Preprint
Article

Optimizing OTEC Performance: Advanced Integration of Bi2Te3-Based Thermoelectric Systems

Altmetrics

Downloads

152

Views

52

Comments

0

This version is not peer-reviewed

Submitted:

03 January 2024

Posted:

04 January 2024

You are already at the latest version

Alerts
Abstract
This study explores the advanced integration of Bi2Te3-based thermoelectric systems in Ocean Thermal Energy Conversion (OTEC) to optimize performance. OTEC, a promising renewable energy source, needs help in efficiency maximization. We address this by implementing Bi2Te3 thermoelectric generators (TEGs), known for their high thermoelectric efficiency at low-temperature differences. Our research encompasses a comprehensive simulation and analysis of these TEGs in OTEC systems, examining material properties, system design, and environmental impact. We present a novel approach to integrating these TEGs, optimizing their arrangement, and interfacing with the OTEC cycle to enhance overall efficiency. The study also investigates the durability and cost-effectiveness of Bi2Te3 TEGs in marine environments. Results demonstrate a significant improvement in energy conversion efficiency, highlighting the potential of Bi2Te3 TEGs in sustainable ocean energy exploitation. This work advances material science in renewable energy, providing valuable insights into the practical application of thermoelectric materials in large-scale energy systems. It paves the way for future research on material optimization and system integration, essential for developing efficient and sustainable OTEC systems.
Keywords: 
Subject: Engineering  -   Energy and Fuel Technology

1. Introduction

The use of fossil fuels has been widespread among the human race since the 20th century. Stockpiles of fossil fuels and other non-renewable energy sources around the world have decreased over the course of the previous few years that have passed. As a consequence of this, countries all over the world are making concerted efforts to find renewable energy sources that are capable of supporting human consumption for an extended period of time.

1.1. Sustainable Energy Transition: Overcoming Fossil Fuel Challenges

Shifting from fossil fuels to renewable energy sources is essential for tackling global warming [1]. However, extravagant consumption must also be reduced to go along with this change [2]. Renewable energy sources, such as solar and wind power, are being increasingly investigated as feasible substitutes for fossil fuels [3,4]. These technologies can substantially reduce greenhouse gas emissions and counteract climate change [5]. Although renewable energy sources have environmental implications, such as land and water use, they are nevertheless seen as more sustainable than fossil fuels [6]. Hence, advancing and extensively adopting sustainable energy options are imperative in combating global warming [7].

1.2. Exploring Ocean Thermal Energy Conversion (OTEC): Principles, Research, and Applications

Ocean Thermal Energy Conversion (OTEC) systems utilize warm surface seawater and cold deep seawater at an approximate depth of 1000 m as the heat source and cold sink, respectively. OTEC systems are classified into three types: closed-cycle, open-cycle, and hybrid. Most energy consumption in closed-cycle OTEC is attributed to the operation of pumps for cold seawater, warm seawater, and the working fluid. During operation, the evaporator facilitates thermal energy transfer from the warm seawater to the working fluid, resulting in vaporization. The gaseous working substance then drives a turbine generator to produce electricity. Subsequently, the condenser uses cold seawater to cool and liquefy the working fluid. The liquid is then returned to the evaporator to repeat the cycle.
OTEC is an up-and-coming renewable energy technology undergoing thorough research. Studies have examined different aspects of OTEC, including its performance and the feasibility of combining it with solar energy [8]. Research has also investigated the costs and engineering uncertainties associated with OTEC implementation [9]. Additionally, analyses have explored potential OTEC applications in Japan, such as electricity generation and uranium extraction [10]. Investigations into applying solar thermal energy to improve the thermal efficiency of OTEC have been undertaken [11]. Economic factors have also been explored, such as the viability of developing combination plants that concurrently provide power, freshwater, and mariculture [12]. The Indian 1 MW demonstration OTEC plant has been crucial in advancing OTEC technology [13].

1.3. Advancing OTEC Efficiency: Integrating Thermoelectric Generators

OTEC efficiency can be enhanced by integrating a thermoelectric generator (TEG), which harnesses the temperature difference between warm surface seawater and cold deep seawater to produce electricity. The primary benefit of this system is its ability to generate consistent output power as long as a thermal gradient exists. Additional advantages include emission-free operation, long component lifetimes, and no moving parts.
Various research studies investigate the potential of OTEC and thermoelectric-OTEC systems. Burmistrov [14] and Pourkiaei [15] both emphasize the promise of thermoelectric technology for harnessing low-grade heat energy. Burmistrov stresses the need for additional research to enhance power density and conversion efficiency. Dogra [16] and Chopra [17] extensively evaluate OTEC systems. The former examines several OTEC methodologies, while the latter focuses on mathematical modeling. Zheng [18] and Kishore [19] explore possible thermoelectric technology applications. Zheng analyzes the positive environmental and economic impacts, whereas Kishore proposes an OTEC-based co-generation plant. Wood [20] presents a comprehensive historical analysis of thermoelectric materials. In contrast, Wei [21] assesses the efficiency and viability of OTEC organic Rankine cycle systems.
In their study, Bohn et al. [22] proposed the thermoelectric-OTEC concept and compared it with closed-cycle OTEC. Thermoelectric OTEC has several advantages, including more durable generators with longer lifespans, increased system reliability from having no moving parts, and improved environmental safety due to the absence of pressurized fluids. The projected cost efficiency of power generation for a 400 MW capacity system is $2620/kW for thermoelectric OTEC versus $2659/kW for closed-cycle OTEC.

1.4. Optimizing Thermoelectric Generators: From Material Innovations to Seawater Efficiency Analysis

Anatychuk et al. [23] utilized COMSOL finite element software to model and optimize the parameters of thermoelectric couples. Yu et al. [24] used numerical calculations to evaluate the performance of TEGs in recovering waste heat. They examined temperature distributions in both parallel and counter flows. Their simulations demonstrated consistent temperature shifts and refined the design of heat exchangers and thermoelectric couplings to improve waste heat recovery effectiveness in TEGs. Niu et al. [25] studied commercially available thermoelectric modules with parallel plate heat exchangers. They aimed to investigate how changes in input temperature, flow rates, and load resistance impact the output power and conversion efficiency of TEGs. Their findings indicate that the hot fluid's inlet temperature and flow rate substantially influence both generated power and conversion efficiency.
Bi2Te3-based thermoelectric materials have been extensively studied for their potential in near room temperature applications. Shi [26] and Hong [27] both provide comprehensive reviews of the strategies and progress in enhancing the thermoelectric performance of these materials, including the reduction of lattice thermal conductivity and the use of nanostructures. Shi [26] also highlights the potential of (Bi, Sb)2Te3 alloys in this regard. Liu [28] and Zhou [29] discuss the use of Bi2Te3-based materials for mid-temperature power generation and the development of high-performance n-type Bi2-xSbxTe3, respectively. Tang [30] and Shu [31] explore the potential of Bi2Te3-based thin films and the Mg3+δSbxBi2−x family as substitutes for the Bi2Te3−xSex family. Lastly, Wang [32] reports on the enhanced thermoelectric properties of Bi2(Te1−xSex)3-based compounds for low-temperature power generation.
The power generation capacity of TEGs depends predominantly on the heat transfer rate, which various fluid properties regulate, including flow velocity, cross-sectional area of flow channels, and channel geometry. The primary objective of this study is to analyze the impact of cold and warm seawater characteristics on TEG efficiency. The study examines how temperature and velocity distributions in the flow channels affect TEG output power and how pump power consumption impacts net power and TEG conversion efficiency. Additionally, it investigates how the electrical and thermal conductivities of different thermoelectric materials influence TEG output power.

2. Numerical Methods

This section may be divided by subheadings. It should provide a concise and precise description of the experimental results, their interpretation, as well as the experimental conclusions that can be drawn.

2.1. Modeling and Simulation of TEG for OTEC: Design and Material Configuration

This study employed COMSOL Multiphysics finite element software to model a TEG for OTEC applications. The model consists of a TEG positioned between two rectangular flow channels. The upper channel, representing warm surface seawater, acts as the hot side. Meanwhile, the lower channel, representing the cold bottom seawater, serves as the cold side. The warm and cold channels have dimensions of 3.8 m x D m x 0.072 m, where the fluid channel height (D) is varied at 0.002 m, 0.006 m, 0.01 m, 0.018 m, 0.036 m, 0.054 m, and 0.072 m. Using copper plates, the TEG connects n-type and p-type thermoelectric materials in a series configuration. Simulations examined two different thermoelectric material combinations. The first utilizes 75% Bi2Te3 + 25% Bi2Se3 for the n-type and 25% Bi2Te3 + 75% Sb2Te3 for the p-type [33]. The second uses Bi2Se0.5Te2.5 for n-type [34] and (Bi0.2Sb0.8)2Te3 for p-type [35]. A single n-type element has dimensions of 0.01 m × 0.01 m × 0.01 m, while a single p-type element has dimensions of 0.012 m × 0.01 m × 0.012 m. The copper plates are 0.03 m × 0.005 m × 0.012 m [33]. There are 400 thermocouple pairs in total. Figure 1 shows the 0.072 m elevation flow channel configuration.

2.2. Governing Equations and Assumptions for Thermoelectric System Simulation

Governing Equations:
During the numerical simulations in this study, the following assumptions were made:
  • The fluid in the input channel is steady, fully developed, and incompressible.
  • The flow channel is thermally insulated, with radiation and convection effects around the channel being disregarded.
  • The electrical and thermal resistances at the contact surfaces of the TEG materials are neglected.
  • Thermal losses between the heat exchanger and the thermoelectric module are ignored.
  • The fluid-solid interface is considered a no-slip boundary.
  • Within the TEG module, the leads of the first set of thermocouples are grounded, while all other boundaries of the TEG are set as electrically insulated.
Mass Conservation Equation [37,38]:
ρ · u = 0
Navier-Stokes Equation:
ρ u · u = p + μ 2 u
Energy Conservation Equation:
ρ c p u · T + · q = Q
In this context, ρ c p μ represent the fluid's density, specific heat, and viscosity coefficient, respectively; p denotes pressure; u is the velocity vector; T represents temperature. Under thermal insulation, q denotes the heat flux, expressed as q = k f T , where k f is the fluid's thermal conductivity; Q symbolizes an internal heat source. The temperature of the fluid can be determined by applying the mass conservation equation, momentum equation (Navier-Stokes equation), and energy conservation equation.
The Heat Conduction Equation for Solids is as follows:
· k s T = 0
Here, k s represents the thermal conductivity of the material. For thermoelectric materials, the energy conservation equation is outlined in references [39,40,41]:
· q T E = Q J o u l e
The Charge Conservation Equation is as follows:
· J = 0
Within this framework, q T E denotes the heat flux through the thermoelectric material; Q J o u l e represents the Joule heating generated by the electric current passing through the thermoelectric material, calculated as Q J o u l e = J 2 / σ , where J is the current density. This is complemented by the thermoelectric constitutive equations referenced in [39,40,41]:
q T E = S T J k T
J = σ E S T
Herein, S σ k represent the Seebeck coefficient, electrical conductivity, and thermal conductivity of the thermoelectric material, respectively; E denotes the electric field, which can be expressed as the gradient of electric potential, V . Consequently, the second constitutive equation can be reformulated as follows:
J = σ V + S T
By incorporating the thermoelectric constitutive equations into the energy conservation and charge conservation equations, one can derive:
· S T J · k T = J 2 σ
· σ V + · σ S T = 0
The aforementioned equations represent the coupled relationship between electric potential and temperature. With a specified electric current, these equations can be used to solve for the temperature distribution and electric potential distribution within the thermoelectric material. Conversely, with a specified temperature, the equations can determine the electric potential and current distribution within the material. The heat at the hot end Q H and at the cold end Q C comprises the output power generated by the thermoelectric effect P T E , the Joule heat produced by the thermoelectric materials Q J o u l e , and the conductive heat transferred from the hot end interface to the cold end interface Q C o n d . The equations representing these relationships are as follows:
Q H = N [ S T h ¯ I 1 2 I 2 R T E + K T h ¯ T c ¯ ]
Q C = N [ S T c ¯ I + 1 2 I 2 R T E + K T h ¯ T c ¯ ]
Where N represents the number of thermocouples; S T h ¯ I and S T c ¯ I correspond to the output power at the hot end and the cold end, respectively; I 2 R T E represents the Joule heat generated by the thermoelectric material; K T h ¯ T c ¯ is the conductive heat transferred from the hot end interface to the cold end interface. The output power P of the TEG can be expressed as:
P = Q H Q C
The conversion efficiency η of the TEG can be expressed as:
η = P Q H
Pump Power Calculation
The fluid pipeline typically consists of straight pipes, bends, and various components, including various types of valves, all contributing to losses in fluid flow. The head loss in the pipeline, accounting for both major losses h m a j o r and minor losses h m i n o r , is described as follows:
h L = h m a j o r + h m i n o r
In pipelines, the energy loss caused by the surface roughness of the straight sections of the pipe is referred to as the major loss, h m a j o r , which can be expressed as:
h m a j o r = f l D h V 2 2 g
Herein, f represents the friction factor, l is the length of the flow channel, D h is the hydraulic diameter of the channel, v is the average velocity of the fluid, and g is the acceleration due to gravity.
Minor losses h m i n o r primarily occur in non-linear segments of the pipeline and result in energy loss. These losses occur in elements such as bends, valves, inlets and outlets, or changes in the cross-sectional area of the pipeline and can be expressed as follows:
h m i n o r = K L V 2 2 g
Herein, K L represents the loss coefficient, v is the average velocity of the fluid, and g is the acceleration due to gravity. This study conducts analyses under the conditions of steady state non-viscous fluid flow. For incompressible flow between any two points, 1 and 2, along a streamline, the flow can be described using the Bernoulli Equation:
P 1 γ + α 1 V 1 2 2 g + z 1 + h P = P 2 γ + α 2 V 2 2 2 g + z 2 + h L
Herein, P 1 and P 2 represent the pressures at positions 1 and 2, respectively; V 1 and V 2 are the velocities at positions 1 and 2, respectively; γ denotes the specific weight of the fluid; α 1 and α 2 are the kinetic energy correction factors; g is the acceleration due to gravity; z 1 and z 2 are the elevations at points 1 and 2, respectively; h P is the pump head; and h L represents the head loss.
The pump power can be expressed as follows:
W P = m ˙ h P g η
Where m ˙ is the mass flow rate, h P is the pump head, η represents the pump output efficiency, and g is the acceleration due to gravity.

3. Results and discussions

This study utilized COMSOL Multiphysics finite element software to simulate a TEG between warm surface seawater and cold deep seawater flow channels. The 3.8-meter-long, 0.072-meter-wide channels comprised 400 thermoelectric units in total. A parallel-plate heat exchanger established the thermoelectric system model. The researchers examined how different Reynolds numbers (Re) impacted temperature distribution in parallel and counter flows by varying channel heights. They analyzed how heat quantities at the hot (Qh) and cold (Qc) ends affected TEG output power (Pout). Additionally, they investigated how pump power consumption influences output power across channel heights. Furthermore, the study examined how alternative thermoelectric materials and cold end temperatures impacted power generation, evaluating how material properties and temperature differentials affect thermoelectric system performance.

3.1. Effects of Reynolds Number and Channel Height on TEG Performance in OTEC Systems

This study utilized variations in flow channel height to investigate the effects of Reynolds number (Re) on temperature distribution, the heat quantity at both the hot and cold ends of the TEG, and the TEG's output power under both parallel and counter flows conditions. The flow channel heights (D) were set at 0.002 m, 0.006 m, 0.010 m, 0.018 m, 0.036 m, 0.054 m, and 0.072 m. These corresponded to Reynolds numbers (Re) of 3987, 11275, 18040, 29848, 49200, 63253, and 73800, respectively, as shown in Table 1.
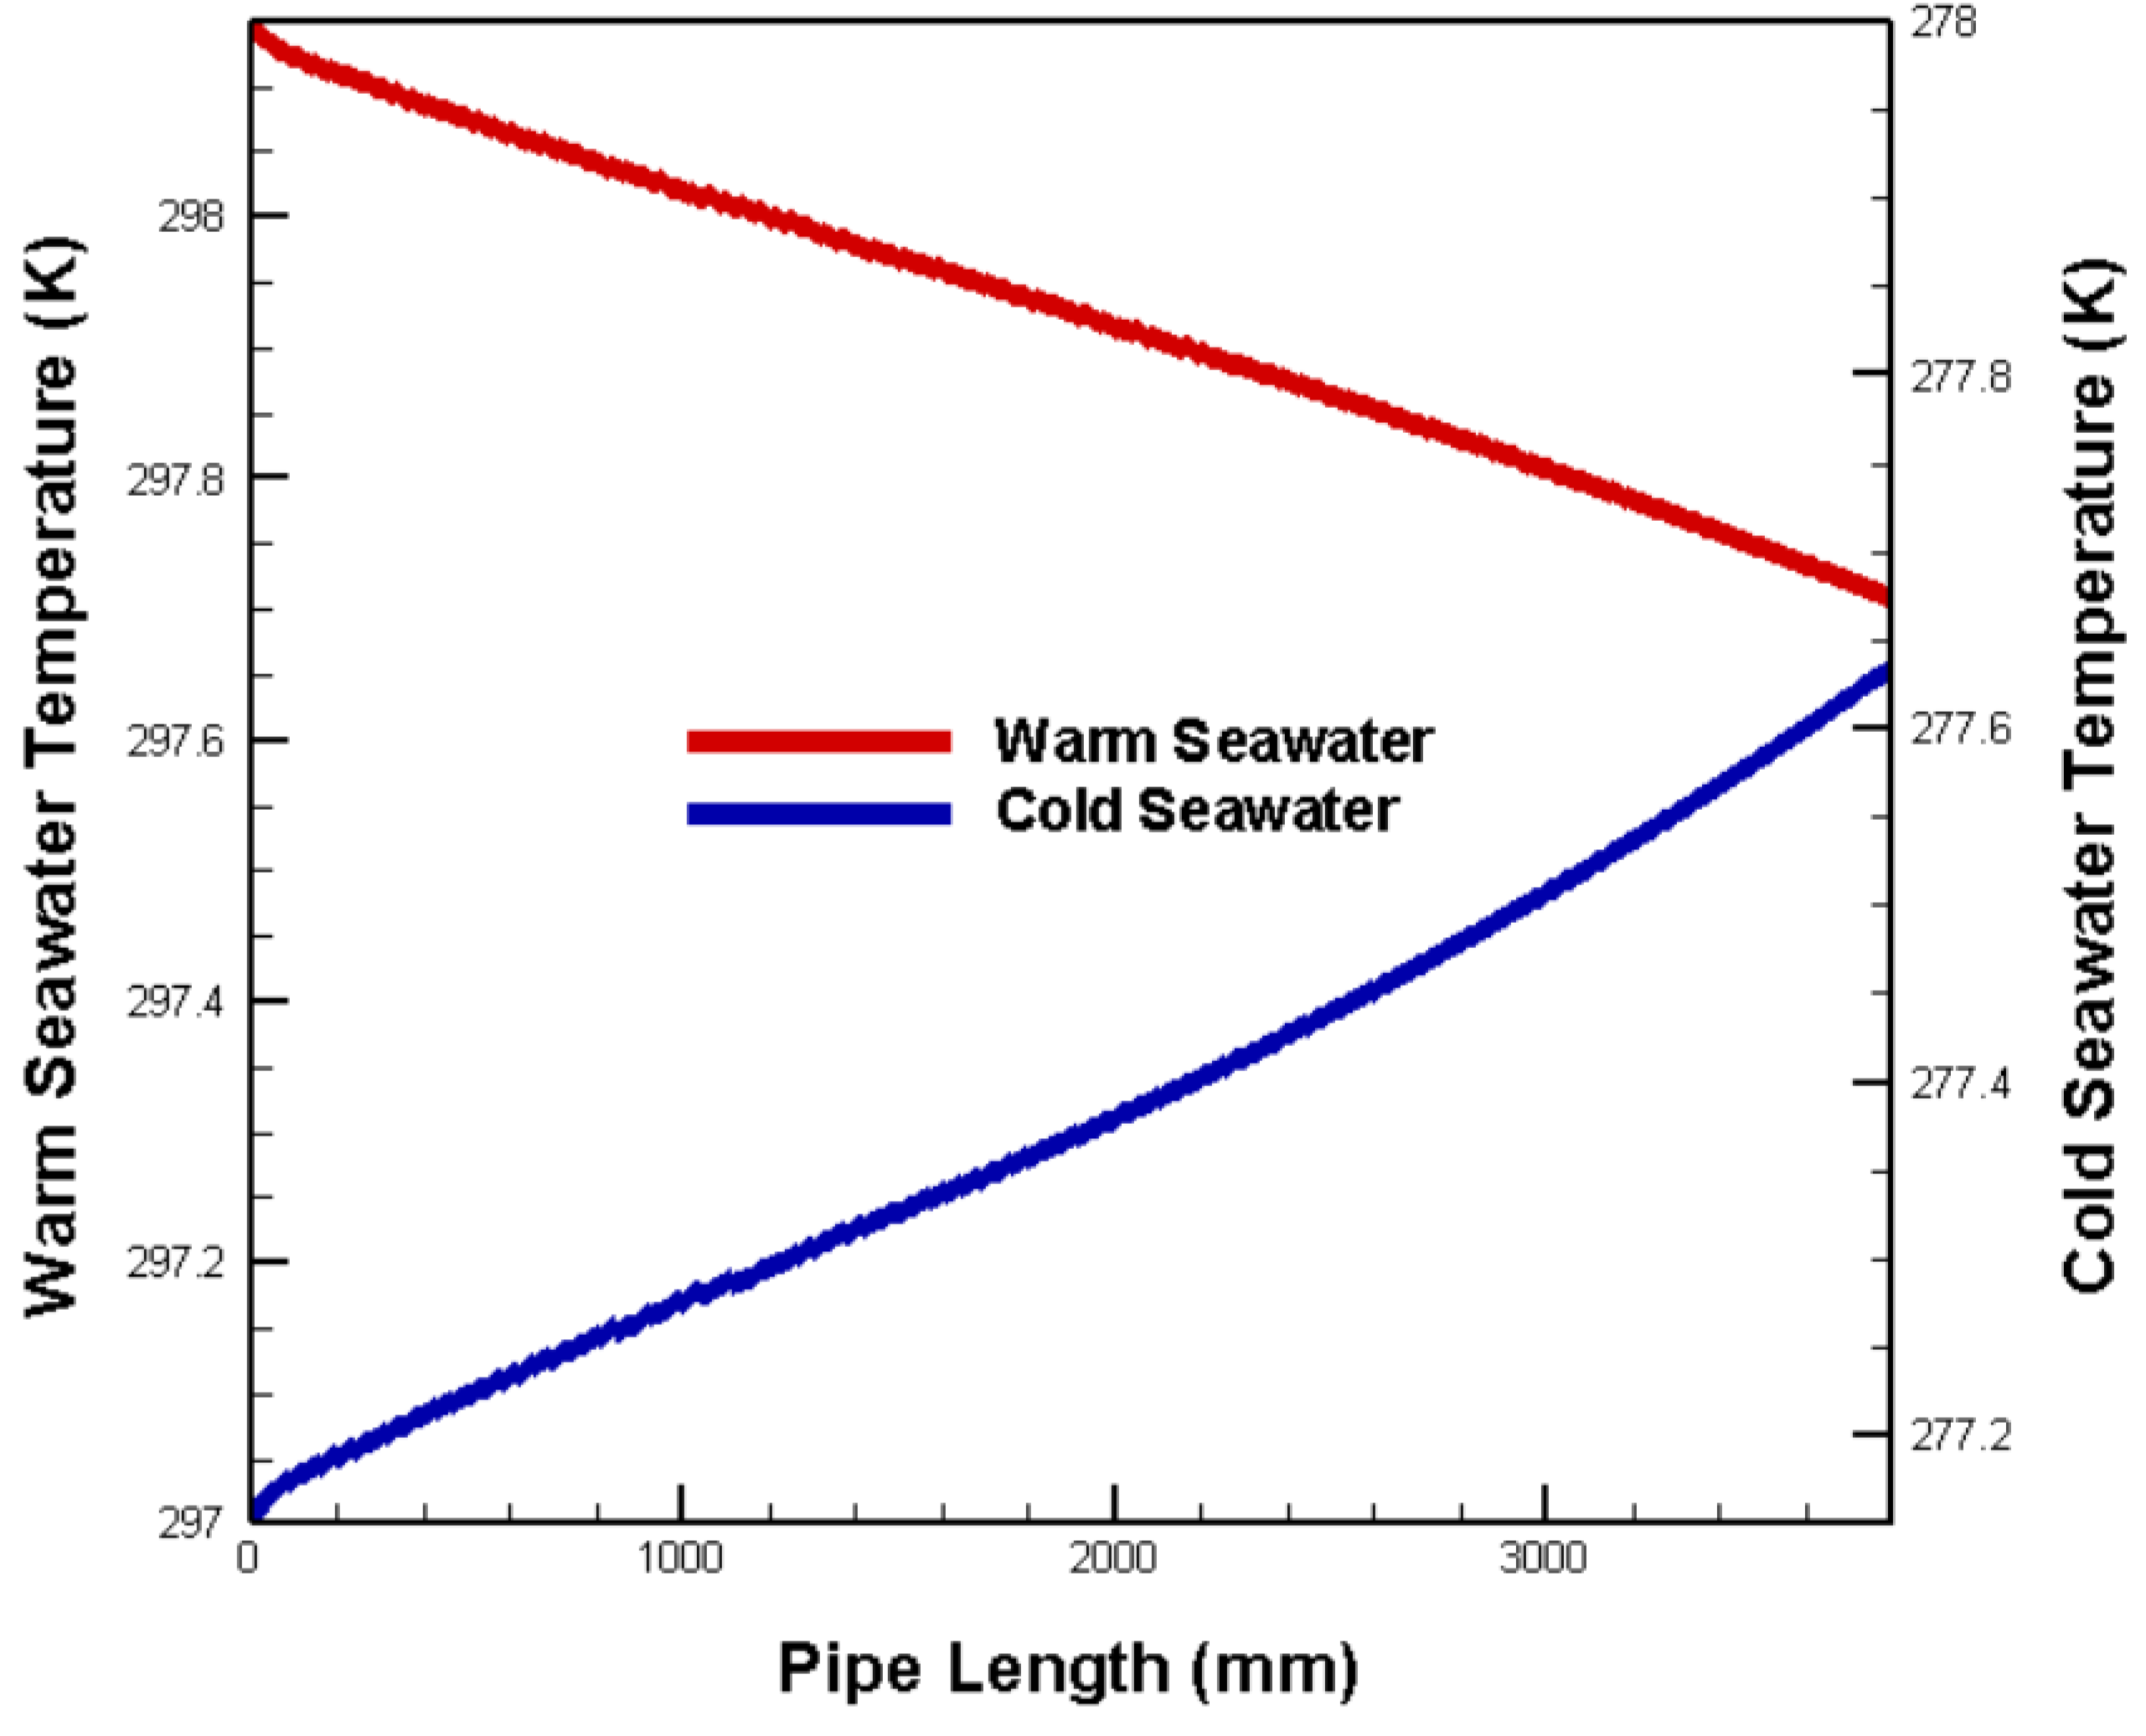
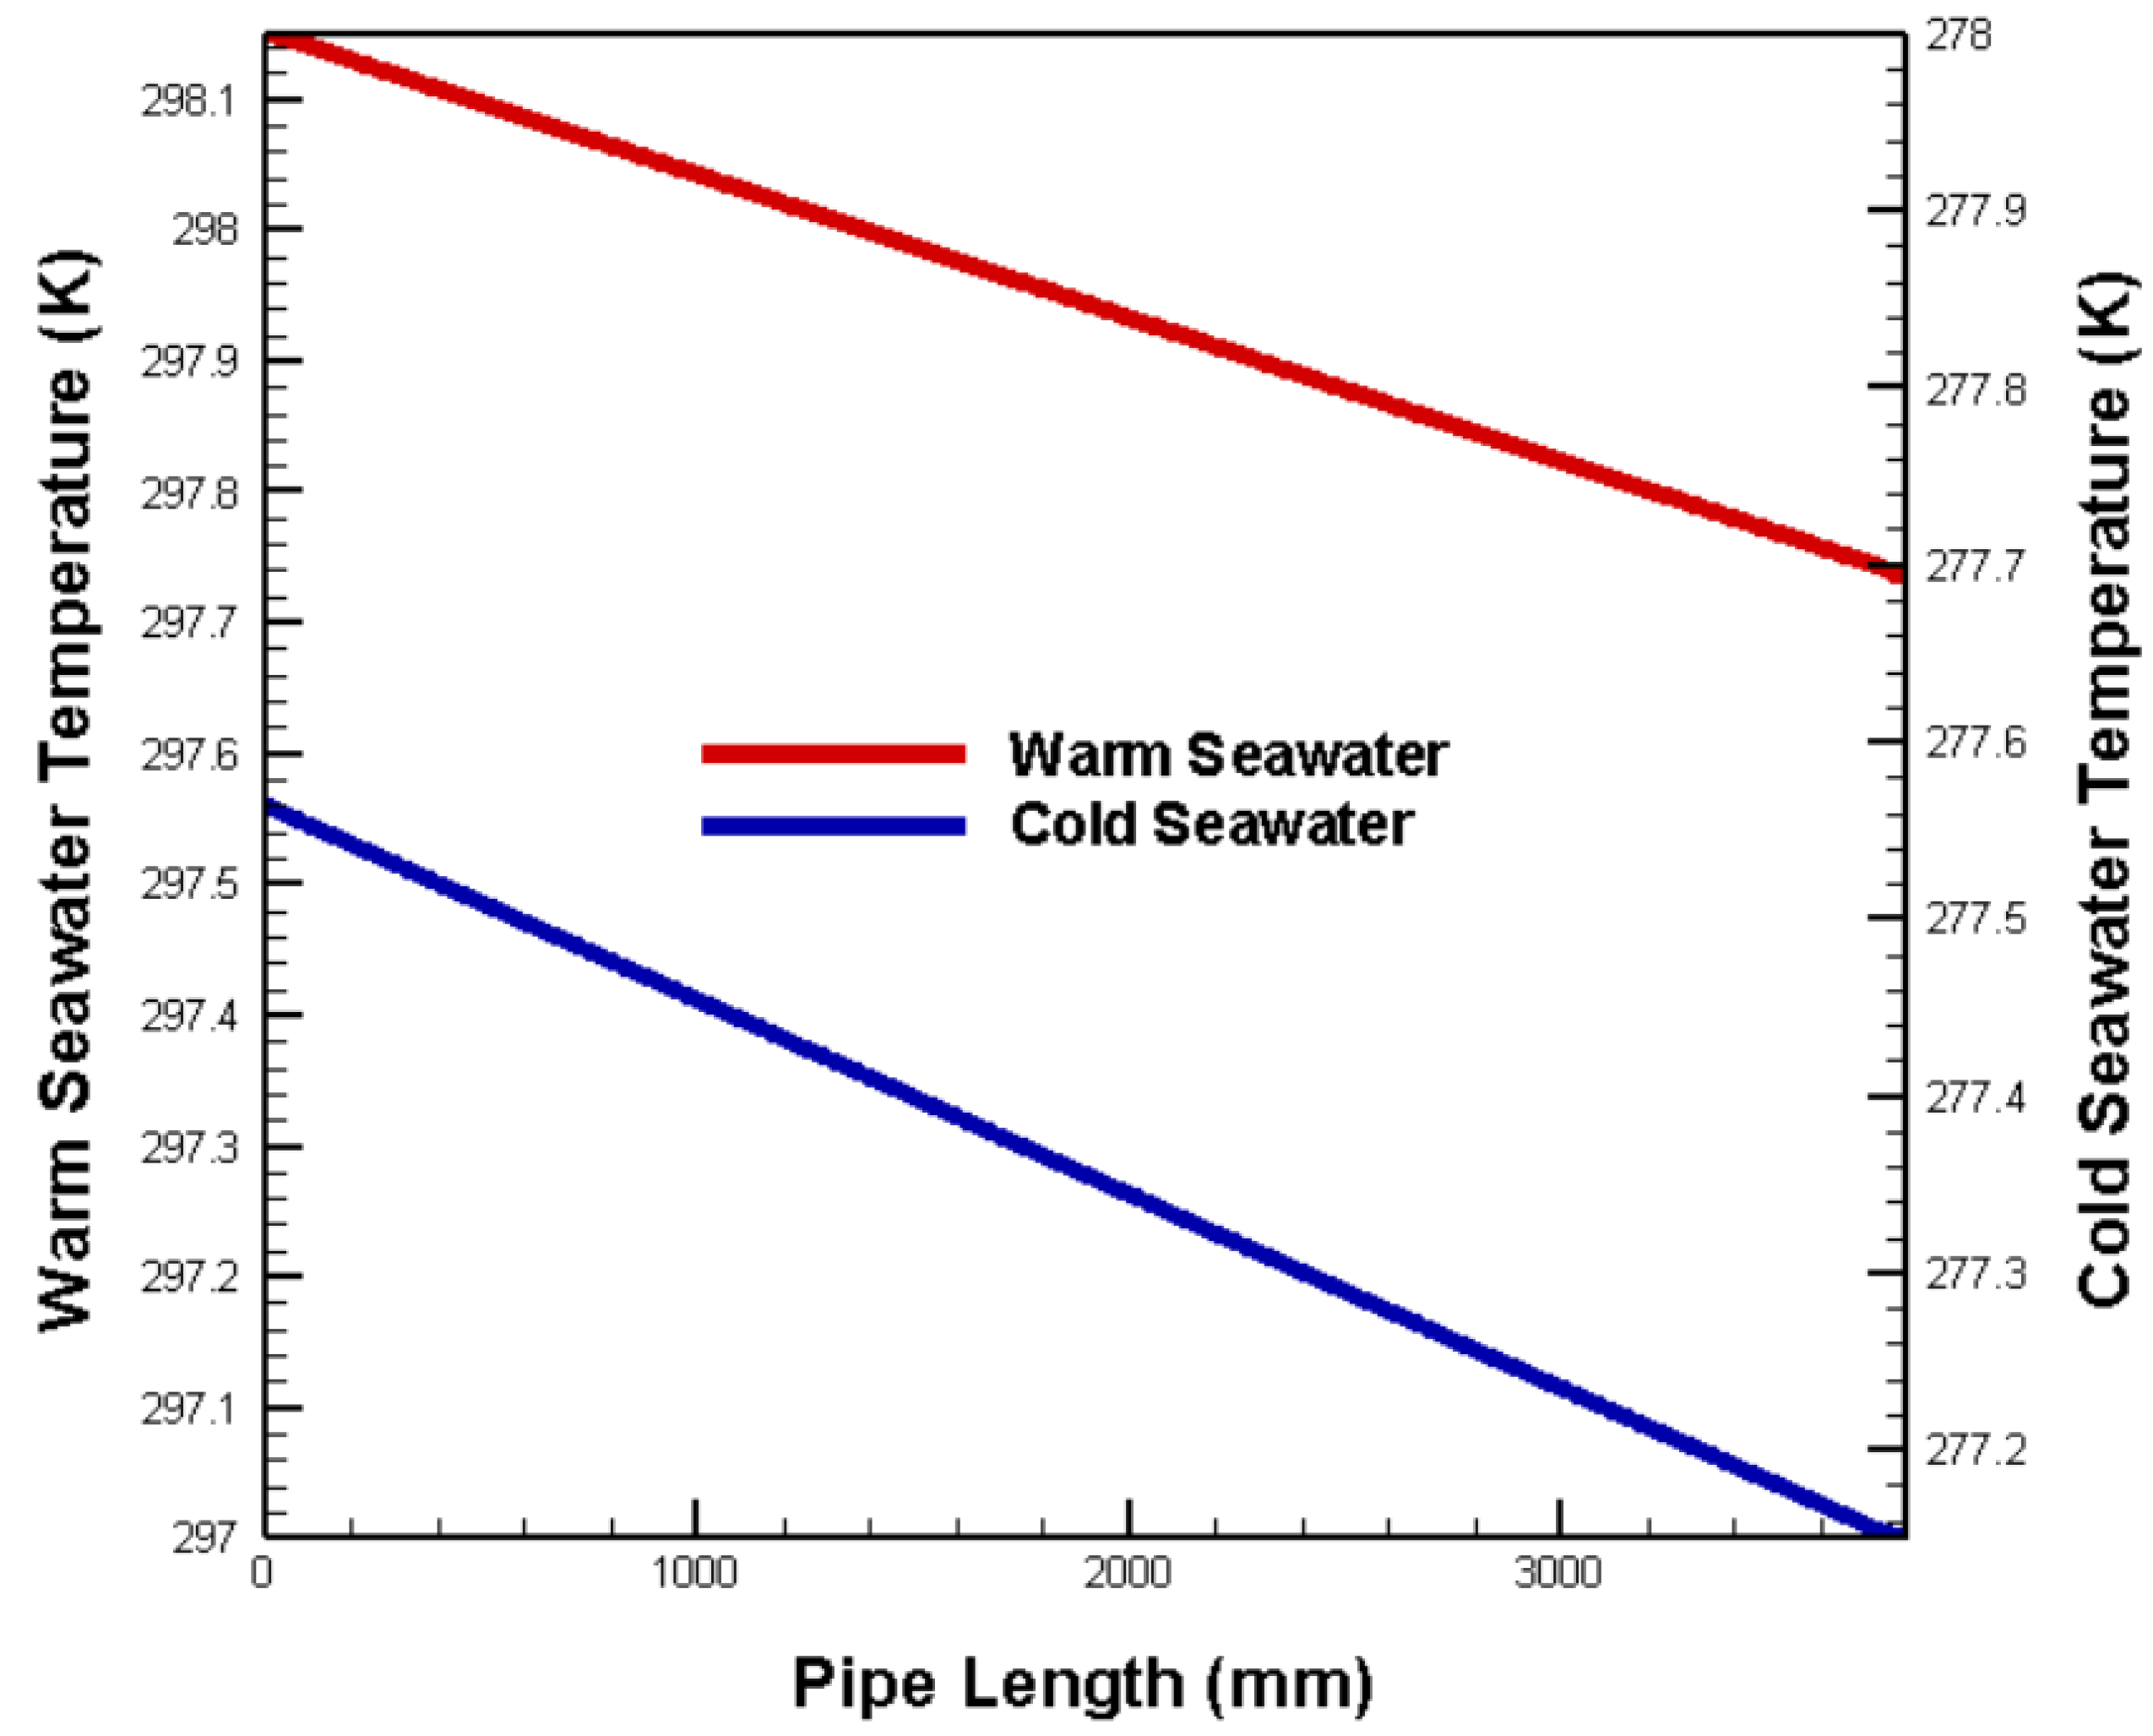
Figure 2 and Figure 3 show the temperature distributions of the warm surface and cold deep seawater along the channel length. The 0.002 m-tall channel has a Reynolds number (Re) of 3987, with parallel and counter flows examined. Inlet temperatures are fixed at Tw = 298 K for warm seawater and Tc = 277 K for cold, entering at 1 m/s (Vin). The data indicates decreasing warm water and increasing cold water temperatures along the channel. Both fluids display nearly linear temperature changes along the flow path. The steady heat transfer between the fluids and TEG enables uniform TEG power output, as evidenced by the constant gradient simulation results.
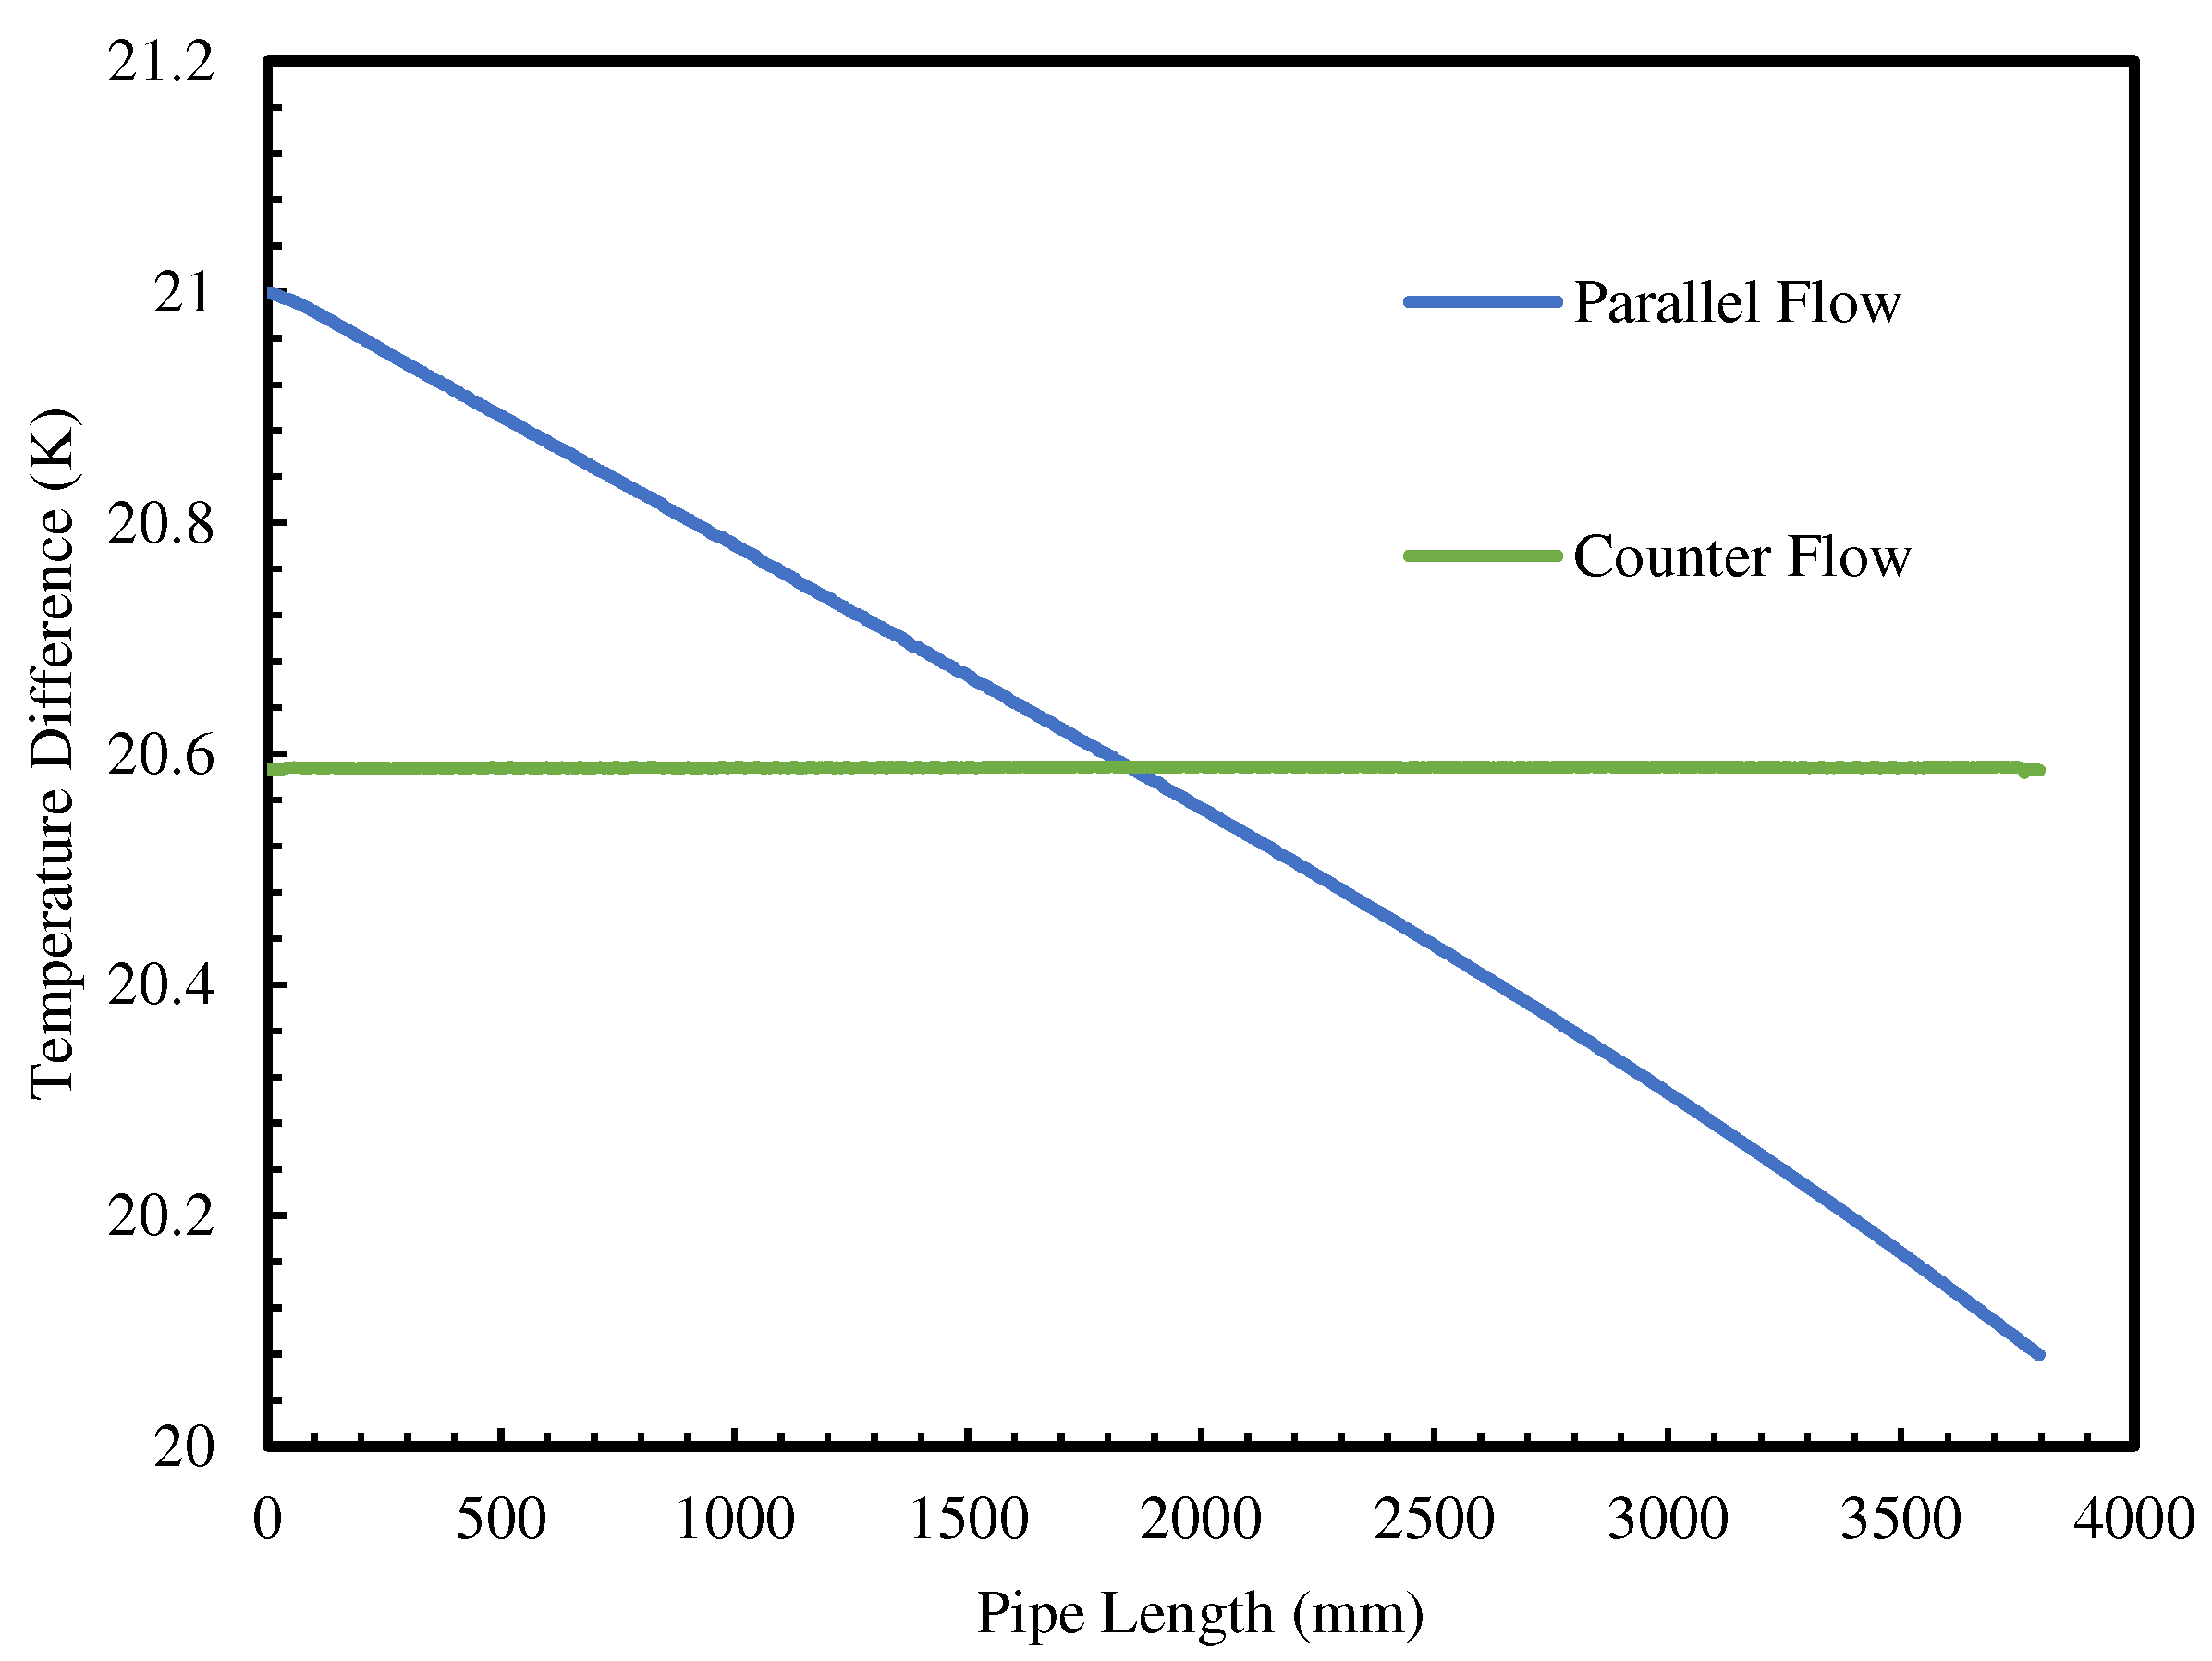
The fluctuation in fluid temperatures causes proportional alterations in the temperature differential ∆T between the high and low ends of the TEG. Figure 4 illustrates the distribution of temperature differences in the TEG's parallel and counter flows For a given fluid inlet temperature, the temperature differential ∆T in the parallel flow shows notable variations. It decreases as the flow channel length rises, indicating a reduction in the temperature gap between the hot and cold ends. In contrast, the temperature difference in the counter flows exhibits reduced fluctuations as the channel length increases, enabling the installation of larger channels for TEGs in this model. When the channel length is the same, the average temperature differences in the parallel and counter flows are nearly the same, leading to comparable output powers for both models.
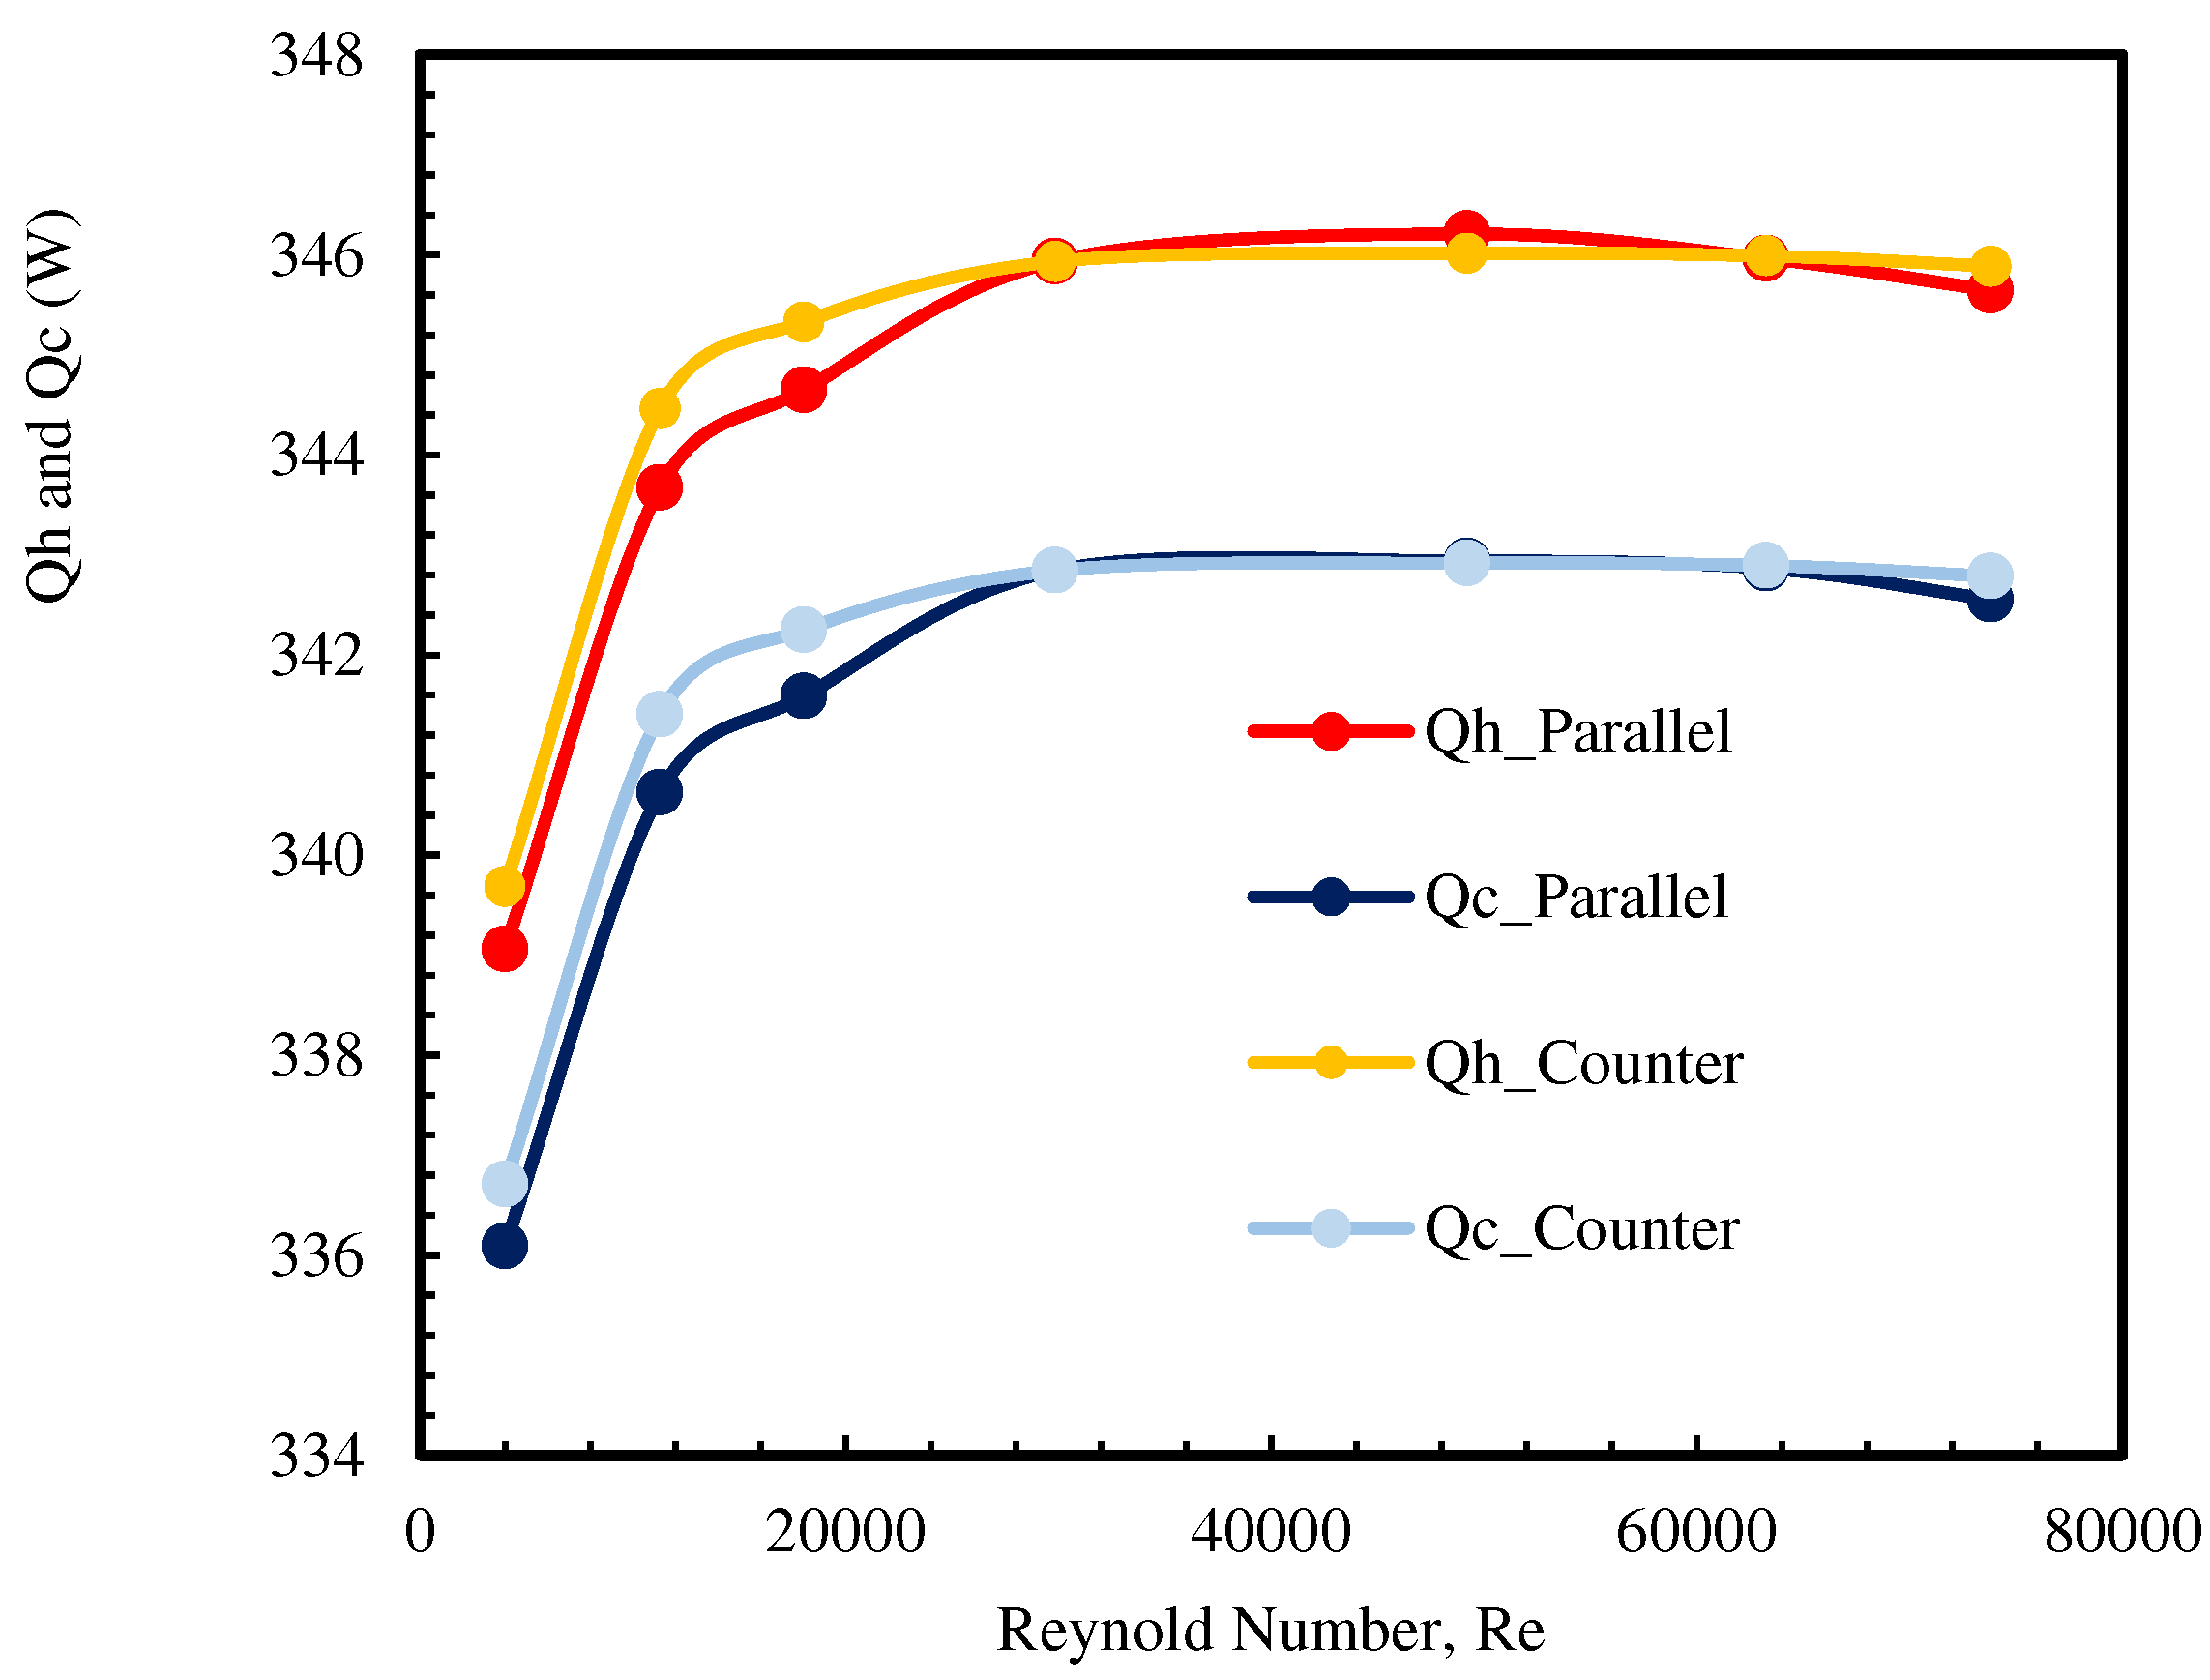
This study examines the influence of changing Reynolds numbers on the power output of TEGs at varying flow channel heights. Variations in the channel height modify the thermal energy contained in the fluid, thereby impacting the output power of the TEG. Figure 5 depicts the heat amounts (Qh and Qc) at the hot and cold end for parallel and counter flows at different Reynolds numbers. For Reynolds numbers (Re) below 12000, the heat available for the TEG increases as the Reynolds number grows. This results in a progressive output power increase for parallel and counter flows models. Nevertheless, when the Reynolds number surpasses 12000, the heightened channel height facilitates an ample and consistent heat delivery to the TEG. The computed thermal energy at the hot end (Qh) is roughly 345 W, while the thermal energy at the cold end (Qc) is around 342 W, with no disparity in the heat transfer between parallel and counter flows
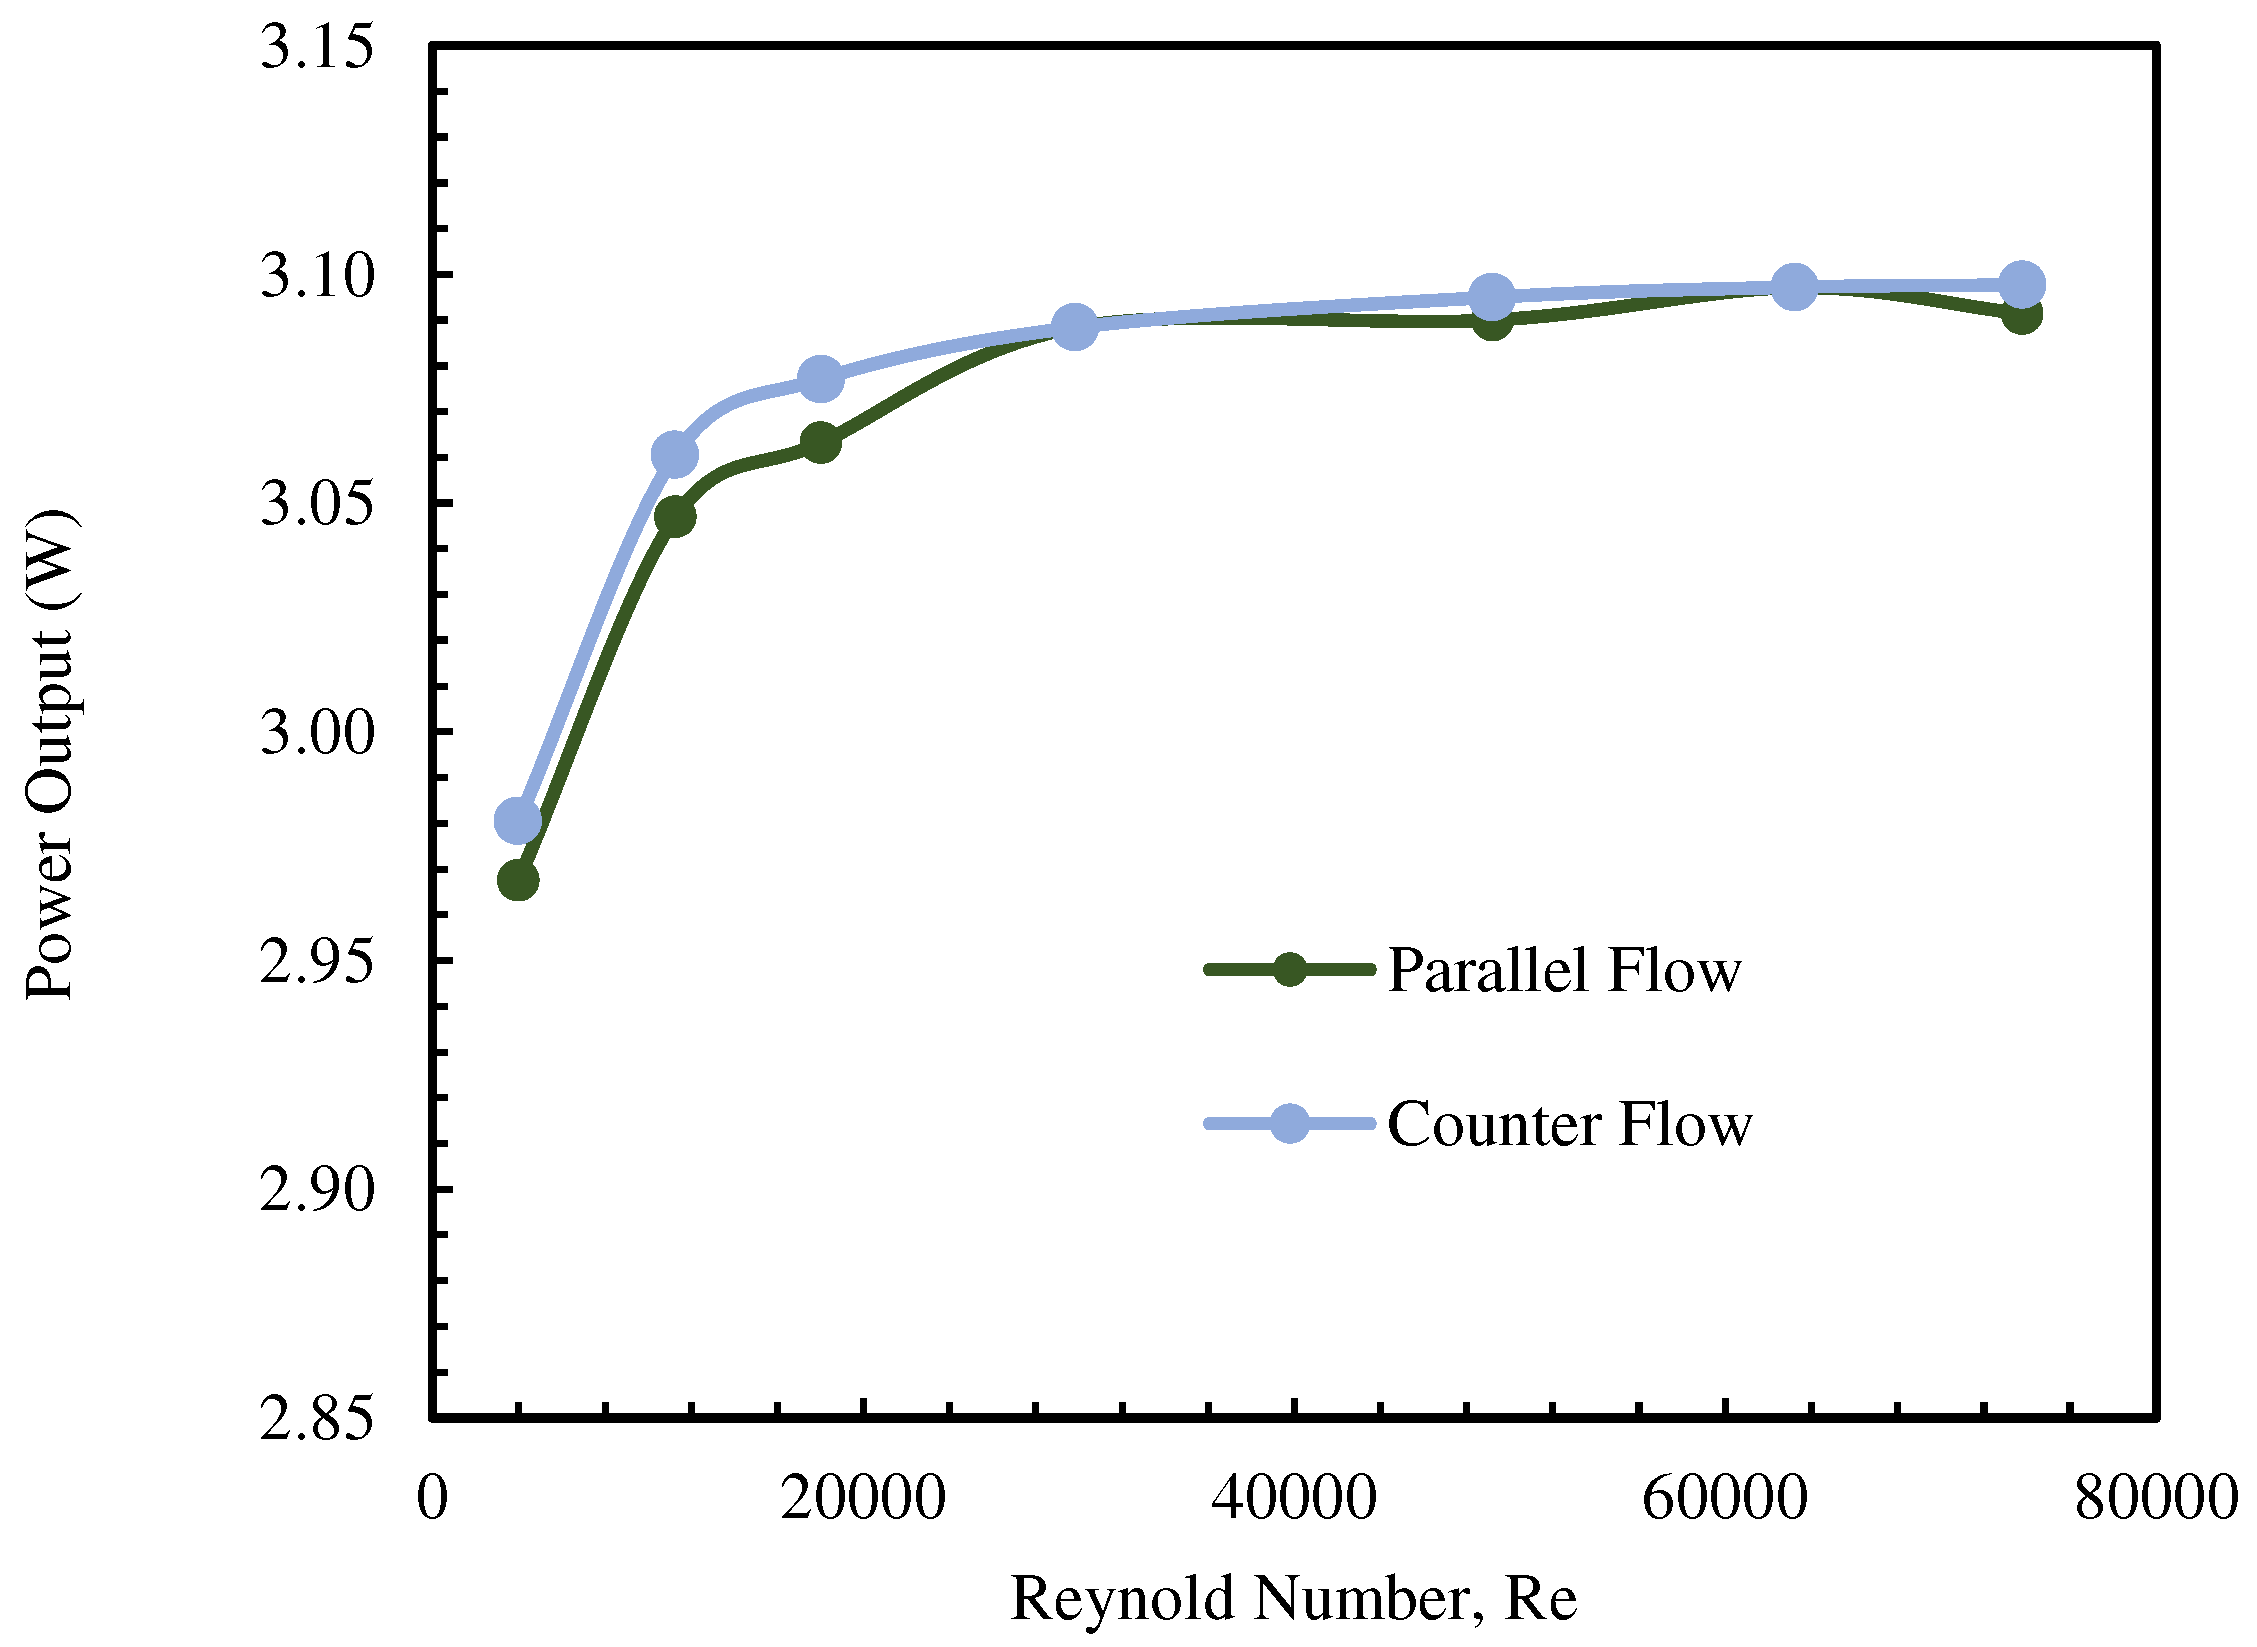
The TEGs output power (Pout) is directly influenced by the heat amounts at the hot end (Qh) and the cold end (Qc). When the Reynolds number (Re) is below 12000, parallel and counter flows models exhibit the lowest heat quantities at the hot and cold ends of the TEG. This leads to a higher temperature variance in the flow channels compared to models with Re > 12000. The power output at a Reynolds number of 3987 is the minimum. The rise in Reynolds number leads to a corresponding increase in the output power of the TEG, which is seen in both parallel and counter flows. Once the Reynolds number exceeds 12000, the thermal energy within the channel is adequately supplied to the TEG, resulting in a relatively steady heat exchange rate. As a result, the output power is fixed at roughly 3.01 W. The channel height substantially impacts the output power in both parallel and counter flows models. The heat amounts at both the hot and cold ends increase as the Reynolds number increases, leading to a significant initial rise in output power. Nevertheless, as the Reynolds number continues to rise, the growth rate in output power decreases, as depicted in Figure 6.

3.2. Analyzing Pump Power and Channel Dimensions in Thermoelectric System Efficiency

The thermoelectric system relies on the temperature difference created by the warm surface and cold deep seawater to power the TEGs. Pumps overcome flow resistance from channel walls, enabling efficient heat transfer between the fluids and heat exchanger by convection. Thus, pump energy expenditure is a crucial factor in our thermoelectric model. We assume fluid passage through a straight pipe, incorporating loss coefficients: an inlet loss coefficient K_(L, in) of 0.5 and an outlet loss coefficient K_(L, out) of 1.
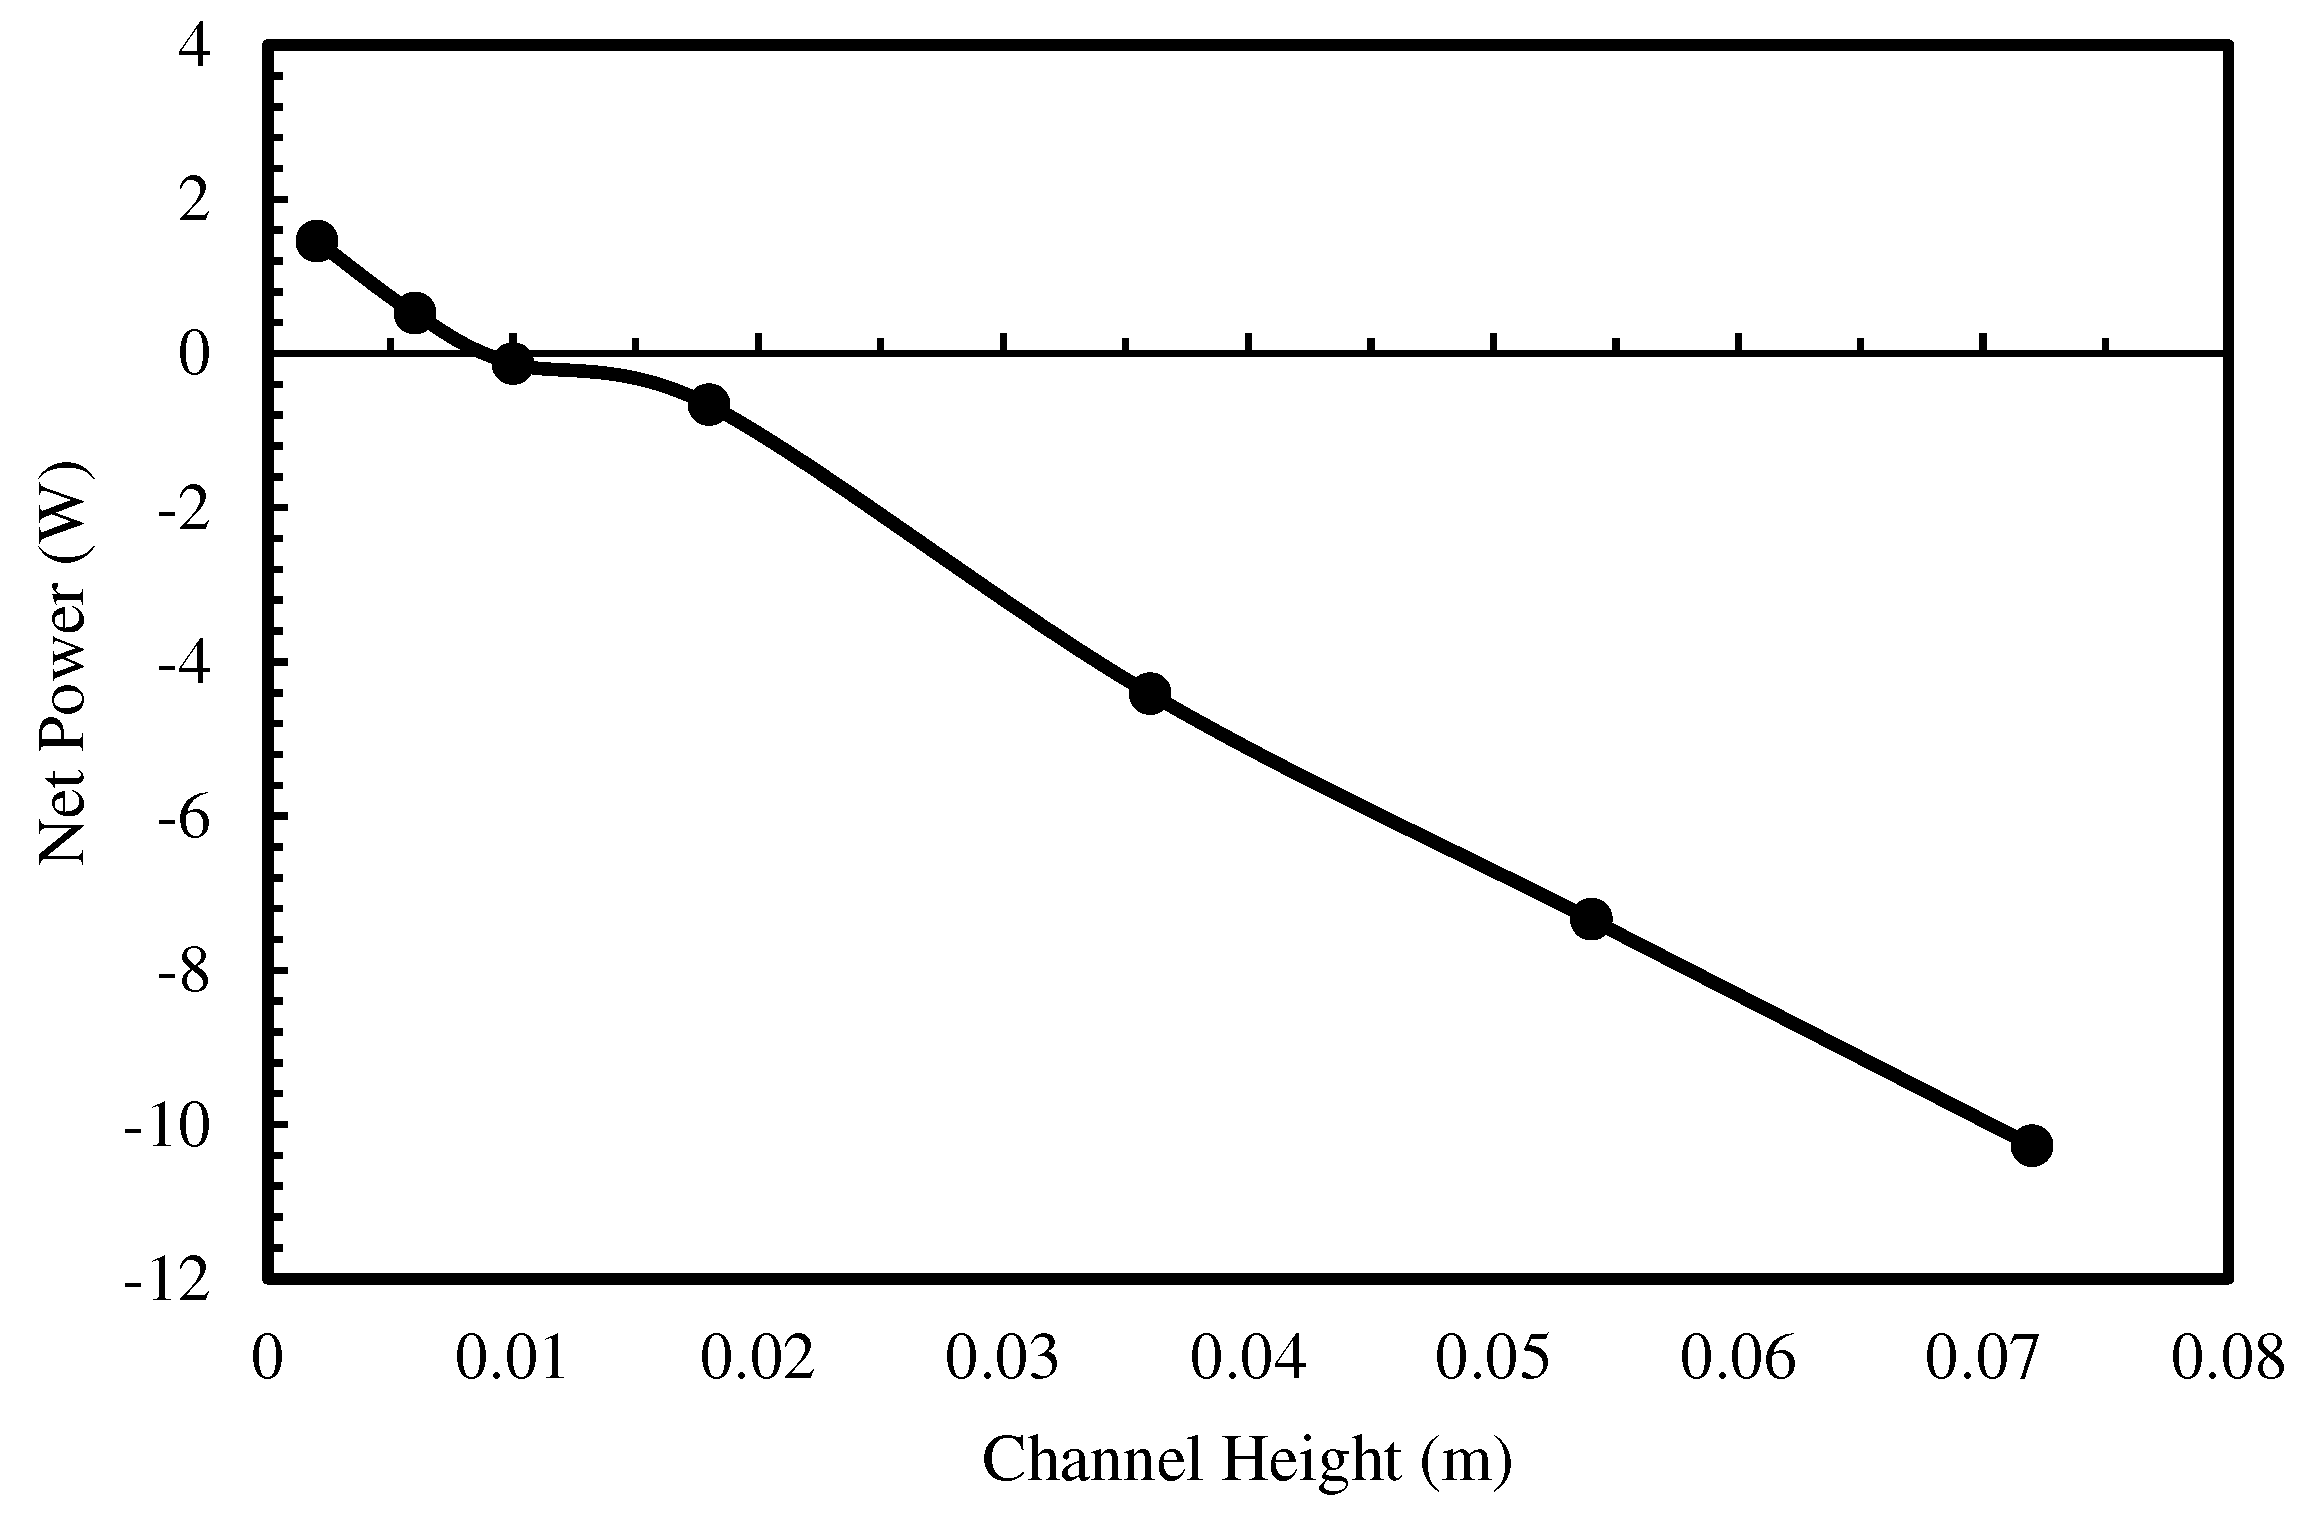
At constant velocity, required pump power rises proportionally with channel height due to the larger fluid volume needing circulation. Although Figure 6 shows height increases above 0.006 m improve TEG output power, maximum net power occurs at D = 0.002 m when accounting for pumping. This height has the smallest cross-sectional area, leading to low pump energy use. Consequently, the net power production is Pnet = 1.45 W. As the height and cross-sectional area grow, pump power demand also increases. Once the height exceeds 0.01 m, the pump power surpasses the TEG output power. Net power production diminishes with increasing channel height, as Figure 7 depicts.

3.3. Comparative Analysis of Thermoelectric Materials and Their Impact on Performance

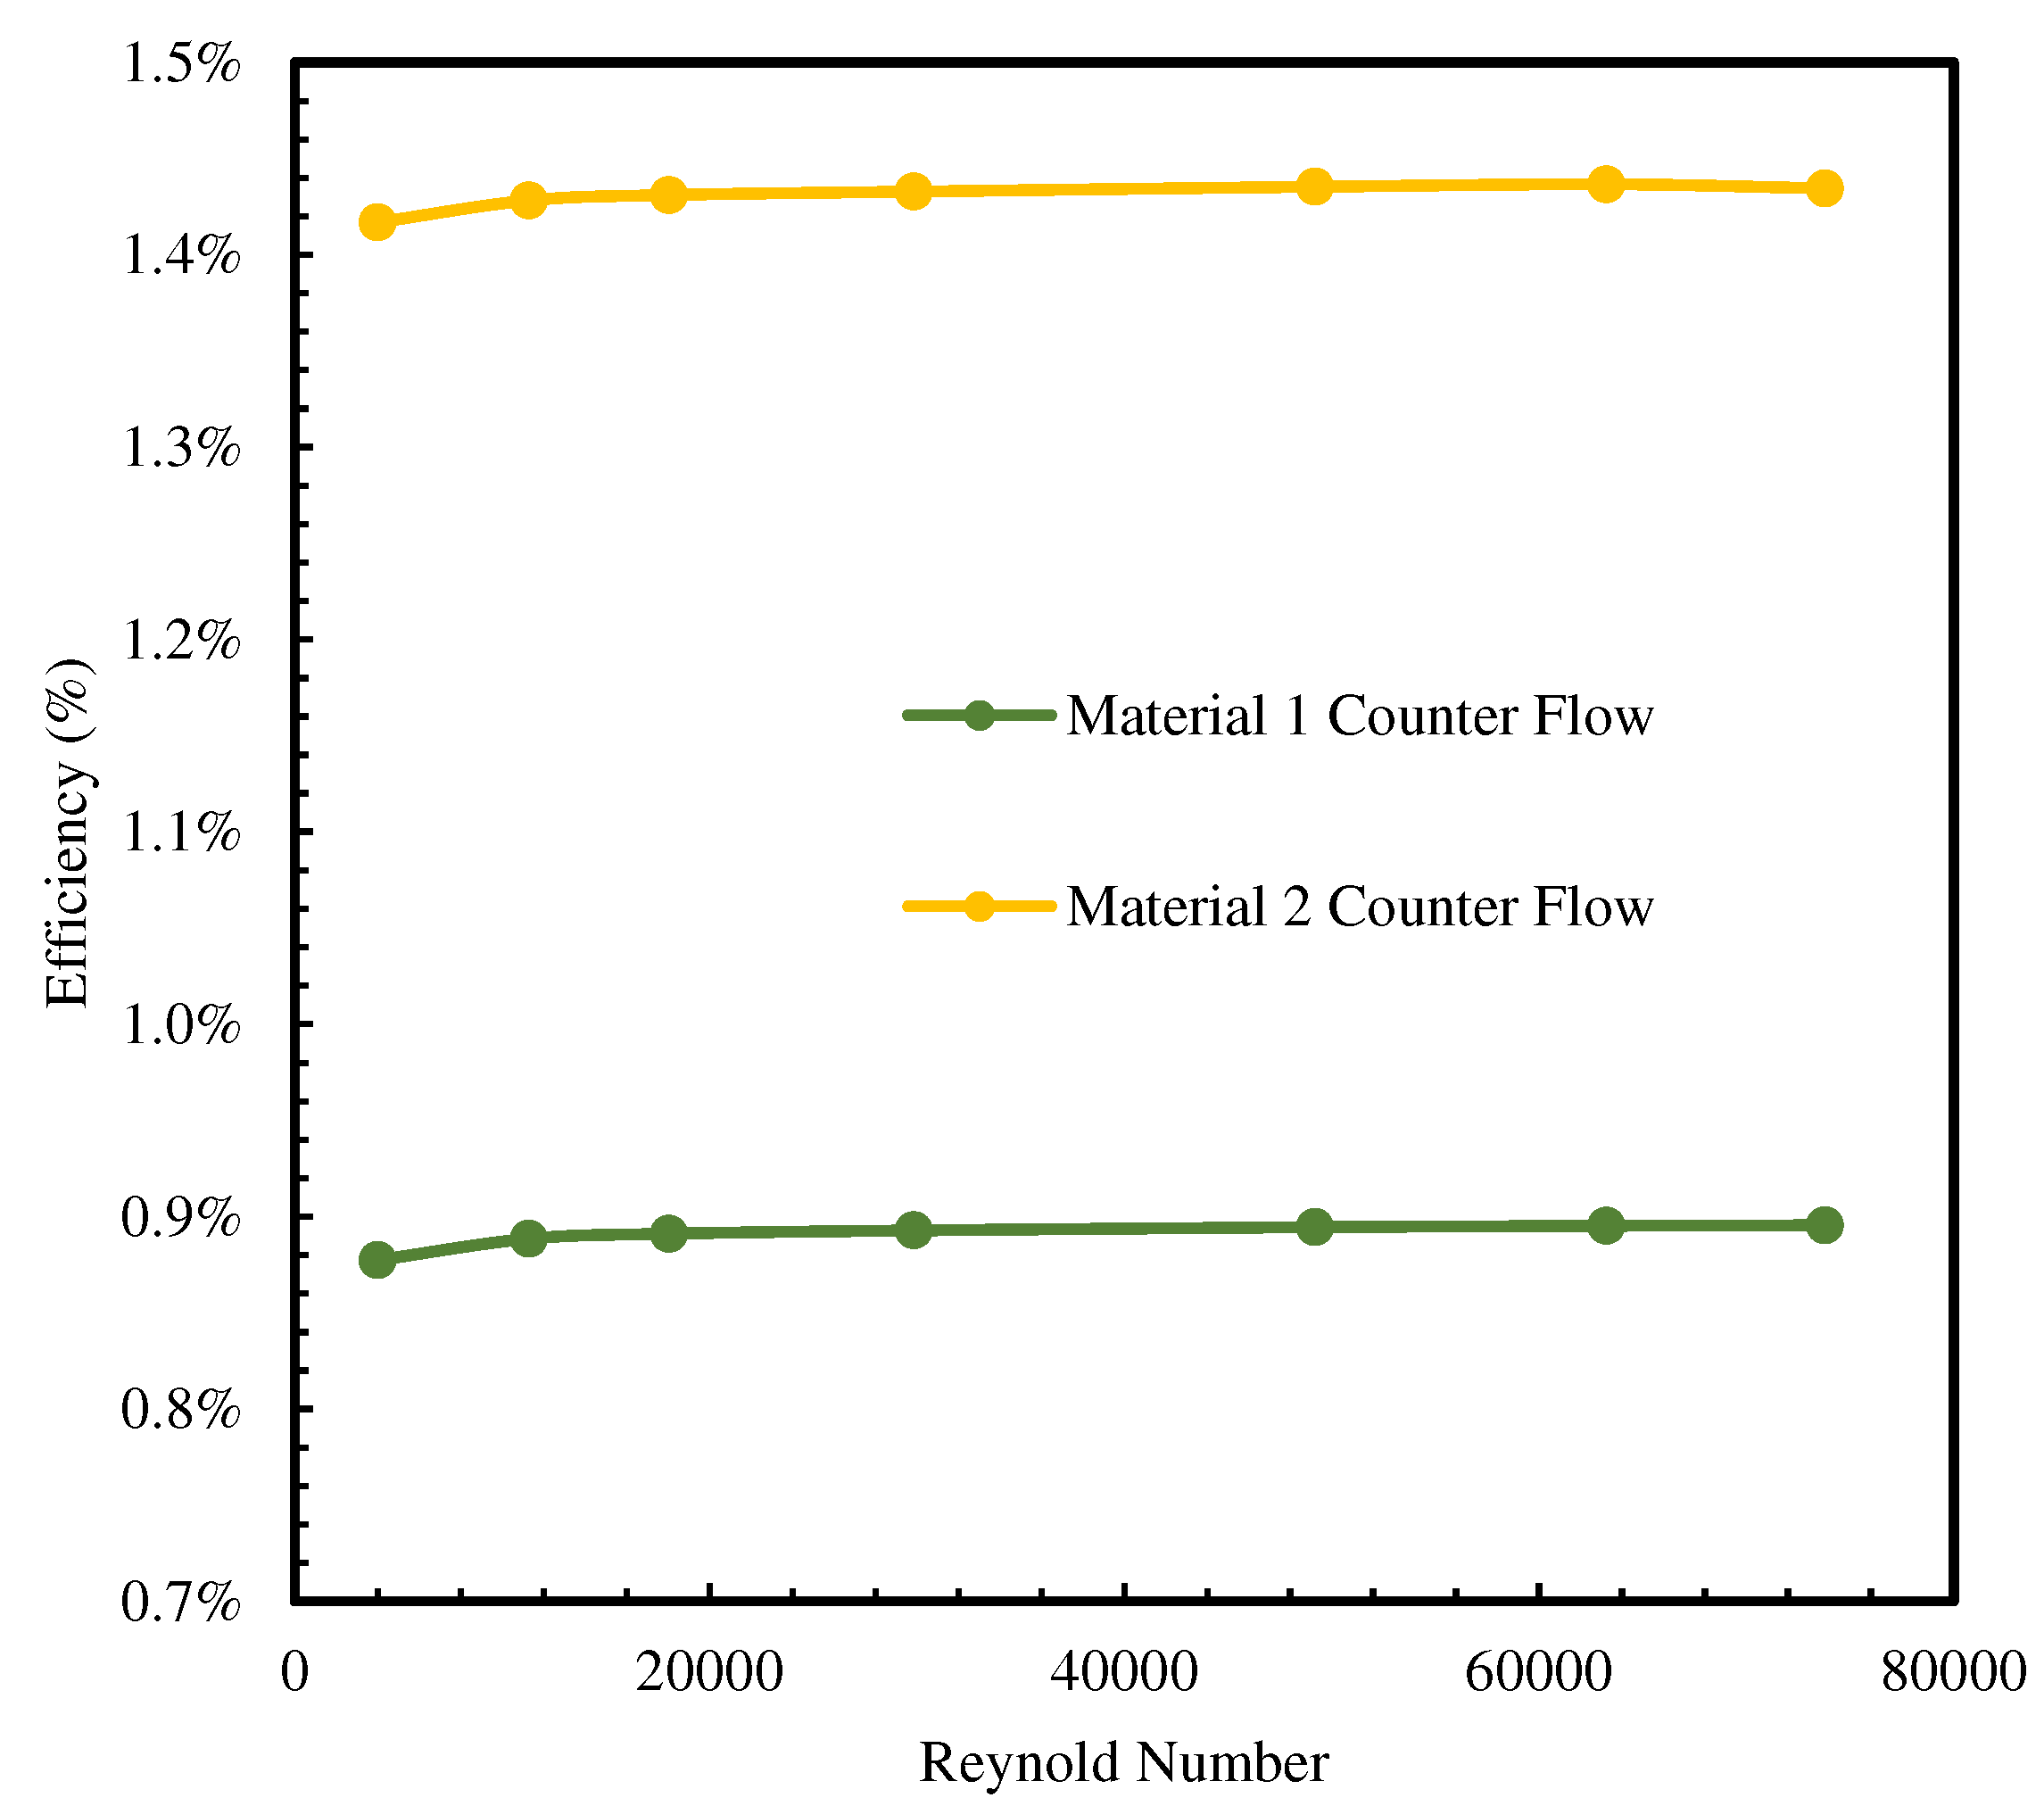
Thermoelectric performance depends on the Seebeck coefficient, thermal conductivity, and electrical conductivity. The dimensionless figure of merit (ZT) commonly evaluates materials. This study examined two distinct thermoelectrics: Material 1, with 75% Bi2Te3 + 25% Bi2Se3 as n-type and 25% Bi2Te3 + 75% Sb2Te3 as p-type; and Material 2, with Bi2Se0.5Te2.5 (n-type) and (Bi0.2Sb0.8)2Te3 (p-type). Figure 8 shows ~1 W higher power output for Material 2, which has superior properties, versus Material 1 for parallel and counter flows. Owing to its higher electrical conductivity and lower thermal conductivity, Material 2 also surpassed Material 1 in conversion efficiency by 0.5% in the counter-current model (Figure 9), a trend also seen with parallel flows. Thus, thermoelectrics with improved performance traits increase output power and efficiency.
Moreover, as Reynolds numbers rose, the output power trends were comparable for both materials in parallel and counter flows. counter flows yielded lower output power at low Reynolds numbers but approached parallel levels at higher Reynolds numbers.

3.4. Impact of Temperature Differential on Power Output and Efficiency in Thermoelectric Systems

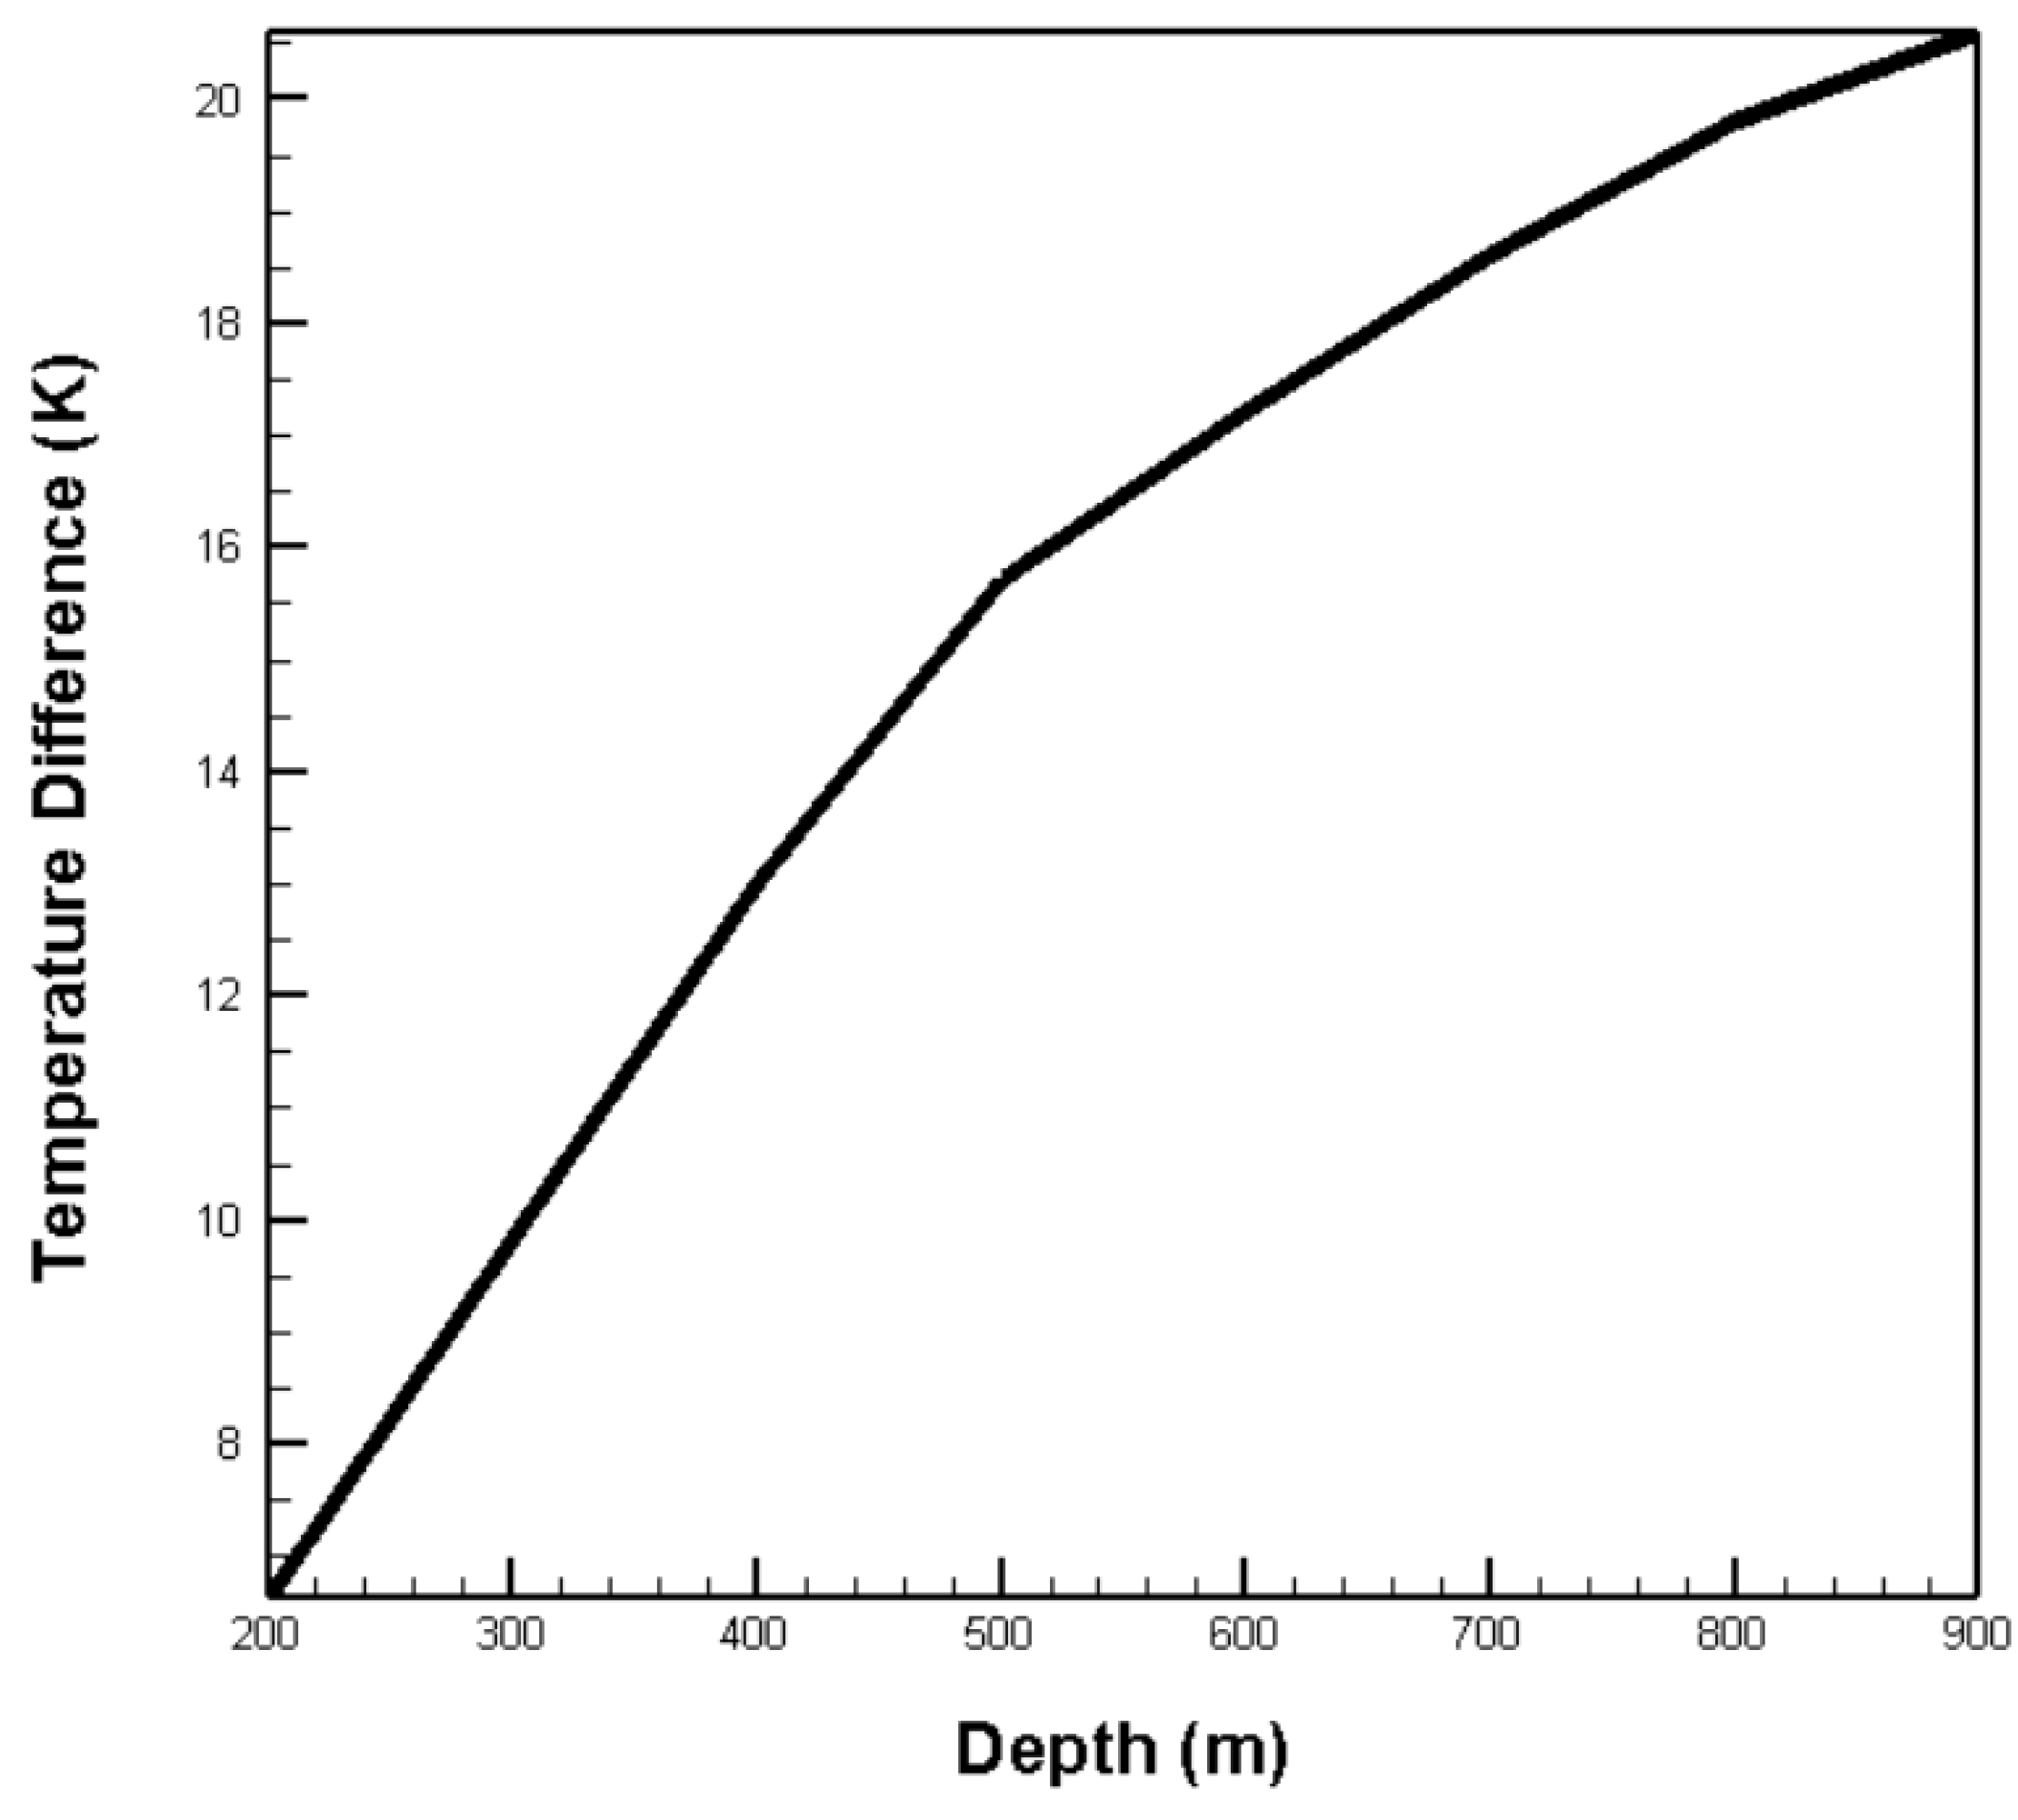
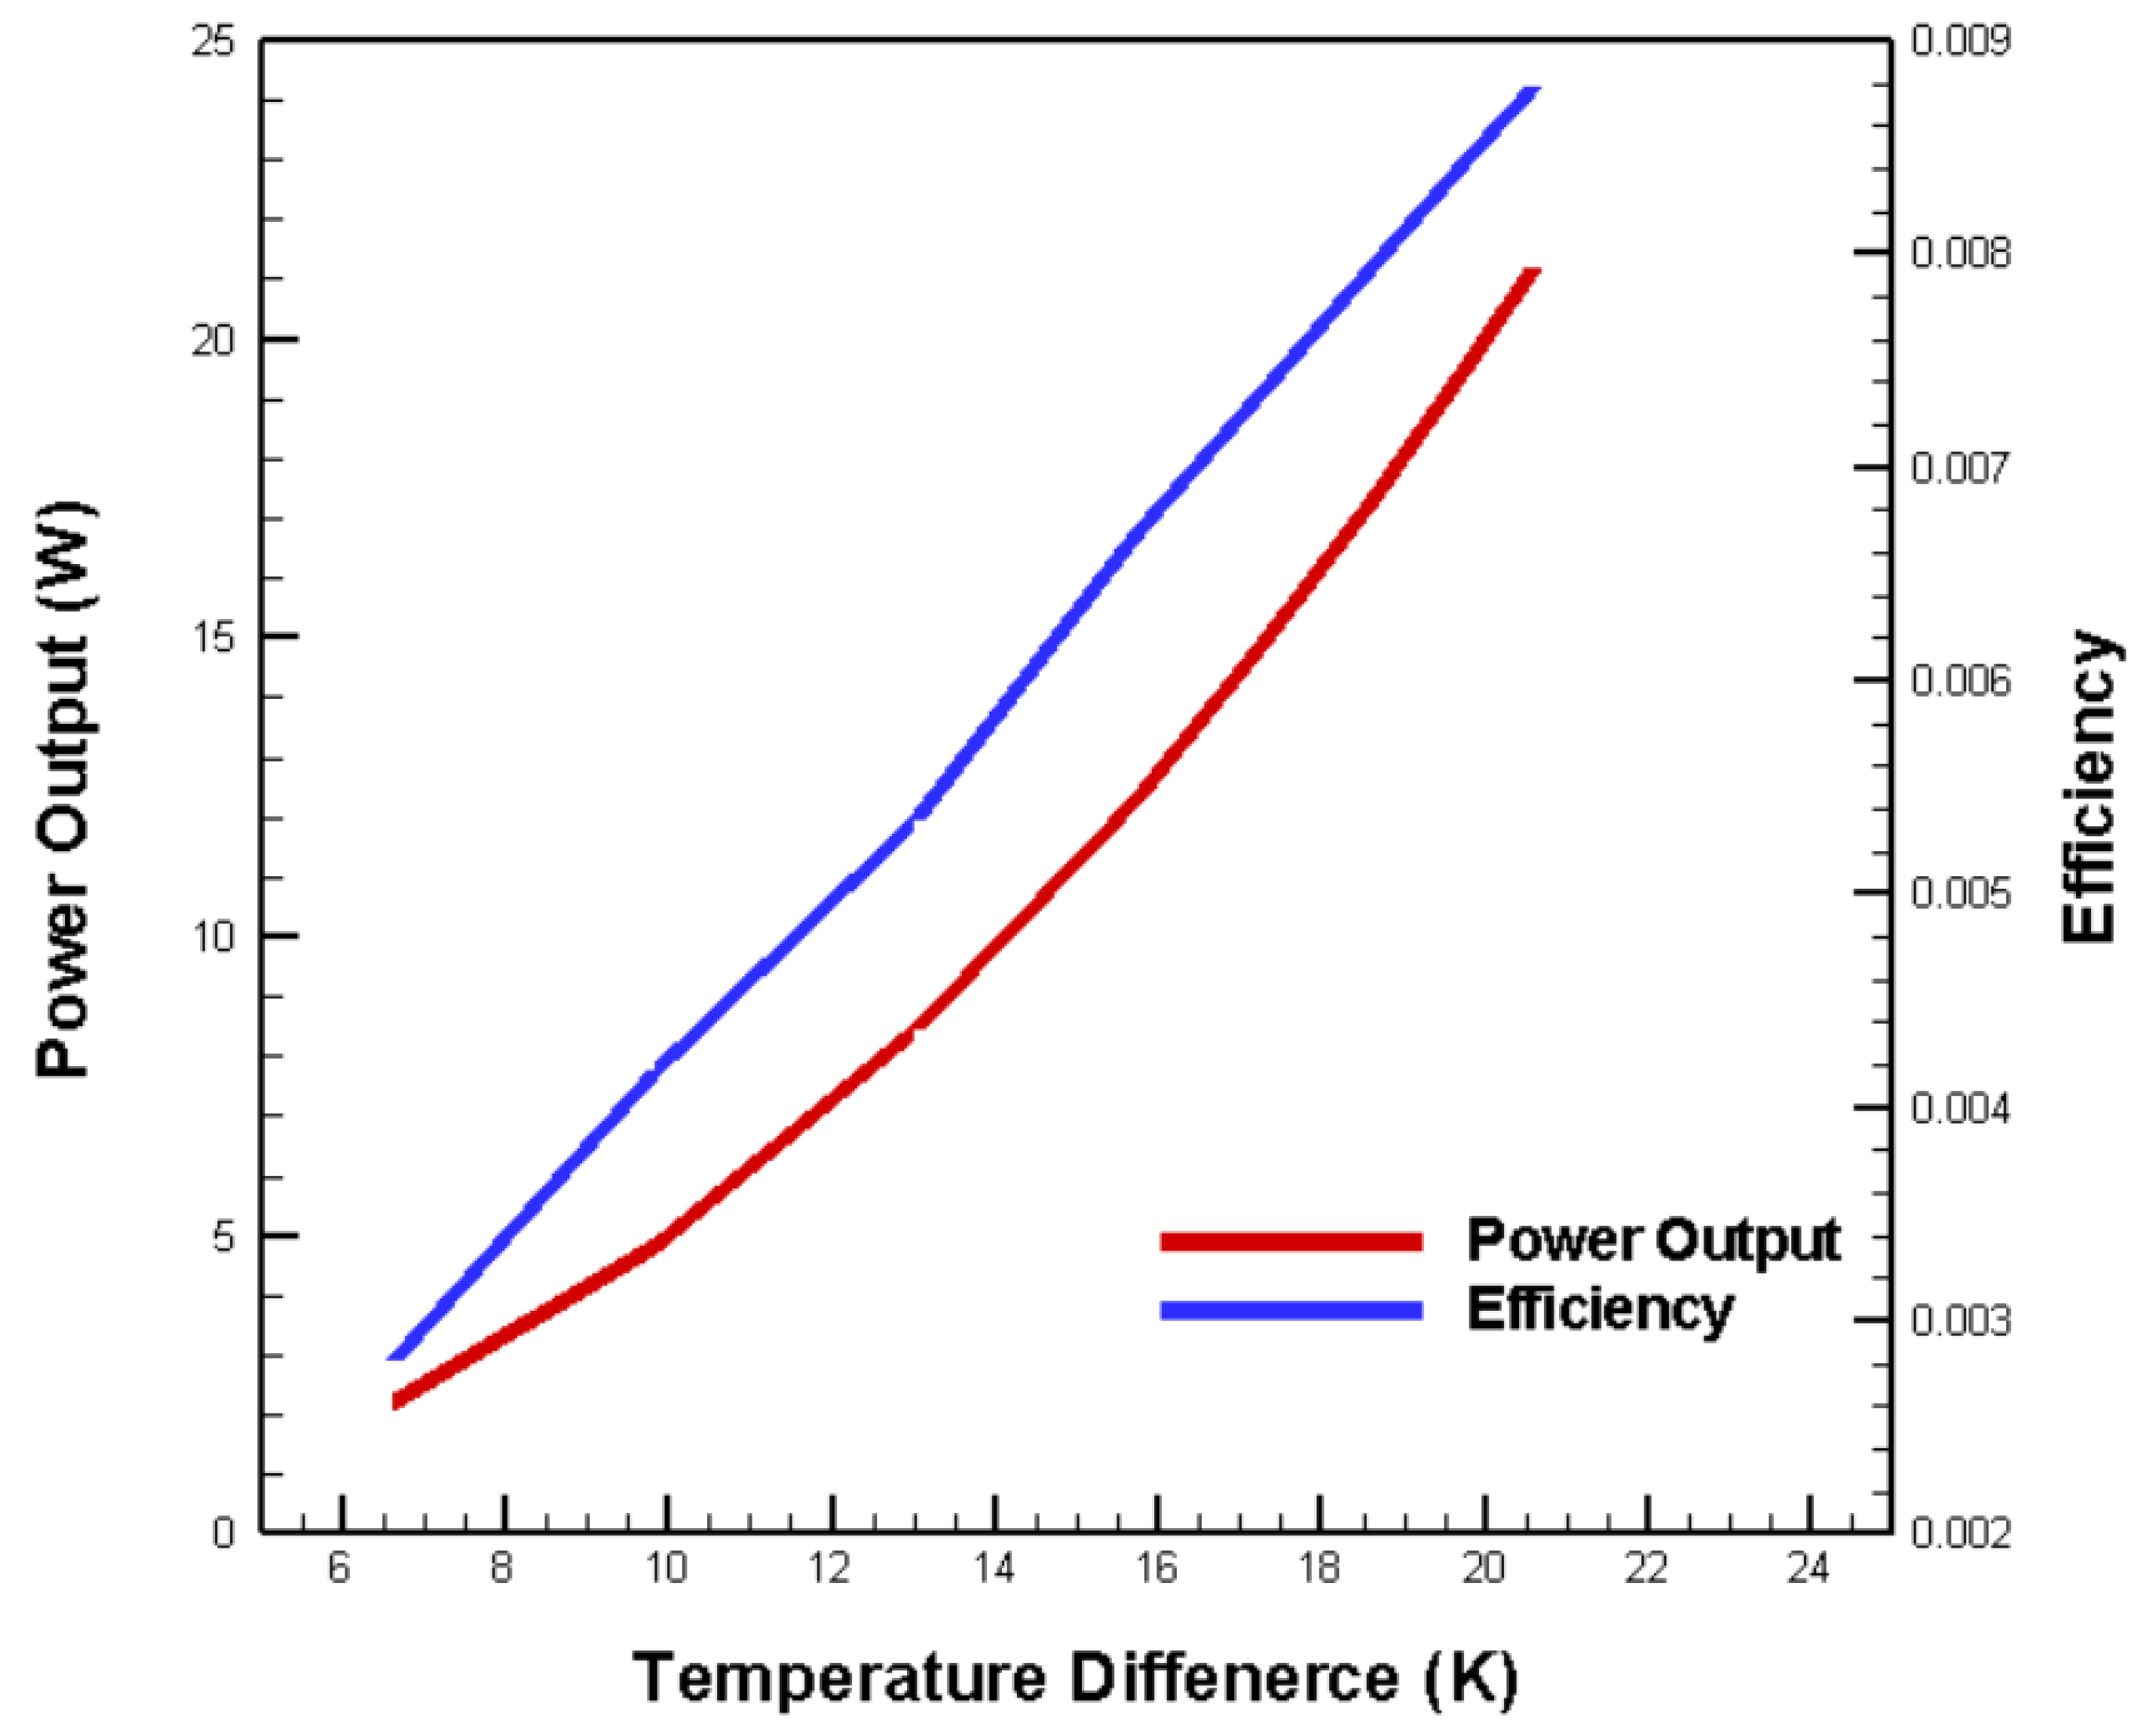
This study focused on analyzing thermoelectric systems' power output and efficiency using identical materials. The primary influencing factor is the temperature differential between the hot and cold ends. A more significant gradient increases the open-circuit voltage, improving output power and conversion efficiency. Leveraging the ocean's diverse temperatures at varying depths (Figure 10), we established a constant warm surface temperature (Th) of 298 K. We also selected cold seawater temperatures at 100-meter-deep intervals below. The corresponding temperature differences (∆T) for simulations run at a Reynolds number (Re) of 11275 were 6.6 K, 9.8 K, 13 K, 15.7 K, 17.2 K, 18.6 K, 19.8 K, and 20.6 K. Per Equation 21,
V O C = ( S p S n ) × ( T H T C ) × N
where VOC is Open-circuit voltage (V); Sp is Seebeck coefficient of the p-type thermoelectric material (V/K); Sn is Seebeck coefficient of the n-type thermoelectric material (V/K); TH is Temperature at the hot side of the thermoelectric module (K); TC is Temperature at the cold side of the thermoelectric module (K) and N is Number of thermocouples in the module. For the smallest ∆T of 6.6 K, VOC was 1.09 V. Output power and efficiency were 0.304 W and 0.279%, respectively. At a maximum ∆T of 20.6 K, Equation 22
R T E = ( R n + R p ) × N
RTE is Total electrical resistance of the thermoelectric module (Ω); Rn is Electrical resistance of the n-type thermoelectric material (Ω); Rp is Electrical resistance of the p-type thermoelectric material (Ω). VOC is 3.39 V. Power output is 2.95 W with a 0.872% conversion efficiency. Figure 11 shows both metrics increasing with ∆T.
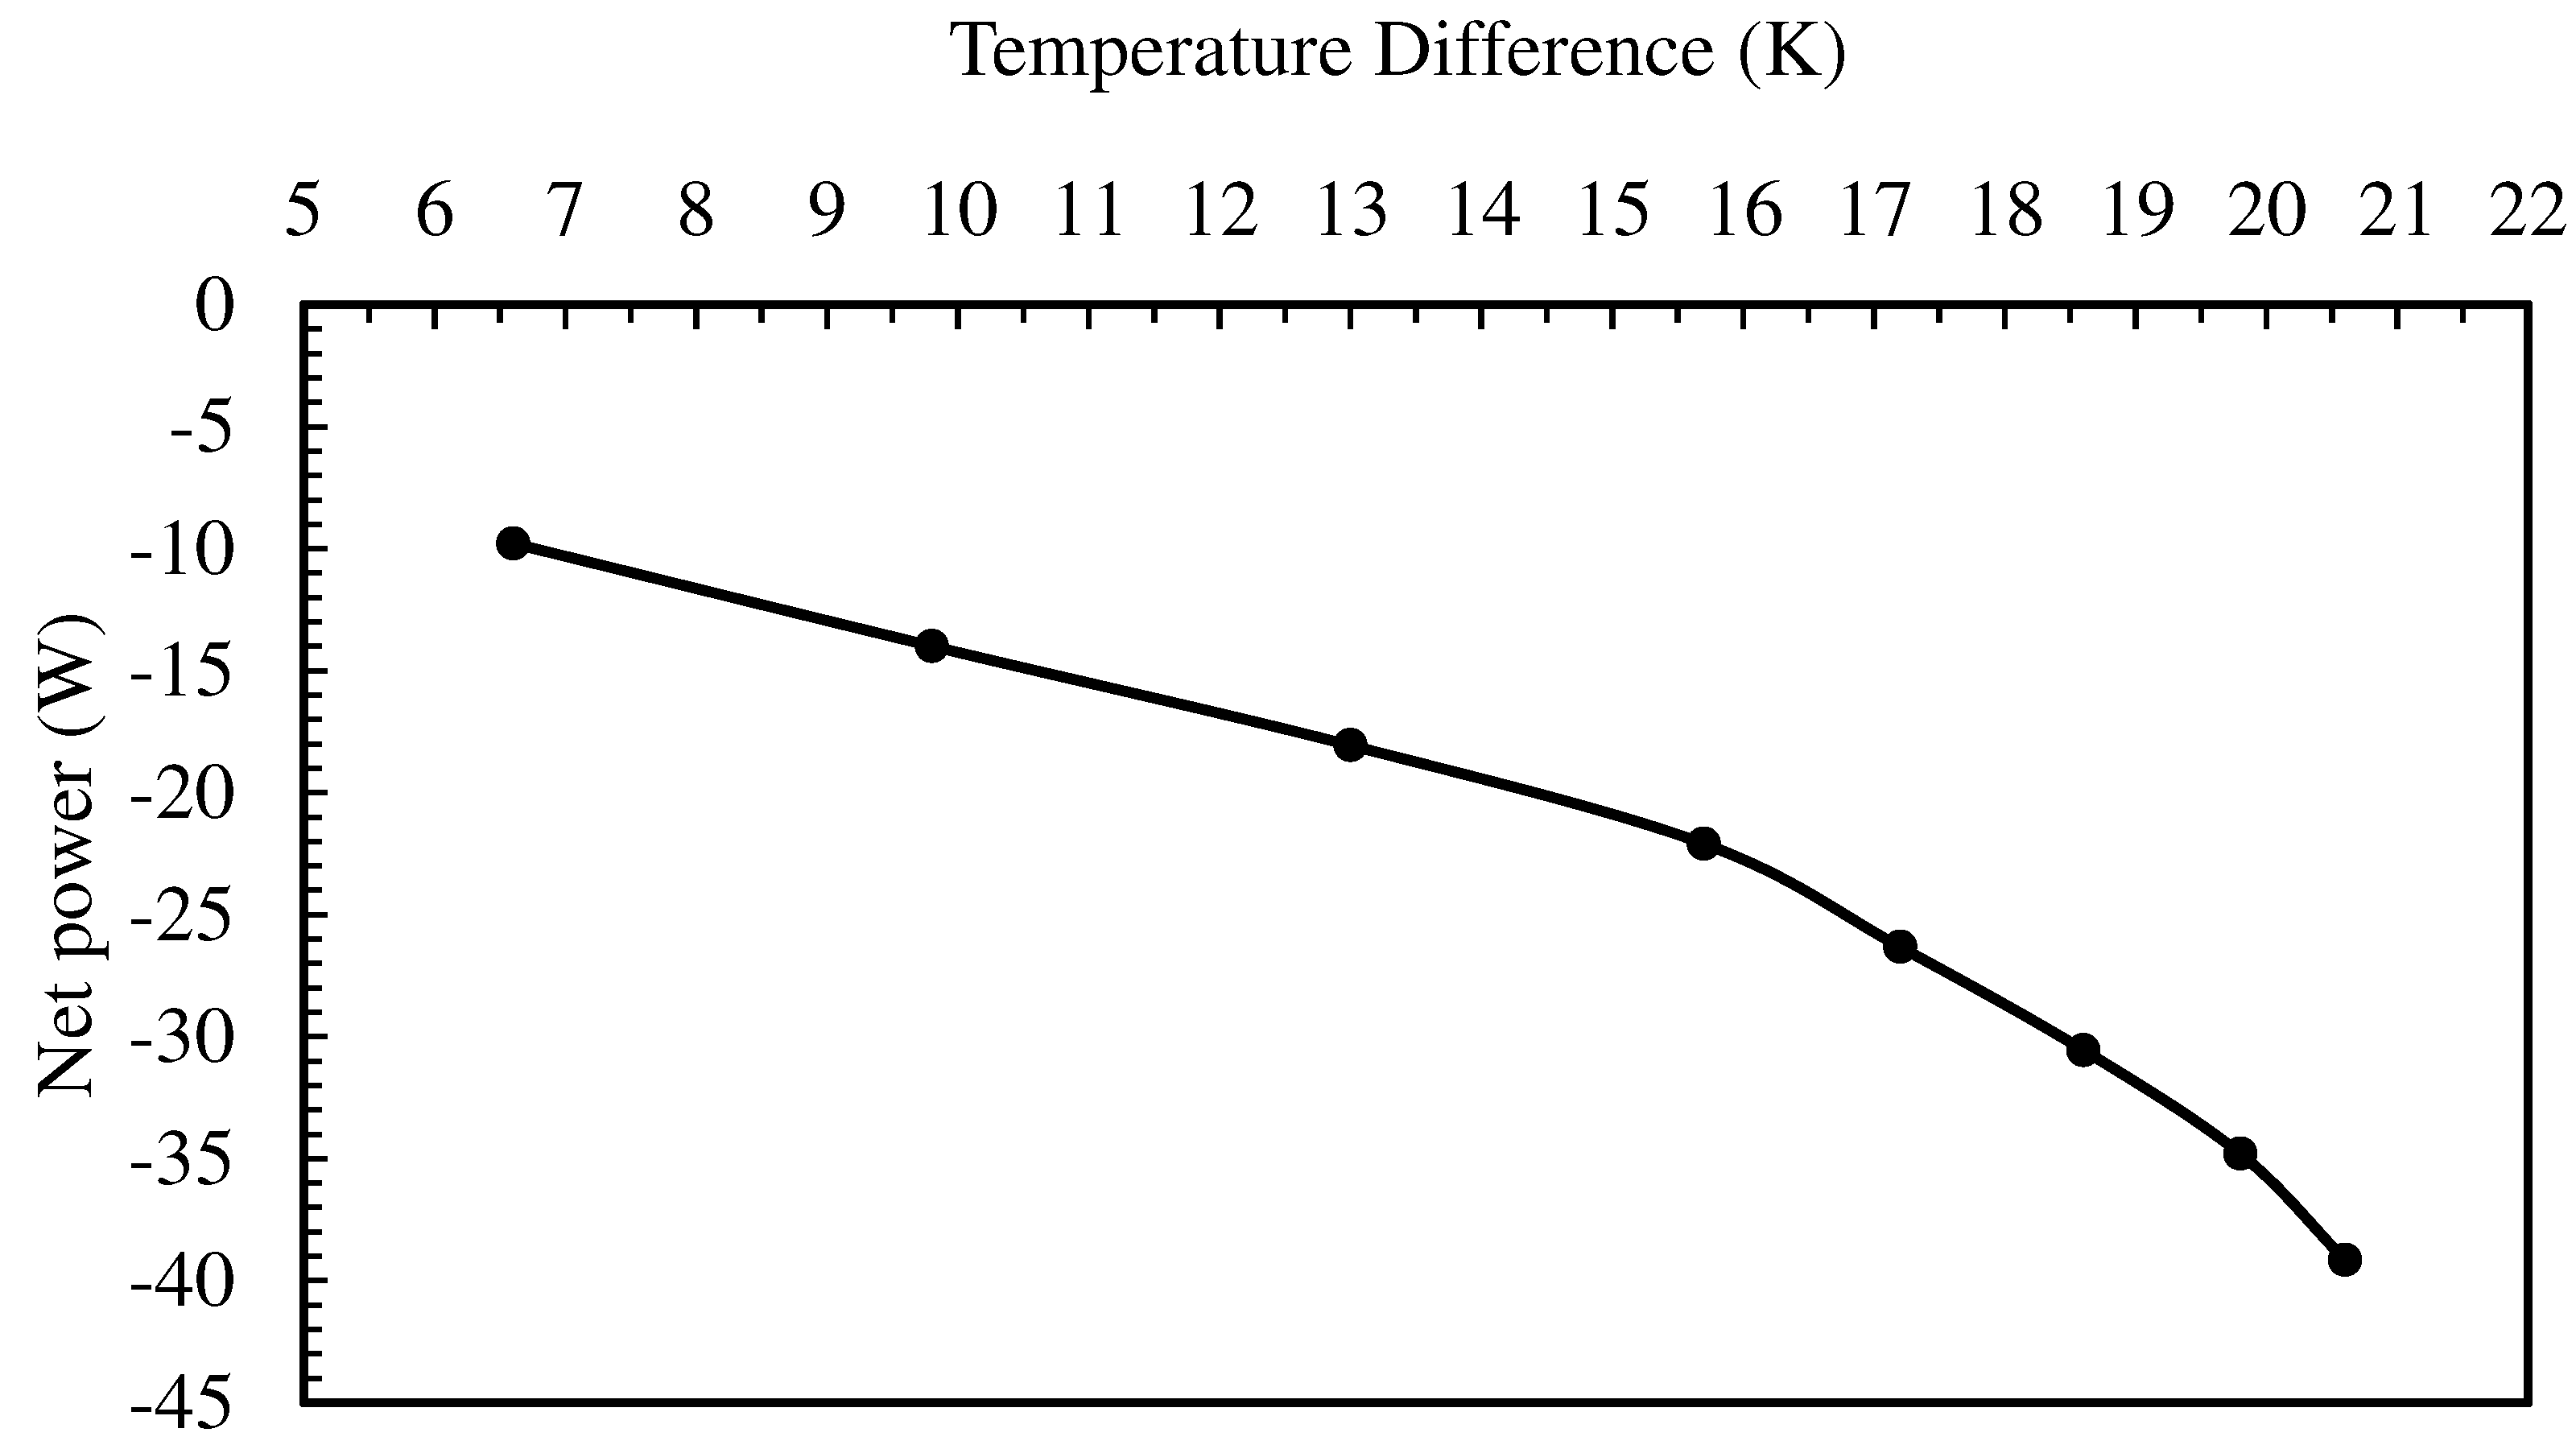
Extracting colder seawater from greater depths for more extensive ∆T requires more pump energy, reducing system net power despite the temperature difference (Figure 12).

3.5. Simulation Results and Performance Analysis of TEGs in OTEC Applications

This study analyzes the application of the TEGs in OTEC, employing the finite element method to simulate TEGs positioned between cold and warm seawater channels. The investigation focuses on the impact of fluid properties on the electricity generation performance of TEGs. By altering the channel height, the Reynolds number is controlled to examine fluids with varying Reynolds numbers, in both parallel and counter flows. The theoretical thermoelectric chip is used to calculate TEG's output power and conversion efficiency, with pump power equations used to compare the net power of TEGs. The simulation results led to the following conclusions:
  • When surface warm seawater and deep cold seawater flow through the channels at fixed temperatures and velocities, the temperature change is nearly linear, indicating stable heat exchange between the fluid and TEG.
  • In both parallel and counter flows models, when the Reynolds number (Re) is less than 12000, the warm surface and cold deep seawater provide lower heat to the TEG. Conversely, at Re>12000, they provide sufficient and stable heat.
  • In the parallel flows, as the Reynolds number increases and sufficient thermal energy is provided to the TEG, the output power also increases, stabilizing at 3.01 W for Re>12000.
  • Although higher channel heights yield better TEG output power, the highest net power, considering pump consumption, occurs at a channel height of D = 0.002 m due to the lowest fluid flow and, consequently, the lowest pump consumption. Net power becomes negative when channel height exceeds 0.01 m.
  • Comparing two different thermoelectric materials, it was found that materials with higher electrical conductivity and lower thermal conductivity exhibit superior thermoelectric performance, resulting in higher output power, in both parallel and counter models.
  • Keeping the surface warm seawater temperature constant and varying the cold end temperature at different depths showed that the open-circuit voltage of the TEG increases with the temperature difference, thereby increasing both output power and conversion efficiency.

4. Conclusions

This work thoroughly investigates utilizing TEGs for OTEC. It employs finite element simulations to analyze the interaction between fluid dynamics and TEG efficiency. The results highlight the significant impact of fluid characteristics, particularly the Reynolds number, on heat transfer effectiveness and, consequently, the electrical power TEGs produce. Notably, the study shows that at Reynolds numbers above 12,000, the heat supplied to TEGs substantially increases, yielding higher power output. Furthermore, the nearly linear temperature profiles in the flow channels confirm stable heat exchange between the fluids and TEG.
An important observation is the TEG output power and pump consumption balance. Although more considerable channel heights typically improve TEG performance, they also increase pump power draw. This demonstrates the need to optimize channel design for maximum net power gain. Moreover, examining various thermoelectric materials reveals that high electrical conductivity and low thermal conductivity lead to greater efficiency, hence enhancing TEG power generation.
Additionally, this study investigates the impacts of different cold end temperatures at varying depths while keeping the warm surface temperature constant. The results clearly show relationships between the temperature differential and the TEG's open-circuit voltage, output power, and conversion efficiency. This observation is especially relevant for developing and deploying TEGs with distinct thermal properties in marine environments.
Ultimately, this research significantly contributes to OTEC by elucidating key factors governing TEG performance in marine settings. The findings provide a foundation for developing more effective, eco-friendly, and economical OTEC systems that harness unused ocean thermal energy for renewable power generation.

Author Contributions

Conceptualization, C.-I W. and W.-L. T.; methodology, C.-I W. and W.-L. T.; software, W.-L. T.; validation, W.-L. T.; formal analysis, C.-I W. and W.-L. T.; investigation, C.-I W. and W.-L. T.; resources, C.-I W.; data curation, W.-L. T.; writing—original draft preparation, C.-I W. and W.-L. T.; writing—review and editing, C.-I W.; visualization, W.-L. T.; supervision, C.-I W.; project administration, C.-I W.; funding acquisition, C.-I W.All authors have read and agreed to the published version of the manuscript.

Funding

This research was funded by National Science and Technology Council of Taiwan, grant number 109-2221-E-019 -013 -.

Data Availability Statement

Data can be obtained by contacting the author, Chun-I Wu (wuchuni@ntou.edu.tw).

Acknowledgments

The authors would like to thank the reviewers for their comments on improving the quality of the paper.

Conflicts of Interest

The authors declare no conflict of interest.

References

  1. Keles, S., Fossil Energy Sources, Climate Change, and Alternative Solutions. Energy Sources Part a-Recovery Utilization and Environmental Effects, 2011. 33(12): p. 1184-1195.
  2. Abbasi, T., M. Premalatha, and S.A. Abbasi, The return to renewables: Will it help in global warming control? Renewable & Sustainable Energy Reviews, 2011. 15: p. 891-894.
  3. Abolhosseini, S., A. Heshmati, and J. Altmann, A Review of Renewable Energy Supply and Energy Efficiency Technologies. Sustainable Technology eJournal, 2014.
  4. Şen, Z., Solar energy in progress and future research trends. Progress in Energy and Combustion Science, 2004. 30: p. 367-416.
  5. Rosen, M.A., Combating global warming via non-fossil fuel energy options. International Journal of Global Warming, 2009. 1: p. 2. [CrossRef]
  6. Klugmann-Radziemska, E. Environmental Impacts of Renewable Energy Technologies. 2014.
  7. Elavarasan, R.M., The Motivation for Renewable Energy and its Comparison with Other Energy Sources: A Review. European Journal of Sustainable Development Research, 2019.
  8. Bombarda, P.A., C.M. Invernizzi, and M. Gaia, Performance Analysis of OTEC Plants With Multilevel Organic Rankine Cycle and Solar Hybridization. Journal of Engineering for Gas Turbines and Power-transactions of The ASME, 2013. 135: p. 042302. [CrossRef]
  9. Gritton, E.C., et al. Quantitative evaluation of closed-cycle Ocean Thermal Energy Conversion (OTEC) technology in central station applications. 1980.
  10. Kamogawa, H., OTEC research in Japan. Energy, 1980. 5: p. 481-492. [CrossRef]
  11. Yamada, N., A. Hoshi, and Y. Ikegami. Thermal Efficiency Enhancement of Ocean Thermal Energy Conversion (OTEC) Using Solar Thermal Energy. 2006.
  12. Cavrot, D., Economics of Ocean Thermal Energy Conversion (OTEC). Renewable Energy, 1993. 3: p. 891-896. [CrossRef]
  13. Ravindran, M.R.M. and R. Abraham, The Indian 1 MW Demonstration OTEC Plant and the Pre-Commissioning Tests. Marine Technology Society Journal, 2002. 36: p. 36-41. [CrossRef]
  14. Burmistrov, I.N., et al., Advances in Thermo-Electrochemical (TEC) Cell Performances for Harvesting Low-Grade Heat Energy: A Review. Sustainability, 2022. [CrossRef]
  15. Pourkiaei, S.M., et al., Thermoelectric cooler and thermoelectric generator devices: A review of present and potential applications, modeling and materials. Energy, 2019. [CrossRef]
  16. Dogra, S. and N. Chauhan. A Review on various ocean thermal energy conversion systems (OTEC). 2021.
  17. Chopra, K.N., Ocean Energy Thermal Conversion (OTEC) and Its Mathematical Modeling-A Short Technical Note. Invertis Journal of Renewable Energy, 2013. 3: p. 222-229.
  18. Zheng, X., et al., A review of thermoelectrics research – Recent developments and potentials for sustainable and renewable energy applications. Renewable & Sustainable Energy Reviews, 2014. 32: p. 486-503. [CrossRef]
  19. Kishore, D.R. and T.J. Prasnnamba, An application of OTEC principle to thermal power plant as a co-generation plant. 2017 2nd International Conference on Communication and Electronics Systems (ICCES), 2017: p. 992-995.
  20. Wood, C., Materials for thermoelectric energy conversion. Reports on Progress in Physics, 1988. 51: p. 459-539. [CrossRef]
  21. Wei, L., et al., Steady State Performance Analysis of OTEC Organic Rankine Cycle System. 2023 5th Asia Energy and Electrical Engineering Symposium (AEEES), 2023: p. 1563-1567.
  22. Bohn, M., D. Benson, and T. Jayadev, Thermoelectric ocean thermal energy conversion. 1980. [CrossRef]
  23. Anatychuk, L. and V. Polyak, Computer design of thermoelectric OTEC. Journal of thermoelectricity, 2015(2): p. 34-44.
  24. Yu, J. and H. Zhao, A numerical model for thermoelectric generator with the parallel-plate heat exchanger. Journal of Power Sources, 2007. 172(1): p. 428-434. [CrossRef]
  25. Niu, X., J. Yu, and S. Wang, Experimental study on low-temperature waste heat thermoelectric generator. Journal of Power Sources, 2009. 188(2): p. 621-626. [CrossRef]
  26. Shi, Q., et al., Comprehensive insight into p-type Bi2Te3-based thermoelectrics near room temperature. ACS Applied Materials & Interfaces, 2022. 14(44): p. 49425-49445.
  27. Hong, M., Z.-G. Chen, and J. Zou, Fundamental and progress of Bi2Te3-based thermoelectric materials. Chinese Physics B, 2018. 27(4): p. 048403.
  28. Lu, X. and D.T. Morelli, Natural Mineral Tetrahedrite as a Direct Source of Thermoelectric Materials. Phys. Chem. Chem. Phys., 2013. 15: p. 5762. [CrossRef]
  29. Zhou, Y., et al., n-Bi2–x Sb x Te3: A Promising Alternative to Mainstream Thermoelectric Material n-Bi2Te3–x Se x near Room Temperature. ACS Applied Materials & Interfaces, 2020. 12(28): p. 31619-31627.
  30. Tang, X., et al., A comprehensive review on Bi2Te3-based thin films: thermoelectrics and beyond. Interdisciplinary Materials, 2022. 1(1): p. 88-115.
  31. Shu, R., et al., Mg3+ δSbxBi2− x Family: A Promising Substitute for the State-of-the-Art n-Type Thermoelectric Materials near Room Temperature. Advanced Functional Materials, 2019. 29(4): p. 1807235.
  32. Wang, S., et al., Enhanced thermoelectric properties of Bi 2 (Te 1− x Se x) 3-based compounds as n-type legs for low-temperature power generation. Journal of Materials Chemistry, 2012. 22(39): p. 20943-20951.
  33. Wu, C., Specific power analysis of thermoelectric OTEC plants. Ocean engineering, 1993. 20(4): p. 433-442. [CrossRef]
  34. Yeo, Y. and T. Oh, Thermoelectric properties of p-type (Bi, Sb) 2Te3 nanocomposites dispersed with multiwall carbon nanotubes. Materials Research Bulletin, 2014. 58: p. 54-58.
  35. Tan, M., Y. Hao, and G. Wang, Improvement of thermoelectric properties induced by uniquely ordered lattice field in Bi2Se0. 5Te2. 5 pillar array. Journal of Solid State Chemistry, 2014. 215: p. 219-224. [CrossRef]
  36. Tseng, W.-L., Simulation design of ocean thermoelectric power generation system, in Mechanical and Mechatronic Engineering. 2021, National Taiwan Ocean University. p. 76.
  37. Yan, S.-R., et al., Performance and profit analysis of thermoelectric power generators mounted on channels with different cross-sectional shapes. Applied Thermal Engineering, 2020. 176: p. 115455.
  38. Ma, T., et al., Numerical study on thermoelectric–hydraulic performance of a thermoelectric power generator with a plate-fin heat exchanger with longitudinal vortex generators. Applied Energy, 2017. 185: p. 1343-1354. [CrossRef]
  39. Zhang, Q.-H., S.-Q. Bai, and L.-D. Chen, Technologies and applications of thermoelectric devices: current status, challenges and prospects. 2019.
  40. Chen, W.-H., et al., A comprehensive analysis of the performance of thermoelectric generators with constant and variable properties. Applied energy, 2019. 241: p. 11-24. [CrossRef]
  41. Sandoz-Rosado, E.J., Investigation and development of advanced models of thermoelectric generators for power generation applications. 2009: Rochester Institute of Technology.
  42. APDRC LAS7 for public. 2021 [cited 2021 2021/6/30]; Available from: http://apdrc.soest.hawaii.edu/las/v6/constrain?var=11412.
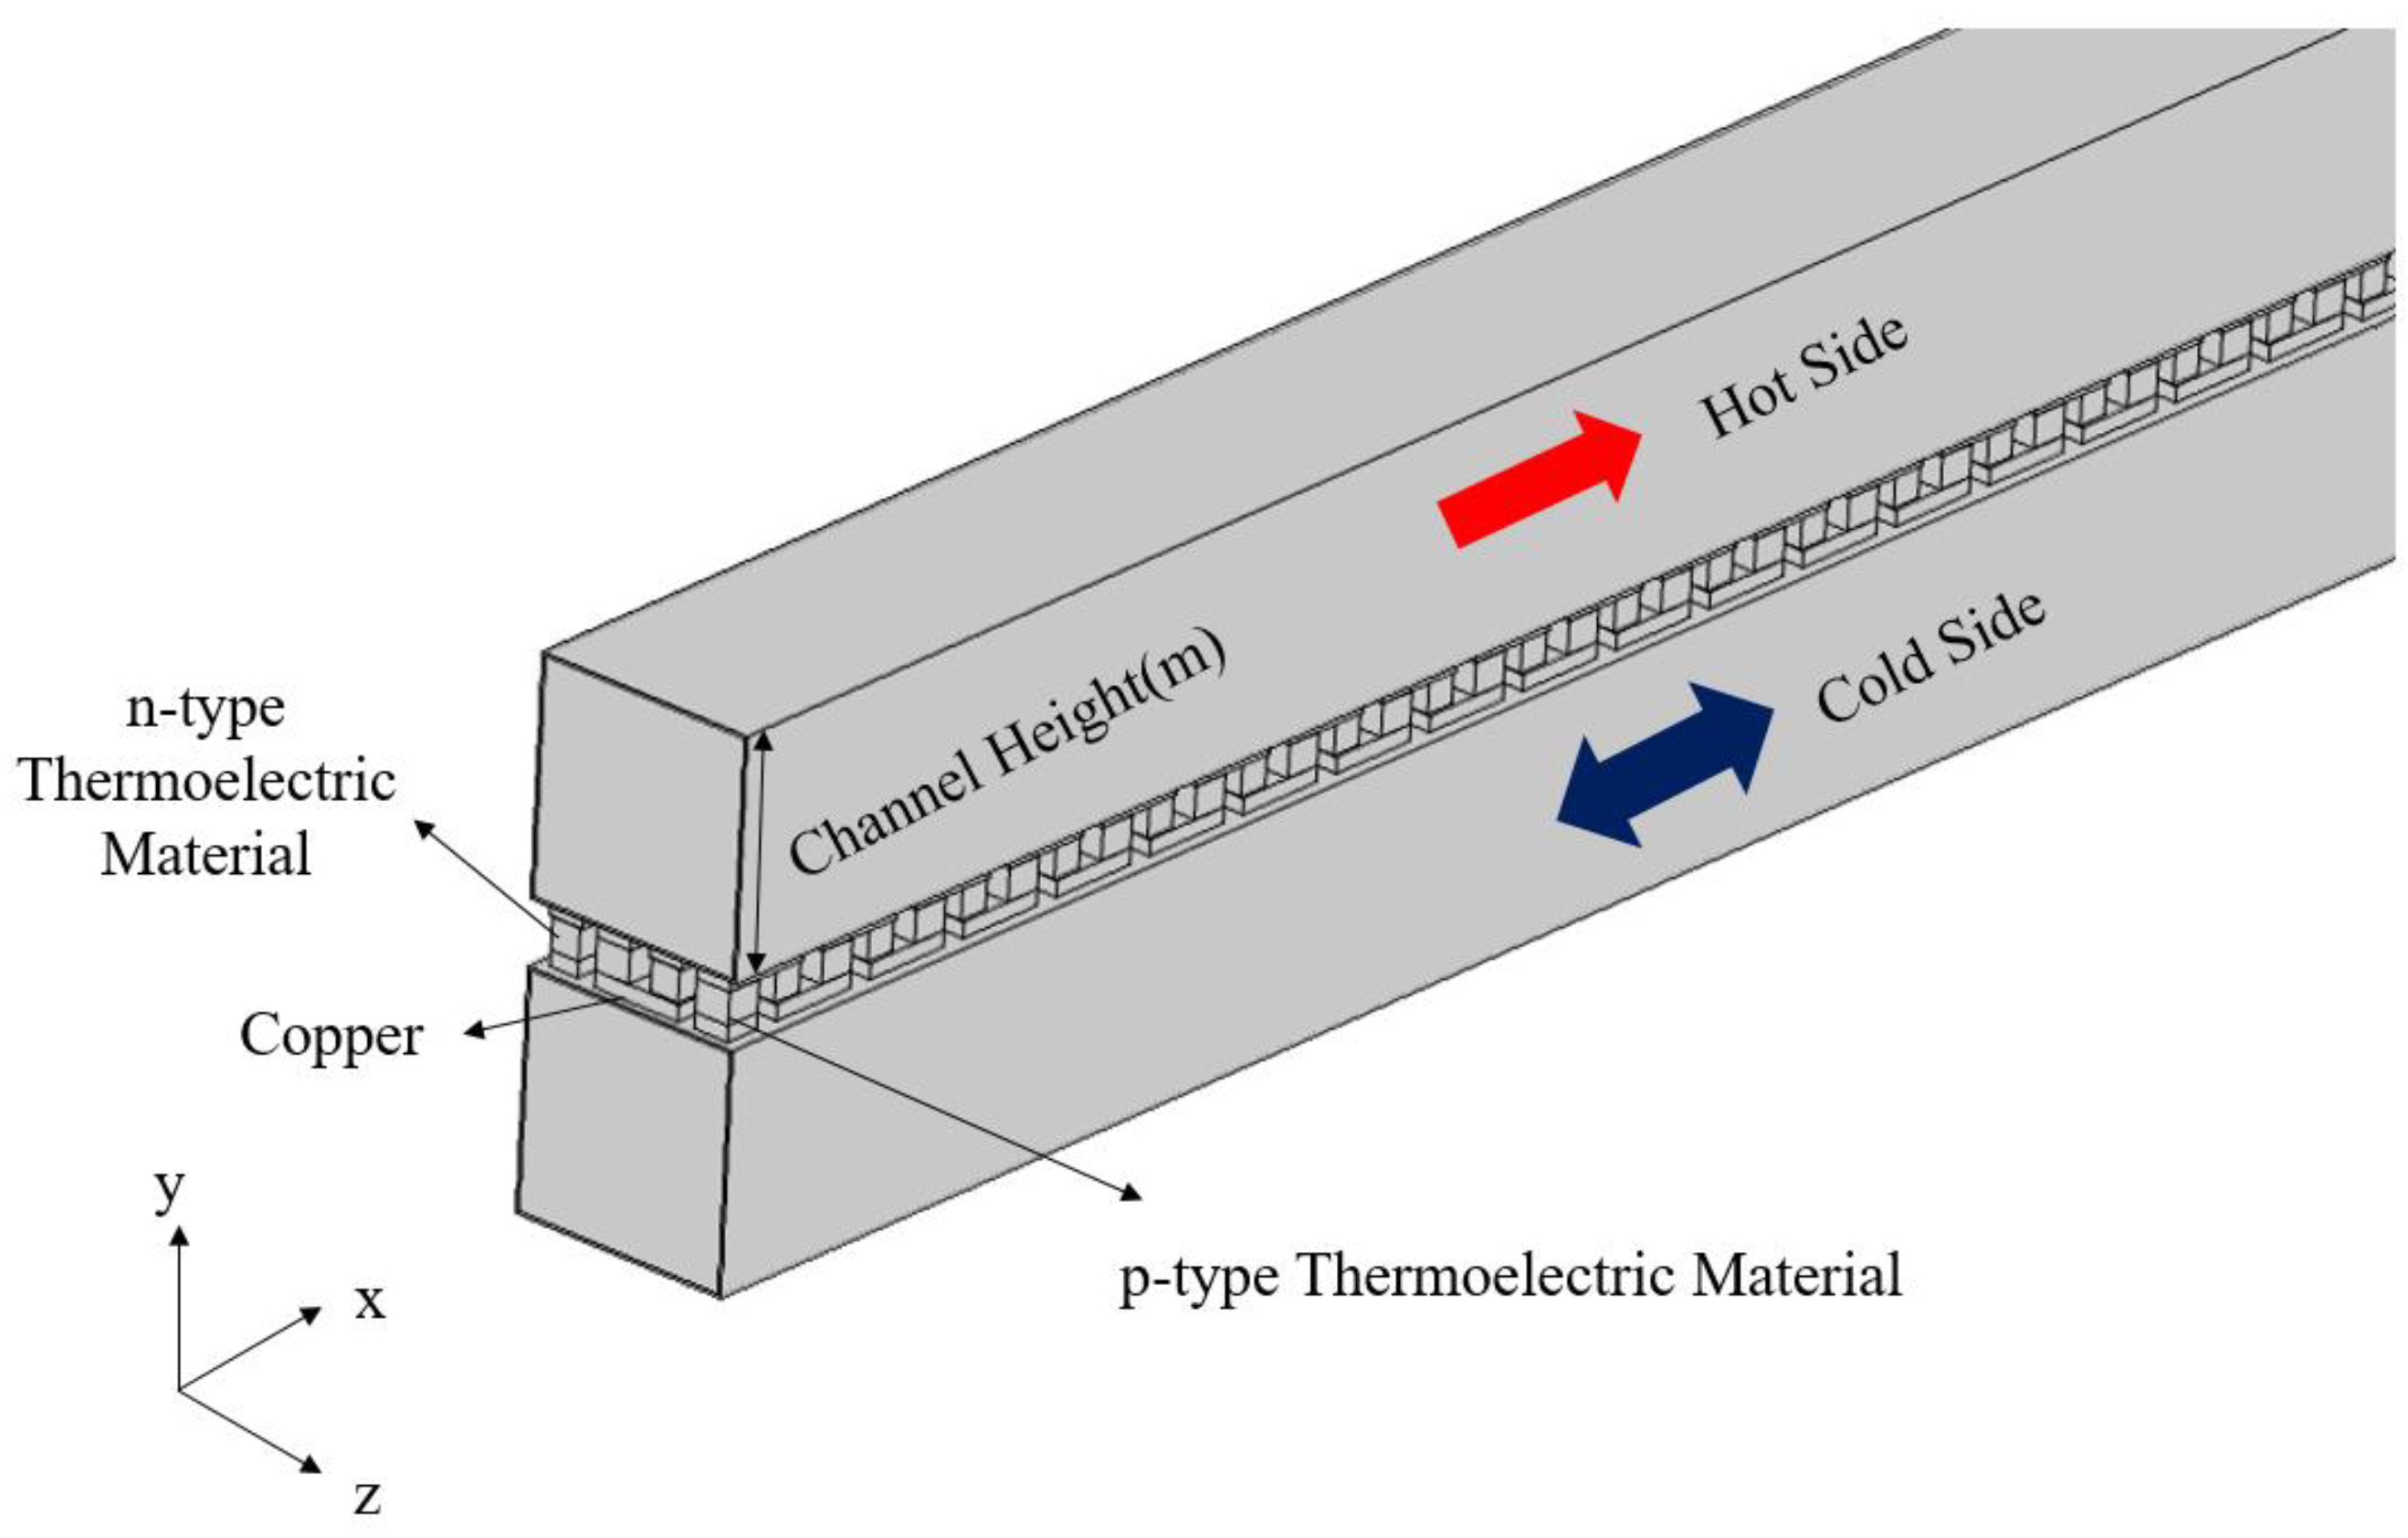
Figure 1. Schematic Representation of the Channel Structure with a Height of 0.072 meters [36].
Preprints 95317 g001
Figure 2. Trend Diagram Illustrating the Relationship Between Channel Length and Temperature Distribution at a Reynolds Number of 3987 (In parallel flows Direction) [36].
Preprints 95317 g002
Figure 3. Diagram Depicting the Relationship Between Channel Length and Temperature Distribution at a Reynolds Number of 3987 (counter flows) [36].
Preprints 95317 g003
Figure 4. Diagram Illustrating the Trend of Temperature Difference Distribution Relative to Channel Length at a Reynolds Number of 3987 [36].
Preprints 95317 g004
Figure 5. Comparative Analysis of Heat Quantities at the Hot and Cold Ends for parallel and counter flows Across Various Reynolds Numbers [36].
Preprints 95317 g005
Figure 6. Comparison of Output Power for Parallel and Counter Flows Across a Range of Reynolds Numbers [36].
Preprints 95317 g006
Figure 7. Variation of Net Power Output Across Various Channel Heights[36].
Preprints 95317 g007
Figure 8. Comparison of Output Power for Different Thermoelectric Materials in Forward and Reverse Flows (Material 1 - n-type: 75% Bismuth Telluride (Bi2Te3), 25% Bismuth Selenide (Bi2Se3); p-type: 25% Bi2Te3, 75% Antimony Telluride (Sb2Te3); Material 2 - n-type: Bismuth Selenide Telluride (Bi2Se0.5Te2.5), p-type: Bismuth Antimony Telluride ((Bi0.2Sb0.8)2Te3))[36].
Preprints 95317 g008
Figure 9. Comparison of Conversion Efficiency in Counter Flow for Various Thermoelectric Materials (Material 1 - n-type: 75% Bismuth Telluride (Bi2Te3), 25% Bismuth Selenide (Bi2Se3); p-type: 25% Bi2Te3, 75% Antimony Telluride (Sb2Te3); Material 2 - n-type: Bismuth Selenide Telluride (Bi2Se0.5Te2.5), p-type: Bismuth Antimony Telluride ((Bi0.2Sb0.8)2Te3))[36].
Preprints 95317 g009
Figure 10. Variations in Temperature at Various Ocean Depths[42].
Preprints 95317 g010
Figure 11. Influence of Variations in Temperature Difference on Output Power and Conversion Efficiency [36].
Preprints 95317 g011
Figure 12. Impact of Temperature Difference Variations on the Net Power Output of Thermoelectric Systems[36].
Preprints 95317 g012
Table 1. The Correspondence of Hydraulic Diameter and Reynolds Number to Channel Height.
Channel Height (m) Hydraulic Diameter (m) Reynold Number
0.002 3.89×10⁻³ 3987
0.006 1.11×10⁻² 11275
0.010 1.76×10⁻² 18040
0.018 2.91×10⁻² 29848
0.036 4.8×10⁻² 49200
0.054 6.17×10⁻² 63253
0.072 7.2×10⁻² 73800
Disclaimer/Publisher’s Note: The statements, opinions and data contained in all publications are solely those of the individual author(s) and contributor(s) and not of MDPI and/or the editor(s). MDPI and/or the editor(s) disclaim responsibility for any injury to people or property resulting from any ideas, methods, instructions or products referred to in the content.
Copyright: This open access article is published under a Creative Commons CC BY 4.0 license, which permit the free download, distribution, and reuse, provided that the author and preprint are cited in any reuse.
Prerpints.org logo

Preprints.org is a free preprint server supported by MDPI in Basel, Switzerland.

Subscribe

© 2024 MDPI (Basel, Switzerland) unless otherwise stated