Preprint
Article

Distinguishing Geogenic Load and Anthropogenic Contribution to Soil Contamination in Mineralised Mountain Landscape of Ore Mountains by Cumulative Distribution Functions

Altmetrics

Downloads

80

Views

35

Comments

0

A peer-reviewed article of this preprint also exists.

Submitted:

04 January 2024

Posted:

04 January 2024

You are already at the latest version

Alerts
Abstract
In ore regions impacted by mining and metal smelting emissions, distinguishing between geogenic anoma-lies and anthropogenic contamination poses a significant challenge. In a study from two areas with different mining histories in the Ore Mountains, Czech Republic, we demonstrate that targeted sampling of topsoils and subsoils respecting local geology and correct soil data treatment respecting soil textural variability effects are indispensable to correctly construct and interpret geochemical maps and identify anthropogenic contam-ination by As, Cu, Pb, and Zn. The list of analysed elements must include both potentially toxic and lithogenic elements, otherwise natural controls of soil composition cannot be deciphered. By using empirical cumulative distribution functions, we found that local backgrounds for As/Fe and Pb/Ti are significantly naturally ele-vated (5.7 to 9.8 times and 2.1 to 2.7 times higher, respectively) compared to the global averages. We con-structed geochemical maps with topsoil minus subsoil concentrations to show the main directions of spreading anthropogenic contamination. The anthropogenic diffuse contamination contribution was calcu-lated (1.12·10-4 and 1.42·10-4 for As/Fe and 16.5·10-4 and 16.2·10-4 for Pb/Ti, respectively), which corresponds to topsoil enrichment by ca. 15 and 14 mg kg-1 for As and ca. 35 and 42 mg kg-1 for Pb in the two study areas. Our study thus provided the first published quantitative estimates of geogenic and anthropogenic contribution to this well-known montane area. The obtained estimates were comparable to the results obtained previously from the local peat archives. The approach we used is efficient in deciphering natural and anthropogenic controls of PTEs in geochemically complicated areas.
Keywords: 
Subject: Environmental and Earth Sciences  -   Environmental Science

1. Introduction

  Soil and water contamination is of a global concern for its far-reaching consequences for human health. Concentrations of potentially toxic elements (PTE) in soils are mainly analysed to judge food production safety and identify possible anthropogenic contamination [1,2,3,4,5]. Agricultural land is the basis of food production and plays a crucial role everywhere in the world. Increasing industrial and communal soil contamination deteriorates soil quality and has become a major global problem [6,7]. Soil contamination, i.e. PTEs exceeding common background and potentially endangering food production safety, most commonly caused by industrial activities, can also occur naturally in areas with anomalous soil-forming bedrock [8,9,10,11]. In geochemically anomalous areas, in particular in ore regions with historical mining and smelting [1,2], distinguishing between geogenic anomalies and anthropogenic contamination needs substantial methodologic improvements of current approaches. Study area of this paper, the Ore Mountains, the Czech Republic and Germany, is appropriate for proposing such methodological improvements. History of mining and smelting in the Ore Mountains started more than 1500 years ago and contributed to naturally elevated concentrations of hazardous elements such as As, Pb, and Zn in the environment [12,13]; their consequences are a pertinent problem for local soils and water also in the present time [14,15]. Simultaneously, local rocks here are anomalous due to geochemical hallos around abundant rock veins, which causes highly elevated PTE contents also in deep soil strata not affected by anthropogenic activities. In spite of preceding extensive research, geogenic and anthropogenic contribution to local soils in the Ore Mountains has not been distinguished [2,14].
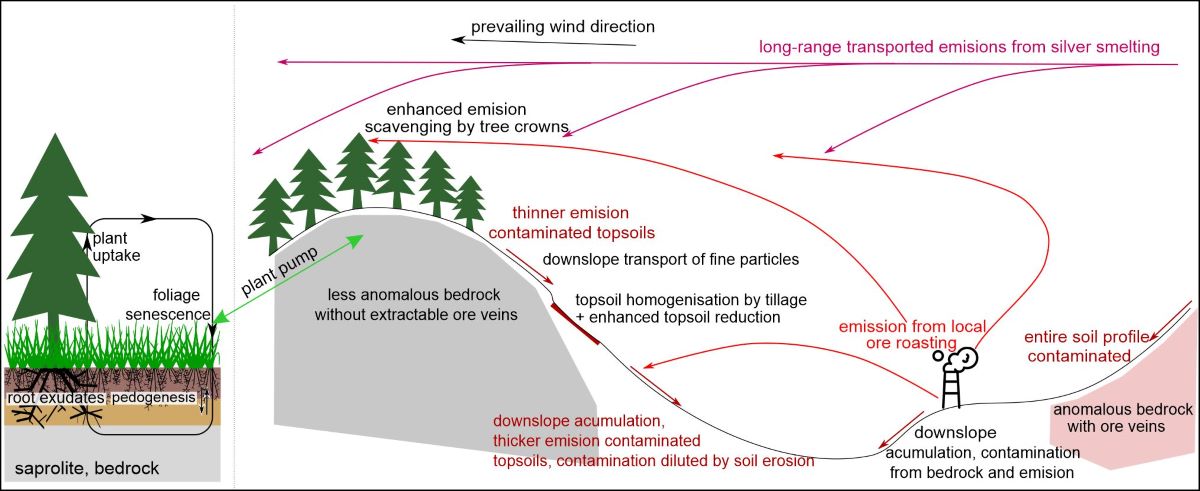
  Interpreting high soil PTE concentrations always requires corrections for variability of real controlling factors (RCFs) behind soil composition, i.e. a suite of geological, geographic, pedogenic, climatic, and anthropogenic factors affecting soil depth profiles of PTEs [16,17,18,19]. All RCFs (Figure 1) cannot be deciphered completely for each soil profile in any study area in the frame of common geochemical mapping projects; there are only individual exceptions of including their substantial portion in specific case studies [1,8]. It is thus essential to interpret the soil geochemical datasets in smaller areas, assuming local RCFs are homogeneous in the entire area [19,20,21], and each case study must be conducted using more detailed approaches than common soil monitoring [20]. Holistic approach and geochemical expertise are needed in data interpretation, whenever unbiased and empirically verifiable results are desired [8,9,19,22]. This is certainly a more appropriate approach than the black box data analysis, so often seen (and growingly popular) today [23], with geochemical soil data mimicking [11,24] instead of understanding and explaining.
In soil studies, geogenic and anthropogenic anomalies, including point and diffuse contamination, can be distinguished using sedimentological tools [25], examination of the entire soil profiles [20,26], or at least a comparison of topsoils (typically 0-20 cm) and subsoils (typically 40-80 cm) [5,11,17,27,28], as a surrogate for complete depth profile analyses. The comparison of topsoils and subsoils can produce hints to decipher the manifestation of some RCFs, in particular geogenic and emission contamination of soils. The best-performing tools for RCFs deciphering from geochemical datasets are exploratory data analysis (EDA), such as data post-stratification and examination of data series distribution [19]. Empirical cumulative distribution function (ECDF) belongs to the most efficient ways of the visualisation and interpretation of geochemical data series [17,19,27]. Recently, ECDFs have been proposed for the identification of diffuse contamination, deciphering of which is a pertinent challenge in environmental geochemistry due to inevitable lack of clear definition of outliers in large soil datasets with weak contamination [17,27,30,31,32]. The diffuse contamination is, however, dangerous by chronic effects of relatively small doses of a contaminant on more components of the soil environment, hence on the whole ecosystem [33]. Comparison of ECDFs of PTEs and lithogenic element concentrations in topsoils and subsoils was employed for distinguishing natural topsoil enrichment, point (or small-scale) contamination, and diffuse contamination [17,27]; this approach deserves further development and broader use in environmental geochemistry.
This work aims to finally decipher the geogenic and anthropogenic contribution to the soil contamination in the Ore Mountains. It is a typical representative of geochemically complex areas with unknown anthropogenic contribution to severely elevated soil PTEs [2,14,15,19]. Although detailed geochemical soil mapping has been performed in the German part of the Ore Mountains by Saxon state authority LfULG [14], there is no overview of historical emission sources and their impacts in that area. This paper is focused on two particular areas in the Ore Mountains, Fláje and Kovářská, and demonstrates that dense sampling and EDA are indispensable to handle local soil complexity. The use of ECDFs for distinguishing diffuse contamination is a particular focus of this work, as some theoretical prerequisites used by Fabian et al. [17] need more attention in our study area, in particular, the diffuse contamination cannot be approximated by a perfectly homogeneous blanket over the entire impacted area due to local topographic and land cover variability (Figure 1). The strategic aim of this work is to test procedures of separation of anthropogenic impact on soil PTEs applicable in whatever geogenically anomalous areas with long-term human impact on the entire environmental compartments, but fully respecting real complexity of geochemical data mining. These tools could finally fill the gap of missing quantification of historical emissions in the Ore Mountains.

2. Materials and Methods

2.1. Geography and mining and smelting history of the study area

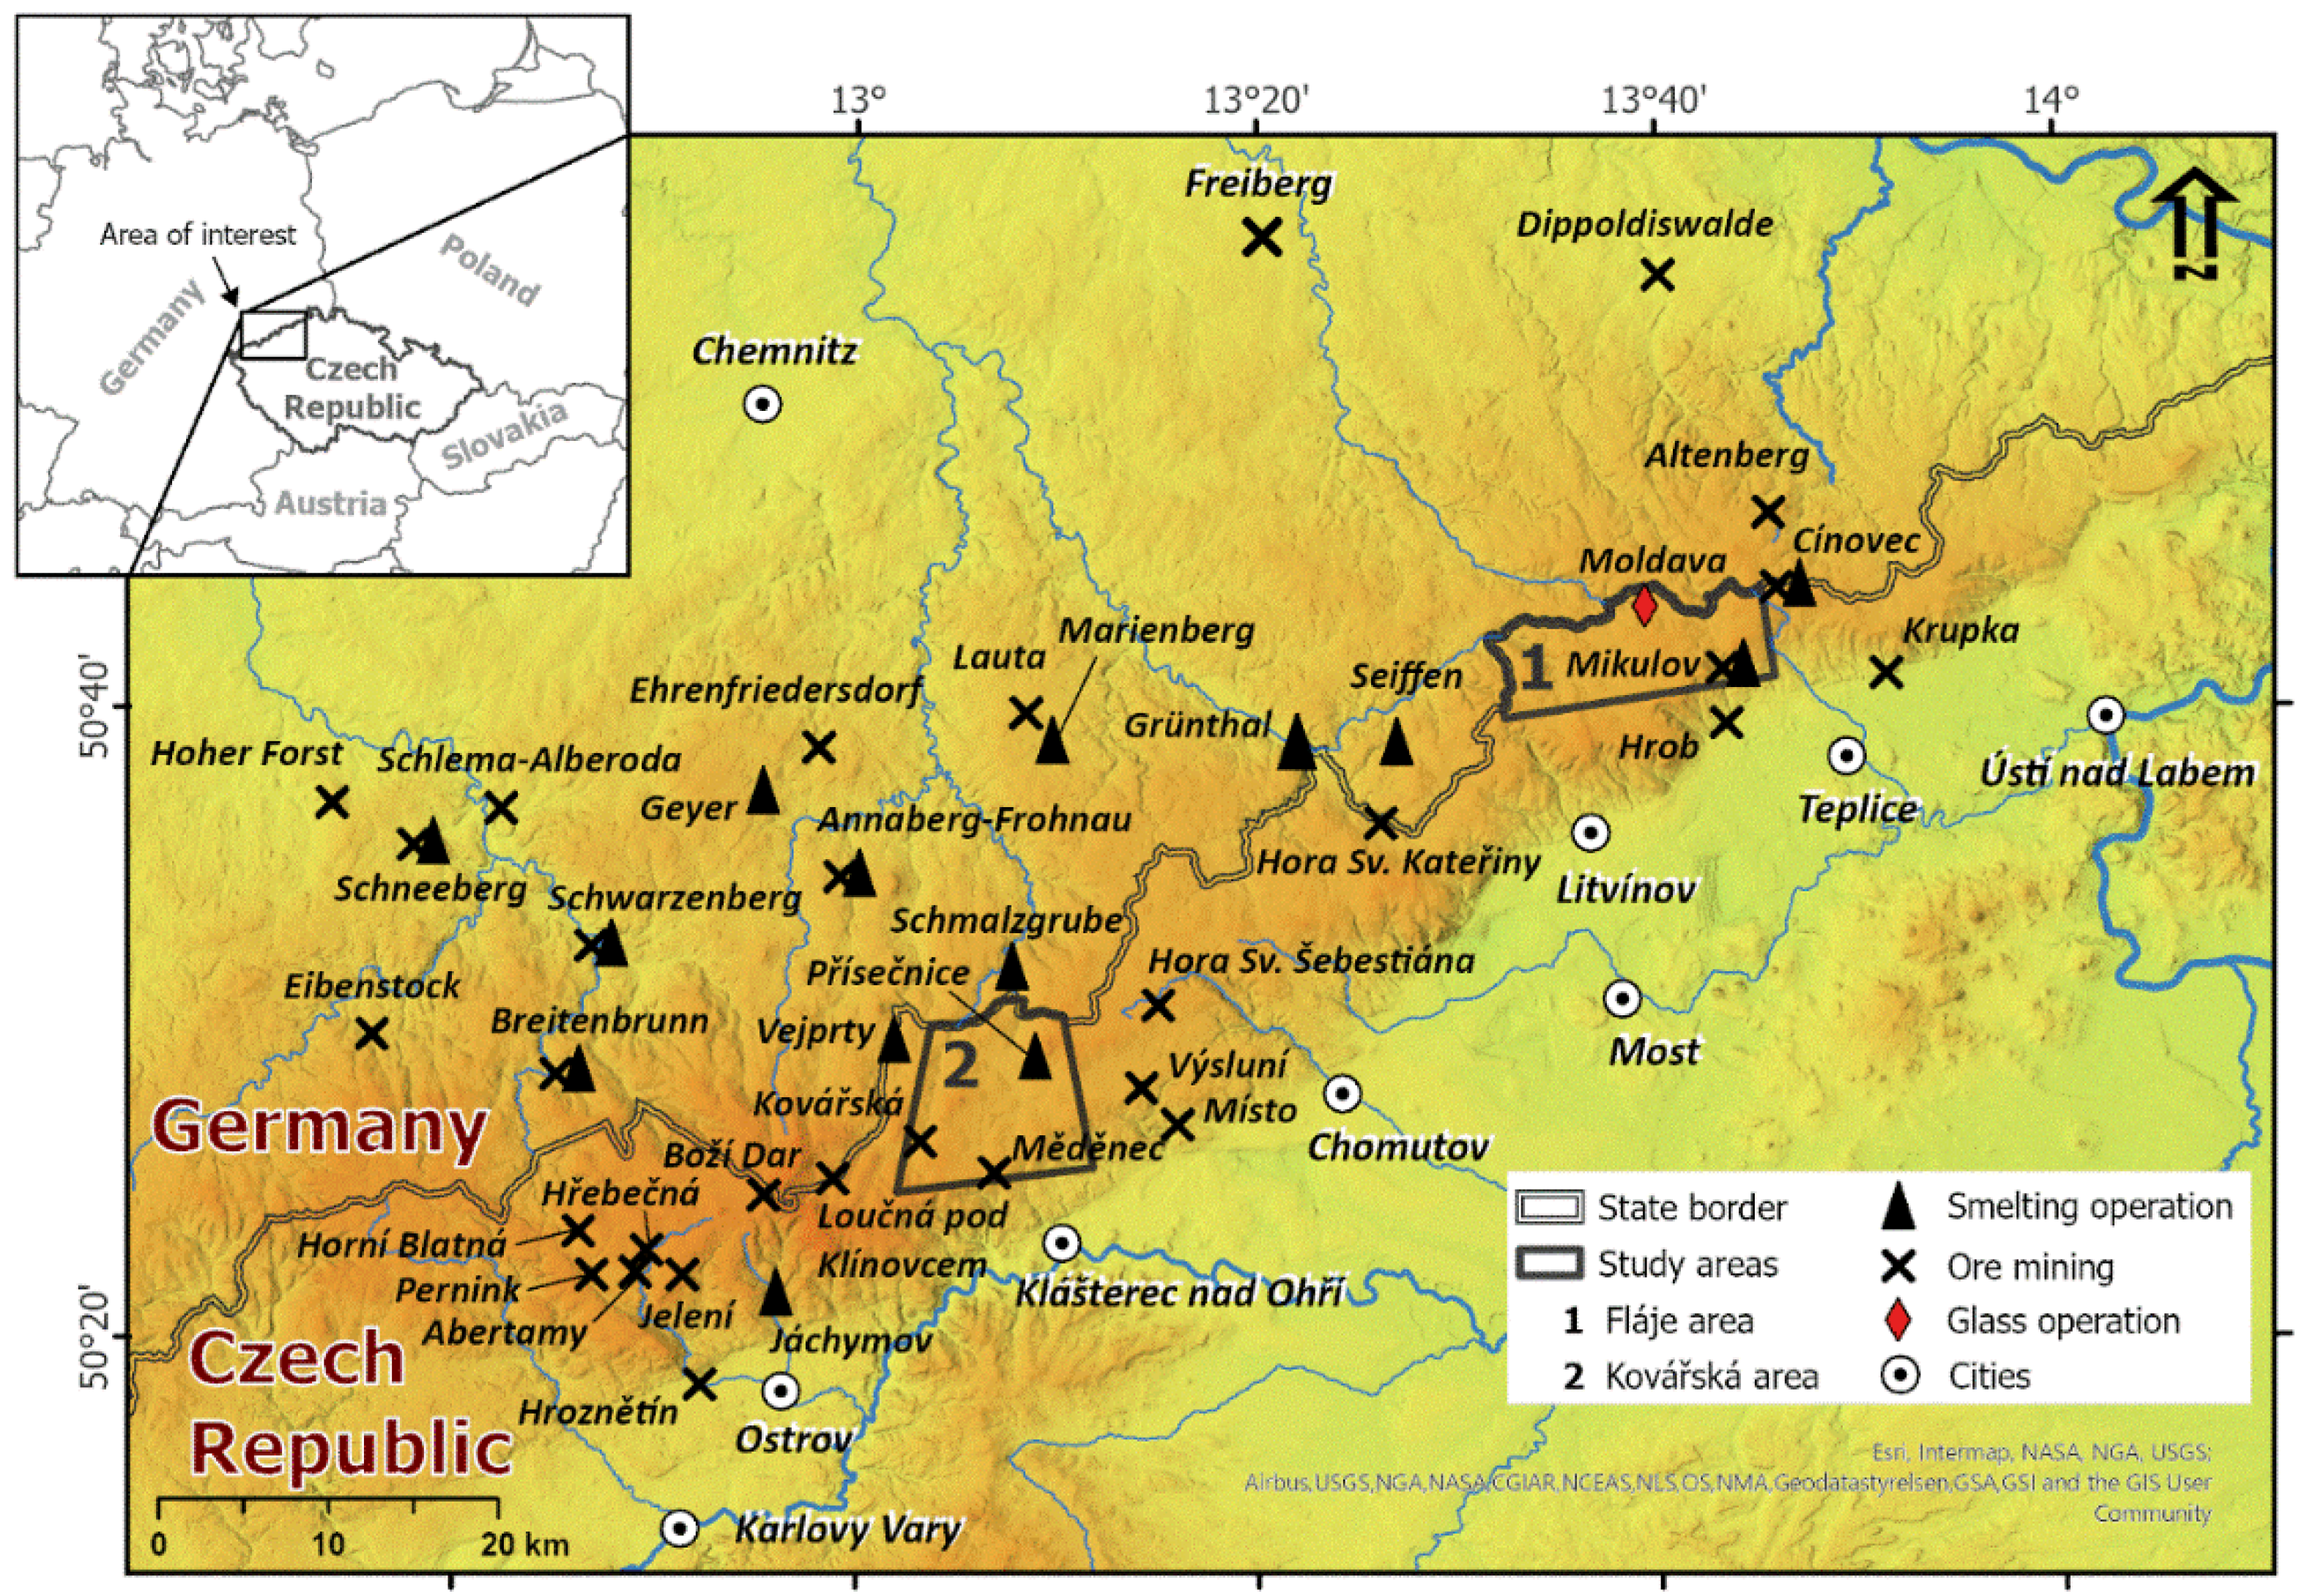
  The Ore Mountains (Erzgebirge in German and Krušné Hory in Czech) represents a mountain range stretching from SW to NE along the Czech-German state border (Figure 2). The altitude is between 338 and 1244 m a.s.l., and annual precipitation is about 900-1200 mm. Study areas are in the mountain ridge, from which the landscape gently slopes to the north-west. Although the Ore Mountains represented a natural barrier of landscape settlement in prehistoric times, its mineral resources made this area the most densely populated mountain range in mediaeval Europe [34,35,36]. The reason of colonisation the Ore Mountains were glass and charcoal production and mining [37]. The mining activity, dating back to the Middle Ages, was primarily focused on Ag and Sn at the beginning, later Pb, Fe, Cu, Co, W, and U were also exploited [38]. Mining and metal smelting became dominant here in the 12th century and continued until the 20th century [12,38]. Mining significantly transformed the local landscape through its deforestation and the establishment of settlements. Now the Ore Mountains are characterised by the abundance of old mining pits and spoil heaps, often close to the pastures and meadows.
  The oldest rocks in the Ore Mountains were of Proterozoic and Cambrian-Ordovician age, exposed and transformed by regional metamorphosis, forming hard rocks similar to the younger granite massifs. The main rocks in the Ore Mountains are metamorphic rocks with predominant gneisses, quartzites, and amphibolites, as well as bodies of igneous rocks.
  The Fláje Area (Figure 2) covers ca. 80 km2. It is located around former Fleyh village, now the Fláje Reservoir (1951-1964). The main rocks here are mainly granites and gneisses, formed from pelitic and granitic rocks, less abundant are amphibolites, basaltoids and volcanic rocks. The area is rather exceptional for the Ore Mountains by absence of the past local mining and smelting. In the village of Moldava (Moldau) and its surroundings, glass was made in 14th = 17th centuries [39,40]. In Grünthal, ca. 15 km west of the Fláje Area (Figure 2), there was silver-copper liquation works for separation of Ag from “black copper” or “black lead” since the 16th century [36]. Another possible sources of emissions were in Mikulov and Hrob, ca. 5 km south-east of the Fláje Area, with historical extraction of Ag-bearing polymetallic ores that peaked around the 16th century. More than 70 ore-bearing polymetallic veins of the As – Ag – Pb type have been documented in the zone between Hrob and Moldava. The mining complex included also a smelting furnace with amalgamation [41].
  The Kovářská Area has ca. 70 km2 (Figure 2). Pelitic rocks to paragneiss are prevailing, with occasional surficial occurrences of basalts, metagranites, and peat. The whole area has mainly been affected by Fe mining and metallurgy since the 13th century. Polymetallic ores were mined and processed in Vejprty (Weipert), Měděnec (Kupferberg), and Přísečnice (Pressnitz), the latest being the second most important Fe mining area in the Czech Lands until the end of the 19th century. The first blast furnace in the Czechia was built in the Kovářská (Schmiedeberg). Magnetite was the latest exploited ore, discovered at Měděnec in 1955 and mined from 1968 to 1992. Ironworks were also established in Schmalzgrube in Germany (Figure 2) in 1659; they were located ca. 6 km to the north of the Kovářská Area and produced pig iron [35].

2.2. Soil sampling and element analysis

  Soils were sampled after removing the humus layer using a shovel or soil auger. The first sample (topsoil, TOP) was taken from a depth of 10 cm, which encompasses the A horizons. The second sample (deeper horizon, BOT) was from a depth of 40 cm, in shallow soils, the sampling depth for BOT was reduced to 30 cm. A total of 72 TOP and BOT pairs of soils were taken in the Kovářská Area and 101 pairs in the Fláje Area. Sampling was carried out at least 50 m away from main roads.
To post-stratify the samples into groups according to geology, we used the GeoCR online geological map with a resolution of 1:50 000 [42].

2.3. Element analysis

  The collected soils were air-dried at room temperature and sieved to a fraction
≤ 2 mm, pulverised in a planetary mill with zirconia vessel and balls (Pulverisette 6, Fritsch, Germany) and analysed for contents of PTEs (Cu, Pb, Zn) and lithogenic elements (Fe, Rb, Ti, Al) by table XRF spectrometer Epsilon 3X spectrometer (PANalytical, the Netherlands) equipped with an X-ray tube (Ag cathode, up to 50 kV). Powdered samples were poured in conventional polyamide measuring cells with Mylar foil bottoms. The analytical signal was calibrated using certified reference materials as described elsewhere [44]. Arsenic was determined using a handheld XRF spectrometer Niton XL3t 950 GOLDD + (Thermo Scientific) with a 50 kV X-ray tube with an Ag cathode. The median, minimum, and maximum concentrations of PTEs in soils from each type of bedrock are listed in Table 1.

2.4. Geochemical normalization

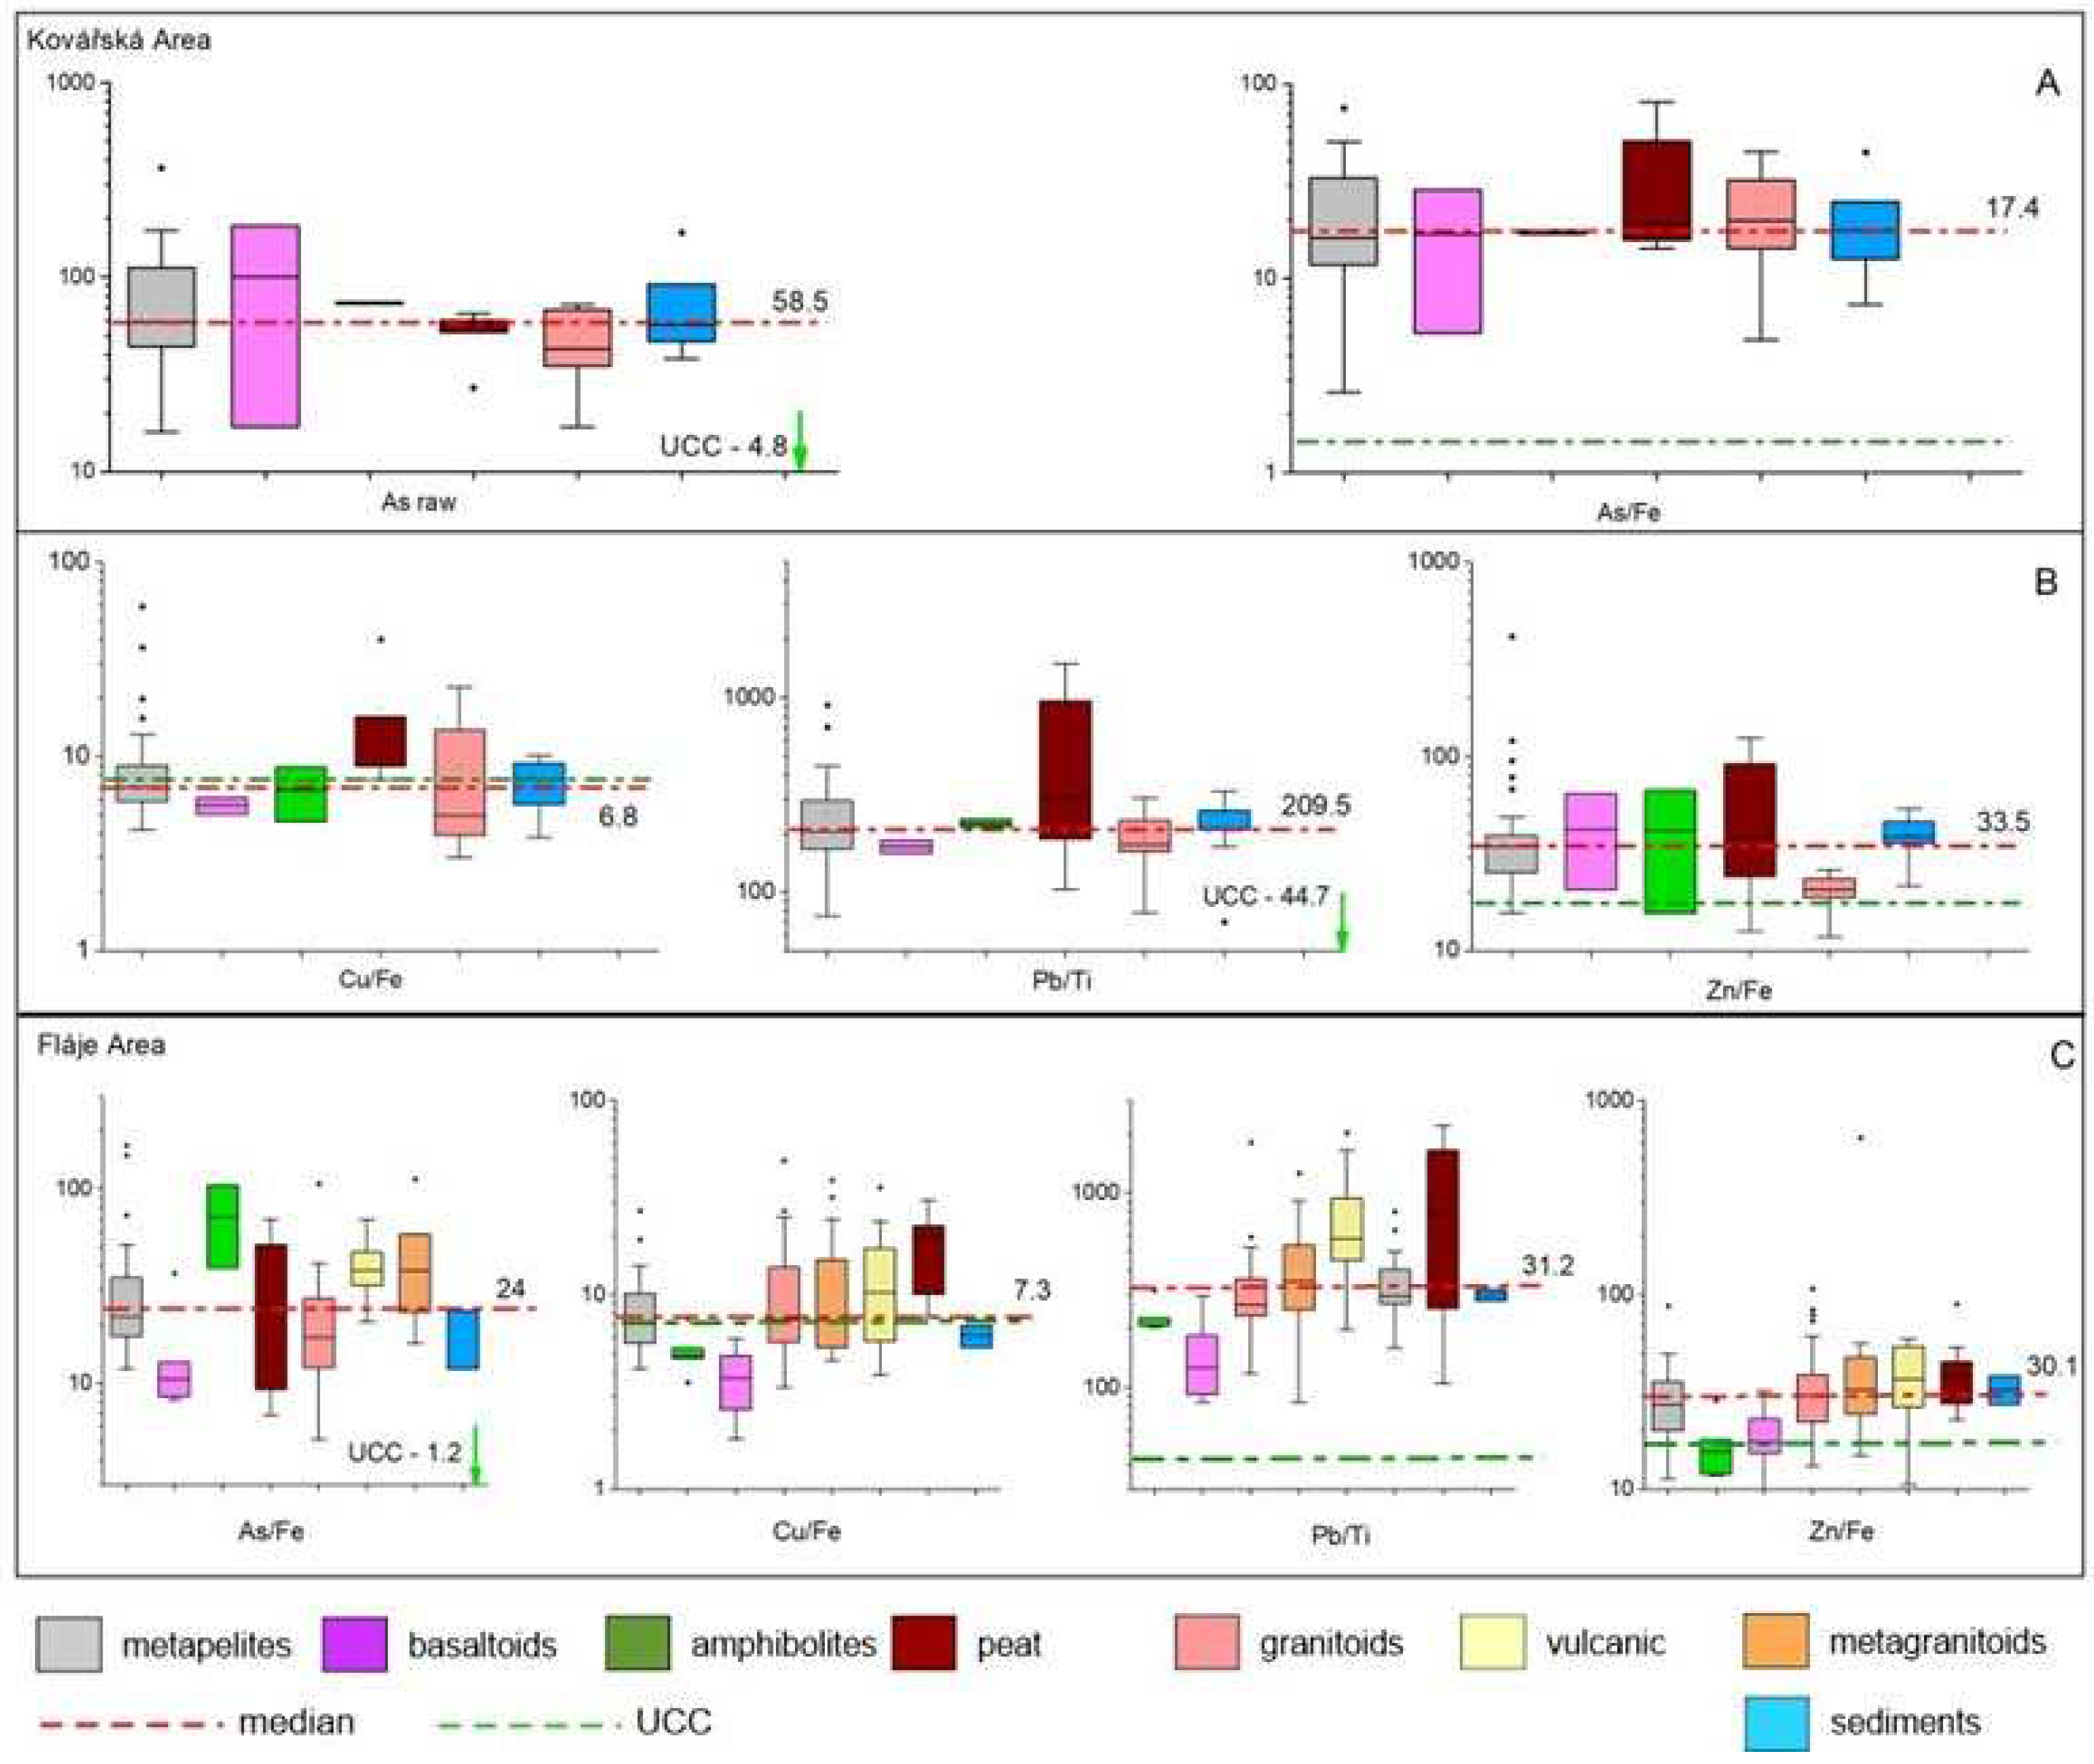
  Mathematical properties of compositional data substantiate use of element ratios rather than raw element concentrations in data processing [19,43,44]. The simplest and empirically justified way is to divide concentrations of a PTE (M) by concentration of a suitable lithogenic element (MREF), such as Al, Ti, Rb, Fe, Zr, Y and thus use element ratios M/MREF instead of M [44,45,46,47,48]. Geochemical normalisation corrects for the influence of the soil matrix [45], in particular a variable percentage of soil organic matter (it is vital for comparison of TOP and BOT, with more organic matter present in TOP) and quartz content (it is mostly controlled by the soil coarseness and this in turn by preceding particle segregation by slope processes and pedogenesis). Normalisation can transform geochemical datasets to be closer to normal (Gaussian) distribution [48] or at least to have a “sharper” main population of datasets, that considerably improves the identification of anomalous values [19,43]. Figure 4 (TOP) and Figure 5 (BOT) show, how Fe normalisation helps to mitigate the effect of soil textural variability on As concentrations, allowing all rock groups to be worked with in a single plot, or to approximate the medians of each group to each other, including peat. We followed a similar approach for all the PTEs examined, also choosing Fe as a normaliser for Cu and Zn, as justified by Matys Grygar and Popelka [48]. In the Ore Mountain bedrock, As, Cu, Fe, and Zn usually occur jointly in sulphides (arsenopyrite, chalcopyrite) and dark minerals rich in Fe, such as biotites; all those listed elements also share the same pathways in weathering, pedogenesis, and possible soil transport by joint bonding to pedogenic iron oxides and other soil microparticles. Conversely, for Pb, Ti, a conservative element moderately abundant in several resistant volcanic mineral phases, has been empirically most useful as a normalising element, because those two elements have similar geochemical behaviour [49].

2.5. Empirical cumulative distribution function

  ECDF have traditionally been used to evaluate mono- or polymodality in data series and define outliers, in particular in the ore prospection [29]. For similar purposes, ECDFs have later been used in environmental geochemistry studies [17,19,50]. In addition, ECDFs are useful in data classification for the geochemical maps (see Figure 6C) in a similar way to that used by Matys Grygar et al. [19].
  Fabian et al. [17] proposed to utilise ECDF for the comparison of TOP and BOT concentrations and thus distinguish geogenic anomalies, diffuse and point source pollution, and surface enrichment by plan-soil interactions (Figure 1). The method by Fabian et al. [17] has further been employed by Reimann and Fabian [51] and Flem et al. [52] and is also used in this paper. To estimate diffuse contamination after Fabian et al. [17], we searched for an optimal horizontal shift of the BOT ECDF to get the best visually evaluated overlap with the TOP ECDF by choosing a suitable a in equation
MTOP = a·MBOT + b
where a is called linear shift constant (LCS) and b corresponds to the diffuse contamination [17]. The parameters a and b were estimated graphically by horizontally shifting BOT in the diagram to visually optimally overlay TOP, this shift corresponds to the visually optimal LCS parameter a. Contrarily to Fabian et al. [17], who optimised b to get best match in the lower percentiles, we optimised it by matching the medians and values in the 2nd and 3rd quartiles (Q2 and Q3), as we did not prefer to rely on low outliers in the data series.
  The part of the TOP curve with a steeper gradient compared to the BOT curve was evaluated as a contribution to diffuse contamination (marked in Figure 6 and Figure 7 by arrows). The median for each PTE was calculated from the difference of the TOP and BOT diagrams using equation 1.

2.6. Software for data processing

  The data series were analysed using Origin 2018 software (OriginLab, Northhampton, MA). Boxplots and ECDFs were created using the same software. The concentrations of PTEs and their local emissions were graphically represented using maps with classified layers, created in ArcGIS 10.7.1 Desktop software (ESRI, Redlands, CA).

3. Results

3.1. PTEs concentration in soils

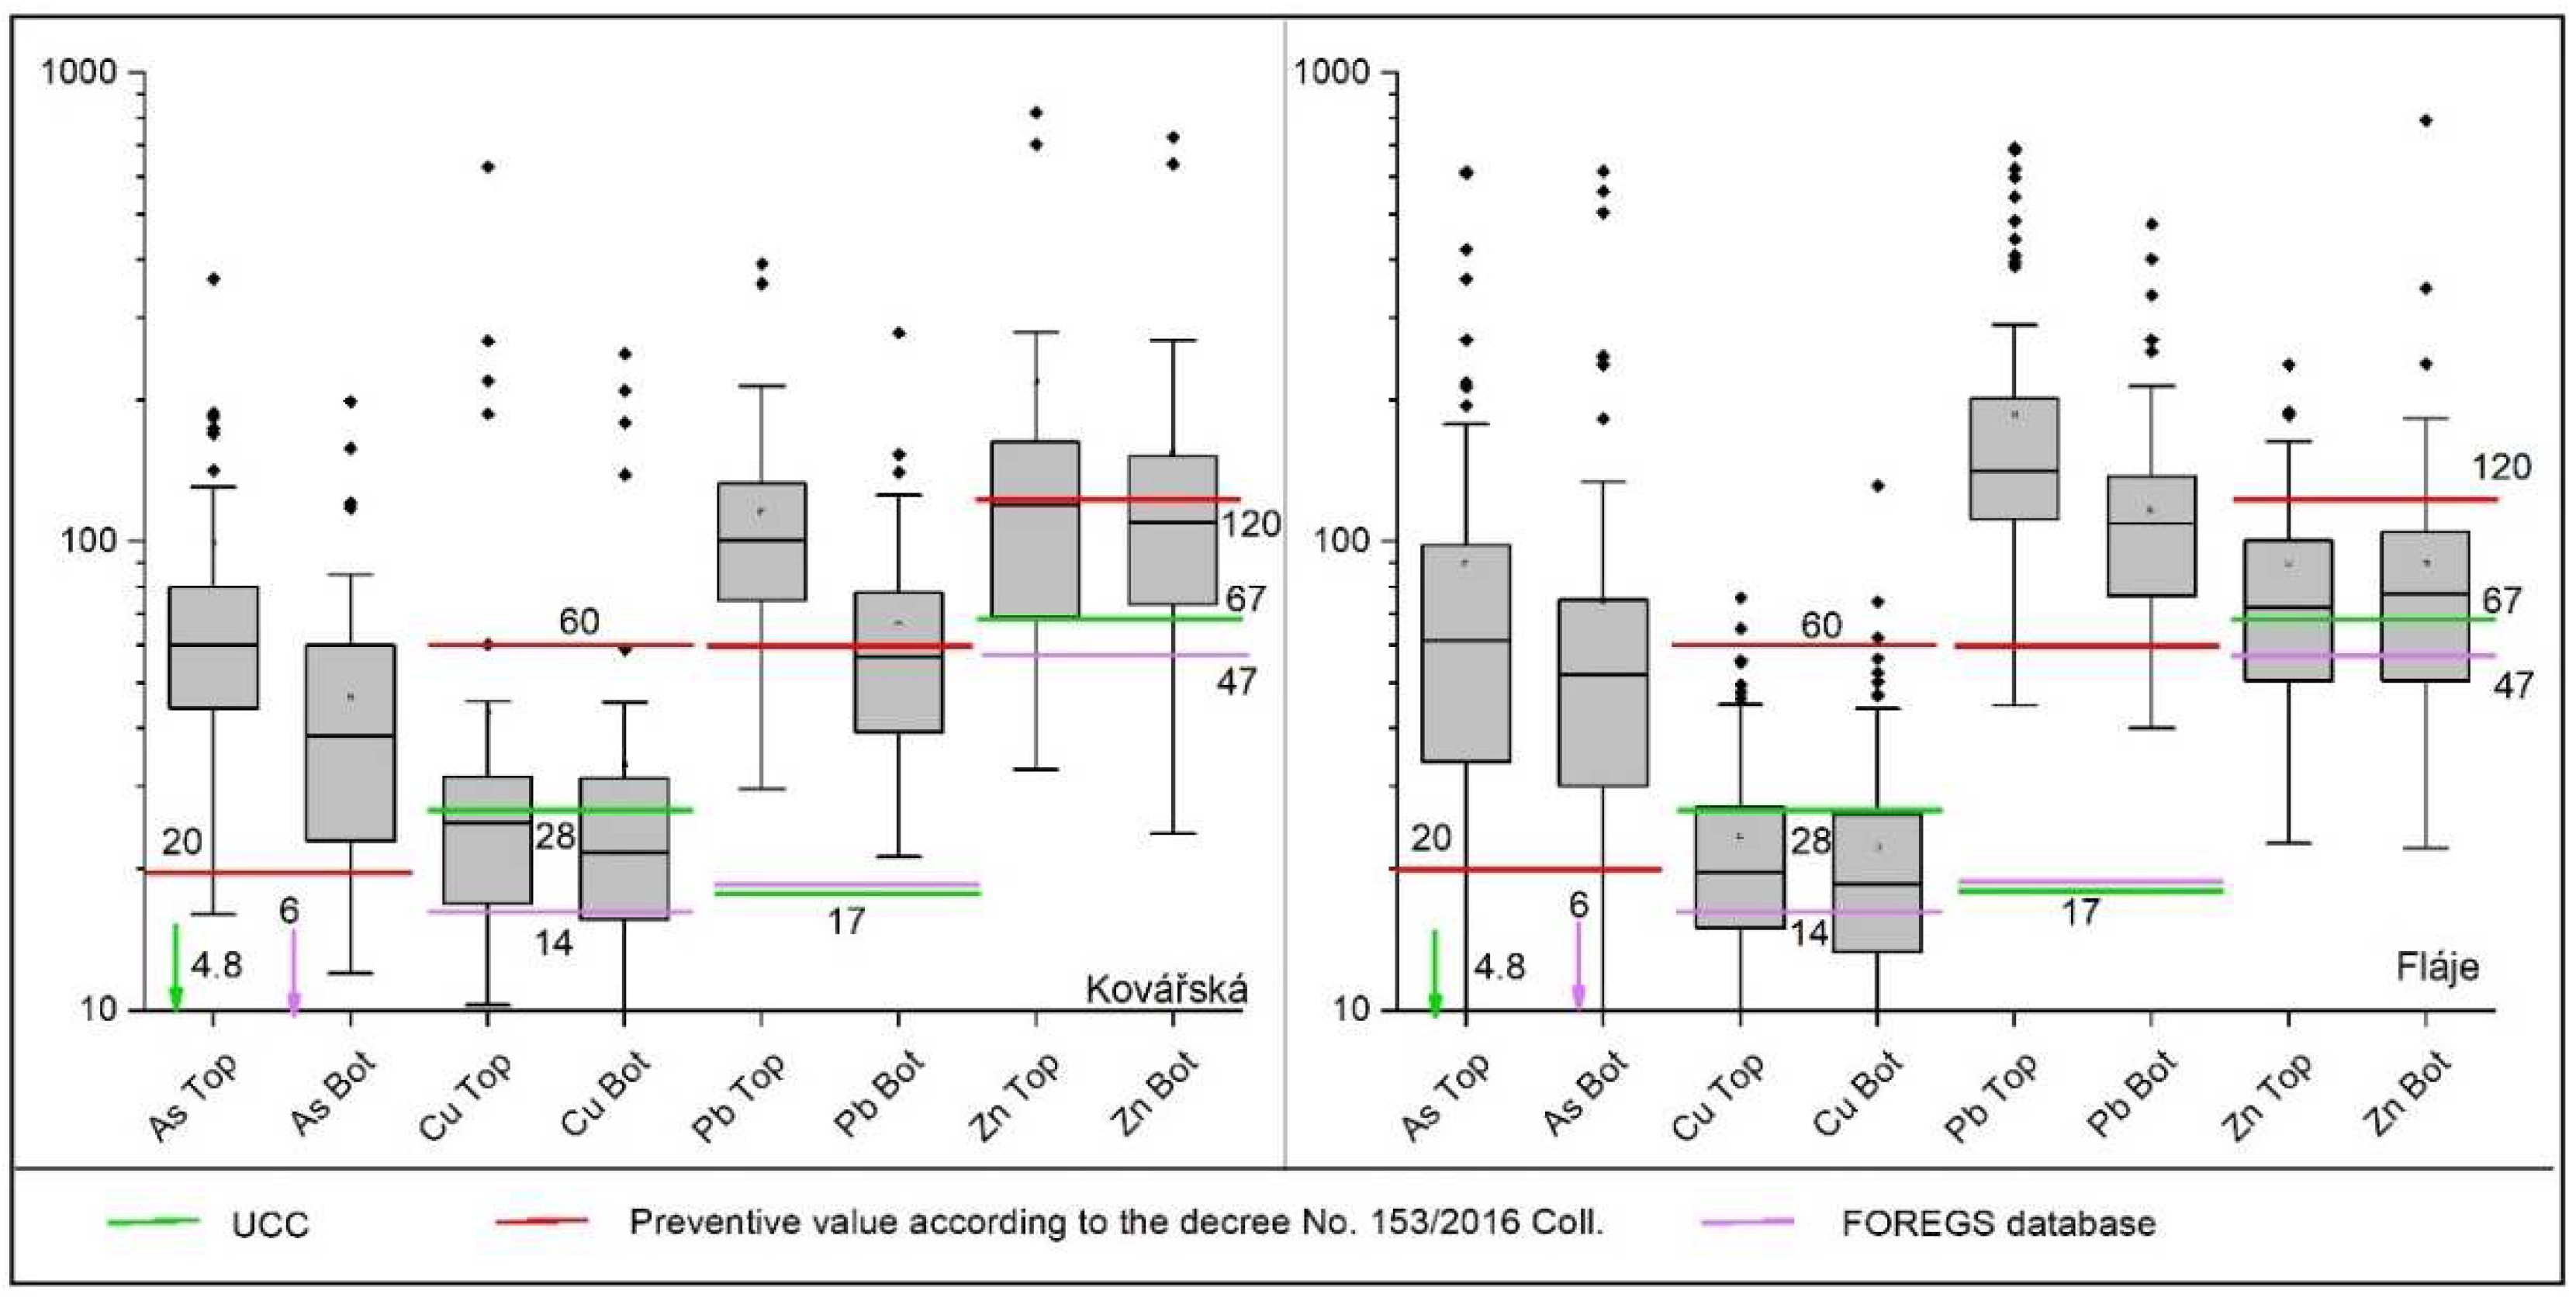
The concentrations of the selected elements in the studied soils (Table 1) varied significantly. Several criteria were used to understand the PTEs variability in soils. Firstly, we compared the total element concentrations in all 270 samples with the global (composition of the upper continental crust, UCC, [53]) and European background (FOREGS database, > 1500 randomly selected mineral soil samples from 26 European countries, [54]) and the national averages (Figure 3 and Table 1). Arsenic and Pb exceed these backgrounds and national averages considerably, Cu is close to UCC and FOREGS at both sites, and Zn is elevated at Kovářská Area (Figure 3).
In addition, As and Pb concentrations in both areas exceeds Czech legislative limits for agricultural soils according to Decree No. 153/2016 Coll. [55]. Soils from the Fláje Area have similar median As concentrations in TOP and BOT as the Kovářská Area (see Figure 3). The situation is similar for Cu, and the median values are also similar in the areas, although the highest values are considerably higher at Kovářská Area. Lead concentrations are then clearly higher in the Fláje Area, including the extremely high values in TOP and BOT. In contrast, Zn concentrations are higher in the Kovářská Area (see Table 1). Separation of samples into groups according to bedrock geology (Figure 4 and Figure 5) showed that the geogenic influence on soil PTEs is not equal at both study sites. A more pronounced impact of geology was found at the Fláje Area, where the concentrations of PTEs expressed as Cu/Fe, Pb/Ti and Zn/Fe in the TOP and BOT samples are lower in soils form from basalts and amphibolites and, on the contrary, higher in the peat (Figure 4 and Figure 5). High values are observed for As/Fe in the soils on amphibolites, and highly variable topsoil As/Fe and Cu/Fe were found on granitoids.
Table 1. Summary of medians for individual PTEs and rock groups in mg kg-1. At the bottom of the table, UCC and FOREGS values in mg kg-1 are shown for comparison.
amphibolites basaltoids metagranitoids metapelites peat fluvial
sediments
granitoids volcanic all rocks FOREGS
Fláje Area As TOP 418 63 104 72 46 x 34 54 62 7
As BOT 134 62 92 54 16 x 27 47 52 6
Cu TOP 27 19 20 23 36 x 17 13 20 13
Cu BOT 25 19 16 23 24 x 16 10 19 14
Pb TOP 157 168 173 165 218 x 110 155 141 23
PB BOT 113 126 117 112 109 x 84 119 109 17
Zn TOP 84 98 72 98 81 x 61 53 72 52
Zn BOT 83 97 65 90 83 x 66 47 77 47
UCC
Kovářská Area As TOP 74 101 43 59 58 57 x x 58 4.8
As BOT 47 89 19 40 36 28 x x 36
Cu TOP 28 28 12 26 29 25 x x 25 28
Cu BOT 30 23 11 23 25 16 x x 22
Pb TOP 114 205 94 94 135 100 x x 96 17
Pb BOT 64 155 51 52 47 47 x x 52
Zn TOP 174 170 43 130 73 137 x x 116 67
Zn BOT 207 152 49 105 67 93 x x 98
Figure 4. Concentrations of PTEs in TOP (10 cm) divided by bedrock and areas with medians and UCCs indicated. Example of raw data vs normalisation (A) and normalised PTEs of the Kovářská Area (B). C: Normalised PTEs of the Fláje Area.
Preprints 95476 g004
Figure 5. Concentrations of PTEs in BOT (40 cm) divided by bedrock and sites with medians and UCCs indicated. Example of raw data vs normalisation (A) and normalised PTEs of the Kovářská Area (B). C: Normalised PTEs of the Fláje Area.
Preprints 95476 g005
At the Kovářská Area, there is no significant group of rocks with exceptionally high concentrations of normalised PTEs compared to other groups, except for peat. Overall, TOP is enriched compared to BOT for As/Fe and Pb/Ti in both study areas. Contrarily, the median Cu/Fe and Zn/Fe concentrations in TOP and BOT are quite similar and close to the UCC at both sites. Figure 4 and Figure 5 show, how Fe normalisation of As concentrations helped to mitigate the effect of the bedrock variability on soil composition, allowing all rock groups to be worked with in a single plot, or to approximate the medians of each group to each other, including peat. This data treatment was effective and was thus used for all studied elements.

3.2. Geochemical maps

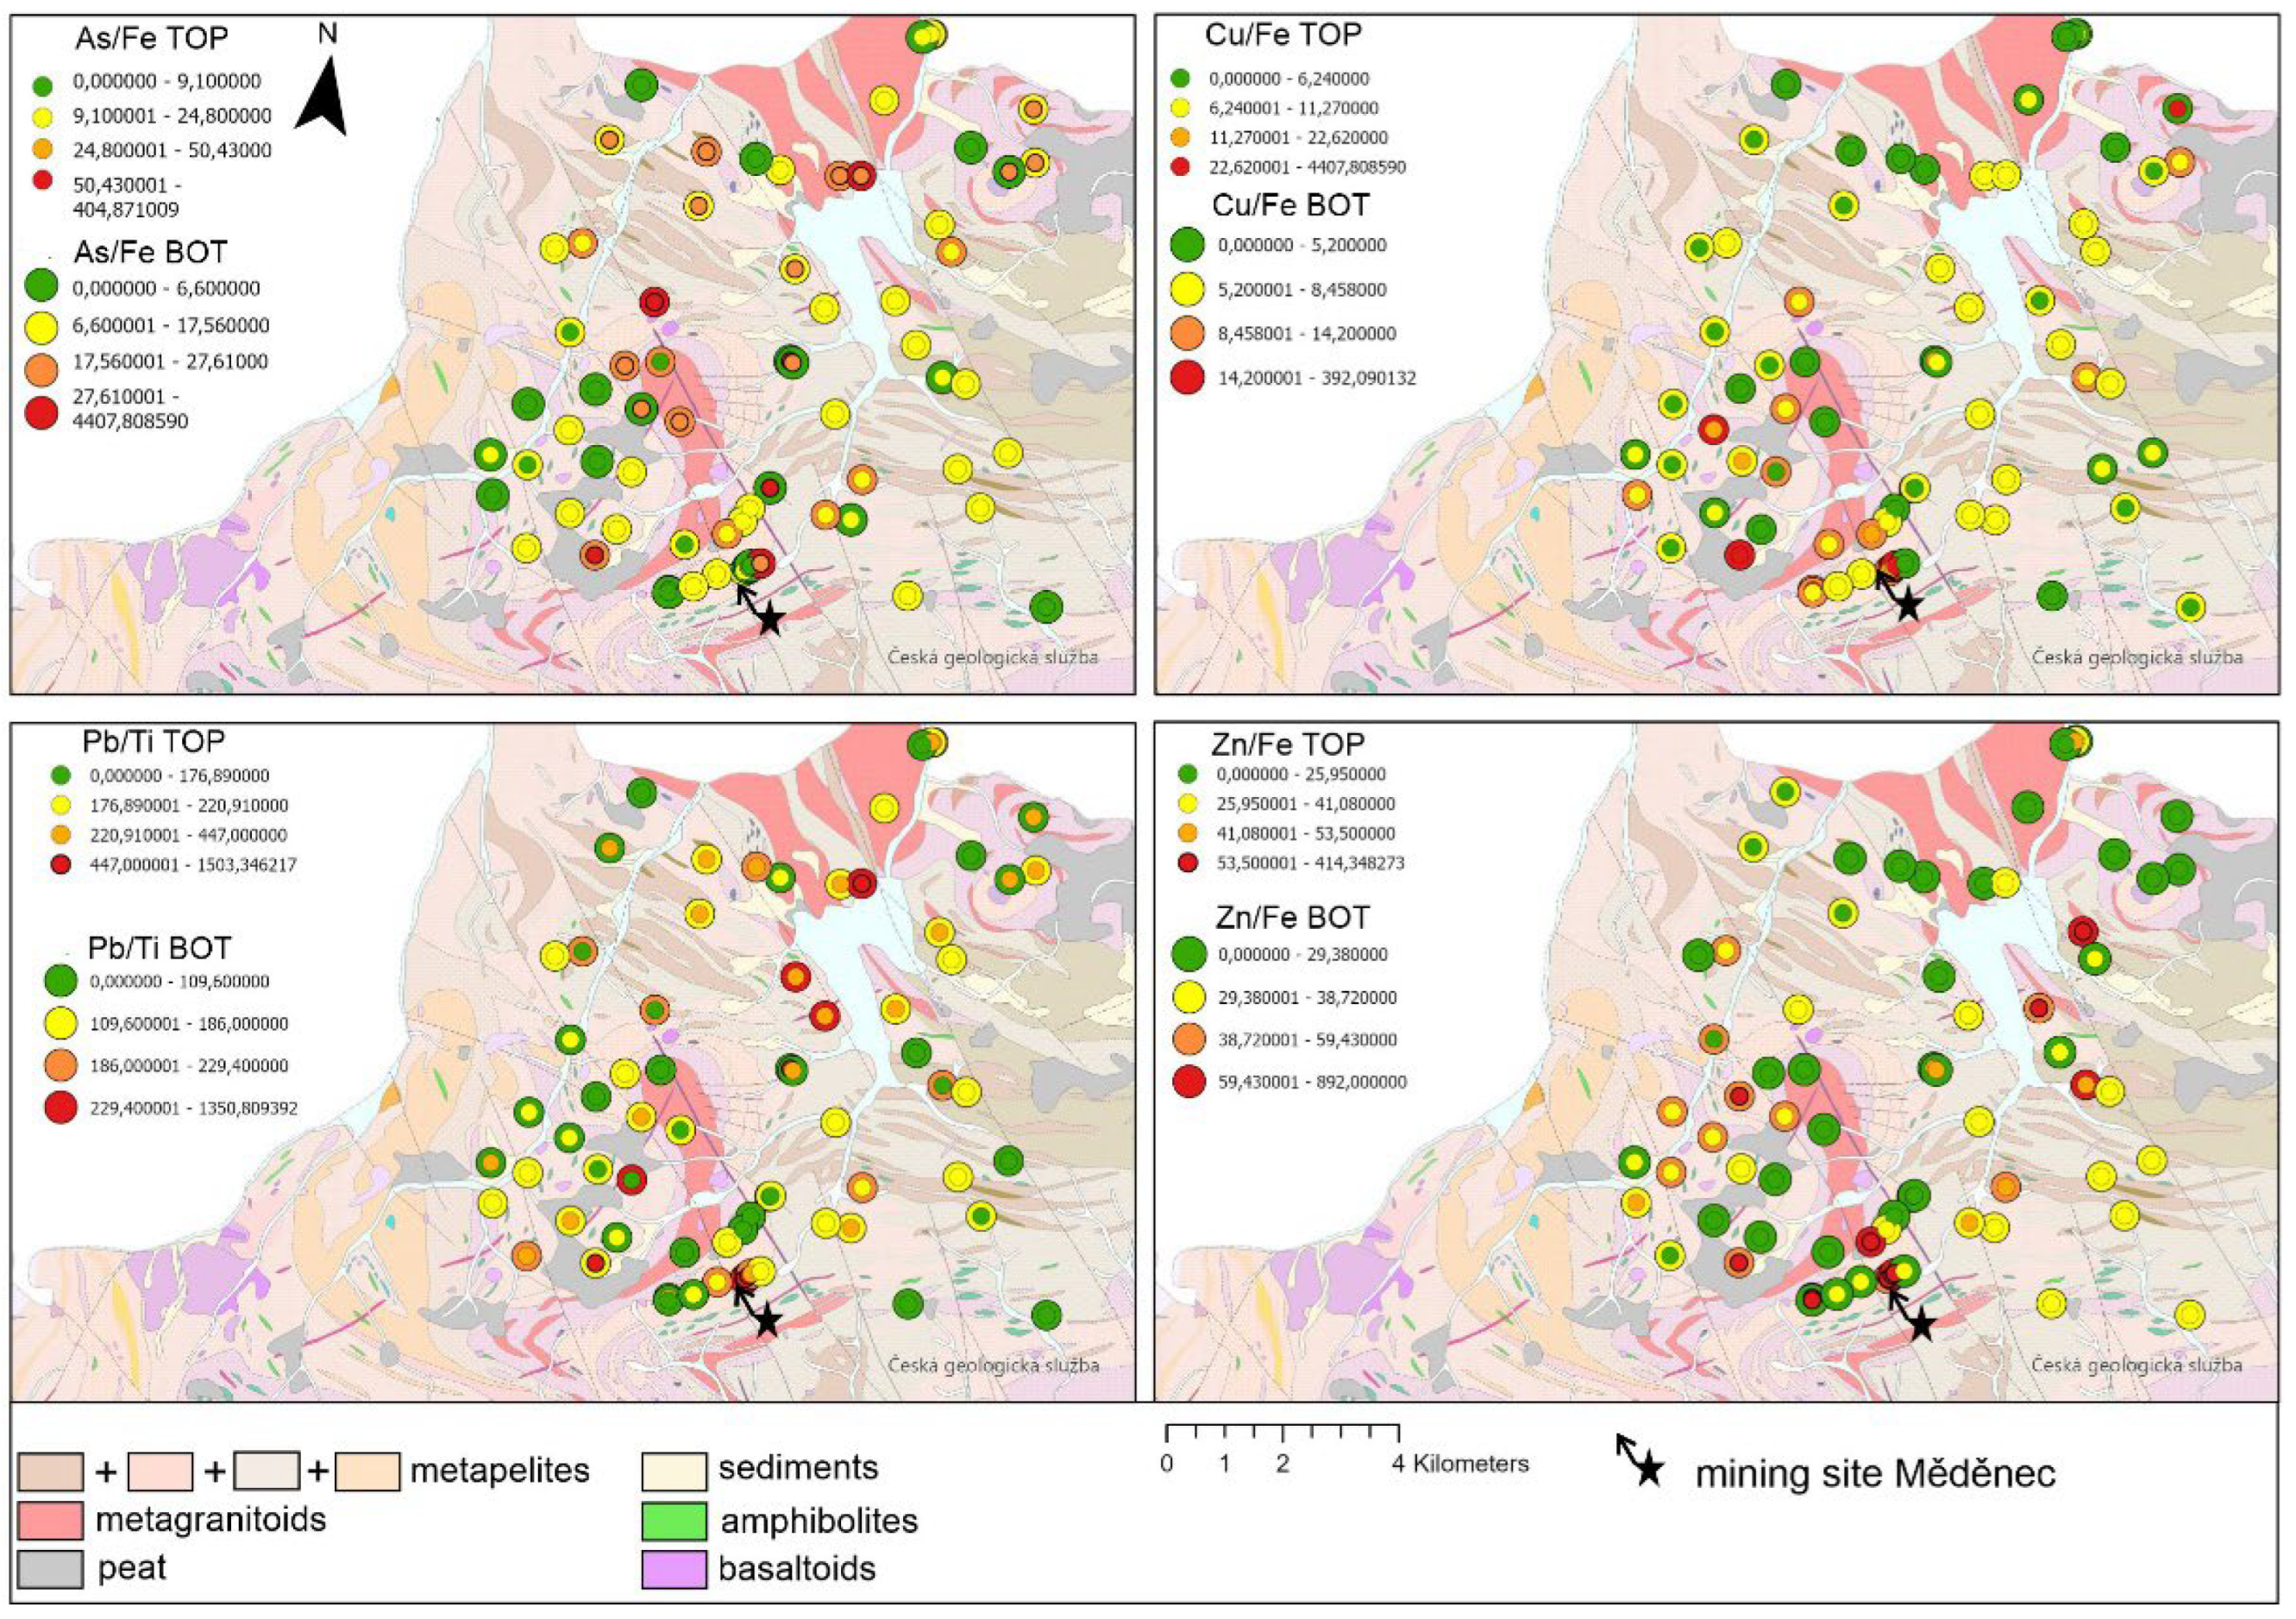
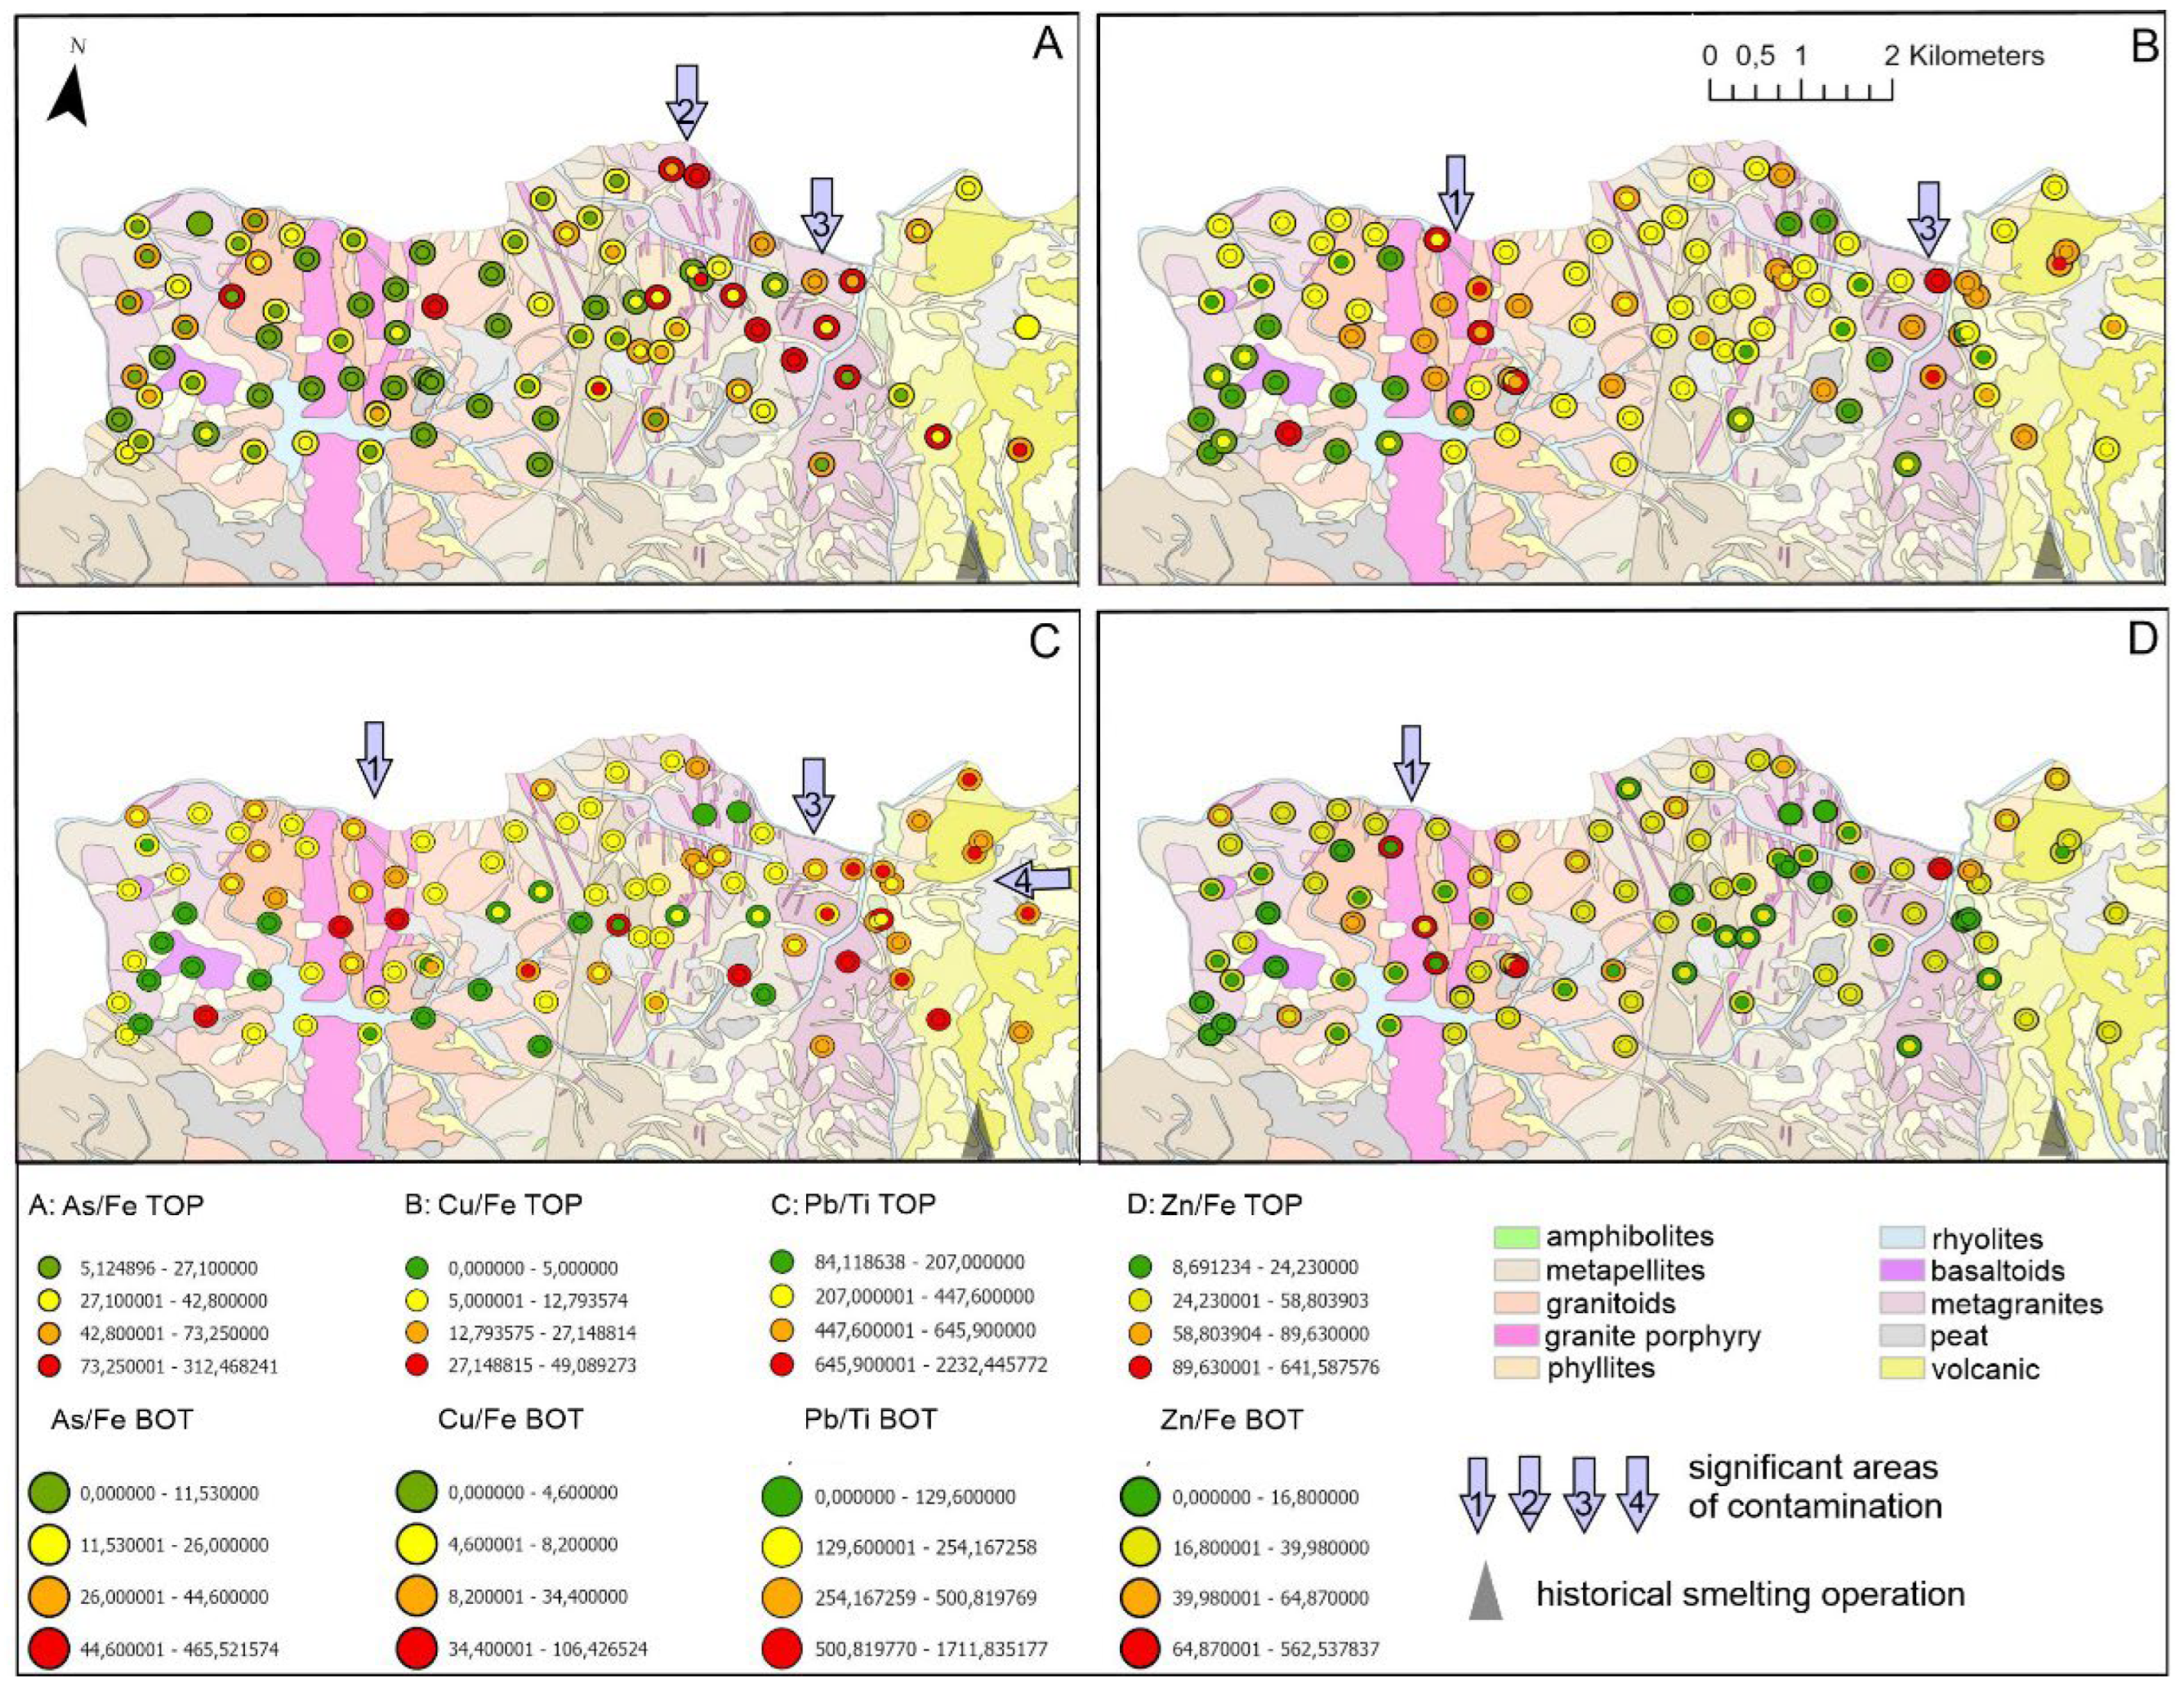
  To examine the spatial distribution of PTEs, we constructed geochemical map with TOP and BOT composition using classified layer. Four individual concentration classes were defined by ECDF (Figure 6C) for the geochemical maps (Figure 8 and Figure 9), where green and yellow colours indicate background or moderate contamination, orange is defined as moderate contamination, and red indicates anomalous values and severe contamination.
  On the Kovářská Area, the high values of PTE are most abundant near the Mědník Hill (Figure 8). This is particularly evident for Cu/Fe and Zn/Fe, their concentration ratios decreasing with distance from this mining site. However, another mechanism controlled As/Fe and Pb/Ti, as their high TOP values are scattered over the entire area, with no apparent decrease with distance from the mining site, but rather forming a belt to the north of the Mědník Hill.
Figure 6. Comparison of raw (A and B) and Fe-normalised As concentrations (C and D) in soils using ECDF plots, divided into TOP and BOT. Part 6C shows the classification of data by natural breaks to data populations. Parts of probable diffuse and severe point contamination are marked by arrows.
Preprints 95476 g006
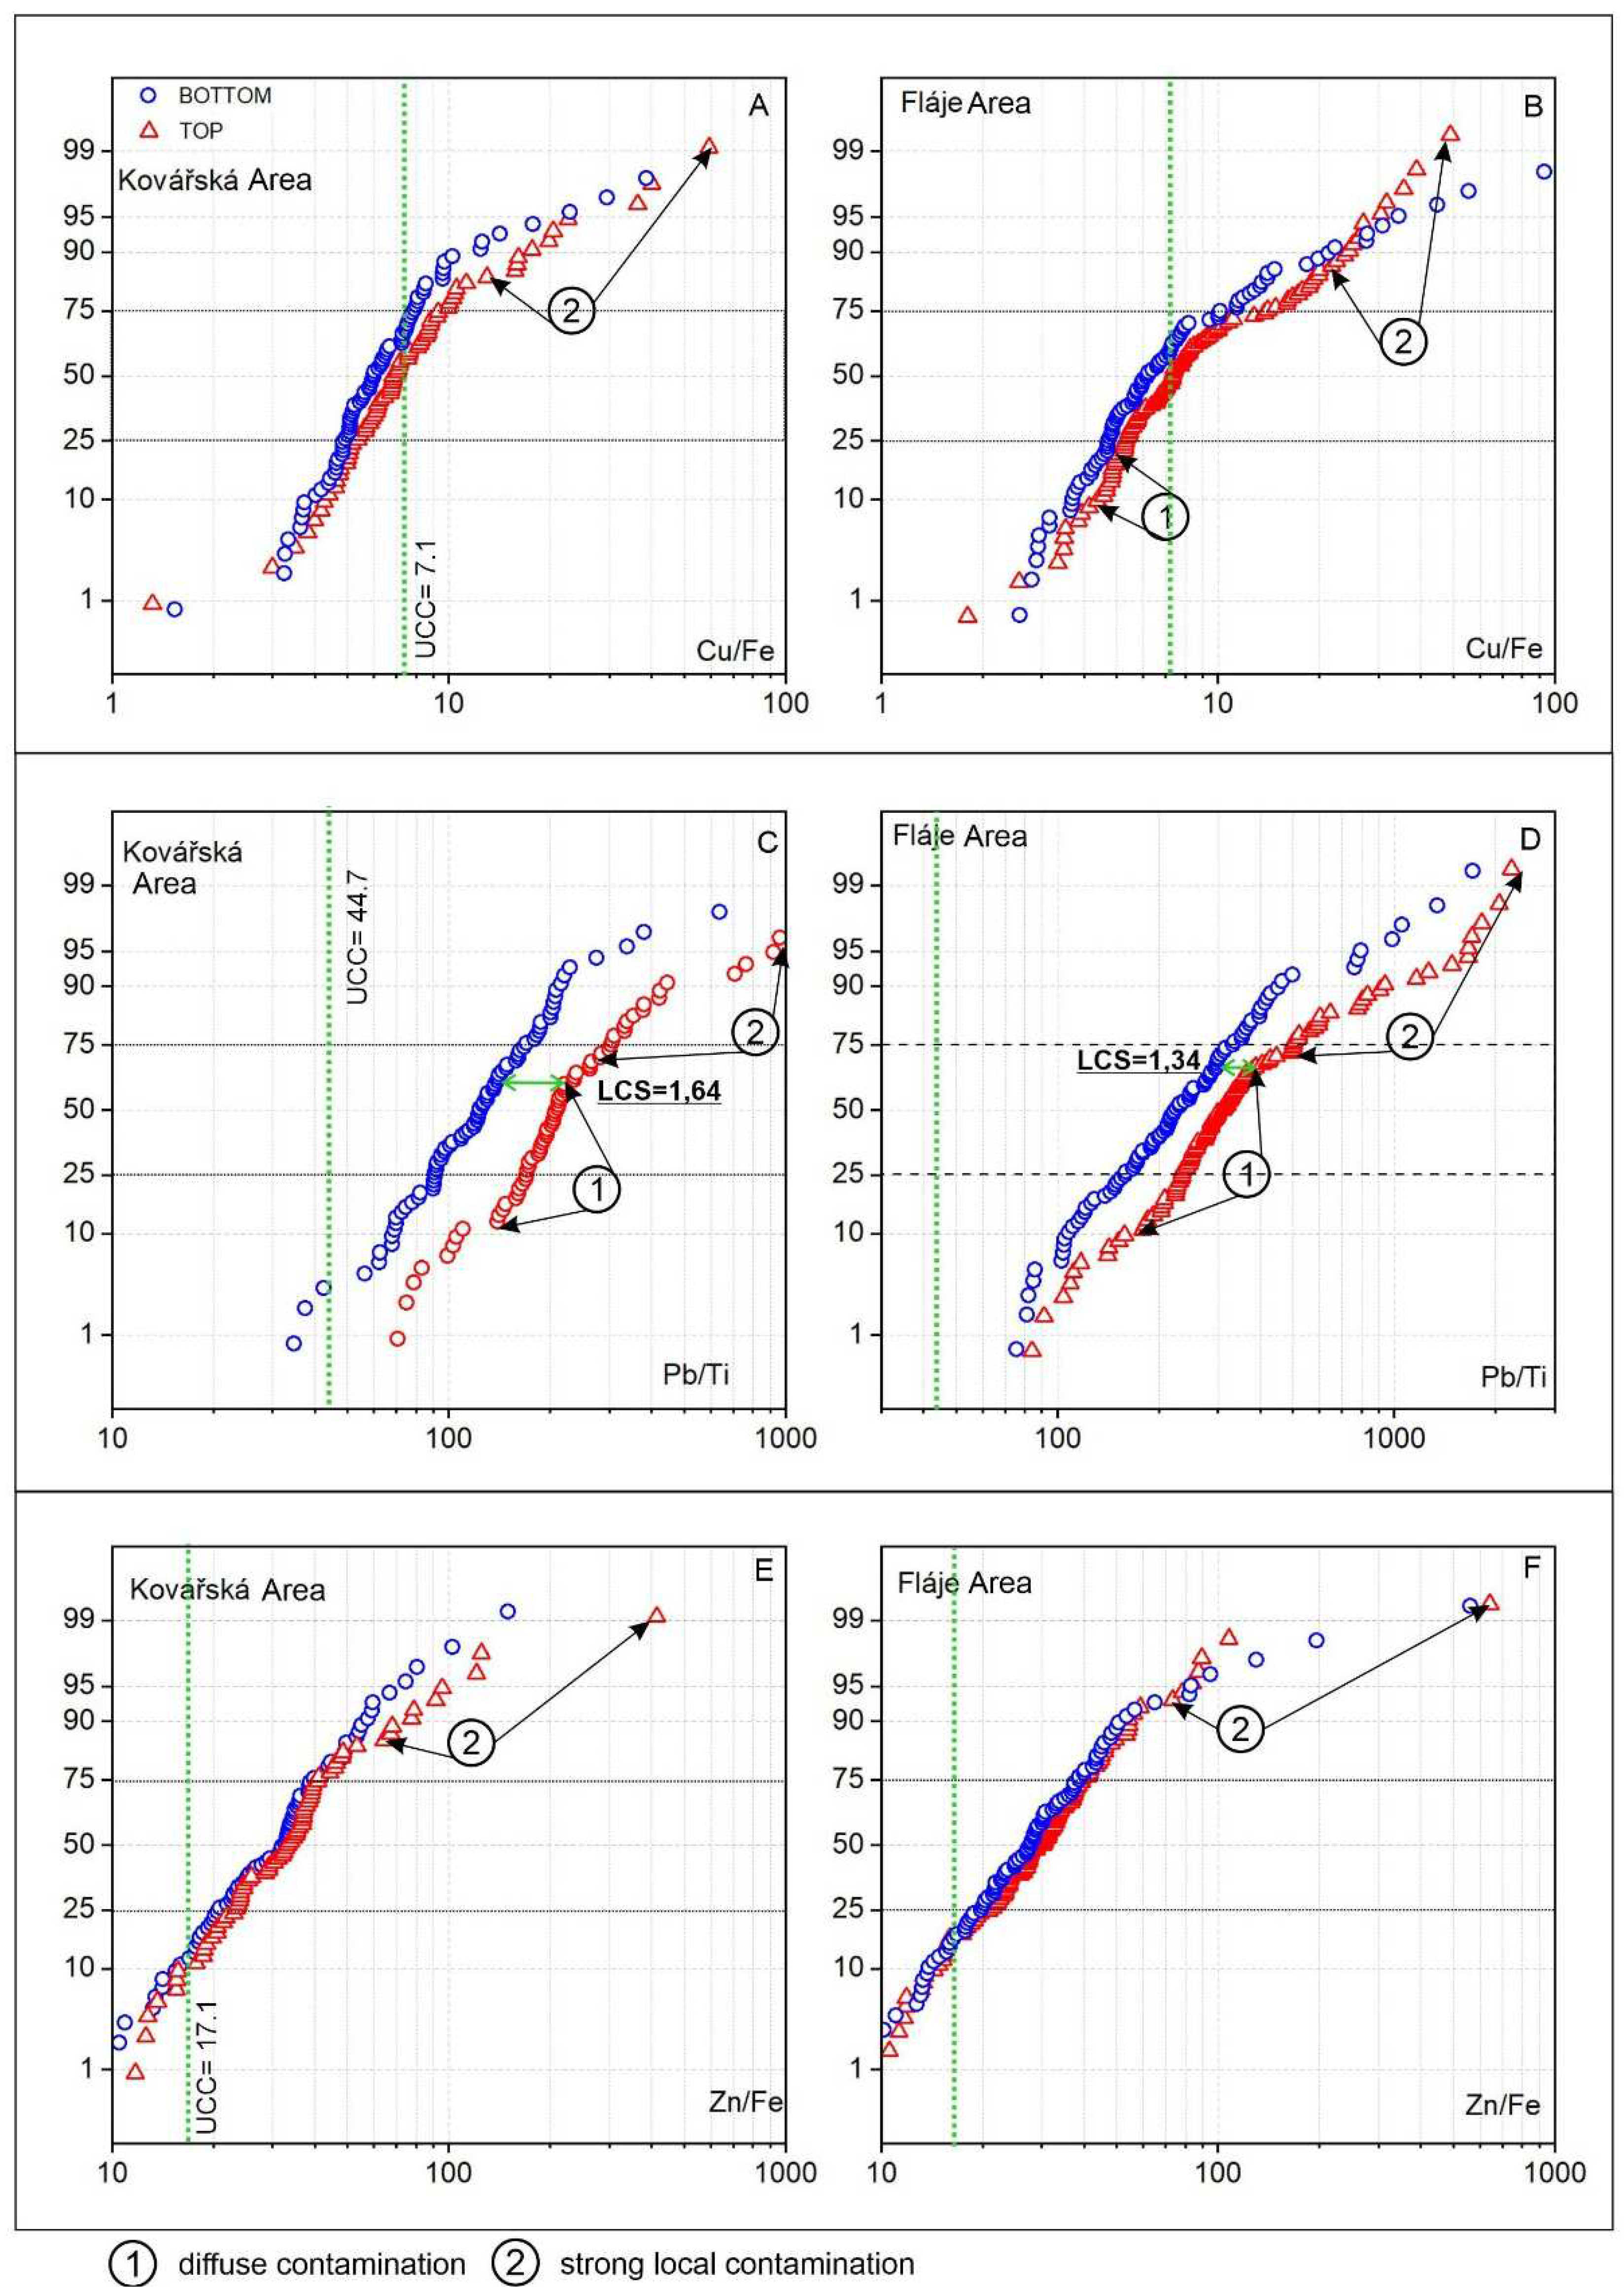
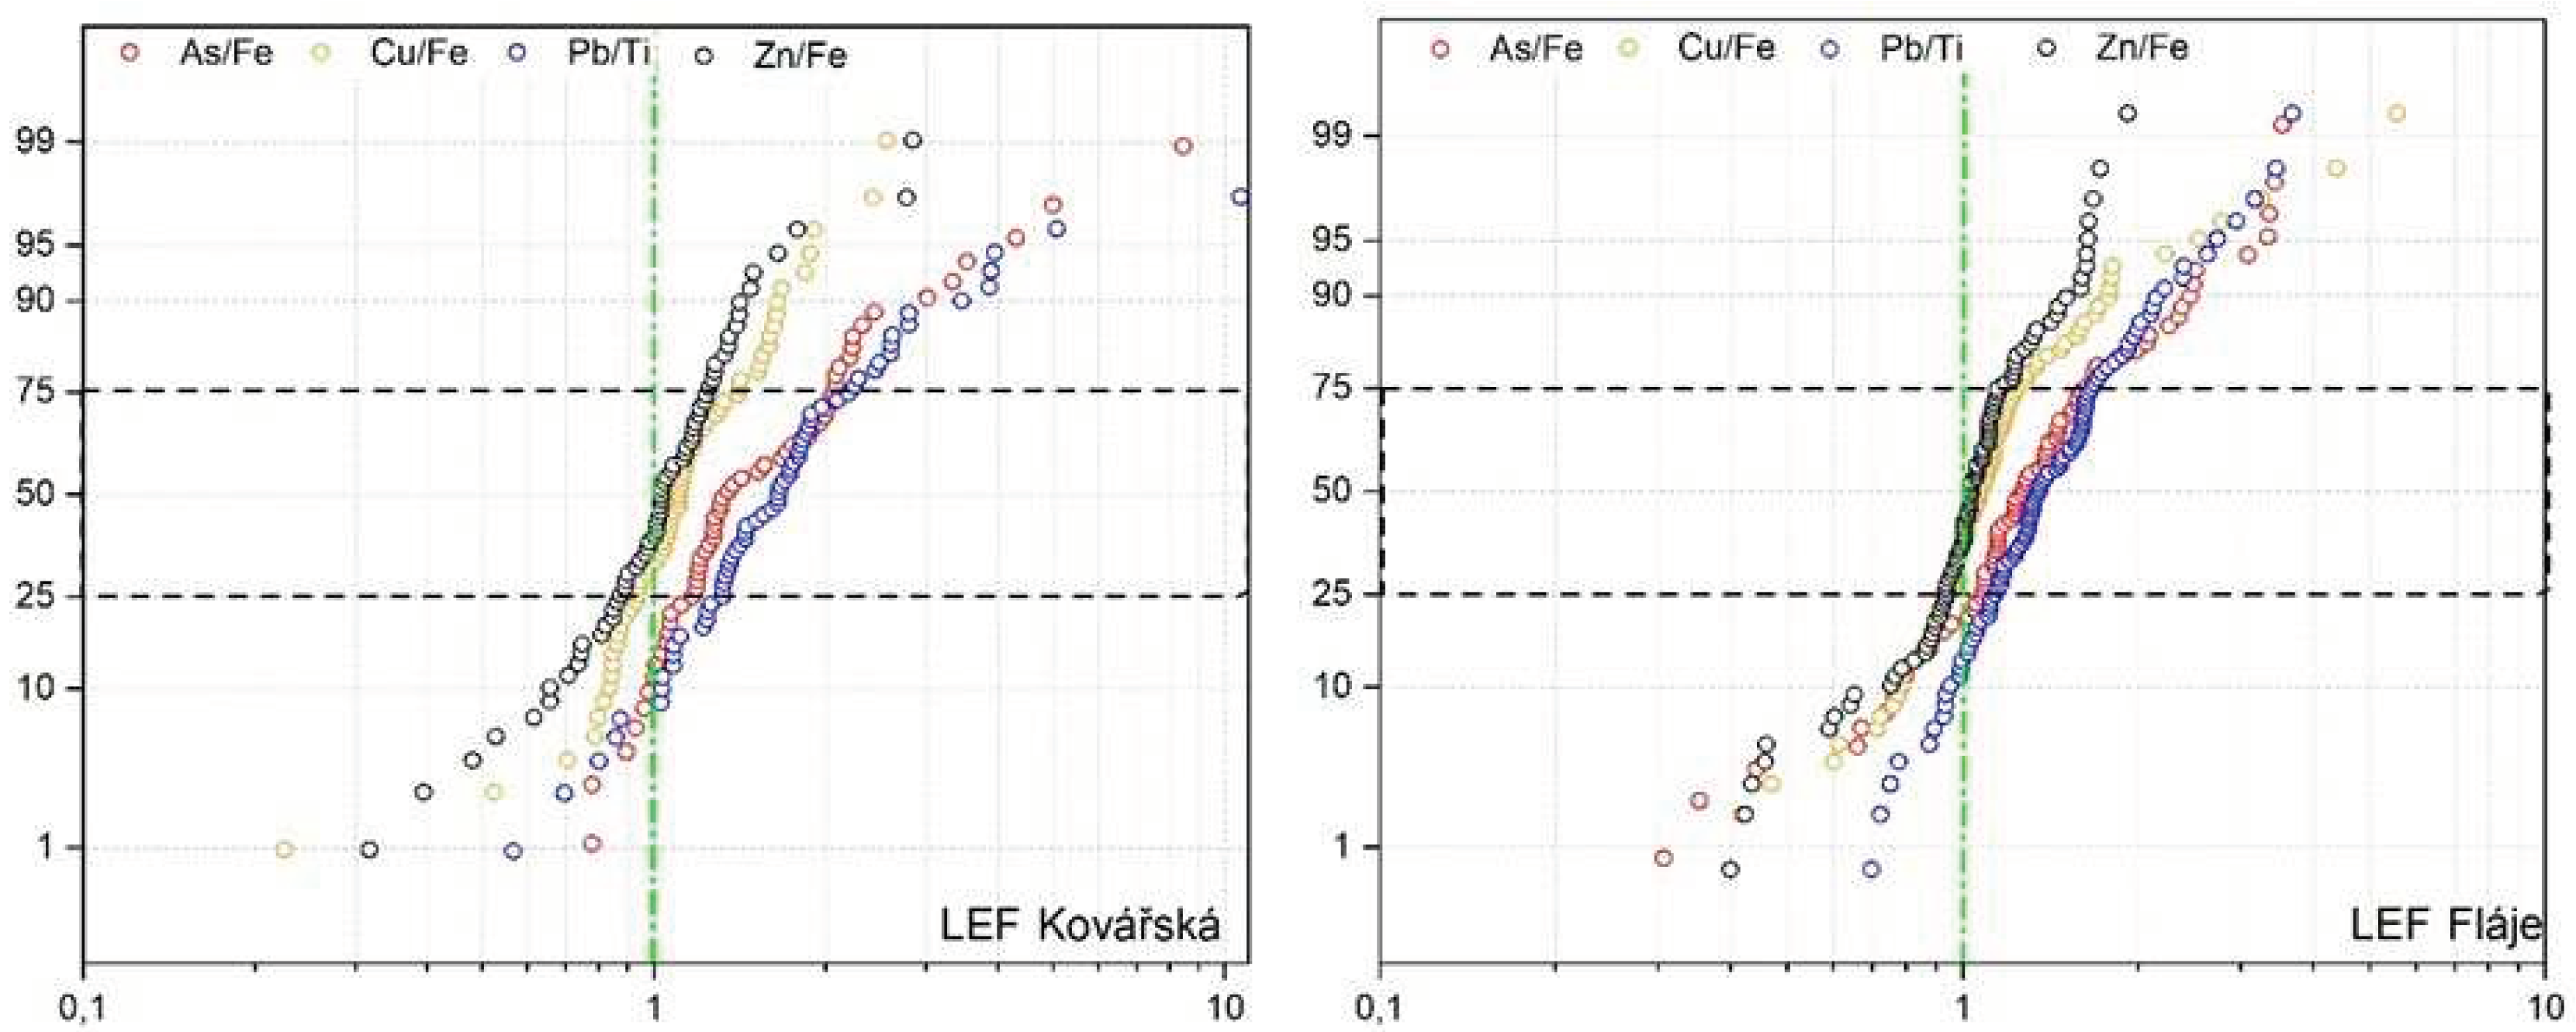
Figure 7. Fe-normalised concentrations of PTEs in soils using ECDF plots, divided into TOP and BOT. Probable diffuse and severe point contamination are marked by arrows.
Preprints 95476 g007
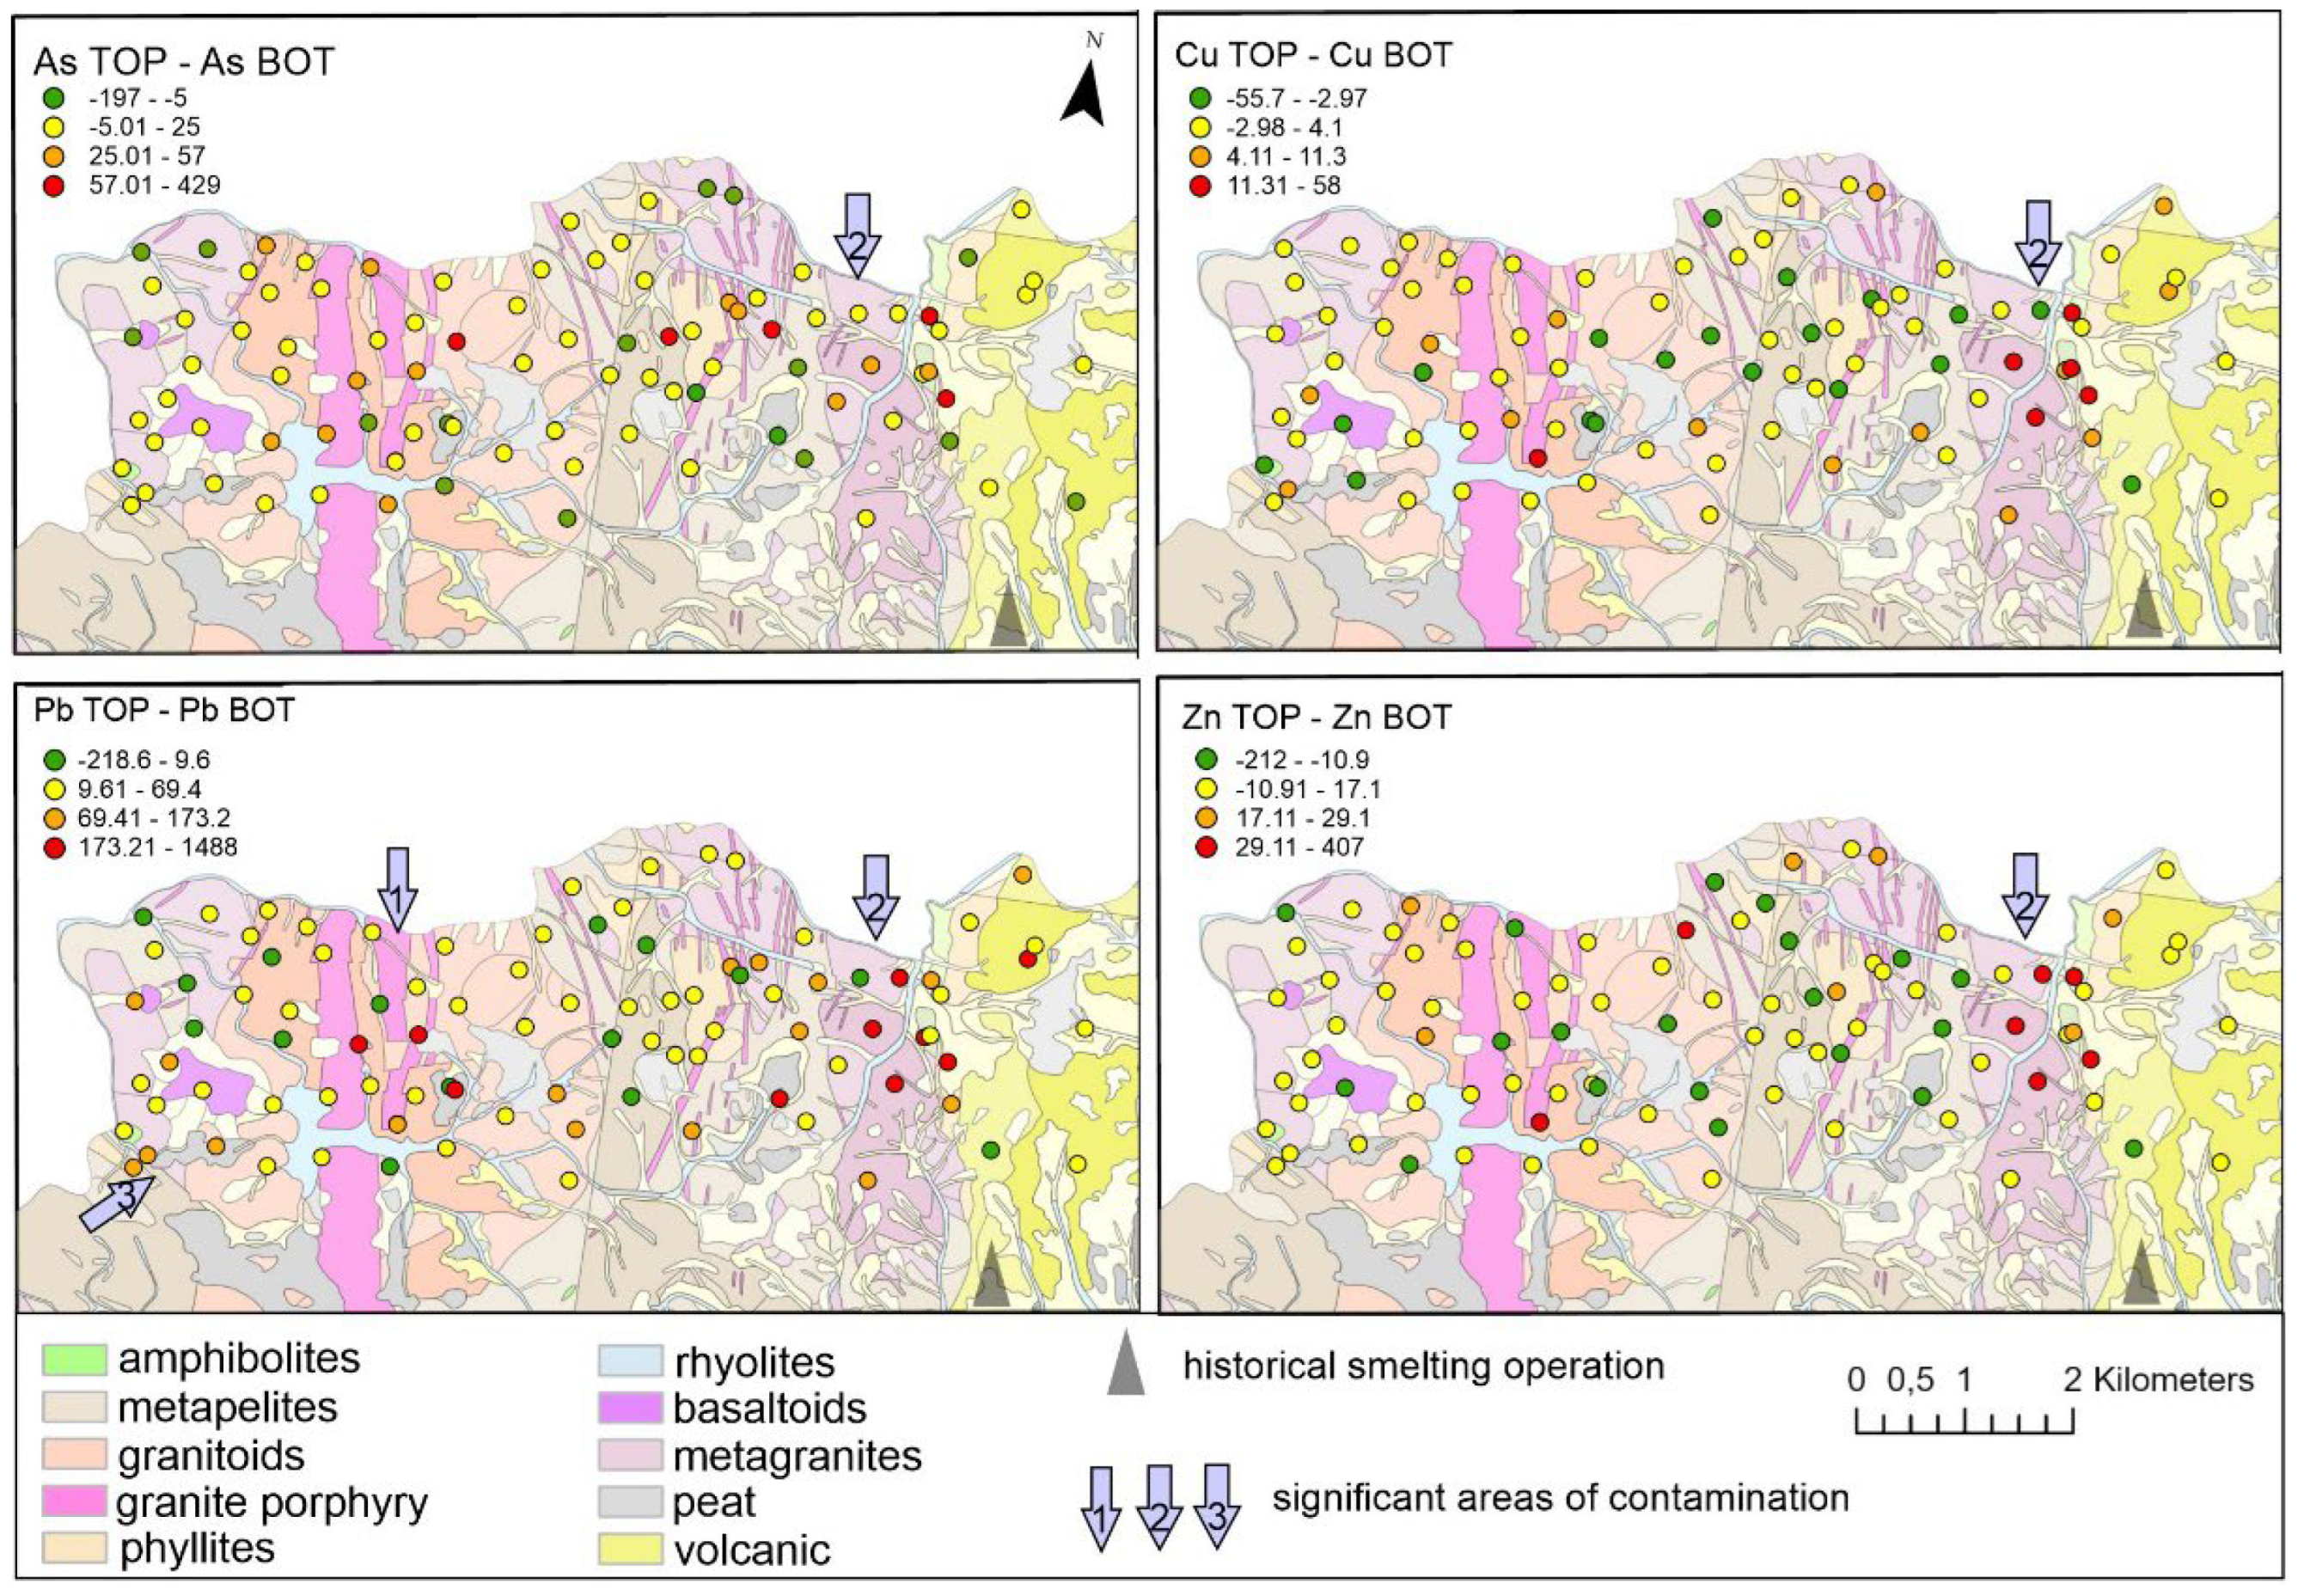
  At the Fláje Area (Figure 9), several sites were found to be distinctive – the first (arrow 1 in Figure 9) is around the locally prominent granitic porphyry outcrop at the Fláje Reservoir where several points with elevated Pb/Ti, Cu/Fe and Zn/Fe in the TOP and BOT, indicating indeed the influence of the underlying rocks, possibly with local ore veins. The second area (arrow 2 in Figure 9) is primarily significant for As/Fe and is close to local historic glassworks in Moldava. Several other soils classified as severely contaminated (high As/Fe, Cu/Fe, and in particular Pb/Ti) are found on the eastern side of the area (arrows 3 and 4 in Figure 9). These points cannot be attributed to bedrock geology alone, as only topsoils are contaminated. However, these soils are close to local mining sites and a smelting furnace near Hrob mining and smelting site (see Figure 2).
Figure 8. Geochemical map with TOP and BOT distribution in concentration ratio – the Kovářská Area.
Preprints 95476 g008
Figure 9. Geochemical map with TOP and BOT distribution in concentration ratios – the Fláje Area.
Preprints 95476 g009

3.3. Comparison of PTE concentrations in TOP and BOT using ECDF

  ECDFs of TOP and BOT (Figure 6 and Figure 7) show the TOP enrichment for As/Fe and especially Pb/Ti at both sites, and in contrast, none or weak TOP enrichment for Cu/Fe and Zn/Fe, except for individual point-contaminated samples near spoil heaps (Figure 8, points near the Mědník Hill). ECDFs make it possible to examine the effect of geochemical normalisation of PTEs concentrations, as it is demonstrated in the example of raw As (Figure 6A, Figure 6B) and As/Fe (Figure 6C, Figure 6D). Geochemical normalisation turns more heterogeneous/polymodal ECDF of the raw As data series to clearer and smoother ECDF of the As/Fe element ratio. This is more evident in the geologically more complex Fláje Area (Figure 6B – before normalisation) than in the Kovářská Area (Figure 6A), and the effect of normalisation is clearer in Figure 6D. ECDFs show, how the influence of the soil matrix and bedrock impact are corrected and the dataset are made more readable by geochemical normalisation, which is supported in Figure 4A and Figure 4B, where this effect is also visible.
  ECDF offers an alternative to examine the interrelation between TOP and BOT in maps with classified layer focused on their spatial distribution (Figure 8 and Figure 9) and boxplots producing net overall TOP contamination (Figure 2). The ECDF alternative proposed by Fabian et al. [17] is specified in Section 2.5. When evaluating the total As/Fe concentration ratio it is evident that the linear shift of TOP by choice of a (eq. 1) is slightly larger at the Kovářská Area (Figure 6C), so there are probably more controlling factors in the area. The As/Fe concentration ratios in Q2 and Q3 at the Kovářská Area range from 6.5·10-4 to
17·10-4 for BOT and from 13·10-4 to 28·10-4 for TOP. There are also several high outliers in the As/Fe data series (roughly above the 75th percentile), probably because of severe local contamination from mining in Měděnec. Those high outliers form a bulge at high values separated from Q3 by a break in the ECDF curve (Figure 6C). Thus, about 25% of the samples (entire Q4) in the area have been locally anthropogenically contaminated. At the Fláje Area, the values for As/Fe are 10·10-4 to 31·10-4 concentration ratios for BOT and 16·10-4 to 39·10-4 concentration ratios for TOP. There are only a few high anomalies at Fláje Area, i.e. here the overall elevated soil PTE concentrations result mainly from the combination of geogenic causes and diffuse contamination.
  TOPs are little enriched relative to BOT for Cu/Fe and Zn/Fe (Figure 7A and Figure 7B), in the case of Zn TOP and BOT the ECDFs almost overlap even without adjustments according to eq. (1). However, there are a few outliers at both sites. At the Kovářská Area, this is evident for both Cu/Fe and Zn/Fe at about the 80th percentile, where is the bulge and this can correspond to the mining sites around the top of Mědník Hill, as shown in Figure 8. At the Fláje Area the high Zn/Fe ratio around the 95th percentile is probably related to the geogenic source, granitic porphyry, as it is obvious from spatial association of the high TOP and BOT values (Figure 9, arrow 1). Overall, there is no significant Cu/Fe and Zn/Fe emission enrichment in TOP.
  In contrast, Pb appears to be the main emission (surficial) soil contaminant in both areas (Figure 8). The median Pb/Ti concentration ratios in the BOT layer are significantly higher at the Fláje Area (224·10-4) than at the Kovářská Area (130·10-4), which indicates naturally higher Pb concentrations already in the soil parent rocks. From about the 75th percentile onwards, a significant bulge deviates from the subsoil curve. This is characteristic of a severe local contamination source or the combined influence of mineralisation and local anthropogenic contamination.
  The Kovářská area shows higher Pb/Ti TOP enrichment and a more significant linear shift (Figure 7C). However, the concentration ratios in the preferentially studied Q2 and Q3 are lower here: TOP (170-300)·10-4; BOT (90-170)·10-4 compared to the TOP (230-500)·10-4; BOT (160-320)·10-4 at the Fláje Area (Figure 7D). The TOP curve again shows a bulge of high outliers starting at approximately the 75th percentile. The enrichment of topsoil in As/Fe and Pb/Ti and the steeper gradient between the TOP and BOT diagrams further suggest that both areas were affected to some extent by diffuse contamination (marked in Figure 6 and Figure 7).

3.4. Quantification of diffuse contamination by ECDF of entire data series

  For application of eq. (1), we focused mainly on Q2 and Q3, in which we looked for signs of diffuse contamination and then calculated its contribution to the total contamination for As/Fe at the Kovářská Area and Pb/Ti in both areas. The results are presented in Table 2. Because the LCS is a statistical average for the entire BOT and TOP data series, it does reflect neither every single point, nor even represent true pairs of TOP and BOT for each sampling site. LCS thus only provide bulk and coarse estimates assuming perfectly homogeneous blanket of diffuse contamination.
For the Kovářská Area, diffuse contamination is not surprising with respect to abundance of local contamination sources (Figure 2) and it reaches 16.5·10-4 for Pb/Ti and 1.1·10-4 As/Fe (concentration ratios) for Q2 and Q3. However, for the Fláje Area, where we did not expect contamination because of no local mines nor furnaces, the calculations produced results very similar to those in the Kovářská Area (see Table 2). We estimate the linear concentration shift as 1.48 for As/Fe and the diffuse contamination contribution as 1.42 concentration ratio for Q2 and Q3. For Pb/Ti, the diffusion contribution is as high as 16.2·10-4 concentration ratio and the LCS is 1.34. This suggests that there has been a significant emission source outside the Fláje Area (Figure 9), i.e. more remote, and perhaps common for both study areas.

3.5. Quantification of diffuse contamination using TOP and BOT pairs

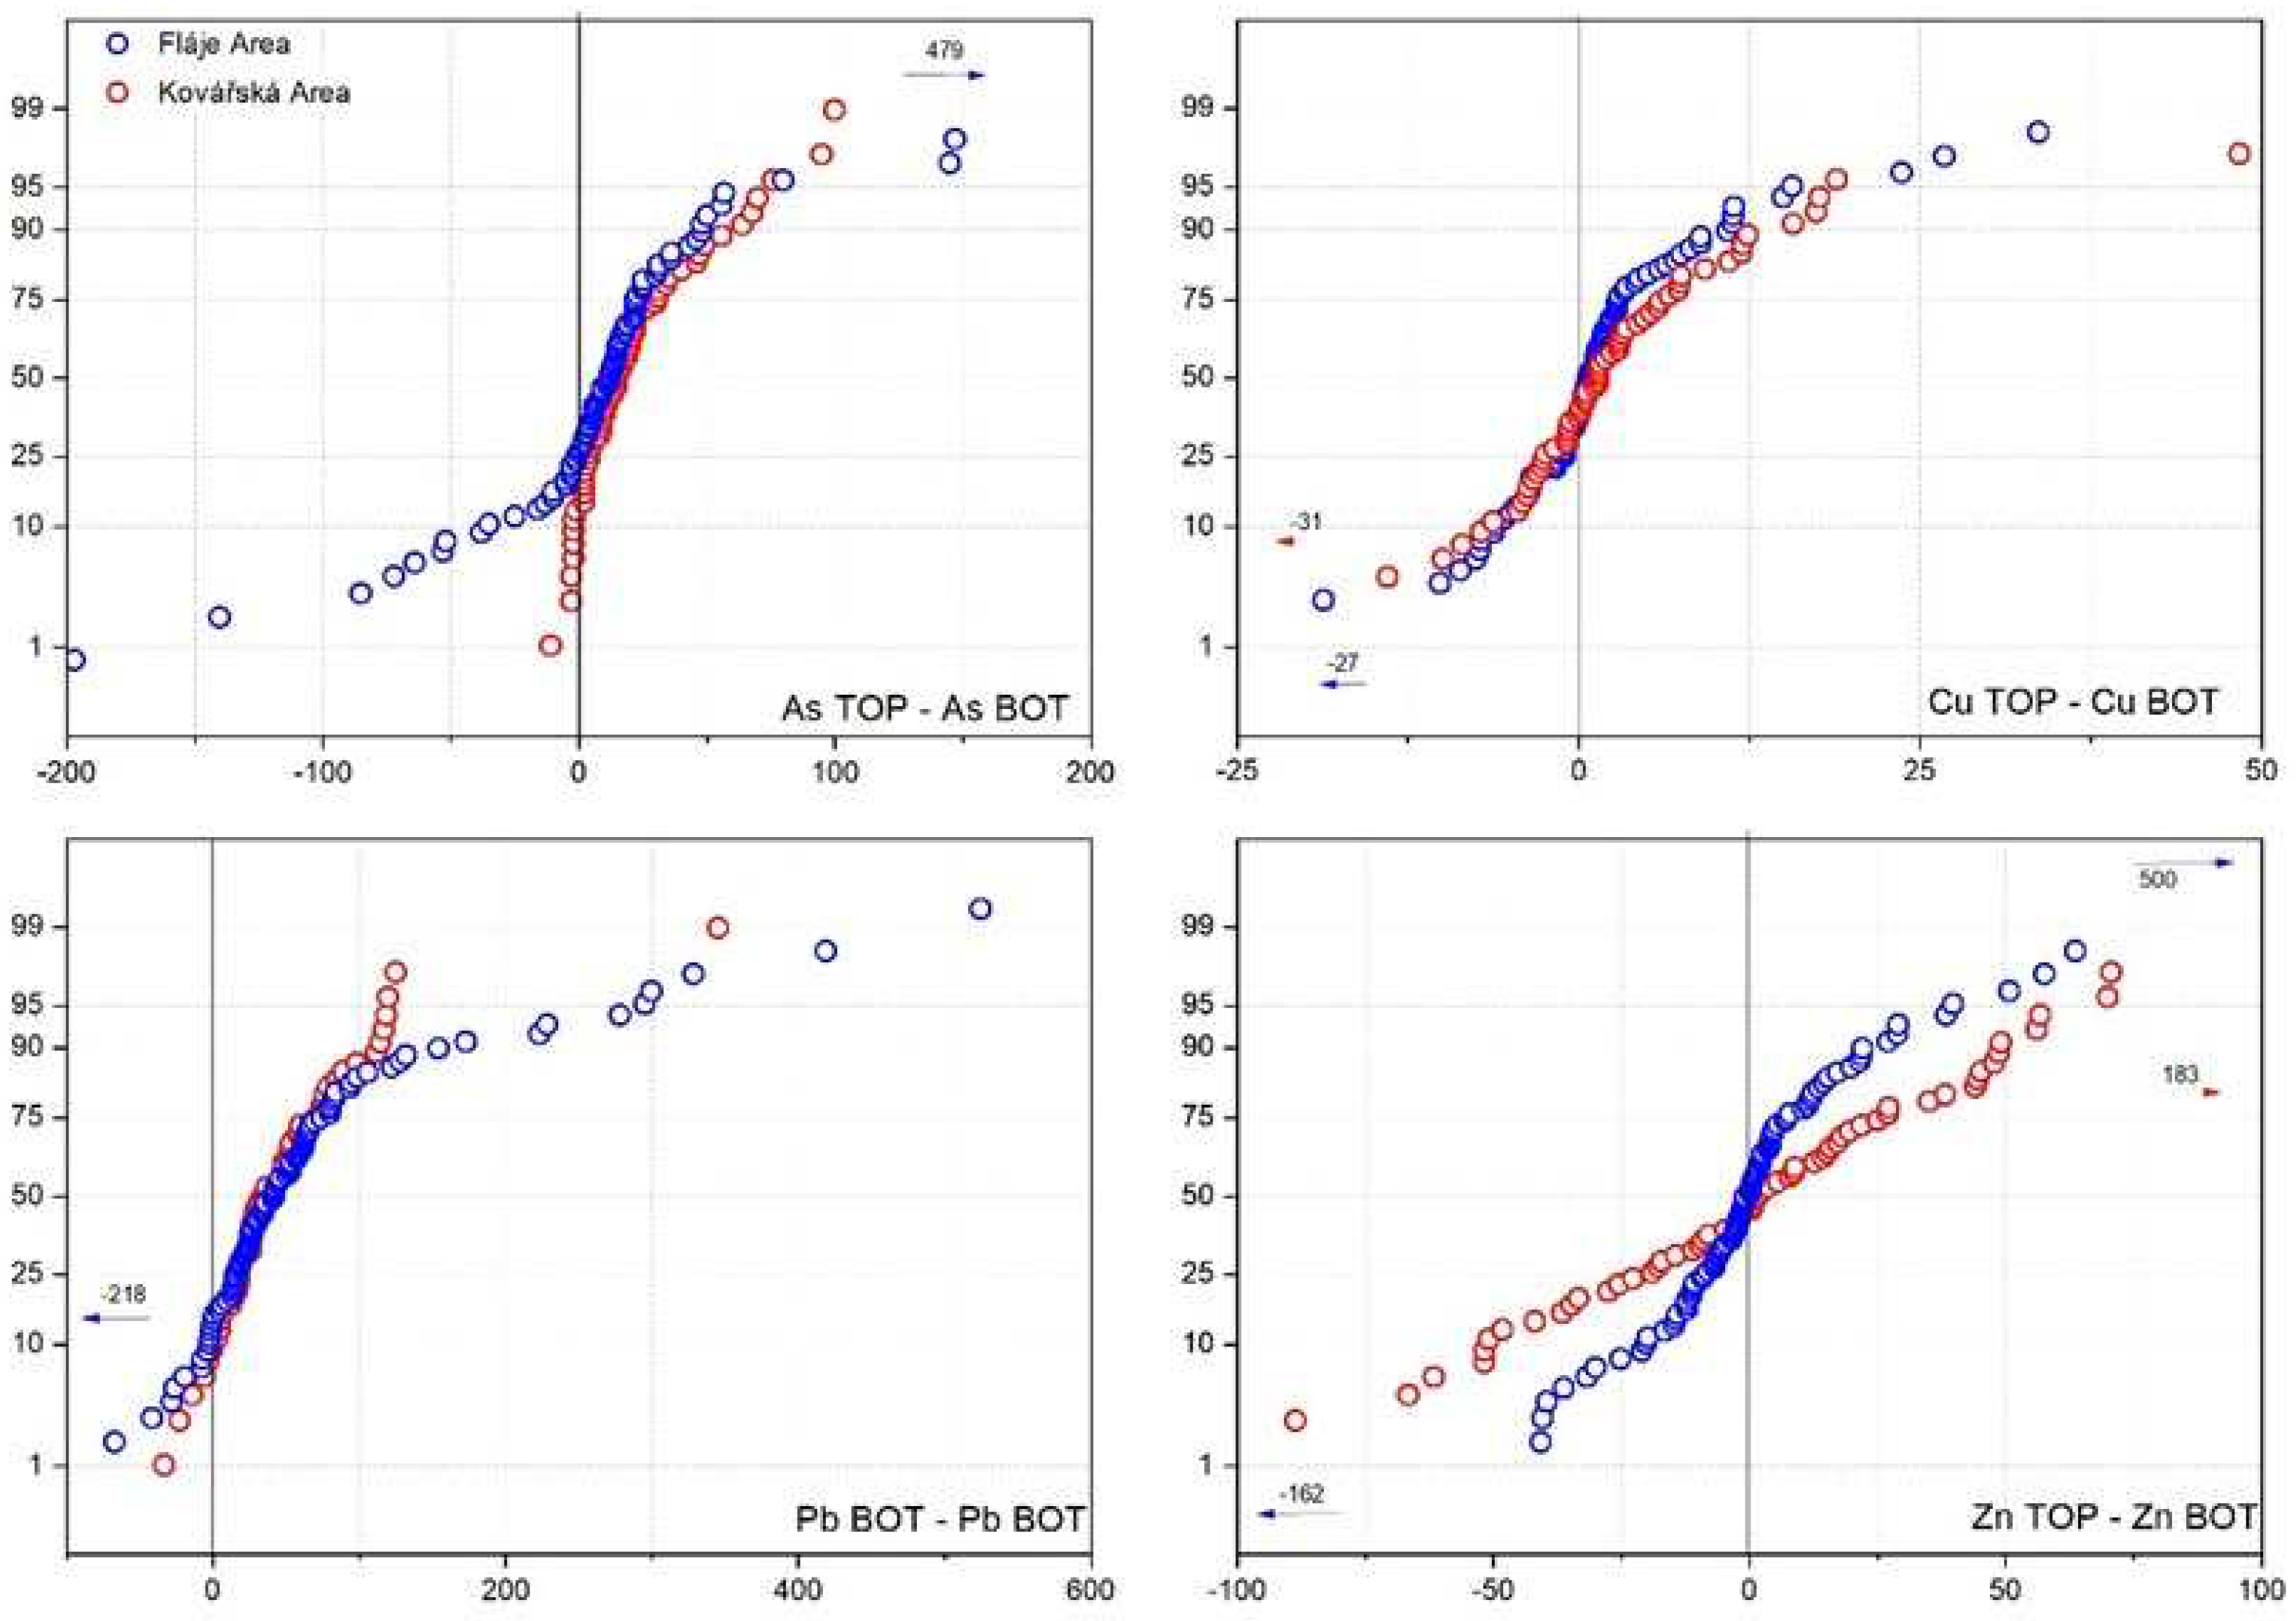
  The method to evaluate TOP and BOT differences in a rough, but in a certain sense more straightforward manner than using eq. 1, is a graphical presentation of TOP and BOT differences in a geochemical map (Figure 11 and Figure 12). In contrast to the approach based on eq. 1, these maps show a real paired comparison of TOP and BOT for each sampling point, while in the ECDFs approach by Fabian et al. [17] the TOP and BOT pairs are disconnected. TOP-BOT approach keeps the pairs connected but works with raw concentrations, which is not mathematically correct (see Section 2.4), but it produces direct estimates of TOP enrichment in concentration units. To express these estimates for the whole area, the medians for each element are presented in Table 3. The plain TOP-BOT difference in the ECDF plot in Figure 10 shows the distribution of the values around zero, consistently with lack of net diffuse contamination of TOP for those two elements. This situation is common in the Kovářská Area near mining sites at Mědník Hill (Figure 8).
Figure 13 compares TOP/BOT enrichment factors for each of the examined PTEs in its geochemically normalised form to compare relative surface enrichment by emission contamination. Also, TOP/BOT evaluation shows the topsoil enrichment decreases in the order Pb > As > Cu/Fe > Zn/Fe for both areas, except for two high Cu/Fe outliers in the Fláje Area.

4. Discussion

4.1. Impact of soil-forming substrate on PTE concentrations

It is generally accepted in the assessment of soil contamination that the parent rock is one of the most important RCFs for PTEs in soils. It can be revealed in the spatial display of the data obtained in a map with the geology of the area or the post-stratification (separation) of concentration data into groups according to geology (Figure 4 and Figure 5). The influence of geology on the concentrations of PTEs has been addressed in several papers [8,11] with the result that certain groups such as ultramafic, mafic, and granitic rocks are so prominent that they need to be considered separately when evaluating the soil composition datasets. The influence of geology as one of the fundamental RCFs is also evident in this study, although less significantly than we initially expected. Unless contrasting geology, such as basalts and granitoids, is involved, geological variability seems less significant on such a small scale than when mapped on a national scale, as shown by [19].
Geology plays a significant role on the Ore Mountains for As and Pb (As/Fe and Pb/Ti), but not in the sense of variability among individual geological units, but rather as an overall enrichment of PTEs in soils of the Ore Mountains compared to global (UCC) or regional (FOREGS) surveys, which seems to be related to metamorphosis and associated formation of ore veins. Comparisons of local PTE concentrations with the global or European backgrounds must take local specificity into account, because natural PTE concentrations in soils can vary significantly from area to area, within and between regions, making it impossible to define single global background values [56]. Peat and organic matter in general appeared as the most anomalous soil-forming substrate in our study, a parameter that needs to be addressed frequently in temperate mountain areas. The elevated PTEs volatilised by ore roasting and metallurgy (As and Pb), scavenged by plants and then transformed to peat (Figure 4 and Figure 5) documents to emissions in the area and this is due to the sorption capacity of organic matter, which acts as a geochemical trap [16]. On the contrary, Cu and Zn are sorbed on soil Fe oxides rather than on organic matter and thus elevated organic matter in TOP mainly dilutes their concentrations in soils, that is corrected with by geochemical normalisation (Figure 4 and Figure 5), also efficient in weakening soil matrix effects.
O’Shea [57] described elevated As concentrations in metasedimentary rocks, up to
138 mg kg-1, of which one possible cause is impact of large-scale fluid flux during rock metamorphosis [58]. Among these rocks, marine pelitic protoliths (such as the gneisses in the Ore Mountains, see Figure 5) typically show the highest average As concentrations (∼18 mg kg-1). All parent rocks from the Ore Mountains are enriched in As. Arsenic concentration is most variabile in basaltoids and metamorphosed rocks. In terms of rock types, Pb concentrations are frequently elevated in granite, followed by schist, gneiss, intermediate rocks, basic rocks, and ultramafic rocks [59]. Lead is widely dispersed in trace amounts in several common minerals, including K-feldspar, plagioclase, mica, zircon, and magnetite [54]. However, our results indicate mineralization enrichment of Pb occurred throughout the entire area irrespective of a bedrock type.
The local background concentration ratios for As/Fe and Pb/Ti (in Kovářská Area is 7·10-4 and 95·10-4, in Fláje Area 12·10-4 and 120·10-4, respectively) are elevated relative reference values (Figure 6 and Figure 7).

4.2. Use of ECDF and geochemical maps for distinguishing diffuse and point contamination

In geochemical mapping, the most challenging issue is how to correctly and objectively classify the data populations into background and contamination classes and how to define a threshold separating high outliers. The background population can be defined as the portion of values with the natural PTE content in soils without human influence [60]. For the actual classification of the data, ECDF diagrams are useful to show discontinuities (gaps) between the main concentration modes [61], including the gaps separating anomalous values, as shown in Figure 6C. The contamination is then easily detectable in upper part of the data series, e.g. in Q4 where the TOP “deviates” from the BOT and forms bulges (Figure 7C and Figure 7D). However, the location of this bulge is not only linked to Q4, it depends on the level of contamination and can generally also be found in the lower quartiles. Provided that such a classified dataset is displayed in conjunction with a geological map, there is a good chance of revealing any spatial links to rocks or contamination sources.
A considerable portion of soil samples from the Fláje Area with locally elevated Pb contamination originated from peat (Figure 9C). It reflects both emission scavenging by vegetation and Pb-sorption capacity of organic matter, which acts as a geochemical trap for several elements [16].
A cluster of elevated As/Fe values is found in the east of the area (Figure 9A, arrows 2 and 3). This clustering is not associated with anomalous geology, but it is close to the local mining and smelting around cities Mikulov and Hrob [41] and glassworks around Moldava city (Figure 1). Another portion of the studied soils, mostly TOP classified as intermediate contamination (tagged by orange circles in Figure 9A), is distributed over a broad area, and point to overall diffuse contamination of the entire area. Several TOP and BOT pairs (Cu/Fe, Pb/Ti, Zn/Fe) in the severely contaminated category (red colour in map) occur in the western part of the Fláje Area (Figure 9, arrow 1). Contamination at both depths can indicate a geogenic anomaly; most of these points are on granite and granitic porphyry geology, i.e., on metamorphosed rocks. However, the geology can play a role here as a secondary parameter and through the soil texture.
The Kovářská Area (Figure 8) is relatively simpler in terms of distinguishing anthropogenic contamination from geogenic anomalies. Strong local contamination is only evident around the Mědník Hill, which dominates as a local source of all studied PTEs. The role of diffusive contamination of As/Fe and especially Pb/Ti is obvious around Kovářská.

4.3. Realistic estimates of diffuse contamination contribution

Contamination is commonly defined as the presence of unusually high concentrations in the data series and soil contamination monitoring is usually focused on actually on them. However, depending on the signal strength, local (point) contamination becomes indistinguishable from natural background variations in meters to several kilometres from the source [27]. Actually, As and Pb are common diffuse contaminants due to their volatility in elemental (Pb) or oxidic forms (As2O3), in particular in areas like the Ore Mountains with widespread sulphide ore roasting and silver production using ancient lead technologies, in particular liquation (Section 2.1). The estimation of the diffuse input in this work is based on the assumption that Pb of anthropogenic origin is retained on the soil surface and the deep soil layers (BOT) originate mainly from the bedrock. Based on this assumption, Fabian et al. [17] proposed comparing the ECDFs for TOP and BOT of a PTE to identify and quantify diffuse contamination. This idea, further employed in subsequent works [30,31,52] is a powerful tool to overcome the problem of weak contamination, otherwise poorly distinguished by conventional data mining.
The Idea by Fabian et al. [17], however, includes a model of a spatially fairly homogenous spatial distribution of PTE emissions, that is not very likely in a real landscape, even over a small area, such as the study areas in the Ore Mountains as depicted schematically in Figure 1. The diffuse contamination of topsoils was affected by variability in the past vegetation cover and its emission-scavenging performance, which is markedly different for meadows and forests, additional heterogeneity inevitable resulted from varied topography and slope orientation relative to the emission sources, and the preferential wind directions in the area. In TOP and BOT contamination following the ECDF approach by Fabian et al. [17], a challenge particularly relevant for the Ore Mountains is a difference in topsoil content of organic matter and generally different soil texture in TOP and BOT. To correct PTE concentrations for those factors, geochemical normalisation is used [46,48]. The geochemical normalisation can also “sharpe” the major concentration populations in geochemical datasets and thus improve their interpretability, in particular definition of outliers [43,61]. Elements are also exchanged between TOP and BOT layers, either by biochemical processes in the form of “plant pump” especially for elements such as Cd, Zn, and Cu [16,62] (Figure 1). However, this plant pump is not so much relevant for Pb and As, because as non-essential elements they are not involved directly in biotic cycling.
From a purely mathematical perspective, Fabian et al. [17] and his followers [30,31,32] assumed that the impact of the diffuse contamination is easiest and most sensitively distinguished in the low-end of the data series in ECDFs because the contamination input is most substantial there. The problem is the lowest percentiles are found in soils with a high percentage of quartz sand and/or organic matter, where there is also the highest risk of post-depositional migration of contaminants; the consequent downward migration of imissions would lead to underestimation of the diffuse contamination contribution according to eq. (1). The lowest quartile or lower percentiles can also suffer from noise and bias analytical uncertainty. In our work, we preferred to search for diffuse contamination in the ECDF with special attention to Q2 and Q3.
The ECDF examination following methodology by Fabian et al. [17] is shown in Figure 6 and Figure 7 and it confirms the results from the geochemical map (Figure 8 and Figure 9): both study areas are affected by TOP diffuse enrichment of Cu/Fe contamination minimally, Zn/Fe barely, and As/Fe and Pb/Ti significantly. The TOP increase by diffuse contamination is somehow larger in the Fláje Area for As/Fe and Pb/Ti, although more local mining and smelting activities occurred in the Kovářská Area. According to Fabian et al. [17], we calculated the diffusion contributions in both areas for As/Fe (16.5·10-4 for Kovářská Area and 16.2·10-4 for Fláje Area) and Pb/Ti (1.12·10-4 and 1.48·10-4, respectively). Comparison of the diffuse contamination components with to the local background for As/Fe (7·10-4 and 12·10-4) and Pb/Ti (95·10-4 and 120·10-4, respectively) indicate that the emission contamination even exceeded the local background, i.e. more than half of topsoil As and Pb originated from emissions.

4.4. Diffuse contribution from soils and peats and outlines of future work

The most common way of evaluation of the TOP and BOT contaminant concentrations is their dividing to enrichment (EF) or concentration factors (CF). The TOP/BOT ratio higher than 1 is conventionally attributed to anthropogenic pollution [63]. Such a ratio can then also be used to summarize the enrichment of topsoil for each element in a given area (Figure 13) to show which contaminants are relatively most important.
Fabian et al. [17] have made a major contribution by distinguishing relative TOP enrichment similar to EF or CF (this is the slope a in eq. 1) and additive enrichment (intercept b in eq. 1) and attributed the latter to diffuse contamination. The example of b evaluation is shown in Figure 10. The plain difference of raw concentrations in Figure 10 is coarse approximation, which neglects the textural difference of TOP and BOT discussed above, but it provides a direct estimate of the net enrichment of TOP versus BOT by diffuse contamination and thus enables to compare results obtained by soil mapping with evaluation of the peat record. Bohdálková et al. [12] studied anthropogenic accumulations of Pb, As and Cu in the peat core sampled near Kovářská village; they found emission fluxes ~6, 0.9, and 0.2 mg m-2 year-1, respectively in the period between years 1420 and 1650. The total Pb fallout for the time period 1500-2000 CE was estimated from the emission fluxes by Bohdálková et al. [12] to be 1.9 g m-2, As fallout 0.35 g m-2, and Cu fallout 0.2 g m-2. Soil analyses, which we performed in the Kovářská Area, do not provide the temporal constraints for the emission flux, but they provide an estimate of total cumulative fallout soil contamination. In the Kovářská Area, the median Pb and As emissions (TOP–- BOT differences) are 35 mg kg-1 and 15 mg kg-1, respectively (Figure 10, Table 3). At the Fláje Area, the median of emissions for Pb is as high as 41 mg kg-1, and As 14 mg kg-1, which is comparable to the Kovářská Area. Making rough assumptions on i) the soil density approximately 1.5 t m-3 [64], and ii) all emissions having been captured in TOP, while iii) BOT represents pre-anthropogenic background, the total fallout for Pb and As was 6 g m-2 and 2 g m-2, respectively for the Fláje Area, and 5 g m-2 and 2 g m-2, respectively for the Kovářská Area. Such estimates are only slightly higher than those obtained from the peat archive by Bohdálková et al. [12]. Recent study by Shotyk et al. [65] indeed showed the peat archives could not “catch” and hold entire emission fallout and the co-incidence of our estimates and Bohdálková et al. [12] can thus be accepted. Contrarily, results by Veron et al. [66], who analysed peat core near Boží Dar, not far south-west of Kovářská (Figure 1), declared more than an order of magnitude bigger total Pb emission fluxes lasting longer than it has been documented by archaeological and botanical research [12,36]; it would produce diffuse enrichment of local topsoils to several hundred ppm Pb that has not been found yet in the target area.
According to the emission fallouts and the results of the spatial distribution of Pb and As TOP enrichment (Figure 11 and Figure 12), the main sources of pollution are located outside the Fláje Areas with rather small-scale mining and smelting activities south of the south-east corner of the Fláje Area (Figure 2). It is worth noting that prevailing wind directions in the Ore Mountains ridge are from the north-west to the east [67] that further weakens possible local contamination in the Fláje Area. Also in the Kovářská Area the impact of local metallurgy centres seem not much relevant relative to overall TOP enrichment. Our findings thus indicate that the sources of diffuse contamination in the Czech part of the Ore Mountains ridge were located in Germany, likely in Grünthal, or even farther from here in Freiberg, which was the most important Ag mining and smelting centre in the Ore Mountains for several centuries (see Section 2.1). This surprising finding will surely motivate our further investigation as it pinpoints the lack of knowledge on the past emission sources in the Ore Mountains. Yet only an overview of mining centres is available [35] but definitely not all of them produced As and Pb emissions.

5. Conclusions

  Appropriate sampling and analytical strategy are indispensable for distinguishing geogenic anomalies from anthropogenic activity in mineralised and anthropogenised landscapes, including top and bottom soil sampling, respecting the local geology, and processing the data appropriately using geochemical normalisation and exploratory data analysis using ECDF. To obtain reliable results, it is advisable to divide the area into smaller units, and in those units to perform high-density sampling to capture spatial concentration patterns in naturally and inevitably heterogeneous real landscapes. Surprisingly, geology can be less important in such deeply man-impacted landscapes, such as the Ore Mountains. The natural background in the mineralised areas can exceeded several times the global or regional backgrounds. Even in geogenically anomalous areas, the ECDF diagrams makes it possible to determine the anthropogenic contribution to the total soil contamination. However, it should be taken into account that the distribution of diffuse contamination is not uniform, as it is controlled by vegetation and the terrain topography. The TOP-BOT methodology can be used to estimate the atmospheric deposition of PTE and to determine numerically the impact of the diffuse contamination sources. Total fallout from these sources, estimated by the TOP - BOT methodology applied to soil analyses, is 6 g m-2 of Pb and 2 g m-2 for As in the Fláje Area, and 5 g m-2 for Pb and 2 g m-2 for As in the Kovářská Area. Methodology demonstrated in this work could be used to establish map of ancient emission sources for the Ore Mountains, yet missing.

Author Contributions

Conceptualization, M.H. and T.M.G.; methodology, M.H and T.M.G.; software, M.H.; formal analysis, M.H. and T.M.G; investigation, M.H and T.M.G.; resources, M.H..; writing—original draft preparation, M.H. and T.M.G; writing—review and editing, M.H. and T.M.G.; visualization, M.H. and Š.T.; supervision, T.M.G.; project administration, M.H.; funding acquisition, M.H. All authors have read and agreed to the published version of the manuscript.

Funding

This research was funded by SGS (UJEP-SGS-44202/15/2084/01) in UJEP Ústí nad Labem.

Acknowledgements

The authors would like to thank M. Maříková and P. Vorm from the Institute of Inorganic Chemistry in Řež for laboratory processing of samples and XRF analysis. We are thankful to S. Draganchev for his help in fieldwork. We also thank J. Elznicová for her advice about GIS.

Conflicts of Interest

The authors declare no conflicts of interest. The funders had no role in the design of the study; in the collection, analyses, or interpretation of data; in the writing of the manuscript; or in the decision to publish the results.

References

  1. Ander, E.L.; Johnson, C.C.; Cave, M.R.; et al. Methodology for the determination of normal background concentrations of contaminants in English soil. Sci. Tot. Environ. 2013, 454–455, 604–618. [Google Scholar] [CrossRef]
  2. Vácha, R.; Skála, J.; Čechmánková, J.; et al. Toxic elements and persistent organic pollutants derived from industrial emissions in agricultural soils of the Northern Czech Republic. J Soils Sed. 2015, 15, 1813–1824. [Google Scholar] [CrossRef]
  3. Reimann, C.; Fabian, K.; Flem, B.; Andersson, M.; Filzmoser, P.; Englmaier, P. Geosphere-biosphere circulation of chemical elements in soil and plant systems from a 100 km transect from southern central Norway. Sci. Tot. Environ. 2018. [Google Scholar] [CrossRef]
  4. Gosar, M.; Šajn, R.; Bavec, Š.; et al. Geochemical background and threshold for 47 chemical elements in Slovenian topsoil. Geologija 2019, 62, 5–57. [Google Scholar] [CrossRef]
  5. Pasieczna, A.; Konon, A.; Nadłonek, W. Sources of anthropogenic contamination of soil in the Upper Silesian Agglomeration (southern Poland). Geol Q 2020, 64, 988–1003. [Google Scholar] [CrossRef]
  6. Kelepertzis, E.; Stathopoulou, E. Availability of geogenic heavy metals in soils of Thiva town (central Greece). Environ Monitoring and Assessment 2013, 185, 9603–9618. [Google Scholar] [CrossRef]
  7. Zhang, H.; Luo, Y.; Teng, Y.; Wan, H. PCB contamination in soils of the Pearl River Delta, South China: Levels, sources, and potential risks. Environ. Sci. Pollut. Res. 2013, 20, 5150–5159. [Google Scholar] [CrossRef]
  8. Amorosi, A.; Guermandi, M.; Marchi, N.; Sammartino, I. Fingerprinting sedimentary and soil units by their natural metal contents: A new approach to assess metal contamination. Sci Total Environ 2014, 500–501, 361–372. [Google Scholar] [CrossRef]
  9. dos Santos, L.M.R.; Gloaguen, T.V.; de Souza Fadigas, F.; et al. Metal accumulation in soils derived from volcano-sedimentary rocks, Rio Itapicuru Greenstone Belt, northeastern Brazil. Sci. Tot. Env. 2017, 601–602, 1762–1774. [Google Scholar] [CrossRef]
  10. Gosar, M.; Šajn, R.; Bavec, Š.; et al. Geochemical background and threshold for 47 chemical elements in Slovenian topsoil. Geologija 2019, 62, 5–57. [Google Scholar] [CrossRef]
  11. Zhang, L.; McKinley, J.; Cooper, M.; Peng, M.; Wang, Q.; Song, Y.; Cheng, H. A regional soil and river sediment geochemical study in Baoshan area, Yunnan province, southwest China. J. of Geochem. Explor. 2020, 217, 106557. [Google Scholar] [CrossRef]
  12. Bohdálková, L.; Bohdálek, P.; Břízová, E.; Pacherová, P.; Kuběna, A.A. Atmospheric metal pollution records in the Kovářská Bog (Czech Republic) as an indicator of anthropogenic activities over the last three millennia. Science of The Total Environment 2018, 633, 857–874. [Google Scholar] [CrossRef] [PubMed]
  13. Tolksdorf, J.F.; Kaiser, K.; Petr, L.; Herbig, C.; Kočár, P.; Heinrich, S.; Wilke, F.D.H.; Theuerkauf, M.; Fülling, A.; Schubert, M.; Schröder, F.; Křivánek, R.; Schulz, L.; Bonhage, A.; Hemker, C. Past human impact in a mountain forest: geoarchaeology of a medieval glass production and charcoal hearth site in the Erzgebirge, Germany. Reg. Environ. Change 2020, 20, 71. [Google Scholar] [CrossRef]
  14. Tarvainen, T.; Reichel, S.; Müller, I.; Jordan, I.; Hube, D.; et al. Arsenic in agro-ecosystems under anthropogenic pressure in Germany and France compared to a geogenic As region in Finland. J of Geochem. Expl. 2020, 217, 106606. [Google Scholar] [CrossRef]
  15. Beier, T.; Opp, C.; Hahn, J.; Zitzer, N. Sink and Source Functions for Metal(loid)s in Sediments and Soils of Two Water Reservoirs of the Ore Mountains, Saxony, Germany. Appl. Sci. 2022, 12, 6354. [Google Scholar] [CrossRef]
  16. Goldschmidt, V.M. The principles of distribution of chemical elements in minerals and rocks. J Chem Soc London 1937, 655–673. [Google Scholar]
  17. Fabian, K.; Reimann, C.; de Caritat, P. Quantifying diffuse contamination: method and application to Pb in soil. Environ. Sci. Technol. 2017, 51, 6719–6726. [Google Scholar] [CrossRef] [PubMed]
  18. Matys Grygar, T.; Elznicová, J.; Tůmová, Š.; Kylich, T.; Skála, J.; Hron, K.; Álvarez Vázquez, M.Á. Moving from geochemical to contamination maps using incomplete chemical information from long-term high-density monitoring of Czech agricultural soils. Environ. Earth Sci. 2023, 82, 6. [Google Scholar] [CrossRef]
  19. Baize, D.; Sterckeman, T. Of the necessity of knowledge of the natural pedo-geochemical background content in the evaluation of the contamination of soils by trace elements. Sci. Total Environ. 2001, 264, 127–139. [Google Scholar] [CrossRef]
  20. Wang, H.; Yilihamu, Q.; Yuan, M.; Bai, H.; Xu, H.; Wu, J. Prediction models of soil heavy metal(loid)s concentration for agricultural land in Dongli: A comparison of regression and random forest. Ecol. Indicators 2020, 119, 106801. [Google Scholar] [CrossRef]
  21. Boente, C.; Baragaño, D.; García-González, N.; Forján, R.; Colina, A.; Gallego, J.R. A holistic methodology to study geochemical and geomorphological control of the distribution of potentially toxic elements in soil. Catena 2022, 208. [Google Scholar] [CrossRef]
  22. Ribeiro, M. T., and Guestrin, C. "Why Should I Trust You?" Explaining the Predictions of Any Classifier. 22nd ACM SIGKDD International Conference on Knowledge Discovery and Data Mining, 2016, 1135–1144.
  23. Zhao, Z.; Qiao, K.; Liu, Y.; et al. Geochemical Data Mining by Integrated Multivariate Component Data Analysis: The Heilongjiang Duobaoshan Area (China) Case Study. Minerals 2022, 12, 1035. [Google Scholar] [CrossRef]
  24. Sarti, G.; Sammartino, I.; Amorosi, A. Geochemical anomalies of potentially hazardous elements reflect catchment geology: An example from the Tyrrhenian coast of Italy. Sci. Total Environ. 2020, 714, 136870. [Google Scholar] [CrossRef]
  25. Lienard, A.; Colinet, G. Assessment of vertical contamination of Cd, Pb, and Zn in soils around a former ore smelter in Wallonia, Belgium. Environ. Earth Sci. 2016, 75. [Google Scholar] [CrossRef]
  26. Reimann, C.; Fabian, K.; Birke, M.; et al. GEMAS: Establishing geochemical background and threshold for 53 chemical elements in European agricultural soil. Appl Geochem 2018, 88, 730–740. [Google Scholar] [CrossRef]
  27. Spahić, M.P.; Sakan, S.; Cvetković, Ž.; et al. Assessment of contamination, environmental risk, and origin of heavy metals in soils surrounding industrial facilities in Vojvodina, Serbia. Environ Monit Assess. 2018. [Google Scholar] [CrossRef]
  28. Sinclair, A.J. Applications of Probability Graphs in Mineral Exploration. Special Volume No. 4, The Association of Exploration Geochemists. Richmond Printers 1976, Richmond, Canada.
  29. Reimann, C.; Fabian, K.; Flem, B. Cadmium enrichment in topsoil: Separating diffuse contamination from biosphere-circulation signals. Sci. Tot. Environ. 2019, 651, 1344–1355. [Google Scholar] [CrossRef]
  30. Reimann, C.; Fabian, K.; Flem, B.; Englmaier, P. The large-scale distribution of Cu and Zn in sub- and topsoil: Separating topsoil bioaccumulation and natural matrix effects from diffuse and regional contamination. Sci. Tot. Environ. 2019, 655, 730–740. [Google Scholar] [CrossRef]
  31. Flem, B.; Acosta-Gongora, P.; Andersson, M.; Finne, T.E.; Minde, Å. Organic soil geochemistry in southern Trøndelag, QC – report. [dataset] Geological Survey of Norway 2021. Report no: 2021.006.
  32. Giandon, P. Soil Contamination by Diffuse Inputs. 2015. ISBN 978-94-017-9498-5. [CrossRef]
  33. Vilímek, V. and Raška, P. The Krušné Hory Mts. The Longest Mountain Range of the Czech Republic. Geomorphological Landscapes 2016. [CrossRef]
  34. UNESCO World Heritage site. Montanregion.cz. Available from: http://www.montanregion.cz/cs/montanregion.html. Accessed 20 October 2023.
  35. Kaiser, K.; Theuerkauf, M.; Hieke, F. Holocene forest and land-use history of the Erzgebirge, central Europe: a review of palynological data. E&G Quaternary Sci. J. 2023, 72, 127–161. [Google Scholar] [CrossRef]
  36. Tolksdorf, J.F.; Kaiser, K.; Petr, L.; Herbig, C.; Kočár, P.; Heinrich, S.; Wilke, F.D.H.; Theuerkauf, M.; Fülling, A.; Schubert, M.; Schröder, F.; Křivánek, R.; Schulz, L.; Bonhage, A.; Hemker, C. Past human impact in a mountain forest: geoarchaeology of a medieval glass production and charcoal hearth site in the Erzgebirge, Germany. Reg. Environ. Change 2020, 20, 71. [Google Scholar] [CrossRef]
  37. Kafka, J. Rudné a uranové hornictví České republiky [Ore and Uranium Mining in the Czech Republic]. DIAMO, Czech Republic, 2003, 80-86331-67-9, pp. 647.
  38. Cílová, Z.; Woitsch, J. Potash e a key raw material of glass batch for Bohemian glasses from 14th -17th centuries? J Archaeo. Sci. 2012, 39, 371–380. [Google Scholar] [CrossRef]
  39. Černá, E.; Frýda, F. Sklo vrcholného středověku – současný stav a perspektivy studia historických (Glass of the High Middle Ages - current state and perspectives of historical studies Technologies). Archaeologia historica 2000, 35, 355–357. [Google Scholar]
  40. Botula, Y.D.; Nemes, A.; Van Ranst, E.; Mafuka, P.; De Pue, J.; Cornelis, W.M. Hierarchical pedotransfer functions to predict bulk density of highly weathered soils in Central Africa. Soil Sci. Society of America 2015, 79, 476–486. [Google Scholar] [CrossRef]
  41. Geological map 1: 50 000, In: Geological map 1: 50,000 [online]. Praha: Czech Geological Survey, Available from: https://mapy.geology.cz/geocr50/. Accessed 10 October 2023.
  42. Adamec, S.; Tůmová, Š.; Hošek, M.; Lučić, M.; Matys Grygar, T., under review. Pitfalls of distinguishing anthropogenic and geogenic reasons for risk elements in soils around coal-fired power plant: from case study in NW Czech Republic to general recommendations. Journal of Soils and Sed. [CrossRef]
  43. Álvarez-Vázquez, M.Á.; Hošek, M.; Elznicová, J.; et al. Separation of geochemical signals in fluvial sediments: new approaches to grain-size control and anthropogenic contamination. Appl. Geochem. 2020. [Google Scholar] [CrossRef]
  44. Sterckeman, T.; Douay, F.; Baize, D.; Fourrier, H.; et al. Trace elements in soils developed in sedimentary materials from Northern France. Geoderma 2006, 136, 912–929. [Google Scholar] [CrossRef]
  45. Bábek, O.; Grygar, T.M.; Faměra, M.; et al. Geochemical background in polluted river sediments: How to separate the effects of sediment provenance and grain size with statistical rigour? Catena 2015, 135, 240–253. [Google Scholar] [CrossRef]
  46. Dung, T.T.T.; Cappuyns, V.; Swennen, R.; Phung, N.K. From geochemical background determination to pollution assessment of heavy metals in sediments and soils. Rev. Environ. Sci. Biotechnol. 2013, 12, 335–353. [Google Scholar] [CrossRef]
  47. Matys Grygar, T.; Popelka, J. Revisiting geochemical methods of distinguishing natural concentrations and pollution by risk elements in fluvial sediments. J Geochem. Explor. 2016, 170, 39–57. [Google Scholar] [CrossRef]
  48. Goldschmidt, V.M. In: Muir, Alex (Ed.), Geochemistry. 1954. Clarendon Press.
  49. Reimann, C.; Filzmoser, P.; Garrett, RG.; Dutter, R. Statistical data analysis explained. Applied environmental statistics with R. John Wiley & Sons 2008, Chichester. ISBN 978-0-470-98581-6.
  50. Reimann, C.; Fabian, K. Quantifying diffuse contamination: Comparing silver and mercury in organogenic and minerogenic soil. Sci. Tot. Environ. 2022, 832, 155065. [Google Scholar] [CrossRef]
  51. Flem, B.; Reimann, C.; Fabian, K. Excess Cr and Ni in top soil: Comparing the effect of geology, diffuse contamination, and biogenic influence. Sci Tot. Env. 2022, 843. [Google Scholar] [CrossRef]
  52. Rudnick, RL.; Gao, S. Treatise on Geochemistry: Composition of the continental crust. In: Rudnick RL, Holland HD, Turekian KK (eds) The Crust, Treatise on Geochem. 2003, 3. Elsevier-Pergamon, Oxford, pp 1–64.
  53. Salminen, R.; Batista, M.J.; Bidovec, M.; et al. Geochemical Atlas of Europe. Part 1 – Background Information, Methodology and Maps. Geological Survey of Finland 2005, Espoo. [dataset]. ISBN 951-690-921-3.
  54. Ministry of Environment; Decree No. 153/2016 Coll. Vyhláška č. 153/2016 Sb. ze dne 9. května 2016 o stanovení podrobností ochrany kvality zemědělské půdy a o změně vyhlášky č. 13/1994 Sb., kterou se upravují některé podrobnosti ochrany zemědělského půdního fondu (in Czech).
  55. Reimann, C.; Garret, R.G. Geochemical background—concept and reality. Sci. Tot. Environ. 2005, 350, 12–27. [Google Scholar] [CrossRef]
  56. O’Shea, B.; Stransky, M.; Leitheiser, S.; Brock, P.; Marvinney, R.; Zheng, Y. Heterogeneous arsenic enrichment in meta-sedimentary rocks in central Maine, United States. Sci. Total Environ. 2015. [Google Scholar] [CrossRef] [PubMed]
  57. Goldhaber, S.B. Trace element risk assessment: essentiality vs. toxicity. Regul. Toxic. And Pharmacol. 2003, 38, 232–242. [Google Scholar] [CrossRef]
  58. Wang, X.; Han, Z.; Wang, W.; Zhang, B.; Wu, H.; Nie, L.; et al. Continental-scale geochemical survey of lead (Pb) in mainland China's pedosphere: Concentration, spatial distribution and influences. Appl. Geochem. 2018, 100, 55–63. [Google Scholar] [CrossRef]
  59. Salminen, R.; Gregorauskiene, V. Considerations regarding the definition of a geochemical baseline of heavy metals in the overburden in areas differing in basic geology. Appl. Geochem. 2000, 15, 647–653. [Google Scholar] [CrossRef]
  60. Bravo, S.; García-Ordiales, E.; García-Navarro, F.J.; et al. Geochemical distribution of major and trace elements in agricultural soils of Castilla-La Mancha (central Spain): finding criteria for baselines and delimiting regional anomalies. Environ. Sci. Pollut. Res. 2023, 26, 3100–3114. [Google Scholar] [CrossRef]
  61. Matys Grygar, T.; Faměra, M.; Hošek, M.; Elznicová, J.; et al. Uptake of Cd, Pb, U, and Zn by plants in floodplain pollution hotspots contributes to secondary contamination. Environ. Sci. and Poll. Res. 2021, 28, 51183–51198. [Google Scholar] [CrossRef]
  62. Shotyk, W. Comment on “The biosphere: A homogeniser of Pb-isotope signals” by C. Reimann, B. Flem, A. Arnoldussen, P. Englmaier, T.E. Finne, F. Koller and Ø. Nordgulen. Applied Geochemistry 2008, 23, 2514–2518. [Google Scholar] [CrossRef]
  63. Density of materials. SImetric (2004). Available from: https://www.simetric.co.uk/si_materials.htm. Accessed 10 December 2023.
  64. Shotyk, W.; Kempter, H.; Krachler, M.; Zaccone, C. Stable (206Pb, 207Pb, 208Pb) and radioactive (210Pb) lead isotopes in 1 year of growth of sphagnum moss from four ombrotrophic bogs in southern Germany: geochemical significance and environmental implications. Geochim. Cosmochim. Acta 2015, 163, 101–125. [Google Scholar] [CrossRef]
  65. Veron, A.; Novak, M.; Brizova, E.; Stepanova, M. Environmental imprints of climate changes and anthropogenic activities in the Ore Mountains of Bohemia (Central Europe) since 13 cal. kyr BP. The Holocene 2014, 24, 919–931. [Google Scholar] [CrossRef]
  66. Windroses at air pollution stations, Praha: Czech Hydrometeorological Institute, Available from: https://www.chmi.cz/files/portal/docs/uoco/isko/tab_roc/2021_enh/pollution_wrose/wrose_UKRUA_GB.html. Accessed 18 December 2023.
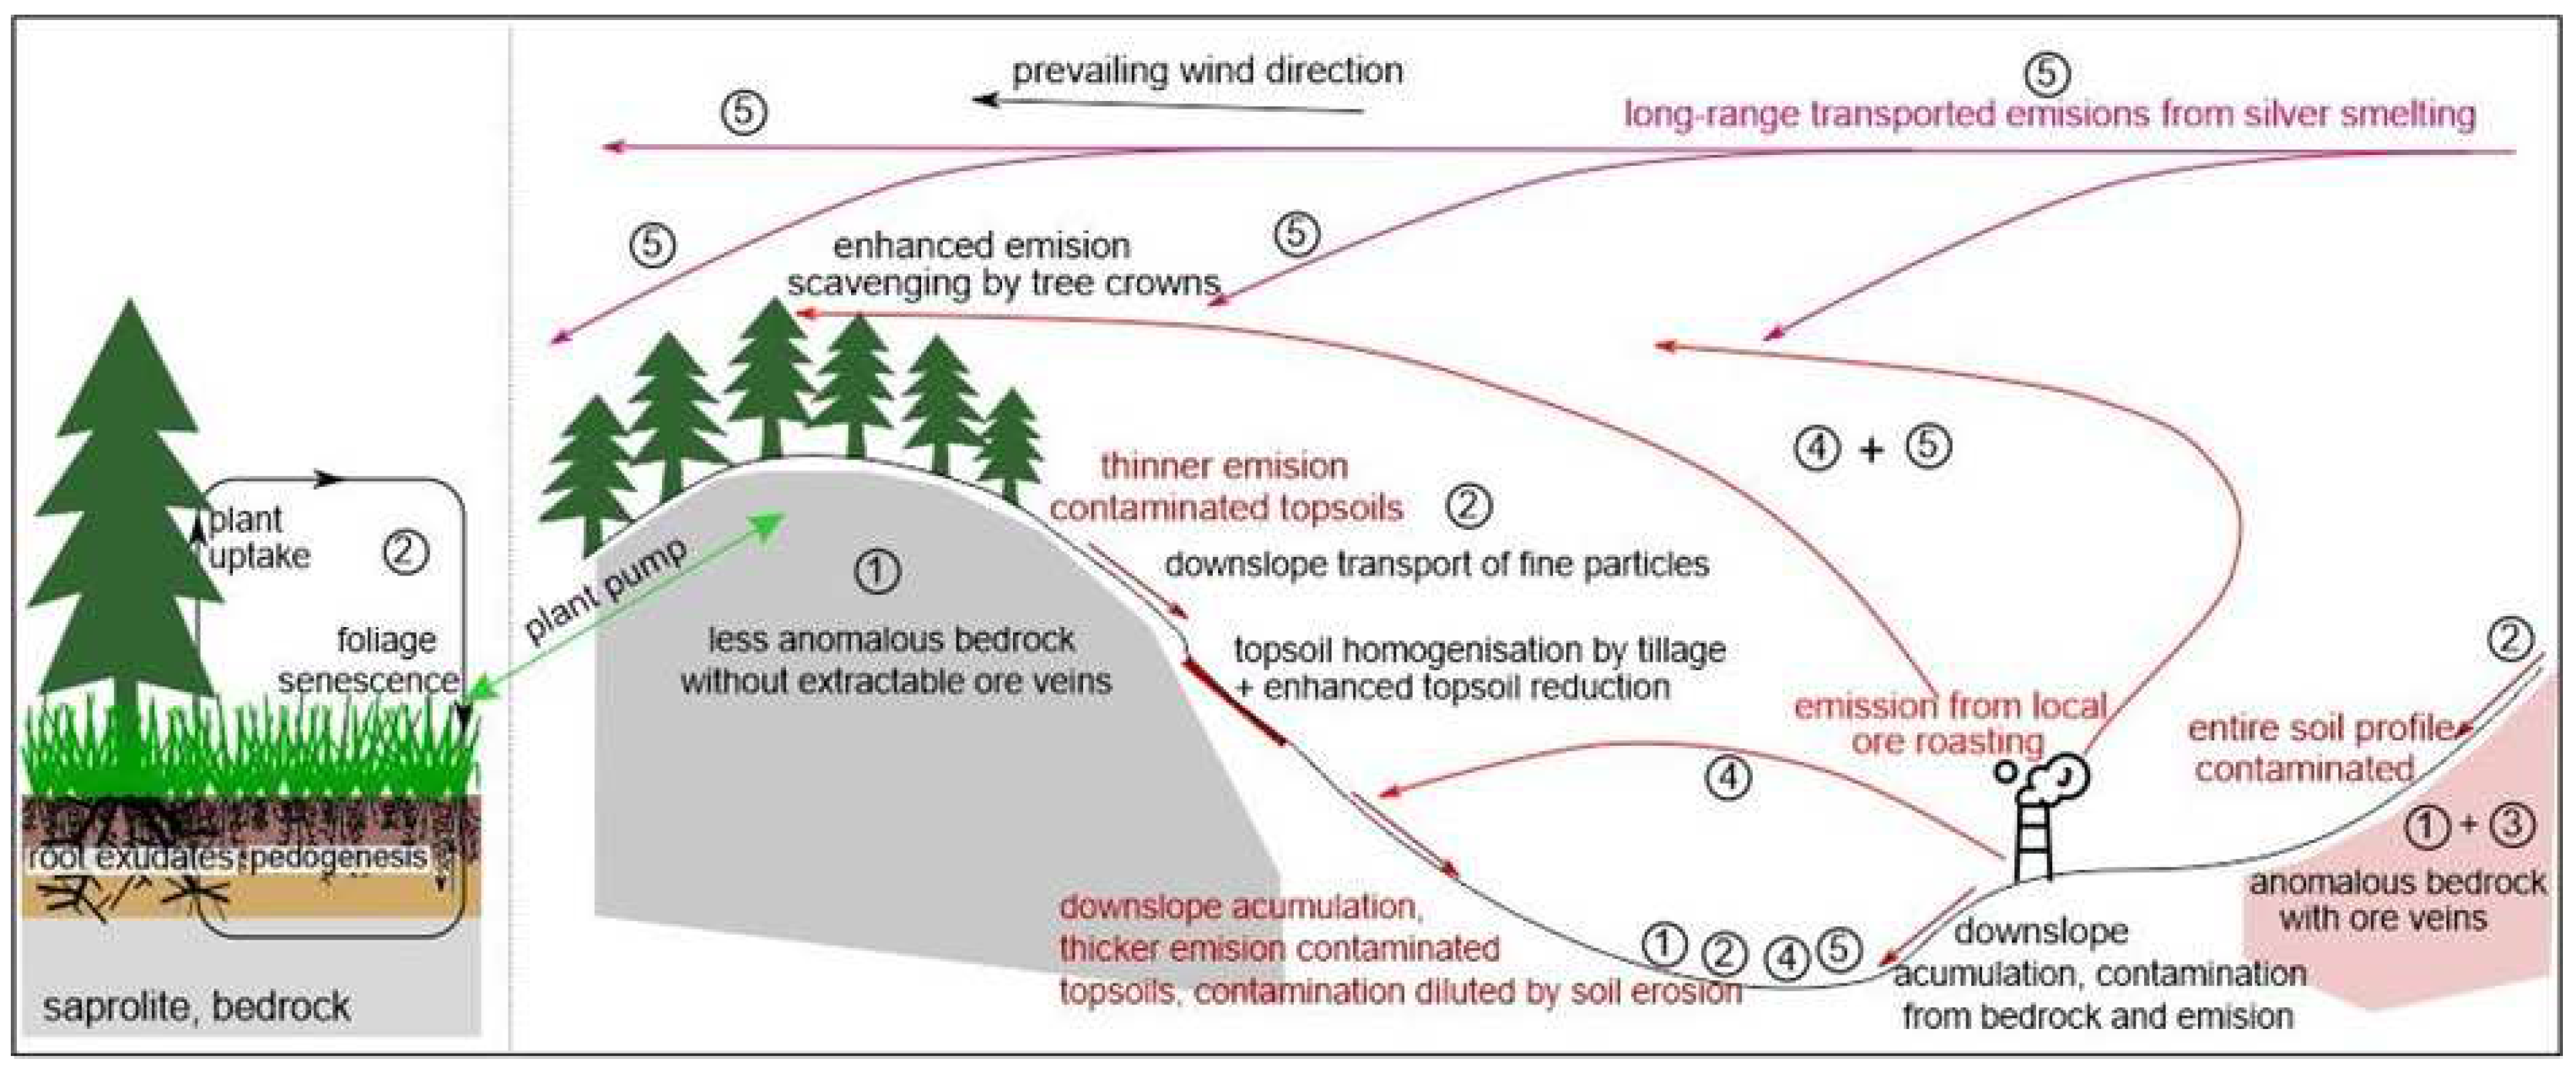
Figure 1. Scheme of real control factors of PTEs concentration. 1) bedrock geology, 2) soil processes including soil transport (erosion/accumulation), particle translocations, organic matter enrichment in topsoils, and plant pump [16], 3) local geogenic anomalies, such as ore veins, 4) localised emissions impacting minor part of soil samples in the target area, and 5) diffuse emissions, impacting majority or all soil samples in the target area.
Preprints 95476 g001
Figure 2. Overview map with marked study areas and with local evidence of mining, metallurgy and glassworks.
Preprints 95476 g002
Figure 3. Summary of raw concentrations of PTEs for the two study areas with highlighted selected reference values.
Preprints 95476 g003
Figure 10. Expression of the emission contribution (mg kg−1) of individual PTEs using the TOP minus BOT methodology.
Preprints 95476 g010
Figure 11. Overview map of the Kovářská Area and plotted TOP – BOT values (mg kg−1), expressing the net contribution (emissions) of individual PTEs.
Preprints 95476 g011
Figure 12. Overview map of the Fláje Area and plotted TOP – BOT values (mg kg−1), expressing the net TOP contribution (emission enrichment) of individual PTEs.
Preprints 95476 g012
Figure 13. Local enrichment factors expressing the difference in concentrations (mg kg−1) of PTEs in TOP versus BOT.
Preprints 95476 g013
Table 2. Summary of LCS (a in equation 1) and predicted diffuse contamination concentration ratios for each element and area.
Kovářská Fláje
LCS Estimated diffuse contamination LCS Estimated diffuse contamination
As/Fe 1.52 1.12 As/Fe 1.48 1.42
Pb/Ti 1.64 16.5 Pb/Ti 1.34 16.2
Table 3. Summary of medians for TOP-BOT difference in mg kg-1.
Element Kovářská Area Fláje Area
As 15 14
Cu 1.5 0.7
Pb 35 42
Zn 1.7 -0.7
Disclaimer/Publisher’s Note: The statements, opinions and data contained in all publications are solely those of the individual author(s) and contributor(s) and not of MDPI and/or the editor(s). MDPI and/or the editor(s) disclaim responsibility for any injury to people or property resulting from any ideas, methods, instructions or products referred to in the content.
Copyright: This open access article is published under a Creative Commons CC BY 4.0 license, which permit the free download, distribution, and reuse, provided that the author and preprint are cited in any reuse.
Prerpints.org logo

Preprints.org is a free preprint server supported by MDPI in Basel, Switzerland.

Subscribe

© 2024 MDPI (Basel, Switzerland) unless otherwise stated