Submitted:
04 January 2024
Posted:
05 January 2024
You are already at the latest version
Abstract
Keywords:
1. Introduction
2. Subjects and Methods
2.1. Subjects
2.2. Methods
2.3. Statistical Analysis
3. Results
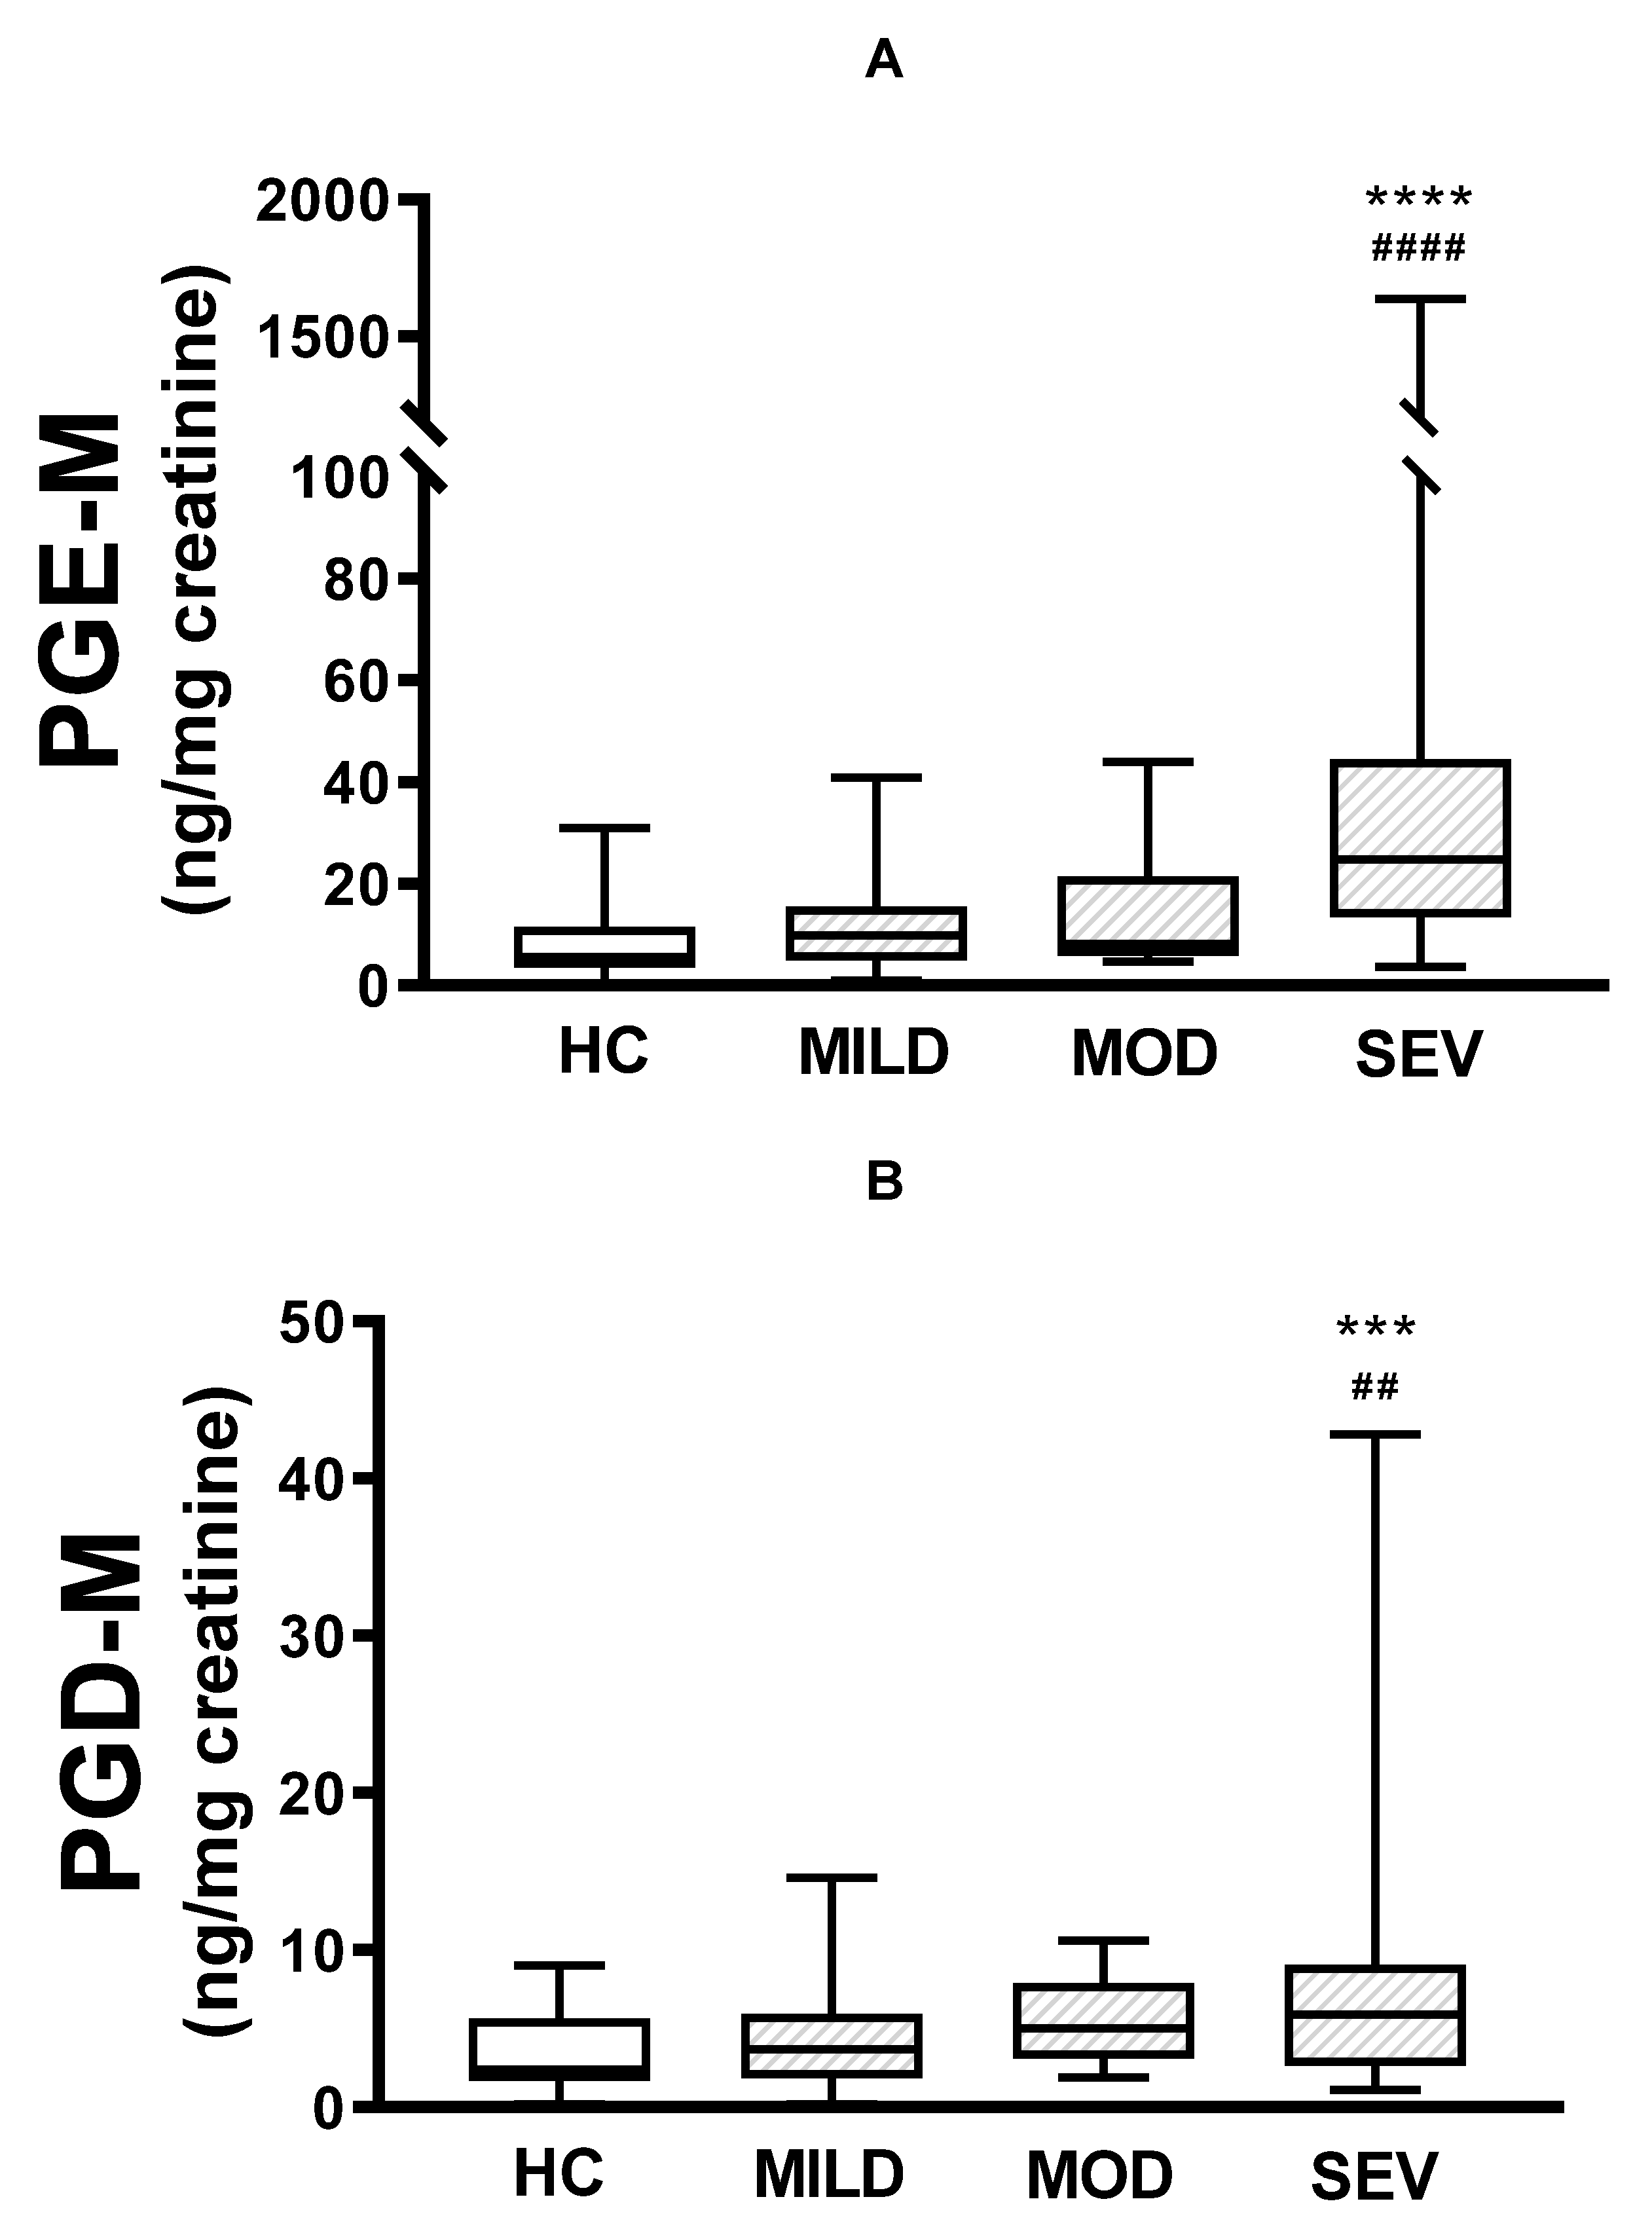
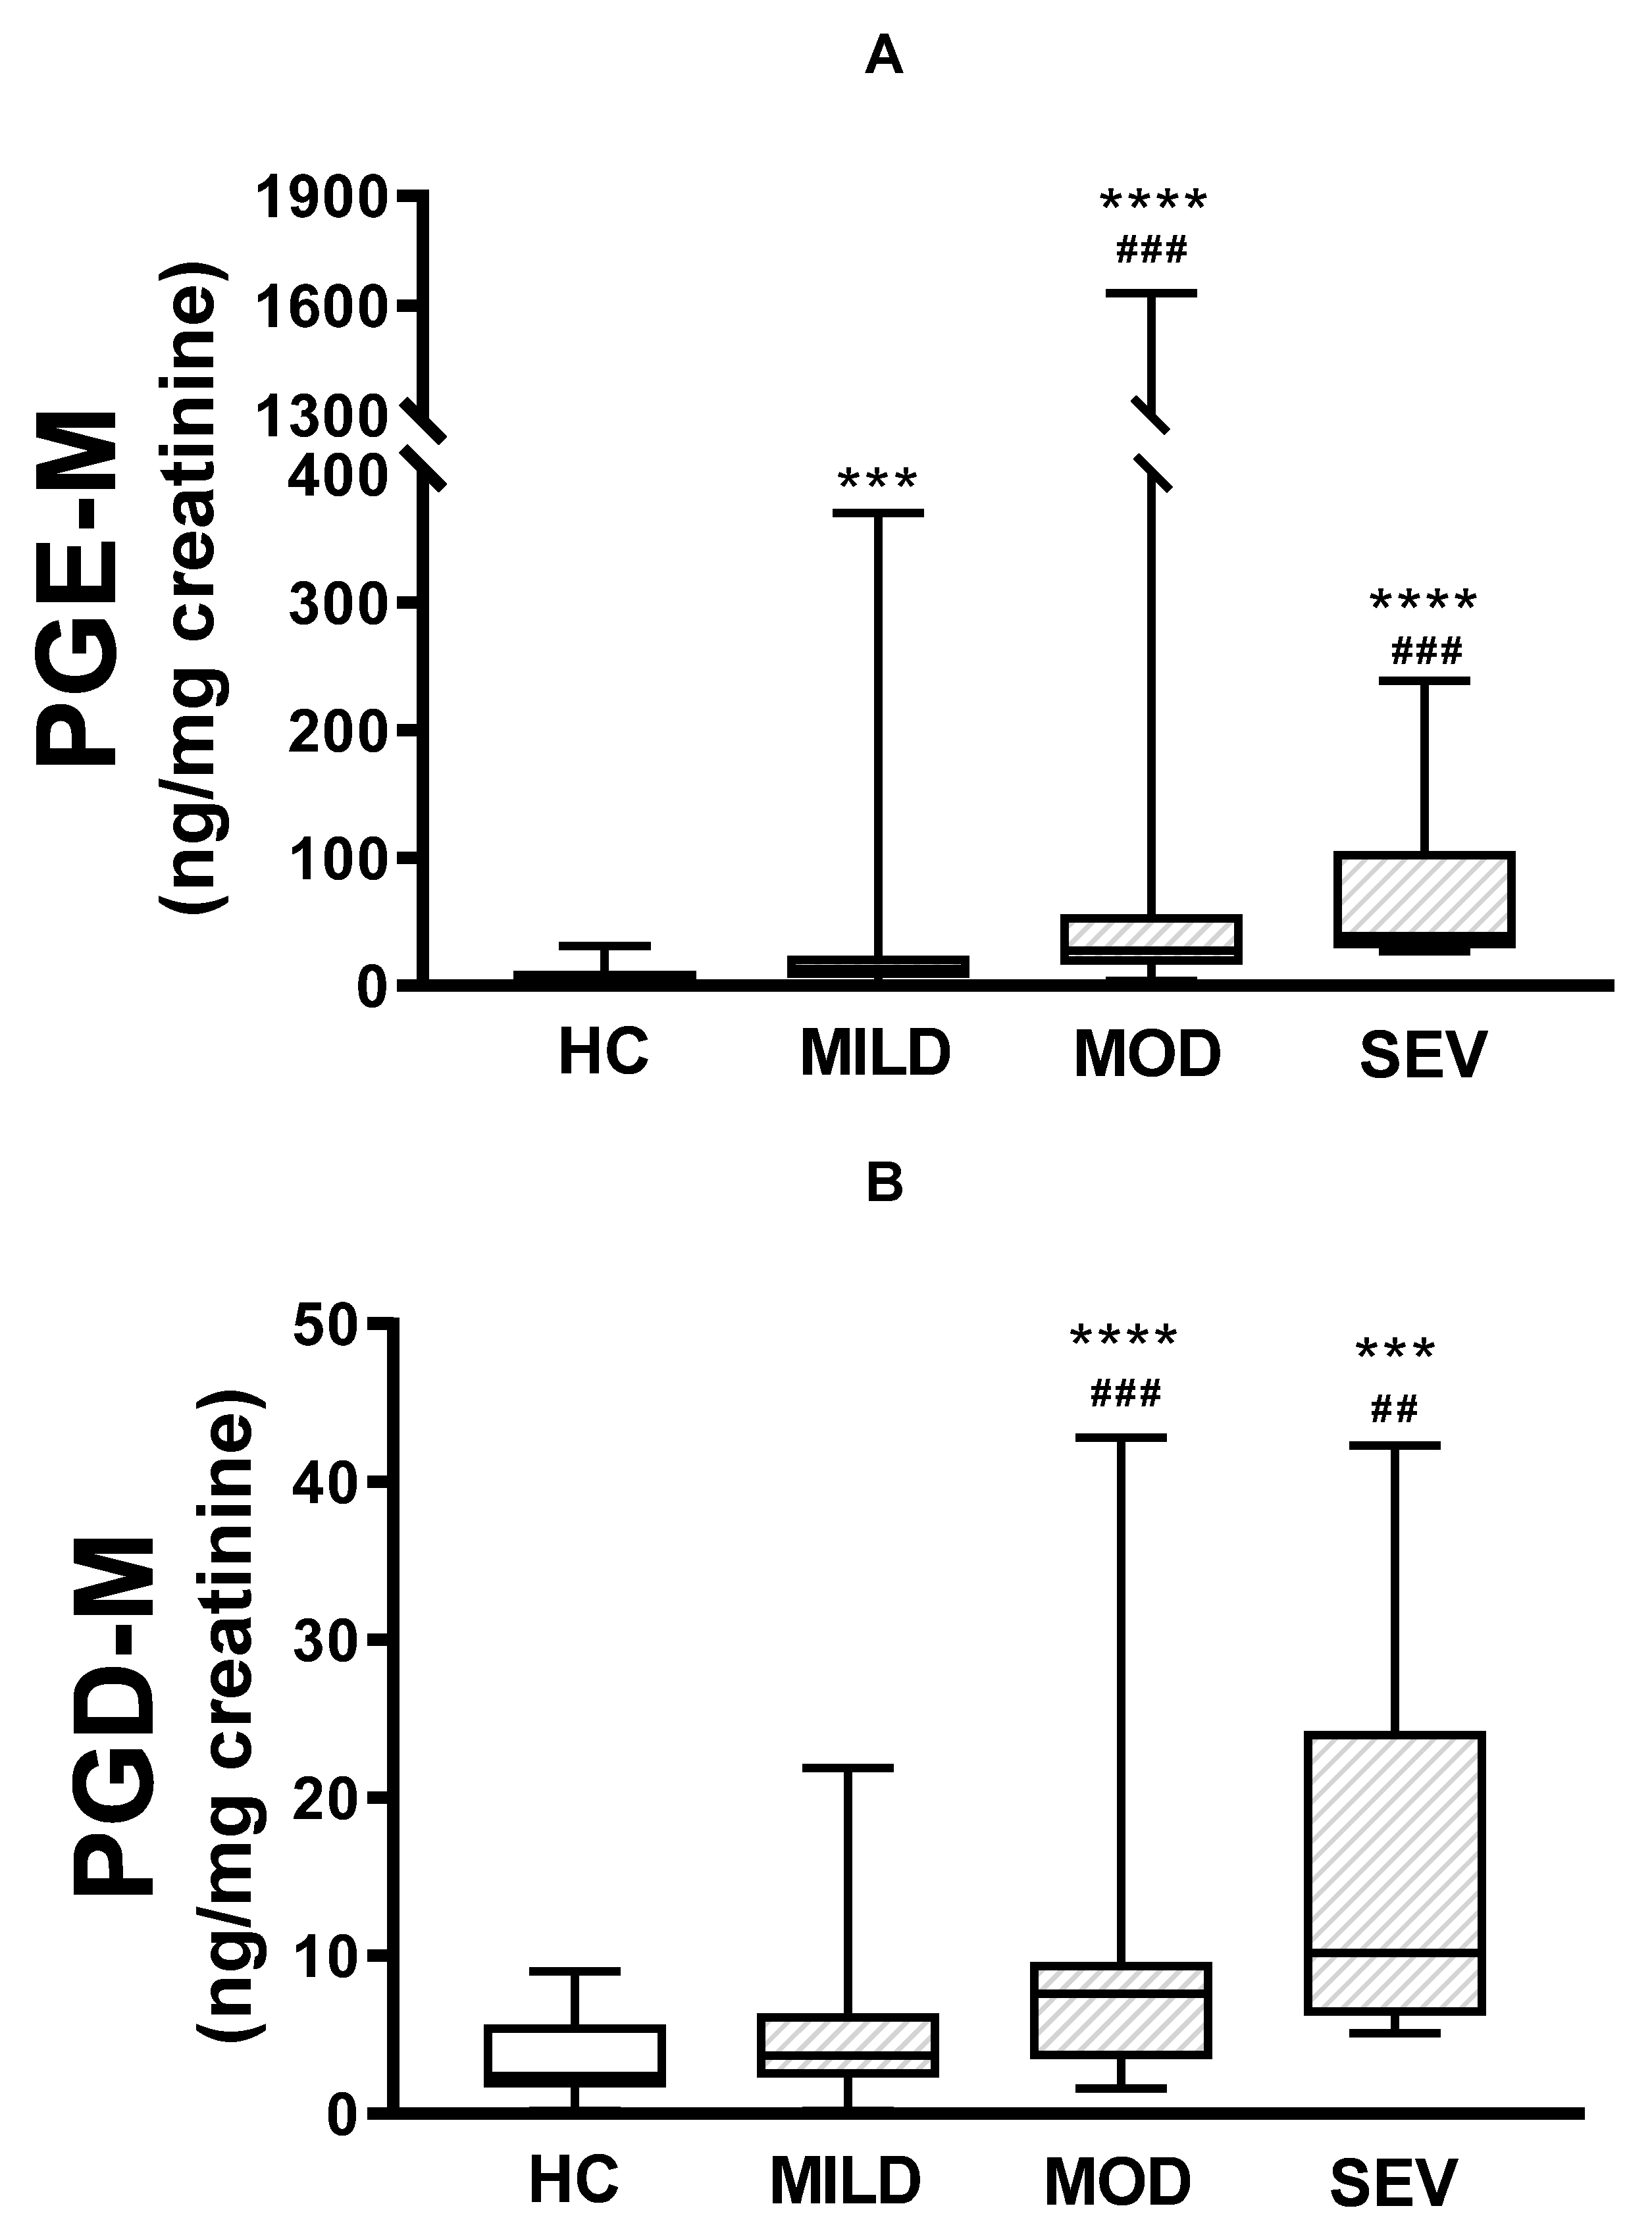
3.1. Urinary PGE-M and PGD-M Levels
3.2. Correlations between Urinary PGE-M and PGD-M Levels and CFTR Gene Mutation Severity
3.3. Correlations between Urinary PGE-M and PGD-M Levels and CF Severity Parameters
3.4. Correlations between Urinary PGE-M and PGD-M levels, Airway Infections, and A Docosahexaenoic (DHA) Supplemented Diet
3.5. Correlation between Prostaglandin Polymorphisms with CF Severity and Urinary Prostaglandin Levels
4. Discussion
Acknowledgements
References
- http://www.genet.sickkids.on.ca/.
- De Boeck, K.; Amaral, M.D. Progress in therapies for cystic fibrosis. Lancet Respir. Med. 2016, 4, 662–674. [CrossRef]
- Ooi CY, Dorfman R, Cipolli M, Gonska T, Castellani C, Keenan K, et al. Type of CFRT mutations determines risk of pancreatitis in patients with cystic fibrosis. Gastroenterology 2011;140:153-161. [CrossRef]
- Kristidis, P.; Bozon, D.; Corey, M.; Markiewicz, D.; Rommens, J.; Tsui, L.C.; Durie, P. Genetic determination of exocrine pancreatic function in cystic fibrosis. 1992, 50, 1178–84.
- Cleveland, R.H.; Zurakowski, D.; Slattery, D.; Colin, A.A. Cystic Fibrosis Genotype and Assessing Rates of Decline in Pulmonary Status. Radiology 2009, 253, 813–821. [CrossRef]
- de Gracia, J.; Mata, F.; Álvarez, A.; Casals, T.; Gatner, S.; Vendrell, M.; de la Rosa, D.; Guarner, L.; Hermosilla, E. Genotype-phenotype correlation for pulmonary function in cystic fibrosis. Thorax 2005, 60, 558–563. [CrossRef]
- Cogen, J.; Emerson, J.; Sanders, D.B.; Ren, C.; Schechter, M.S.; Gibson, R.L.; Morgan, W.; Rosenfeld, M.; for the EPIC Study Group Risk factors for lung function decline in a large cohort of young cystic fibrosis patients. Pediatr. Pulmonol. 2015, 50, 763–770. [CrossRef]
- Gan, K.H.; Geus, W.P.; Bakker, W.; Lamers, C.B.; Heijerman, H.G. Genetic and clinical features of patients with cystic fibrosis diagnosed after the age of 16 years.. Thorax 1995, 50, 1301–1304. [CrossRef]
- Hubert, D.; Bienvenu, T.; Desmazes-Dufeu, N.; Fajac, I.; Lacronique, J.; Matran, R.; Kaplan, J.; Dusser, D. Genotype-phenotype relationships in a cohort of adult cystic fibrosis patients. Eur. Respir. J. 1996, 9, 2207–2214. [CrossRef]
- Borgo G, Gasparini P, Bonizzato A, Cabrini G, Mastella G, Pignatti PF. Cystic fibrosis: The delta508 mutation does not lead to an exceptional severe phenotype. A cohort study. J Pediatr 1993;152:1006-1011. [CrossRef]
- Lai, H.J.; Cheng, Y.; Cho, H.; Kosorok, M.R.; Farrell, P.M. Association between Initial Disease Presentation, Lung Disease Outcomes, and Survival in Patients with Cystic Fibrosis. Am. J. Epidemiology 2004, 159, 537–546. [CrossRef]
- Zielenski, J. Genotype and Phenotype in Cystic Fibrosis. Respiration 2000, 67, 117–133. [CrossRef]
- Cantin, A.M.; Hartl, D.; Konstan, M.W.; Chmiel, J.F. Inflammation in cystic fibrosis lung disease: Pathogenesis and therapy. J. Cyst. Fibros. 2015, 14, 419–430. [CrossRef]
- Verhaeghe, C.; Delbecque, K.; de Leval, L.; Oury, C.; Bours, V. Early inflammation in the airways of a cystic fibrosis foetus. J. Cyst. Fibros. 2007, 6, 304–308. [CrossRef]
- Shrestha, N.; McCarron, A.; Rout-Pitt, N.; Donnelley, M.; Parsons, D.W.; Hryciw, D.H. Essential Fatty Acid Deficiency in Cystic Fibrosis Disease Progression: Role of Genotype and Sex. Nutrients 2022, 14, 4666. [CrossRef]
- Freedman, S.D.; Blanco, P.G.; Zaman, M.M.; Shea, J.C.; Ollero, M.; Hopper, I.K.; Weed, D.A.; Gelrud, A.; Regan, M.M.; Laposata, M.; et al. Association of Cystic Fibrosis with Abnormalities in Fatty Acid Metabolism. New Engl. J. Med. 2004, 350, 560–569. [CrossRef]
- Yang, J.; Eiserich, J.P.; Cross, C.E.; Morrissey, B.M.; Hammock, B.D. Metabolomic profiling of regulatory lipid mediators in sputum from adult cystic fibrosis patients. Free. Radic. Biol. Med. 2012, 53, 160–171. [CrossRef]
- Smith WL, Dewitt DL, Garavito RM. Cyclooxygenases: Structural, cellular and molecular biology. Ann Rev Biochem 2000;69:145-182. [CrossRef]
- Roca-Ferrer, J.; Pujols, L.; Gartner, S.; Moreno, A.; Pumarola, F.; Mullol, J.; Cobos, N.; Picado, C. Upregulation of COX-1 and COX-2 in nasal polyps in cystic fibrosis. Thorax 2006, 61, 592–596. [CrossRef]
- O’connor, M.G.; Thomsen, K.; Brown, R.F.; Laposata, M.; Seegmiller, A. Elevated prostaglandin E metabolites and abnormal plasma fatty acids at baseline in pediatric cystic fibrosis patients: a pilot study. Prostaglandins, Leukot. Essent. Fat. Acids 2016, 113, 46–49. [CrossRef]
- Jabr, S.; Gartner, S.; Milne, G.L.; Roca-Ferrer, J.; Casas, J.; Moreno, A.; Gelpí, E.; Picado, C. Quantification of major urinary metabolites of PGE2 and PGD2 in cystic fibrosis: Correlation with disease severity. Prostaglandins, Leukot. Essent. Fat. Acids 2013, 89, 121–126. [CrossRef]
- Medjane S, Raymon B, Wu Y, Touqui L. Impact of CFTR delta508 mutation on prostaglandin E2 production and type IIA phospholipase A2 expression by pulmonary epithelial cells. Am J Physiol Lung Cell Mol Physiol 2005;289:L816-L824. [CrossRef]
- Chen J, Jiang XH, Chen H,Guo JH, Tsang LL, Yu MK, et al. CFRT negatively regulates cyclooxygenase-2-PGE2 positive feedback loop in inflammation. J Cell Physiol 2012;227:2759-2766. [CrossRef]
- Borot F, Vieu DV, Faure G, Fritsch J, Colas J, Moriceau.S Eicosanoid Release Is Increased by Membrane Destabilization and CFTR Inhibition in Calu-3 Cells. PLoS One. 2009; 4(10): e7116. [CrossRef]
- Seegmiller, A.C. Abnormal Unsaturated Fatty Acid Metabolism in Cystic Fibrosis: Biochemical Mechanisms and Clinical Implications. Int. J. Mol. Sci. 2014, 15, 16083–16099. [CrossRef]
- Kunzelmann, K.; Mehta, A. CFTR: a hub for kinases and crosstalk of cAMP and Ca2+. FEBS J. 2013, 280, 4417–4429. [CrossRef]
- Czerska, K.; Sobczyńska-Tomaszewska, A.; Sands, D.; Nowakowska, A.; Bąk, D.; Wertheim, K.; Poznański, J.; Zielenski, J.; Norek, A.; Bal, J. Prostaglandin-endoperoxide synthase genesCOX1 andCOX2 — novel modifiers of disease severity in cystic fibrosis patients. J. Appl. Genet. 2010, 51, 323–330. [CrossRef]
- Alonso, M.J.; Heine-Suñer, D.; Calvo, M.; Rosell, J.; Giménez, J.; Ramos, M.D.; Telleria, J.J.; Palacio, A.; Estivill, X.; Casals, T. Spectrum of Mutations in the CFTR Gene in Cystic Fibrosis Patients of Spanish Ancestry. Ann. Hum. Genet. 2006, 71, 194–201. [CrossRef]
- Anderson CM. Hypothesis revisited. Cystic fibrosis: A disturbance of water and electrolyte movement of exocrine secretory tissue associated with altered prostaglandin (PGE2) metabolism. J Pediatric Gastroenterol Nutrition 1984;3:15-22.
- A de Jong, P.; Lindblad, A.; Rubin, L.; Hop, W.C.J.; de Jongste, J.C.; Brink, M.; Tiddens, H.A.W.M. Progression of lung disease on computed tomography and pulmonary function tests in children and adults with cystic fibrosis. Thorax 2005, 61, 80–85. [CrossRef]
- Bush, A.; Sly, P.D. Evolution of cystic fibrosis lung function in the early years. Curr. Opin. Pulm. Med. 2015, 21, 602–608. [CrossRef]
- McMahon, M.A.; Chotirmall, S.H.; McCullagh, B.; Branagan, P.; McElvaney, N.; Logan, P. Radiological abnormalities associated with Aspergillus colonization in a cystic fibrosis population. Eur. J. Radiol. 2012, 81, e197–e202. [CrossRef]
- Loeve M, Gerbrandts K, Hop WC, Rosenfield M, Hartman IC, Tiddens HAl. Bronchiectasis and pulmonary exacerbations in children and young adults with cystic fibrosis. Chest 2011;140:178-185. [CrossRef]
- Loeve, M.; van Hal, P.T.W.; Robinson, P.; A de Jong, P.; Lequin, M.H.; Hop, W.C.; Williams, T.J.; Nossent, G.D.; A Tiddens, H. The spectrum of structural abnormalities on CT scans from patients with CF with severe advanced lung disease. Thorax 2009, 64, 876–882. [CrossRef]
- Tepper, L.A.; Utens, E.M.; Caudri, D.; Bos, A.C.; Gonzalez-Graniel, K.; Duivenvoorden, H.J.; van der Wiel, E.C.; Quittner, A.L.; Tiddens, H.A. Impact of bronchiectasis and trapped air on quality of life and exacerbations in cystic fibrosis. Eur. Respir. J. 2013, 42, 371–379. [CrossRef]
- Horati, H.; Janssens, H.M.; Margaroli, C.; Veltman, M.; Stolarczyk, M.; Kilgore, M.B.; Chou, J.; Peng, L.; Tiddens, H.A.; Chandler, J.D.; et al. Airway profile of bioactive lipids predicts early progression of lung disease in cystic fibrosis. J. Cyst. Fibros. 2020, 19, 902–909. [CrossRef]
- O’Connor, M.G.; Seegmiller, A. The effects of ivacaftor on CF fatty acid metabolism: An analysis from the GOAL study. J. Cyst. Fibros. 2016, 16, 132–138. [CrossRef]


| FVC, % pred (n=93) | 104.1±1.8 |
| FEV1, % pred (n=93) | 94.3±2.3 |
| Pancreatic insufficiency, (n=103) % | 70 (68%) |
| Severity of the CFTR gene mutation (n=101): | |
| Mild, % | 28.7% |
| Moderate, % | 6.9% |
| Severe, % | 64.4% |
| Clinical severity (n=101): | |
| Mild, % | 64.4% |
| Moderate, % | 29.7% |
| Severe, % | 5.9% |
| Bronchiectasis, (n=102) % | 45(44%) |
| Air Trapping (n=92) % | 64(69.%) |
| Data presented as mean±SEM or percentage. FVC, forced vital capacity; pred, predicted; FEV1, forced expiratory volume in 1 s; CFTR, cystic fibrosis transmembrane conductance regulator | |
| F508del homozygote, n (%) | 19 (18.4%) |
| F508del heterozygote, n (%) | 59 (57.3%) |
| Other mutations, n (%) | 25 (24.3%) |
Disclaimer/Publisher’s Note: The statements, opinions and data contained in all publications are solely those of the individual author(s) and contributor(s) and not of MDPI and/or the editor(s). MDPI and/or the editor(s) disclaim responsibility for any injury to people or property resulting from any ideas, methods, instructions or products referred to in the content. |
© 2024 by the authors. Licensee MDPI, Basel, Switzerland. This article is an open access article distributed under the terms and conditions of the Creative Commons Attribution (CC BY) license (http://creativecommons.org/licenses/by/4.0/).


