1. Introduction
Strobilurin (or strobin) fungicides were first registered for use on agricultural crops in the USA in 1997 [
1]. Strobilurins typically are applied to a variety of crops, including maize, soybean, wheat, oats, alfalfa, and various vegetables. Unlike other fungicides, strobilurins are most effective when used preventatively on crops rather than as a treatment for established fungal infections [
2], inhibiting mitochondrial respiration in fungi through binding to the bc1 cytochrome enzyme complex [
3].
Since development, applications of strobilurin fungicides have increased significantly in the United States, especially on maize, soybean, and wheat crops, with 25 to 30% of croplands being treated [
4]. In Minnesota, strobilurin use has increased 30-fold since 2001 [
5]. Its use on maize and soybeans has increased yields by 5 to 20% [
6,
7]. Strobilurins typically are applied as either a seed coating or as a spray onto growing plants [
8,
9]. Application may occur several times per growing season, but because they are relatively stable, strobilurins can persist in the soil for several months or more [
10], potentially providing crop protection with only a single, yearly application [
11].
Despite their beneficial roles in crop protection and yield enhancement, strobilurins may be harmful to aquatic organisms if they are transported off-site. Although strobilurins have minimal water solubility and sorb strongly to soils and organic matter, they have a potential to reach surface waters via runoff and soil transport for several months after application [
10,
11]. Recently, various strobilurins have been detected in aquatic systems worldwide at concentrations ranging from <1 ng/L to 30 µg/L [
11,
12,
13,
14,
15,
16,
17]. The upper portion of this concentration range overlaps with the toxicological benchmarks for several aquatic organisms (96-hour LC
50 values ranging from 3 to 1100 µg/L) [
18,
19,
20,
21,
22,
23], suggesting that some aquatic organisms may be at risk from fungicide runoff.
Studies of strobilurins in streams and rivers generally have focused on concentrations measured during normal or base-flow conditions [
12]. Dissolved strobilurin concentrations in streams during stormflow events, when large quantities of eroded soils may be in transport, have not been examined adequately. Increasing use of strobilurin fungicides, coupled with increased frequencies of severe storms and associated runoff and flooding related to climate change [
24], suggest that the potential toxic risk of these fungicides to aquatic ecosystems may be increasing [
25]. Consequently, this study was designed to examine the effects of precipitation and stormflows on the detection and concentrations of dissolved strobilurin fungicides in a system of coldwater trout streams draining an agricultural watershed. Fungicides may have contributed to a post-storm event fish kill in this system during summer 2015, which killed an estimated 2,900 brown (
Salmo trutta) and rainbow trout (
Oncorhynchus mykiss) and nearly 10,000 fish overall [
26]. We tested hypotheses that included: 1) dissolved strobilurin fungicide concentrations would be higher in proximity to agricultural lands compared to woodland areas; 2) strobilurins would be detected only during periods centered on the timing of fungicide applications to crops; 3) strobilurin concentrations would increase during stormflow events; and 4) predictive models could be developed connecting precipitation levels, stream stormflows, and strobilurin concentrations.
2. Study Area
The Whitewater River watershed encompasses 830 km
2 within the Paleozoic Plateau (or Driftless Area) ecoregion of southeastern Minnesota, USA. The watershed has been an important agricultural area for >160 years, where fertile, loess soils overlie ancient (>100,000 ybp) glacial till [
27]. The region is most characterized by its rugged topography, and ancient landscape preserved when Wisconsinan glaciers missed the region. Meltwaters from Pleistocene (2.6 million to 11,700 ypb) glaciation deeply dissected the plateau carving steep-sided valleys with distinct ridges along the Mississippi River and its tributary valleys [
28]. The area’s rich soils, within the transition zone between hardwood forests and tallgrass prairies support a diverse agricultural landscape of grain crops and livestock grazing [
29]. Current watershed land use is dominated by croplands (45%), pastures (27%), and woodlands (21%).
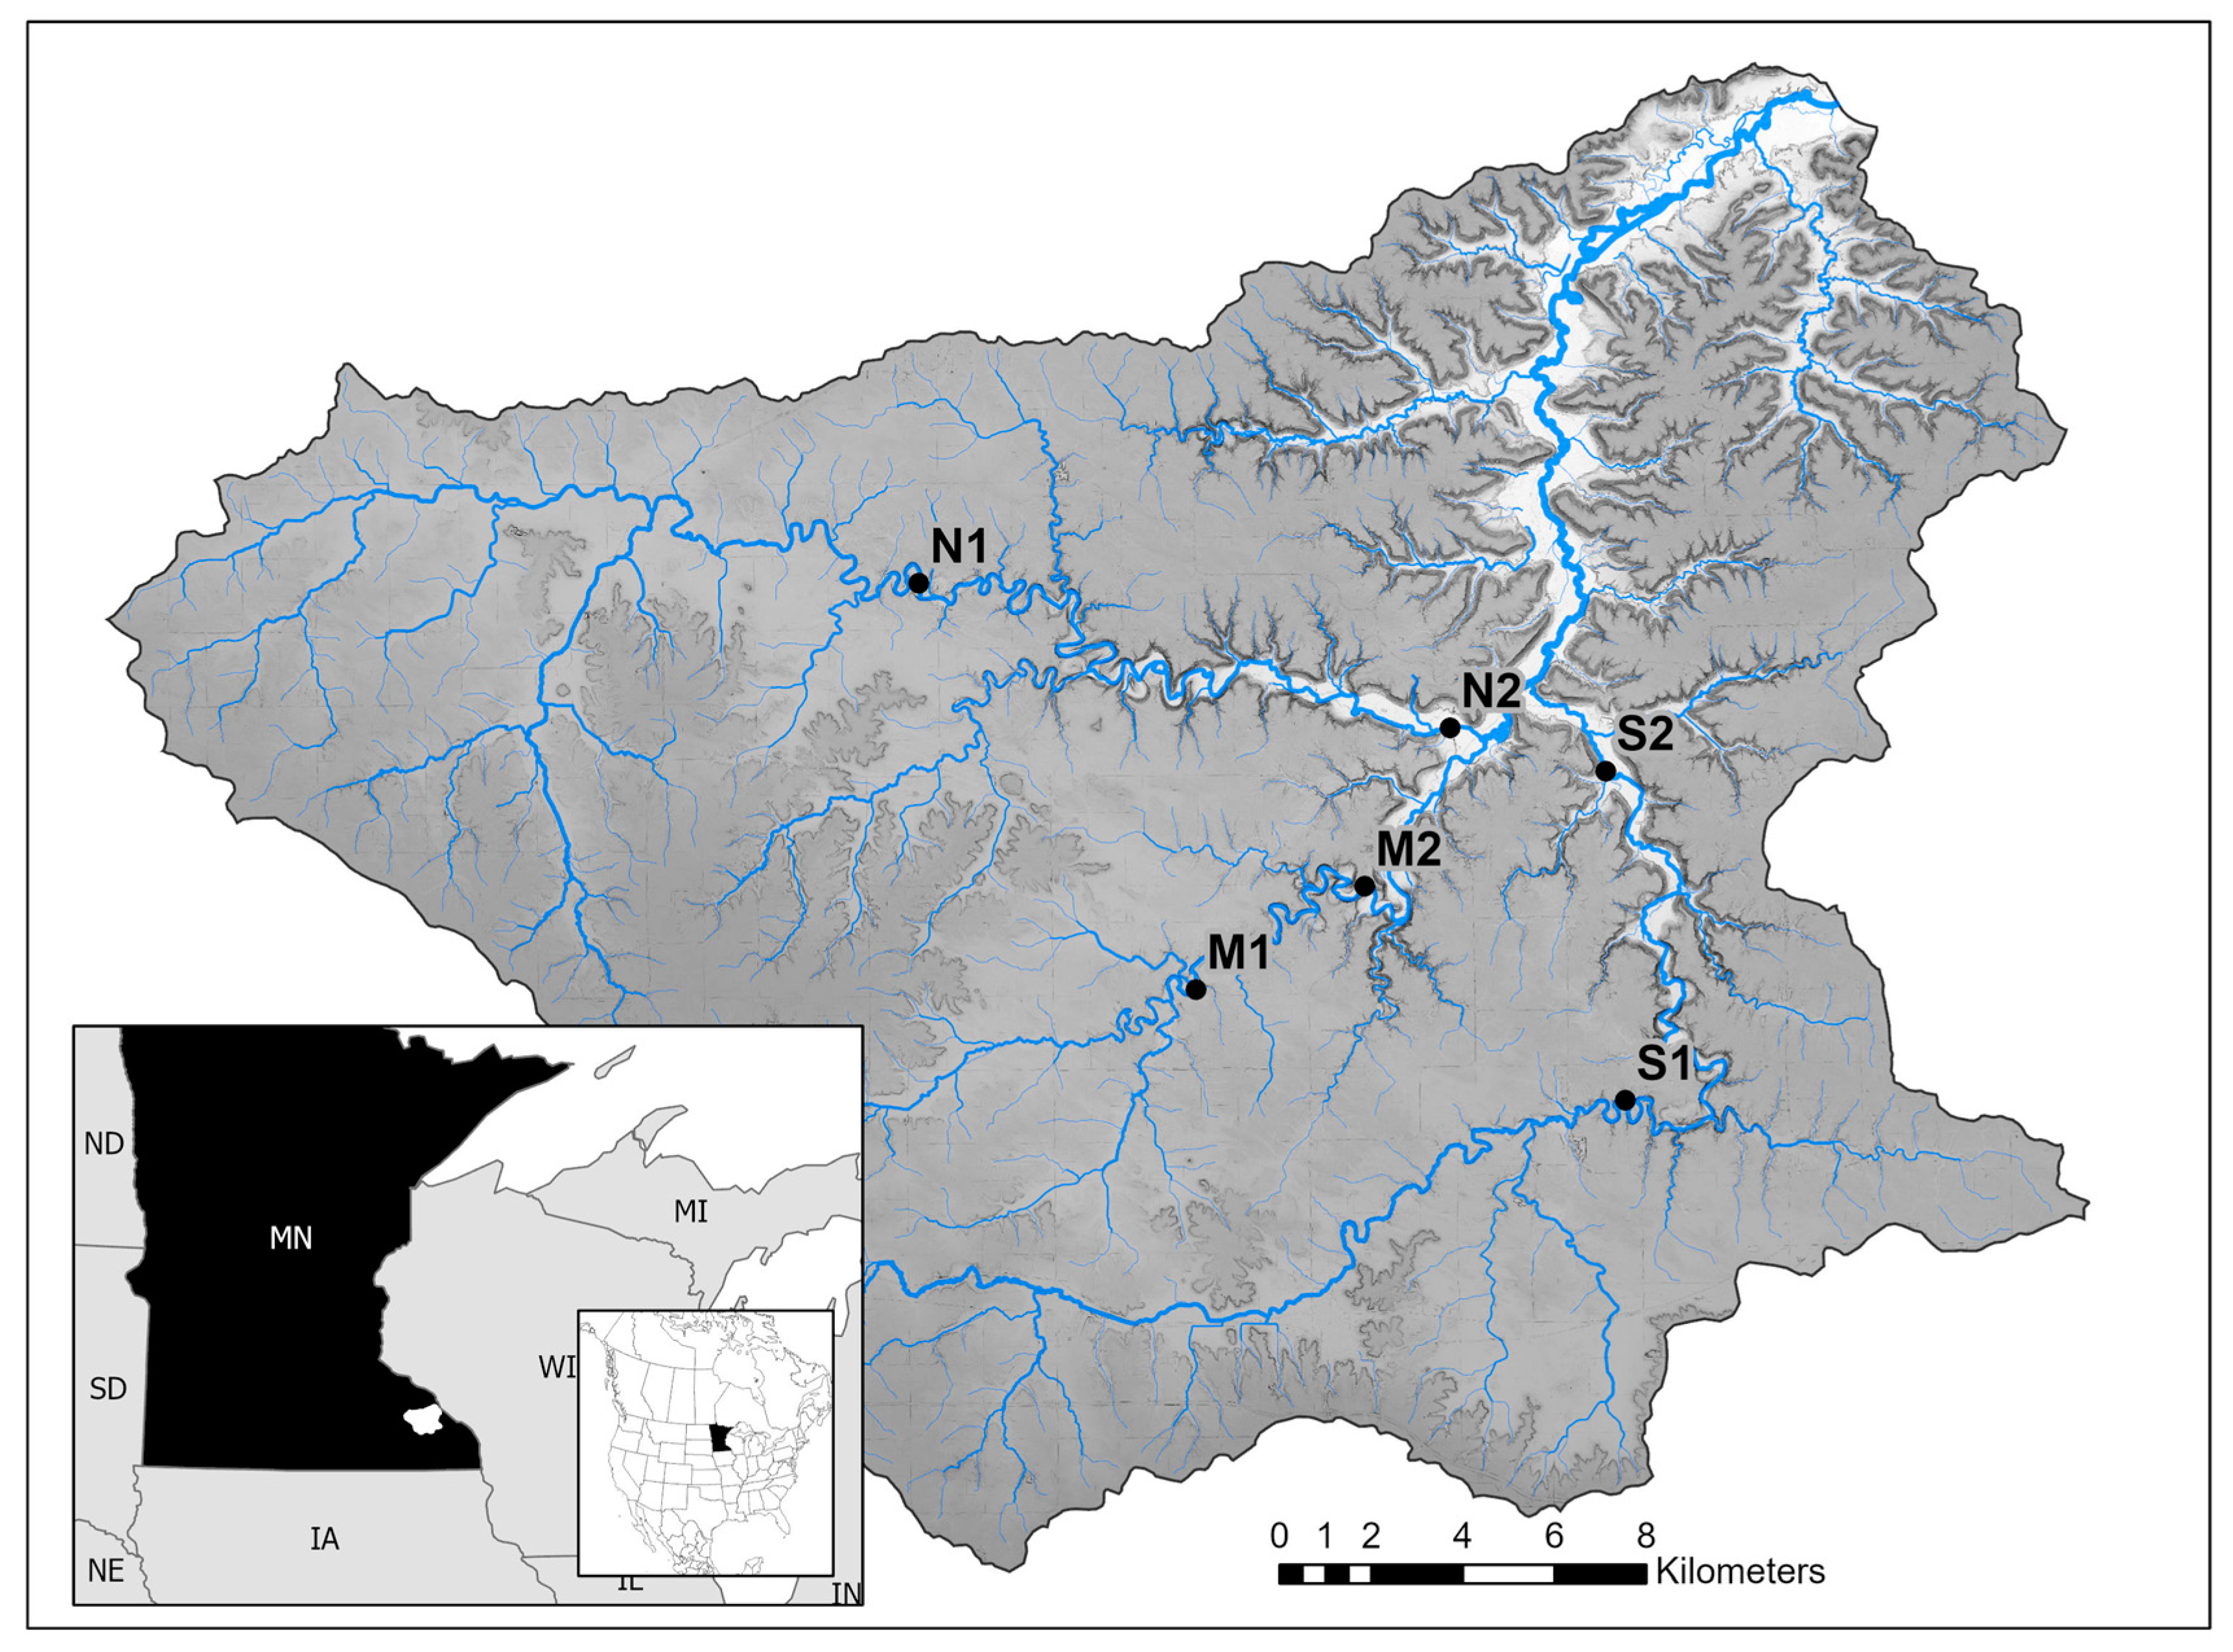
The watershed is drained primarily by three forks of the Whitewater River (North, Middle, South) that originate in rolling agricultural land before descending 168 m in elevation through wooded hillsides to unite and form the Whitewater River mainstem, which then flows into the Mississippi River (
Figure 1). All three forks gradually transition from runoff-dominated coolwater/warmwater systems in their upper, agriculture-dominated reaches to spring-fed coldwater streams in their wooded lower reaches. The entire watershed is underlain by limestone-based karst geology.
A network of six water quality sampling stations (each consisting of a multi-parameter sonde, pressure transducer, automated water sampler, and weather station) were established in the Whitewater River system, with two stations (upstream, downstream) located on each stream fork (
Figure 1). Upstream stations were located immediately downstream from most agricultural lands along each river fork, whereas downstream stations were in woodland areas slightly upstream from the confluence of the three forks. Monitoring stations served the dual purpose of gathering continuous water quality data (e.g., temperature, conductivity, turbidity, pH, stage height) and collecting multiple water samples when triggered during stormflow events.
3. Methods and Materials
3.1. Fungicide applications
To understand the extent and timing of fungicide applications in the Whitewater River watershed, we interviewed several regional pesticide dealers/commercial applicators (mostly associated with farm cooperatives) and a canning company that serviced the area to obtain information on how fungicides were used in the watershed and general estimates on what proportions of various crops were treated. According to Minnesota Statute 18B.37 [
30], commercial and noncommercial applicators of pesticides are required to keep records of the date, time, location, rate of application, number of units treated, pesticide registration number, and pesticide brand. Records must be created within five days of application and maintained by the applicator or company for five years. However, those records are private data which are only collected upon request of the state agricultural commissioner, which typically occurs only during official investigations. Area farm cooperatives were willing to provide general fungicide application information, in lieu of the private data.
3.2. Sample collections
At each monitoring station, an ISCO 3700 automated water sampler was used to collect stream water samples throughout stormflow events. Stations were variously set to trigger on elevated turbidity (150 to 250 NTUs) [
31] or river stage height based on location-specific responses to storm events, or stations were triggered manually based on weather forecasts. Once sampling was initiated, stations were programmed to collect 1-L samples each hour for 24 hours in polypropylene bottles. Before deployment, bottles were cleaned by sequential overnight soaks in detergent and 1 M hydrochloric acid, each followed rinsing with deionized water, and finally autoclaving. Baseflow samples were collected in a similar manner via manual triggering of samplers.
Only select samples collected from a given station/stormflow event were targeted for analysis. Based on the stream hydrograph recorded for an event at a given station, samples (one each) from the rising limb, peak, and falling limb of the storm event hydrograph were chosen for fungicide analysis. Three similar samples were selected at each site to be analyzed for routine water quality analyses (nitrates, ammonia, total phosphorus, total suspended solids [TSS], and
E. coli). Due to sampler trigger failures and short hydrographs during some storm events, optimal sample selection was not always achieved. All samples were stored on ice in the dark and delivered to labs for testing (same day delivery to Winona State University for routine water quality analyses, within 48 hours to the University of Minnesota for fungicide analyses). Analyses for nitrates, ammonia, total phosphorus, TSS, and
E. coli followed standard laboratory procedures for these variables [
32,
33,
34].
3.3. Sample preparation and extraction for fungicide analysis
Upon delivery of water samples to the lab for fungicide analysis, they were filtered through pre-weighed EMD MilliporeTM AP4004700 microfiber glass filters (pre-combusted at 550 °C) to separate solids from the water portion of the sample. While the fungicides could be sorbed to suspended particles, we focused on the dissolved fraction, which is the most readily bioavailable and likely drives any toxicity concerns. Water sample volume was measured (nearest 1 mL) and each sample was spiked with d3-pyraclostrobin to serve as a surrogate standard. Method blanks of ultrapure water and spike and recovery samples were run with each sample batch. Spike and recovery samples were created by adding stock solutions of strobilurins into ultrapure water, which were then processed via the normal sample extraction procedure, as were method blanks. Method blanks were only ultrapure water to allow for the detection of any contamination during the extraction process. Samples, method blanks, and spike and recovery samples were then extracted through preconditioned (10 mL methanol, 10 mL ethyl acetate, 5 mL ultrapure water) Waters Oasis HLB 6cc Vac Cartridges (200 mg sorbent per cartridge) at a rate of 10 mL/min or less. Cartridges were then dried under vacuum, wrapped in foil, and stored at 4°C until extraction.
Before elution, each cartridge was rinsed with two, 5-mL fractions of 50:50 methanol:water to help mitigate possible matrix effects. This 50:50 solution was demonstrated to not elute the desired strobilurins. Cartridges were eluted with 12 mL of ethyl acetate spiked with d10- acenaphthene (to serve as internal standard) at 0.4 μg/L. Elutions were then evaporated down to a volume of ~200 μL using nitrogen. The internal standard was added to the extraction solvent because each sample was not evaporated down to the exact same volume. The small, concentrated volume of the volatile solvent was difficult to measure accurately, and the internal standard allowed for corrections for volume differences.
Extracts were placed into GC vials with inserts and analyzed via gas chromatography-mass spectrometry (GC-MS) using an Agilent 6890 gas chromatograph with a 5973 mass spectrometer (Hewlett-Packard 5MS column 30 m length, inner diameter 0.25 mm, film thickness 0.25 μm). Details of the GC-MS method are described elsewhere [
35]. Two instrument blanks of ethyl acetate were run between samples due to observed carryover issues. The liner was changed twice during the period of analyses to help prevent contamination. A calibration curve was generated during each run using six standard points for each of the five strobilurins examined: azoxystrobin, fluoxastrobin, picoxystrobin, pyraclostrobin, and trifloxystrobin. Limits of detection (LODs) were determined as the lowest concentration usable in a linear calibration curve [
36]. The method reporting limits (MRLs) were determined as the concentrations observed in the method blanks. All LODs and MRLs for samples are described in O’Connor [
35]. Final concentrations were not adjusted for recoveries to serve as minimum estimations. Details of the analysis method and recoveries are described in O’Connor [
35].
3.4. Chemical sources and purity
Acenaphthene-d10 was purchased from Santa Cruz Biotechnology, Inc. Azoxystrobin PESTANAL® (analytical standard), fluoxastrobin PESTANAL® (analytical standard), picoxystrobin PESTANAL® (analytical standard), pyraclostrobin PESTANAL® (analytical standard), trifloxystrobin PESTANAL® (analytical standard), pyraclostrobin-(n-methoxy-d3), and ethyl acetate (≥99.7%) were purchased from Sigma Aldrich. Acetonitrile (HPLC grade) was purchased from Fisher Chemical. Ultrapure water (18.2 MΩ·cm) was produced by a Milli-Q Academic system (Millipore).
3.5. Sample concentration calculations
If identified by retention time and mass spectra, each peak area in standards and samples was divided by internal standard area. The area ratio of any peaks observed in the method blank corresponding to that batch of samples (samples taken within the same 24-48 hours) was then subtracted from the sample area ratio to account for any carryover and contamination. If this subtraction resulted in a negative number, the results were set to below the method reporting limit, or BMRL. This corrected ratio was then used with the calibration curve from the run to determine the strobilurin concentrations in the concentrated extracts.
3.6. Data analyses
A series of simple statistical tests were used to examine general water quality and strobilurin concentrations within the Whitewater River system. For general water quality parameters (ammonia, nitrate, total phosphorus, TSS, E. coli counts), baseflow and stormflow values were compared using a series of non-parametric, two-tailed Mann-Whitney tests. For all tests examining strobilurin concentrations, data for each of the five strobilurins were analyzed separately, and tests were conducted in two ways: with BMRL samples excluded, and with BMRL samples set to 1⁄2 MRL (for t-tests and Kruskal-Wallis tests) or 0 (for Wilcoxon signed-ranks tests).
Two-tailed t-tests were used to test for possible differences in fungicide concentrations between baseflow and stormflow samples. Separate tests were conducted for each of the five strobilurins examined. All baseflow samples from all forks and dates were compared to all stormflow samples from all forks and dates to test the hypothesis that strobilurin concentrations in stream water increased during stormflow events.
Non-parametric Kruskal-Wallis tests were used to compare strobilurin concentrations among rising-limb, peak, and falling-limb stormflow samples. Separate tests were conducted for each of the five strobilurins examined, to determine if stormflows produced a consistent pattern in strobilurin concentrations across different stages of the stormflow hydrograph.
Finally, non-parametric Wilcoxon signed-ranks tests for paired samples were used to compare strobilurin concentrations between upstream and downstream locations within each fork for each strobilurin. This allowed us to test the hypothesis that strobilurin concentrations would be higher in streams near agricultural lands (upstream sites) than in streams near woodlands (downstream sites).
5. Discussion
Our study demonstrated the regular presence of strobilurin fungicides in water samples collected from all forks of the Whitewater River in southeastern Minnesota, USA, throughout the agricultural growing season (May–October) of 2019. Interviews with local pesticide dealers/applicators indicate that fungicide use on agricultural crops (e.g., alfalfa, maize, soybean) has been expanding within the region for many years, with most use concentrated during two time periods (May–early June, mid-July–August) and aimed at boosting productivity rather than treating known fungicide outbreaks. The decision on whether to apply fungicides on croplands in the Whitewater River watershed comes down to cost for many producers. While fungi are common crop pests elsewhere in the USA, widespread devastating fungal infections are not common in Minnesota crops. Therefore, fungicides were not used in the Whitewater watershed as insurance against large crop loss, but instead were used to boost yield. Area pesticide dealer/applicators stated that regional crop producers had observed that soybeans displayed a consistent, positive yield return after fungicide application, and more producers planned to use them each year [
38,
39]. Financial returns from applying fungicides to field maize have been more difficult to decipher because there is a higher cost of application and a variable impact on yield. However, with reports of strobilurins increasing yields by up to 25 bushels/acre (or 1680 kg/hectare), or a 12% increase from the state average yield [
39,
41], the application to maize continues to increase.
Detectable concentrations of one or more fungicides were present in the majority of water samples examined, during both baseflow conditions and stormflow events, suggesting that fungicides have a constant presence in the watershed during the growing season. Different strobilurins do not all respond in the same way to rain events, but concentrations of some strobilurins apparently can increase to potentially toxic levels in streams during and after rainfall, highlighting a potential hazard for aquatic life now and into the future if fungicide use continues to increase. Future work also should evaluate the suspended sediment, which may carry and release these fungicides. These materials, after settling, also may serve as a source of strobilurins to the overlying water during baseflow conditions.
The presence of strobilurin fungicides in Whitewater River water samples throughout the 2019 agricultural growing season was not unexpected. The sale and use of strobilurins for agriculture have expanded dramatically in the United States during the past 25 years, and southeastern Minnesota watersheds lie within the region experiencing the highest use [
42]. Despite their low solubilities in water [
35], the five strobilurins examined in our study are classified as slightly to moderately mobile [
43] based on their soil adsorption coefficients (2.63–3.96 log K
oc) [
44,
45,
46,
47,
48]. Consequently, they have the potential for leaching into groundwater and/or running off into surface waters from fields to which they are applied [
49].
Slight differences in mobility and adsorption coefficients among the strobilurin fungicides examined [
49,
50,
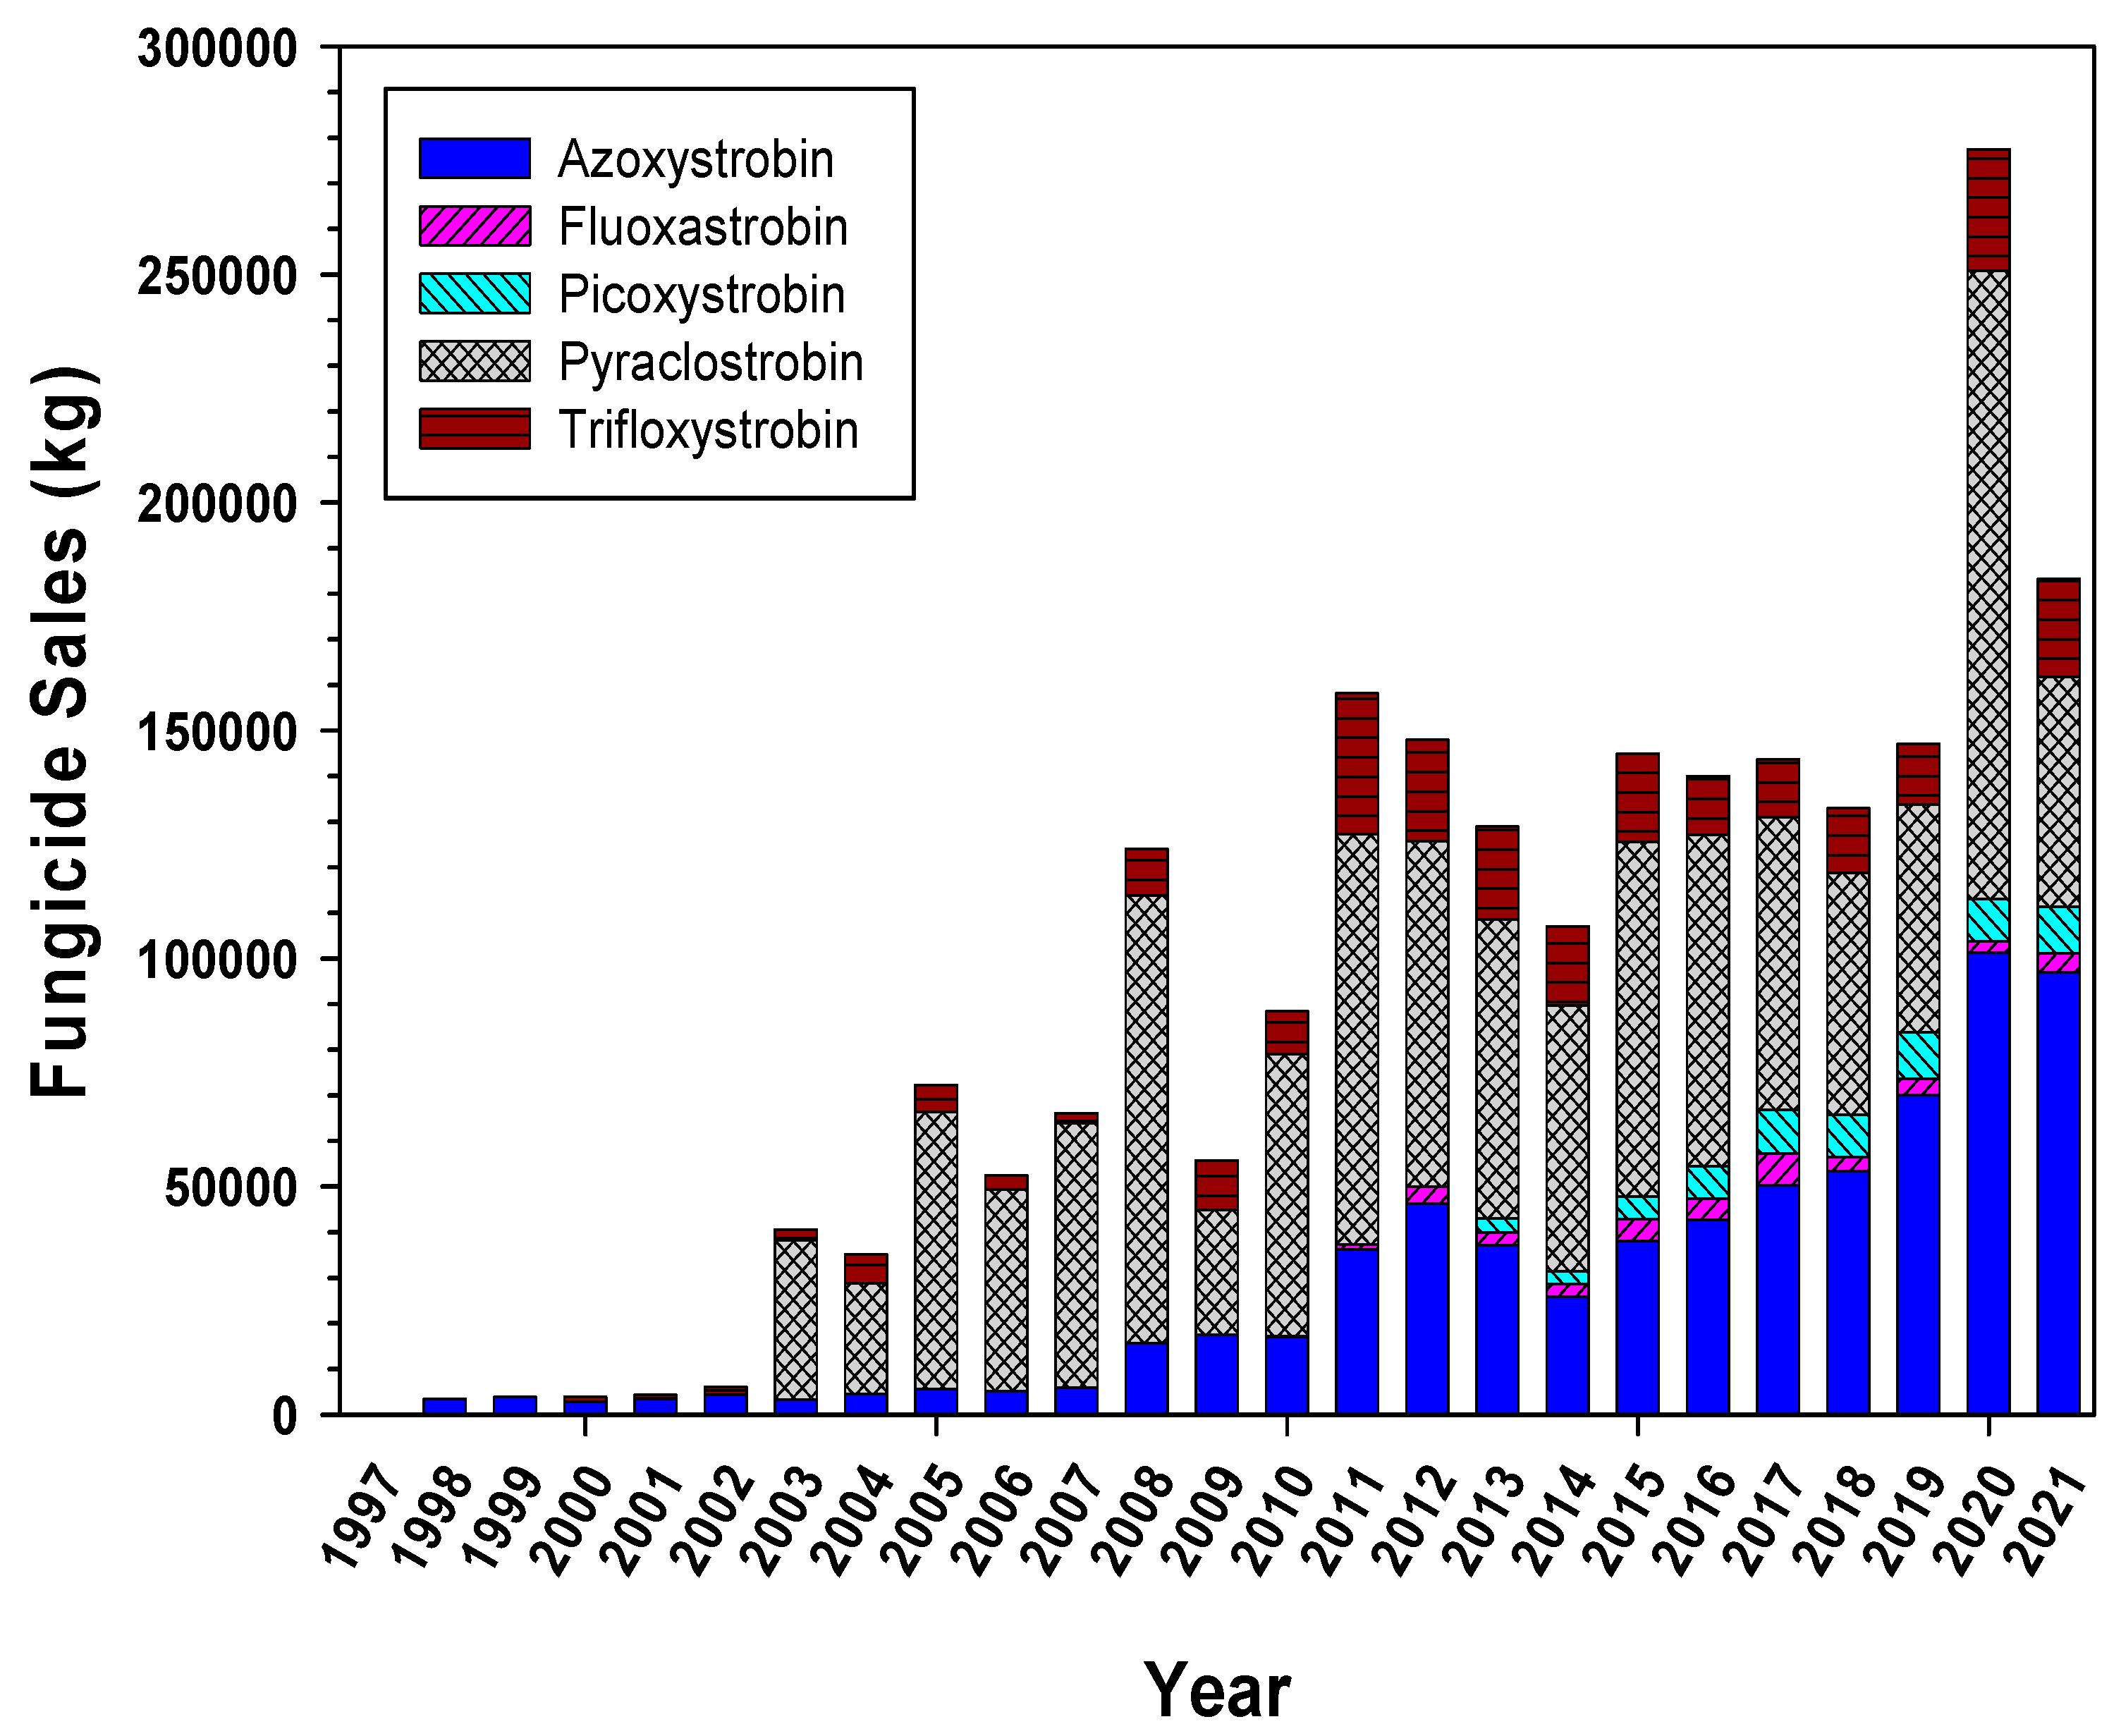
51], along with the quantities of strobilurins sold, may help explain their differing detection frequencies in Whitewater River water samples. Pyraclostrobin and azoxystrobin have been the most heavily applied (kg/year) strobilurin fungicides in Minnesota since 2003 (
Figure 2) [
52] and also displayed the highest detection frequencies in our study and in the Minnesota Department of Agriculture water quality portal records for the Whitewater River [
53]. In contrast, trifloxystrobin ranked number 3 in sales in Minnesota, but had the fewest detections of any of the strobilurins tested. Azoxystrobin is the most water soluble, pyraclostrobin is intermediate in solubility, and trifloxystrobin is the least water soluble of those strobilurins examined [
35]. Pyraclostrobin and trifloxystrobin also have higher soil adsorption coefficients than azoxystrobin [
44,
45,
48]. Taken together, these factors potentially explain the observed differences in detection frequencies in our water samples.
Concentrations of three of the five strobilurins examined in our study (azoxystrobin, pyraclostrobin, trifloxystrobin) were consistent with previously reported concentrations of these strobilurins in other aquatic environments [
11,
12,
13,
14,
15,
16,
17,
25], whereas there are few reports of the remaining two strobilurins (fluoxastrobin, picoxystrobin) in environmental samples [
54]. Similar to our results, previous reports span conditions from baseflow conditions during dry periods to runoff during and after storm events. As in our study, maximum concentrations reported previously for azoxystrobin, pyraclostrobin, and trifloxystrobin all occurred during storm events [
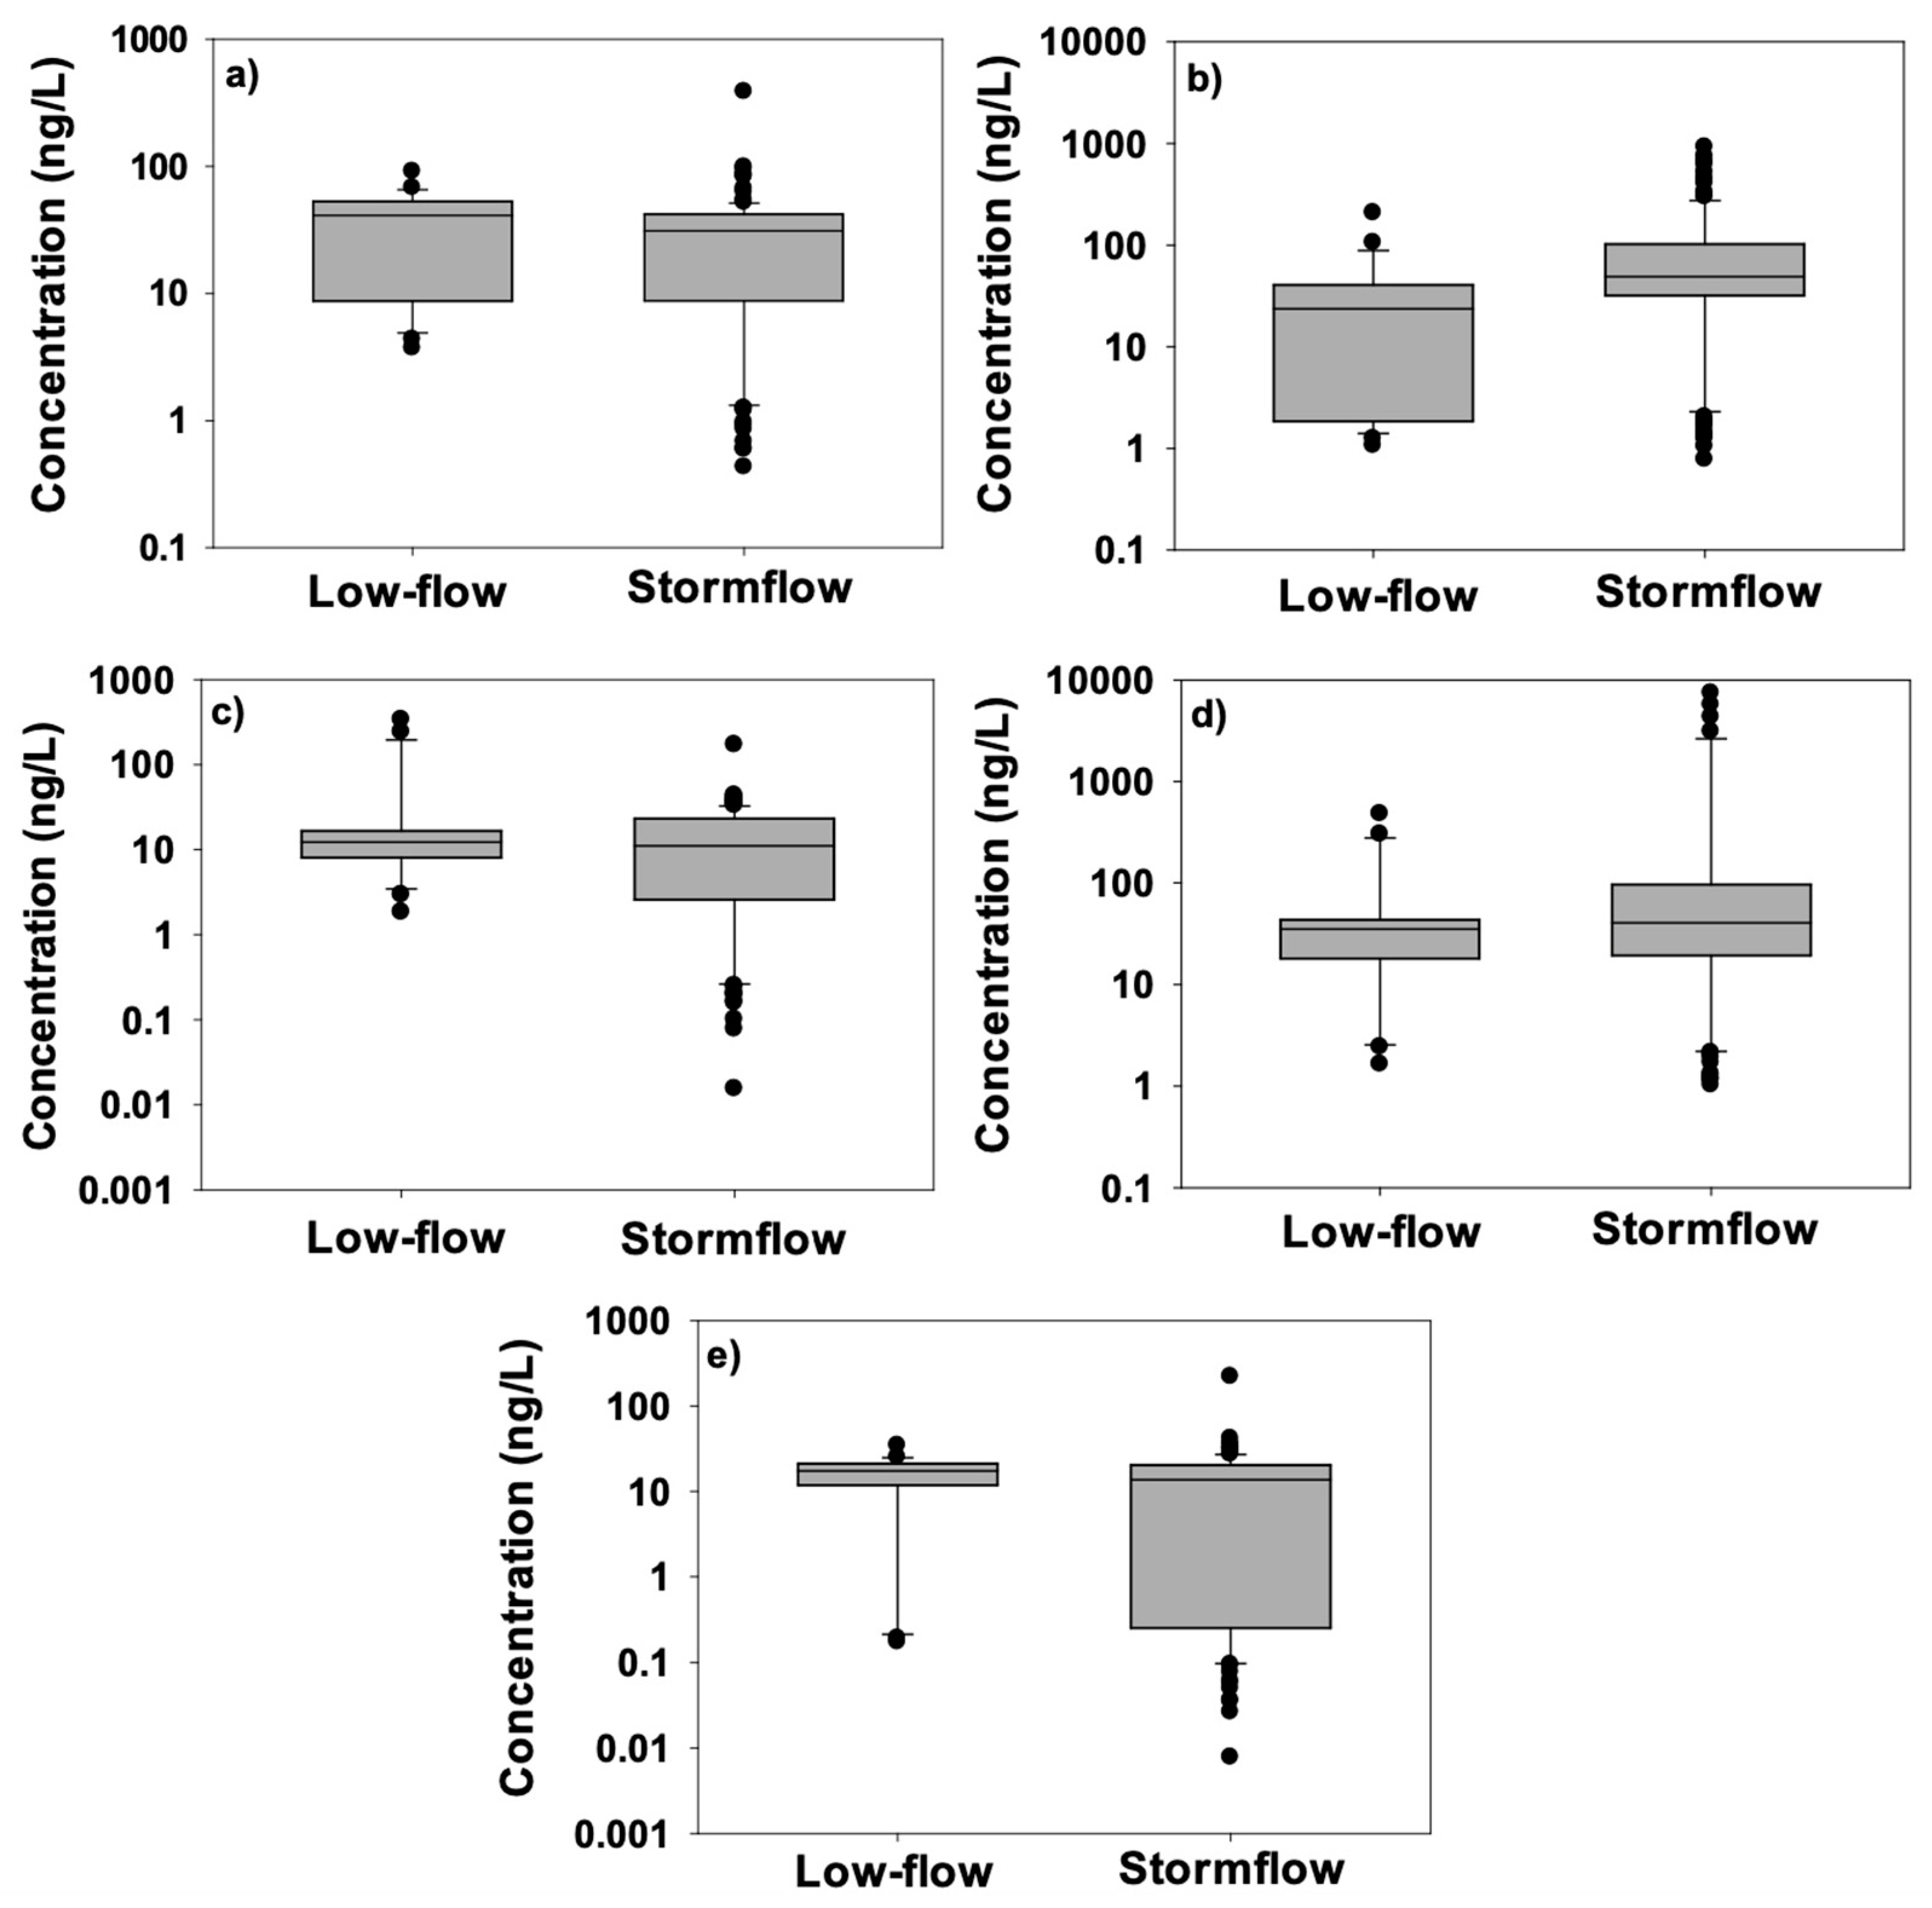
35], possibly suggesting a common pathway for delivery of these strobilurins to streams and rivers. In this work, however, only pyraclostrobin and fluoxastrobin concentrations were statistically significantly higher in stormflow than in baseflow samples.
High concentrations of strobilurins detected in Whitewater River water samples during two time periods coincided with expected times of applications to alfalfa (May–early June), and to maize and soybean (mid-July–August). Stormflows during these time periods produced concentrations for pyraclostrobin and fluoxastrobin that exceeded toxic thresholds (e.g., no observable effect concentrations [NOEC]) for some aquatic species [
18,
19,
20,
21,
22,
23,
25,
51,
55], although those concentrations likely were not maintained for a time period (e.g., 96 hours used in typical toxicity assessments) sufficient to produce significant lethality. Pyraclostrobin exhibited the most frequent exceedances (15% of all samples tested), especially during a July rain event. This event was a medium-intensity rainfall that elicited only a minor hydraulic response, but was still able to mobilize sediment and occurred shortly after the expected alfalfa application period. Refer to Weaver [
5] for a more detailed examination of this event. As the most commonly used strobilurin fungicide in Minnesota and the most frequently detected in our water samples, such high concentrations are concerning. Even during baseflows, median concentrations of azoxystrobin (30 ng/L;
Table 1) exceeded the threshold (26 ng/L) above which sublethal effects on respiration and reproduction can occur for the zooplankton
Daphnia magna [
25,
55]. Phytoplankton, aquatic fungi, aquatic macrophytes, amphibians, and numerous aquatic invertebrates also may be impacted by low, but field-relevant concentrations of strobilurin fungicides [
25]. Precipitation generally is reduced during the July–August period within the study region, although periodic, intense storm events are becoming more frequent [
56,
57]. We observed widespread aerial application of fungicides to maize crops within the watershed during July and August. Inadvertent overspray during application, or application less than 48 hours before a rain event (insufficient time to bind to plants and soil), could result in elevated conveyance of fungicides to surface waters during storm runoff and subsequent high concentrations of fungicides in stream stormflows and place aquatic biota at risk. Strobilurin fungicides were suspected but not directly implicated in the killing of 2900 trout and thousands of other fishes in the South Fork of the Whitewater River after a storm event in late July 2015 [
26], roughly the same time period when we observed high fungicide concentrations during 2019.
One state agency historically has monitored for the presence of strobilurin fungicides in the Whitewater River. The Minnesota Department of Agriculture (MDA) maintains two sites for monitoring agricultural chemicals within the Whitewater River system: an automated sampler on the Middle Fork (near our upstream site) and a grab sample site on the South Fork (near our downstream site). The automated sampler collected stormflows triggered on stage height, producing a composite sample gathered over 96 hours (90 mL/hour), whereas instantaneous grab samples were collected once every two weeks (based largely on a calendar schedule rather than flow regime). Detection frequencies of strobilurins from these two MDA sites (available for calendar years 2015–2018) [
53] were limited to only azoxystrobin (6–17%) and pyraclostrobin (2–7%), frequencies much lower than those (~80%) for these same strobilurins in our study during 2019. Our higher detection frequencies and higher concentrations of those fungicides detected likely resulted from only examining instantaneous rather than composite samples (the latter diluting higher concentration samples collected during each storm event hydrograph with samples collected over the remainder of the 4-day sampling cycles). Another possibility is differences in extraction efficiencies and detection limits, but comparisons are difficult given different methodologies and instruments used.
Predicting how strobilurin fungicides find their way into surface waters and estimating what concentrations they might achieve in those waters likely are very complicated tasks. Although we detected a few significant differences in strobilurin concentrations in the Whitewater River that may be attributable to flow regime and characteristics of specific strobilurins, we were unable to find any effect(s) of hydrograph stage, river discharge, or precipitation amount on strobilurin concentrations. We also observed only slight effects of sampling location within the watershed (i.e., near agricultural lands or bordered by woodlands) on strobilurin concentrations. For example, the Middle Fork upstream site often had the highest concentrations for most strobilurins during stormflows, likely related to more agricultural lands (85% land use versus 65% in North and South forks) within this subwatershed [
35]. Detailed examinations of fungicide concentrations across the watershed during individual storm events produced no additional clarity [
5], and strobilurin load calculations for individual storm events were widely variable (even for the same event) based on the various methodologies employed [
5,
35]. Calculated strobilurin loads during storm events also were not correlated with either nitrate or total phosphorus concentrations, preventing the use of these common water quality variables as model surrogates for strobilurin concentrations during stormflows [
5].
Based on our study, it is evident that strobilurin fungicides are entering the Whitewater River from within the watershed. While fungicides were most concentrated during the summer growing season and were present at elevated levels in stream water samples collected during storm events, there appeared to be low, background levels of strobilurins present in surface waters of the river during spring and autumn, prior to and after the normal application season for fungicides. These low levels present outside the growing season, as well as low levels detected during summer baseflow sampling (where measured fungicide concentrations did not change between upstream and downstream sites), are suggestive of possible groundwater contamination. The limestone-based karst geology underlying the watershed is especially prone to connections between surface activities and groundwater resources [
58,
59,
60,
61,
62], and other agricultural chemicals have been detected both in springs that discharge groundwater into regional streams and in the streams themselves [
26,
61,
63]. Testing for strobilurin fungicides in water samples collected from springs or wells during winter (December–March) would be needed to confirm the presence of these fungicides in regional groundwater supplies.
6. Conclusions
This study documented the regular presence of strobilurin fungicides in the Whitewater River system during a typical crop growing season, taking advantage of new sample processing procedures optimized for strobilurin extraction to increase detection frequencies relative to previous studies. We had hypothesized that strobilurin fungicide concentrations would be higher in proximity to agricultural lands compared to woodland areas (i.e., upstream versus downstream stations), but found that statement to be true for only three of 15 possible river fork-strobilurin type combinations. We expected that strobilurins would be detected only during periods centered on the timing of fungicide applications to crops, but found fungicides present in most samples tested throughout the growing season. We also expected that strobilurin concentrations would increase during stormflow events, which was true only for three of the five fungicides examined. Finally, we hypothesized that predictive models could be developed connecting precipitation levels, stream stormflows, and strobilurin concentrations, but discovered that there were no apparent patterns connecting these variables.
Detecting the presence of strobilurin fungicides throughout the entire growing season was unexpected, but the extremely high concentrations of some strobilurins observed during some stormflows raise concerns for biota living in the Whitewater River system [
51]. The Whitewater River is prized for its recreational trout fishery [
64], emphasizing the need to protect this river system from agricultural chemicals. Future research should focus on 1) the possible presence of strobilurin fungicides in groundwaters [
62,
65] discharging into this river system [
58]; 2) the roles of suspended and deposited sediments as potential sources and sinks for strobilurins [
25,
49,
50,
51,
66]; and 3) the importance of streamside buffers in preventing delivery of strobilurins to streams during storm runoff [
67,
68,
69]. With strobilurin fungicide use likely to expand in many regions, addressing these research needs should provide both farmers and environmental managers with better information to guide responsible future fungicide use for agriculture while also protecting public water resources.
Figure 1.
Map of the Whitewater River watershed indicating upstream (1) and downstream (2) locations of water sampling sites on the North Fork (N), Middle Fork (M), and South Fork (S). The small inset shows the location of Minnesota (in black) within North America, and the larger inset highlights the study watershed (in white) in southeastern Minnesota, USA.
Figure 2.
Total sales for five strobilurin fungicides in Minnesota, 1997–2021, based on data collected by the Minnesota Department of Agriculture [
52].
Figure 2.
Total sales for five strobilurin fungicides in Minnesota, 1997–2021, based on data collected by the Minnesota Department of Agriculture [
52].
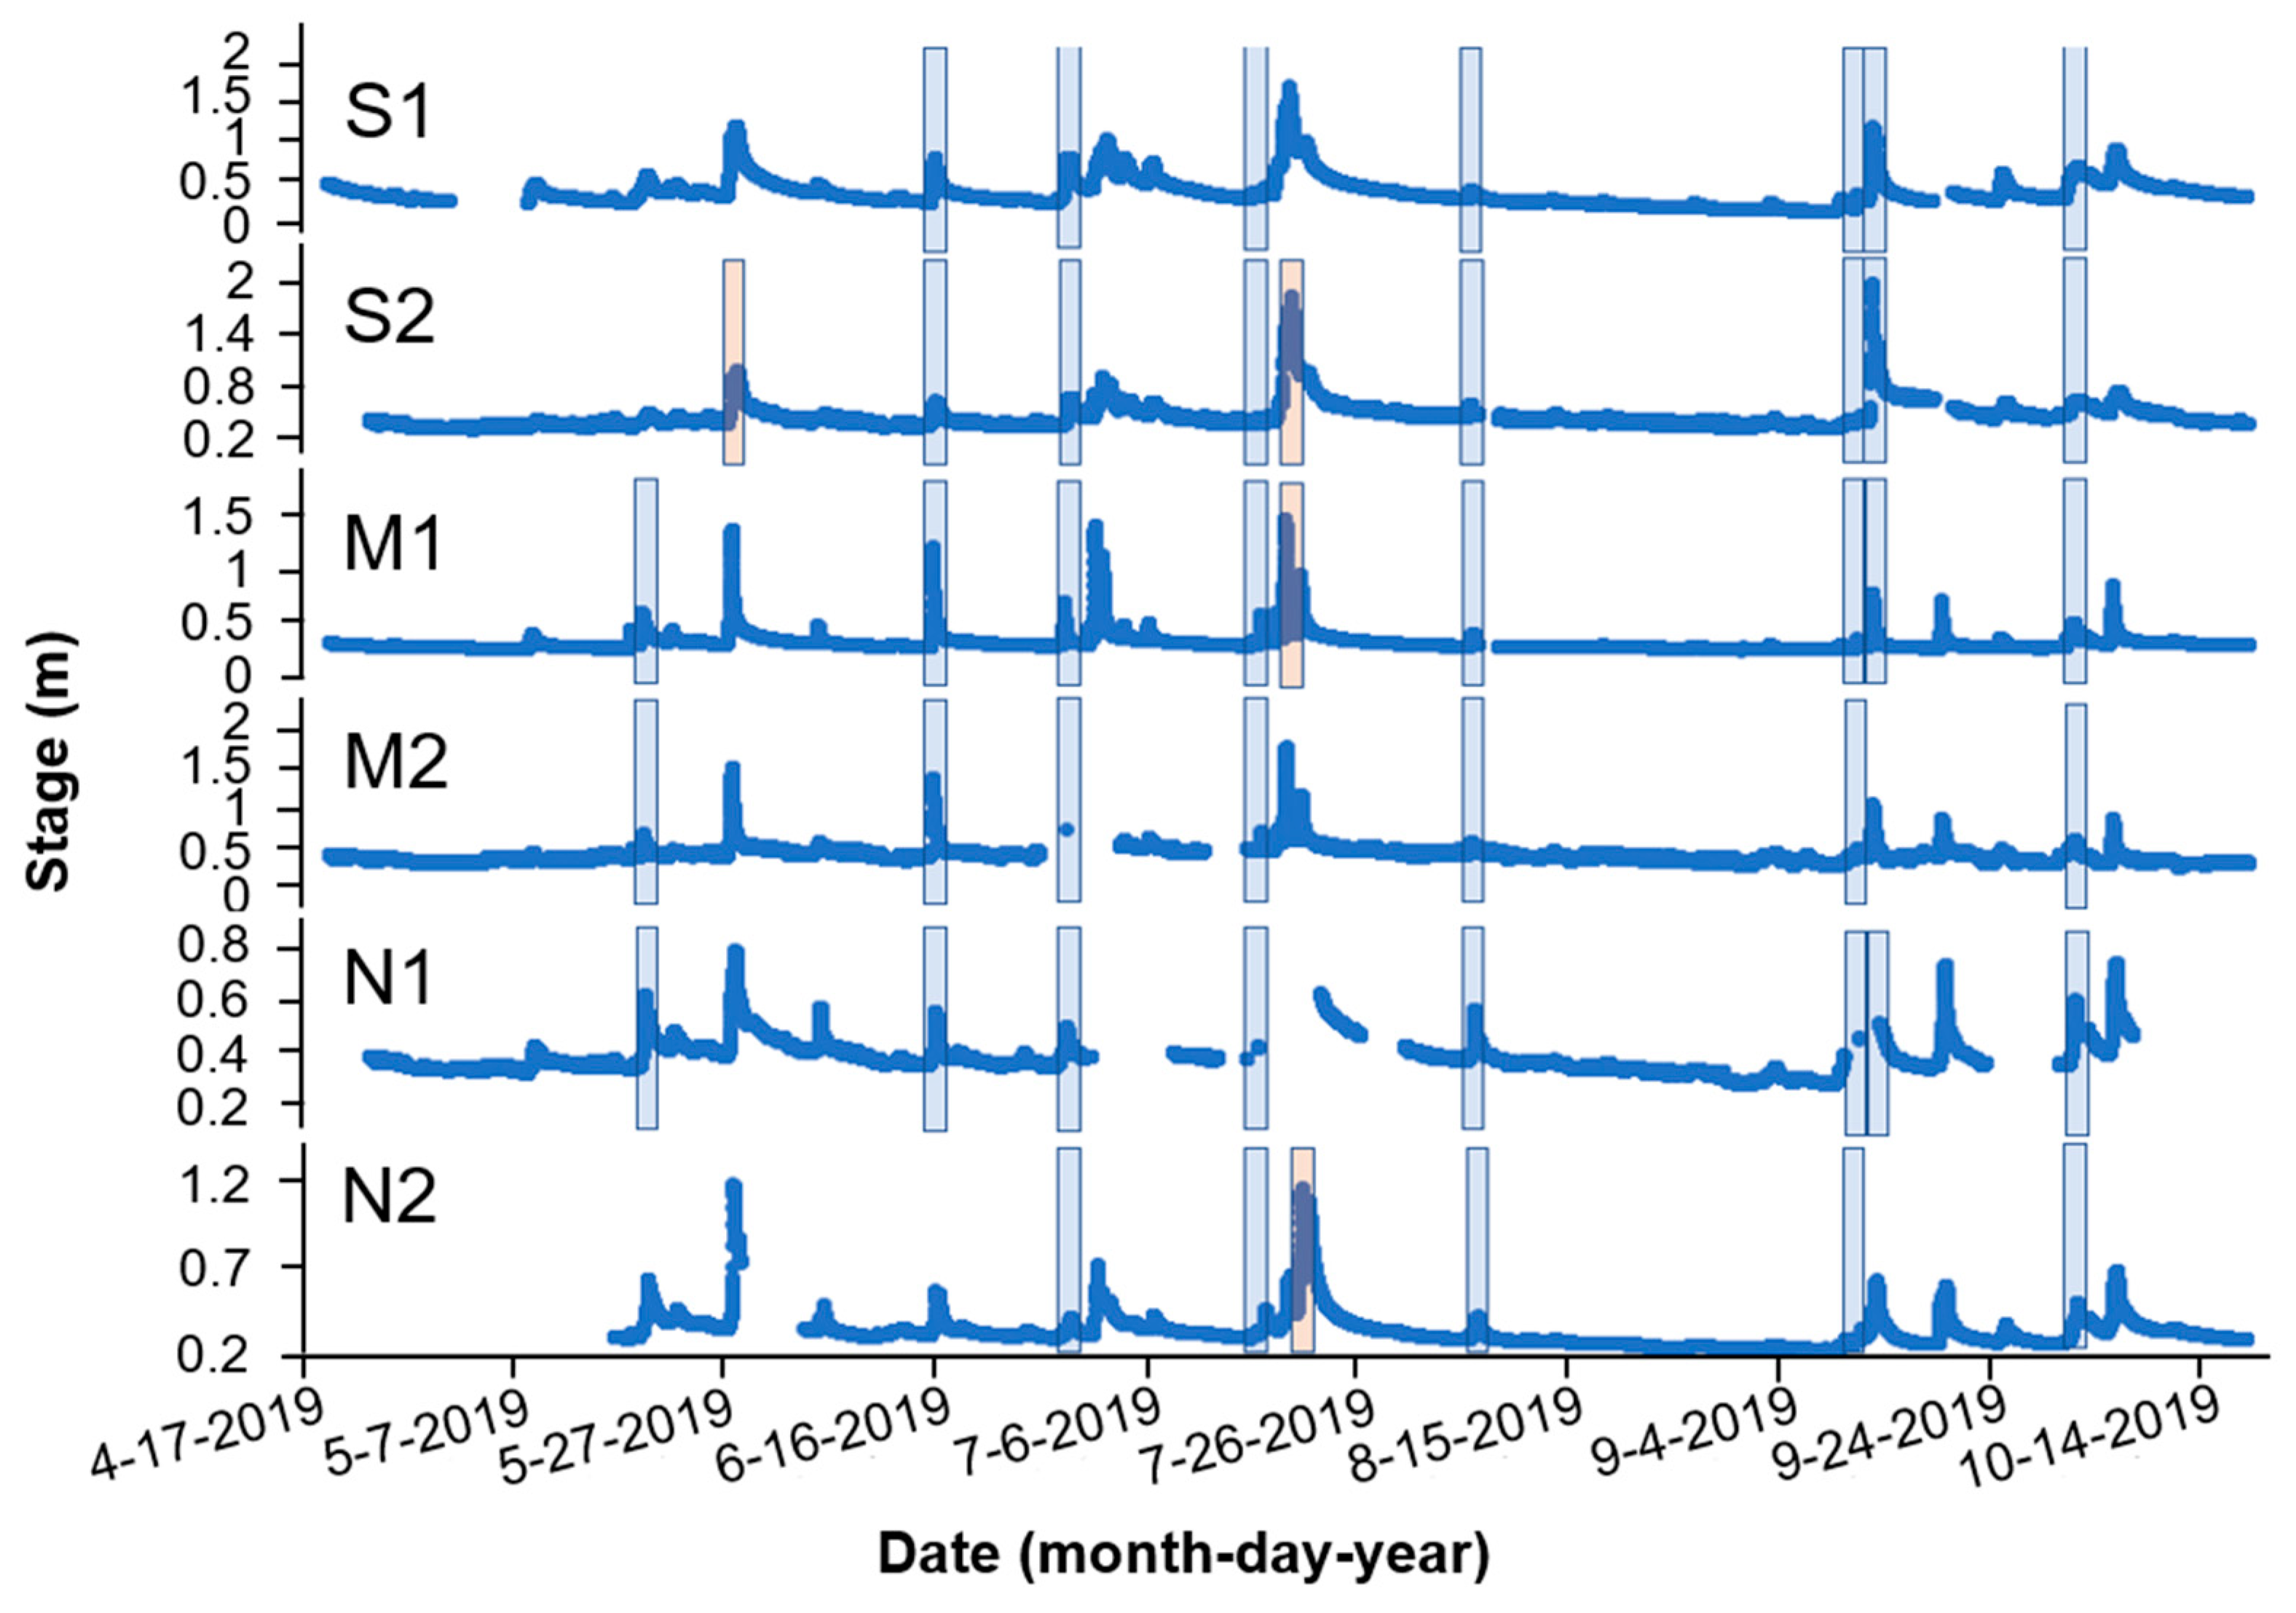
Figure 3.
Hydrographs from April to October 2019 for sampling locations in the Whitewater River in southeastern Minnesota. Automated sampling periods are highlighted by blue and orange rectangles. Blue boxes were stormflow event samples analyzed for fungicides and general chemistry parameters, whereas orange boxes were only analyzed for general chemistry parameters.
Figure 4.
Box and whisker plots of baseflow (low-flow) and stormflow concentrations for a) azoxystrobin, b) fluoxastrobin, c) picoxystrobin, d) pyraclostrobin, and e) trifloxystrobin from the Whitewater River, 2019. Boxes represent 75th and 25th percentiles, midlines are medians, whiskers are 10th and 90th percentiles, and dots represent the lowest 10% and highest 10% of individual values. Detections BMRL were set to ½ MRL (see Methods).
Figure 5.
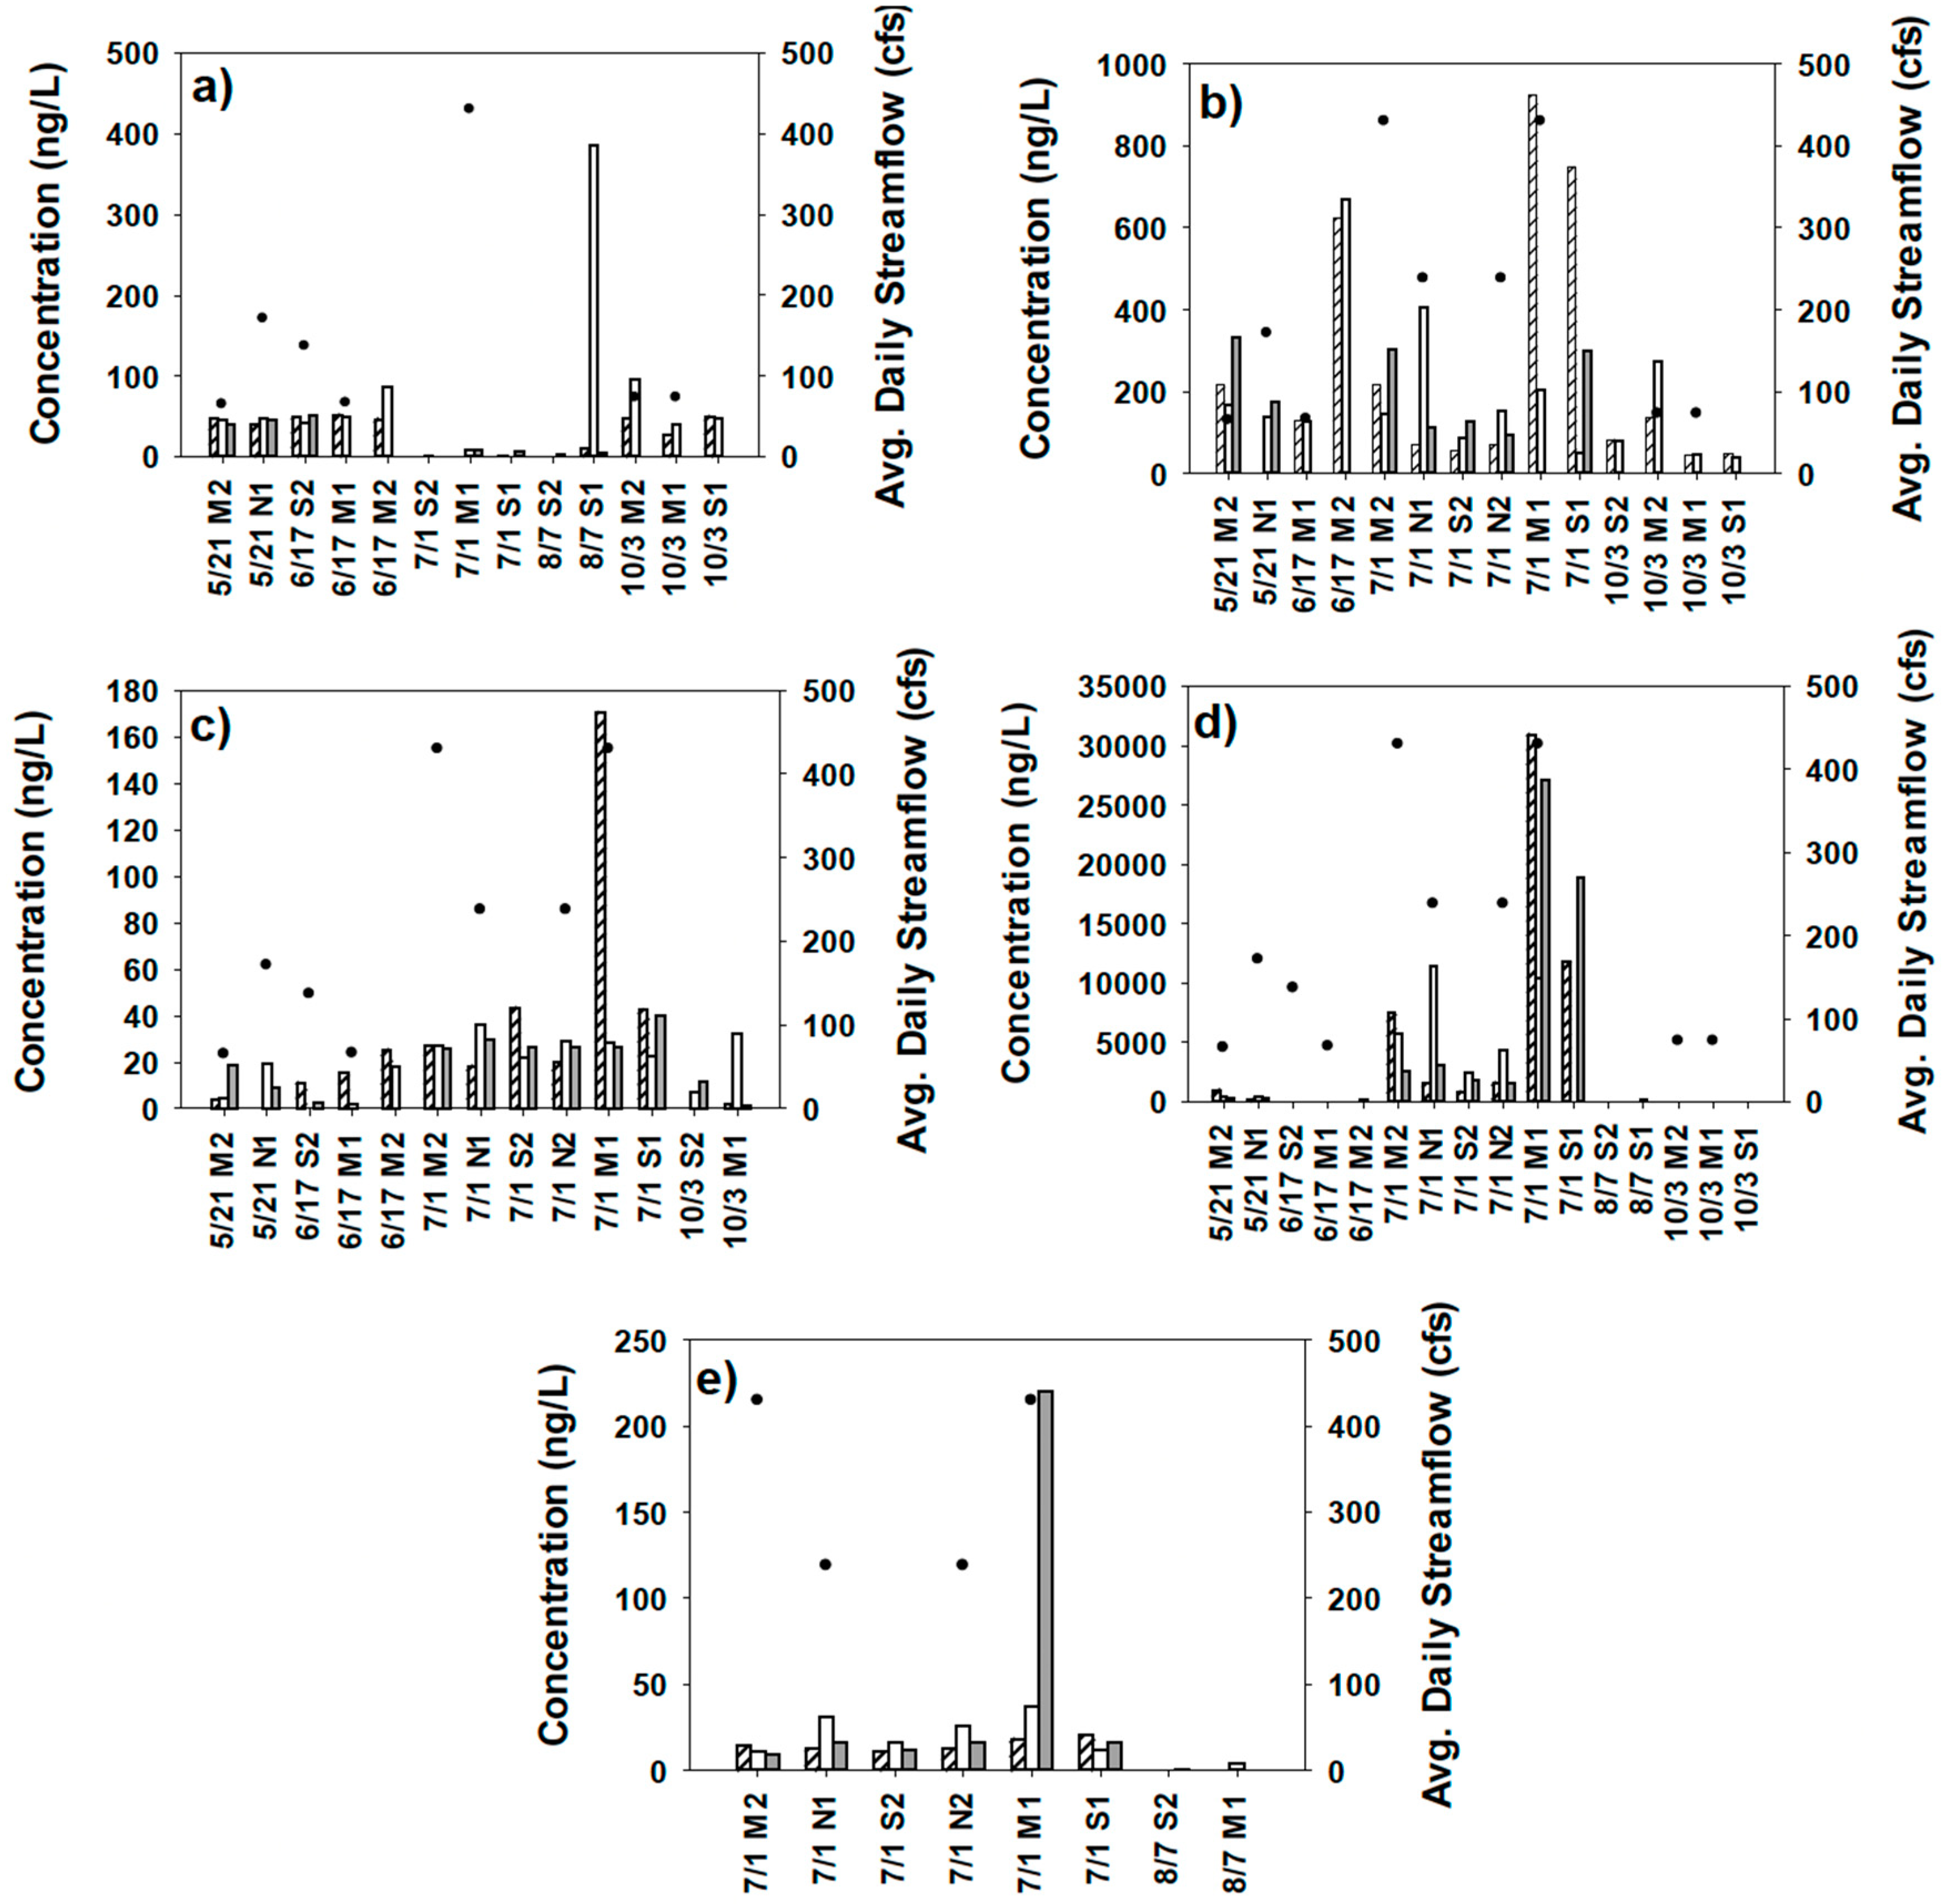
Fungicide concentrations (a) azoxystrobin, b) fluoxastrobin, c) picoxystrobin, d) pyraclostrobin, and e) trifloxystrobin) for water samples collected from the rising limb (hatched bars), peak (white bars), and falling limb (gray bars) of stormflow hydrographs, Whitewater River, 2019. Black dots indicate streamflows (cfs = cubic feet/sec), with sample dates and stream sites (N = North Fork, M = Middle Fork, S = South Fork, 1 = upstream site, 2 = downstream site) designated along the X axes.
Figure 6.
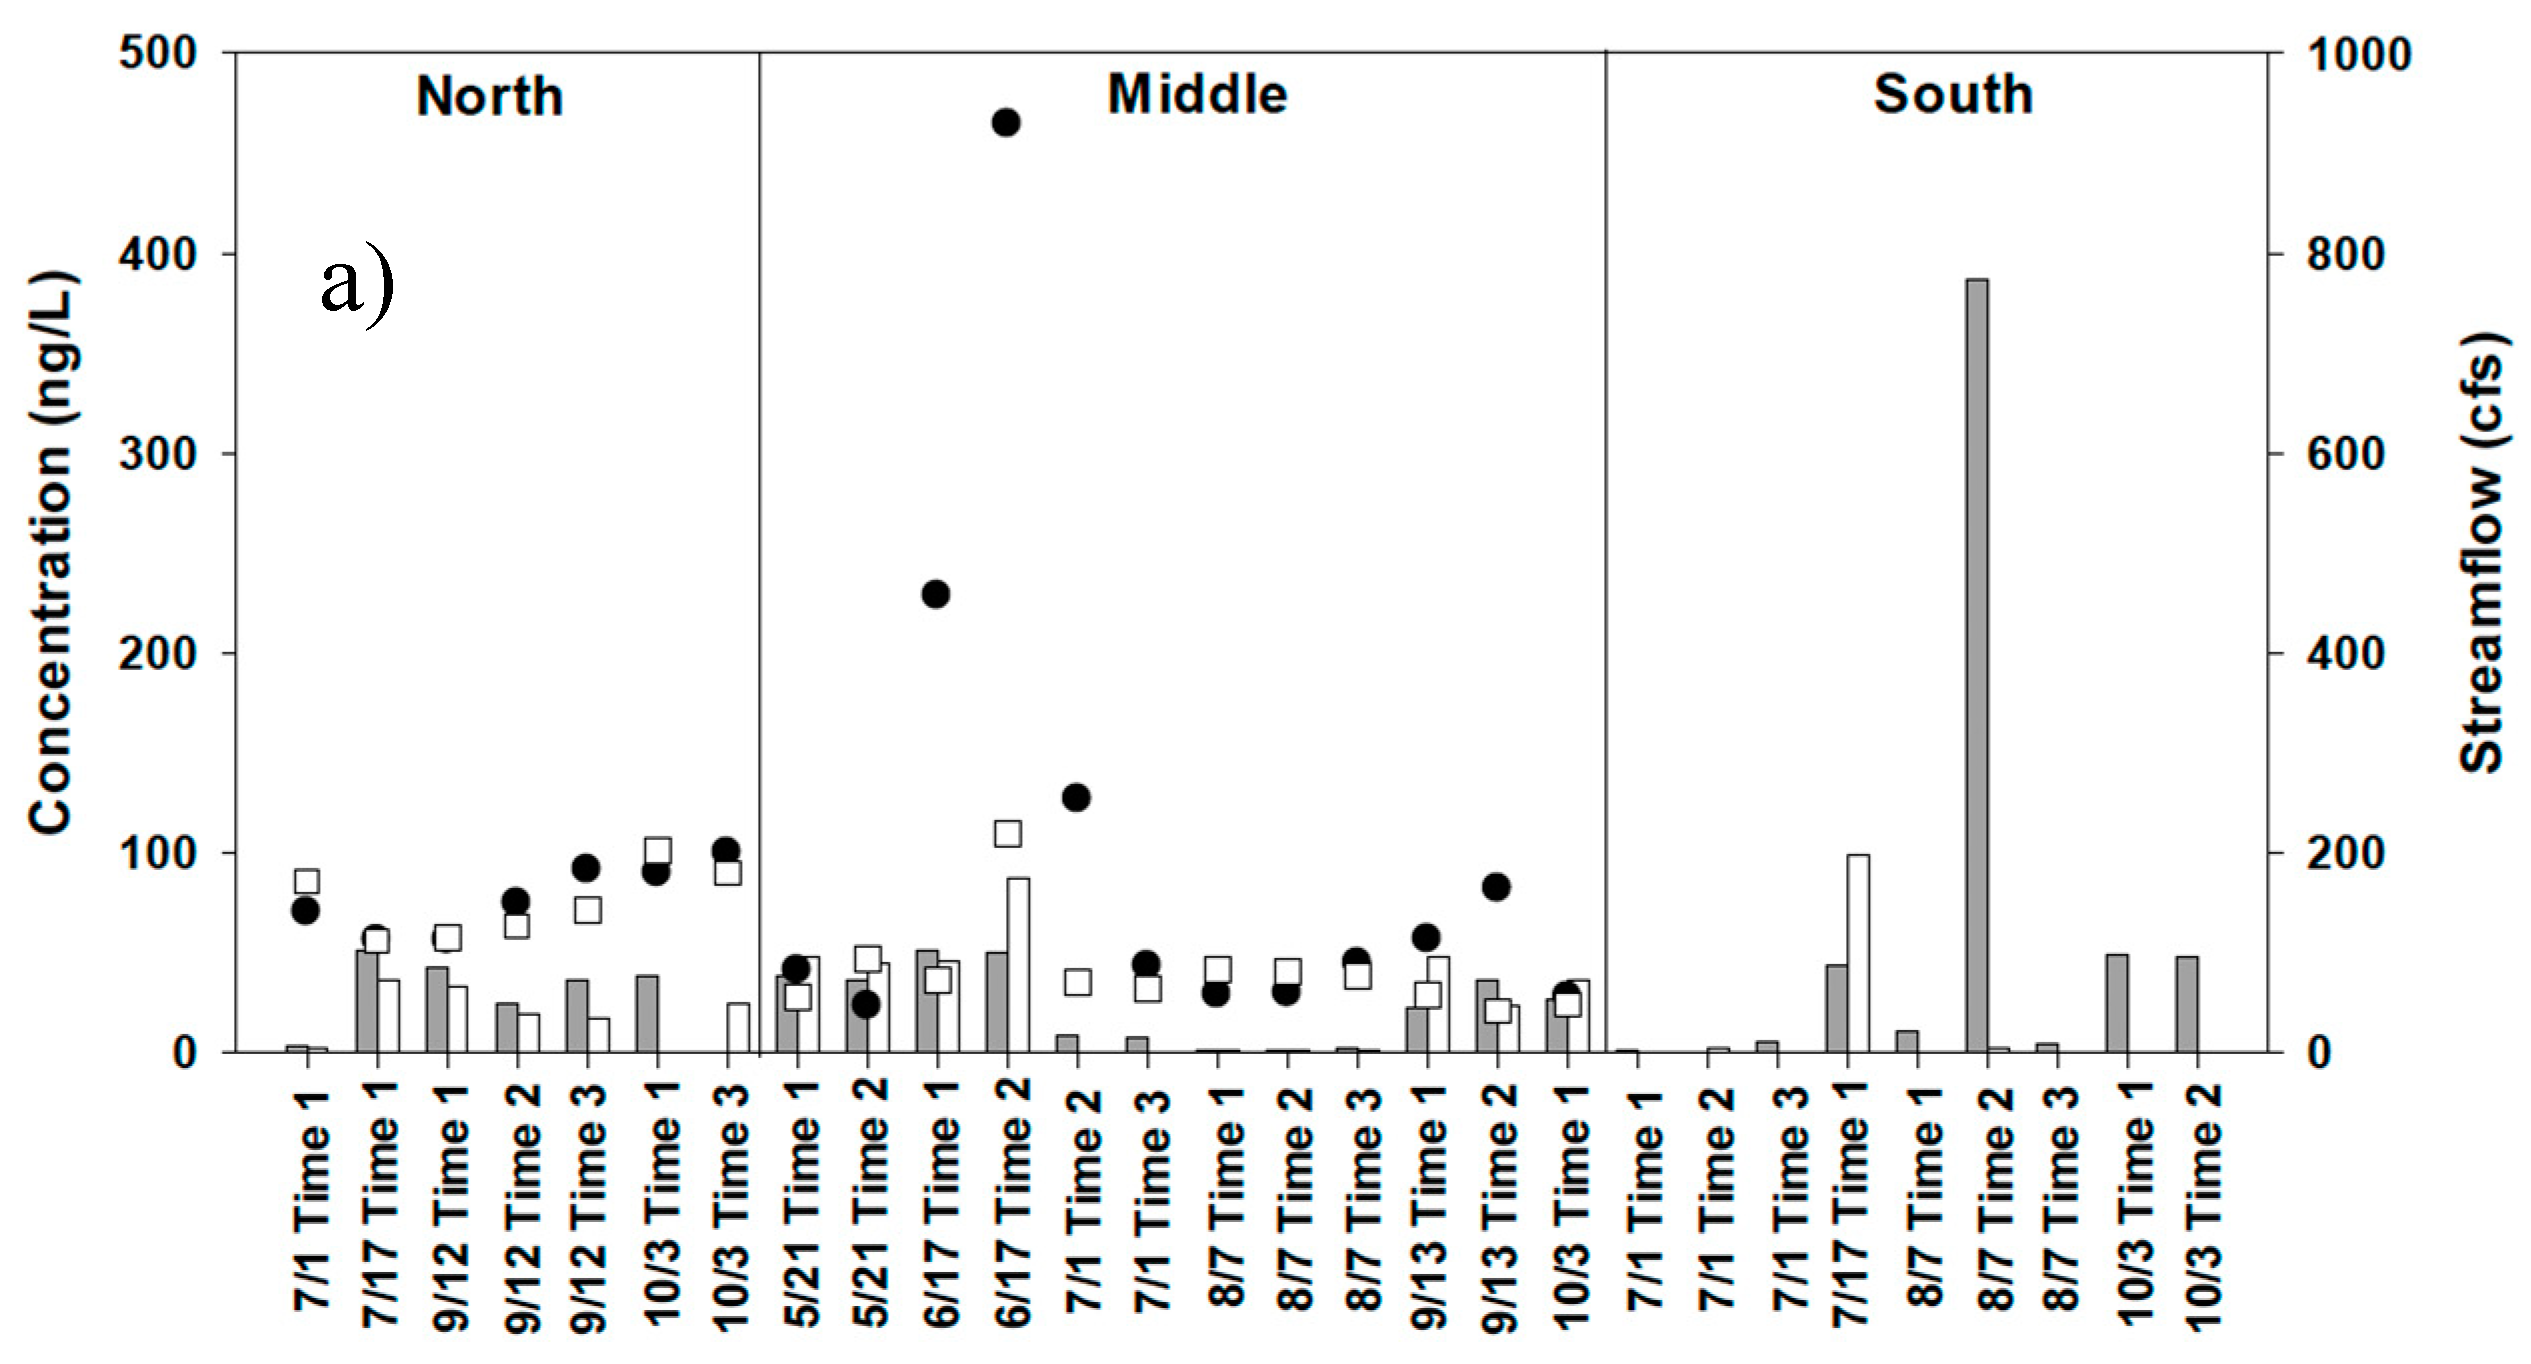
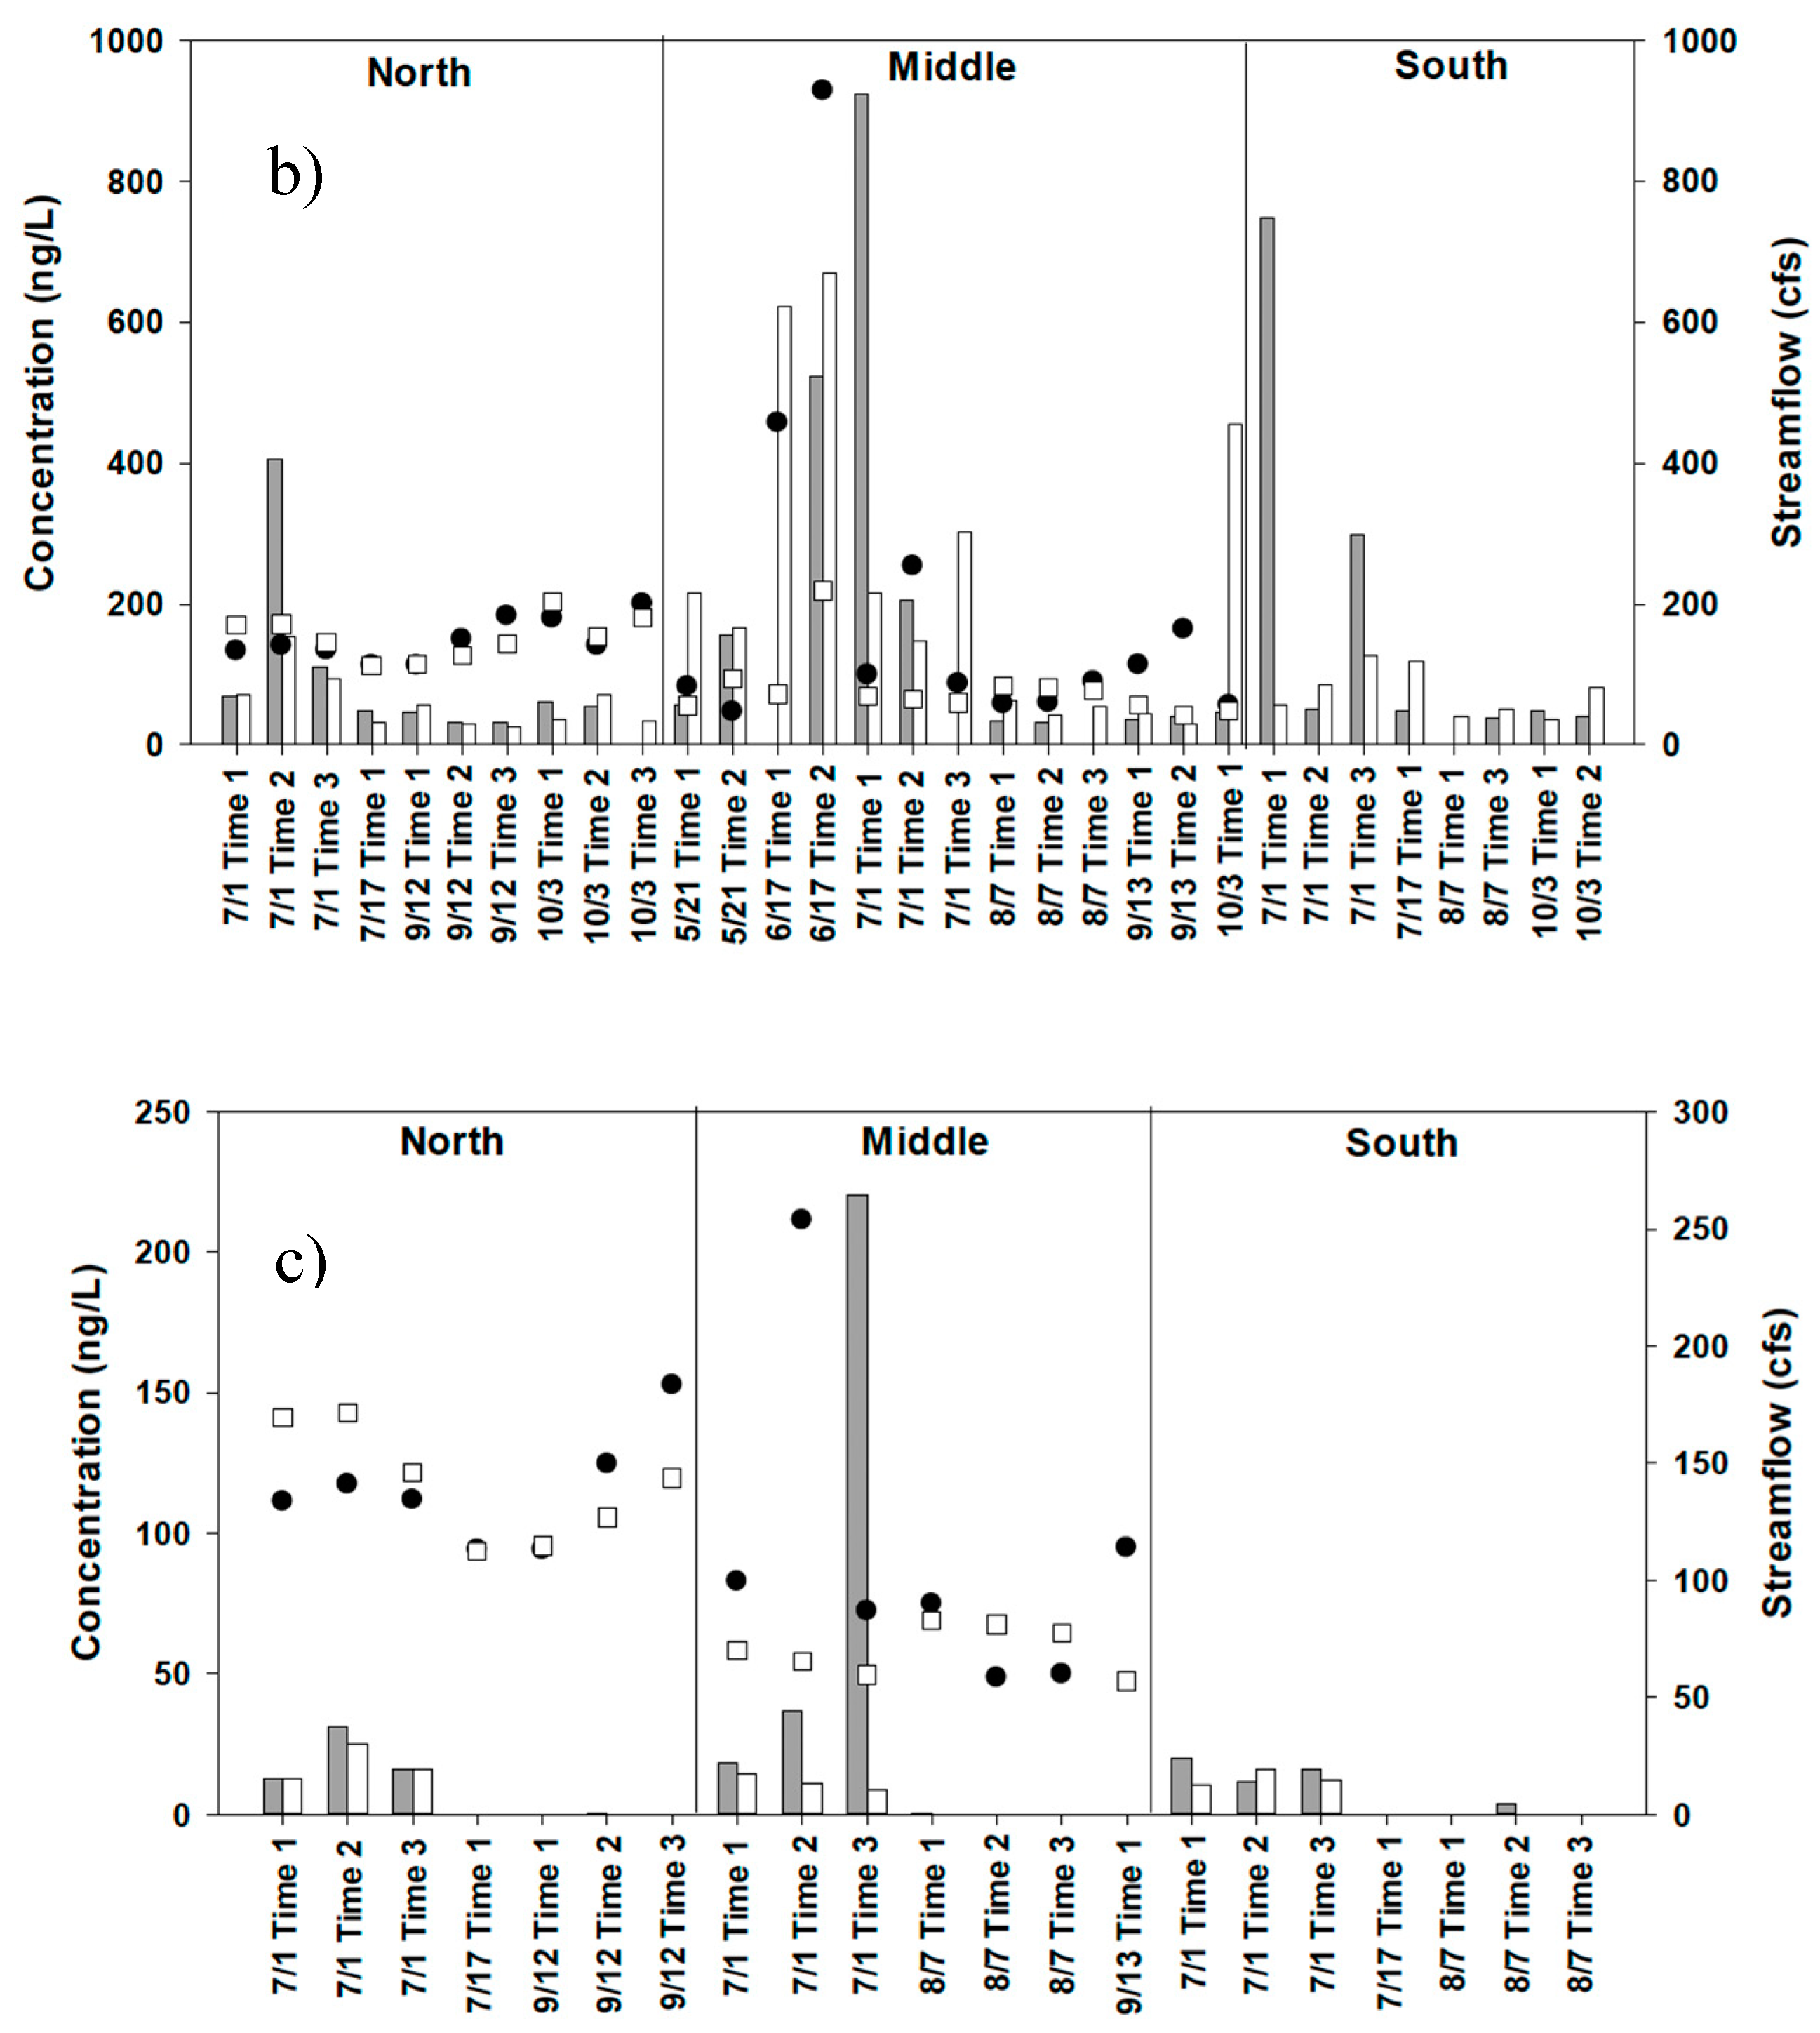
Fungicide concentrations (a) azoxystrobin, b) fluoxastrobin, and c) trifloxystrobin) for water samples collected from upstream (gray bars) and downstream (white bars) sites in the three forks (North, Middle, South) of the Whitewater River during stormflow events, 2019. Streamflows (cfs = cubic feet/sec) are indicated by black circles (upstream sites) and white squares (downstream sites). Flow gauges were offline for South Fork sites. Sample dates and times are designated along the X axes.
Table 1.
Mean, median (Med) and maximum (Max) values for routine water quality variables collected during baseflow sampling and stormflow events from six sites in the Whitewater River system, 2019. P values are from Mann-Whitney tests comparing baseflow and stormflow concentrations. Asterisks (*) by median values indicate which flow regime (baseflow versus stormflow) had the significantly higher concentration. n = sample size, P = phosphorus, TSS = total suspended solids, CFU = colony-forming units.
| |
Baseflow |
Stormflow |
|
| Variable |
Mean |
Med |
Max |
n |
Mean |
Med |
Max |
n |
P |
| Ammonia (mg/L–N) |
0.51 |
0.78* |
7.65 |
31 |
1.14 |
0 |
9.05 |
76 |
<0.001 |
| Nitrate (mg/L–N) |
5.87 |
5.66 |
14.3 |
64 |
5.9 |
5.24 |
18.06 |
108 |
0.484 |
| Total P (mg/L–P) |
0.51 |
0.56 |
2.03 |
58 |
0.74 |
0.49 |
7.81 |
107 |
0.757 |
| TSS (mg/L) |
19 |
160 |
1000 |
41 |
1,781 |
600* |
18,080 |
107 |
0.044 |
|
E. coli (CFU/100 mL) |
9 |
4* |
78 |
68 |
8 |
0 |
90 |
89 |
<0.001 |
Table 2.
Summary statistics of strobilurin concentrations (ng/L) and detections in 131 water samples from the Whitewater River system, 2019. Samples BMRL were set to 0 for the statistics reported. Values calculated with samples BMRL set to ½ MRL are shown in parentheses only if they differed from those with BMRL set to 0.
| Strobilurin |
Total
detections |
Percent detections
(Overall, baseflow,
stormflow) |
Median
concentration
(ng/L) |
Maximum
concentration
(ng/L) |
| Azoxystrobin |
106 |
82, 82, 82 |
30 (33) |
386 |
| Fluoxastrobin |
103 |
79, 68, 80 |
45 |
924 |
| Picoxystrobin |
82 |
63, 68, 61 |
1.2 (11) |
338 |
| Pyraclostrobin |
107 |
82, 90, 80 |
37 |
3.1 × 10⁴
|
| Trifloxystrobin |
58 |
44, 41, 45 |
0 (15) |
221 |
Table 3.
Statistical comparisons (t-tests) of fungicide concentrations for baseflow versus stormflow water samples from the Whitewater River system, 2019. Tests were conducted for strobilurins both with and without samples below the method reporting limit (BMRL; see Methods). When including samples BMRL, concentration was set at ½ the method reporting limit (MRL; see Methods). Significant differences are indicated by bold font.
| Strobilurin |
df |
t value |
P value |
| Azoxystrobin |
49 |
|
|
| Without BMRL |
|
0.88 |
>0.20 |
| With BMRL |
|
0.68 |
0.50 |
| Fluoxastrobin |
120 |
|
|
| Without BMRL |
|
3.94 |
<0.001 |
| With BMRL |
|
3.92 |
<0.001 |
| Picoxystrobin |
21 |
|
|
| Without BMRL |
|
1.33 |
>0.10 |
| With BMRL |
|
1.40 |
>0.10 |
| Pyraclostrobin |
120 |
|
|
| Without BMRL |
|
2.89 |
<0.005 |
| With BMRL |
|
2.89 |
<0.005 |
| Trifloxystrobin |
|
|
|
| Without BMRL |
120 |
1.79 |
>0.05 |
| With BMRL |
80 |
0.53 |
>0.50 |
Table 4.
Kruskal-Wallis test results comparing fungicide concentrations among rising-limb, peak, and falling-limb stormflow hydrograph samples from the Whitewater River system, 2019. Tests were conducted for strobilurins both with and without samples below the method reporting limit (BMRL; see Methods). When including samples BMRL, concentration was set to 0. Pyraclostrobin and trifloxystrobin did not have any samples BMRL.
|
P values |
|---|
| Strobilurin |
Without BMRL |
With BMRL |
| Azoxystrobin |
0.40 |
0.68 |
| Fluoxastrobin |
0.69 |
0.87 |
| Picoxystrobin |
0.93 |
1.00 |
| Pyraclostrobin |
0.75 |
|
| Trifloxystrobin |
0.94 |
|
Table 5.
Wilcoxon signed-ranks test results comparing fungicide concentrations for water samples collected from upstream and downstream sites in the three forks of the Whitewater River during stormflow events, 2019. Tests were conducted for strobilurins both with and without samples below the method reporting limit (BMRL; see Methods). When including samples BMRL, concentration was set to 0. Significant differences are indicated by bold font.
|
P values |
|---|
| Strobilurin |
North Fork |
Middle Fork |
South Fork |
| Azoxystrobin |
|
|
|
| Without BMRL |
<0.05 |
>0.50 |
>0.05 |
| With BMRL |
<0.05 |
>0.50 |
>0.10 |
| Fluoxastrobin |
|
|
|
| Without BMRL |
<0.001 |
>0.05 |
>0.20 |
| With BMRL |
<0.001 |
>0.05 |
>0.20 |
| Picoxystrobin |
|
|
|
| Without BMRL |
0.20 |
>0.50 |
>0.50 |
| With BMRL |
0.50 |
>0.50 |
>0.20 |
| Pyraclostrobin |
|
|
|
| Without BMRL |
>0.20 |
>0.50 |
0.50 |
| With BMRL |
>0.20 |
>0.50 |
0.50 |
| Trifloxystrobin |
|
|
|
| Without BMRL |
>0.50 |
>0.20 |
>0.10 |
| With BMRL |
>0.50 |
0.02 |
0.10 |
