Preprint
Article

Hydrocarbon Reservoir Characterization in the Challenging Structural Setting of Southern Gulf of Suez: Synergistic Approach of Well Log Analyses and 2D Seismic Data Interpretation

Altmetrics

Downloads

182

Views

106

Comments

0

Submitted:

05 January 2024

Posted:

08 January 2024

You are already at the latest version

Alerts
Abstract
The Gulf of Suez is a sedimentary rift-basin with thick evaporites and complex structural settings that presents challenges to achieving quality imaging based on seismic reflection data. Such subsurface settings and the lack of 3D seismic data poses challenges in building reservoir models to guide hydrocarbon exploration and development, especially in southern parts the Gulf of Suez. This study attempts to overcome the challenges of both 2D seismic interpretation and building a static reservoir model of two Miocene reservoir formations, Ras Ghara Field, Southern Gulf of Suez. Integration of well log data analysis of nine wells and regional-tectonics cognizant 2D seismic interpretation of nineteen 2D seismic lines enabled a reliable 3D static reservoir model. The Miocene reservoir characterization reveals heterogeneity in lithofacies distribution, with thick evaporite sequences causing seismic reflection distortions. Significant hydrocarbon accumulations are associated with horst fault blocks. The Miocene reservoirs demonstrate effective porosity of 14-33%, water saturation of 16-65%, and hydrocarbon saturation of 35-84%. Two new prospects are identified based on structure, facies distribution, and petrophysical results, with estimated original oil in place (OOIP) of 2,002,404 stock tank barrels (STB) and 1,175,580 STB for the Kareem Formation, and 6,302,916 STB and 2,841,894 STB for the Rudeis Formation.
Keywords: 
Subject: Environmental and Earth Sciences  -   Geophysics and Geology

1. Introduction

The Gulf of Suez plays a significant role as a strategic transit hub for oil reservoirs navigating between the Red Sea and the Mediterranean Sea, serving as a vital conduit for the global oil trade [1,2,3]. The utilization of 3D static modeling is of utmost importance in the reservoir production process as it facilitates a comprehensive comprehension of subsurface geology, fluid distribution, and reservoir properties [2,4,5,6,7,8]. The precise representation of the subsurface aids in elucidating the architecture of the reservoir and the spatial arrangement of properties such as porosity and permeability [2,4,9,10,11,12].
The Ras Ghara region, located in the southern Gulf of Suez, holds significant significance in oil production from the Kareem and Rudeis formations. Its noteworthy attributes include a substantial thickness of stratigraphic succession and a distinctive structural setting that facilitates oil accumulation. Although the central and northern Gulf of Suez takes precedence in terms of interest, the authors recognized the importance of conducting a detailed study on the Ras Ghara area. The aim was to emphasize its significance and evaluate the economic feasibility of oil production in this region. Consequently, the authors undertook this research endeavor to shed light on the potential of the Ras Ghara area as an economically viable source of oil, contributing valuable insights to the scientific community.
Deep seismic imaging in the Gulf of Suez area faces significant challenges due to the presence of thick near-surface evaporites. These challenges primarily revolve around accurately characterizing and visualizing the pre-Miocene strata. Factors hindering interpretation include: the attenuation and weakening of seismic energy caused by the thick Miocene evaporite section, the masking of faint reflections from pre-Miocene interfaces by reflections originating from later-formed evaporites, complexities in the Miocene strata exhibiting dip reversals and varying dips in all directions, affecting data interpretation and velocity analysis, significant thickness of Rudeis clastics, resulting in absorption and scattering of downward and reflected energies, and the presence of enclosed flaws leading to diffraction, scattering of noises, and the creation of unpredictable fake reflections. These challenges can result in inadequate transmission of seismic energy, leading to limited or no energy reaching the ground surface. [13,14,15].
2D seismic data interpretation is constrained by the base of Miocene evaporites, with the Kareem-Rudeis interface being the deepest reliable boundary. An integrated interpretation was conducted to address the seismic failure by utilizing potential field data, seismic reflection, and well data, employing the inverse modeling technique [15].
The geographical area under consideration possesses a substantial historical record of oil extraction and is the site of prominent oil reserves, including Ras Gharib and Zeit Bay. These reserves play a significant role in Egypt's overall oil production, as reported by [2,5,7,16,17,18]. The Gulf of Suez benefits from its advantageous geological characteristics and extensive infrastructure, which encompasses pipelines and refineries, hence enabling efficient execution of exploration, production, and transportation activities. In addition, the strategic positioning of the area, coupled with the continuous efforts in exploration, renders it an appealing opportunity for additional advancement and investment from global oil corporations [8,19,20,21]. The strategic positioning and thriving petroleum sector of the Gulf of Suez render it a crucial element within the worldwide energy framework, guaranteeing a dependable provision of oil to satisfy global requirements. The Gulf of Suez is a shallow gulf (50–70 m in bathymetry) in northeastern Egypt, located to the west of the Sinai Peninsula and at the northern end of the Red Sea (Figure 1a). It is well-known as a Neogene continental rifting system between the African and Arabian plates, as well as a productive oil province of Egypt [2,22,23,24,25,26,27].
Since its excellent hydrocarbon potential was discovered in the 19th century (the first exploration drilling was in 1886), the Gulf of Suez has been explored intensively for petroleum production. More than 80 oil fields have been developed. In these oil fields, Miocene clastic and carbonate deposits represent the major reservoir systems in structural and combined traps [2,7,28,29,30,31,32,33,34]. With respect to geoscientific research, the Miocene sequences are a crucial record to reveal syn-rift structural and stratigraphic evolution in the continental rifting system of the Gulf of Suez [2,5,35,36,37,38]. Thus, more detailed and comprehensive studies of the Miocene sequences are required to establish the geological evolution as well as potential hydrocarbon plays.
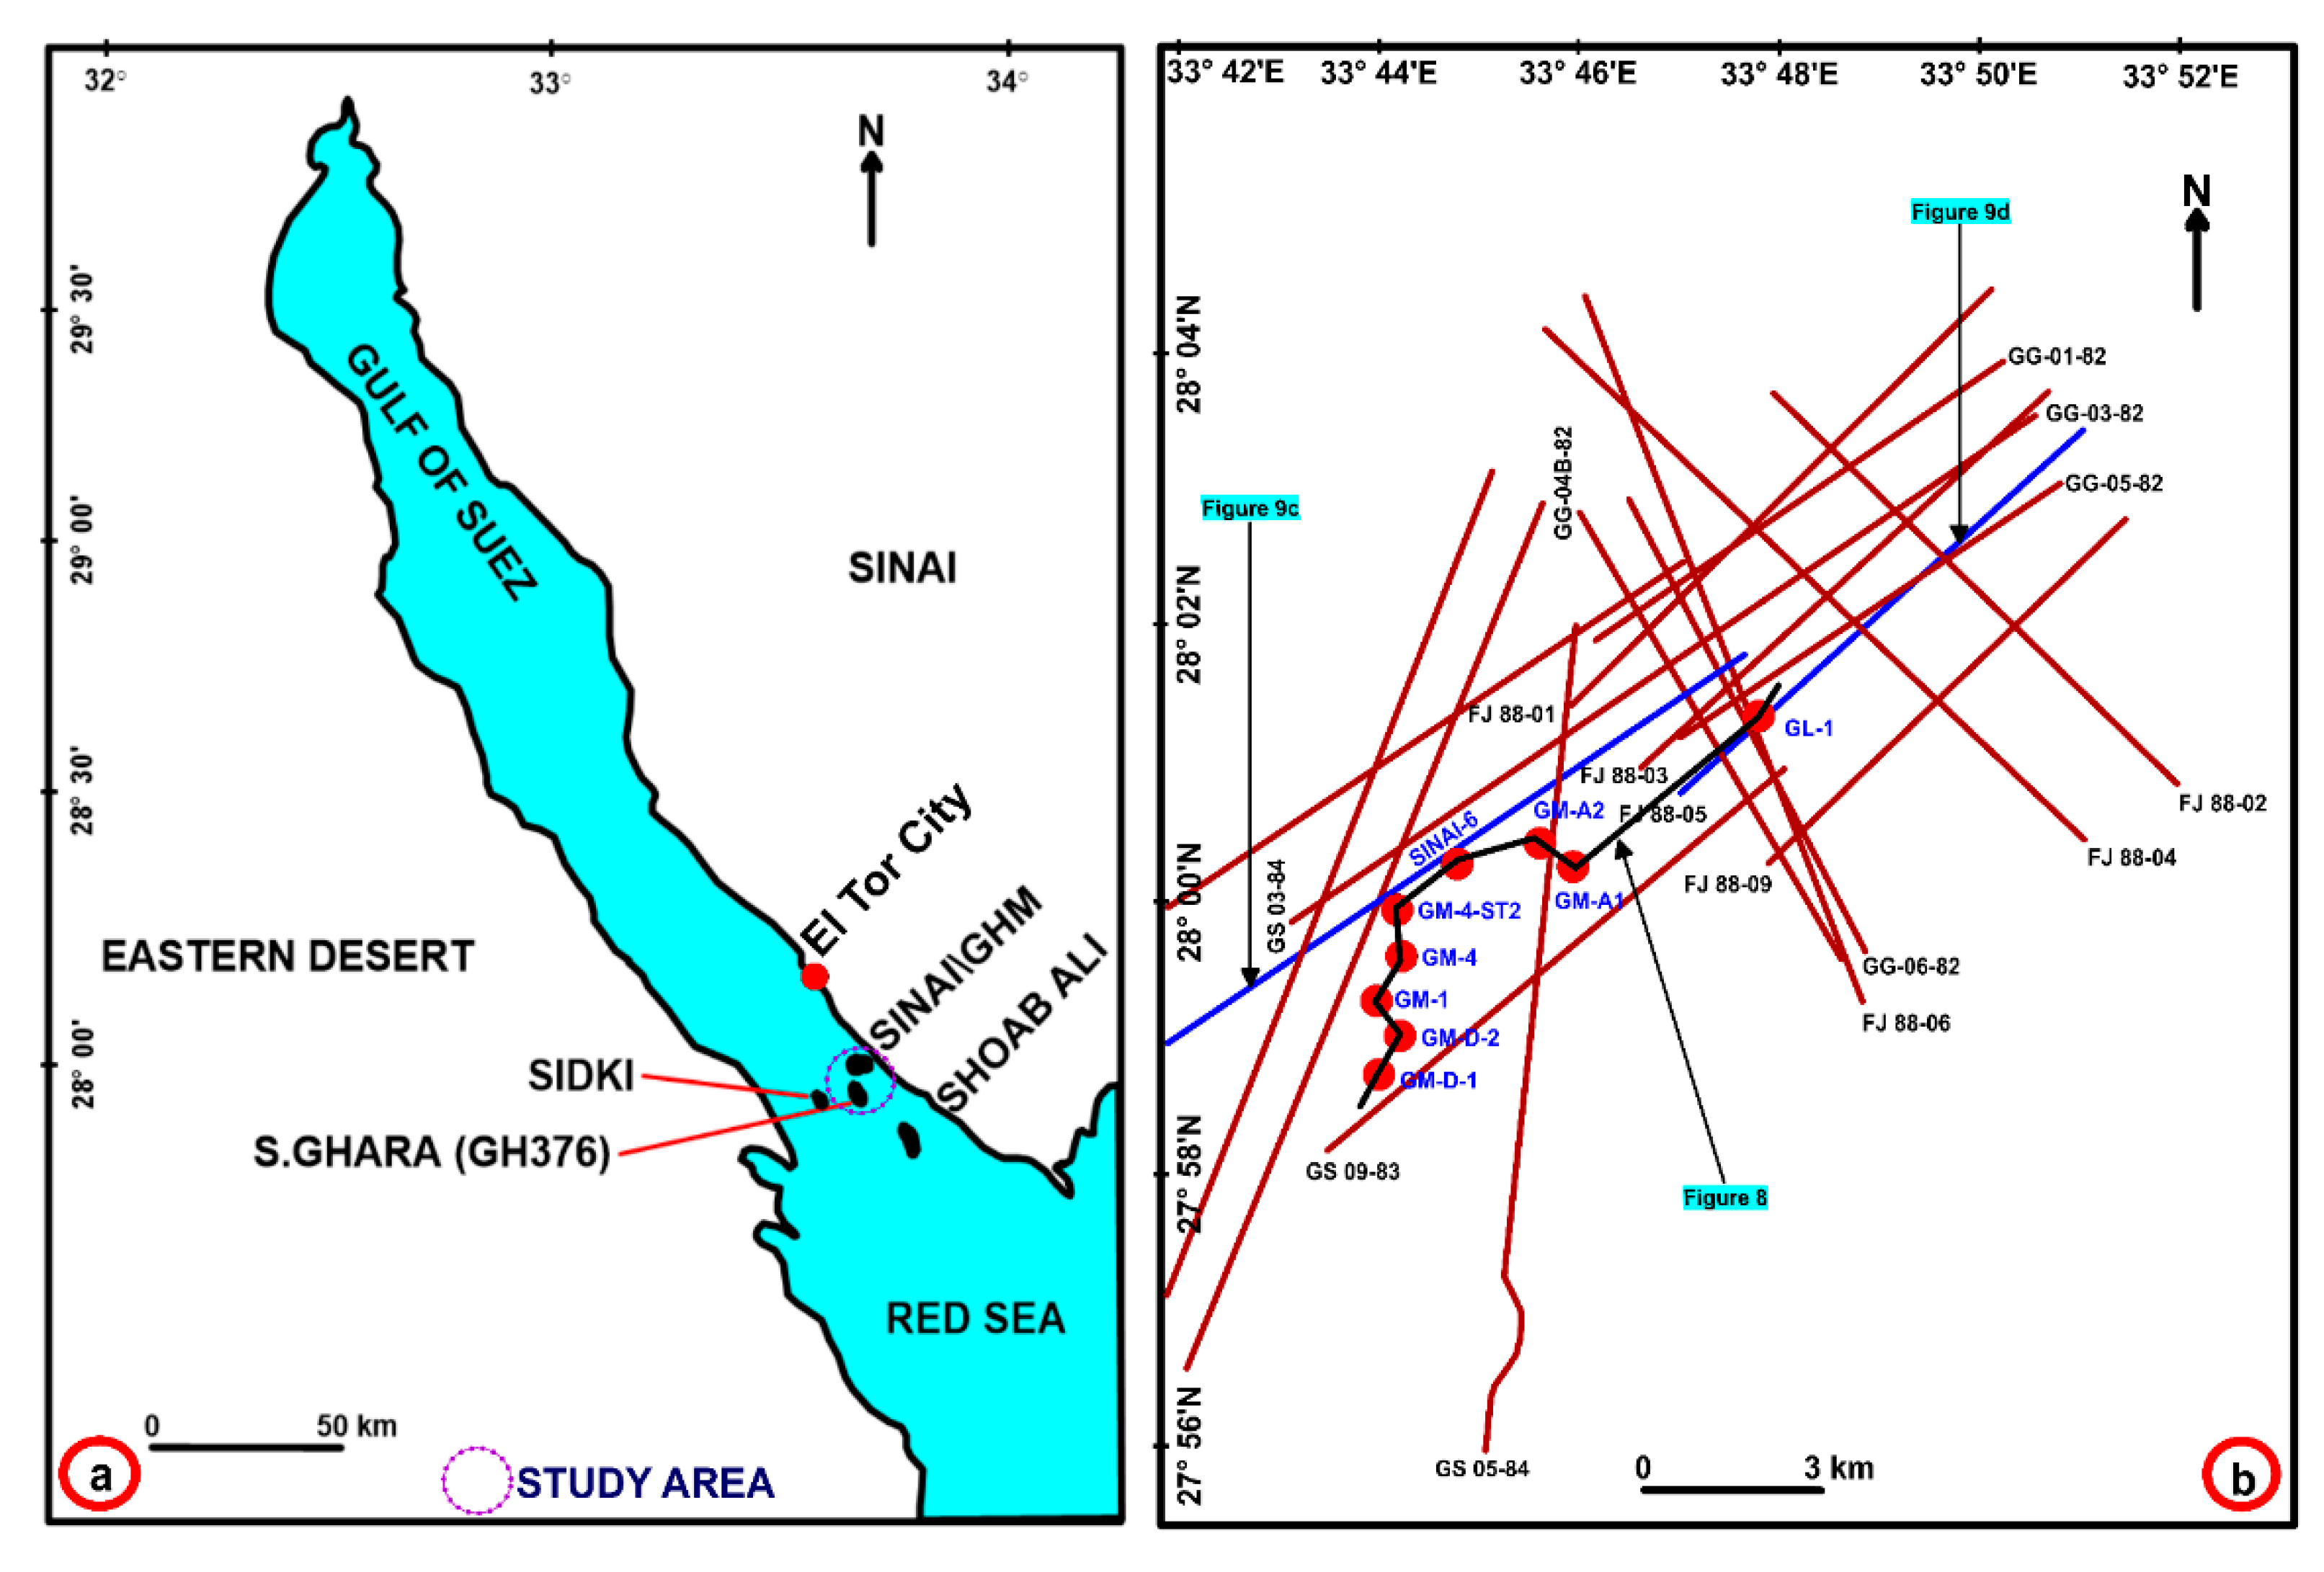
Figure 1. (a) Location map of the Ras Ghara oil field area in the southern Gulf of Suez, modified from EGPC 1996. (b) Locations of the available boreholes and 2D seismic lines used in this study. The black line refers to the direction of the stratigraphic correlation in Figure 8. The blue lines refer to the used seismic sections (GS 13-83 and FJ 88-05) shown in Figure 9.
Preprints 95655 g001
The Ras Ghara oil field is in the southern portion of the Gulf of Suez (Figure 1a) and covers approximately 100 km2 from latitude 27°56'10'N to 28°03'38'N and longitude 33°38'41'E to 33°50'54'E. It is about 6 km west of the Gulf’s east coast and about 30 km to the south of El Tor city, which is 11 km east of the Sidki field and 16 km north-northwest of Shoab Ali field [39,40]. After GPC drilled the well Shoab Ali-1, COPE began to explore the Ghara area in 1964, which targeted the Miocene oil reservoir (Kareem). In 1981, GUPCO established ~1600 km of seismic exploration at the South Ghara Concession, as well as gravity and aeromagnetic surveys, which enabled them to estimate the hydrocarbon potential of Miocene and pre-Miocene deposits in the region. Subsequent exploration wells (e.g., well GH 376-1) confirmed the subsurface stratigraphic and structural settings as well as hydrocarbon accumulations, marking both the Kareem and Rudeis formations as effective pay zones [32]. Since hydrocarbon exploration and production began in the southern Gulf of Suez, including the Ras Ghara oil field, local Miocene formations have represented the major hydrocarbon-producing reservoirs [2,3,5,7,39,40,41,42,43,44]. However, geoscientific studies of the Miocene formations are insufficient to understand the subsurface setting, and lithologic and petrophysical characteristics, and published works leave ample room for further exploration. Data confidentiality of the productive oil reservoirs is a major obstacle for new studies, in addition to the inherently complex litho-logic and spatial structure of the southern Gulf of Suez region. An integrated approach of geology, geophysics, petrophysics, geostatics, and reservoir engineering must be used for detailed characterization of reservoirs and their properties [45,46,47].
In this study, we investigate the Kareem and Rudeis formations in the Ras Ghara oil field. Using a combination of well data and seismic profiles, we describe and interpret a wide variety of geological aspects, ranging from the lithology and petrophysical properties to the subsurface stratigraphic and structural setting of the Miocene sedimentary units. Seismic attribute interpretation is essential in 3D reservoir modeling for oil and gas development. It is a valuable tool for understanding the intricacies of the subsurface and maximizing the recovery of hydrocarbons. Seismic characteristics utilize seismic data to extract valuable information on amplitude, frequency, and phase changes. This information offers insights into reservoir qualities, structural features, and fluid distribution. Consequently, it enables precise characterization and modeling of reservoirs. The accuracy of imaging subsurface reservoirs depends on the frequency characteristics of the seismic data [21,48].
The results are combined into 3D property models of lithofacies, effective porosity, and water saturation to evaluate the Kareem and Rudeis reservoirs. Since the previous geoscientific works only sparsely covered specific aspects of the Ras Ghara oil field, this study provides valuable datasets and results to understand the Kareem and Rudeis formations and their surrounding areas. Finally, our findings suggest a new prospect, including an initial assessment of oil reserves, which can have a direct impact on hydrocarbon production levels at the Ras Ghara oil field.

2. Tectonic and Stratigraphic Settings
The Gulf of Suez is a NW-SE trending continental rift system about 300 km long and 80 km wide (Figure 1a). Its tectonic evolution and stratigraphic framework have been studied in various geoscientific fields and in exploration campaigns for hydrocarbon reservoirs [22,23,24,25,26,28,30,35,36]. The Gulf of Suez rift basin was formed by the counterclockwise rotation of the Arabian plate with respect to the African plate, and its syn-rifting stage commenced with volcanism during the Oligocene [32,33]. The extensional plate motion during the Miocene established four enormous half-graben structures with complex faulting in the Gulf of Suez, which is responsible for several dissected highs and lows. Pre-rift structures controlled the locations and orientations of grabens and accommodation zones. Syn-depositional faulting occurred with tectonic subsidence during the Miocene (Figure 3). The syn-rift sequence ceased towards the end of the Miocene when the plate configuration changed. On both flanks of the Gulf of Suez, the complete stratigraphic sequence was exposed by uplifted and tilted fault blocks.
The Precambrian basement is a part of the Arabian-Nubian Shield, which consists of complex crystalline igneous and metamorphic rocks with dikes. The overlying sequences ranging from the Paleozoic to the present are subdivided into three phases: pre-rift succession (older than the Oligocene), syn-rift succession (Oligocene to the Miocene), and post-rift succession (post-Miocene). Each succession consists of several sedimentary units, which vary in lithology, thickness, areal distribution, depositional environment, and hydrocarbon importance over the Gulf of Suez [22,25,26,28,30,34]. The structural characteristics exhibit the typical NW-SE trending faults of the Gulf of Suez, which form a series of horst, graben, and step-fault blocks and extend to the Miocene and post-Miocene troughs [32].
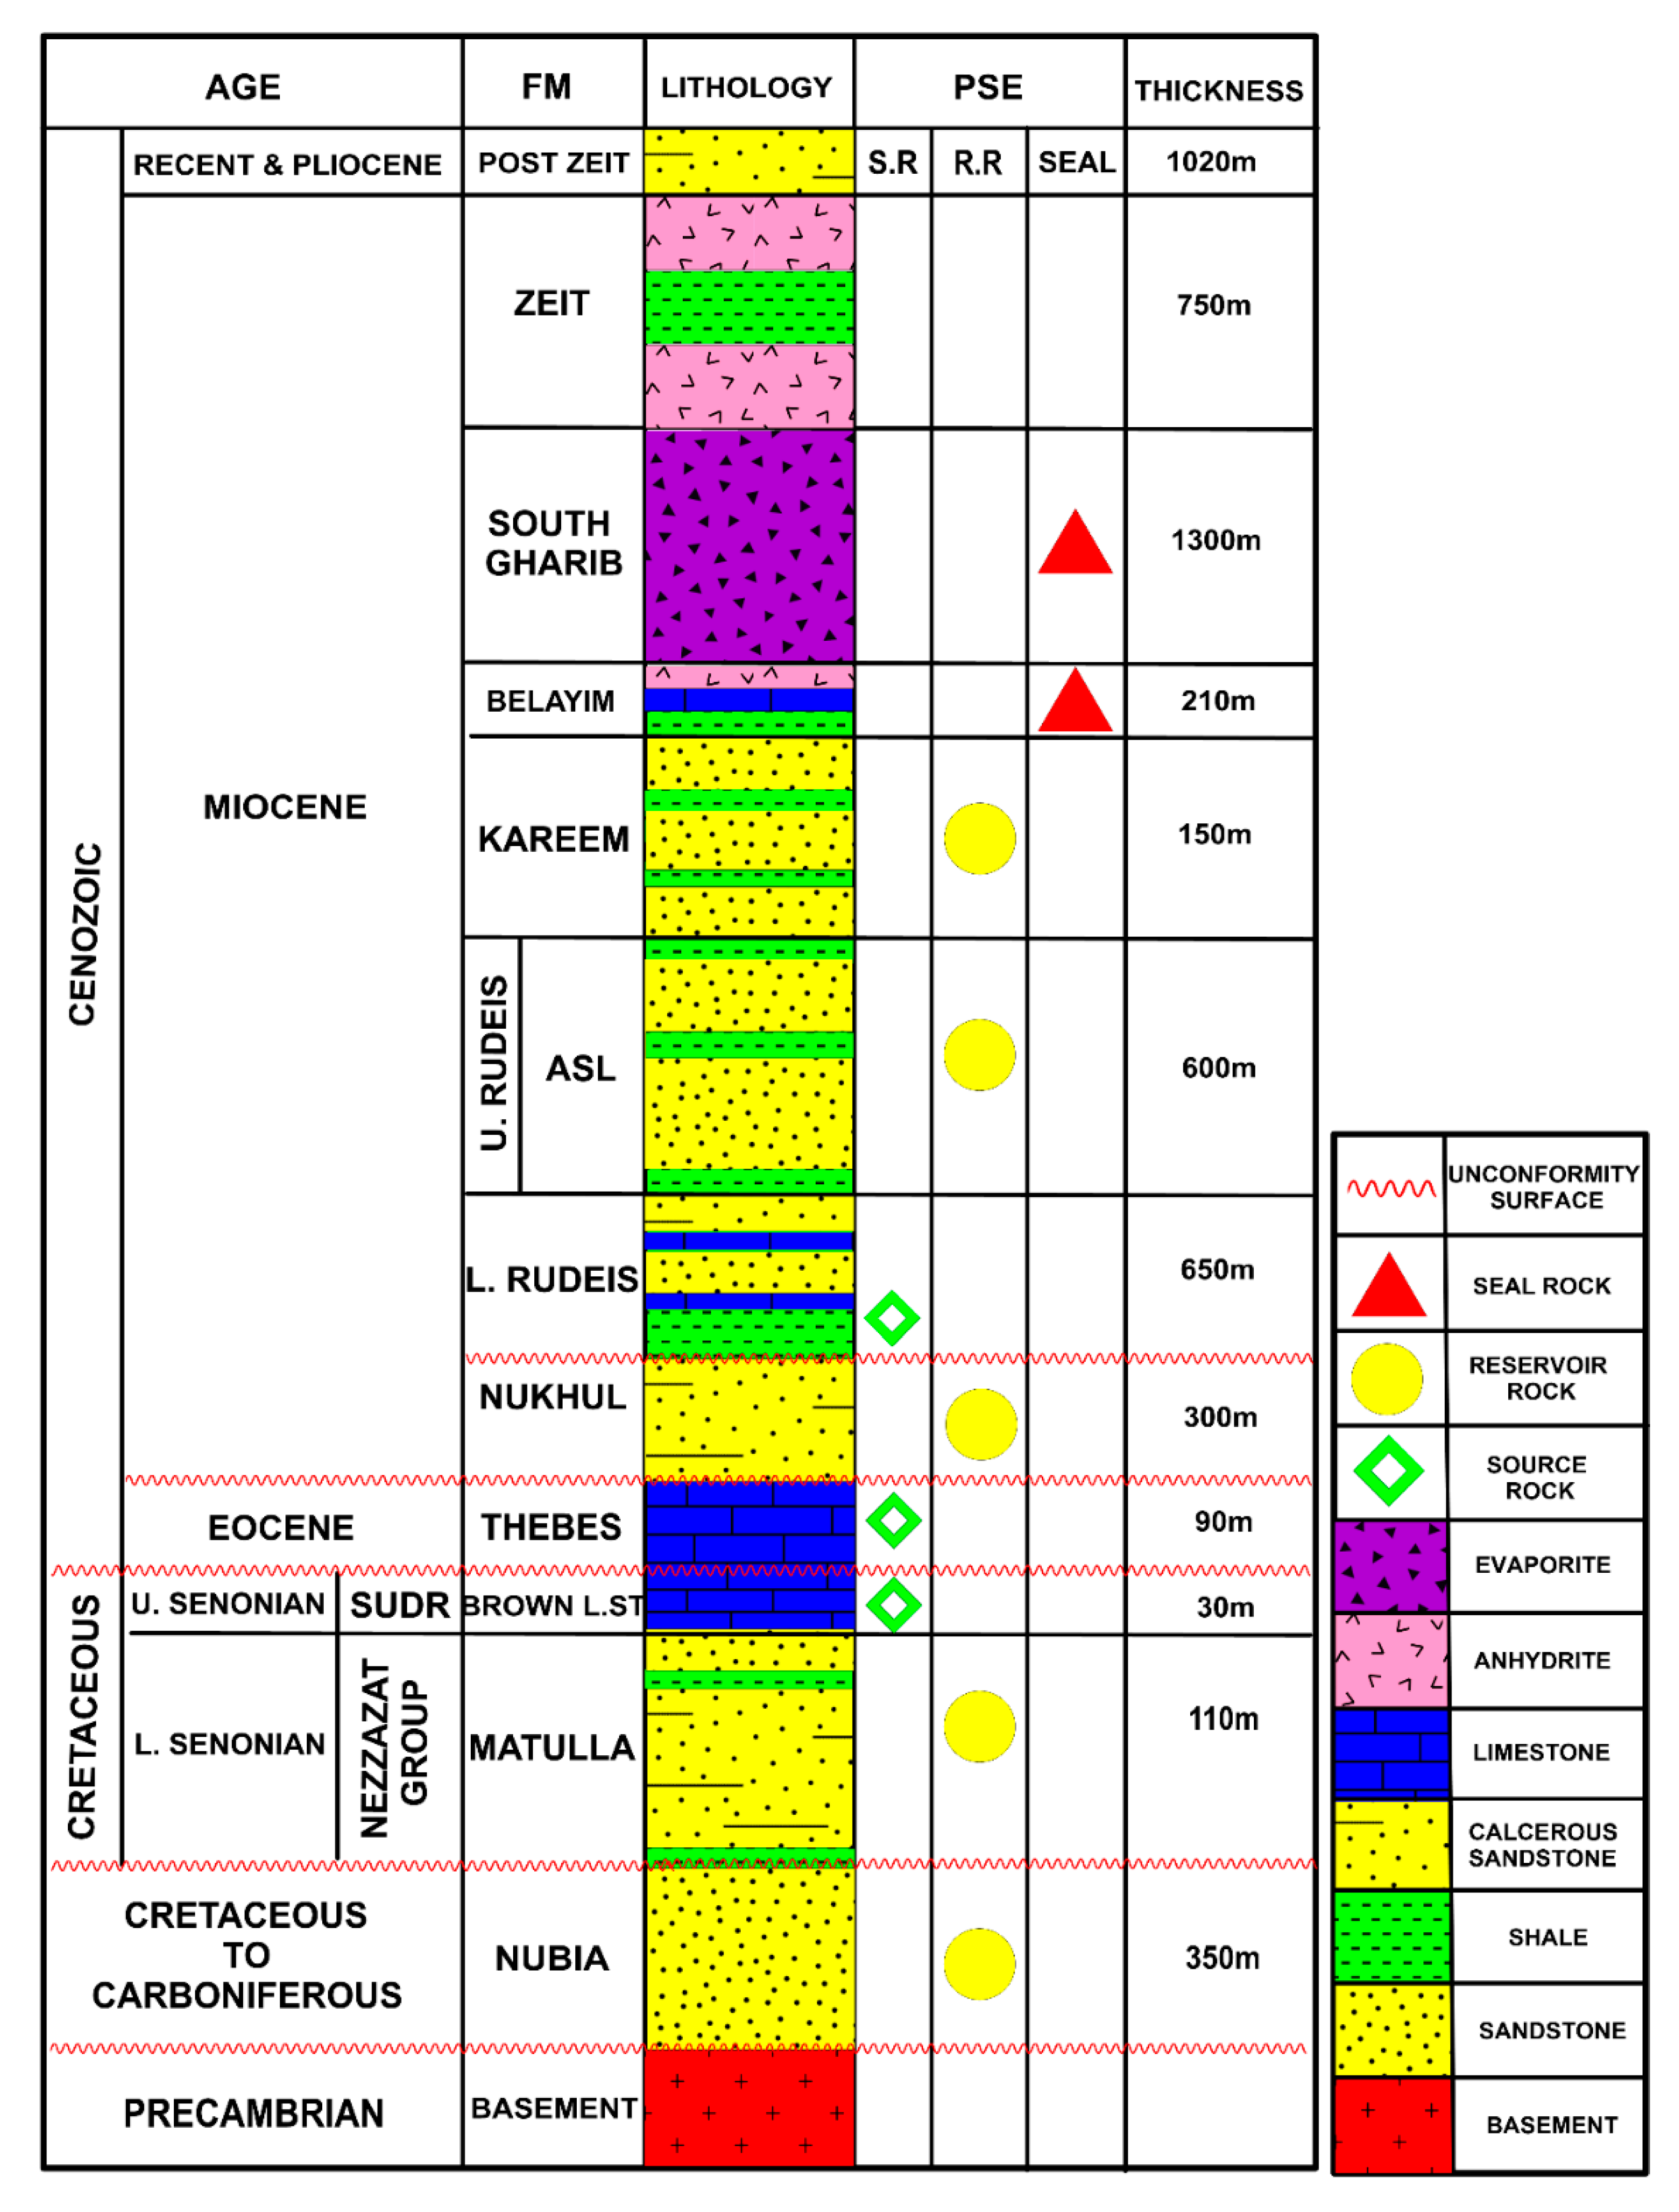
The stratigraphic setting of the Ras Ghara oil field (Figure 2) ranges from the Precambrian to recent in age [2,4,29,33,41]. The pre-Miocene section, consisting of the Nubia, Matulla, Sudr, Esna, and Thebes Formations, is characterized by a comparatively reduced thickness of approximately 580 m.
Figure 2. General stratigraphic column and major petroleum system of the Ras Ghara area in the southern Gulf of Suez, Egypt (modified and after [5,29,32].
Preprints 95655 g002
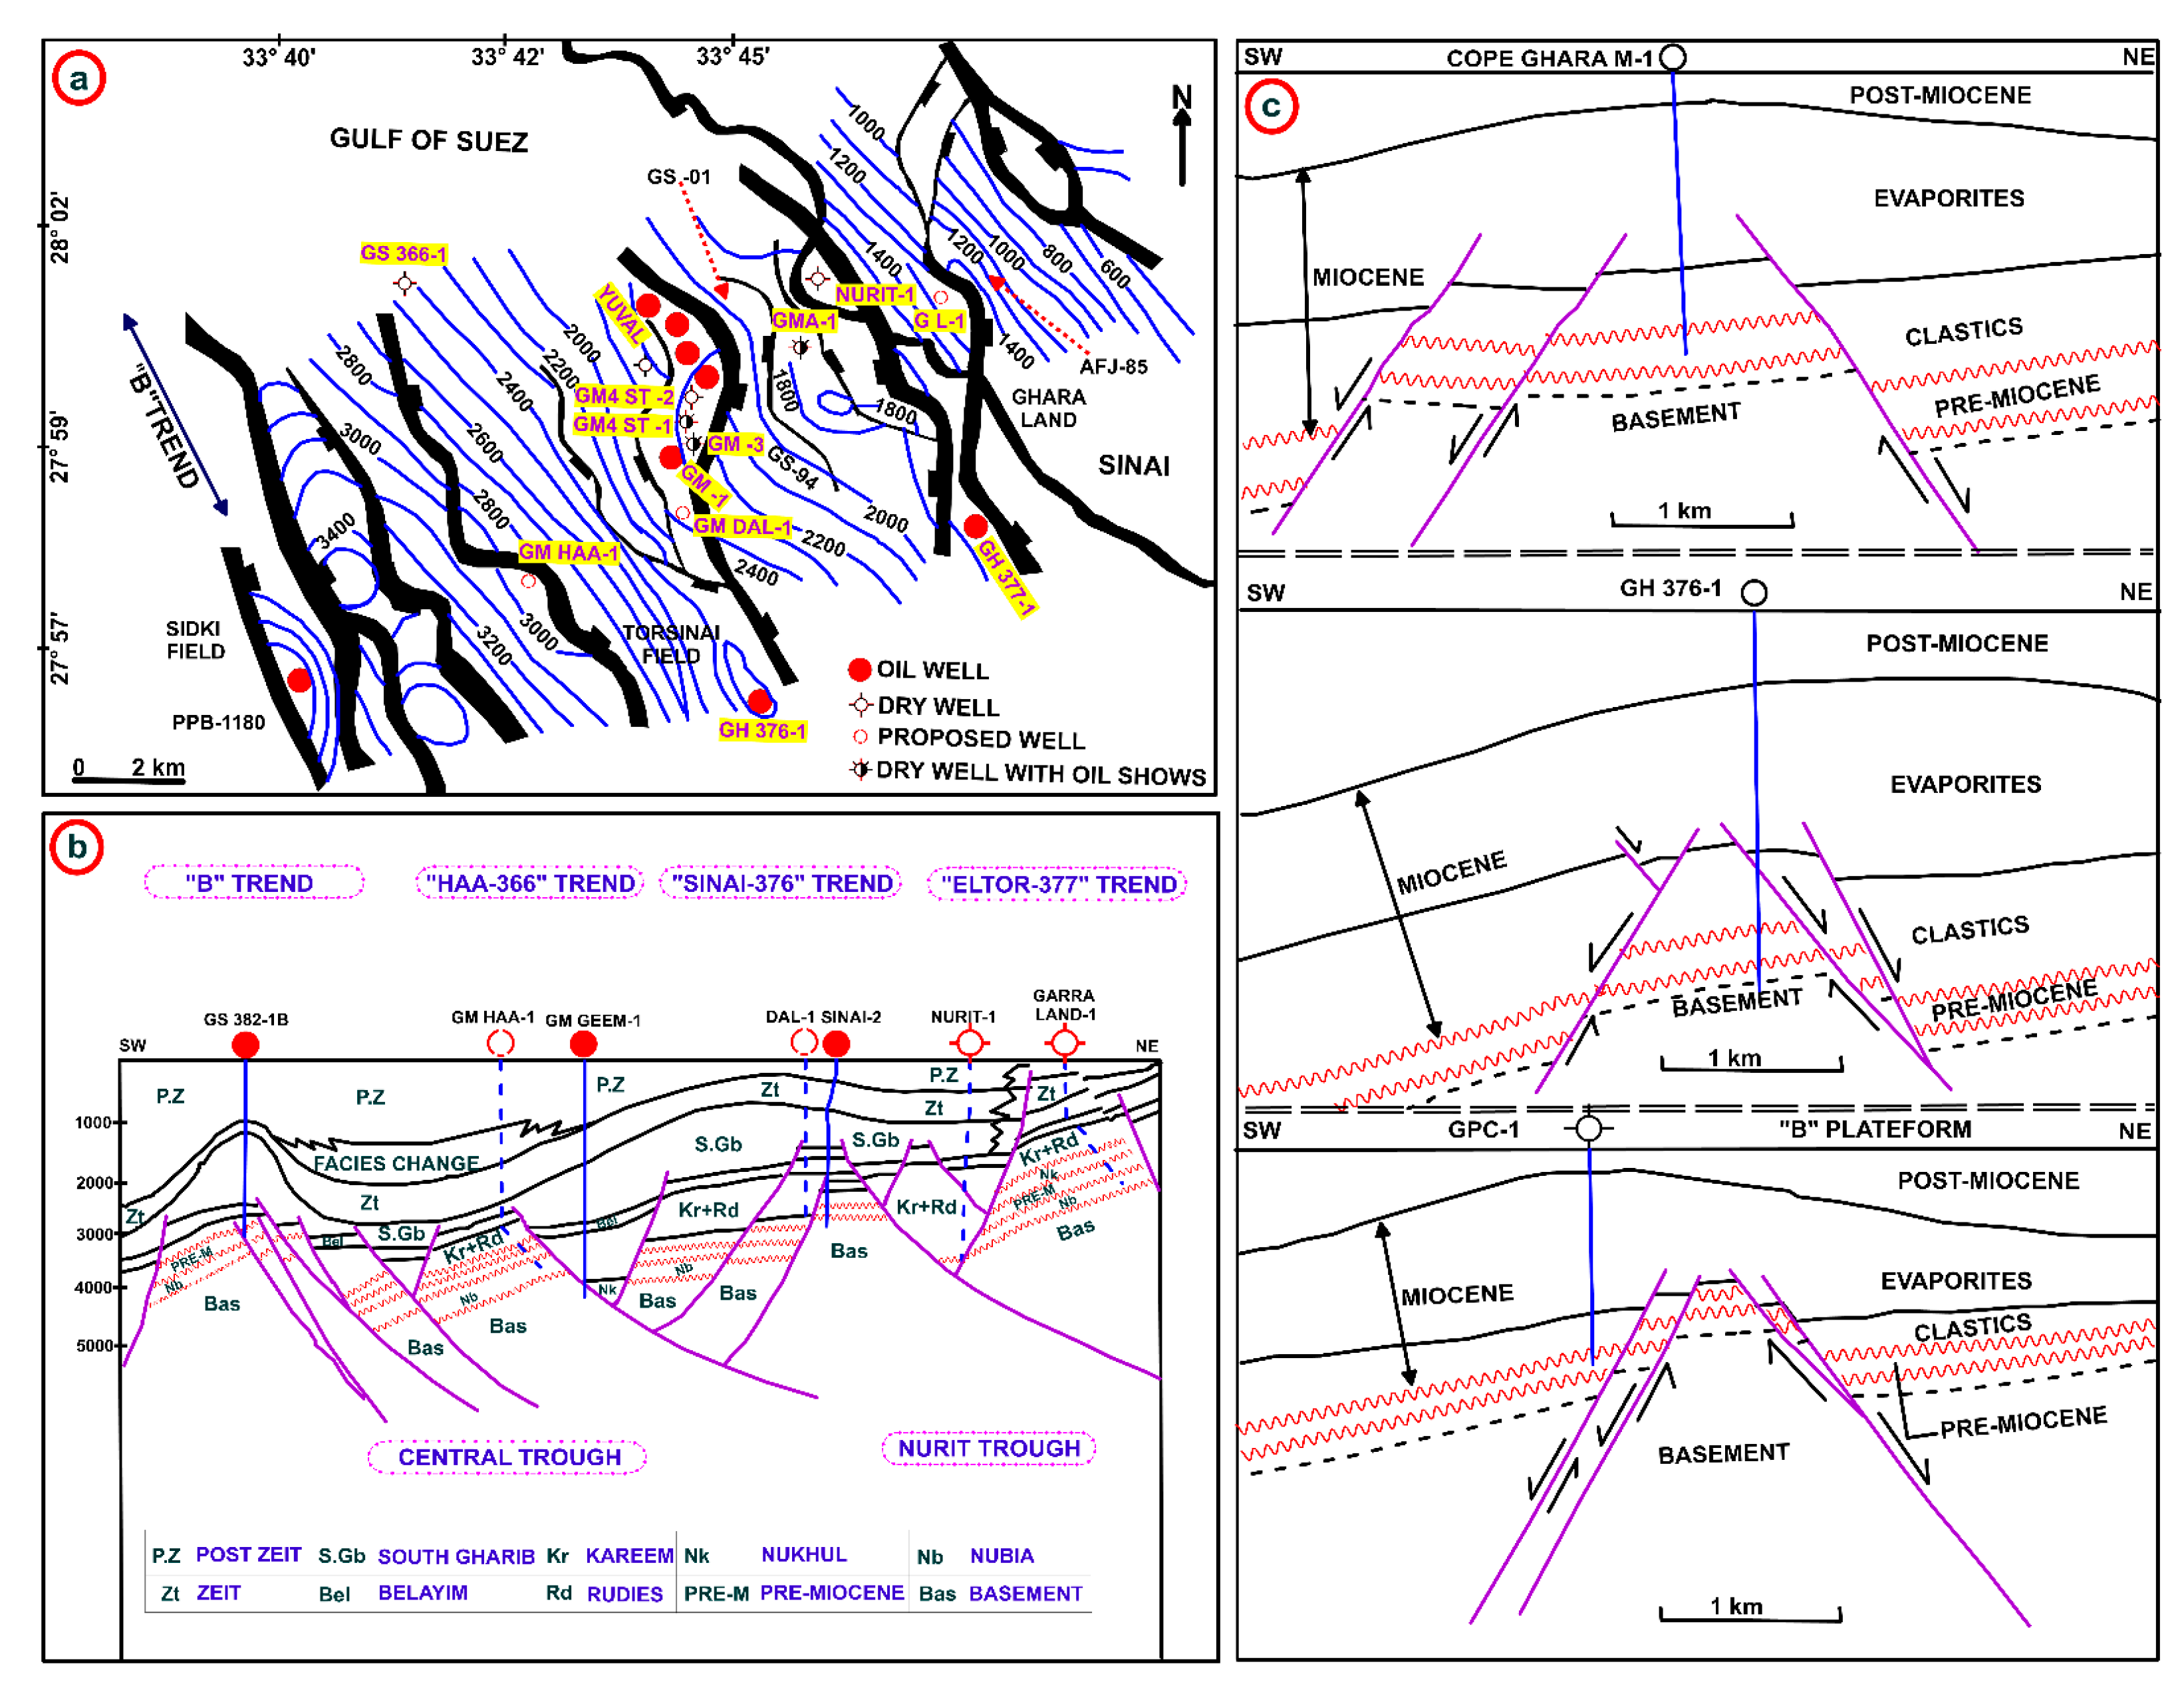
Figure 3. Structural setting of the Ras Ghara and adjacent areas in the southern Gulf of Suez after 32 1996. (a) Structural map with contours and faults on top of the Kareem Formation, with showing well locations. (b) Structural profile showing the major troughs, structural trends, and stratigraphic setting with well locations. (c) Diagrammatic sections of the hydrocarbon-bearing horst complex systems.
Preprints 95655 g003
This pre-Miocene section is unconformably overlain by extensive Miocene clastics and evaporite sequences, surpassing 3,960 m in thickness. The Ras Ghara oil field exhibits a stratigraphic succession characterized by a thick Miocene section encompassing the Nukhul, Rudeis, Kareem, Belayim, South Gharib, and Zeit Formations. The sedimentary layers of the Post-Zeit Formation overlay these Miocene sequences [15,27,34,42,43,49].
The Pre-Miocene stratigraphy, in particular, was largely unexplored, mainly due to severe deformation by faulting as well as regionally sparse distribution by denudation. The pre-Miocene oil reservoir is primarily the Matulla Formation. In contrast, the primary oil reservoirs of the Miocene epoch consist predominantly of the upper-Rudeis and Kareem formations. These formations are distinguished by their lateral facies’ changes as noted by [37,38,41,50,51,52].
The Precambrian granite basement underlies the Nubia Formation, which is composed mainly of Carboniferous to Cretaceous sandstones. It is overlain unconformably by late Cretaceous sedimentary rocks of the Matulla Formation, composed of sandstone, limestone, and shale, and the Sudr Formation, which consists predominantly of the Campanian limestones. The Nubia and Matulla sandstones have shown reservoir potential in the oil field. Cretaceous rocks are unconformably distributed beneath the Eocene Esna Formation and Thebes Formation, which are composed mainly of shale and dark cherty limestone, respectively [32].
There are two important regional unconformities between the Sudr and Esna formations (Cretaceous and Paleogene) and the upper Eocene unconformity overlain by the lower Miocene formations, which significantly affected the thickness of the pre-Miocene section.
The Miocene formations consist of the Nukhul, Lower Rudeis, Upper Rudeis, Kareem, Belayim, South Gharib, and Zeit (Figure 2), which were deposited on marked paleo-reliefs and show rapid lateral changes in facies [2,4,7,28,32,34]. The Miocene section can be divided into two main categories: clastic sequences and evaporite sequences. The Nukhul, Rudeis, and Kareem formations represent the Miocene clastic deposits, which are important reservoir rocks in the Ras Ghara oil field. This study focuses on the Rudeis and Kareem formations. According to previous studies (e.g., Brooks and Hagras, 1971; Takasu, et al., 1982; Tewfik, et al., 1992; 30 and Salah, 1994; 32, 1996; 34, 2020), the Rudeis Formation varies greatly in lithology and thickness, depending on the depositional environment changes and irregular paleo-relief in which the deposition occurred. The active and rotational faulting provided a topographic relief that was progressively submerged by a middle Miocene transgression.
The thickness ranges from 11 to 1304 m, and it is chiefly composed of sandstones, argillaceous limestone, and calcareous shale with sandstone interbeds and streaks. The Lower Rudeis Formation is considered a source rock, while the Upper Rudeis Formation is a major sandstone reservoir. A shallow to deep water environment for clastic deposition has been suggested for this gulf margin to marine basin setting [30]. The Kareem Formation is characterized by sandstones, limestones, and small bands of shale and limestone with very fine anhydrite streaks, which correspond to a shallow and partly open marine depositional environment with localized lagoon conditions [43]. Its thickness ranges from 15 to 539 m in the region, showing thinned sand bodies towards the margins [53] (Tewfik, et al., 1992). The Miocene evaporite, anhydrite, shale, and limestone sections are described in the Belayim, South Gharib, and Zeit formations. The post-Miocene units consist of loose sands and streaks of shale and clay, which are distributed throughout the region.
In the Ras Ghara area, three distinct Miocene sections have been developed as major reservoirs, associated with excellent limestone source rocks and evaporite seal rocks [32]. The Miocene reservoirs are found in the Kareem, Rudeis, and Nukhul sandstones (Figure 2). Dolomitized reef limestones also have reservoir potential in the Miocene units [30]. The Kareem sandstones represent the primary reservoir and have an average thickness of 79 m with an average effective porosity of 20%. The Belayim fault system had an impact on the distribution of sandstones throughout the field. The Rudeis sandstone beds are the second-most significant reservoir, with a total sand thickness of about 65 m and an average porosity of 16%. The basal Miocene sandstones of the Nukhul Formation are the third major reservoir encountered in the Ras Ghara field; the about 17-meter-thick sandstone reservoir shows 18% average porosity and 22% water saturation.
The Miocene formations correspond to the sediments that were formed during the initial stage of the syn-rift period in the Gulf of Suez rift. Due to its diverse lithofacies distribution and excellent structural trap closure, it serves as the main hydrocarbon reservoir for numerous oil fields in the region [54,55].
Based on source rock analytical data [2,4,40] excellent source rock properties have been determined for the late Cretaceous limestone of the Sudr Formation and good to poor properties for the Eocene limestones and Miocene shales, which are distributed from the central trough to the Ras Ghara traps. Based on prior studies, the migration of hydrocarbons in the clayey limestones occurred along the fault plane to the Miocene sandstones [2,4,41]. The Miocene evaporites, reaching a maximum thickness of 1,812 m, formed a major seal of the pre-Belayim reservoir sections and structures (Figure 2).

3. Data and Methods

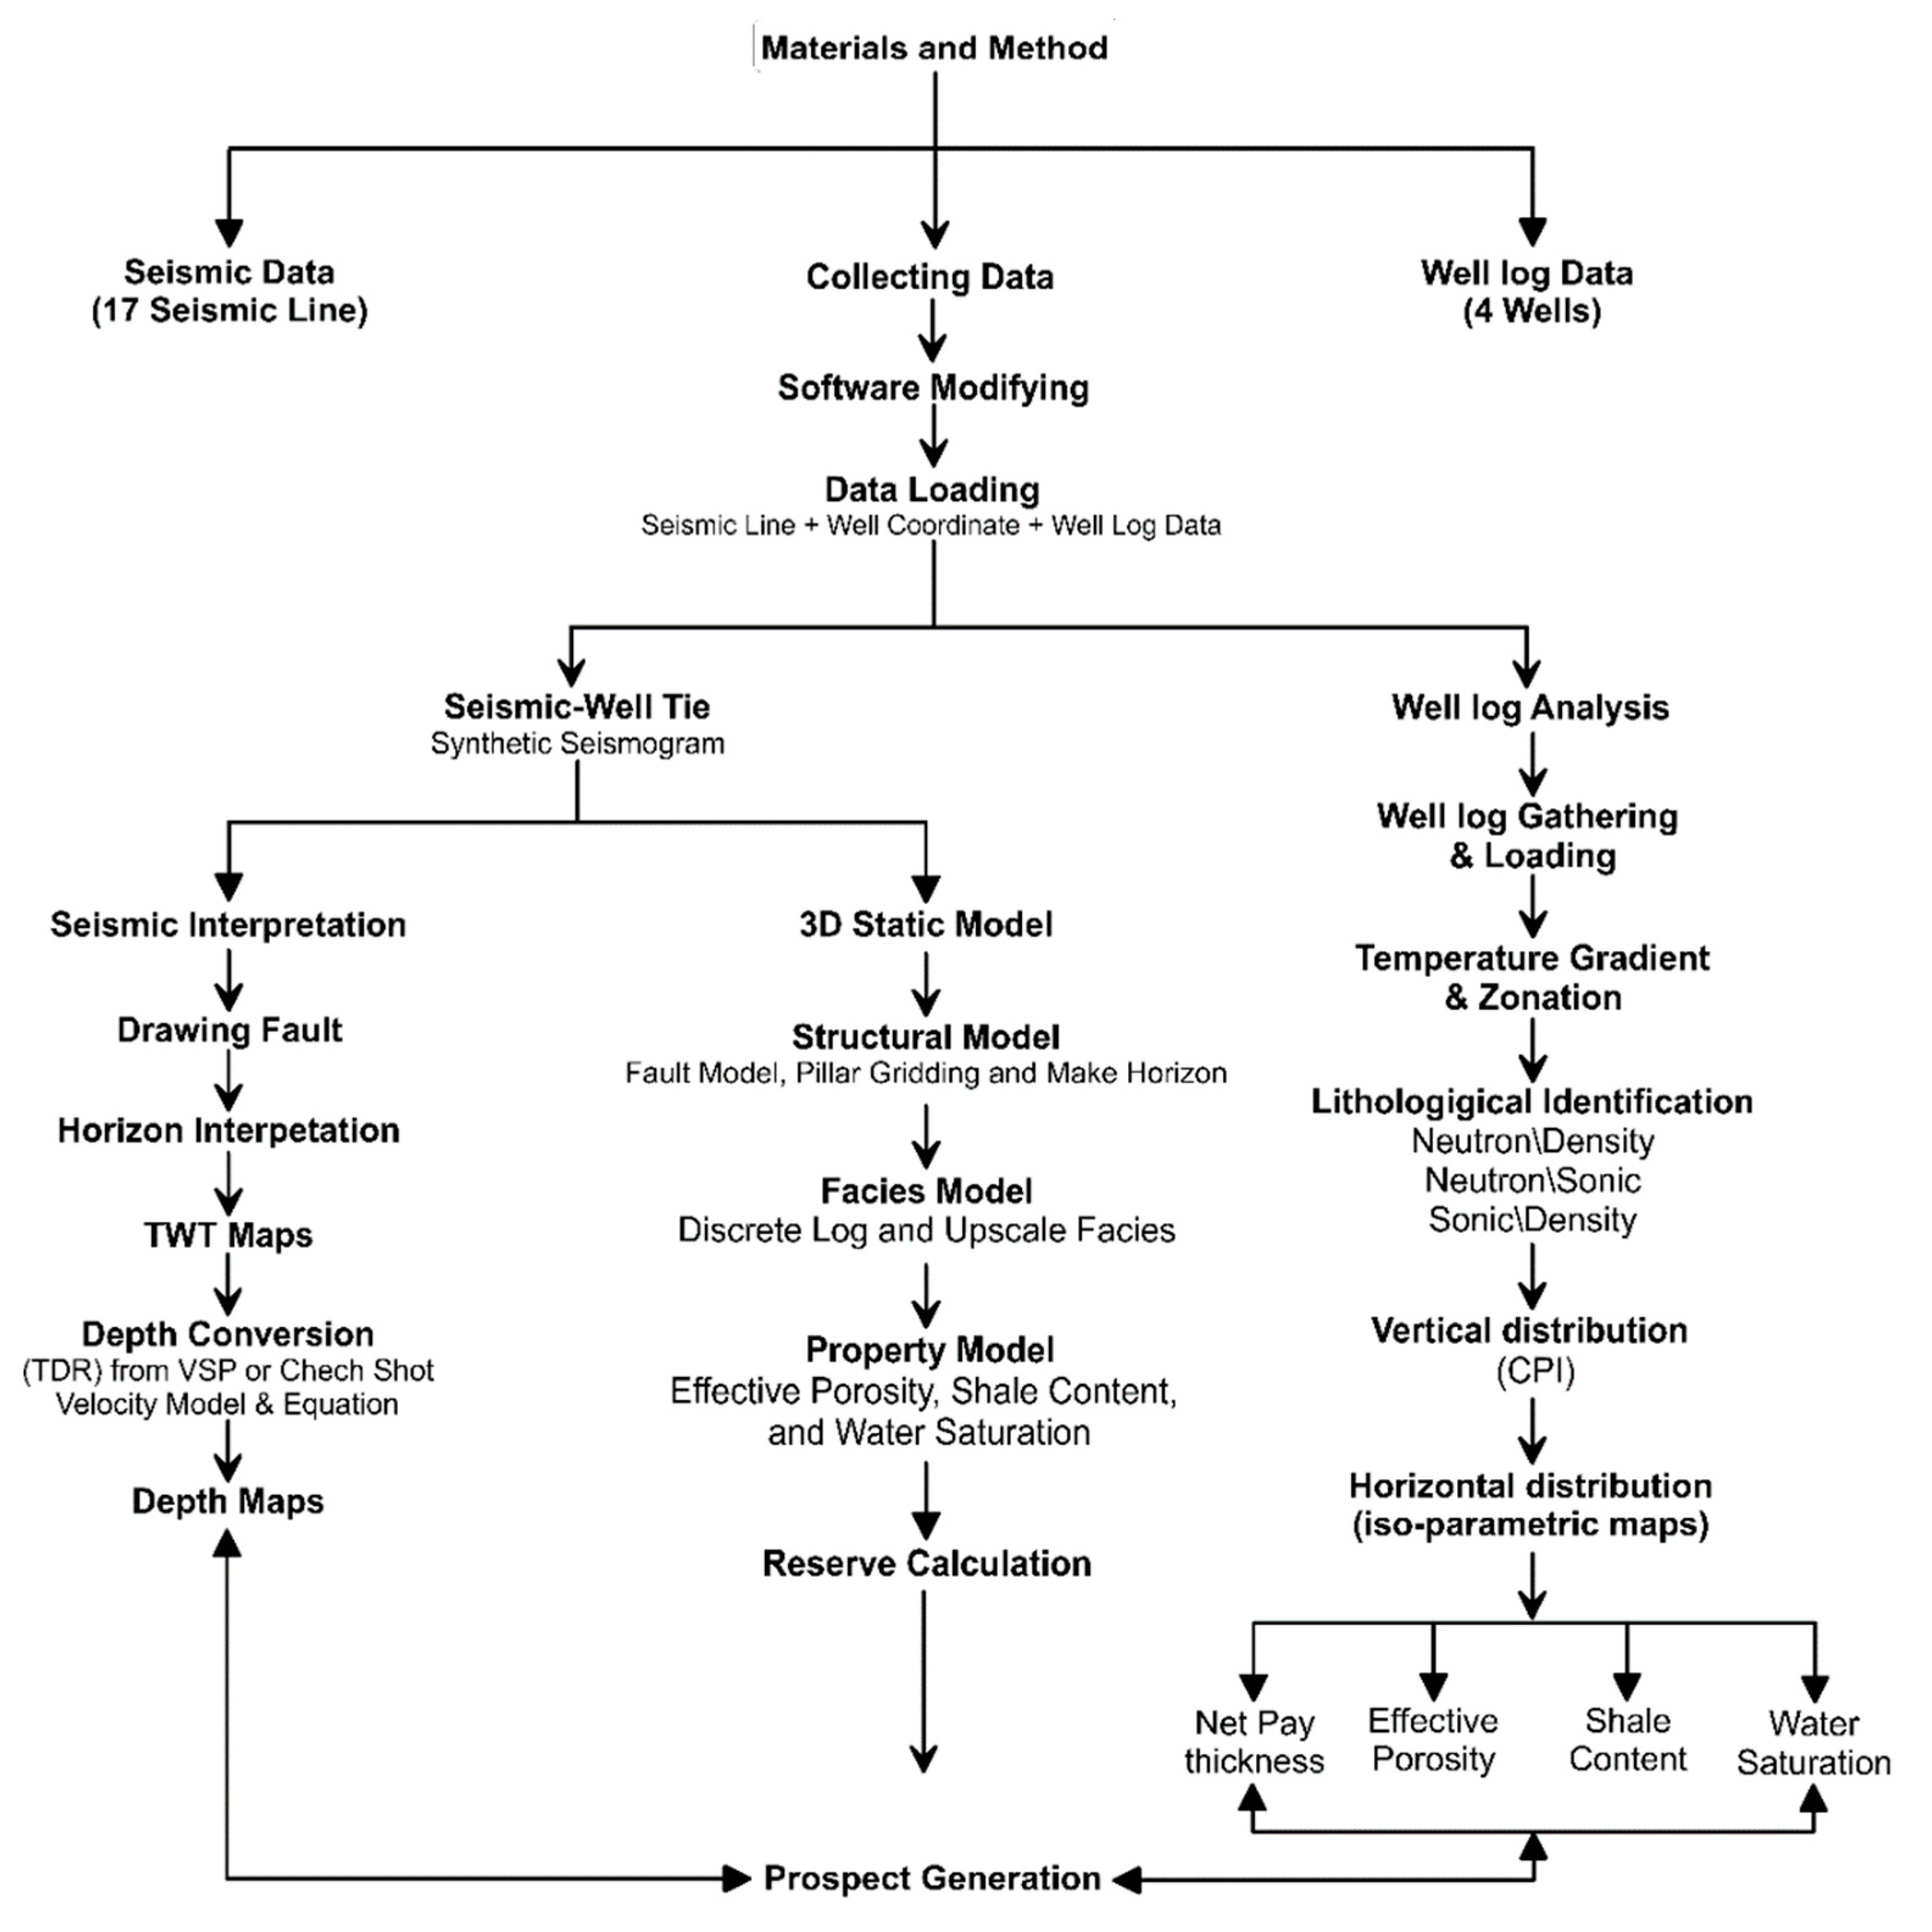
This study comprises four main components: well log analysis, seismic interpretation, 3D static reservoir modeling (structural-facies-property), and hydrocarbon volumetric calculation. The well log analysis involved utilizing various open-hole logging tools, including gamma-ray log (GR), sonic log (DT), density log (ROHB), neutron log (NPHI), and resistivity log (LLS and LLD). These logs were obtained from eight wells (GL-1, GM-A1, GM-A2, SINAI-6, GM-4-ST-2, GM-4, GM-1, and GM-D2) located across the field in a northeast to southwest direction. Additionally, 19 two-dimensional post-stack migrated seismic data were available (Figure 1b). The seismic and well log data were imported into Petrel™ 2017 Schlumberger and Interactive Petrophysics (IP) 2018 software. Quality control (QC) was performed, and the data were organized in respective databases. The stepwise integrated methodology employed in this study is illustrated in Figure 4.
Figure 4. Workflow highlighting various steps and methods employed in this study for reservoir characterization and prospect assessment of the Ras Ghara oil field, Southern Gulf of Suez, Egypt.
Preprints 95655 g004

3.1. Petrophysical analysis

Petrophysical analysis plays a crucial role in petroleum exploration as it involves the evaluation of reservoir rock properies; lithology, net pay thickness, shale volume, effective porosity), and fluid properties (water and hydrocarbon saturation) of Kareem and Rudeis reservoirs in the Ras Ghara oil field. The procedure typically includes several steps to characterize and quantify these properties.
The first step is to collect relevant data from various sources, such as well logs, core samples, and production data. Well logs provide measurements of different physical properties, including gamma ray, resistivity, porosity, and sonic velocity, which are essential for petrophysical analysis. The collected well logs are subjected to quality control measures to ensure data accuracy and integrity. This involves checking for data gaps, outliers, and any other artifacts that may affect the analysis. Once the quality control is complete, the well logs are interpreted to determine key petrophysical parameters. This step involves identifying different rock and fluid types, calculating porosity, permeability, water saturation, and other properties of interest.
Cross-plots are graphical representations that help analyze the relationships between different petrophysical parameters. These plots, such as neutron/density and M/N cross plots which performed for the GM-A1 well to identify the main lithology for the selected reservoirs, aid in identifying trends, correlations, and potential reservoir characteristics. Petrophysical analysis assists in identifying the types of fluids present in the reservoir, such as oil, gas, and water [45,46,47,56]. This is achieved by analyzing the response of different petrophysical measurements to the presence of various fluid phases.
With the petrophysical parameters determined, the next step is to estimate the volume of hydrocarbons in place, assessing reservoir quality, and identifying potential flow barriers or compartmentalization within the reservoir. Petrophysical analysis results are integrated with existing 3D geological models and geological interpretations. This integration helps refine the understanding of the reservoir architecture, facies distribution, and overall depositional environment.

3.2. Seismic Data Interpretation

Seismic data interpretation is a fundamental process in geophysics and petroleum exploration. It involves analyzing and interpreting the seismic reflection data to gain insights into the subsurface geology and identify potential hydrocarbon reservoirs. The actual interpretation process involves the identification and mapping of geological features and structures based on the seismic data. This is typically done by interpreting seismic horizons, which are distinct reflectors observed in the seismic data and identified based on well-to-seismic matching [57]. Interpreters analyze the seismic amplitudes events (reflections) and variation patterns of seismic attributes to delineate seismic horizons, faults, channels, reservoirs, and other subsurface features of interest. Since a spatial interpretation for improved horizon evaluation is required to model the reservoir surfaces, the seismic interpretation was set in both lines and crosslines.
To evaluate the seismic reflection data interpretation, it is important to compare it with well data. Well logs, core data, and other well information are integrated with the seismic interpretation to establish a correlation between the interpreted seismic horizons and the subsurface rock properties. The interpreted seismic data is used to analyze the structural and stratigraphic framework of the subsurface. This involves identifying faults, folds, depositional environments, and other geological features that influence the distribution and trapping of hydrocarbons.
To investigate fault dips and reservoir structural trends, a seismic survey was conducted, considering the prevailing structural elements [58,59]. The subsurface structures, including folds, faults, and unconformities, were investigated using 19 seismic lines (Figure 1b).
Seismic interpretation results are often visualized and analyzed in three dimensions (3D) using Petrel software. Schlumberger PetrelTM software 2017 was used for 2D seismic interpretation, well-to-seismic ties, surface mapping, and 3D static modeling. 3D visualization allows for a better understanding of the spatial relationships between geological features and assists in building geologically realistic subsurface models. After the volume visualization and attribute presentations, manual interpretation of faults and horizons was performed mainly for the Miocene reservoir portion. In the manual interpretation conducted, event termination, change in seismic waveform character, and reflection attitude changes guided the fault interpretation quality control and identification. Fault plan dips might be greater than actual dips due to the inherent imaging problems of 2D seismic data, especially in case of steep dips. The structural interpretation was combined with stratigraphic and lithofacies data from wells, which allow us to analyze the subsurface setting as well as evaluate the impacts of faulting and structural deformation in the Miocene deposition and pre-Miocene deposits. The seismic interpretation process involved correlating seismic data with well log data to establish consistent stratigraphic sequences and understand the relationship between seismic reflections and stratigraphy. To link seismic interpretation and well-log data, labelled wells with stratigraphic tops converted from time to depth were located on the seismic time sections, which were correlated with horizons at the appropriate times [60]. Formation well top data from GL-1, GM-A1, GM-A2, SINAI-6, and GM-4-ST-2 wells were overlaid on GS 13-83 and FJ 88-05 for formation location analysis and assessment, providing a comprehensive understanding of formation attributes. The horizons were identified on each seismic inline/crossline cross-section by differentiating marker strata and aligning them with corresponding points identified on well logs, after well-to-seismic matching.. Significant faults were selected, incorporating crucial elements for characterizing the structural pattern and the trapping mechanism of hydrocarbon accumulations. The interpreted seismic time horizons were transformed into structural depth surfaces

3.3. Three-dimensional static modeling

Three-dimensional static modeling is a critical step in reservoir characterization and field development planning. It involves constructing a geologically and geophysically consistent representation of the subsurface reservoir using available data. Gather all available geological, geophysical, and petrophysical data relevant to the reservoir. This includes well logs, core data, seismic data, production data, and any other pertinent information. Evaluate the data quality and validity for modeling purposes.

3.3.1. Structural Modeling

Interpret the seismic data and incorporate structural geological concepts to create a framework for the reservoir structure. Identify and map key horizons, faults, and other structural features. This can involve seismic interpretation, fault interpretation, and horizon picking.
Following the completion of seismic data interpretation and the generation of structural maps, the subsequent step involved constructing a structural model for the designated research region. The proposed model comprised three main stages. The first stage involved characterizing the fault model that influenced the investigated formations. This was followed by the establishment of pillar gridding and the construction of the overall model framework. Finally, the horizons were delineated and categorized, allowing for their further subdivision into layers. This subdivision facilitated the identification of structural effects, variations in rock facies, and changes in the petrophysical properties of the Kareem and Rudeis reservoirs.

3.3.2. Stratigraphic Modeling

Based on well logs and seismic interpretation model, a geostatistical facies and rock property distribution of different stratigraphic units within the reservoir was estimated. Thus, defining and mapping key reservoir aspects such as facies variations, and lithological changes.
For static modeling, this study integrated multiple datasets as well as techniques, including well upscaling and reservoir modeling algorithms, which created 3D property models by populating structural models with lithofacies and petrophysical properties. Depending on the modeling objectives and computational constraints, upscale the geocellular model to a coarser grid for dynamic flow simulation purposes. Upscaling involves aggregating multiple cells into larger representative cells while preserving key flow properties.

3.3.3. Property Modeling

Estimate and model reservoir properties such as porosity, permeability, saturation, and other relevant petrophysical parameters. Use well log data, and geostatistical techniques to predict and interpolate these properties between wells. Consider reservoir heterogeneity and anisotropy while modeling.

4. Results and Discussion

This section may be divided by subheadings. It should provide a concise and precise description of the experimental results, their interpretation, as well as the experimental conclusions that can be drawn.

4.1. Well-log analysis

An extensive examination of Ras Ghara well data was carried, focusing specifically on eight wells situated within the selected study region (as seen in Figure 1b). The primary objective of this study was to evaluate the petrophysical properties the Miocene Kareem and Rudeis reservoir formations. The reservoirs’ formation water resistivity (Rw) ranged from 0.008 to 0.103 ohm.m. Following that, the specified cutoff threshold values, which include an effective porosity of 10%, a water saturation up to 50%, and a shale content less than 35%, for the southern Gulf of Suez Basin were applied,
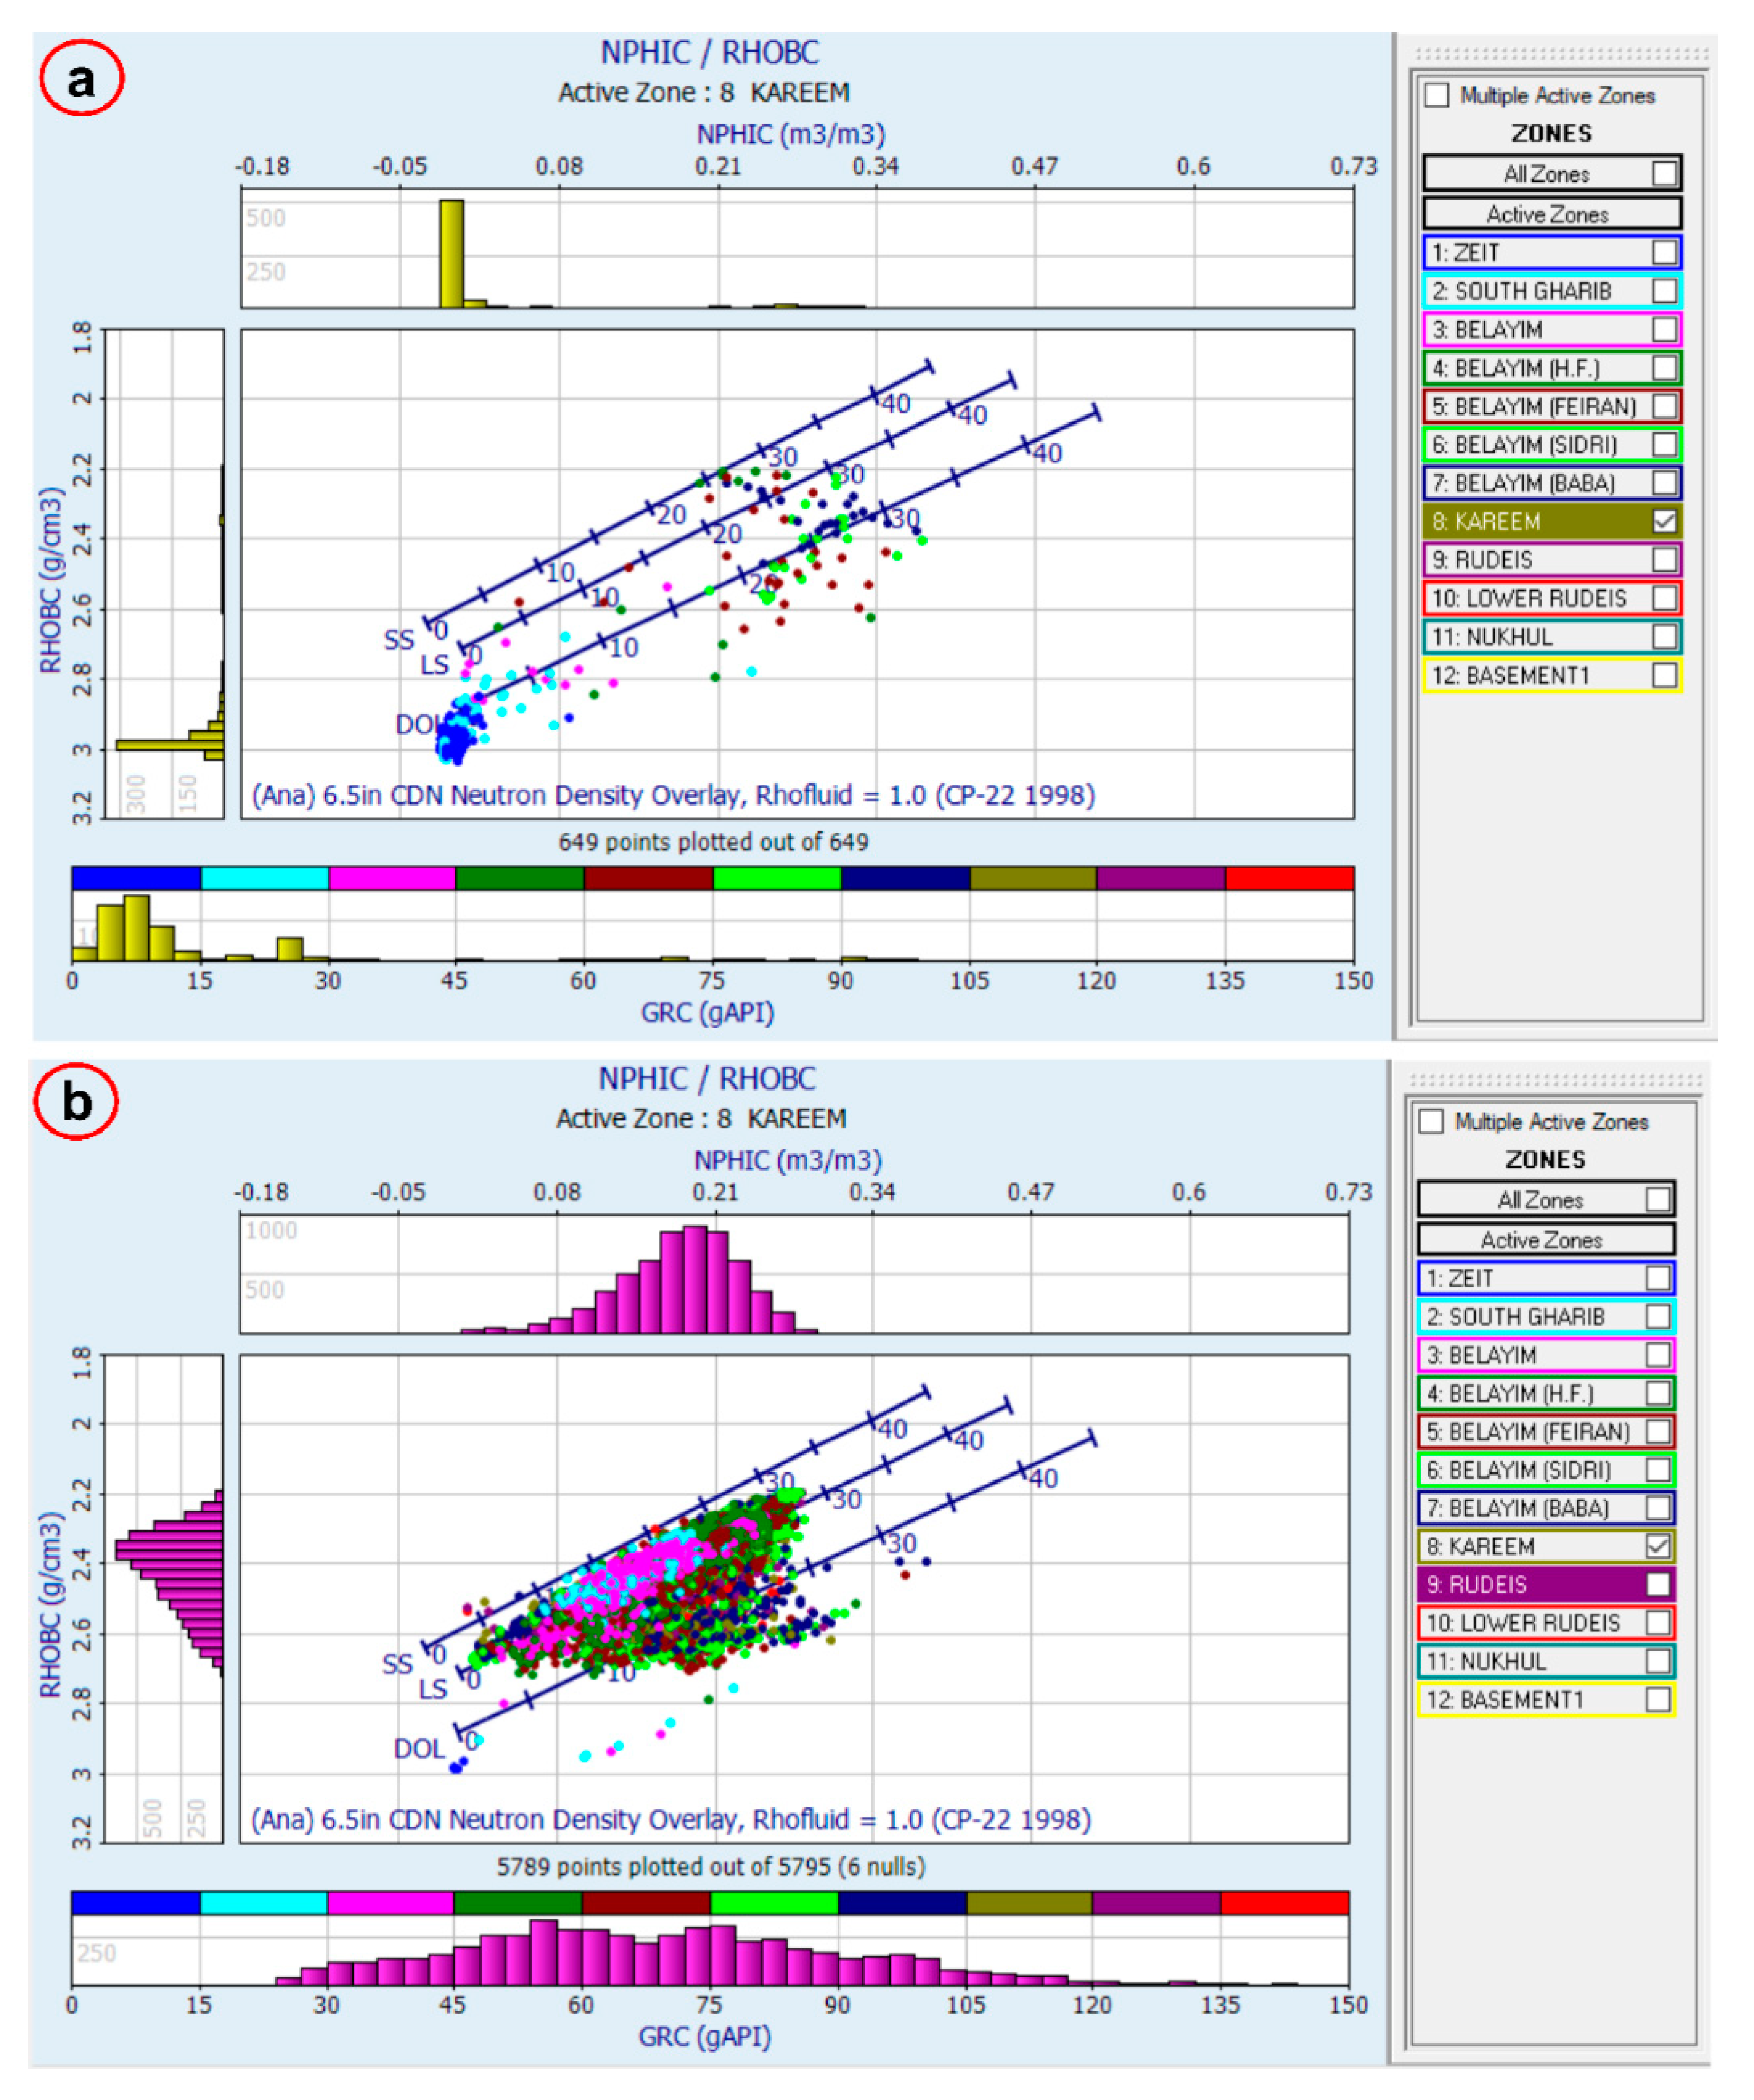
The procedure involves identifying and analyzing the individual components and characteristics of the geological lithological members of a reservoir formation. Neutron-porosity and density cross plots are frequently used to identify lithological characteristics. Geoscientists use neutron-porosity density cross plots to differentiate between various lithologies in the reservoir, determine the porosity of the reservoir rocks, and assist in evaluating the fluid saturation within the reservoir [61].
From the Neutron-porosity\Density cross-plots in the GMA-1 well (Figure 5a) of the Kareem reservoir in the study area, it is observed that a dense cluster of points are scattered close (shale and anhydrite effects) to the clean sandstone line, especially for Neutron porosity greater than 20%. Less than about 40% of the points coincide with or in the vicinity of the limestone\dolomite trend with tight cluster that is possibly low porosity anhydrite. Effective porosity is ranging from 16 to 27% in GMA-1 well and density is ranging from 2.1 to 2.7 g/cm3, this indicates that the reservoir lithology is mainly composed of about sandstone and shale with minor intercalation of limestone, dolomite,and evaporites. Dolomitization reflects porosity enhancing diagenetic history of the carbonate reservoir of this field.
Figure 5. Lithological identification Neutron-density cross-plots for the Kareem and Rudeis reservoirs in the GMA-1 well. (a) Kareem Formation, (b) Rudeis Formation.
Preprints 95655 g005
The Neutron-porosity\Density cross-plots in the GMA-1 well (Figure 5b) of the Rudeis reservoir in the study area, it is observed that most of the plotted points are scattered close to the limestone line, especially for Neutron porosity greater than 20%. Effective porosity is ranging from 7 to 29% in GMA-1 well and density is ranging from 2.1 to 2.7 g/cm3, this indicates that the reservoir lithology is mainly composed of about 85% limestone and shale with minor intercalation of sandstone.
An M-N cross-plot [61], which is independent of primary (intercrystaline and intergranular) porosity and commonly referred to as Pickett plots, is extensively utilized in the field of petrophysics for the purpose of identifying the matrix mineralogy (lithology) of reservoir rocks.
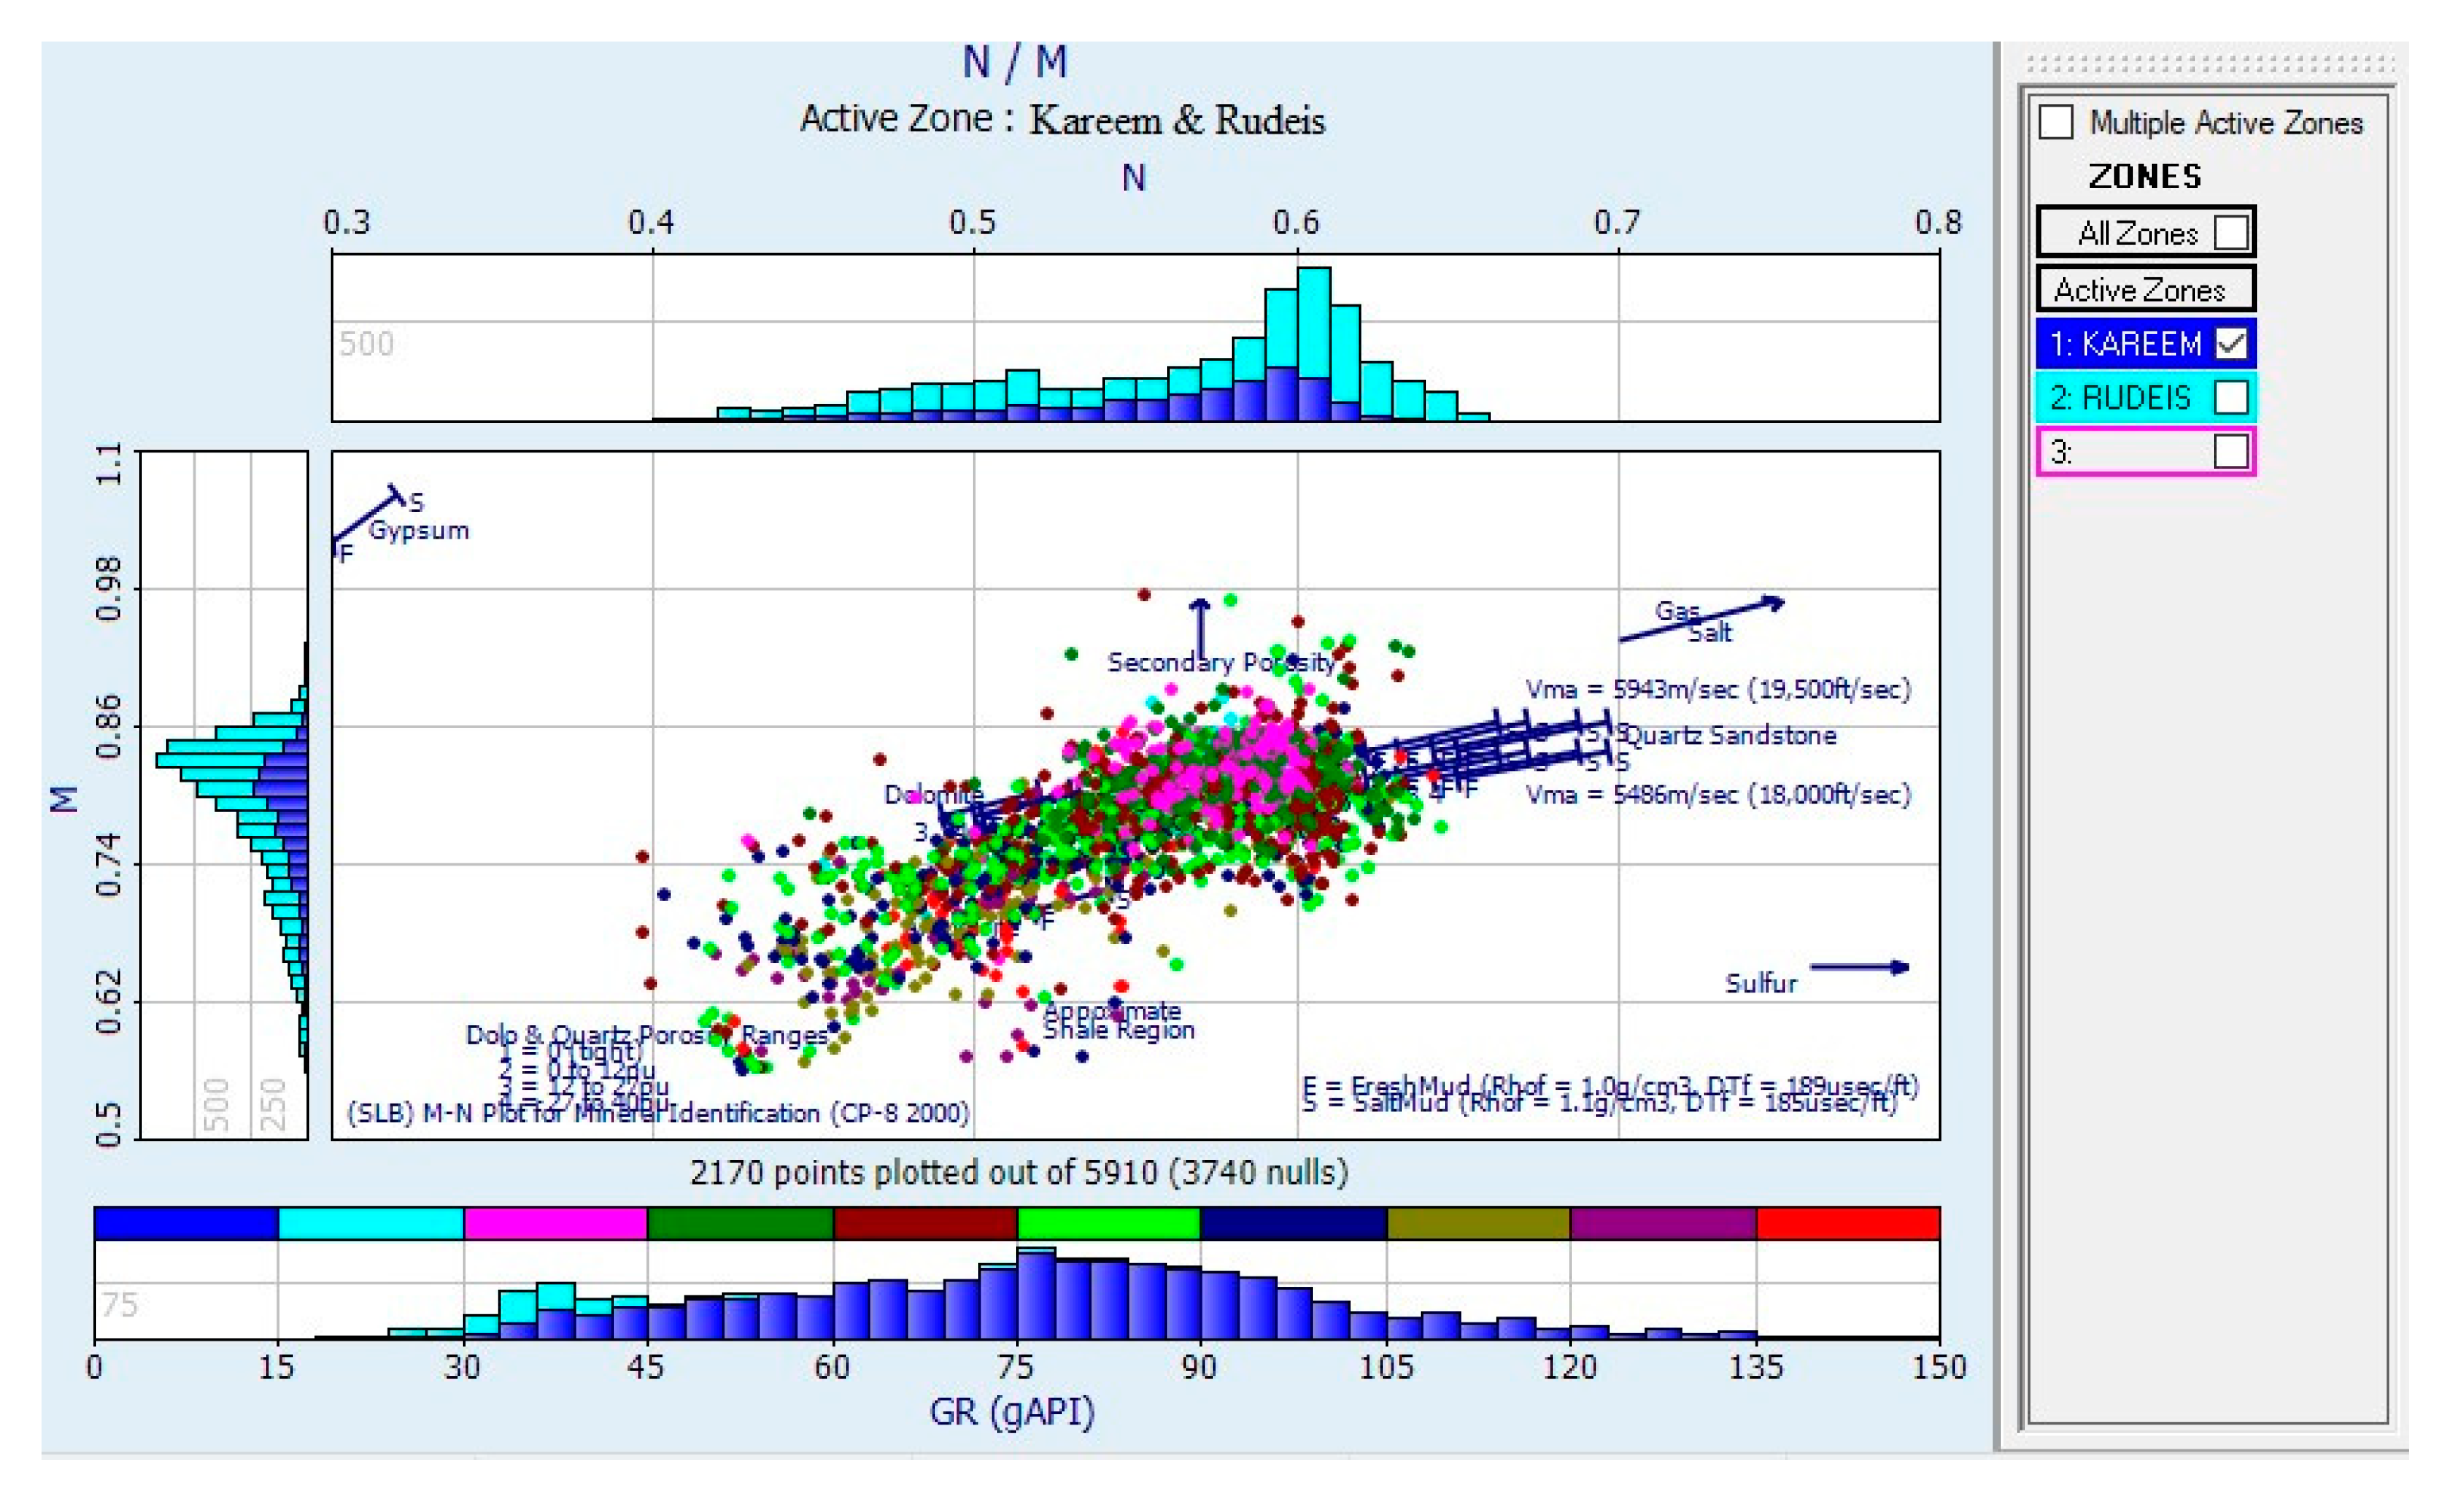
The M versus N in the GM-4 well in Ras Ghara oil field (Figure 6), reflects a dominant lithotypes of limestone, sandstone, and shale with considerable proportion of anhydrite. Most data points are distributed around the region between the calcite and dolomite regions, with a few data points in proximity to the quartz region. The observed geological characteristics may suggest the existence of limestone reservoirs, as well as the presence of shale formations interspersed with occasional sandstone layers. The upward scattering of certain spots is attributed to secondary porosity. Computed Gamma ray color scale is used to evaluate the consistency of clustering from one cross-plot to another.
Figure 6. M/N cross plot in GM-4 well reflects a dominant lithotypes in the Kareem and Rudeis formations.
Preprints 95655 g006
Following the determination of the rock facies type and the calculation of petrophysical properties within the reservoir, the findings were vertically depicted to showcase the vertical variations in both the rock facies and the properties across the study wells located in the Ras Ghara oil field. The depths observed in the study wells varied from, 1501-1590 m in GL-1 well, 1992-2014 m in GMA-1 well, 2192-2466 m in GM4 well, 2278-2334 m in GM4 ST2 well, 2183-2264 m in GM-1 well, 2168-2250 m in GMD-1 well, and 2350-2400 m in GMD-2 well for Kareem and Rudeis formations respectively, while the Rudeis Formation reach its formation top at 2172 m in SINAI-6 well. Regarding the petrophysical quality of the reservoir layer, the Kareem reservoir properties can be summarized as follows: The net pay thickness of the reservoir layer varied from 3 m in GMA-1 and GMD-2 wells to 48 m in GM-1 well. Additionally, the effective porosity values ranged from 14% in GL-1 well to 33% in GMD-2 well. The shale content within the research region exhibited an approximate value of 23% in the GM4 ST2 well. The water saturation levels in GMD-1 and GMA-1 wells varied between 23% and 65%, respectively. Consequently, the saturation percentage of hydrocarbons might potentially exceed 77%, as seen in Table 1.
The Rudeis reservoir properties can be summarized as follows: The net pay thickness of the reservoir layer varied from 4 m in GMD-1 and GL-1 wells to 58 m in GMD-2 well. Additionally, the effective porosity values ranged from 15% in GM4 ST2 and GMA-1 well to 25% in GMD-1 well. The shale content within the research region exhibited an approximate value of 26% in the GM4 ST2 well. The water saturation levels in SINAI-6 and GMA-1 wells varied between 16% and 60%, respectively. Consequently, the saturation percentage of hydrocarbons might potentially exceed 84%, as seen in >Table 1.
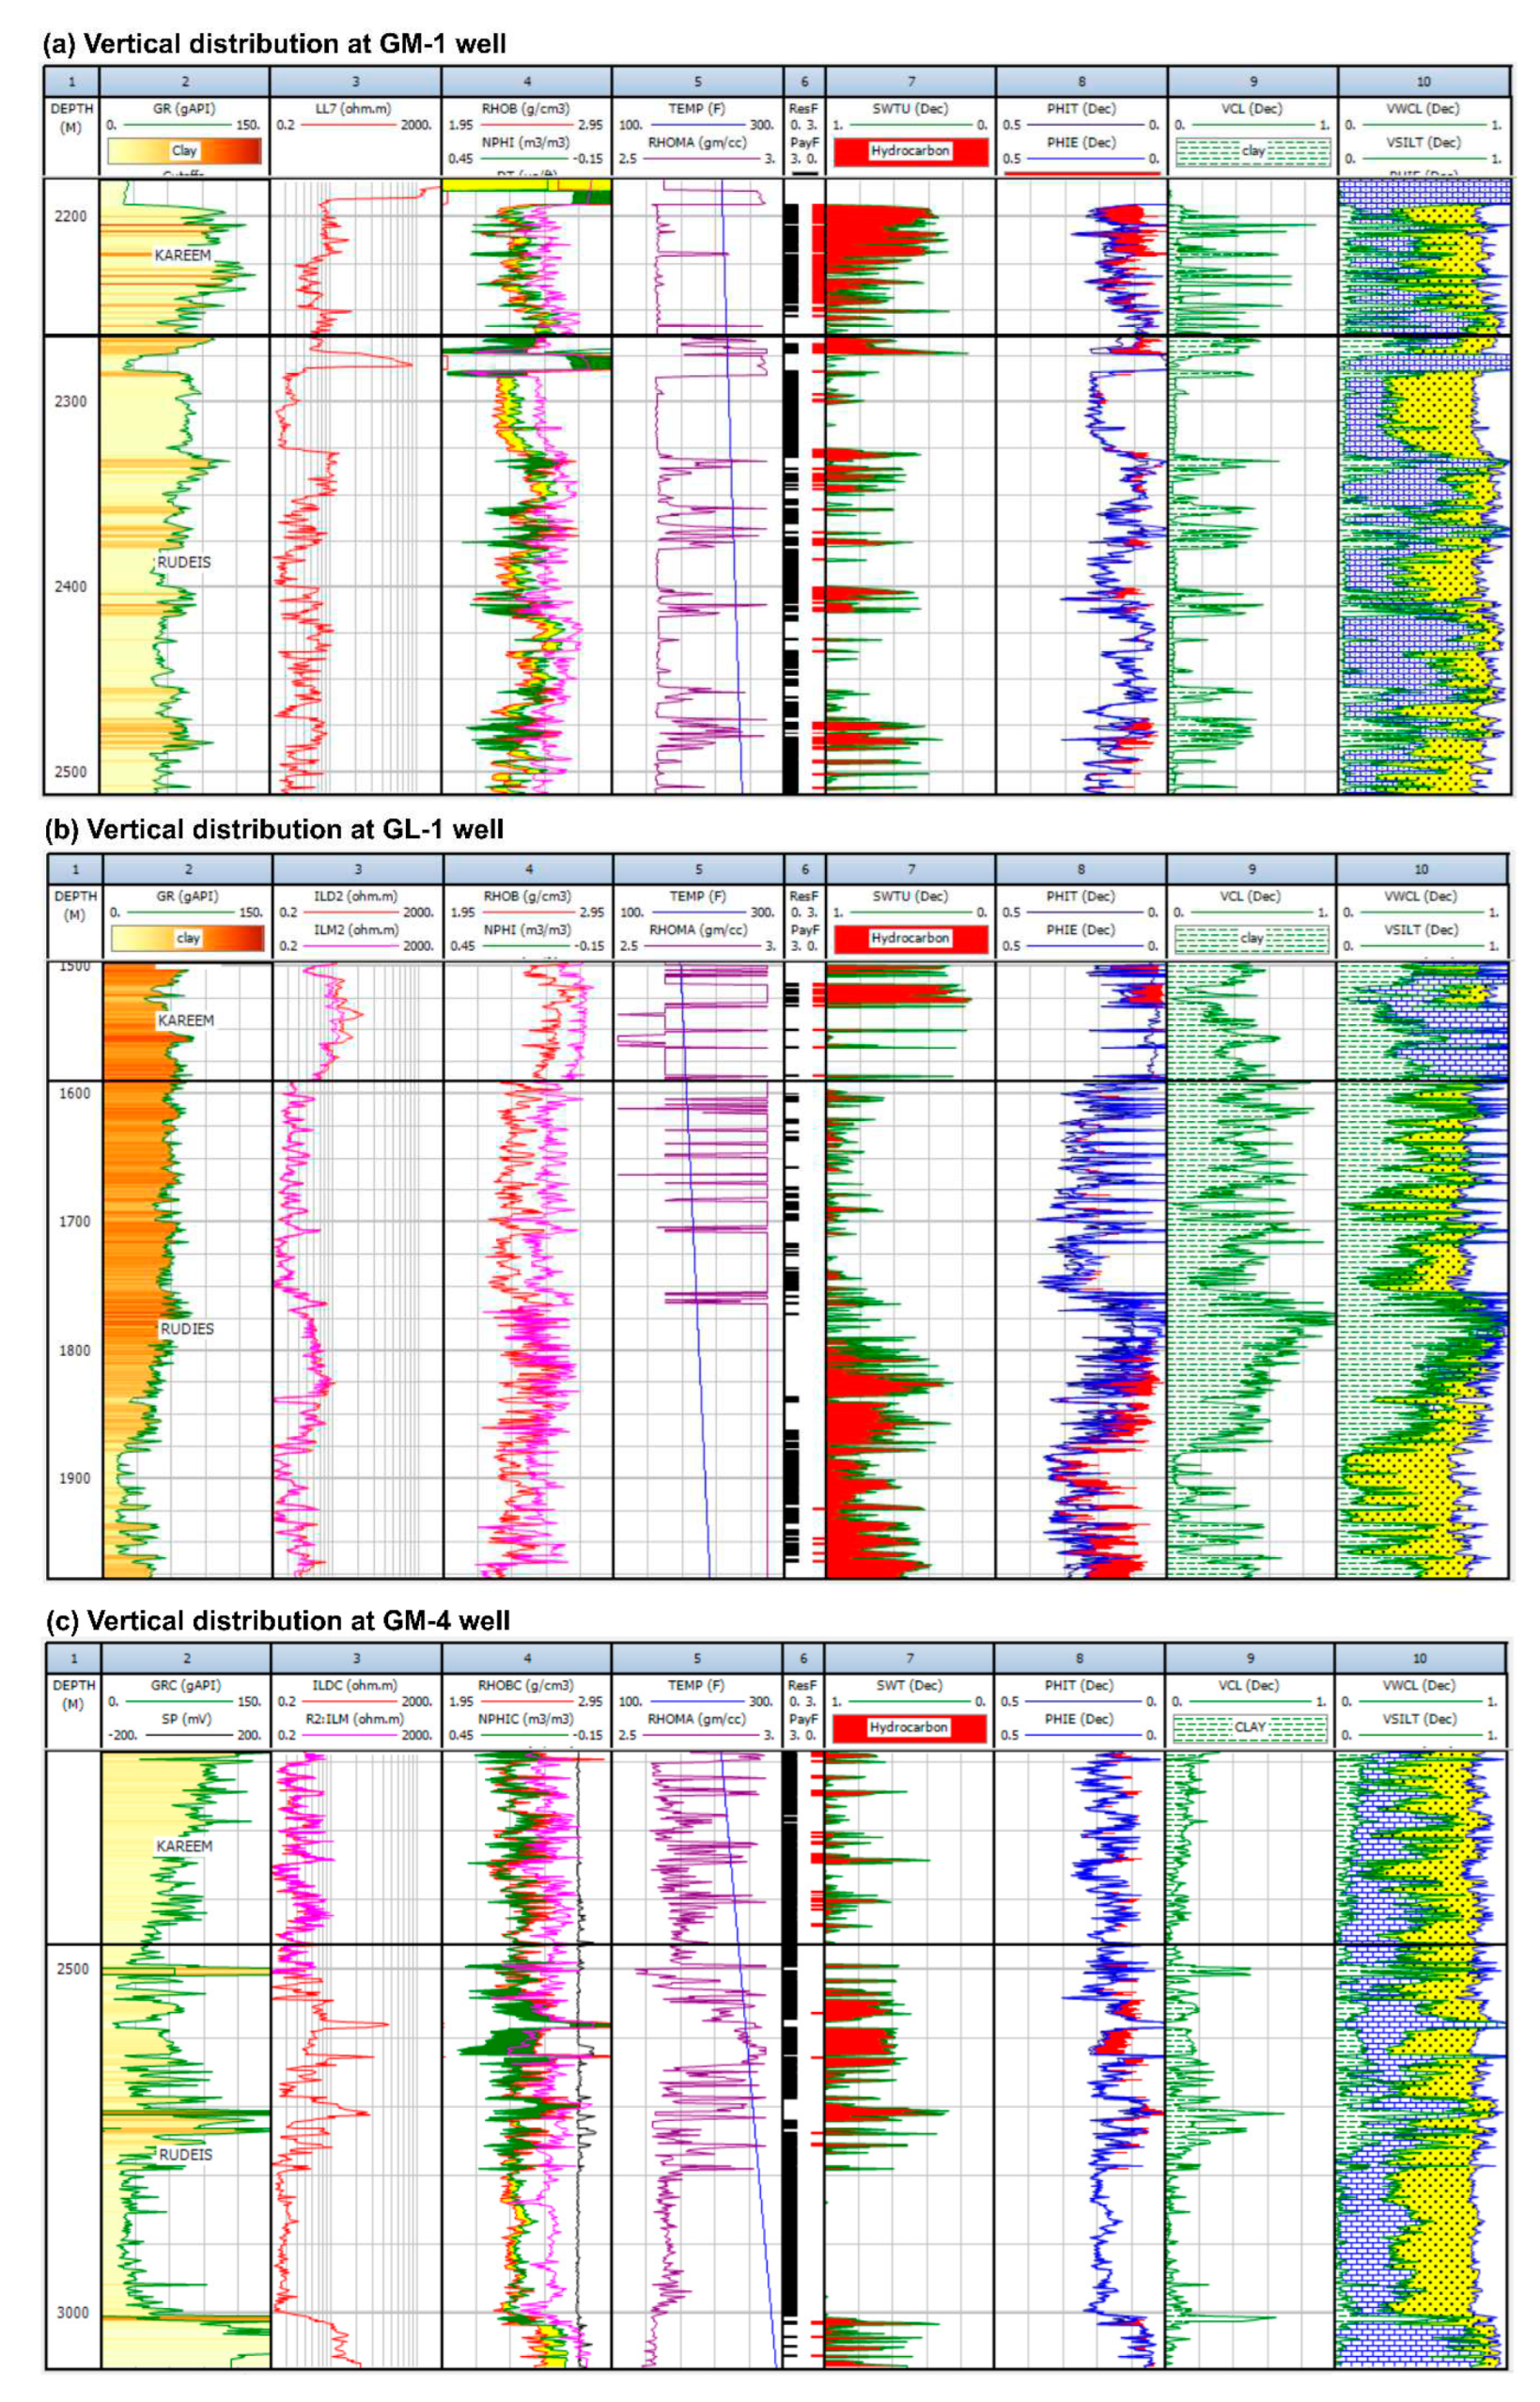
Figure 7. depicts the Computer Processed Interpretation (CPI) study conducted on the GM-1, GL-1, and GM-4 wells, serving as an instructive example. This study covers ten discrete pathways, commencing with the depth, then gamma ray pathway and ends with the lithofacies pathway. The results of this investigation suggest that the rock facies identified in the Kareem and Rudeis formations consist predominantly of limestone and sandstone, with occasional instances of shale interbeds. The presence of vertical facies variation is apparent, as indicated by the prevalence of limestone facies in the top and middle zones. This transition is accompanied by the emergence of sandstone facies interspersed with shale.
Figure 7. The vertical distribution of well-logs, petrophysical parameters, and lithofacies, ac-quired from the Kareem and Rudeis formations using the CPI plots, (a) GM-1 well, (b) GL-1 well, and (c) GM-4 well. .
Preprints 95655 g007

4.2. Stratigraphic Interpretation

The stratigraphic correlation approach is a method employed to establish a connection between distinct rock layers or strata in various geographical regions. The objective is to ascertain whether the strata in one region are comparable or analogous to those in another region, and if so, to establish their chronological order and depositional chronicles in relation to each other.
The initial stage in constructing a three-dimensional representation of oil or gas reservoirs involves ascertaining the stratigraphic placement of the designated region in order to comprehend the prevailing stratigraphic sequence and the interrelationships among the various layers. The identification of unconformity surfaces is crucial for understanding the genesis of significant stratigraphic petroleum reserves, thereby necessitating precise indication of their existence or absence.
The focus of this study is to the deposit Miocene, with particular emphasis on the Kareem and Rudeis formations. This specific formations serves as the primary reservoir in the majority of fields located in the southern Gulf of Suez of Egypt [4,62,63]. The substantial thickness and unique compositional characteristics of this layer contribute to its significance in hydrocarbon exploration.
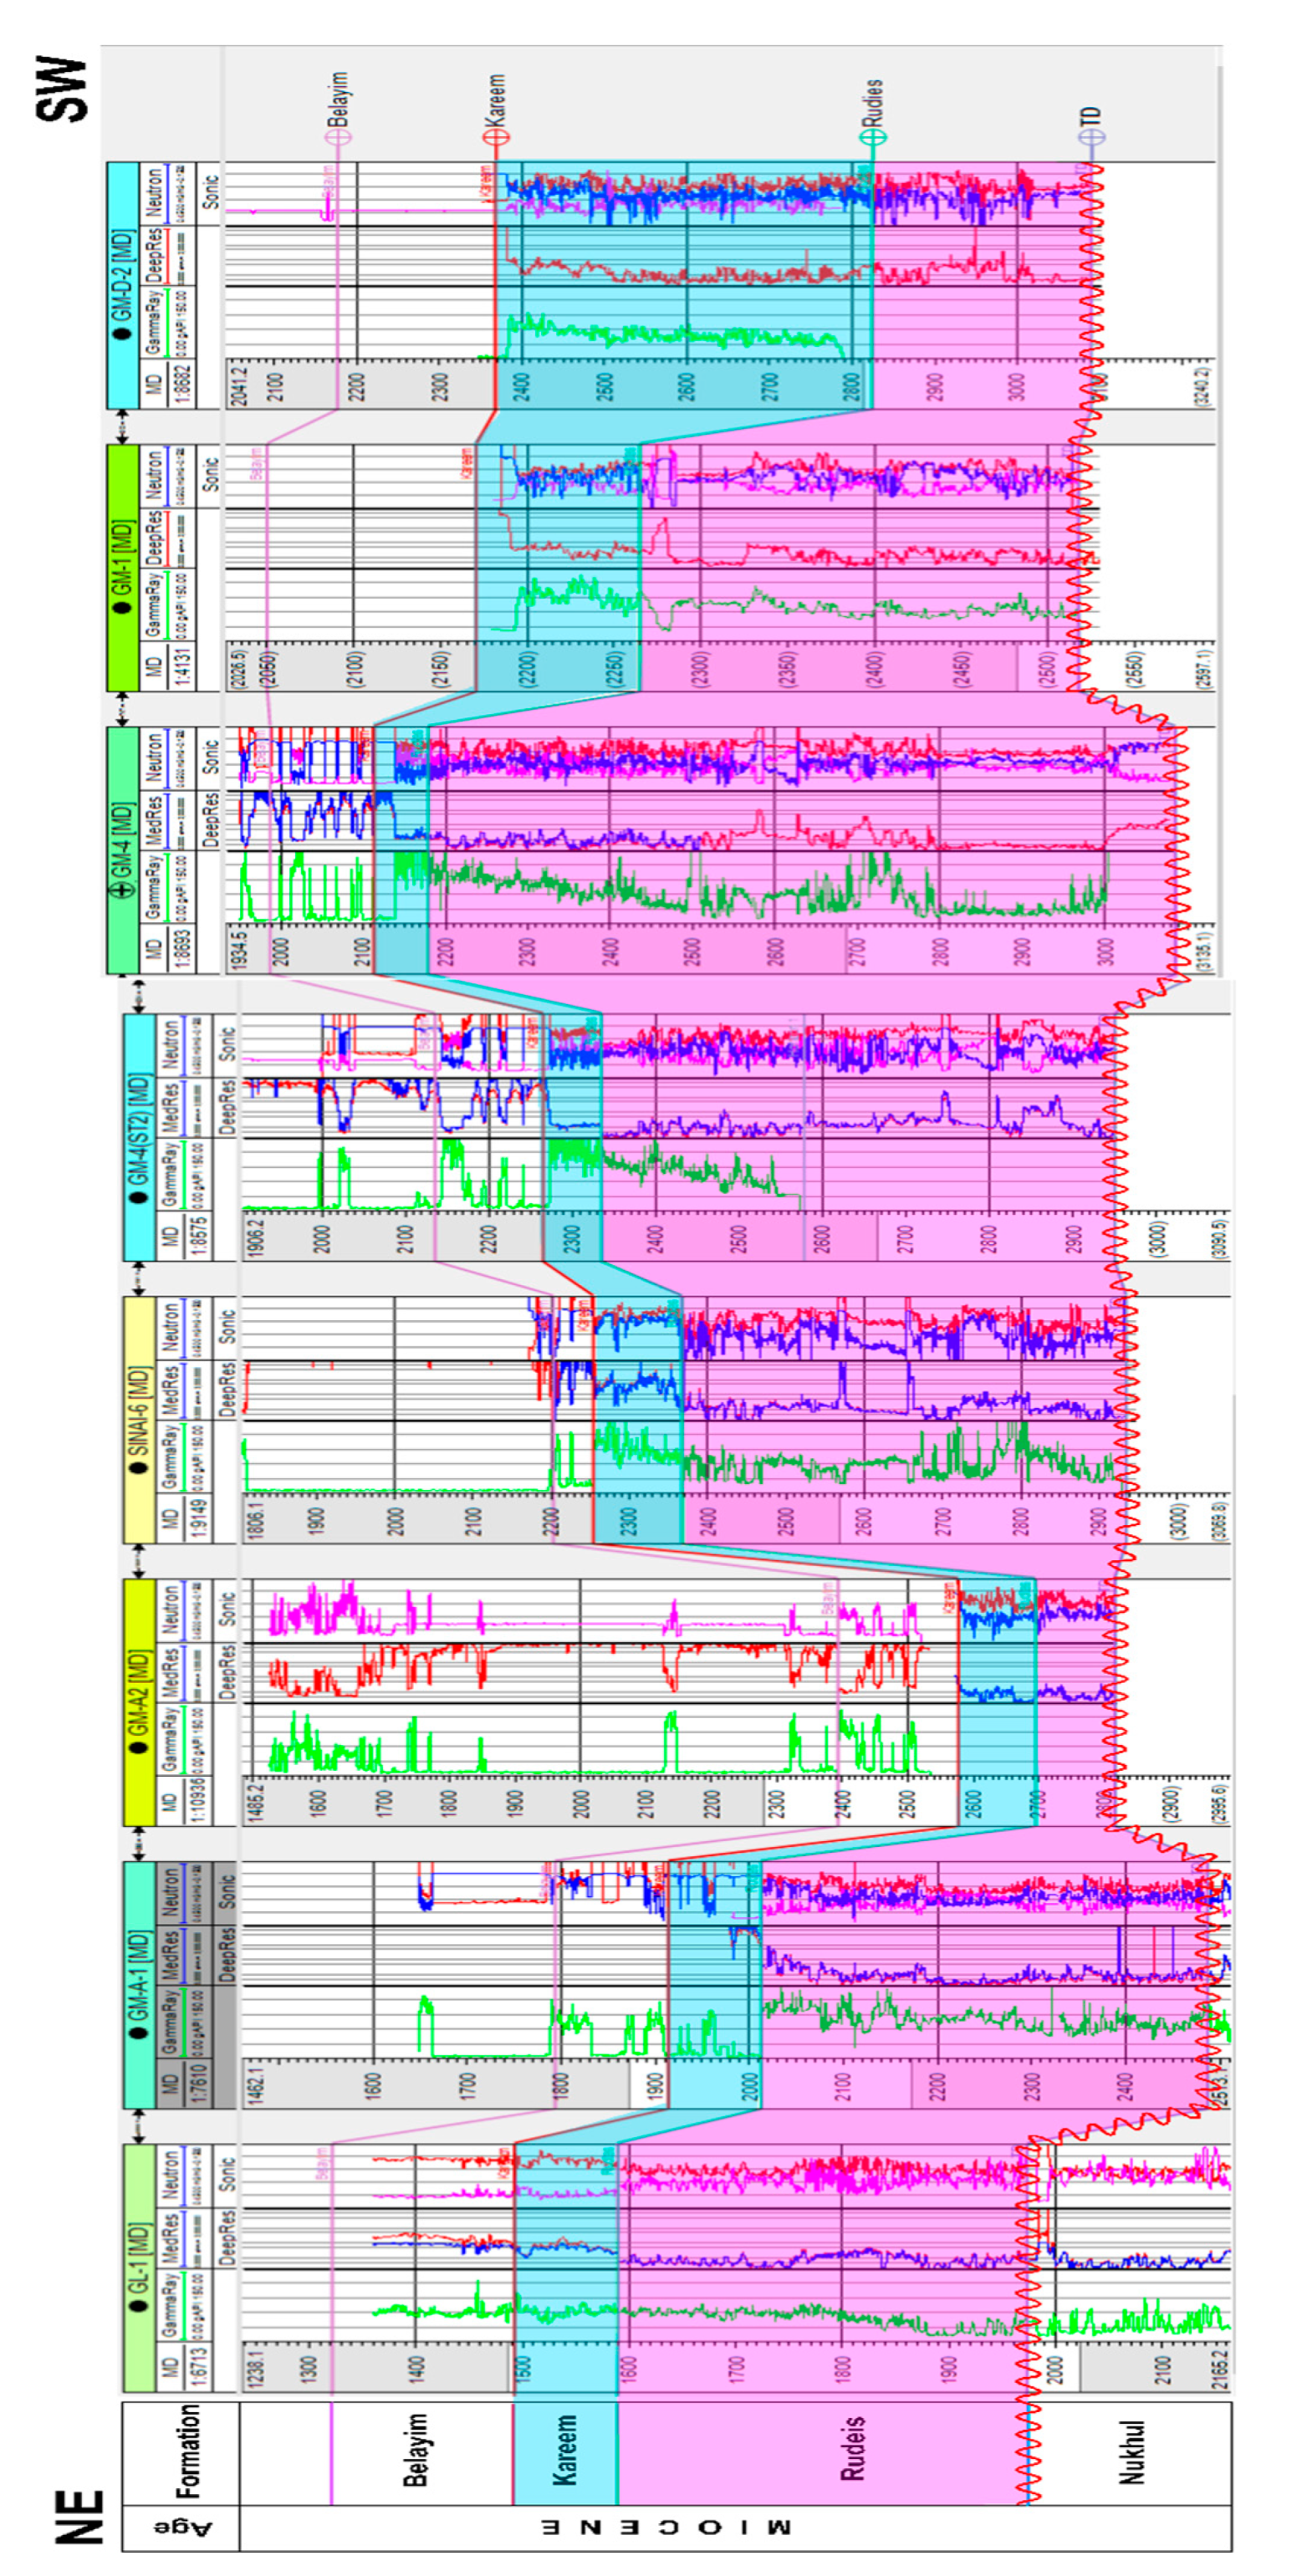
In order to facilitate a comparative analysis of the Kareem and Rudeis formations in the wells under investigation (namely, GL-1, GM-A1, GM-A2, SINAI-6, GM-4-ST2, GM-4, GM-1, GM-D2, and GM-D1), a vertical correlation section was created. This correlation was placed in a left-to-right sequence, with GL-1 being the leftmost well and GM-D1
being the rightmost well. The goal of this arrangement was to enable a comprehensive examination and comparison of the Kareem and Rudeis formations (Figure 8). The Rudeis Formation is stratigraphically overlain by the Nukhul Formation, forming an unconformity connection. It is distinguished by its considerable thickness, primarily focused in the northeastern direction and in the central part of the research region. The thickness steadily diminishes in the southwest direction. The correlation clearly indicates that the GM-A2 well has the lowest thickness of the Rudeis Formation.
Figure 8. Stratigraphic correlation section for Kareem and Rudeis formations in through the selected wells in the Ras Ghara oil field, southern Gulf of Suez, Egypt.
Preprints 95655 g008
The Kareem Formation, located atop the Rudeis Formation, has a consistent and uniform thickness across the research region. However, it is worth mentioning that there is a significant rise in thickness towards the southwest direction of the Ras Ghara oil field in the southern Gulf of Suez. The minimum thickness value is located in GM-4-ST2 well. The Kareem Formation is positioned above the belayim Formation in a conformable manner.

4.3. Structural Setting and Seismic Interpretation
The Ras Ghara oil field, as described in the EGPC, 1994, is characterized by a structural setting dominated by normal faults. These faults exhibit trends in the northwest-southeast and northeast-southwest directions, giving rise to a series of horst (uplifted blocks), graben (down-dropped blocks), and step-fault structures. These faulted blocks extend from the Miocene epoch and continue into the post-Miocene sedimentary layers. The primary fault blocks have played a crucial role in shaping the Central and Nurit troughs (Figure 3), as well as the horst complexes within the field. The troughs are confined by a principal fault along their southern margin, while a secondary fault trending in the 'B' direction delineates their western boundary. These faulted structures have emerged as prime targets for hydrocarbon exploration and production. As depicted in (Figure 3), the prominent structural features of the Miocene reservoirs within the Ras Ghara oil field can be explained as follows: The horst complexes exhibit lower Miocene clastic reservoirs, which are overlain by an upper Miocene evaporite plateau. This depositional sequence is predominantly present on the southwest-facing slopes of the pre-Miocene horst blocks.
In summary, the Ras Ghara oil field showcases a complex structural framework characterized by a network of normal faults with distinct orientations. These faulted blocks have given rise to horst, graben, and step-fault structures, contributing to the formation of the Central and Nurit troughs and horst complexes. The faulted structures represent key targets for hydrocarbon exploration, with the Miocene reservoirs displaying distinct characteristics such as lower Miocene clastic reservoirs overlain by an upper Miocene evaporite plateau. The interpretation of seismic data plays a crucial role in the field of petroleum exploration as it entails the examination and analysis of seismic data to extract valuable information about the properties and arrangements of subsurface formations.
Seismic horizons are identifiable geological boundaries or surfaces in the subsurface that are used for interpretation in horizon and fault analysis. To understand these horizons, one must first determine their locations within the seismic data and then track their paths throughout the seismic volume. The main goal of fault interpretation is to identify and characterize fault zones that may affect the spatial distribution of underlying geological formations, as stated by [64]. Velocity Modelling and Depth Conversion are essential for estimating the distribution of subsurface velocity based on seismic data [65]. Well log data integration is commonly used to align and verify the seismic interpretation, as stated by [8,64].
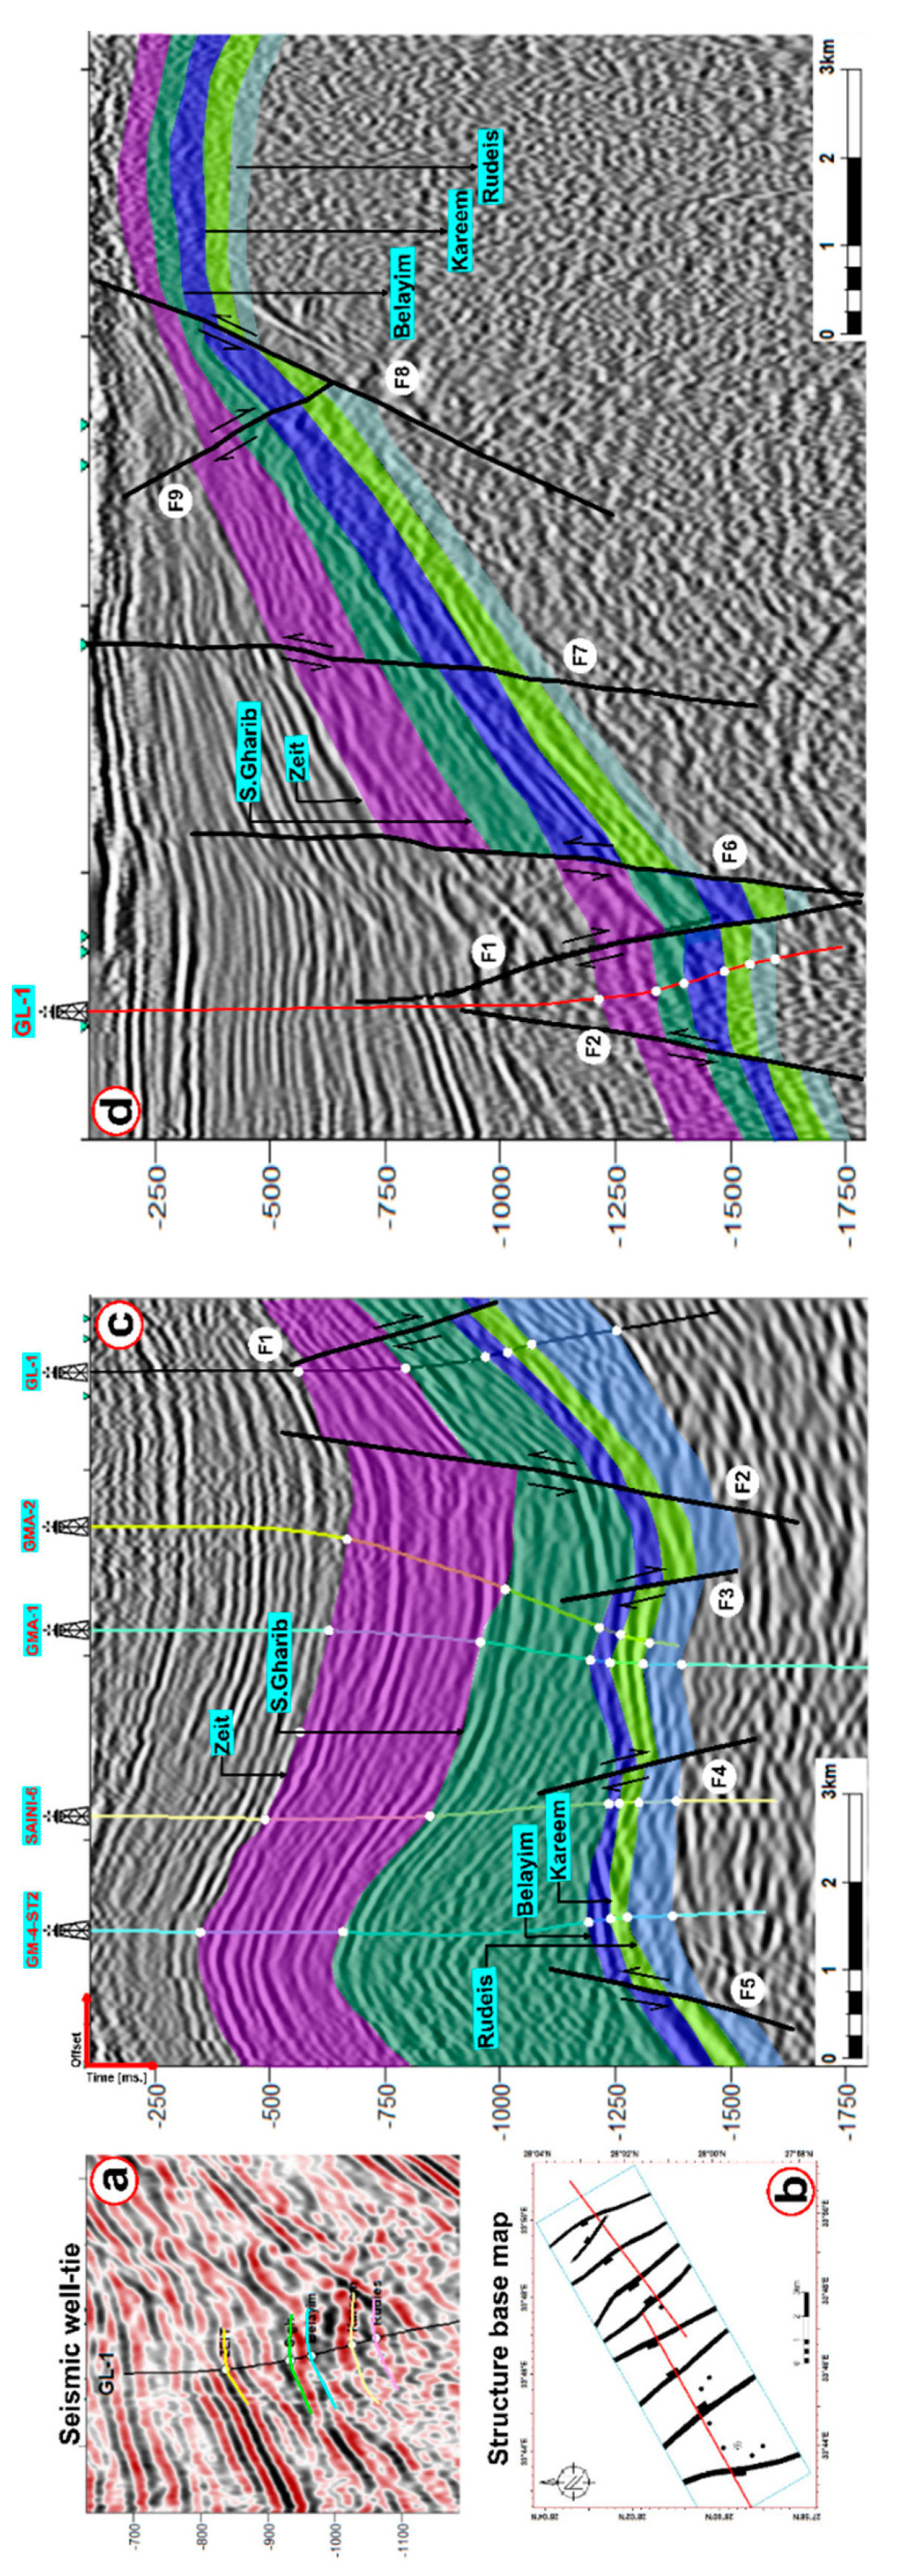
The investigation of subsurface conditions, encompassing both structural and stratigraphic characteristics, involved the interpretation of nineteen seismic reflection profiles (Figure 1b). Two seismic lines, GS 13-83 and FJ 88-05, depicted in Figure 9, exhibited a NE-SW orientation, closely intersecting the GL-1, GM-A2, GM-A1, SINAI-6, and GM-4 ST2 wells situated in the central region of the study area (Figure 9b). A comprehensive analysis was conducted on the Zeit, South Gharib, Belayim, Kareem, and Rudeis formations to discern their surface attributes and discern any fault influences.
The findings indicate the presence of multiple normal faults, resulting in the formation of horst, graben, and step faults within the Ras Ghara oil field. Furthermore, the Kareem and Rudeis formations were successfully penetrated by the examined wells, as depicted in the figure. Additionally, the figure illustrates the significant influence of five major faults (F1, F2, F6, F7, and F8) and four minor faults (F3-F5 and F9) on the study area.
To obtain a visual representation of the subsurface structure in terms of its depth, it is essential to create a map that shows the structure at different depths. Geoscientists can enhance their comprehension of the complex geological framework under the surface by constructing a detailed depth structure map. The location and shape of geological features such as faults, folds, and other structural aspects are disclosed, as stated by [66].
Figure 9. NE-SW interpreted seismic sections for the Miocene stratigraphic units in the central part of the Ras Ghara oil field: (a) seismic well tie using a check-shot in the GL-1 well; (b) base map showing the location of the interpreted seismic sections and structure features; (c) GS 13-83 and (d) FJ 88-05.
Preprints 95655 g009
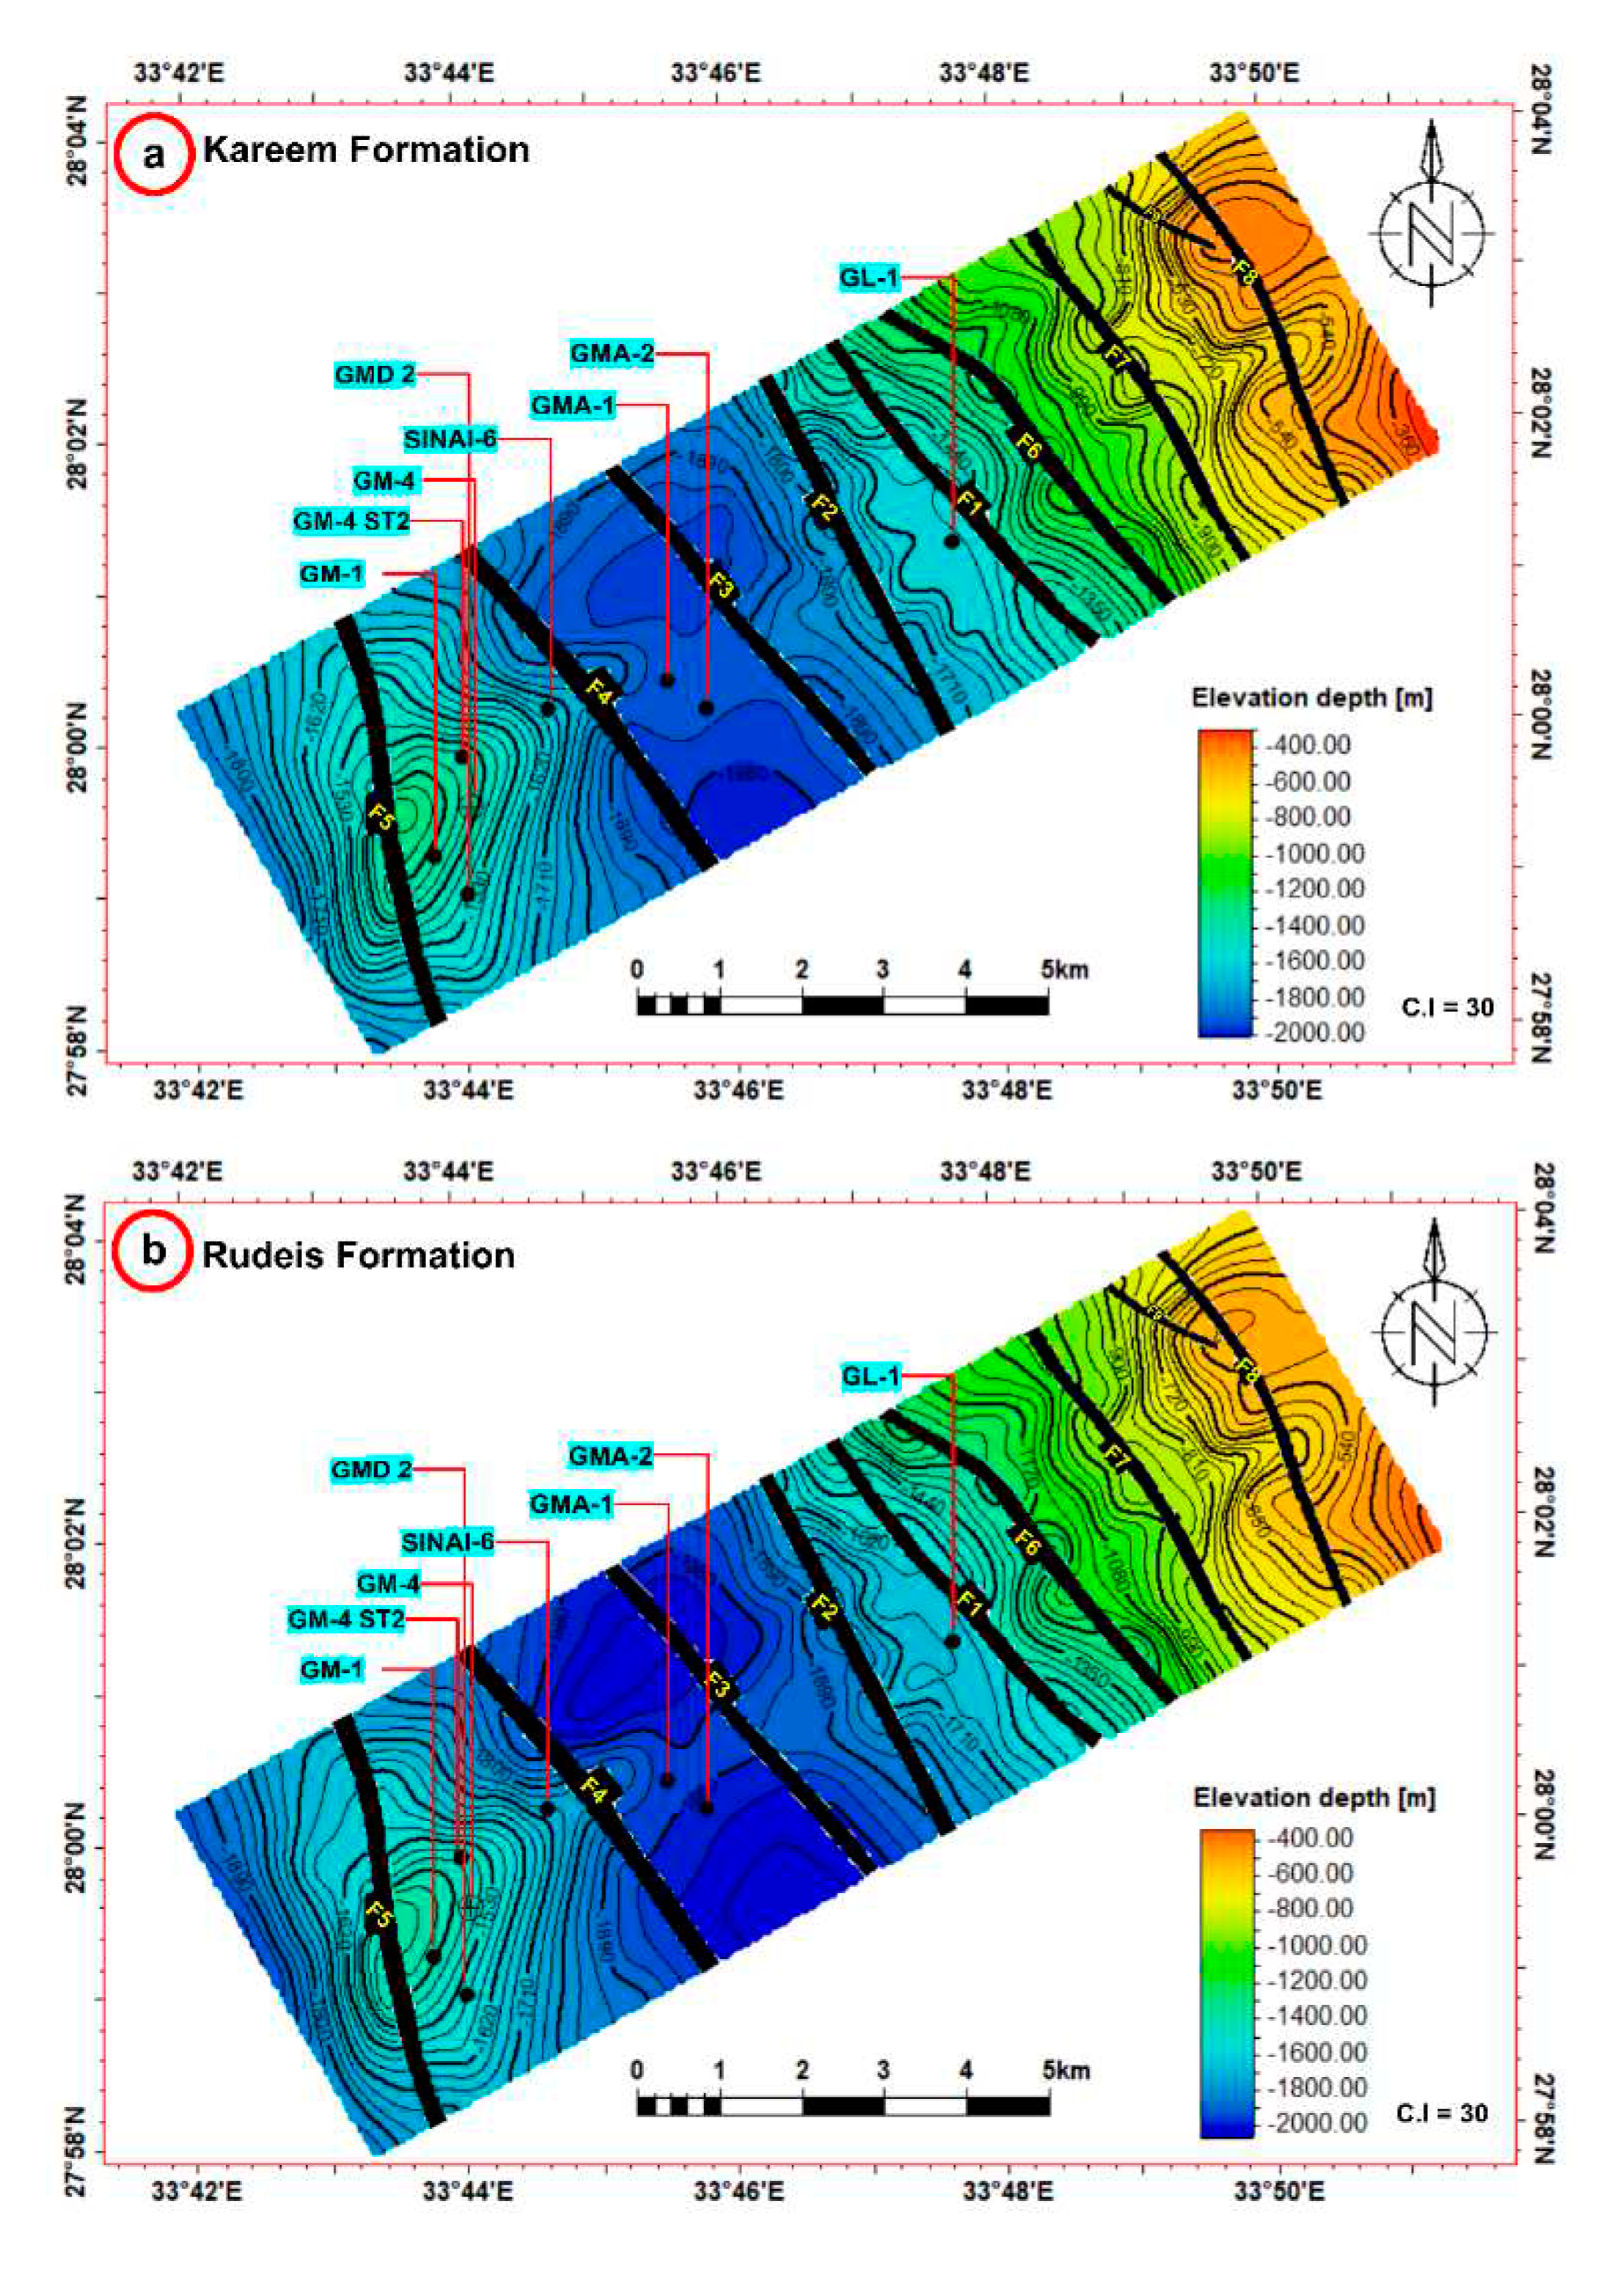
The Kareem and Rudeis formations are the primary reservoir in the Ras Ghara area, as seen by the depth structure contour map on top of Kareem and Rudeis reservoirs (Figure 10). There are a total of nine faults in these reservoirs, with some being quite major and others quite minor. The depth might be range between 1501m and 2350 m for Kareem Formation, while the Rudeis Formation range between 1590m and 2466m. All faults run northwest to southeast. These groups of Normal faults coalesce into horst, graben, and step fault complexes. All wells were conducted within the upper thrown side of the interpreted faults that impact the Miocene formations in the southern Gulf of Suez. These fault closures exhibit favorable characteristics, including well-defined sealing areas, which create optimal conditions for the accumulation of oil reserves. Both formations are distributed from shallow depths in the NE part to deeper depths in the SW part, which are vertically displaced by faulted graben and horst blocks.
Figure 10. The depth structure contour maps on the top of (a) Kareem Formation and (b) Rudeis Formation in the Ras Ghara oil field.
Preprints 95655 g010

4.4. Three Dimentional Structural Model
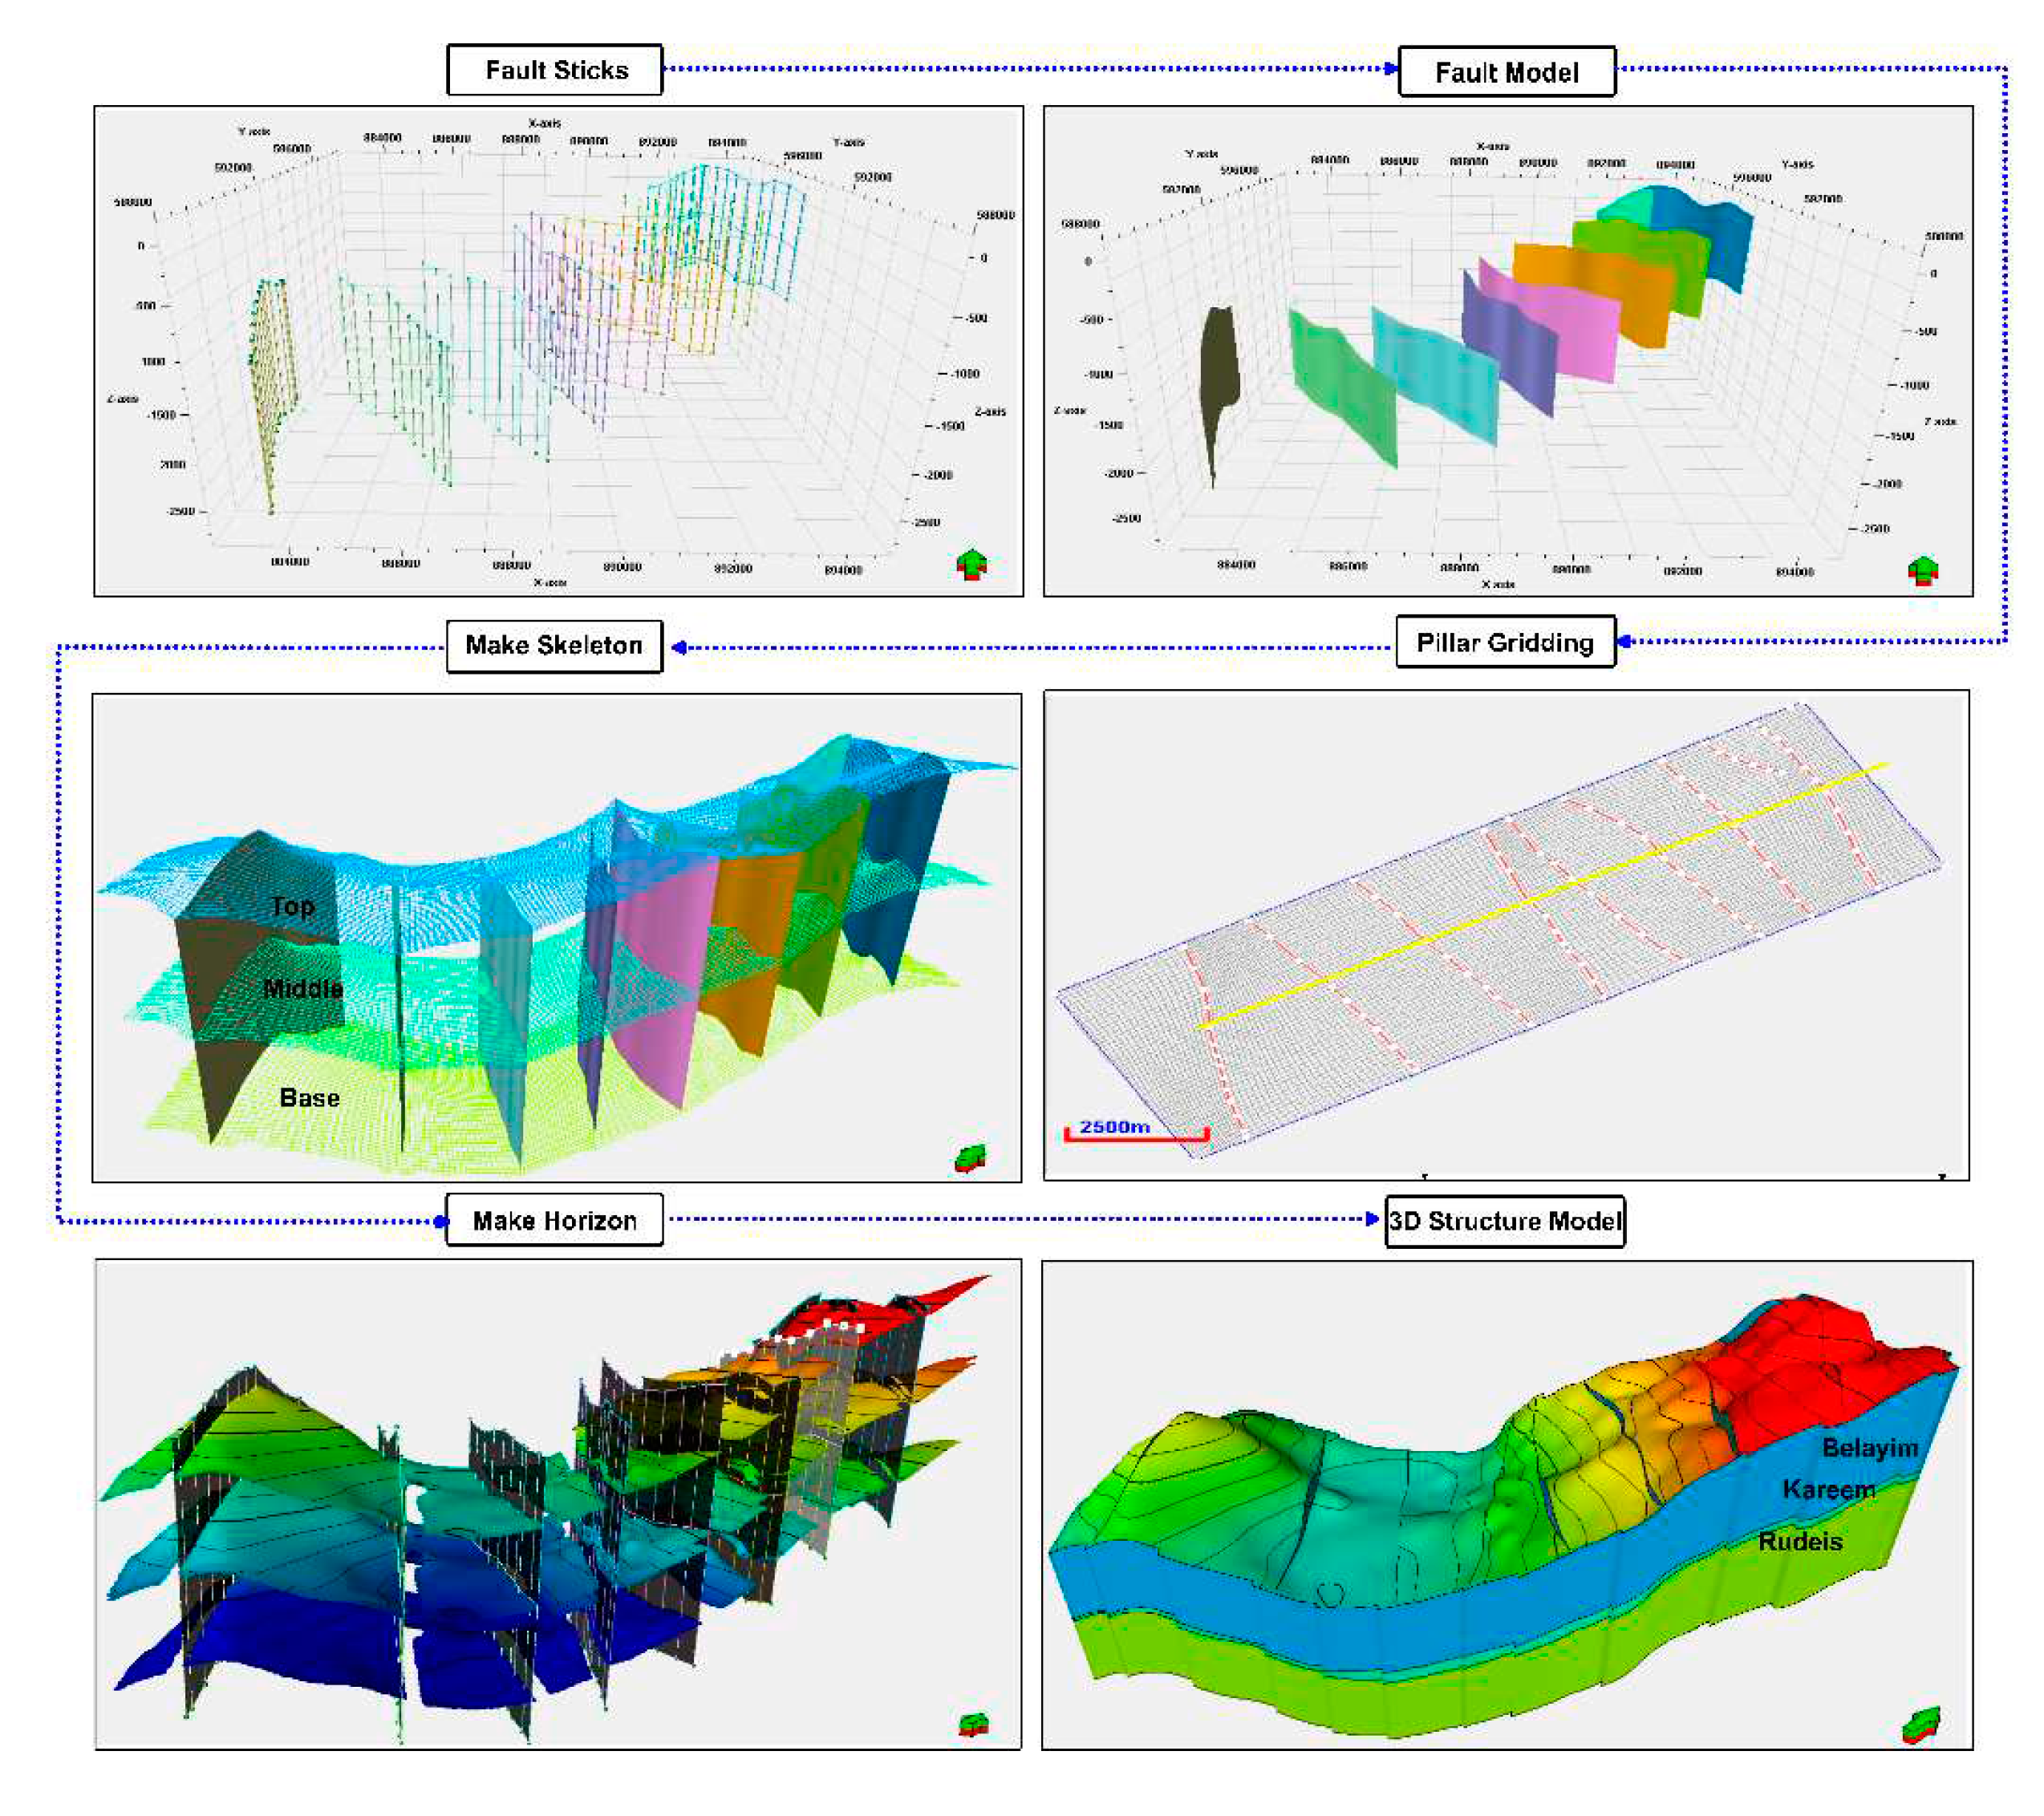
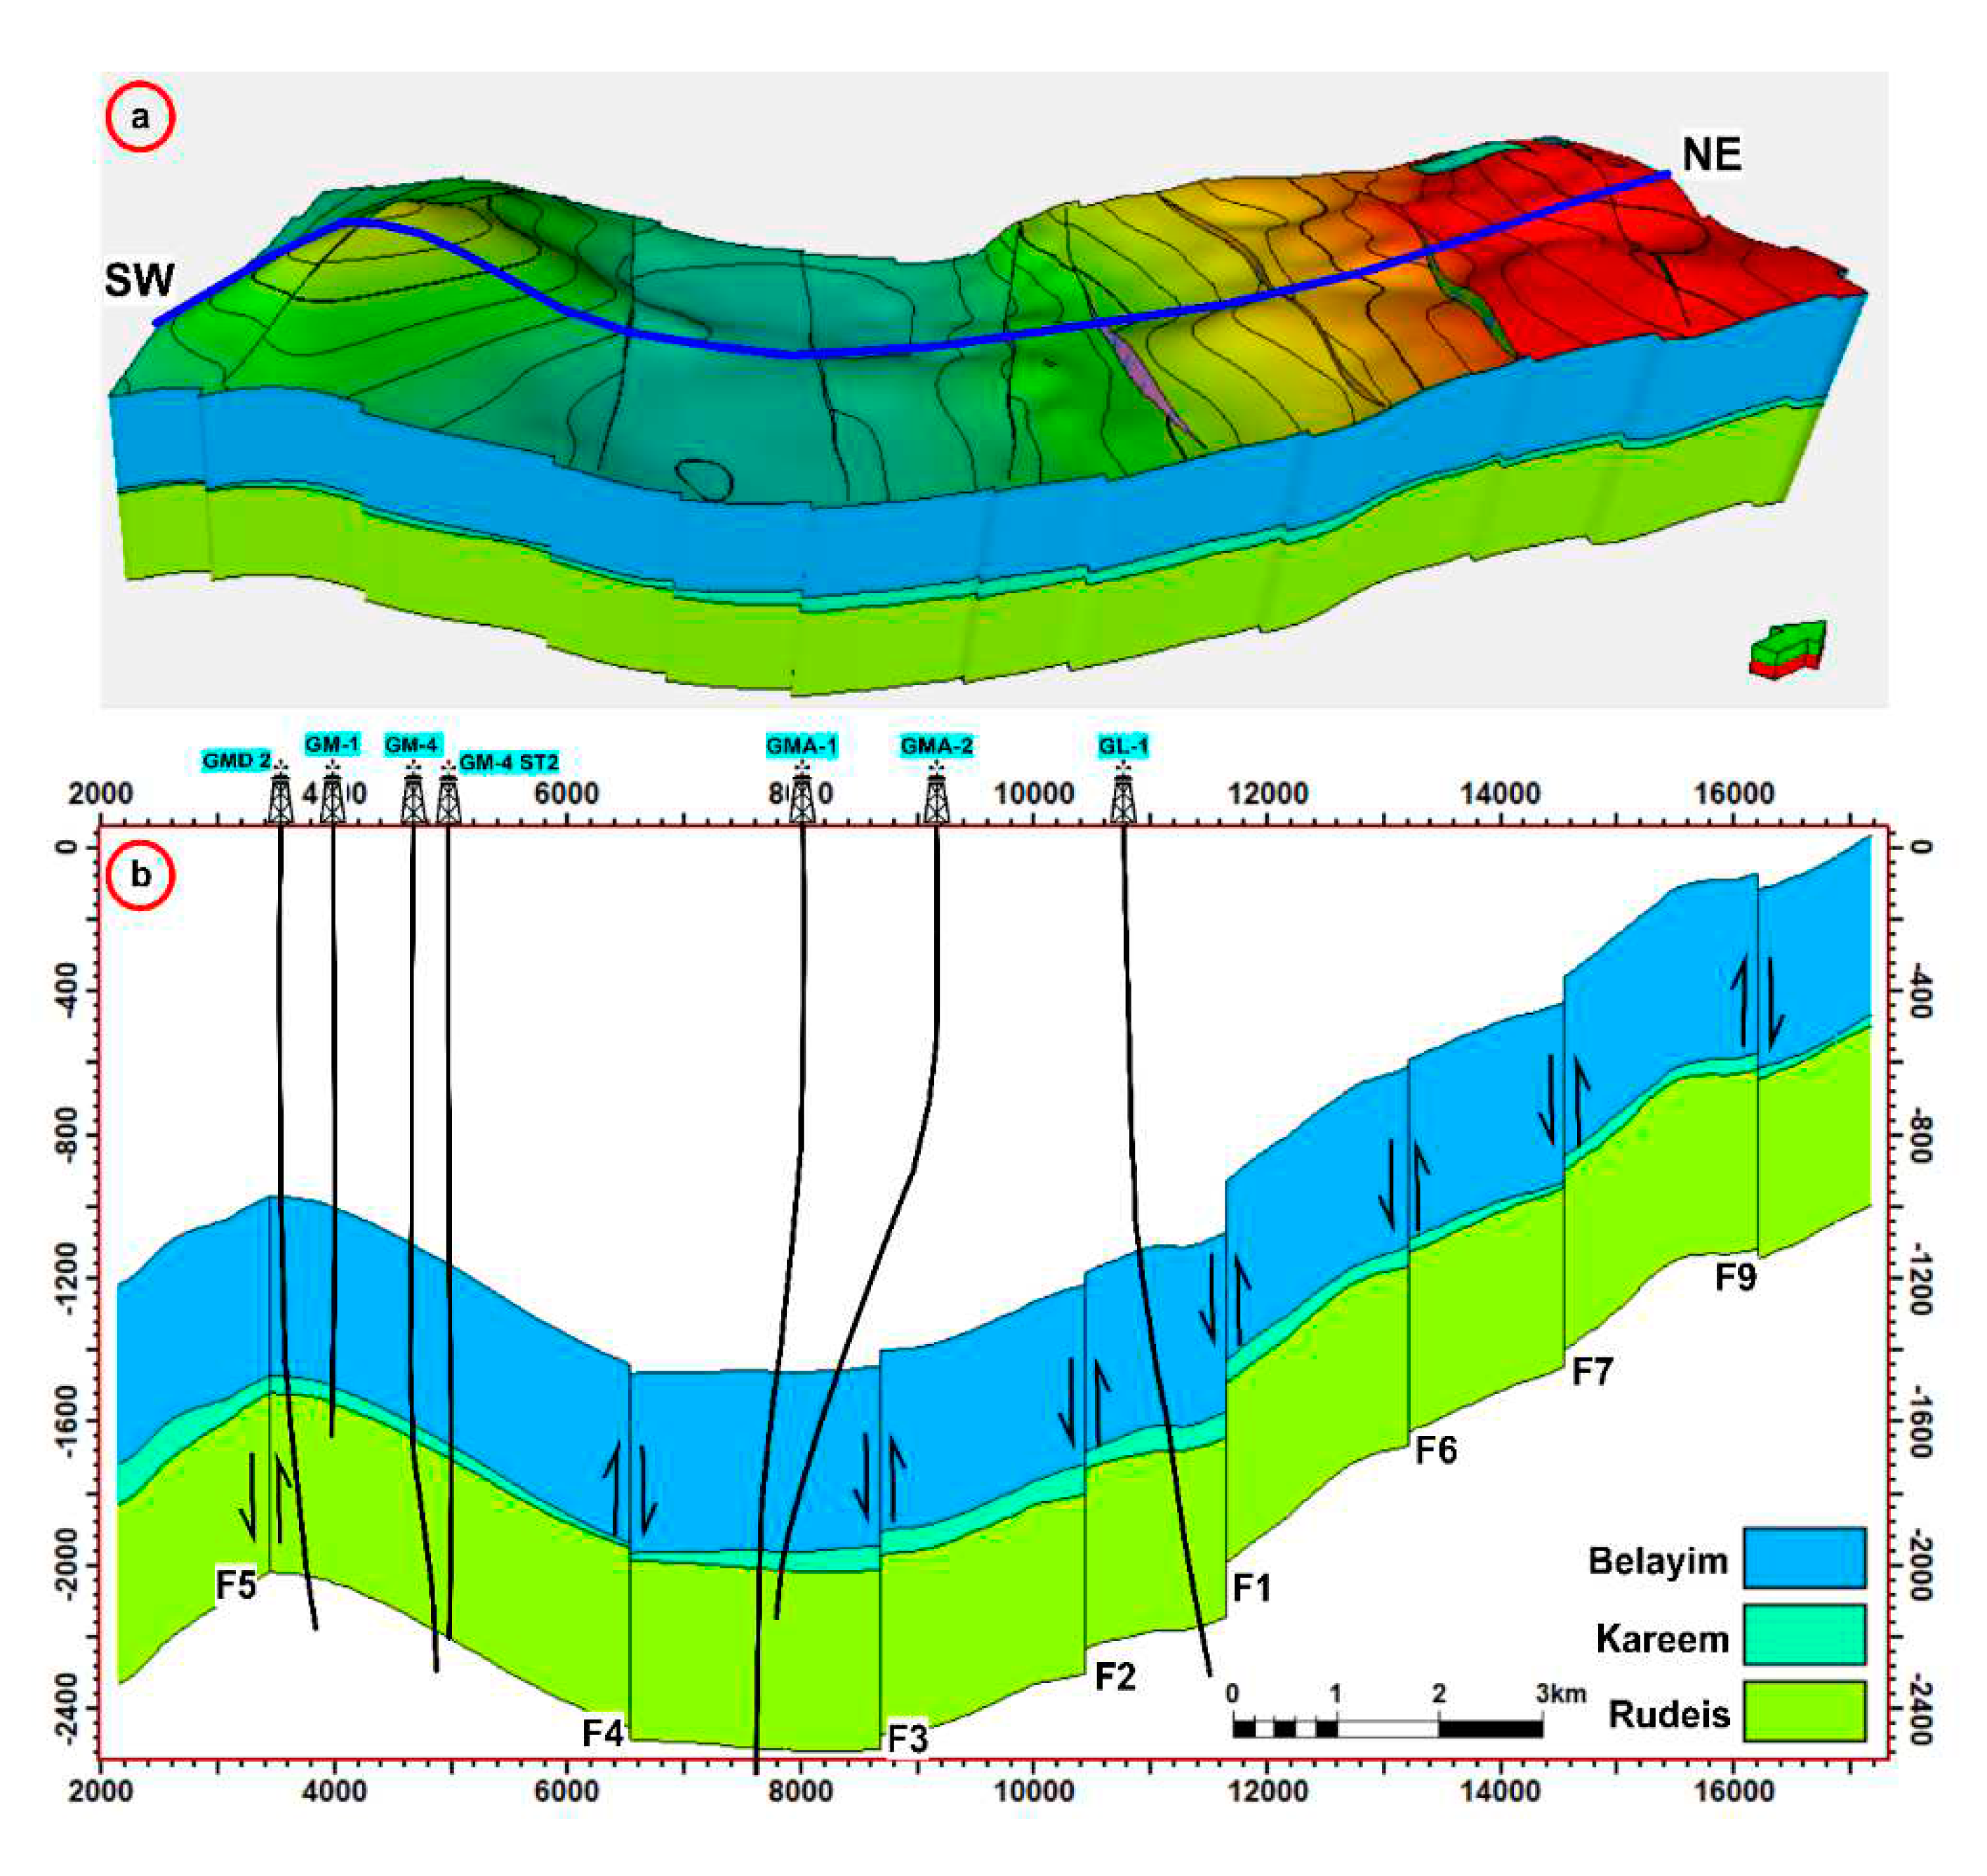
After the interpretation of seismic data and the generation of structural maps, the subsequent step involved constructing a comprehensive structural model for the Ras Ghara area. This model was developed in three key stages. Initially, the focus was on characterizing the fault system impacting the target formations under investigation. Subsequently, a pillar gridding technique was employed to establish a grid framework for the model. Finally, the horizons were delineated and categorized, enabling their subdivision into layers to facilitate the identification of structural effects, variations in rock facies, and changes in the petrophysical properties of the Kareem and Rudeis reservoirs (Figure 11). This approach allowed for a detailed understanding of the subsurface architecture and provided valuable insights for reservoir characterization and analysis in the designated region.
Figure 11. illustrates the primary steps involved in creating a three-dimensional structural model in the Ras Ghara oil field.
Preprints 95655 g011
Figure 12 showcases a vertical structure cross-section aligned in the northeast-southwest direction, providing a visual representation of the influence of structures on the Kareem and Rudeis formations within the Ras Ghara oil field in the southern Gulf of Suez Basin. Analysis of this cross-section unveiled the presence of nine recurrent normal faults in the region, characterized by northwest-southeast and northeast-southwest orientations. These faults interact with each other, leading to the formation of geological features such as horst, graben, and step fault blocks. Notably, the study wells were strategically drilled near the upper displacement zones of faults 1, 3, 4, and 5. These findings contribute valuable insights into the structural dynamics and reservoir potential of the studied area, aiding in the optimization of exploration and production strategies.
Figure 12. (a) 3D subsurface model of the Belayim, Kareem, and Rudeis formations in the Ras Ghara oil field, showing faulted blocks with horst and graben structures. (b) A NE-SW cross-section of 3D model with showing three formations, faults F1–F9 and well locations.
Preprints 95655 g012

4.5. Three Dimentional Property Model
The 3D static property model acts as a platform for integrating diverse reservoir data, including geological, petrophysical, and geophysical information [7,8,48]. The 3D static property model (facies and petrophysical) provides a detailed representation of the spatial distribution and variability of reservoir properties, such as porosity, permeability, and fluid saturation. This enables a better understanding of reservoir heterogeneity, identifying areas of high and low productivity, and guiding well placement and reservoir management strategies. By integrating various data sources, including well logs, and seismic data, the 3D static property model provides a comprehensive characterization of the reservoir. It helps identify geological features, such as faults, fractures, and stratigraphic variations, which influence fluid flow behavior and impact reservoir performance.
Upscaling petrophysical features of reservoir formations is crucial due to its impact on computing efficiency, model representation, and reservoir management. When working on extensive reservoir simulations or field development plans, the complex calculations required for high-resolution petrophysical data obtained from well logs or core samples can be computationally challenging. Hence, upscaling enables a more effective depiction of the reservoir properties while maintaining the essential features that impact fluid flow behavior.
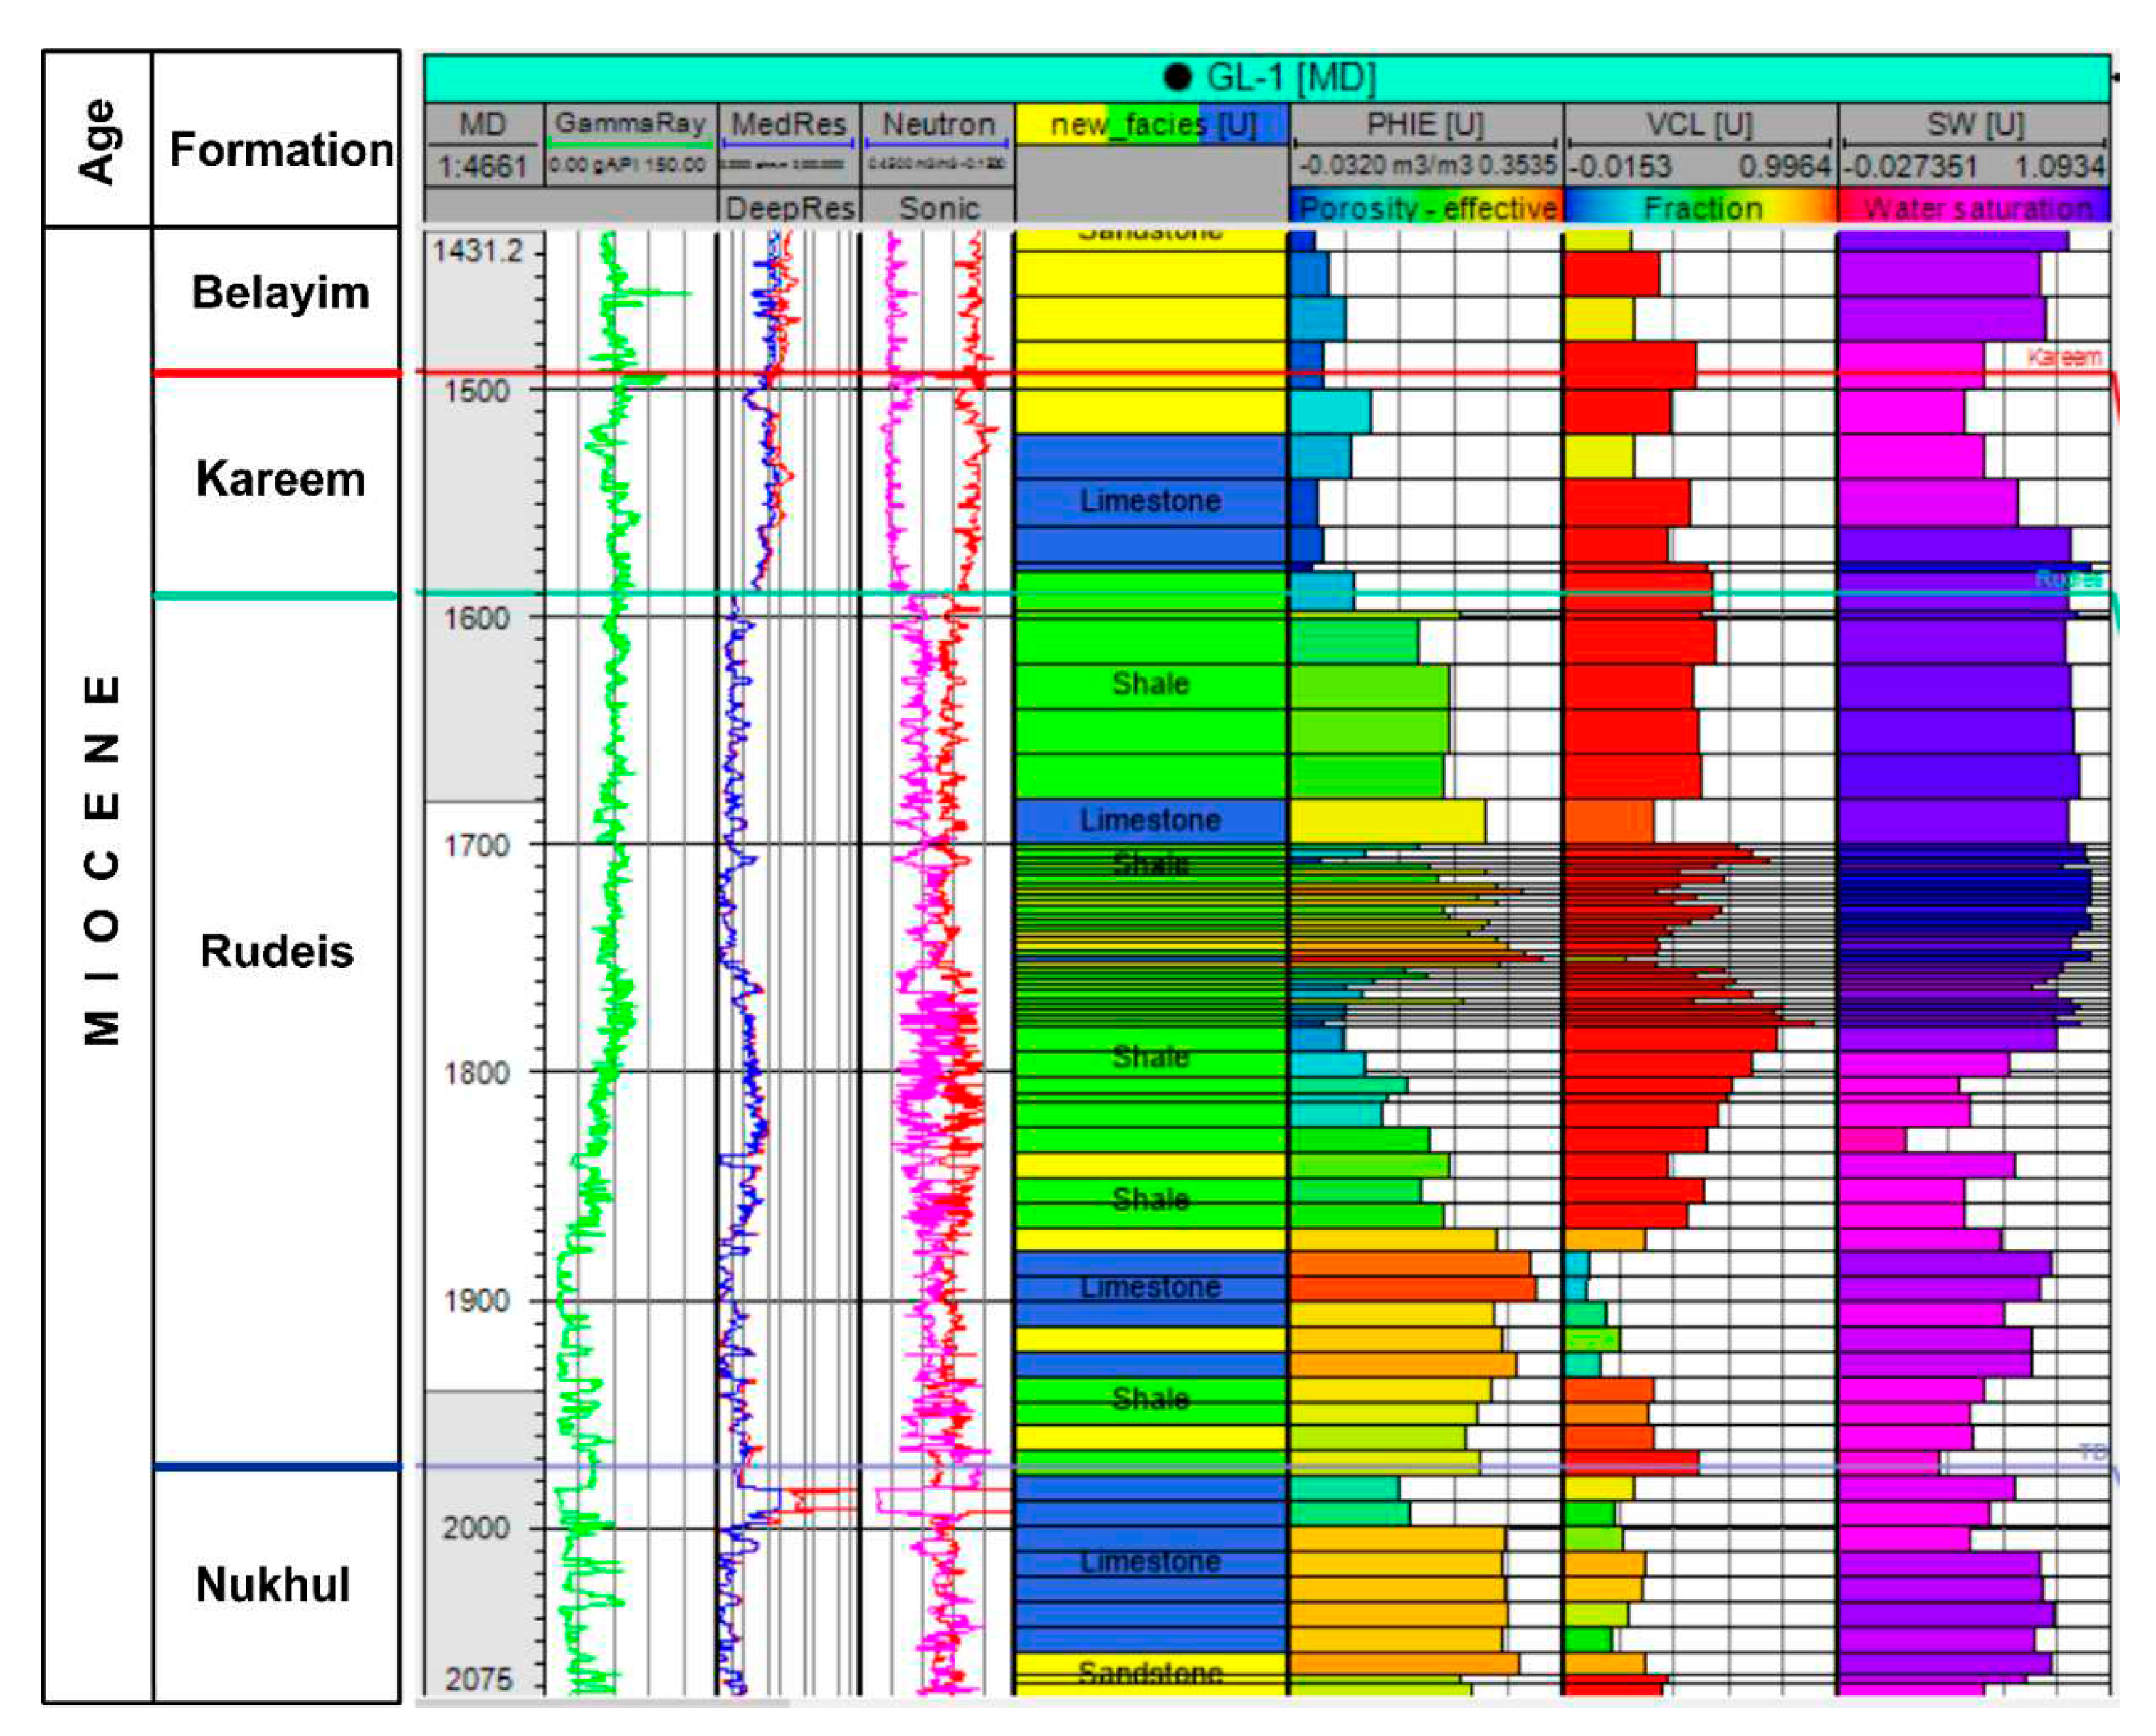
Figure 13 illustrates the vertical changes in the rock types and physical properties of the reservoir layer, along with the efforts made to scale up these important elements. The diagram displays well differentiated geological facies consisting of limestone, shale, and sandstone. The Kareem Formation is distinguished by the prevalence of a prominent limestone facies accompanied by substantial quantities of sandstone facies, whereas the Rudeis Formation is distinguished by the occurrence of diverse facies including limestone, shale, and sandstone. The upper section of the Rudeis Formation is primarily composed of sandstone and shale, characterized by a rough texture. In contrast, the lower region of the reservoir exhibits a greater presence of limestone, which has a smoother appearance. Upon closer analysis, it becomes apparent that the prevailing rock types identified in the GL-1 well consist primarily of limestone, with some shale and a little amount of sandstone. Figure 13 vividly depicts the vertical variability seen in upscaled petrophysical parameters, including effective porosity, clay content, and degree of water saturation.
Figure 13. The vertical distribution of the upscaled facies, and petrophysical properties of Kareem and Rudeis formations in GL-1 well in the Ras Ghara oil field.
Preprints 95655 g013
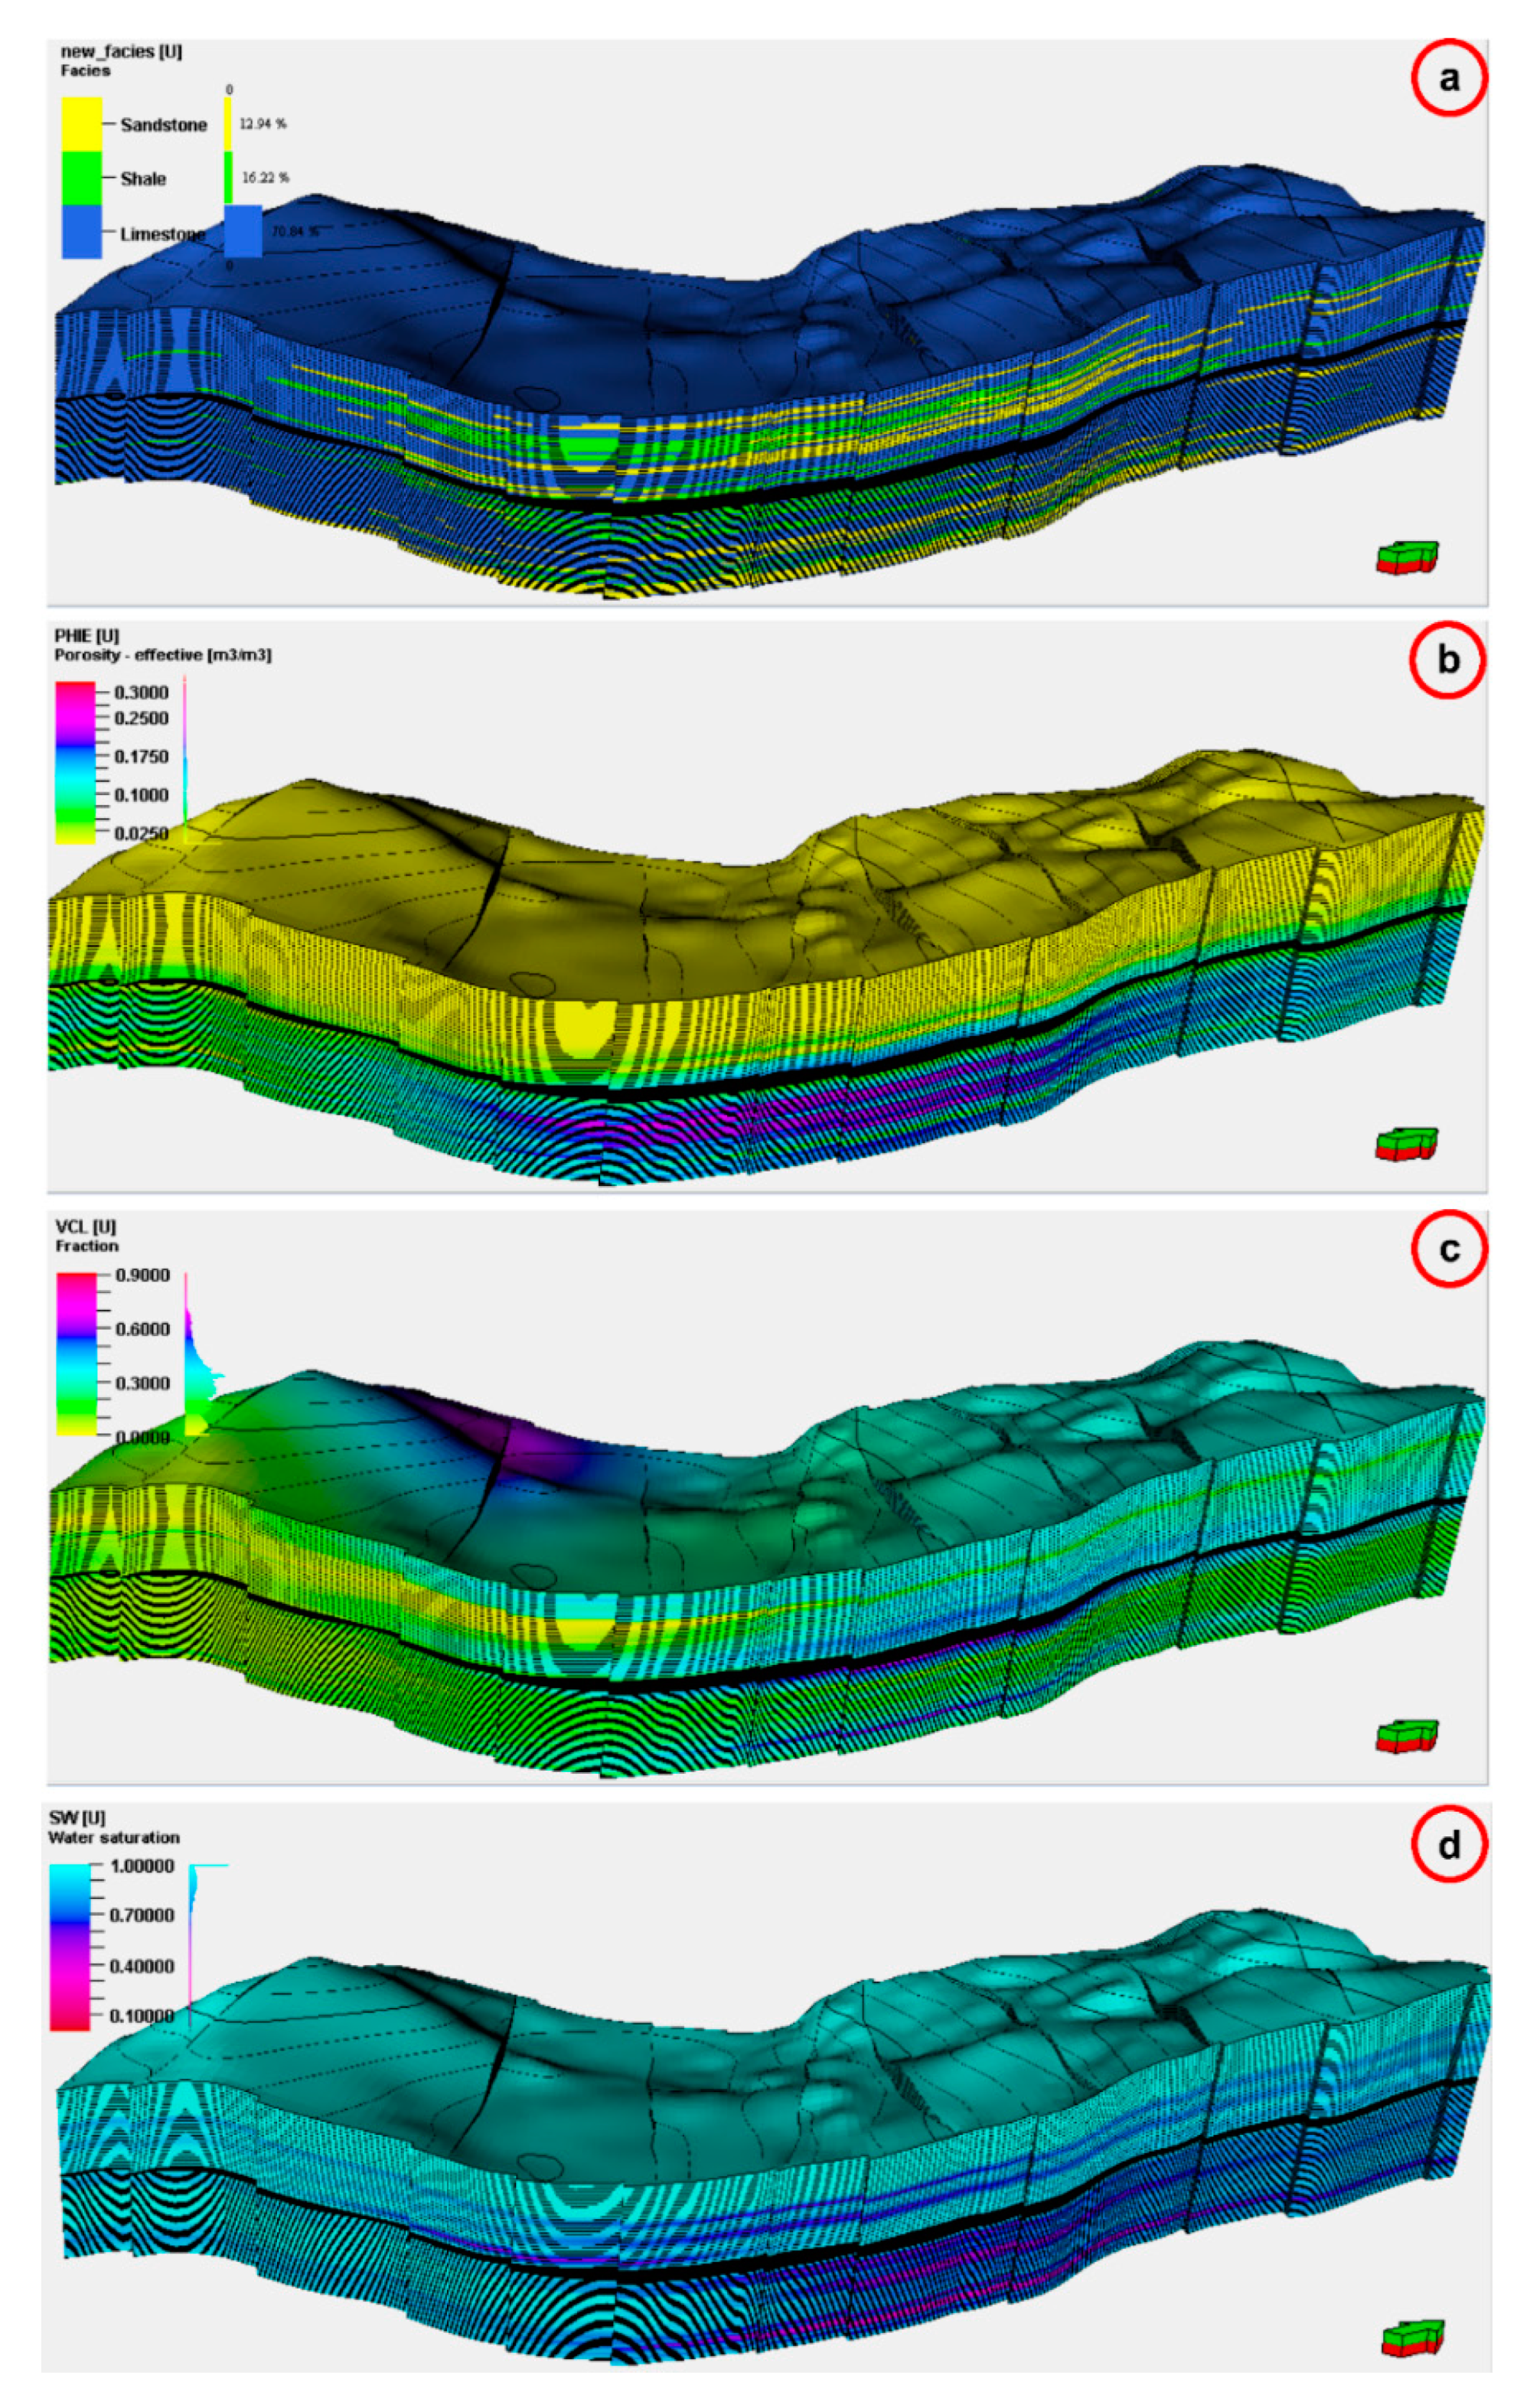
The cells intersected by drill holes must be assigned lithofacies and rock property values [67]. The subsurface structural and stratigraphic setting of the Kareem and Rudeis formations was applied to the property models. Lithofacies interpretation is based on well-log data, which differentiates the logarithm of each interpreted sediment surface according to the three major lithofacies: limestone sandstone, and shale (Figure 14). 3D static models for lithofacies were constructed based on sedimentary simulations of rock types. For this, the Kareem and Rudeis sections were divided into thirty and fifty layers respectively, to capture small-scale vertical non-uniformities in sufficient detail. Petrophysical features were utilized to create the 3D property models of effective porosity, shale content, and water saturation (Figure 14). The facies model suggests that the Kareem and Rudeis formations are composed primarily of limestone and sandstone, with some intercalated shale.
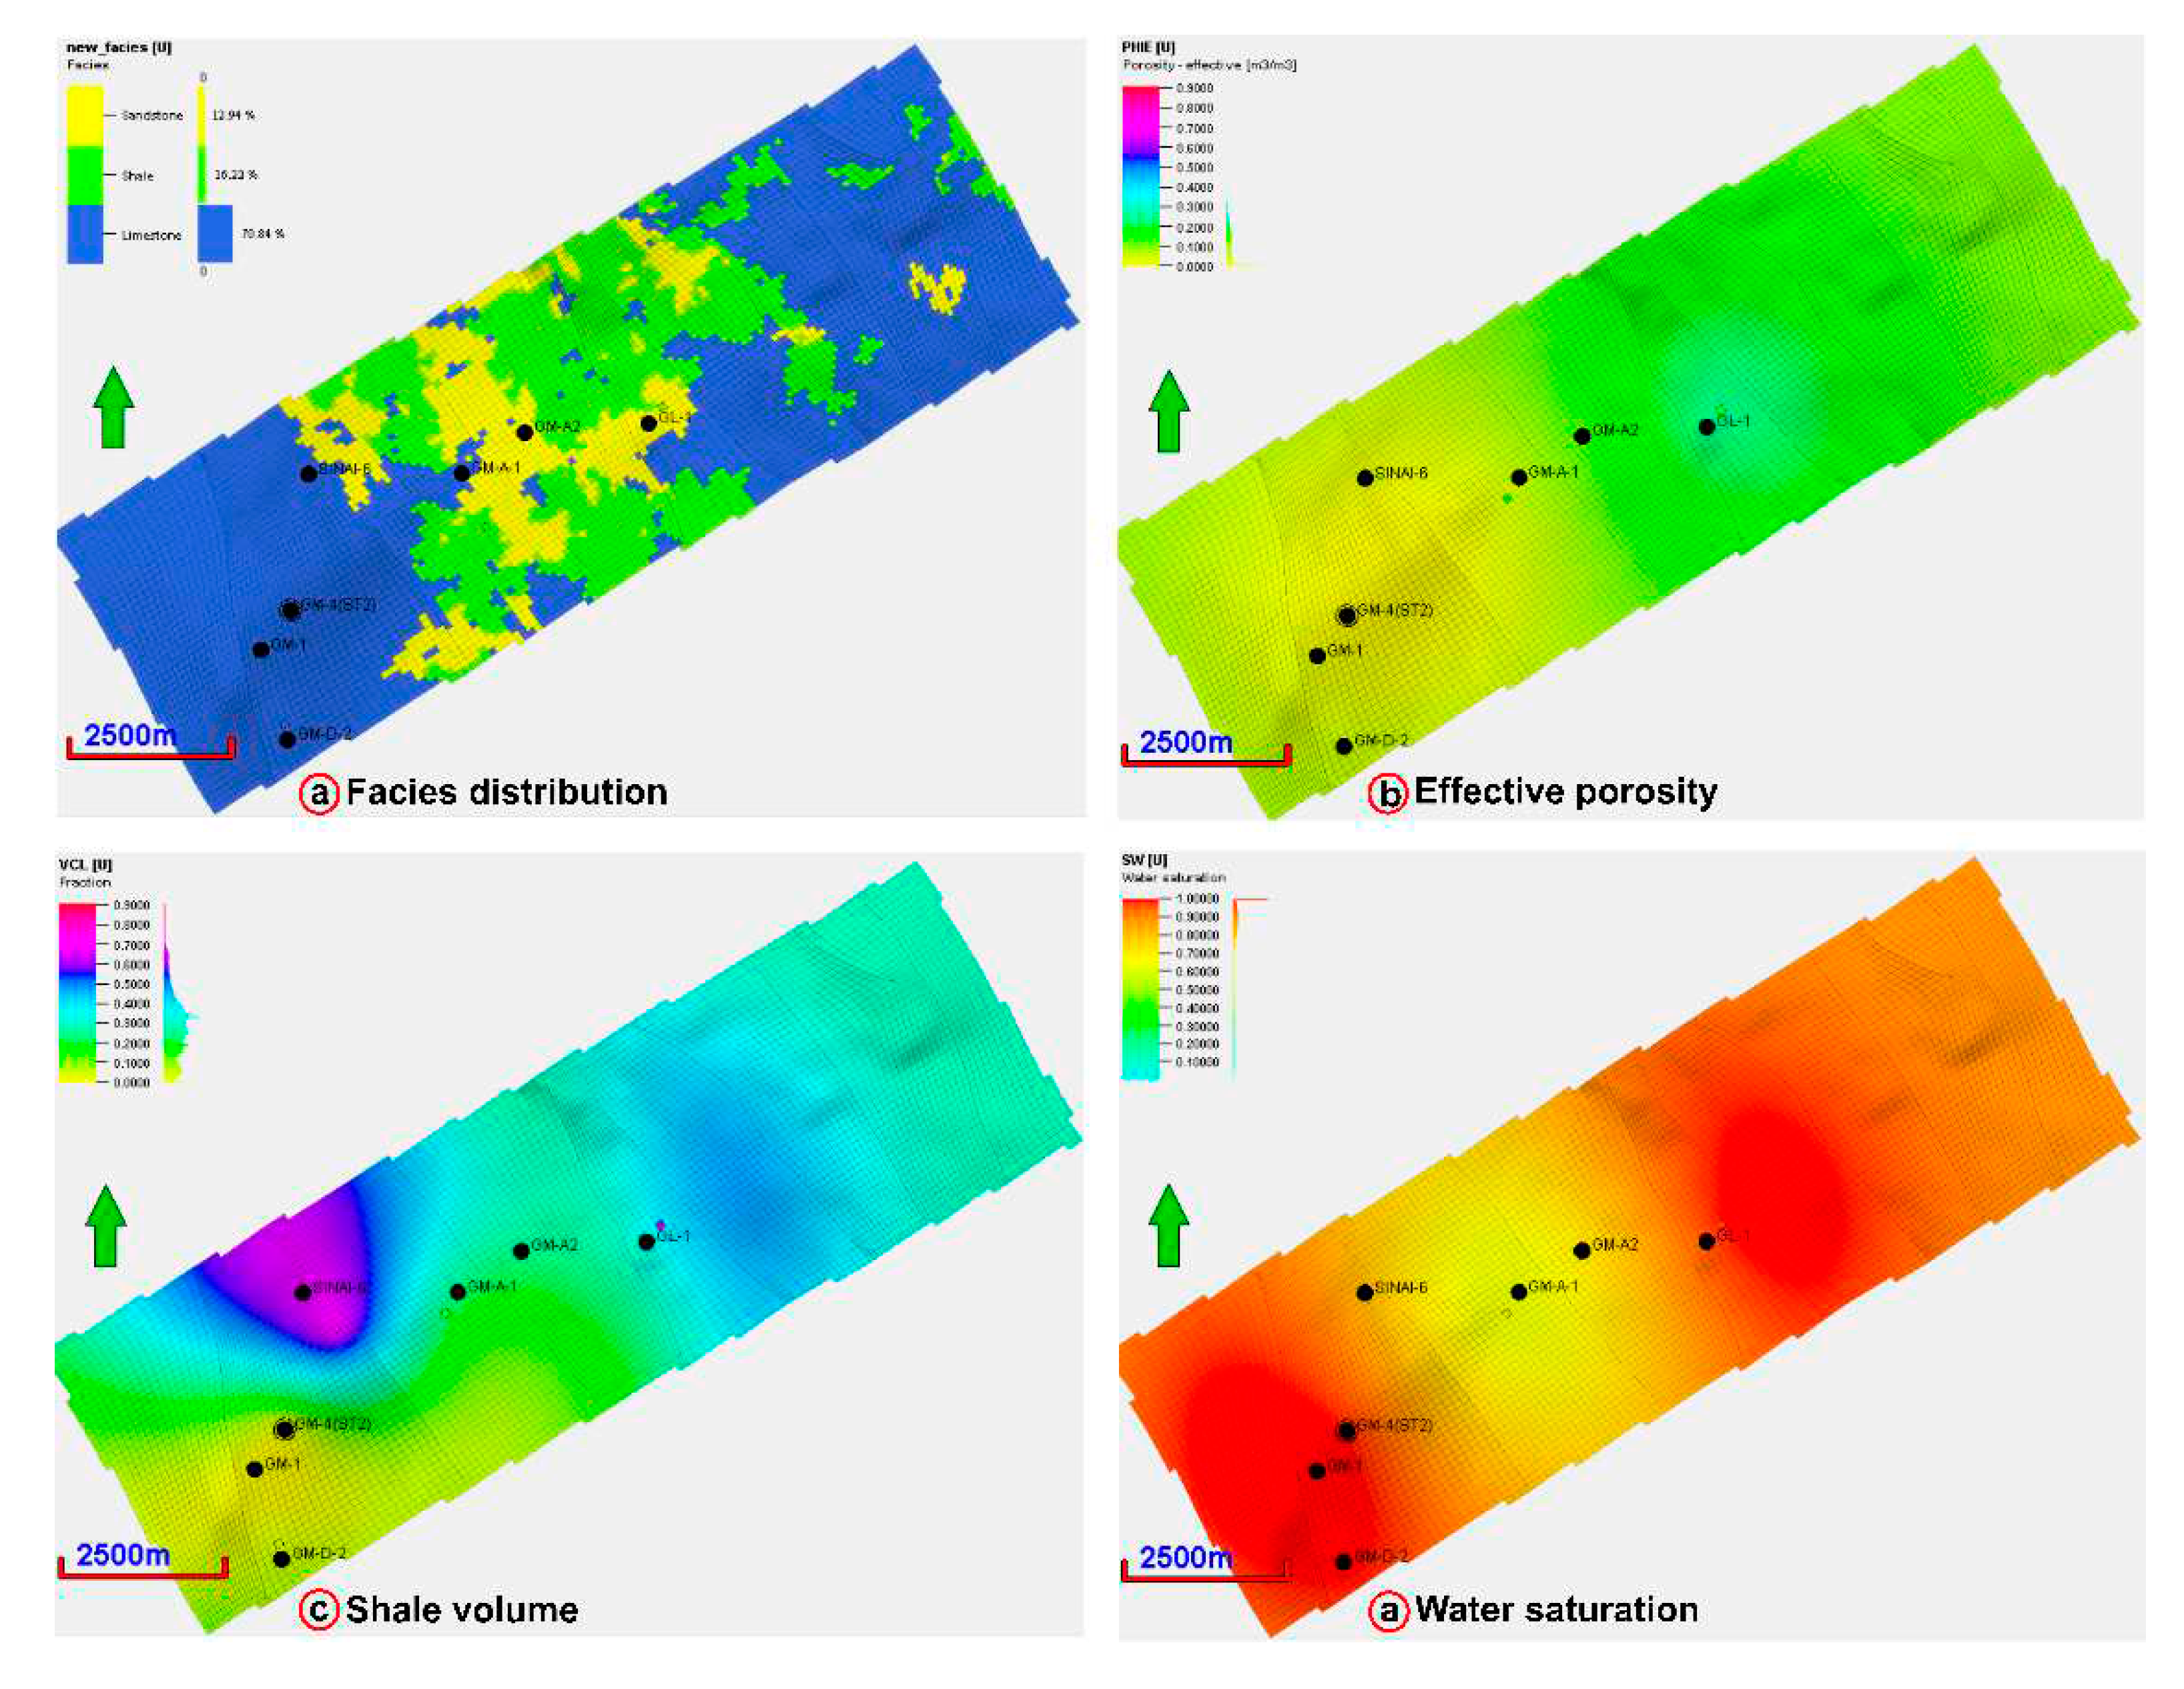
Figure 15 showcases the spatial distribution of rock facies within the Kareem Formation, encompassing limestone, shale, and sandstone, along with key reservoir properties such as effective porosity, shale content, and water saturation. The dominance of limestone facies is observed in the research area, primarily concentrated in the northeastern and southwestern directions. A progressive lateral fading is seen, followed by the occurrence of sandstone and shale facies, mainly focused on the central region. Moreover, a significant increase in effective porosity values is noted in both the central and northeastern directions. The shale content exhibits an upward trend towards the northwest, while decreasing towards the northeast. Water saturation demonstrates a decline towards the center and a gradual increase in both the northeast and southwest directions of the research region. These findings contribute to a comprehensive understanding of the reservoir's geological characteristics and have profound implications for optimized reservoir modeling and hydrocarbon exploration strategies.
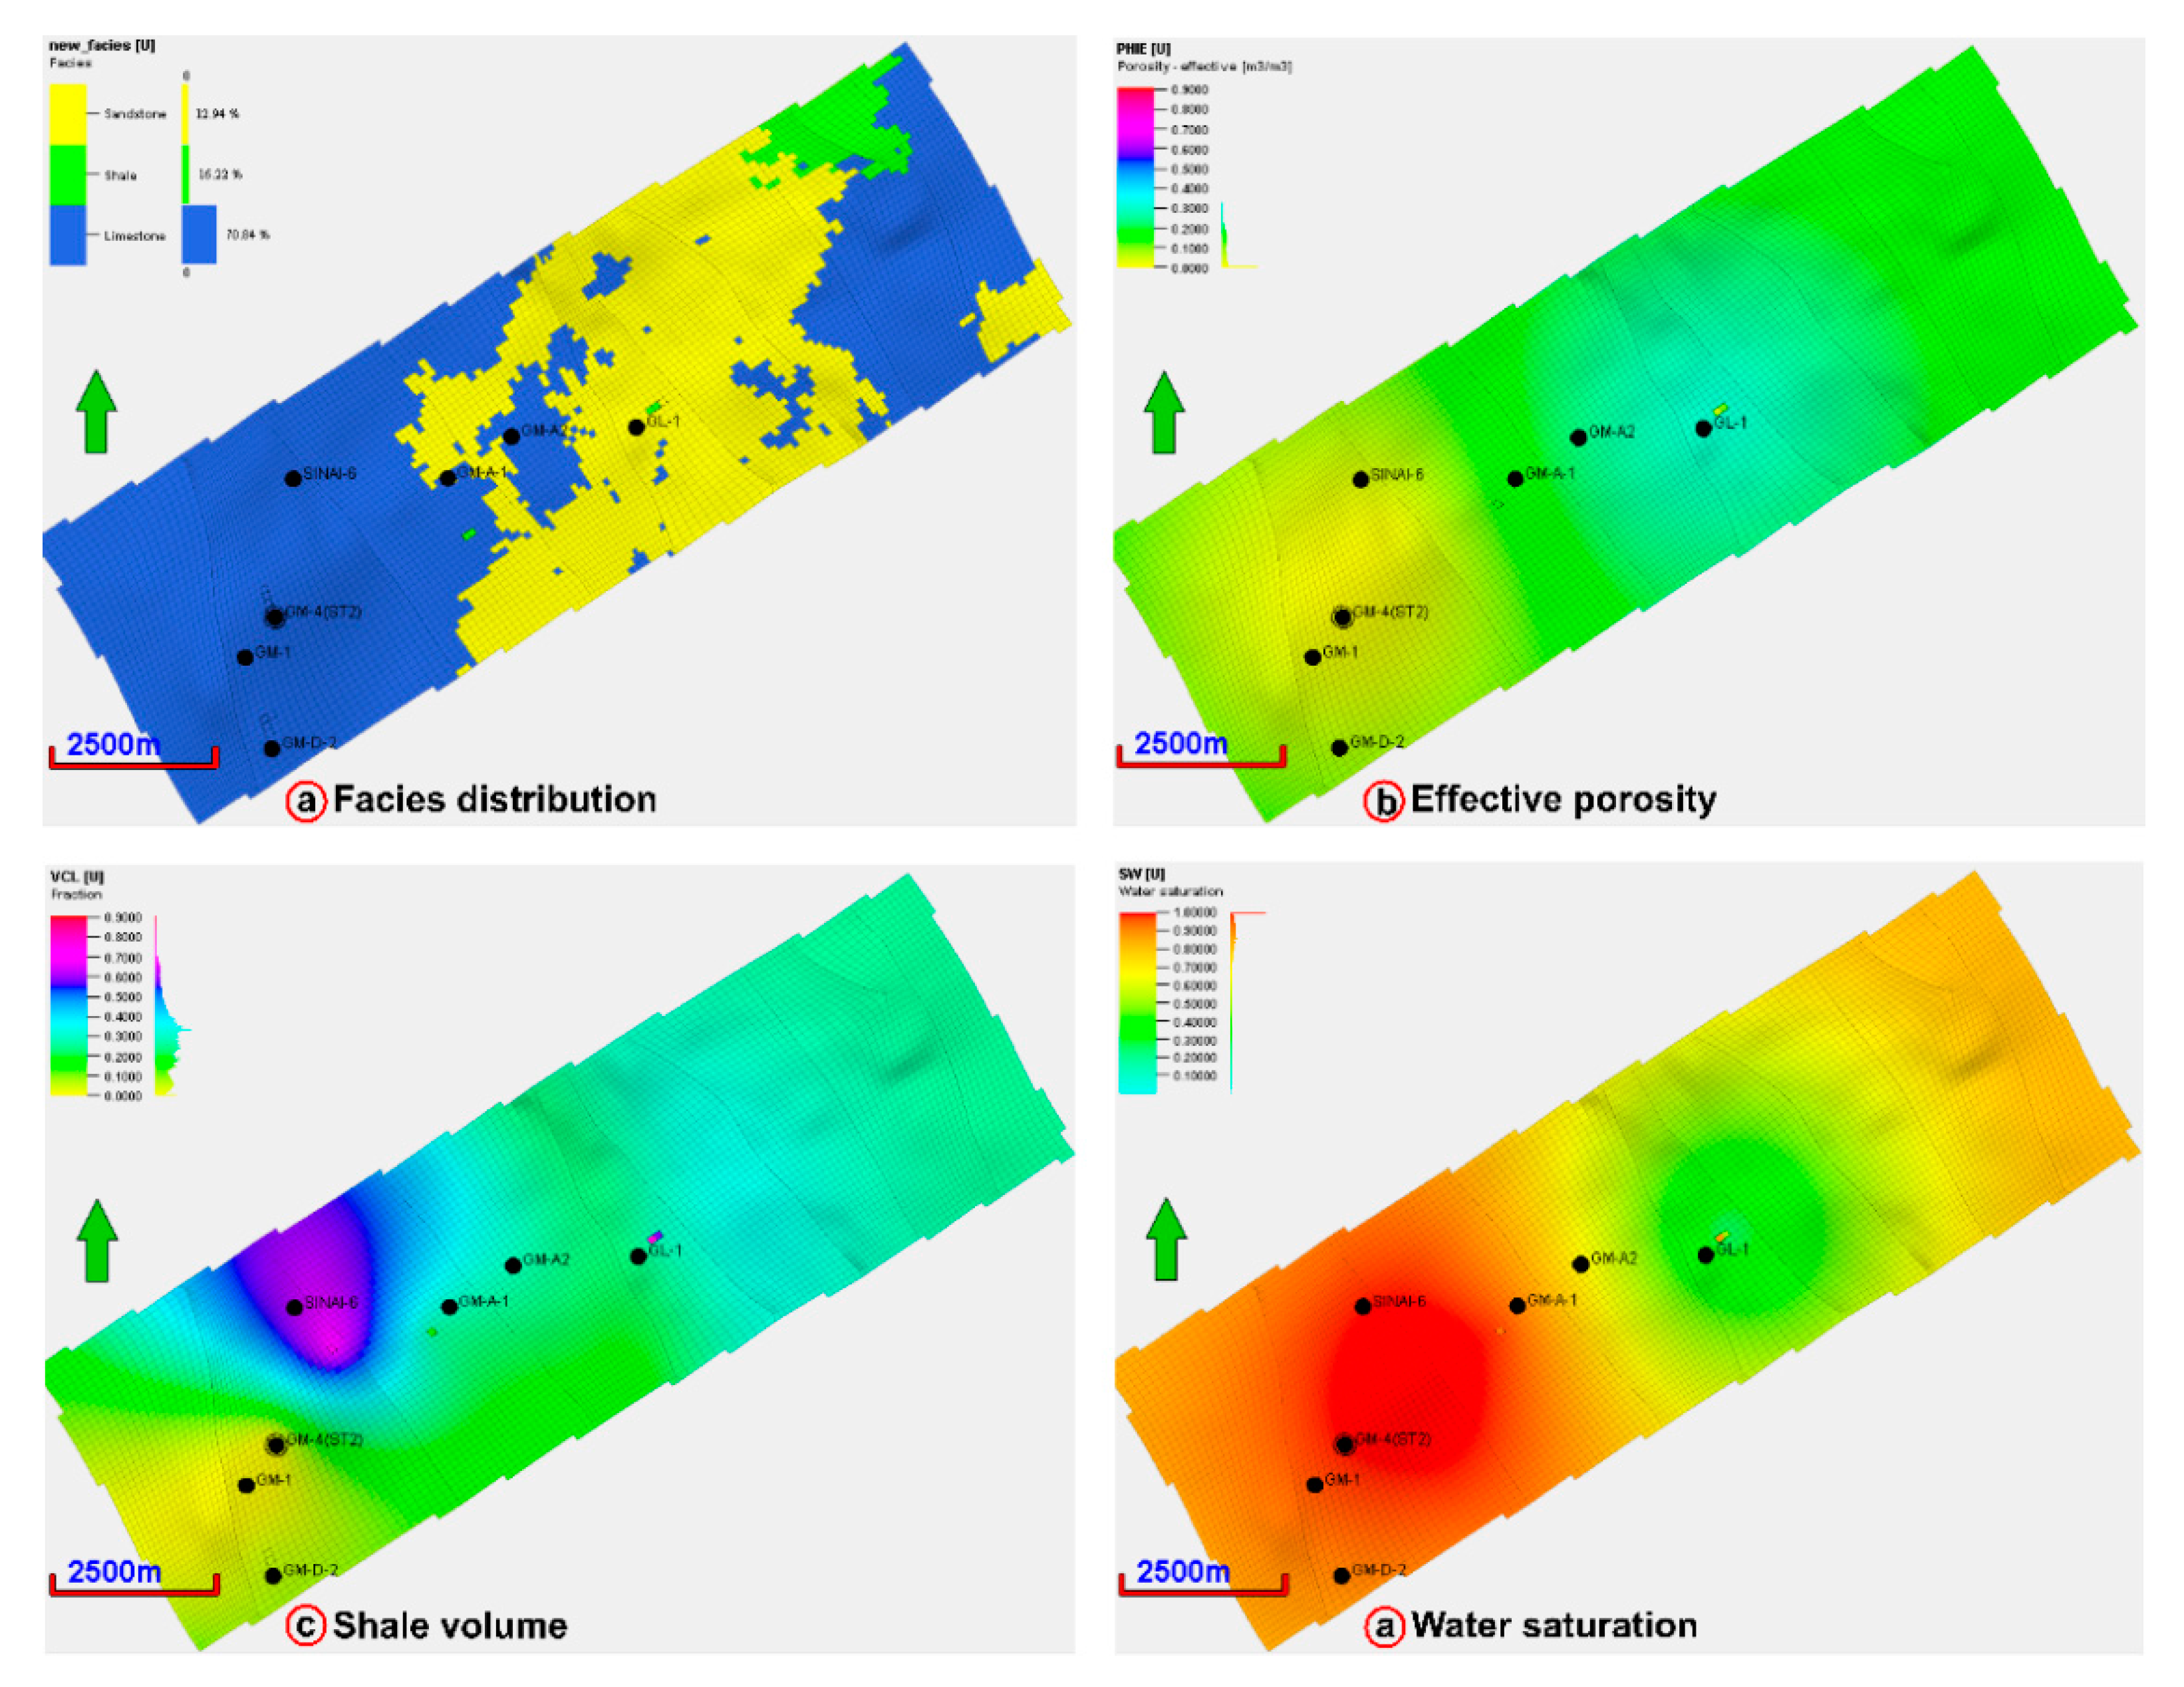
Figure 16 depicts the spatial configuration of rock facies in the Rudeis Formation, including limestone, shale, and sandstone. In addition to the distribution map of effective porosity, the reservoir's shale composition and water saturation are also considered. The spatial distribution map of rock facies in the Rudeis Formation highlights the prevalence of limestone facies, primarily concentrated in the southwestern direction. The facies transition gradually to sandstone facies in the central region of the study area, before reappearing in the northeastern direction. Notably, all sandstone facies are concentrated in the central part of the study area. Additionally, there is a presence of shale facies in minimal quantities, primarily concentrated in the far northeastern region of the study area.
The effective porosity values exhibit an upward trend in both the central and southwestern regions, indicating increased pore space availability. Conversely, the clay content values demonstrate a decreasing pattern in the southwestern and central parts, as well as in the northeastern direction of the Ras Jara area. Notably, the water content values exhibit an ascending trend in the southwest direction, while experiencing a decline in the northeast and central regions of the study area. These observations provide crucial insights into the reservoir's fluid behavior and have significant implications for optimizing hydrocarbon recovery strategies and reservoir management in the Ras Ghara area. The observed sequence of rock facies, characterized by a transition from limestone to shale and ultimately sand, implies a plausible north-eastward direction for the beach (platform), while concurrently suggesting a south-westward orientation for the basin development. These findings provide crucial insights into the paleogeographic evolution of the region, offering valuable information on the depositional dynamics and contributing to a comprehensive understanding of the geological history. This knowledge is of paramount importance for accurate reservoir characterization and optimizing hydrocarbon exploration strategies, ultimately enhancing the success rates and economic viability of petroleum operations in the investigated area. The spatial and vertical heterogeneity in lithofacies and petrophysical properties within the Gulf of Suez rift basin are predominantly influenced by the tectonic and structural framework of the region. The primary structural traps in this basin are closely associated with faulted blocks, which play a pivotal role in controlling the distribution and accumulation of hydrocarbons. Additionally, the fault planes serve as important conduits for hydrocarbon migration.
To summarize, the 3D static property model is essential in evaluating reservoirs as it offers a thorough and precise depiction of reservoir features. It facilitates the process of understanding and describing reservoir properties, modeling and analyzing different scenarios, assessing uncertainties, and optimizing techniques to enhance oil recovery. Ultimately, it supports making well-informed decisions and implementing better reservoir management practices.
Figure 14. 3D static reservoir models across the Ras Ghara oil Field. (a) facies model, (b) effective porosity model, (c) shale volume model, and (d) water saturation model.
Preprints 95655 g014
Figure 15. The selected productive layer in the Kareem Formation, Ras Ghara oil field, (a) facies distribution (b) effective porosity, (c) shale content, and (d) water saturation.
Preprints 95655 g015
Figure 16. The selected productive layer in the Rudeis Formation, Ras Ghara oil field, (a) facies distribution (b) effective porosity, (c) shale content, and (d) water saturation.
Preprints 95655 g016

4.6. New Prospect and Reserve Estimation
Multiple sources [2,7,8,48,68,69] emphasize the utilization of well log and seismic data for prospect detection, which involves identifying areas with favorable geological and economic conditions for exploratory drilling and assessing reservoir quality and hydrocarbon reserves. In the case of the Kareem and Rudeis formations, these formations exhibit relatively high hydrocarbon saturation, reaching up to 77% and 84%, respectively, accompanied by an effective porosity range of 14% to 33%. The sandstone reservoirs within these formations have demonstrated associations with source rocks and seals.
By integrating models of lithofacies and petrophysical properties, we conducted an evaluation of limestone and sandstone distribution, revealing favorable reservoir quality within traps formed by faulted structures. These faulted structures serve as the primary targets in our search for new prospects in the Ras Ghara oil production area. Through our analysis, we have identified a target area as a new prospect, specifically focusing on two prospect areas located on the upthrown side of fault F1 and F3. Depth contour maps depicting the top of the Kareem and Rudeis reservoirs exhibit a three-way closure, indicating potential for reservoir accumulation (Figure 10). Furthermore, constructed cross-sections reveal that the predominant facies within these prospect areas are limestone and sandstones. The effective porosity ranges from 14% to 33%, while water saturation ranges from 16% to 65%, and hydrocarbon saturation ranges from 35% to 84% (Figure 15 and Figure 16). These findings provide valuable insights into the reservoir characteristics and aid in identifying potential drilling targets within the newly identified prospect area.
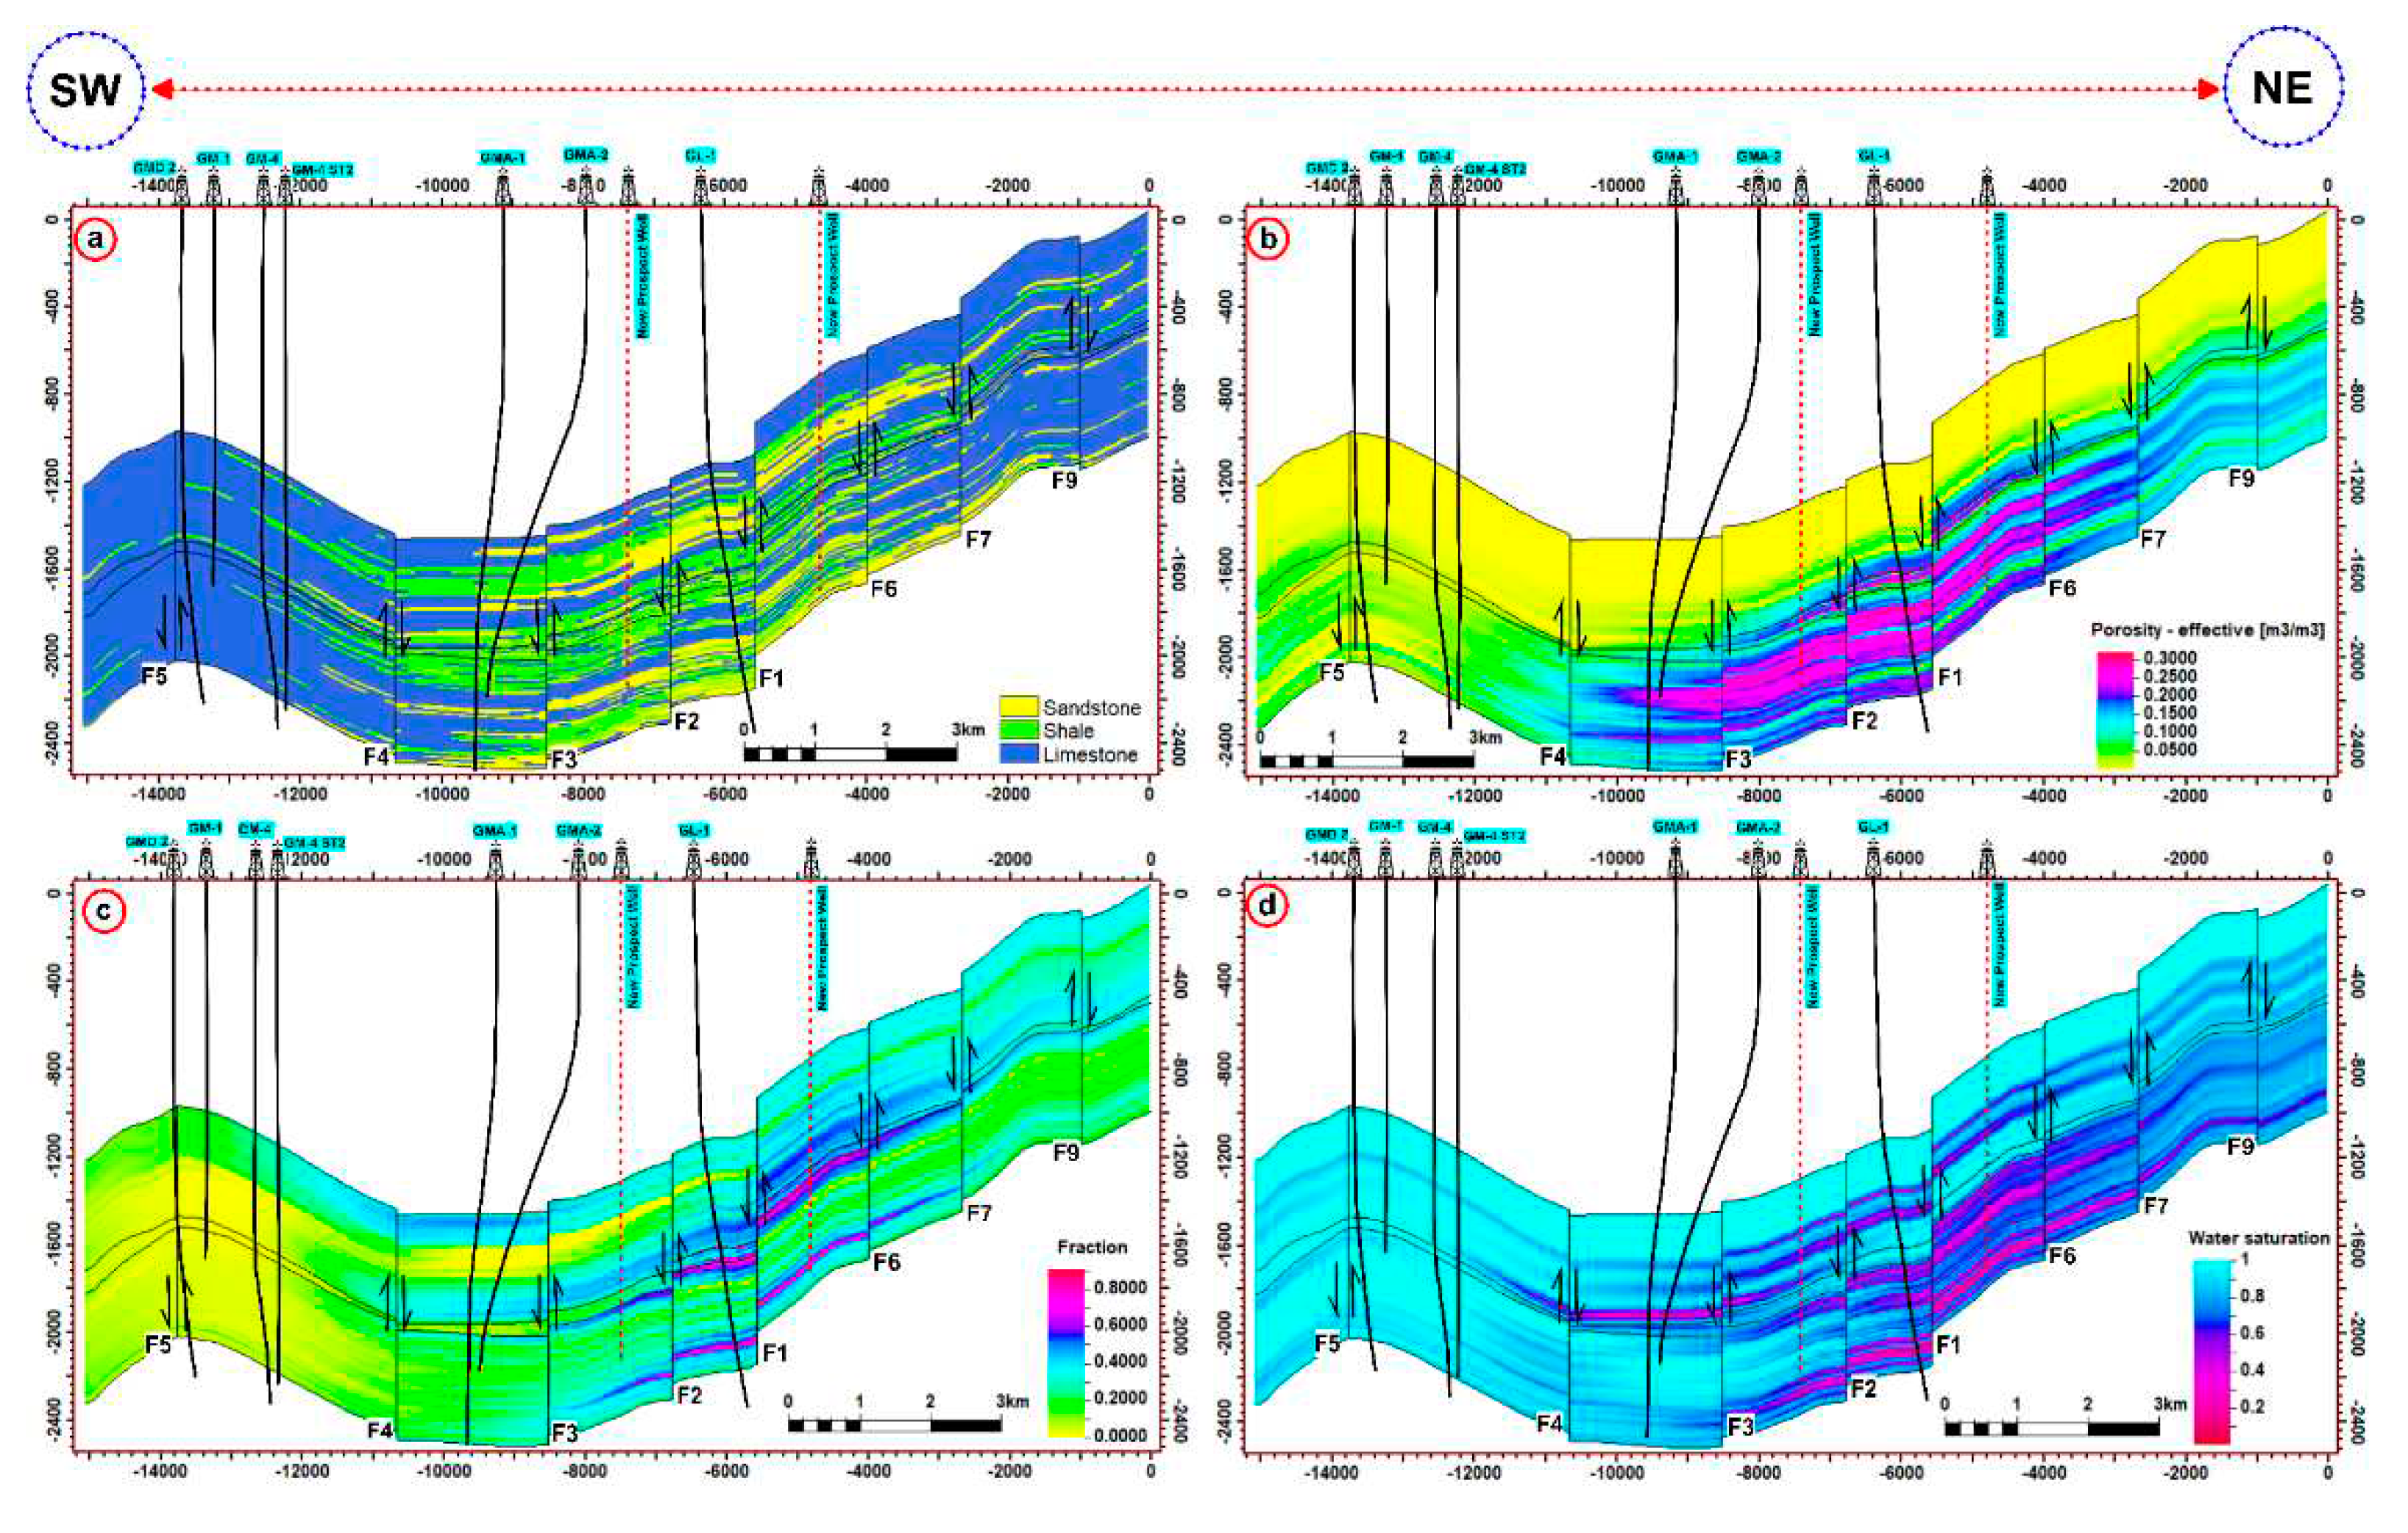
In Figure 17, a series of vertical sections are presented, oriented in the northeast-southwest direction, aiming to showcase the variations in rock facies and petrophysical parameters within the Kareem and Rudeis reservoirs. As discussed earlier, these sections serve to identify potential areas suitable for implementing a development plan. Notably, areas located along the upper throw of normal faults No. 1 and 3 have been recognized as favorable locations, exhibiting a promising three-dimensional closure zone and demonstrating positive petrophysical properties within the reservoir.
These noteworthy areas are delineated by a dashed red line, indicating their significance for future exploration and production activities. This information holds considerable importance for reservoir characterization and decision-making processes, contributing to the optimization of hydrocarbon recovery and the successful implementation of development strategies.
The following equation was utilized to compute hydrocarbon volumes: (Cannon, 2018);
HCIIP= (GRV*ϕ NTG*(1-S_w)) /FVF (1)
where HCIIP is the hydrocarbons initially in place, GRV is the gross rock volume, ϕ is the porosity, NTG is the net/gross reservoir ratio, Sw is the water saturation, and FVF is the formation volume factor.
The original oil-in-place (OOIP) of the two new prospects was determined using the HCIIP volume calculations, as shown in Table 2. This study provides estimates for the original oil in place (OOIP) in the Kareem Formation, which are approximately 2,002,404 STB and 1,175,580 STB. The oil reserves in this formation are estimated to be 600,721 STB and 352,674 STB. In the Rudeis Formation, the estimated OOIP is 6,302,916 STB and 2,841,894 STB, with oil reserves of about 1,890,875 STB and 852,568 STB for the first and second prospects respectively. The evaluation of oil reserves and the potential opportunities for developments can directly influence the levels of hydrocarbon output at the Ras Ghara oil field.
Figure 17. NE-SW trending cross-section profiles of 3D property models (a) lithofacies distribution. (b) effective porosity. (c) shale content. (d) water saturation of the Kareem and Rudeis formations in the Ras Ghara oil field; the dotted line refers to the new prospect wells.
Preprints 95655 g017

5. Coclusions

  • This study presents an insightful understanding of the reservoir attributes of the Kareem and Rudeis formations. The petrophysical properties, lithology, faulted structures, and hydrocarbon distribution through a three-dimensional static model, has been established for Ras Ghara Field, southern Gulf of Suez.
  • The established favorable hydrocarbon accumulations in fault horst blocks of Kareem and Rudies in Ras Ghara field are interpretable on 2D seismic reflection data despite structural imaging and seismic signal-to-noise issues.
  • The petrophysical investigations determined that the net pay thicknesses varied between 3 m and 48 m in the Kareem reservoirs, and between 4 m and 58 m in the Rudeis reservoirs. The porosity range is 14–33% and 15–25%, respectively, while the hydrocarbon saturation range is 35–77% and 40–84%, respectively.
  • The distribution pattern of the limestone and sandstone reservoir zone within the Ras Ghara oil field is primarily focused in the northeastern, southwestern, and central regions, displaying a discernible eastward migration from the Rudeis to Kareem formations. In essence, the central region stands out as the predominant location for the limestone and sandstone facies, distinguished by higher effective porosity and lower water saturation. This spatial arrangement of reservoir lithologies holds significant implications for high-impact journals, as it highlights the key areas of concentration and migration patterns of hydrocarbon-bearing formations in the Ras Ghara oil field.
  • The estimated original oil in place (OOIP) within the reservoir formations of the Ras Ghara oil field indicates substantial quantities of oil, with the Kareem Formation holding 2,002,404 STB and 1,175,580 STB of oil for the proposed two new prospects, respectively. Additionally, the Rudeis Formation contains a noteworthy 6,302,916 STB and 2,841,894 STB, respectively.

Author Contributions

Conceptualization, M.R., T.M., and A.R.; methodology, M.R., T.M., A.R., M.F., F.A., and M.A.; software, M.R., T.M., M.F., F.A., and M.A.; validation, M.R., T.M., and A.R.; formal analysis, M.R. and T.M.; investigation, M.F., F.A., and M.A.; resources, M.R., T.M.,M.F., F.A., and M.A.; data curation, M.R., T.M.,M.F.; writing—original draft preparation, M.R., T.M., and A.R.; writing—M.R. and A.R.; visualization, A.R. and M.F.; supervision, M.R. and T.M.; project administration, F.A. and M.A.; funding acquisition, F.A., and M.A. All authors have read and agreed to the published version of the manuscript.

Funding

This research was funded by King Saud University, grant number: Fahad Alshehri. The APC was funded by XXX”.

Data Availability Statement

The current study's datasets are not publicly available, due to data sharing limitations. The corresponding author may help obtaining a data access permission.

Acknowledgments

The authors extend their appreciation to Abdullah Alrushaid Chair for Earth Science Remote Sensing Research for his leadership and supporting the research grant application.

Conflicts of Interest

The authors declare no conflicts of interest.

References

  1. Guo, Y.; Yang, Y.; Wang, C. Global energy networks: Geographies of mergers and acquisitions of worldwide oil companies. Renew. Sust. Energ. Rev. 2021, 139, 110698. [Google Scholar] [CrossRef]
  2. Gawad, E.A.; Fathy, M.; Reda, M.; Ewida, H. Source rock evaluation of the Central Gulf of Suez, Egypt: A 1D basin modelling and petroleum system analysis. Geol. J 2021, 56(7), 3850–3867. [Google Scholar] [CrossRef]
  3. Lirong, D.O.U.; Zhixin, W.E.N.; Jianjun, W.A.N.G.; Zhaoming, W.A.N.G.; Zhengjun, H.E.; Xiaobing, L.I.U.; Zhang, N. Analysis of the world oil and gas exploration situation in 2021. Pet. Explor. Dev 2022, 49(5), 1195–1209. [Google Scholar] [CrossRef]
  4. Abd Elhady, M.A.; Fathy, M.; Hamed, T.; Reda, M. Petroleum evaluation through subsurface and petrophysical studies of Hammam Faraun Member of Belayim Formation, Bakr Oil Field, Gulf of Suez, Egypt. Nat Sci 2015, 13(4), 59-78. http://www.sciencepub.net/nature.10. /: 59-78. http.
  5. Gawad, E.A.; Fathy, M.; Reda, M.; Ewida, H. Petroleum geology: 3D reservoir modelling in the central Gulf of Suez, Egypt, to estimate the hydrocarbon possibility via petrophysical analysis and seismic data interpretation. Geol. J 2021, 56(10), 5329–5342. [Google Scholar] [CrossRef]
  6. Radwan, A.E. Three-dimensional gas property geological modeling and simulation. In Sustainable geoscience for natural gas subsurface systems, , David A. Wood, Jianchao Cai Wood, D.A., Cai, J; Gulf Professional Publishing: Oxford, United Kingdom, 2022; Volume 2, pp. 29-49). [CrossRef]
  7. 7. Reda, M.; Fathy, M.; Gawad, E.A. Comprehensive 3D reservoir modelling and basin analysis: An insight into petroleum geology, to reevaluate the hydrocarbon possibilities in the Siwa Basin, North Western Desert, Egypt. Geol. J 2022, 57(4), 1600–1616. [CrossRef]
  8. Mamdouh, M.; Reda, M.; Din, M.Z.E; Abdelhafeez, T.H. 3D petroleum reservoir modelling using seismic and well-log data to assess hydrocarbon potential in Abu Roash (G) Member, Karama Oil Field, North-Western Desert, Egypt. Geol. J 2023. 313-324. [CrossRef]
  9. Yilmaz, Ö. Seismic data analysis: Processing, inversion, and interpretation of seismic data, 2nd ed.; Society of exploration geophysicists, Tulsa, USA, 2001, 1238-1295. [CrossRef]
  10. Biondi, B.L. 3D seismic imaging, 1st ed.; Society of exploration geophysicists, Tulsa, USA., 2006, pp. 123–142. [CrossRef]
  11. Simm, R.; Bacon, M. Seismic Amplitude, 1st ed.; Cambridge University Press, Cambridge, UK, 2014; pp. 50-57.
  12. Sayers, C.M., 2013. Introduction: Rock physics for reservoir exploration, characterisation, and monitoring. Geophys. Prospect 2013, 61(2), 251-253. [CrossRef]
  13. Meshref, W.; Refai, E.M.; Abdel Baki, S.M., 1976. Structural interpretation of the Gulf of Suez and its oil potentialities. In Proceedings of the EGPC., 5th Petrol Explor. Semin.; Cairo, Egypt.
  14. Nakhla, A.M., 2005. An integrated seismotectonic- magnetotectonic study for the miocene-pre-miocene sequence in Abu Rudeis-Ras Budran area Gulf of Suez, Egypt, Ph.D. Banha University. June 15, 2005.
  15. Ghoneimi, A.; Azab, A.; Elsawy, M.; Alaa El-Din, A., 2020. Structural setup of Gara Marine area as deduced from 3D seismic interpretation and gravity-magnetic modelling, Gulf of Suez, Egypt. NRIAG J. Astron. Geophys 2020, 9(1), 483-490. [CrossRef]
  16. Fattouh, B.; and Darbouche, H. North African oil and foreign investment in changing market conditions. Energy Policy 2010, 38(2), 1119-1129. 2. [CrossRef]
  17. Dolson, J. C., M. Atta, D. Blanchard, A. Sehim, J. Villinski, T. Loutit and K. Romine, 2014, Egypt’s future petroleum resources: A revised look into the 21st century, in Petroleum systems of the Tethyan region: AAPG Memoir 106 L. Marlow, C. Kendall and L. Yose, eds., American Association of Petroleum Geologists, Tulsa, USA, 2014; p. 143–178. [CrossRef]
  18. Dolson, J., 2019. The petroleum geology of Egypt and history of exploration. In The Geology of Egypt. Regional Geology Reviews, Hamimi, Z., El-Barkooky, A., Martínez Frías, J., Fritz, H., Abd El-Rahman, Y. Eds; Springer, New York, USA. pp. (635-658. [CrossRef]
  19. Radwan, A.E.; Abdelghany, W.K.; Elkhawaga, M.A. Present-day in-situ stresses in Southern Gulf of Suez, Egypt: Insights for stress rotation in an extensional rift basin. J. Struct. Geol 2021, 147, 104334. [CrossRef]
  20. Esily, R.R.; Chi, Y.; Ibrahiem, D.M.; Amer, M.A. The potential role of Egypt as a natural gas supplier: A review. Energy Rep. 2022, 8, 6826-6836. [CrossRef]
  21. El-Qalamoshy, T.R.; Abdel-Fattah, M.I.; Reda, M.; et al. A multi-disciplinary approach for trap identification in the Southern Meleiha Area, North Western Desert, Egypt: integrating seismic, well log, and fault seal analysis. Geomech. Geophys. Geo-energ. Geo-resour. 2023, 9, 157. [Google Scholar] [CrossRef]
  22. Abdel-Gawad, M., 1970. A discussion on the structure and evolution of the Red Sea and the nature of the Red Sea, Gulf of Aden and Ethiopia rift junction-The Gulf of Suez: a brief review of stratigraphy and structure. Philosophical Transactions of the Royal Society of London. Series A, Mathematical and Physical Sciences, 267(1181), 41-48. [CrossRef]
  23. Evans, A.L., 1988. Neogene tectonic and stratigraphic events in the Gulf of Suez rift area, Egypt. Tectonophysics 1988, 153, 235–247. [CrossRef]
  24. Moustafa, A.R. Structural characteristics and tectonic evolution of the east-margin blocks of Suez rift. Tectonophysics 1993, 223, 223–381. [Google Scholar] [CrossRef]
  25. Schütz, K.I., 1994. Structure and stratigraphy of the Gulf of Suez, Egypt. In Interior rift basins, AAPG Memoir 59, Landon, S.M., Coury, A.B., Eds.; American Association of Petroleum Geologists, Tulsa, USA, pp. 57–96. [CrossRef]
  26. Bosworth, W.; McClay, K., 2001. Structural and stratigraphic evolution of the Gulf of Suez rift, Egypt: a synthesis. In Peri-Tethyan Memoir 6: Peri-Tethyan Rift/Wrench Basin and Passive Margins, Ziegler, P.A., Cavazza, W., Robertson, A.H.F., Crasquin-Soleau, S., Eds; Mémoires du Muséum national d'histoire naturelle, Paris, France, 567-606. https://personal.utdallas.edu/~rjstern/egypt/PDFs/Cenozoic%20Red%20Sea/Bosworth&McClay01.pdf.
  27. Moustafa, A.R.; and Khalil, S.M.. Structural setting and tectonic evolution of the Gulf of Suez, NW Red Sea and Gulf of Aqaba rift systems. The geol. of Egypt 2020, 295-342. [CrossRef]
  28. Abdine, A.S. Egypt's petroleum geology: Good grounds for optimism. World Oil 1981, 193, p. 7.
  29. Lelek, J.J.; Shepherd, D.B.; Stone, D.M.; Abdine, A.S., 1992. October Field: The Latest Giant under Development in Egypt's Gulf of Suez: Chapter 15. In M 54: Giant Oil and Gas Fields of the Decade 1978–1988, Halbouty, M.T., Ed.; American Association of Petroleum Geologists, Tulsa, USA, 1992; Volume 52, pp. 231–249. [CrossRef]
  30. Alsharhan, A.S.; Salah, M.G. Geology and hydrocarbon habitat in a rift setting: southern Gulf of Suez, Egypt. Bull. Can. Pet. Geol. 1994, 42, 312–331.
  31. Alsharhan, A.S.; Salah, M.G. Geology and hydrocarbon habitat in a rift setting: northern and central Gulf of Suez, Egypt. Bull. Can. Pet. Geol. 1995, 43, 156–176.
  32. EGPC, 1996. Gulf of Suez oil fields (a comprehensive overview); Egyptian General Petroleum Corporation: Cairo, Egypt, p. 736.
  33. Alsharhan, A.S., 2003. Petroleum geology and potential hydrocarbon plays in the Gulf of Suez rift basin, Egypt. Am Assoc Pet Geol Bull. 2003, 87, 143–180.
  34. Dolson, J. The Petroleum Geology of Egypt and History of Exploration. In The Geology of Egypt. Regional Geology Reviews; Hamimi, Z., El-Barkooky, A., Martínez Frías, J., Fritz, H., Abd El-Rahman, Y., Eds.; Springer: Cham, Switzerland. [CrossRef]
  35. McClay, K.R.; Nichols, G.J.; Khalil, S.M.; Darwish, M.; Bosworth, W. , 1998. Extensional tectonics and sedimentation, eastern Gulf of Suez, Egypt. In Sedimentation and tectonics of rift basins: Red Sea-Gulf of Aden, Purser, B.H., Bosence, D.W.J., Eds.; Springer, Dordrecht, Netherlands, 1998; pp. 223–238. [CrossRef]
  36. Young, M.J.; Gawthorpe, R.L.; Sharp, I.R. Sedimentology and sequence stratigraphy of a transfer zone coarse-grained fan delta, Miocene Suez Rift, Egypt. Sedimentology 2000, 47, 1081–1104. [CrossRef]
  37. Jackson, C.; Gawthorpe, R.; Carr, I.; Sharp, I. Normal faulting as a control on the stratigraphic development of shallow marine syn-rift sequences: the Nukhul and Lower Rudeis Formations, Hammam Faraun fault block, Suez Rift, Egypt. Sedimentology 2005, 52, 313–338. [CrossRef]
  38. El-Naby, A.I.M.; Ghanem, H.; Boukhary, M.; El-Aal, M.; Lüning, S.; Kuss, J. Sequence-stratigraphic interpretation of structurally controlled deposition: Middle Miocene Kareem Formation, southwestern Gulf of Suez, Egypt. Geoarabia 2010, 15, 129–150. [CrossRef]
  39. El-Khadragy, A.A.; Shazly, T.F.; Ramadan, M.; El-Sawy, M.Z. Petrophysical investigations at both Rudeis and Kareem formations, Ras Ghara oil field, Gulf of Suez, Egypt. Egypt. J. Pet. 2017, 26, 269–277. [CrossRef]
  40. El-Khadragy, A.A.; Shazly, T.F.; Mousa, D.A.; Ramadan, M.; El-Sawy, M.Z. Integration of well log analysis data with geochemical data to evaluate possible source rock. Case study from GM-ALEF-1 well, Ras Ghara oil Field, Gulf of Suez-Egypt. Egypt. Egypt. J. Pet. 2018, 27, 911–918. [CrossRef]
  41. Sakran, S.; Nabih, M.; Henaish, A.; Ziko, A. Structural regime and its impact on the mechanism and migration pathways of hydrocarbon seepage in the southern Gulf of Suez rift: An approach for finding new unexplored fault blocks. Mar Pet Geol. 2016, 71, 55-75.
  42. Hewaidy, A.G.A.; Mandur, M.M.; Farouk; S.; El Agroudy, I.S. Integrated planktonic stratigraphy and paleoenvironments of the Lower-Middle Miocene successions in the central and southern parts of the Gulf of Suez, Egypt. Arab. J. Geosci. 2016 , 9, pp.1-32.
  43. Sallam, E.S.; Afife, M.M.; Fares, M.; van Loon, A.J.; Ruban, D.A. Depositional cycles of the Lower Miocene Rudeis Formation (southwestern offshore margin of the Gulf of Suez, Egypt): Implications for reservoir evaluation. Mar. Geol. 2019, 415, 105964. [CrossRef]
  44. Farouk, S.; Sen, S.; Pigott, J.D.; Sarhan, M.A. Reservoir characterization of the middle Miocene Kareem sandstones, Southern Gulf of Suez Basin, Egypt. Geomech. Geophys. Geo-energ. Geo-resour. 2022, 8, 130. [CrossRef]
  45. Adelu, A.O.; Aderemi, A.A.; Akanji, A.O.; Sanuade, O.A.; Kaka, S.I.; Afolabi, O.; Olugbemiga, S.; Oke, R. Application of 3D static modeling for optimal reservoir characterization. J. African Earth 2019, 152, 184–196. [CrossRef]
  46. Ma, Y.Z.; La Pointe, P.R., (Eds.). Uncertainty analysis in reservoir characterization and management: how much should we know about what we don't know? In Uncertainty analysis and reservoir modeling: AAPG Memoir 96, Ma, Y.Z., La Pointe, P.R., eds.; American Association of Petroleum Geologists: Tulsa USA, 2011; pp. 1–15. Uncertainty analysis and reservoir modeling: AAPG Memoir 96, Ma, Y.Z., La Pointe, P.R., eds. pp. 1–15. [CrossRef]
  47. Yu, X.Y.; Ma, Y.Z.; Psaila, D.; Pointe, P.L.; Gomez, E.; Li, S., 2011. Reservoir characterization and modeling: a look back to see the way forward; In Uncertainty analysis and reservoir modeling: AAPG Memoir 96, Ma, Y.Z., La Pointe, P.R., eds.; American Association of Petroleum Geologists: Tulsa, USA, 2011; pp. 289–309. [CrossRef]
  48. .
  49. El-Bialy, M.Z.,. Precambrian Basement Complex of Egypt. In The Geology of Egypt. In The Geology of Egypt. Regional Geology Reviews, Hamimi, Z., El-Barkooky, A., Frías, J.M., Fritz, H., El-Rahman, Y.A., Eds.; Springer: Cham, Switzerland, 2020; pp. 37–79. [CrossRef]
  50. Salama, A.; El-Mougy, S.; El-Moneim, M.A.; Hakim, S. Exploration in Ras Ghara area, a case history, Southern Gulf of Suez, Egypt. Egypt J Pet Corp. 1994, 1, 240–257.
  51. El-Naby, A.A.; El-Aal, M.A.; Kuss, J.; Boukhary, M.; Lashin, A. Structural and basin evolution in Miocene time, south-western Gulf of Suez, Egypt. Neues Jahrbuch für Geologie und Paläontologie-Abhandlungen 2009, 251, 331–353. [CrossRef]
  52. Wanas, H.A. The Lower Paleozoic rock units in Egypt: An overview. Geosci Front 2011, 2, 492–507. [CrossRef]
  53. Tewfik, N.; Harwood, C.; Deighton, I., 1992. The Miocene, Rudeis, and Kareem Formations of the Gulf of Suez, Aspects of Sedimentology and Geohistory. In Proceedings of EGPC 11th Petroleum Exploration and Production Conference, Cairo, Egypt, 1992; 07/11/1992.
  54. Ayyad, H.M.; Hewaidy, A.G.A.; Omar, M.; Fathy, M., 2023a. Sequence stratigraphy and reservoir quality of the Gulf of Suez syn-rift deposits of the Nukhul formation: Implications of rift initiation and the impact of eustacy and tectonic on deposition. Mar Pet Geol. 2023, 156, 106459. [CrossRef]
  55. Ayyad, H.M.; Hewaidy, A.G.A.; Farouk, S.; Samir, A.; Bazeen, Y.S., 2023b. Sequence stratigraphy of the upper Oligocene–middle Miocene succession in west–central Sinai, Egypt. Geol. J. 2023, 58(1), 264-282. [CrossRef]
  56. Cannon, S. Reservoir modelling: A practical guide; John Wiley & Sons: New Jersy, USA, 2018; 47-156. [CrossRef]
  57. White, R.E.; Simm, R., 2003. Tutorial: Good practice in well ties. First break 2003, 21(10). 75-83.
  58. Khan, U.; Zhang, B.; Du, J.; Jiang, Z. 3D structural modeling integrated with seismic attribute and petrophysical evaluation for hydrocarbon prospecting at the Dhulian Oilfield, Pakistan. Front. Earth Sci. 2021, 15(3), 649-675. 3. [CrossRef]
  59. Zhang, B.; Tong, Y.; Du, J.; Hussain, S.; Jiang, Z.; Ali, S.; Khan, U. Three-dimensional structural modeling (3D SM) and joint geophysical characterization (JGC) of hydrocarbon reservoir. Minerals 2022, 12(3), 363. 3. [CrossRef]
  60. Tearpock, D.J.; Bischke, R.E.; Brenneke, J.; Metzner, D. Applied three-dimensional subsurface geological mapping: with structural methods, 3rd ed.; Pearson: Boston, USA; 2020, p. 992.
  61. Asquith, G.B., Krygowski, D. and Gibson, C.R., 2004. Basic well log analysis, 2nd ed.; American Association of Petroleum Geologists, Tulsa, USA, 2004; pp. 138-145.
  62. Boukhary, M.; Abd El Naby, A.; Faris, M.; Morsi, A. Plankton stratigraphy of the Early and Middle Miocene Kareem and Rudeis Formations in the central part of the Gulf of Suez, Egypt. Hist Biol. 2012, 24(1), 49-62. 1. [CrossRef]
  63. El Atfy, H.; Brocke, R.; Uhl, D.; Ghassal, B.; Stock, A.T.; Littke, R., 2014. Source rock potential and paleoenvironment of the Miocene Rudeis and Kareem formations, Gulf of Suez, Egypt: An integrated palynofacies and organic geochemical approach. Int J Coal Geol 2014, 131, 326-343. [CrossRef]
  64. .
  65. Alshangiti, A.; Zhou, H.W. Estimation of seismic attenuation for reservoirs mapping and inverse Q-filtering: An application on land seismic data. Geophys. Prospect 2023, 71(4), 682-697. 4. [CrossRef]
  66. Minshull, T.A.; Kearey, P.; Brooks, M., Hill, I. An Introduction to Geophysical Exploration, 3rd ed.; Blackwell Science, Oxford, UK, 2002; pp. 366-366. [CrossRef]
  67. Shepherd, M. Oil Field Production Geology, AAPG Memoir 91; The American Association of Petroleum Geologists, Tulsa, USA, 2009; p. 350. [CrossRef]
  68. Gluyas, J.G.; Swarbrick, R.E. Petroleum Geoscience, 2nd ed.; Wiley-Blackwell, Hoboken, USA, 2001; p. 432. https://books.google.com.eg/books?id=8uMXEAAAQBAJ.
  69. Hyne, N.J. Nontechnical Guide to Petroleum Geology, Exploration, Drilling, and Production, 3rd Ed.; Penn Well Corporation: Tulsa, Oklahoma, USA, 2001; p. 724.
Disclaimer/Publisher’s Note: The statements, opinions and data contained in all publications are solely those of the individual author(s) and contributor(s) and not of MDPI and/or the editor(s). MDPI and/or the editor(s) disclaim responsibility for any injury to people or property resulting from any ideas, methods, instructions or products referred to in the content.
Copyright: This open access article is published under a Creative Commons CC BY 4.0 license, which permit the free download, distribution, and reuse, provided that the author and preprint are cited in any reuse.
Prerpints.org logo

Preprints.org is a free preprint server supported by MDPI in Basel, Switzerland.

Subscribe

© 2024 MDPI (Basel, Switzerland) unless otherwise stated