1. Introduction
Over the past decade, the rapid pace of technological evolution alongside digitalization has led to a tremendous shift in several sectors such as healthcare, education, and construction [
1,
2,
3]. Digitalization can be defined as the adoption of advanced information technologies to enable automated, efficient, and effective business practices [
4]. Evolving technologies such as artificial intelligence (AI), the “Internet of Things” (IoT), blockchain, and data analytics have facilitated the transition towards digitalization.
The construction and architectural industries are also sectors that have benefited from digitalization [
5]. The technological revolution allows architects to showcase distinctive architectural forms while achieving sustainability, reducing energy, water, and raw material consumption [
6], and providing a better use experience [
7]. As a result, many technologies and terms have emerged, such as Building Information Modelling (BIM), cloud computing, big data, smart cities, machine learning, artificial intelligence, block-chain technology, and industry 4.0, which are contributing towards digitalization of the AEC/FM industry. The latest technology added to this list is the “digital twin” (DT) which is gaining research and industry attention, for its claimed potential in managing construction as well as the operational phase of built assets.
A DT is essentially a digital model that conducts simulations and facilitates bi-directional information exchange with a tangible counterpart in the physical world (referred to as a physical twin). This linkage presents opportunities for decision-making centered around data. DTs find diverse applications within the asset management realm, particularly in architecture, engineering, and construction/facilities management (AEC/FM). For instance, a twin of a constructed asset can be designed to illustrate the functioning of its systems, establishing a corresponding data connection to capture operational data and mirror real-time information in the digital world. Despite the potential advantages, both the technology and the processes involved in creating digital twins, along with their potential applications, remain incompletely understood within academia and industries. This paper aims to analyze current trends in the use of DTs and in particular focus on DT applications in the asset management of built environment projects.
A systematic literature review of DT applications in the AEC/FM industry is provided. A bibliometric analysis of the retrieved articles highlights this area’s interest and research trends. In addition, we categorize articles into five different categories based on their focus areas, including DTs in general, creation of DTs, application of DTs for heritage restoration, DTs for asset management, and DTs for sustainability.
The rest of this paper is organized as follows.
Section 2 presents a background and overview of the DT concept. The methodology adopted in this review is described in
Section 3. The bibliometric analysis of the extracted studies is presented in
Section 4, and
Section 5 details our categorization of DT applications in the AEC/FM industry. In
Section 6, we discuss some open challenges hindering the implementation of DT in the AEC/FM industry. Finally, the paper concludes with a discussion of future research directions in
Section 7.
5. Categorization of the Included Articles
In this segment, the articles considered in the study are organized according to their respective focus areas. The 26 included articles are grouped into five categories, as illustrated in
Figure 15. The subsequent sections provide explanations for each category and highlight the contributions of the respective articles.
5.1. Digital Twin Technology
This section delves into the examination of articles focusing on the extraction of DT definitions, applications, and implementation challenges across various industries. The articles within this category center on concepts, characteristics, applications, and challenges related to DT technology.
Barricelli et al. [
26] scrutinized 75 articles to dissect existing DT definitions. They presented key DT characteristics and outlined diverse application domains in which the technology has been employed, categorizing them into manufacturing, aviation, and healthcare. The authors described two DT lifecycles, one involving the creation of a twin for a non-existing physical object and another where the object already exists but lacks a twin. The analysis revealed that the design process varies accordingly, simultaneously encompassing both the physical object and its twin or focusing on connecting the existing object to its twin. The study also brought attention to digital implementation issues, including ethical considerations, data security, privacy, deployment costs, governmental regulations, and technical limitations. While the healthcare, aviation, and manufacturing industries extensively explored DT applications, the need for further research in other sectors was emphasized.
Camposano et al. [
27] conducted a qualitative study examining the comprehension of DTs among Finnish AEC/FM practitioners. Through semi-structured interviews with 28 professionals in 2018 and 2019, the authors found that respondents, rather than grasping precise DT details, were more inclined to be familiar with the technology’s vision and implementation in organizations. DTs were distinguished from digital models, by the respondents, based on attributes such as dynamic time, virtual representation, higher dimensional abstraction, bidirectional data flow between the physical object and its twin, technological components, and high actor interdependency. The study concluded that AEC/FM practitioners lack a unanimous definition of DTs and often rely on simplistic metaphors, advocating for a cohesive understanding of the technology for better inter-organizational acceptance.
Delgado and Oyedele [
28] analyzed 54 articles to scrutinize structural and functional descriptions of DTs in the built environment. The authors identified three types of models: conceptual models, system architectures, and data models as part of the structural model, and process and communication models in the functional model. Conceptual models were further categorized into prototypical, model-based, interface-oriented, and service-based, while process models included DT creation, synchronization, asset monitoring, prognosis and simulations, optimal operations, and optimized designs. Notably, the study found that prognosis and simulation models were predominantly applicable to the AEC industry implementations.
Ozturk [
29] conducted a bibliometric review analyzing the applicability and challenges of DT in the AEC/FM industry. Based on the review of 151 articles, the author found that DT implementation in the AEC/FM industry is focused on five areas: 1) building lifecycle management; 2) virtual-based information utilization; 3) virtual–physical building integration; 4) information-based predictive management; and 5) information integrated production. Another bibliometric and systematic review was conducted by Agnusdei et al. to analyze existing DT applications supporting safety management [
30]. The authors found that integrated DT and safety management research is focused on six areas: 1) decision-making and offshore applications; 2) IoT and lifecycle approaches; 3) industry 4.0; 4) machine learning for DT and safety support; 5) safety engineering; and 6) hazards and risk management.
In summary, DT technology is promising for the AEC/FM industry, but there are several challenges, such as technical limitations, data ownership, etc, which still exist and should be addressed for wider implementation in real scenarios.
5.2. Digital Twin Creation
Digital twins refer to virtual representations of physical objects, processes, and systems with bidirectional data exchange capabilities between the physical entity and its digital replica. The first and foremost step in creating a twin using the discrete-event simulation technique is to identify the different elements involved in the physical system and their inter-relationships. The second step is to represent the physical system in a digital space, which involves representing the identified elements, production operations, and inter-relationships. The third step in creating a DT involves the interconnection and interaction between the physical system and its digital representation models. A data interaction technique should be implemented in this step that aggregates the middleware, a memory database, and a relational database to implement the physical–digital interaction [
31].
Jiang et al. [
31] implemented the discrete event simulation modeling technique to rapidly create a shop floor’s DT. However, the authors focused only on proactive simulations without considering predictive simulations. Khajavi et al. [
32] implemented a simulation approach to create a DT of an office building at the Aalto University in Finland. This was accomplished by collecting and analyzing 25,000 sensor readings. The data were collected using a wireless sensor network installed on the building’s façade. The experiments revealed that most of the technical DT creation issues were related to data collection through sensors due to frequent discharging of the sensors’ batteries, disruption of data transmission channels, and the number and positioning of the sensors.
Furthermore, a DT can be created using either a data-based or system-based DT [
33]. In the data-based approach, the data from the physical system is structured according to criteria such as functionality, enabling users to quickly gain an overview of the system’s performance. The data-based method can be efficient if the users are only exposed to the data and not the physical system’s technical information. By contrast, a system-based approach creates and combines several virtual models of the physical system to obtain a nearly exact representation of reality. System-based creation can provide more comprehensive insight into the physical system’s performance than a data-based system. However, creating a system-based DT requires full knowledge of the technical details of the system and the components involved. To enhance the predictive performance based on data-based models and improve the efficiency of the current performance analysis, a hybrid data- and system-based model was recommended [
33].
Lu et al. [
15,
16,
17] introduced a framework for generating DTs at both the building and city levels, with a particular focus on the operational and maintenance phases within the building development lifecycle. To illustrate the viability of the proposed framework, the authors applied it to create a DT for the West Cambridge site at the University of Cambridge in the UK. The implemented scenario seamlessly integrated diverse data sources, demonstrating effective and efficient data query, analysis, and decision-making during the operation and maintenance phase. Additionally, the authors underscored the practical challenges encountered in DT creation, including issues related to heterogeneous data sources, automated integration of data from these sources, data synchronization, and ensuring data quality.
However, simply creating a building DT does not benefit or create value for the AEC/FM industry. It is crucial to understand how to use the developed DT to create value. The benefits of DT and the costs and risks involved should be determined through the benefits management process [36]. This process involves identifying and structuring benefits, planning benefits realization, executing the benefits realization plan, evaluating and reviewing results, and discovering the potential of future benefits. Based on an empirical study of nine projects, Love and Matthews [36] proposed a business dependency network to analyze the post-creation benefits of a DT.
In summary, a simulation-based approach is suitable for creating a DT [
31]. An integrated data- and system-based model should be considered to enhance the simulated virtual model’s reactive, proactive, and predictive performance [
33]. However, attention is required while collecting sensor data for virtual model creation because most errors are introduced at this stage [
32]. The current state of DTs in the AEC/FM industry is mainly focused on how to create a DT [36]. More studies focusing on how to realize the benefits of a DT after its creation are required.
5.3. Digital Twins for Heritage Restoration
Heritage monuments and buildings are valuable assets that convey a historical legacy to later generations. These buildings degrade over time, and restoring them is crucial to preserve their aesthetic value and fulfill their original purpose [37]. The documentation of heritage buildings is the most crucial process during restoration because a lack of documents can lead to inefficient project management, high maintenance costs, and lost time [38]. Documentation for heritage buildings often involves a heterogeneous range of qualitative and quantitative data gathered and analyzed by different stakeholders in isolation. A lack of communication and coordination among stakeholders can lead to duplicated efforts and incomplete documentation [39]. Recent technological advances can address data fragmentation issues and the lack of governability in heritage buildings’ documentation and restoration processes.
After examining various documentation aspects associated with the restoration of heritage buildings, data can be classified into four distinct types: 1) archaeological/historical data, which pertains to the historical context of the building; 2) geometry data, which relates to the building's shape and distinctive features; 3) pathology data, concerning the decay or damage to the building; and 4) performance data, encompassing the building's performance metrics in areas such as energy efficiency, thermal characteristics, comfort, safety, and security [39]. In this context, historic building information modeling (HBIM) can aid in the integration and management of graphical and textual data from multiple sources without manual intervention and facilitate communication and coordination between stakeholders. Moreover, DTs enable modeling interrelationships between sensor-collected data and the historic building site, mitigating threats related to the initial design, occupancy, and spatial configuration [40]. An integrated HBIM-DT approach enables the creation of a preventive restoration mechanism for heritage buildings. HBIM models with real-time IoT data and DT technology enhance the relationship between the physical on-site building and the digital model, allowing the non-specialist stakeholder to contribute to the decision-making process [40].
To summarize, DT technology has shown promising potential for heritage building restoration and damage prediction. However, the digitalization of heritage restorations using DTs requires a deep understanding of the heritage site, and the structuring of this information in digital data models is a complex process [41].
5.4. Digital Twin for Asset Management
The publications within this category primarily center around the implementation of DTs for effective asset management throughout the entire lifecycle of an asset. Decision-making related to assets holds significant importance in asset management [42], emphasizing the necessity for well-informed decision-making facilitated by proficient data and information management [42].
The integration of digitization into asset management proves beneficial. For example, the utilization of sensors aids in data collection, while advanced digital controls contribute to minimizing unplanned downtime through cost-effective management of assets. Illustrating the imperative role of decision support in asset lifecycle management and showcasing the potential of DTs in this context, Marco et al. [43] explored the significance of DTs in asset management, particularly emphasizing their role in the decision-making process related to assets in a conceptual article. This decision-making process involves four principles and two aspects.
Principles:
Emphasis on the lifecycle (decisions should align with long-term objectives).
Focus on the system (consideration of the decision's impact on the entire system, not just individual components).
Prioritization of risk (implementation of decision-making followed by risk management strategies).
Centricity on assets (emphasis on data and information pertaining to assets).
Considerations within the decision-making process (the subsequent factors should be taken into account when making decisions related to assets) encompass:
Asset lifecycle: the enduring impact of the decision on the asset.
Asset hierarchical control level: the level at which the decision is made (strategic/tactical/operative), ensuring alignment with other levels.
The decision-making process necessitates effective data/information management [43]. Currently, there is not a complete integration of data/information management with the lifecycle management of assets, but this gap can be addressed through the implementation of DTs. Macchi et.al, [44] have emphasized the significance of DTs in asset-related decision-making by examining use cases derived from the authors’ past projects. These use cases are categorized based on their asset control levels (i.e., strategic, tactical, and operational) and asset lifecycle phases (i.e., beginning of life, middle of life, and end of life). The data obtained from a DT can be utilized for tasks such as asset configuration, reconfiguration, planning, commissioning, condition monitoring, and health assessment [44].
James and Ajith [45] detailed the creation and construction of DTs through a BIM-based methodology, devising an Asset Information Model (AIM) conducive to DT generation. The AIM encapsulates the necessary data and information linking assets to a level essential for the optimal operation of an asset management system. The authors illustrated this concept through a case study conducted on the West Cambridge campus. The process of developing the AIM to facilitate DT creation involved the following steps:
Categorization of assets (according to their functions, such as heating, ventilation, power, and lighting) within a BIM model. Document the classification system through Unified Modeling Language (UML) diagrams.
Creation of an AIM relational database based on UML diagrams depicting the established classification system.
Integration of BIM models with the database within a unified model (commonly referred to as a federated model).
The considered case study in [45] consists of four BIM models representing four individual buildings on the West Cambridge campus. Three of the buildings were fully constructed, and one was under construction. A point cloud dataset was obtained using a Light Detecting and Ranging (LiDAR) scanner mounted on a car, and the utilities such as water, sewer, power, and communications were modeled as 3D geometry. In the first step in developing the AIM, the assets of two BIM models (i.e., two buildings) were classified, consisting of 6881 assets. In the second step, 41 UML diagrams and 149 relational database tables were created. The third step federates the 3D geometry, BIM models, and point cloud LiDAR data. The classified assets within the BIM models were then exported to the AIM, and the AIM relational database and federated 3D model were linked. In total, 6881 assets and associated data were exported from the BIM models.
Dolgov et al. [46] discussed the challenges and aspects of developing DTs for production system management. The DT consisted of an information model and an evaluation system. The information model was based on the collected data for management and consisted of three blocks: 1) initial data, which is conditionally constant; 2) a production schedule, which changes periodically; and 3) status and statistics, which change constantly. After data collection within the information model, the enterprise (production system) was simulated using the collected data. The simulation permitted the assessment and management of production capacity in different scenarios, the justification of necessary equipment or composition, the validation of a plan or schedule, and the development of recommendations for increasing the efficiency of the enterprise.
Lu et al. [47] analyzed literature and industry-defined standards influencing BIM and asset management during the operation and maintenance phase. The authors proposed a DT-enabled framework for intelligent asset management, comprising three layers: 1) smart assets, representing the digital counterparts of physical systems; 2) smart asset integration, concentrating on the incorporation of asset data and big data analytics technology; and 3) smart DT-enabled asset management, illustrating the interaction between human operators and the DT. DT-based asset management facilitates the creation of dynamic digital models that autonomously learn and update the status of their physical counterparts. However, the study did not delve into the interaction between smart assets and various stakeholders involved in the asset management process. Bolshakov et al. [48] outlined approaches for organizing the lifecycle management of technical systems, assets, and infrastructures using DTs. Furthermore, they underscored the necessity for formal definitions and standardization to implement DTs effectively in practice.
To summarize, DTs can enable interconnections between data and asset management to enable efficient asset-related decision-making [44]. In addition, AI-based decision-making improves the intelligence and integration of the overall asset management system [47]. Effective and efficient DT-based communication and cooperation enable a close connection between the stakeholders and the asset management process [47]. However, the deployment of DTs for asset management is still hindered by a lack of definition and formalization of the information required to create and update the asset management model [48].
5.5. Digital Twin for Asset Management
The articles in this category concentrate on the application of DTs for assessing the sustainability of structures. Kaewunruen and Xu [49] scrutinized the design, construction, and maintenance processes of a railway station in London, utilizing BIM and a DT to guide construction participants in environmentally conscious planning, design, and project operation. The authors converted the 3D model of the structure into a 6D BIM model, encompassing time and cost schedules along with carbon emission calculations. They demonstrated the utility of BIM in predicting the sustainability of the structure during emergency situations. Additionally, the authors simulated three building renovation options using a DT in the event of a fire emergency to assess the most cost-efficient and environmentally friendly option. However, it is important to note that the implemented models in the study may not guarantee optimal accuracy due to a lack of design data for the considered building and its surrounding area.
Kaewunruen et al. [50] introduced a DT-enabled lifecycle assessment for evaluating the sustainability and vulnerability of a subway station in China. The authors utilized a DT to benchmark estimated costs and carbon emissions at each stage of the project lifecycle. Simulation results indicated that the construction stage incurs the highest cost, while carbon emissions costs are highest during the operation and maintenance phases. The authors also assessed different materials and simulated various renovation options to evaluate their cost and carbon emissions efficiency. However, it's worth noting that the proposed model was static and not self-re-updatable, which may prove ineffective in managing dynamic risks throughout the project lifecycle.
Tagliabue et al. [51] proposed a framework to transition from manual static sustainability assessments to a DT and IoT-enabled approach. The effectiveness of the proposed framework was demonstrated in a real-world scenario involving an educational building at the University of Brescia. The authors showcased how the DT enhances decision-making related to sustainability. Oroz-co-Messana et al. [52] concentrated on devising a method for creating a resource-efficient DT model of a neighborhood to conduct lifecycle analysis and sustainability assessments.
Francisco et al. [53] utilized data from smart meters to establish daily energy benchmarks for buildings, categorized by specific periods such as occupied and unoccupied periods during the school year, occupied and unoccupied periods during the summer, and the peak summer period. Simulation results revealed that energy scores for each building, when analyzed periodically, were significantly different from scores during the overall period. The authors recommended incorporating these periodically segregated efficiency metrics into DT-enabled energy management platforms.
Wang et al. [54] proposed a DT-based framework for a green building maintenance system. The proposed framework enables the stakeholders involved in the operation phase to solve the problem of insufficient information and automated management of green building maintenance. The feasibility of the proposed framework was verified by developing a prototype based on Bentley Systems software. The simulation results revealed that the framework could reflect green buildings’ accurate and real-time status and improve green building maintenance efficiency using automated management. However, the proposed framework involves complex cross-application communication without considering heterogeneity among different data islands. Jakobi et al. [55] demonstrated the application of a BIM use case to minimize the performance gap that arises from inconsistencies between individual planning phases in a project’s lifecycle. However, the authors evaluated the proposed model theoretically without performing an empirical analysis.
To summarize, the applicability of DTs for sustainability can lead to inconsistent and inaccurate models due to a lack of standard protocols. Moreover, under existing copyright law, it is challenging to preserve the privacy of critical and sensitive data [49]. In addition, DTs can optimize construction efficiency, cost, carbon emission, and buildability to improve building resilience and sustainability [50]. To further improve the energy efficiency of buildings, it is advisable to integrate temporally segmented daily energy metrics into a digital twin [53].
7. Conclusions
The concept of DTs in the AEC/FM industry represents a relatively new area of investigation. While practical applications of DTs are prevalent in the aviation and manufacturing sectors, examples within the AEC/FM industry are limited. This study identifies literature reviews and a few proofs-of-concept for DT implementation in the AEC/FM industry, particularly in the early stages of researching how DTs can be applied in asset management.
Furthermore, this systematic literature review highlights potential applications of DTs targeting the asset management domain within AEC/FM, offering a comprehensive discussion. The identified areas encompass asset management throughout the lifecycles of existing facilities and infrastructures, evaluation and retrofitting of existing facilities for sustainability, and the restoration and efficient management of heritage buildings.
To further explore the true potential of DTs in the asset management domain, future research endeavors should focus on presenting practical frameworks, techniques, methodologies, and case studies from real-life projects. Such efforts would enhance understanding of the AEC/FM industry and pave the way for additional research and technological developments, ultimately revolutionizing the asset/facility management domain.
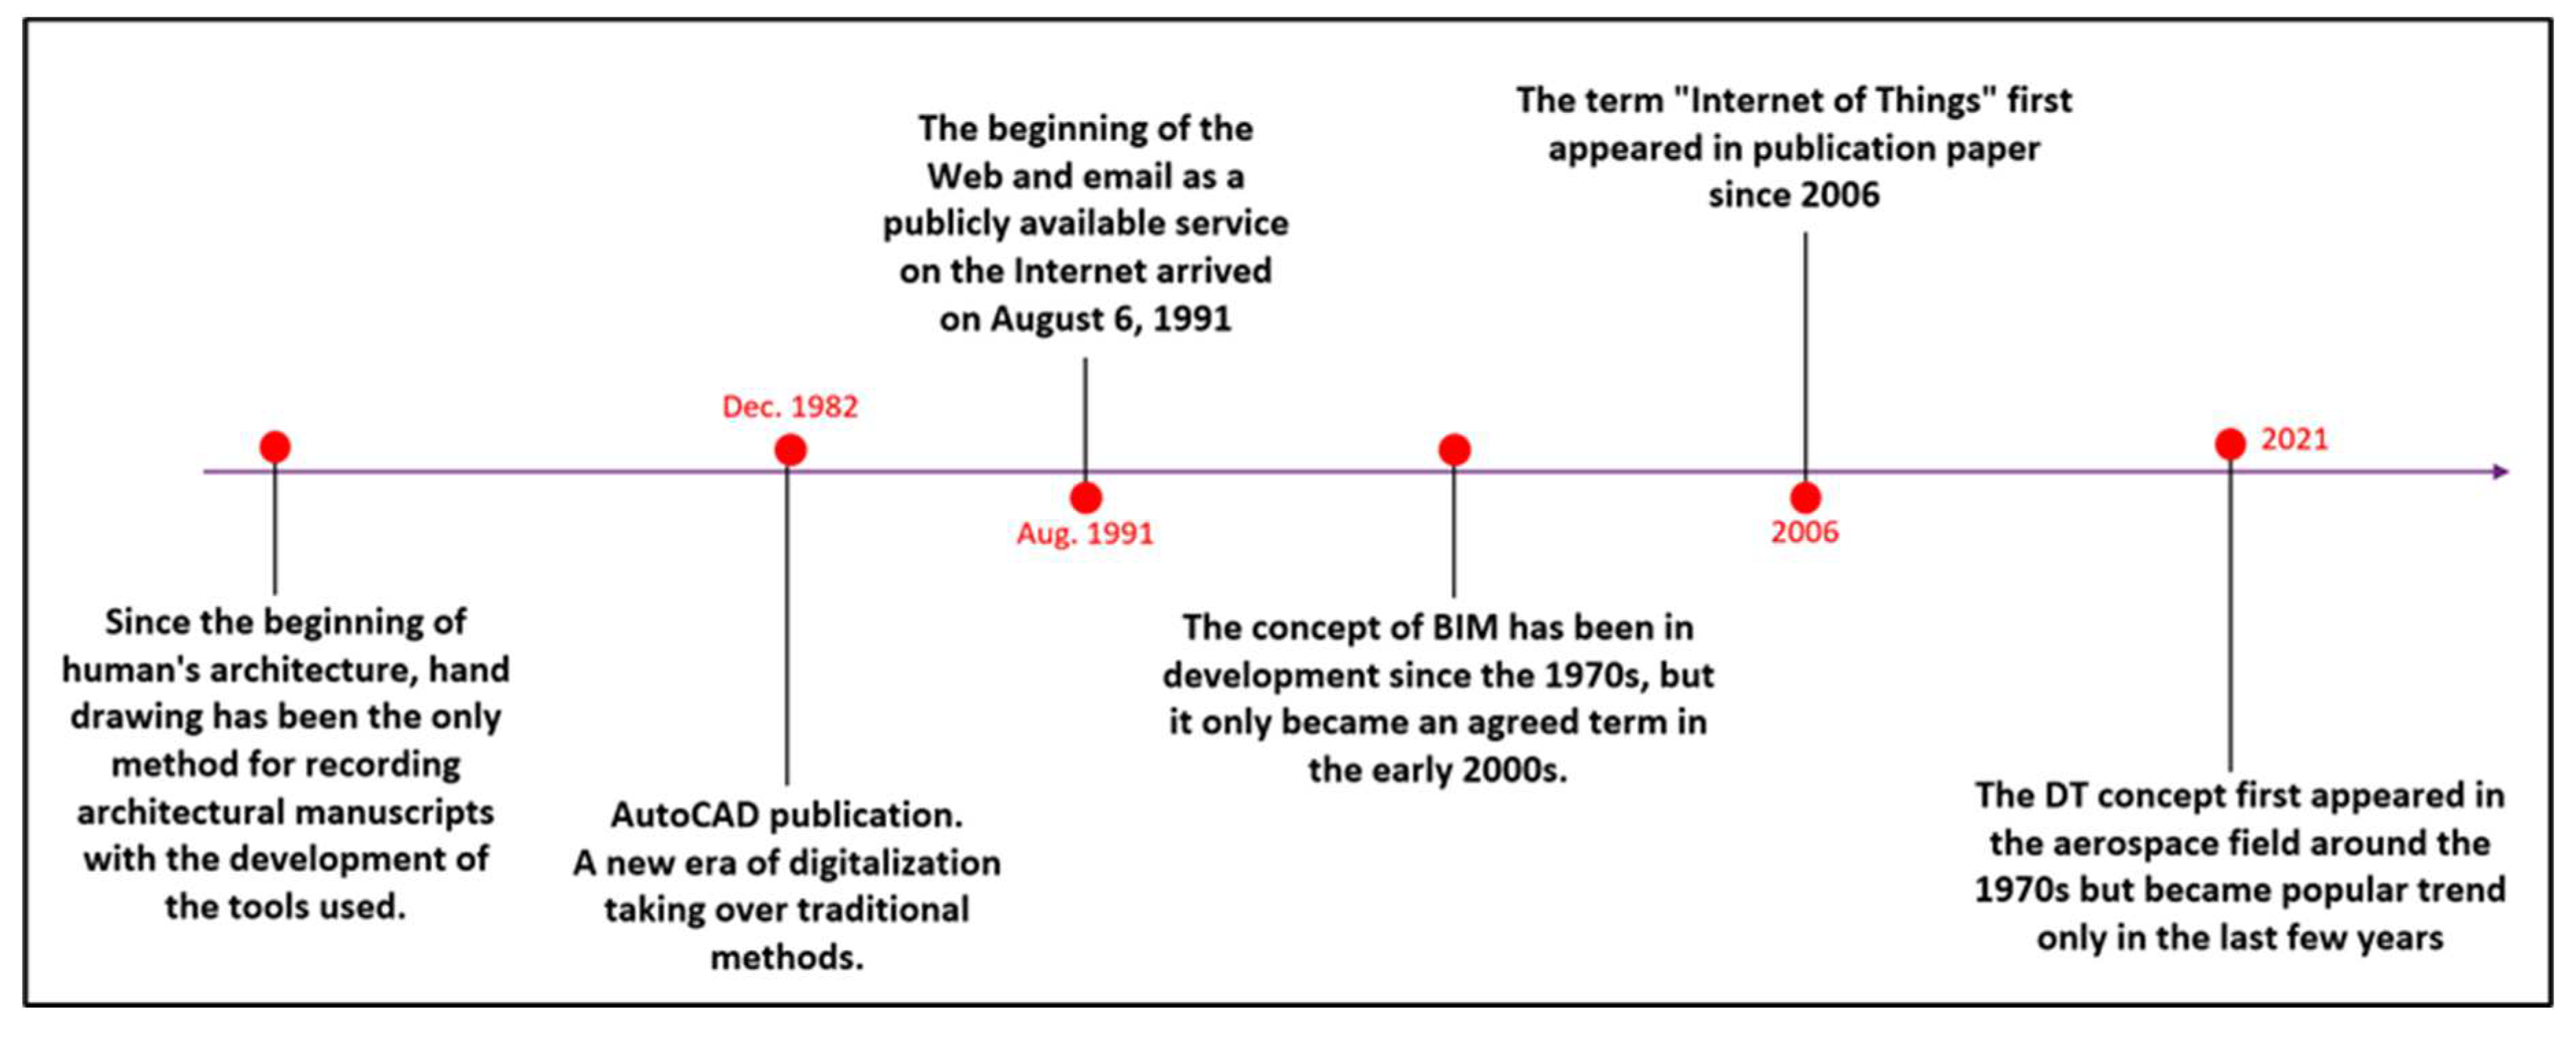
Figure 1.
Evolution of digital twins.
Figure 1.
Evolution of digital twins.
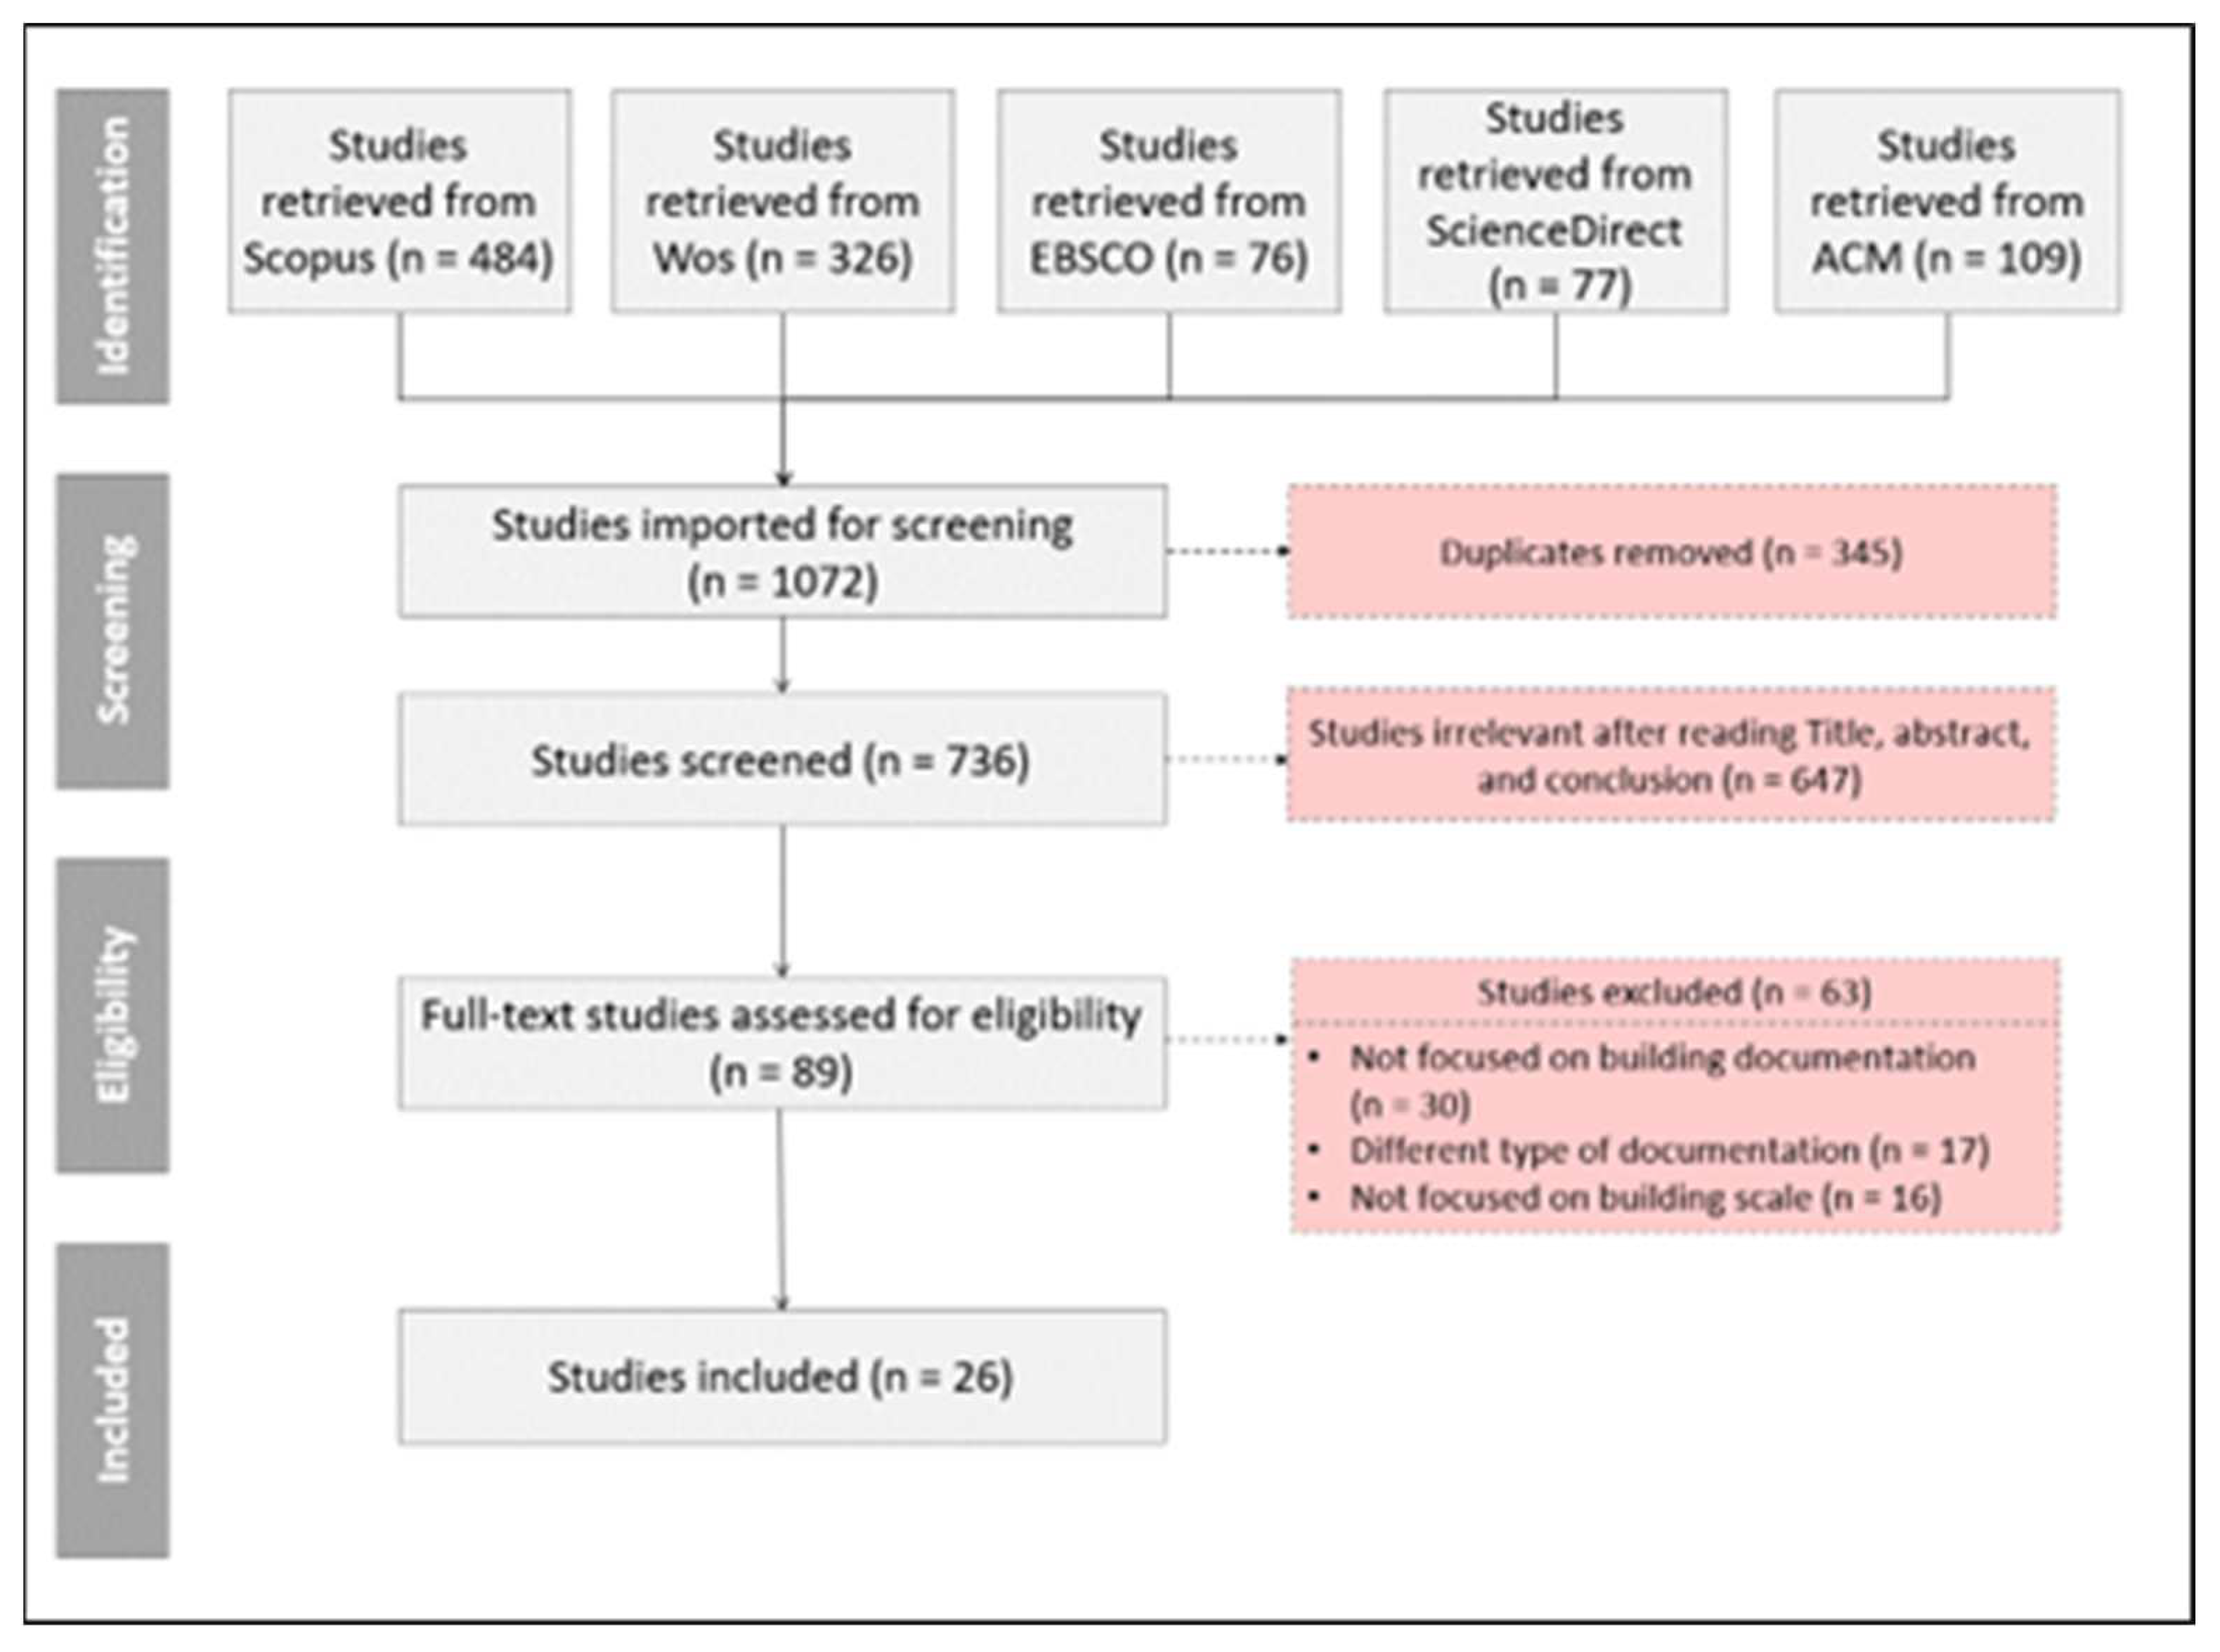
Figure 2.
The methodology employed in this systematic review.
Figure 2.
The methodology employed in this systematic review.
Figure 4.
Google web search trend for the current study keywords.
Figure 4.
Google web search trend for the current study keywords.
Figure 5.
Google image search trend for the current study keywords.
Figure 5.
Google image search trend for the current study keywords.
Figure 6.
Google news search trend for the current study keywords.
Figure 6.
Google news search trend for the current study keywords.
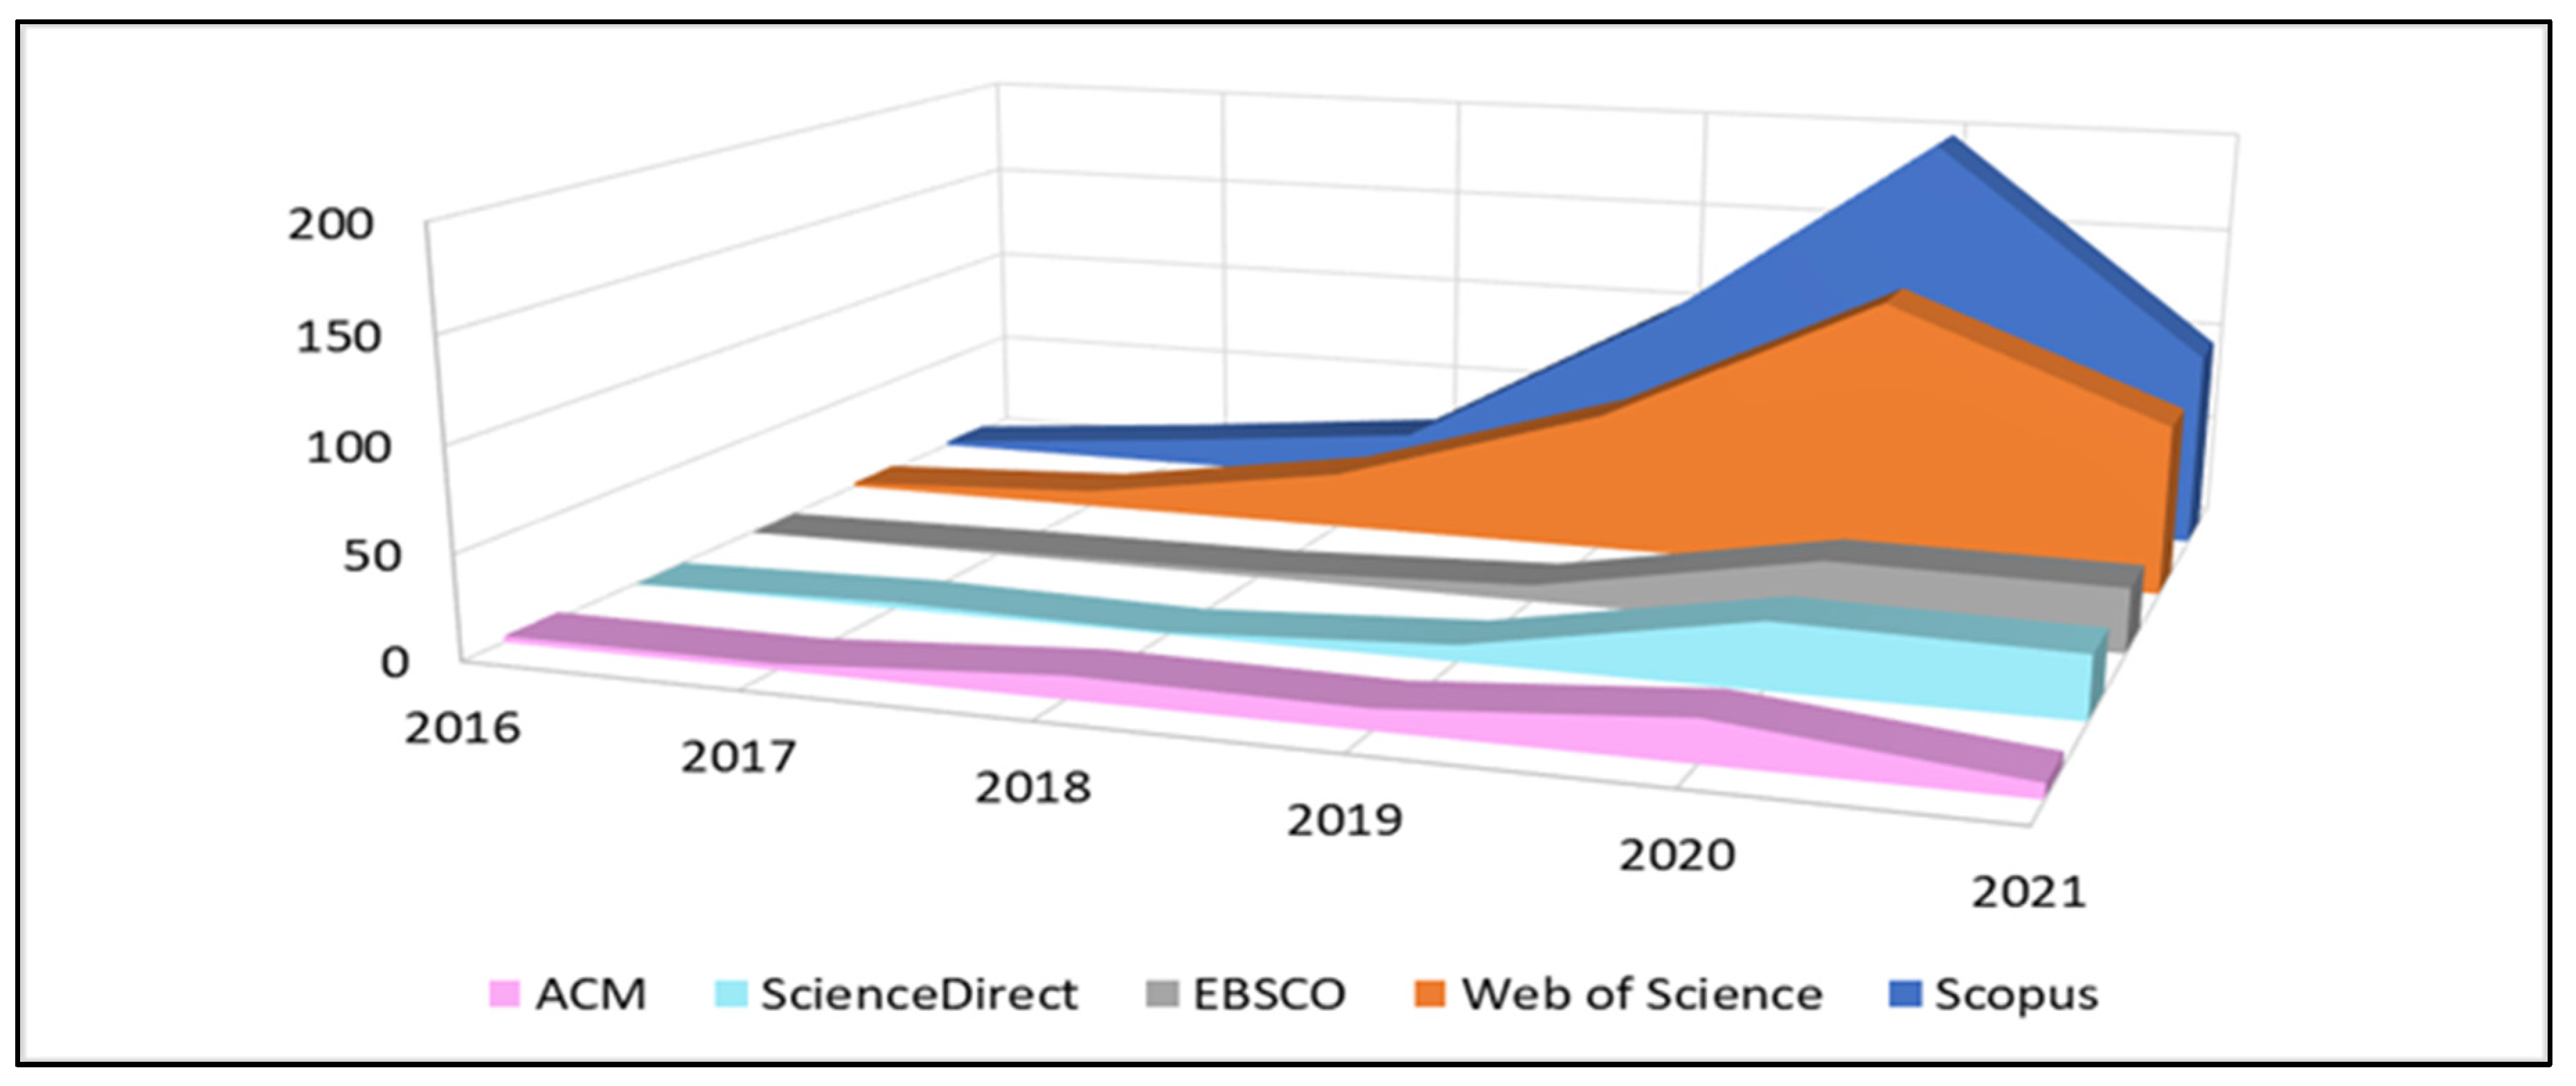
Figure 7.
Yearly distribution of the retrieved articles from the considered databases.
Figure 7.
Yearly distribution of the retrieved articles from the considered databases.
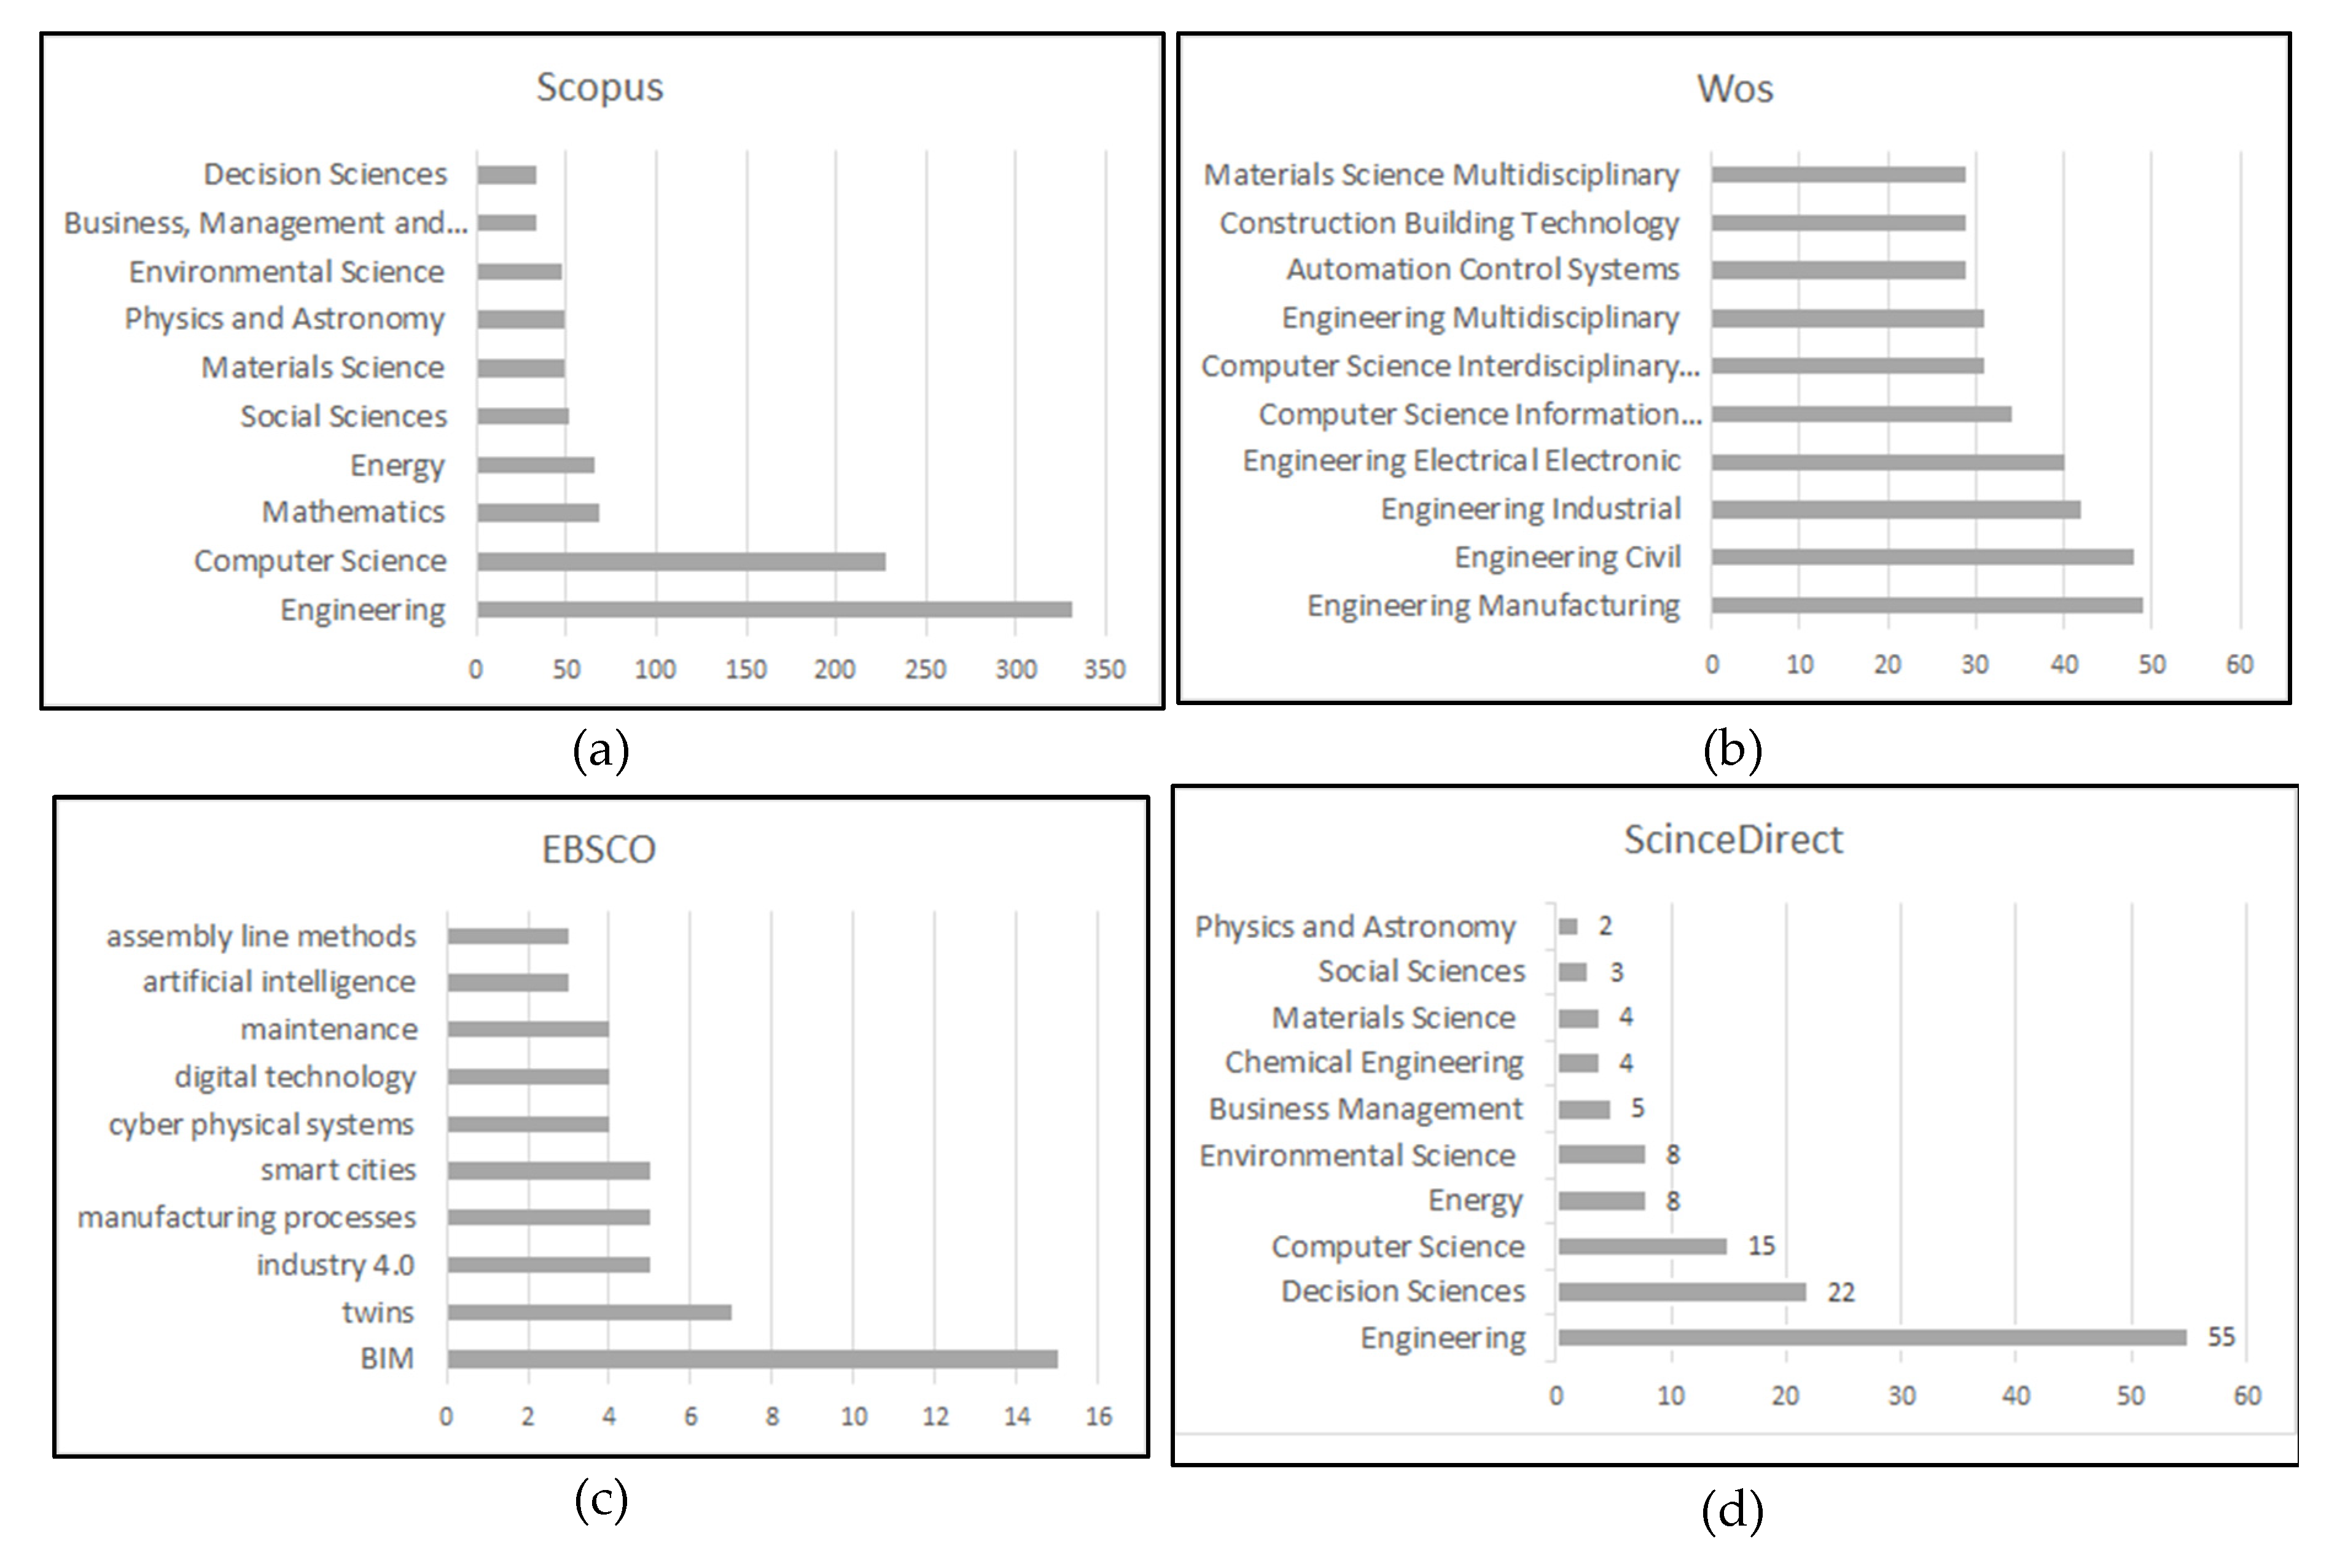
Figure 8.
Articles categorization: (a) Scopus, (b)Web of Science, (c) EBSCO, and (d) ScienceDirect.
Figure 8.
Articles categorization: (a) Scopus, (b)Web of Science, (c) EBSCO, and (d) ScienceDirect.
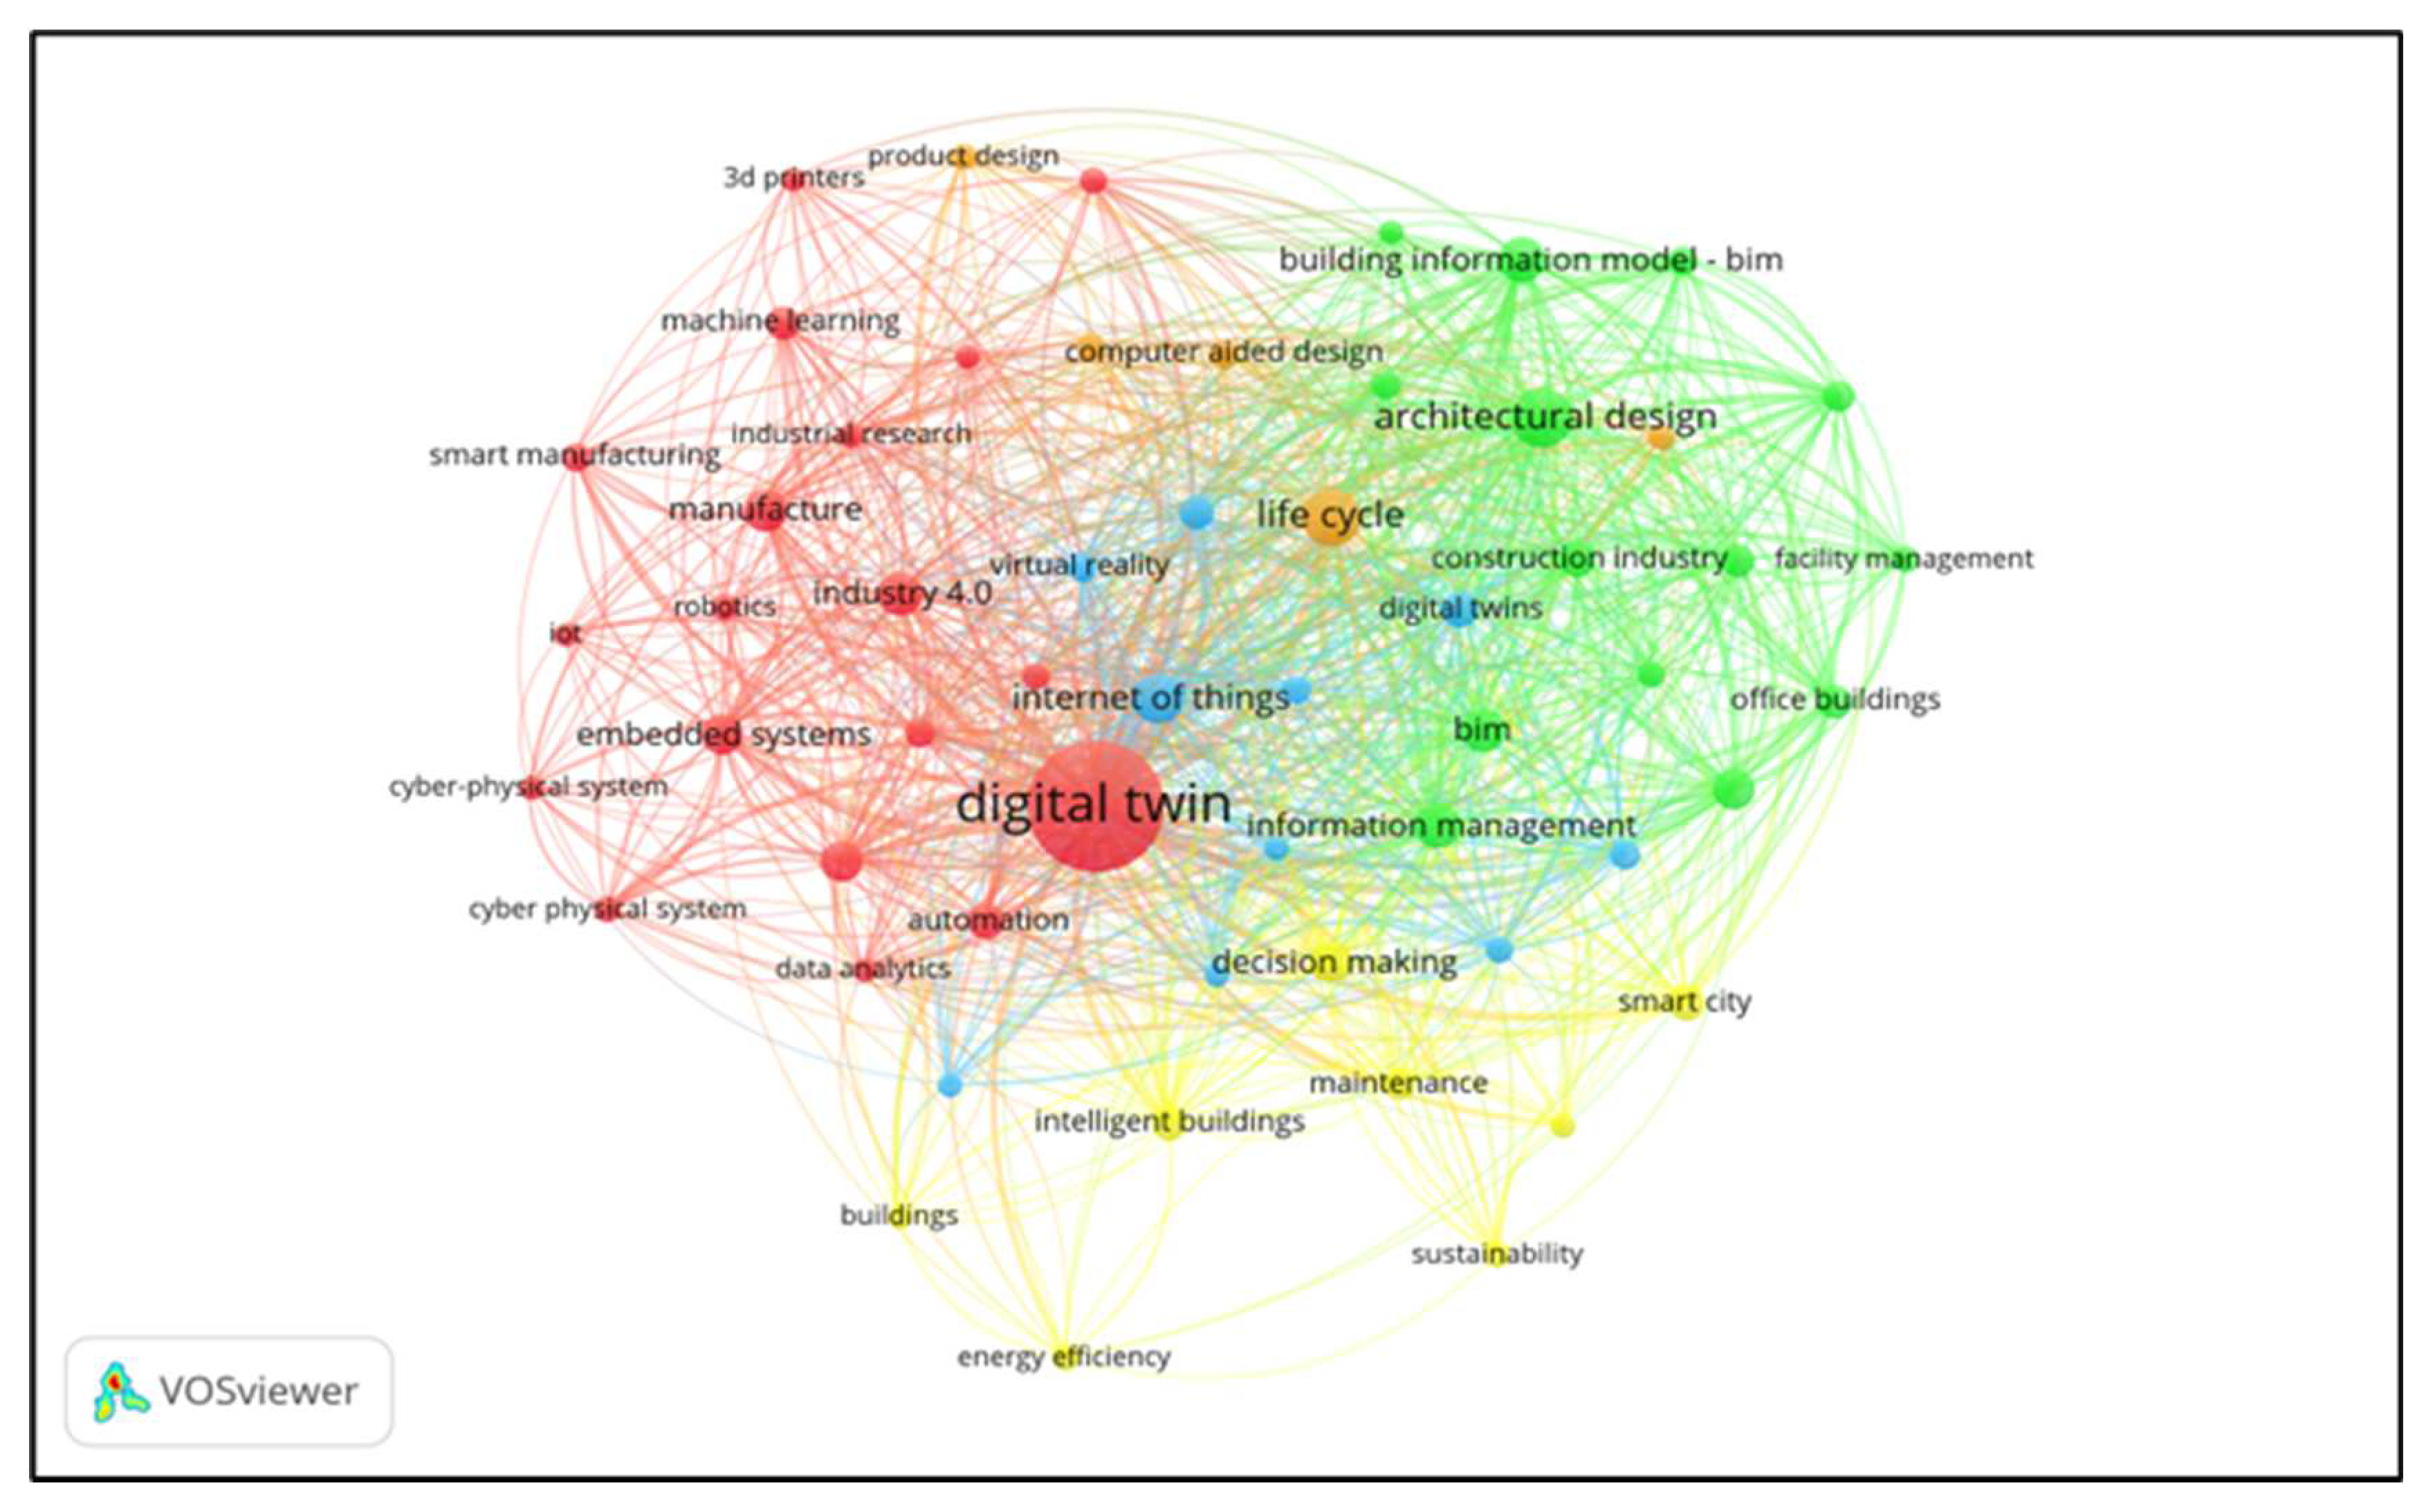
Figure 9.
Scopus keywords mapping.
Figure 9.
Scopus keywords mapping.
Figure 10.
Web of Science keywords mapping.
Figure 10.
Web of Science keywords mapping.
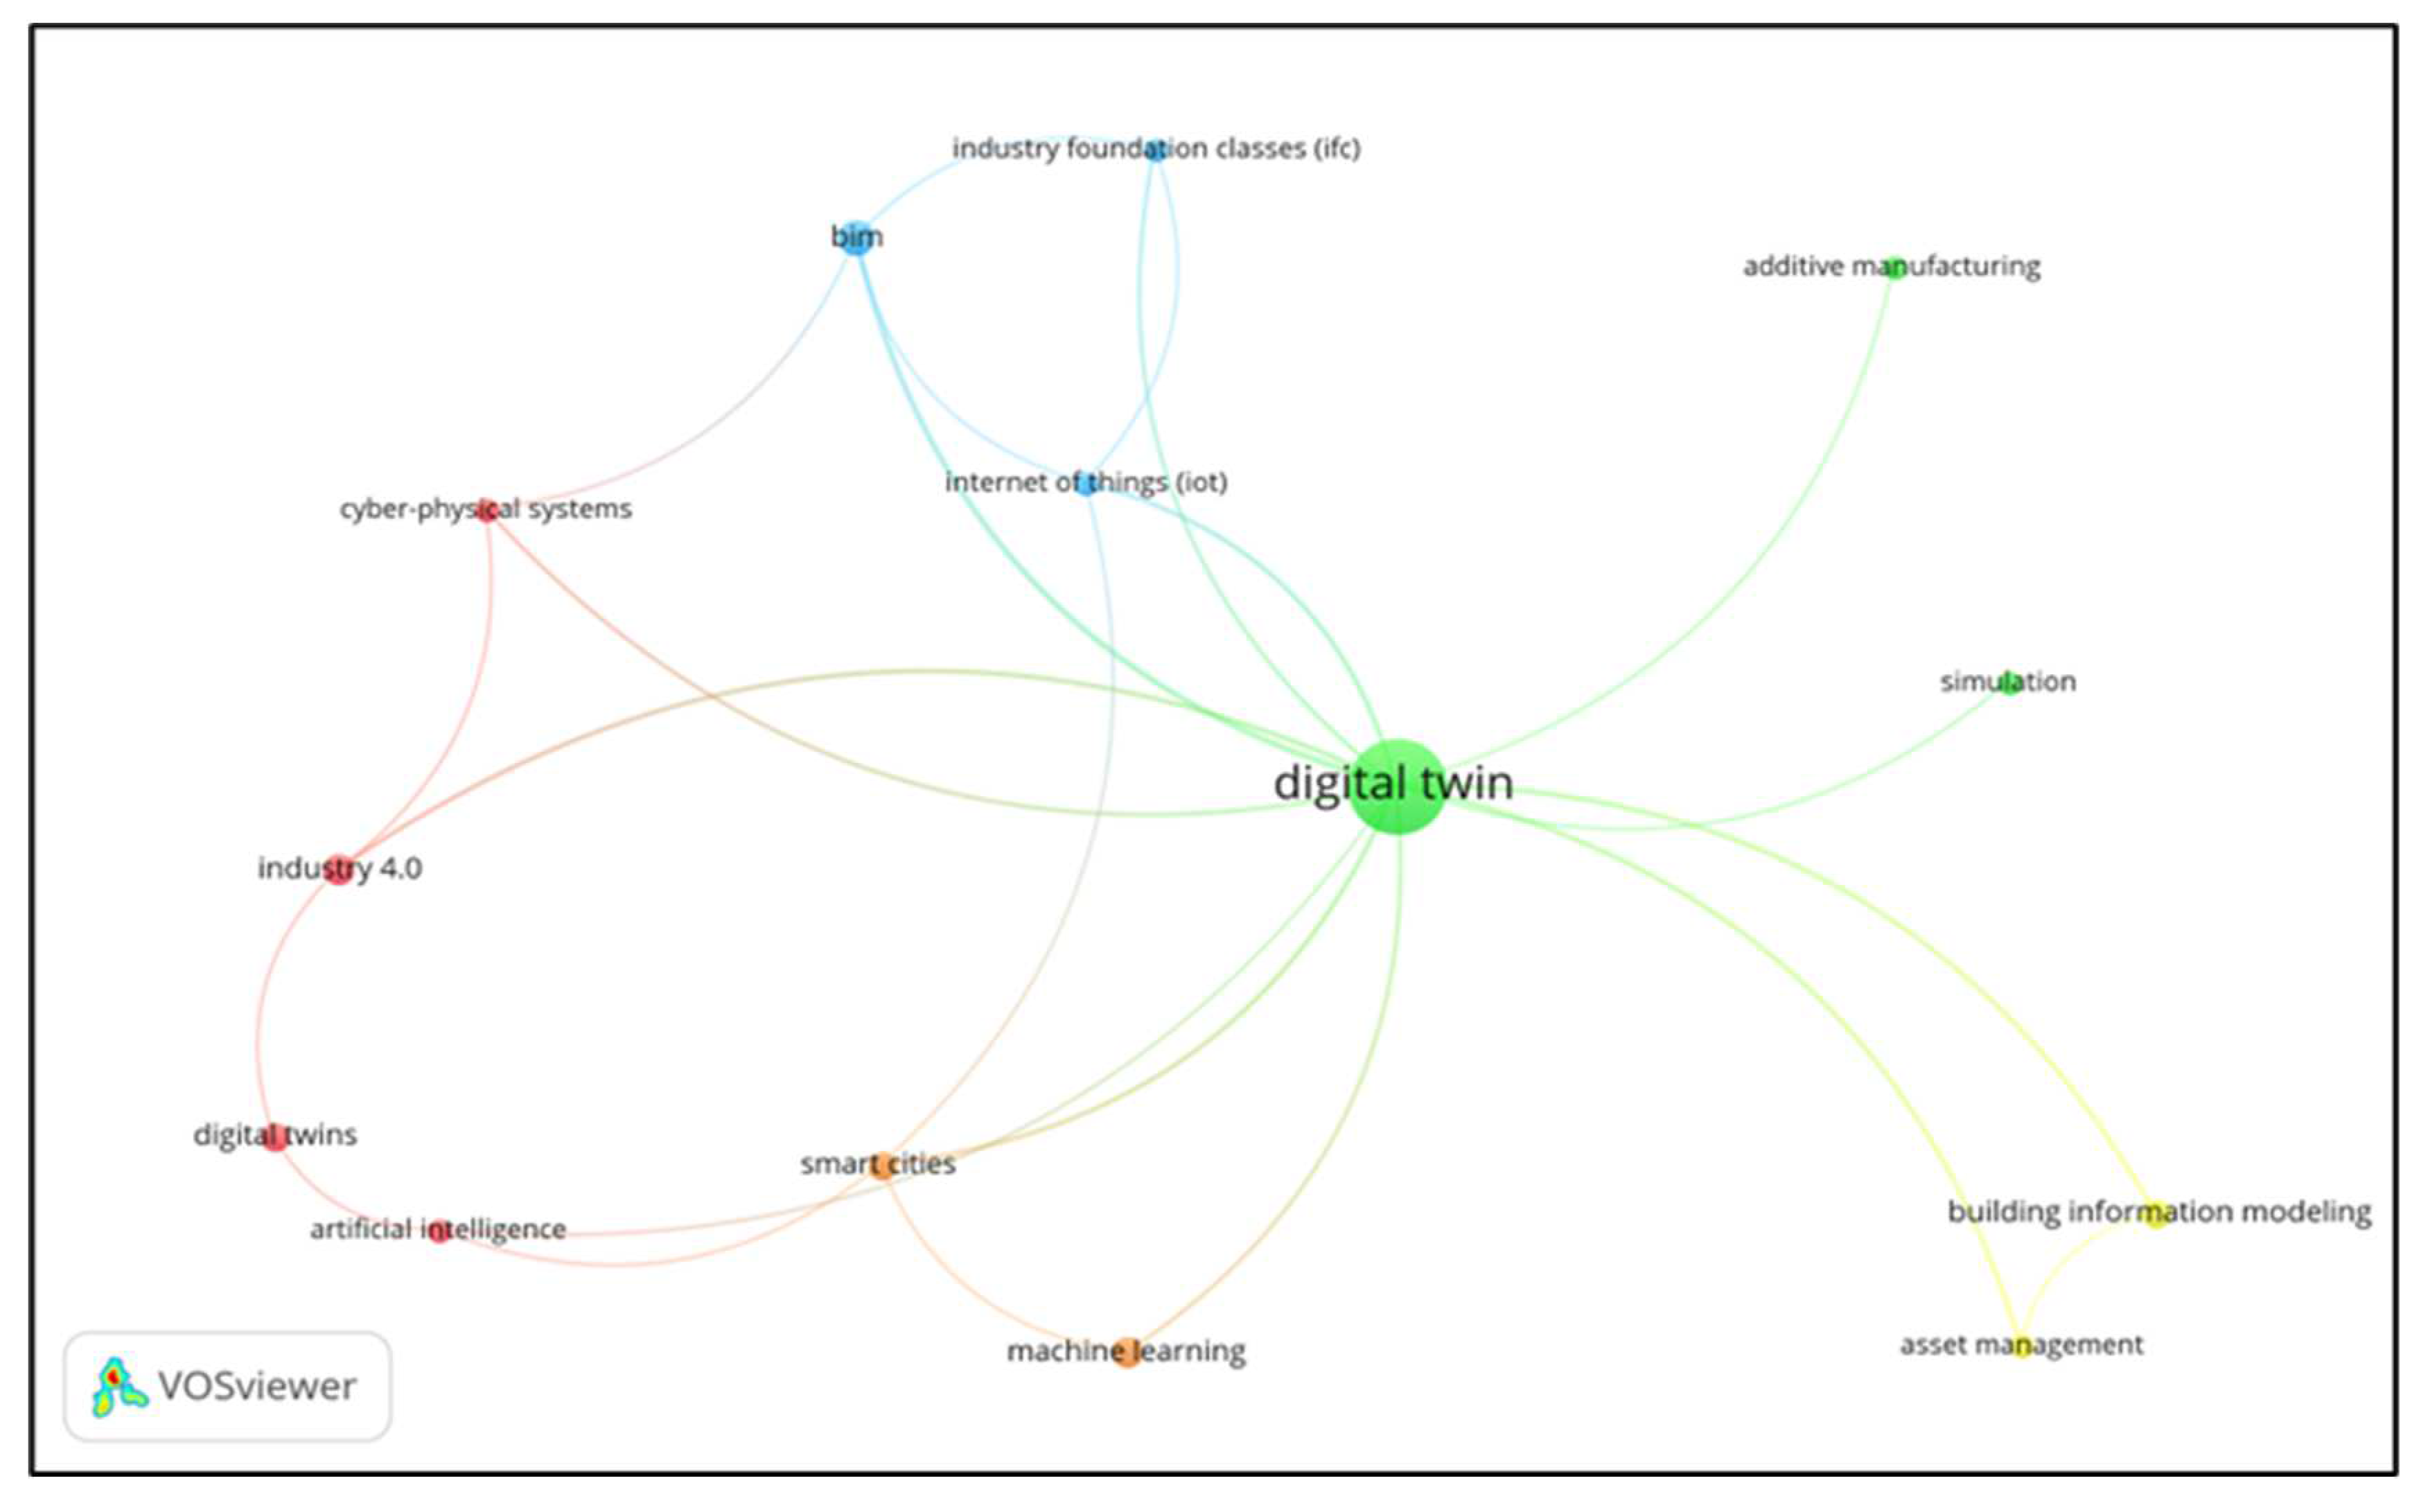
Figure 11.
ScienceDirect keywords mapping.
Figure 11.
ScienceDirect keywords mapping.
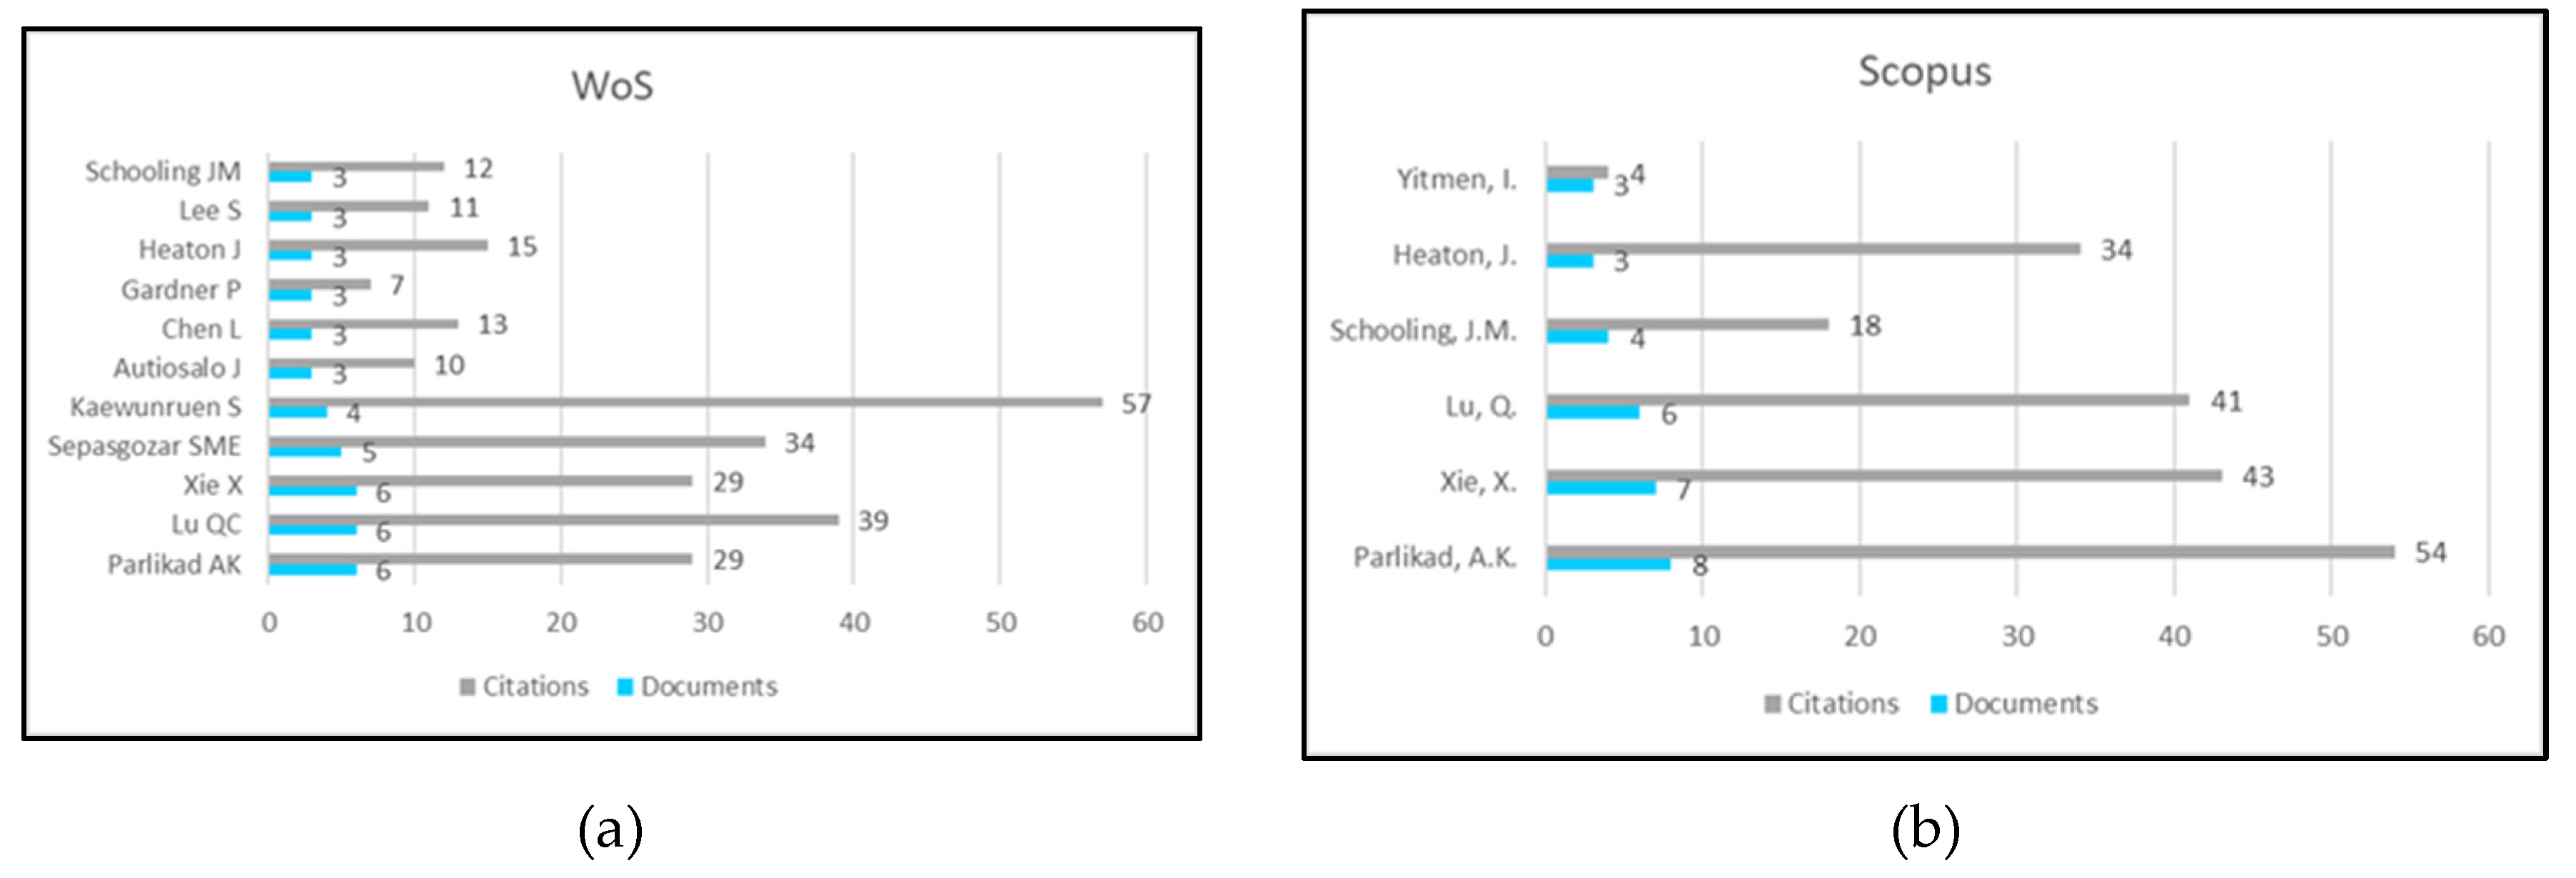
Figure 12.
Authors – citations analysis: (a) Web of Science and (b) Scopus.
Figure 12.
Authors – citations analysis: (a) Web of Science and (b) Scopus.
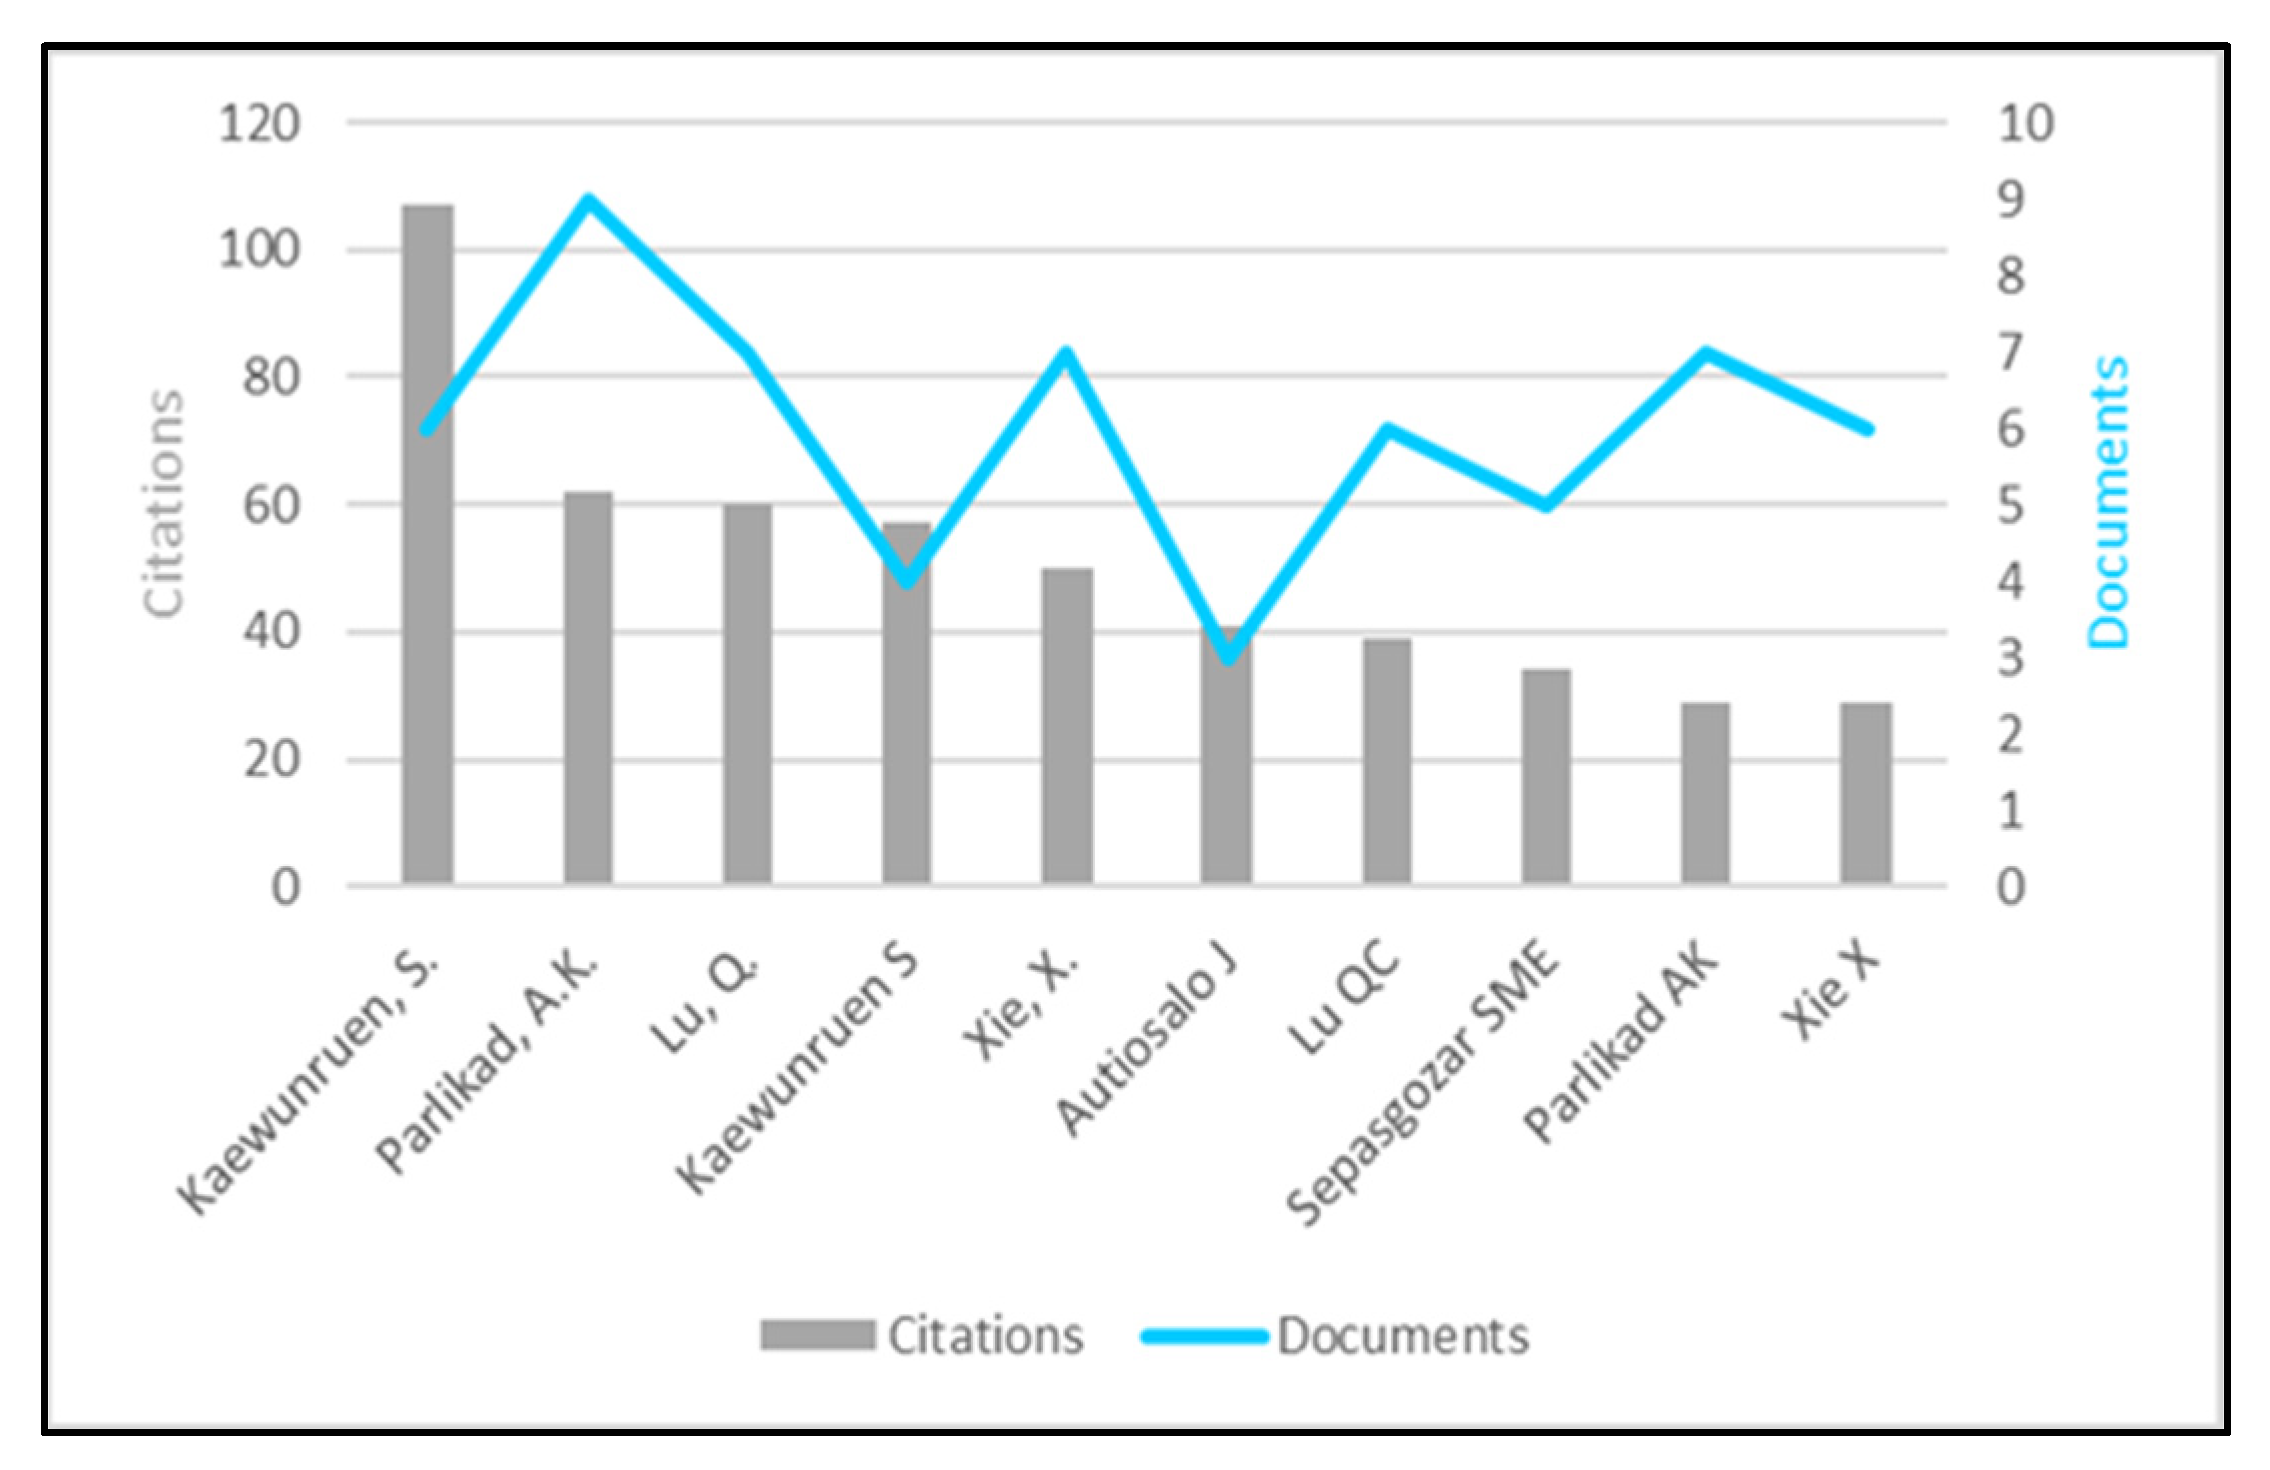
Figure 13.
Top contributing authors based on citations.
Figure 13.
Top contributing authors based on citations.
Figure 14.
Country of origin analysis: (a) Web of Science and (b) Scopus.
Figure 14.
Country of origin analysis: (a) Web of Science and (b) Scopus.
Figure 15.
Categorization of the included articles in the systematic review.
Figure 15.
Categorization of the included articles in the systematic review.
Table 1.
Search string and numbers of retrieved articles for the considered databases.
Table 1.
Search string and numbers of retrieved articles for the considered databases.
| Database |
Search string |
Results |
| Scopus |
TITLE-ABS-KEY (“Digital twin” AND building)
TITLE-ABS-KEY (“Digital twin” AND “asset management”) |
484 |
| WoS |
((TI=(“digital twin” AND (building OR “asset management”))) OR AB=(“digital twin” AND (building OR “asset management”))) OR AK=(“digital twin” AND (building OR “asset management”)) |
326 |
| EBSCO |
KW (“digital twin” AND building) OR KW (“digital twin” AND “asset”) OR TI (“digital twin” AND building) OR TI ( “digital twin” AND “asset”) OR AB (“digital twin” AND building) OR AB (“digital twin” AND “asset”) |
76 |
| ScienceDirect |
Title, abstract, keywords: “digital twin” AND (building OR “asset management”) |
77 |
| ACM |
[[Publication Title: “digital twin”] AND [[Publication Title: building] OR [Publication Title: “asset management”]]] OR [[Abstract: “digital twin”] AND [[Abstract: building] OR [Abstract: “asset management”]]] OR [[Keywords: “digital twin”] AND [[Keywords: building] OR [Keywords: “asset management”]]] |
109 |
Table 2.
Types of retrieved documents.
Table 2.
Types of retrieved documents.
| Document type |
Databases |
| WoS |
Scopus |
EBSCO |
ACM |
ScienceDirect |
| Journal articles |
192 |
208 |
55 |
1 |
68 |
| Proceedings papers |
111 |
249 |
0 |
102 |
0 |
| Review articles |
18 |
19 |
0 |
0 |
0 |
| Early access |
9 |
0 |
0 |
0 |
0 |
| Book chapters |
3 |
21 |
10 |
0 |
7 |
| Editorial materials |
2 |
3 |
0 |
0 |
1 |
| News items |
2 |
0 |
0 |
2 |
0 |
| Notes |
1 |
2 |
0 |
0 |
0 |
| Books |
0 |
2 |
0 |
0 |
0 |
| Trade publications |
0 |
0 |
5 |
0 |
0 |
| Magazine articles |
0 |
0 |
3 |
4 |
0 |
Table 3.
Keyword co-occurrence analysis.
Table 3.
Keyword co-occurrence analysis.
| Assessment |
Consideration |
Scopus results |
WoS results |
ScienceDirect |
| Type of analysis |
Co-authorship |
|
|
|
| Counting method |
Full counting |
3534 |
1439 |
327 |
| Unit of analysis |
All keywords |
56 |
59 |
14 |
| Minimum occurrence |
|
10 |
5 |
3 |
Table 4.
Top 10 keywords, their number of links, and total link strength for Scopus.
Table 4.
Top 10 keywords, their number of links, and total link strength for Scopus.
| Keyword |
Frequency |
Number of links |
Total link strength |
| Digital Twin |
314 |
933 |
94 |
| BIM |
113 |
613 |
170 |
| IoT |
75 |
357 |
109 |
| Architectural designs |
64 |
368 |
47 |
| Lifecycle |
56 |
266 |
51 |
| Information management |
38 |
224 |
48 |
| Industry 4.0 |
33 |
126 |
42 |
| Manufacture |
31 |
106 |
37 |
| AI |
30 |
130 |
44 |
| Embedded systems |
30 |
130 |
38 |
Table 5.
Top 10 keywords, their number of links, and total link strength for WoS.
Table 5.
Top 10 keywords, their number of links, and total link strength for WoS.
| Keyword |
Frequency |
Number of links |
Total link strength |
| Digital twin |
175 |
415 |
85 |
| BIM |
51 |
202 |
99 |
| System |
38 |
134 |
73 |
| Design |
32 |
113 |
44 |
| IoT |
32 |
152 |
88 |
| Model |
27 |
87 |
53 |
| Industry 4.0 |
26 |
98 |
54 |
| Simulation |
26 |
71 |
35 |
| Management |
17 |
79 |
34 |
| Framework |
16 |
89 |
43 |
Table 6.
Top 10 keywords, their number of links, and total link strength for ScienceDirect.
Table 6.
Top 10 keywords, their number of links, and total link strength for ScienceDirect.
| Keyword |
Frequency |
Number of links |
Total link strength |
| Digital twin |
47 |
31 |
14 |
| BIM |
10 |
12 |
6 |
| Industry 4.0 |
5 |
5 |
3 |
| Machine learning |
5 |
3 |
2 |
| Smart cities |
4 |
6 |
4 |
| Additive manufacturing |
3 |
1 |
1 |
| Artificial intelligence |
3 |
3 |
3 |
| Asset management |
3 |
4 |
2 |
| Cyber-physical systems |
3 |
4 |
3 |
| Industry foundation classes |
3 |
4 |
3 |
Table 7.
Co-authorship analysis.
Table 7.
Co-authorship analysis.
| Assessment |
Consideration |
Scopus results |
WoS results |
| Type of analysis |
Co-authorship |
|
|
| Counting method |
Full counting |
169 |
1179 |
| Units of analysis |
Authors |
6 |
11 |
| Minimum Occurrence |
|
3 |
3 |
Table 8.
Co-authorship analysis based on organizational affiliations.
Table 8.
Co-authorship analysis based on organizational affiliations.
| Assessment |
Consideration |
Scopus results |
WoS results |
| Type of analysis |
Co-authorship |
|
|
| Counting methods |
Full counting |
107 |
469 |
| Units |
Organizations |
107 |
27 |
| Minimum occurrence |
|
1 |
3 |
Table 9.
Top contributing organizations.
Table 9.
Top contributing organizations.
| Organization |
Indexing |
Documents |
Citations |
| University of Cambridge |
WoS, Scopus |
22 |
99 |
| Polytechnic di Milano |
WoS, Scopus |
13 |
102 |
| University Of Sheffield |
WoS, Scopus |
7 |
17 |
| Aalto University |
WoS, Scopus |
6 |
39 |
| University of California, Irvine |
WoS, Scopus |
6 |
37 |
| University of Birmingham |
WoS, Scopus |
5 |
62 |
| Norwegian University of Science and Technology |
WoS, Scopus |
5 |
5 |
| Delft University of Technology |
WoS, Scopus |
4 |
59 |
| Chalmers University of Technology |
WoS, Scopus |
4 |
19 |
| Beijing Institute of Technology |
WoS, Scopus |
4 |
114 |
Table 10.
Co-authorship analysis based on country of origin.
Table 10.
Co-authorship analysis based on country of origin.
| Assessment |
Consideration |
Scopus results |
WoS results |
| Type of analysis |
Co-authorship |
|
|
| Counting methods |
Full counting |
26 |
48 |
| Units |
Countries |
9 |
31 |
| Minimum occurrence |
|
3 |
3 |
