1. Introduction
The need for sustainable development, reduction of energy-related greenhouse gas emissions and the desire to attain carbon-neutral economy have been major contributing factors in the drive to shift from fossil-based systems of energy production and consumption towards renewable and clean energy sources. Photovoltaic (PV) system constitutes one of the major technologies which could contribute to meeting the UN Sustainable Development Goal (SDG) on ensuring reliable and sustainable energy supply, through effective sun energy harvesting to generate electricity while minimizing adverse environmental impacts [
1]. Mobile solar PV systems play a crucial role in regions where access to the power grid is limited or unreliable. These systems provide a sustainable and independent source of energy, particularly in remote areas or during emergencies such as in healthcare buildings. The mobility of solar PV systems allows them to be easily deployed and relocated as needed, making them suitable for various applications such as disaster relief efforts, outdoor events, and mobile installations, including recreational vehicle and boats. Advancements in battery storage technology have improved their effectiveness by enabling energy storage for use during non-sunlight hours. This ensures a consistent power supply even in off-grid locations. Despite the several advantages of the mobile solar PV systems, one of the challenging problems that need to be addressed is ensuring the structural integrity of solar panels to withstand wind loads in various circumstances. Solving or reducing this challenge will have significant impacts on the deployment of the system.
The aerodynamics of solar panels are categorized into roof-mounted panels and ground-mounted, depending on the wind conditions and turbulence intensity [
2]. The most popular method of installation is the roof-mounted solar systems for generating clean and renewable energy. A solar PV system erected on a roof can be installed on flat or sloping roofs, including metal composite roofs or rubber materials. When installed on commercial or industrial buildings, they can provide significant cost savings on electricity bills and help to reduce greenhouse gas emissions. Roof-mounted panels are influenced by surrounding walls and building edges, causing airflow separation and vortex generation, which may lead to a high-pressure zone on the roof [
3]. The loads on the panels are determined by their inclination angle, affected by different factors including wind direction, panel position, and building height [
4,
5]. A ground-mounted solar system on the other hand is a free-standing solar system that is mounted on the ground. These solar systems are installed with a metal frame or a single pole. The same type of solar panels is used in ground-mounted solar PV systems as in rooftop systems, but they are installed differently. Ground-mounted solar panels, located within the boundary layer, require precise array configuration, wind direction, and wind speed and turbulence definitions for accurate load calculations [
6,
7].
The analytical investigation aims to utilize aerodynamic formulations to determine the forces experienced by the panels. The lift force represents the component of the aerodynamic force that acts perpendicular to the airflow and mathematically described by equation 1. Likewise, the drag force corresponds to the component of the aerodynamic force that acts tangentially to the airflow and can be expressed by equation 2.
where
and
are lift and drag forces (N), respectively. A is the area (m2) of the panel subjected to the air flow, ρ is the mass density (kg/m3) of the air flow, and V is the velocity (m/s) of wind relative to the panel.
and
are lift and drag coefficients, respectively.
Obtaining accurate values of and is crucial when calculating the aerodynamic forces on the panels analytically. These coefficients need to be determined specifically for each panel size and tilting position. The most reliable methods for determining these coefficients is through experimental tests. Experimental tests allow the determination of aerodynamic forces, drag coefficient, lift coefficient, and other parameters on physical models placed in a wind tunnel under controlled conditions. On the other hand, CFD simulations utilize numerical method to simulate airflow around the panels and estimate the resulting forces, lift, and drag coefficients.
For industrial applications, it is preferable to adhere to standard codes such as the International Building Code (IBC) and American Society of Civil Engineers (ASCE) standard ASCE 7, particularly for the roof-mounted panels. The International Building Code (IBC) serves as a suitable standard for assessing wind loads on structures, including solar panels [
8]. Additionally, ASCE 7 provides comprehensive guidelines for determining wind loads and their impacts on solar panel installations [
9]. These standards offer insights into wind load requirements based on factors such as building height, location, wind speed, and exposure. However, for certain structures like mobile solar PV system mounted on trailer (MPST), the availability of specific standards and codes may be limited or not directly applicable. This can pose a challenge when it comes to parameter selection in ensuring the structural integrity and resilience of such systems in the face of wind loads.
In cases where standard codes may not exist, it becomes crucial to adopt a rigorous and comprehensive approach to address wind load concerns. This typically involves leveraging engineering principles, expertise, and best practices to design and implement solar PV module systems that can withstand various wind conditions. For such situations, there are two primary approaches that can be employed for predicting wind load effects on solar panels. The first approach involves placing a scaled model of the solar panel in a wind tunnel, where loads are determined using measured parameters on the model [
10,
11,
12]. The second approach utilizes numerical simulation, which has significantly advanced due to the progress made in information technology (IT) sector. Wind tunnel testing involves constructing a scaled model of the solar panel system and subjecting it to controlled wind conditions [
13]. On the other hand, numerical simulations utilize computational models and algorithms to simulate wind flow and its interaction with the solar PV power system [
14,
15]. Both approaches complement each other, as the results obtained from the wind tunnel testing helps in the validation of the numerical approach. The later helps in design optimization and can provide a comprehensive assessment of wind load effects on solar panels.
This paper presents a study that employs both experimental and numerical techniques to investigate the behaviour of the solar PV panels used in the designed MSPT. It focuses on analysing the lift and drag forces exerted on the panels by varying wind velocity, including velocity and direction. The study also evaluates the impacts of wind on solar PV panels used in the system, considering different panel tilt angles. Computational Fluid Dynamics (CFD) technique was utilized for the comprehensive investigation and analysis, while the experimental testing was conducted using a scaled-down panel sample with a ratio of 1:15.
2. Methodology
The methodology used in this study involves the numerical simulations (using ANSYS-Fluent 2022/R2 software) conducted on the solar PV panels as well as the entire MSPT. This helps to determine the magnitude and impact of the wind force on the system with different tilt angles and wind velocities.
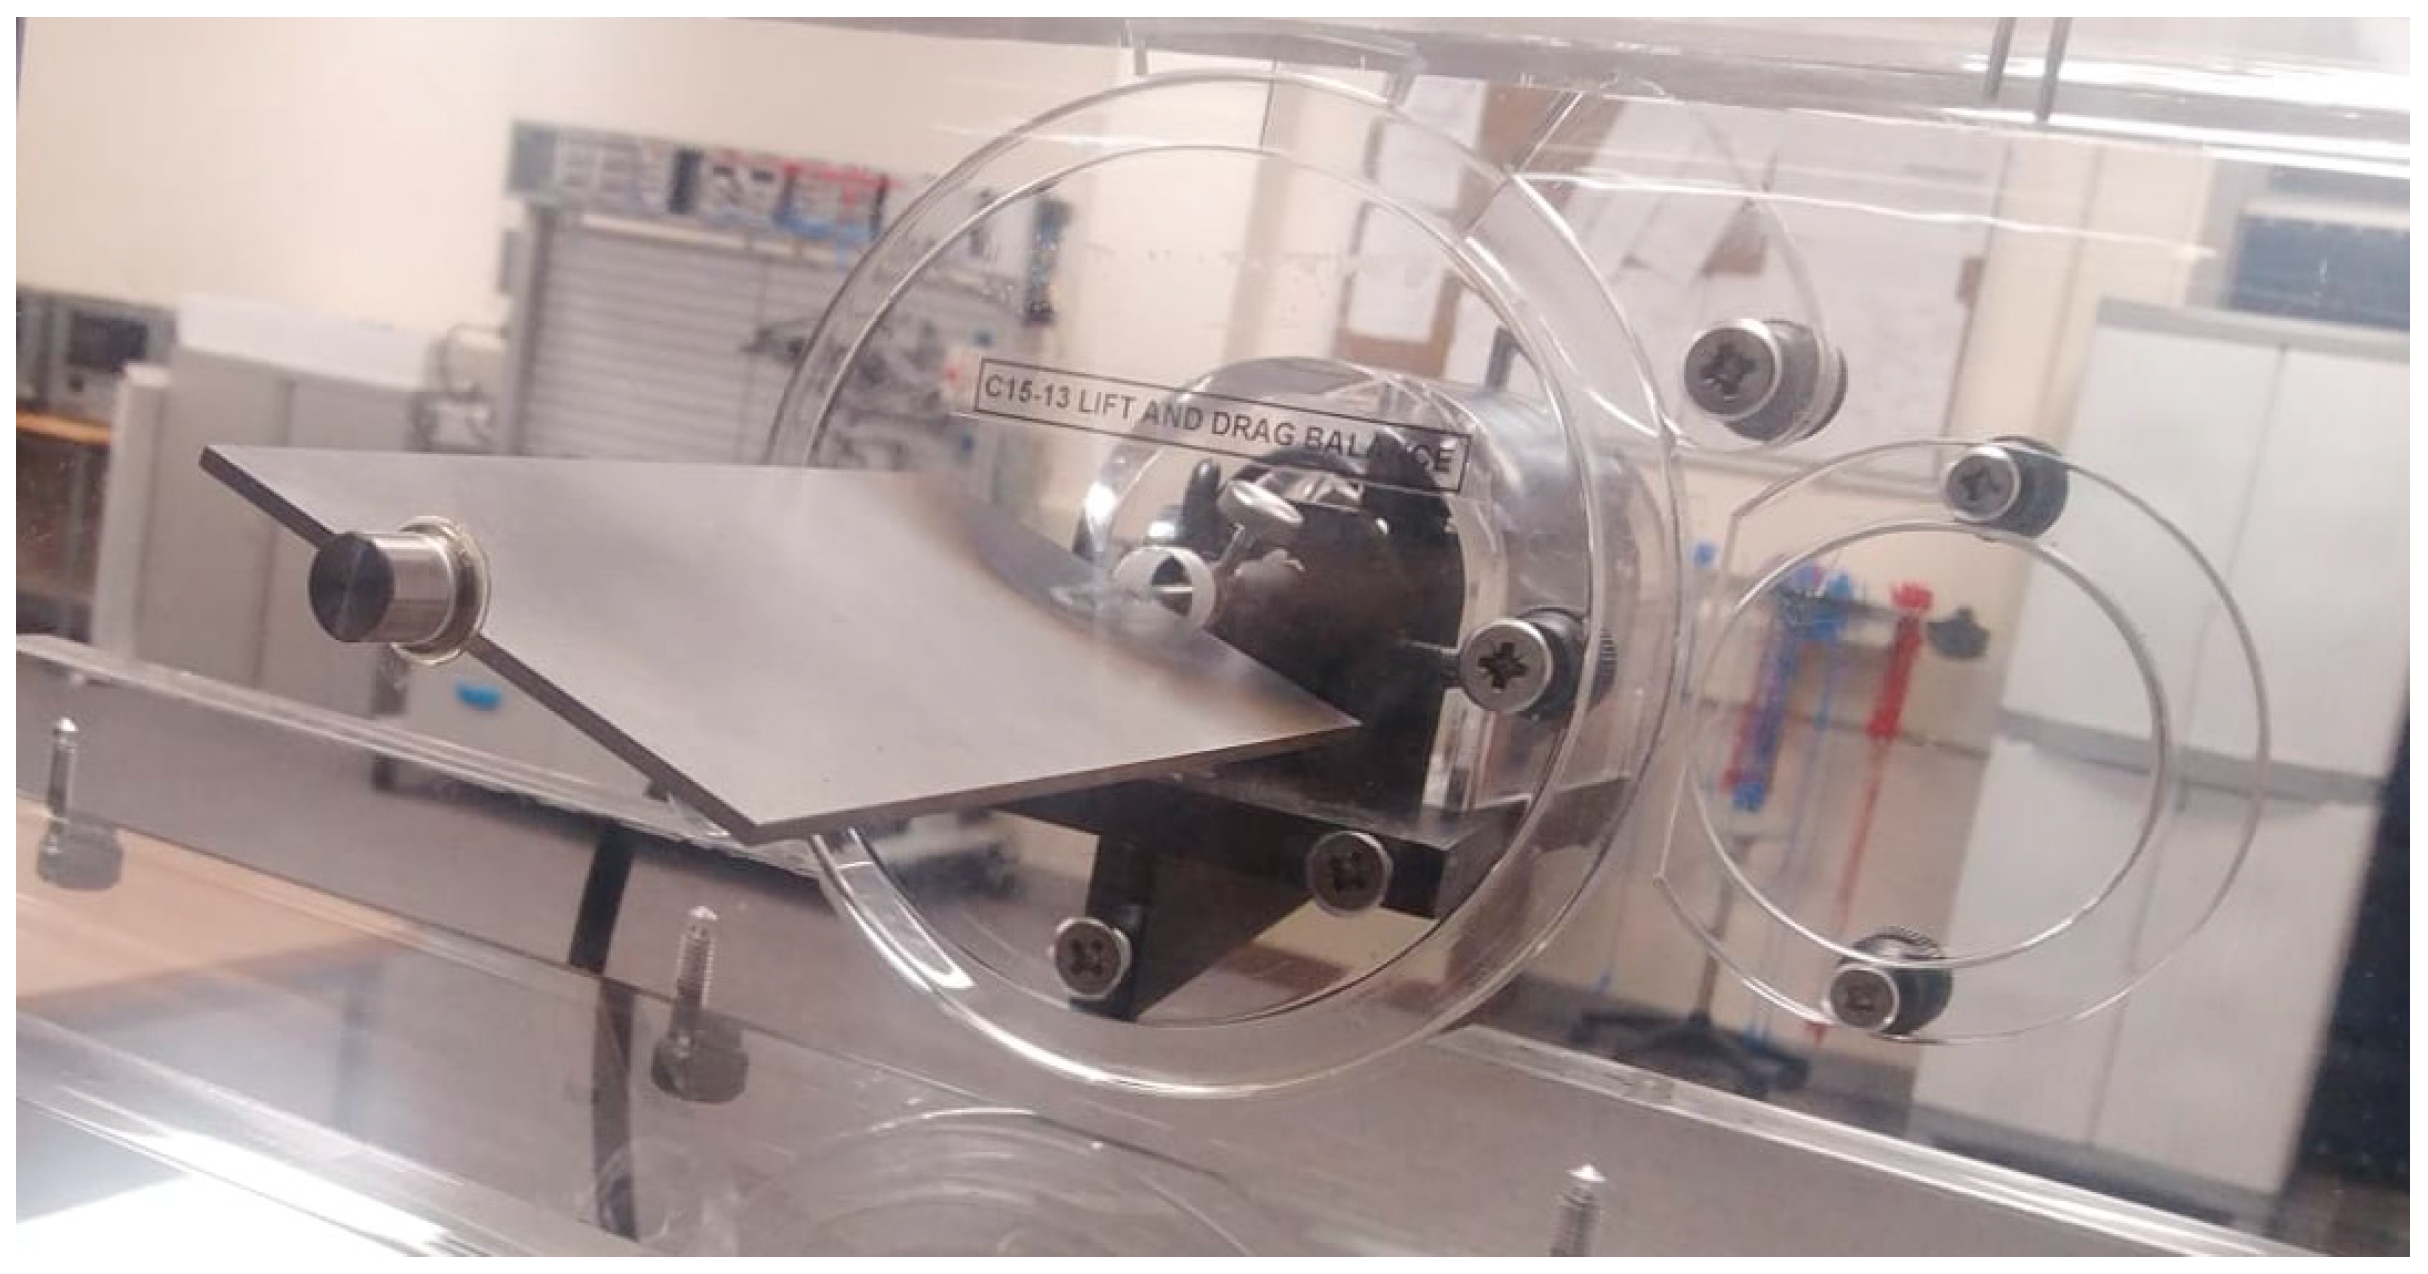
Furthermore, the experimental tests on the panel sample (scaled 1:15) were conducted using an open circuit wind tunnel with inclined manometer. The square test section was nominally 150 mm x 150 mm, with maximum air velocity up to 34 m/s in the test section. The experimental results were used to determine the amounts of lift and drag force of wind on the panel sample.
Figure 1 depicts a view of the solar PV panel sample installed in the wind tunnel test section.
The numerical simulations have been conducted to determine the associated lift and drag forces based on the experimental test conditions. Comparing the results from the simulation with those from the experiment, assisted in validating the simulation set-up for the study involving the full-size panel and entire MSPT.
Additionally, a comparative analysis was undertaken to substantiate the precision of the existing simulation technique. This analysis entailed a juxtaposition of the results derived from the utilization of the present technique with those documented in extant scholarly works concerning solar photovoltaic (PV) panels [
16,
17]. The comparative evaluation involved a comprehensive review of both experimental data, as exemplified by Hoerner (1965), and numerical investigations, as exemplified by Giorges et al. (2013). This additional validation step aimed to ensure the robustness and reliability of the simulation set-up, providing a comprehensive assessment of its performance across different cases. This allowed for a comprehensive aerodynamic performance analysis of the panels under varying wind velocities and tilt angles.
3. Numerical Simulation
The numerical aerodynamic simulation aids in comprehending the interaction between fluids and solid objects, encompassing both the movement of solid objects through the fluid and the response of static structures to moving fluid (air (wind) in this case). It plays a crucial role in various industries, including aviation, automotive, solar PV arrays, wind energy, and sports equipment design. Computational approach emerges as a cost-effective alternative, circumventing the need for resource-intensive investigations like wind tunnel tests. The critical principles for aerodynamic numerical simulations involve judicious considerations of computational domain, flow conditions, geometrical models, boundary conditions, computational scheme, and domain discretization. These key fundamental principles are meticulously discussed in the subsequent subsections, providing a comprehensive understanding for the numerical analysis employed in this study.
3.1. Computation Domain and Flow Conditions
3.1.1. Geometrical Models
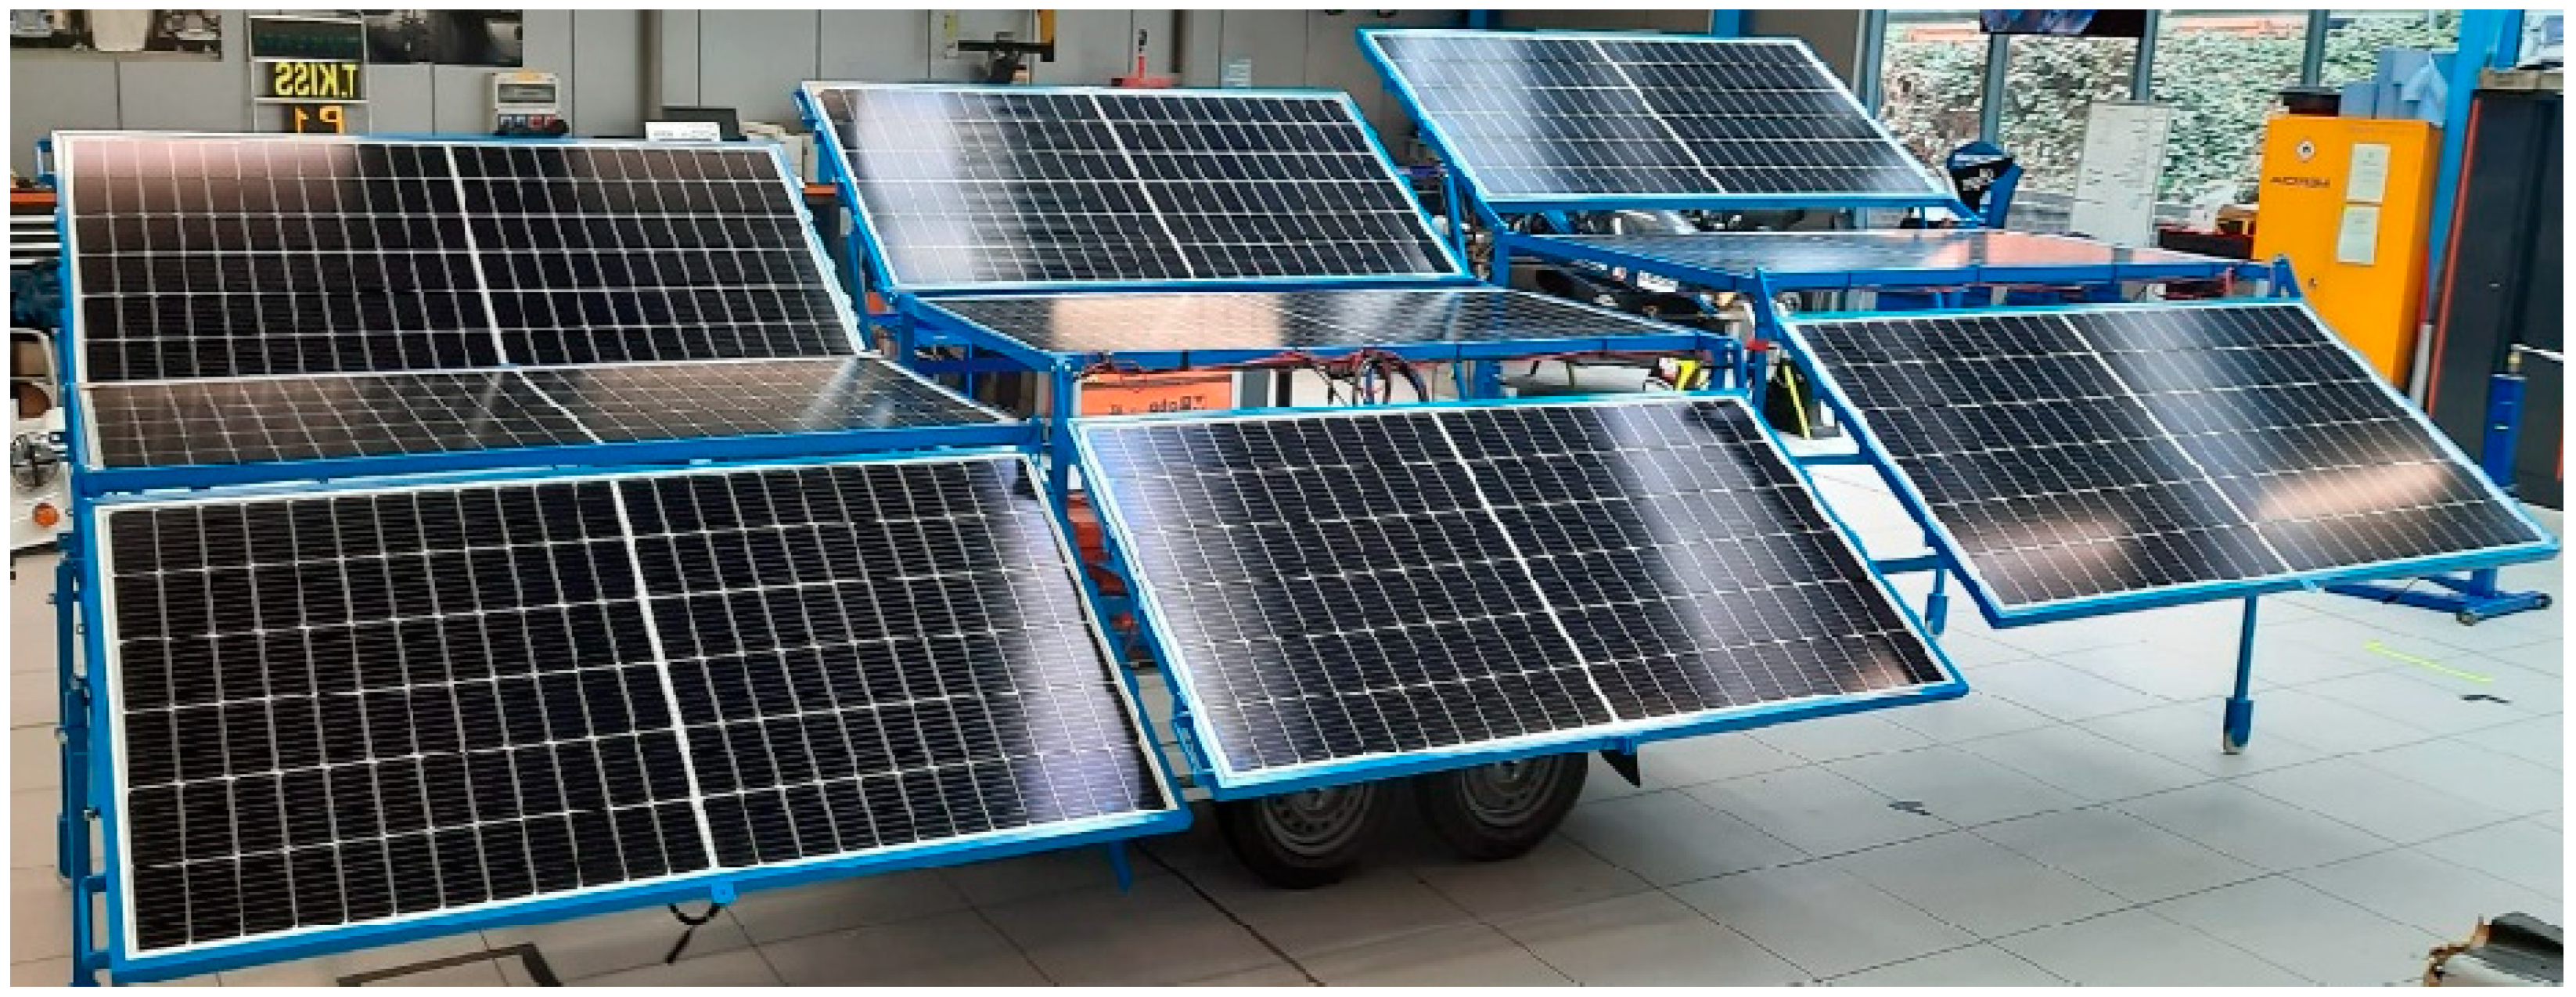
A prototype of the MSPT was constructed and affixed to a trailer, as depicted in
Figure 2. The MSPT configuration comprises nine panels, featuring six panels (positioned at the top and bottom) tilted at 30 degrees, while the three panels in the middle remain without tilt. The individual solar PV panels employed in the MSPT measure 2.14 meters in width and 1.08 meters in length. Furthermore, upon unfolding the MSPT with a 30-degree tilt angle, the panels unveil substantial dimensions: a length of 6.61 meters, a breadth of 3.45 meters, and a height of 1.19 meters.
3.1.1. Wind Load
The velocity of 10 m/s has been selected, as the MSPT is designed for operating in sub-Sharan region, particularly in Nigeria, where the average annual wind speeds typically range from 2 m/s to 9.5 m/s [
16,
17].
3.1.1. Boundary Conditions
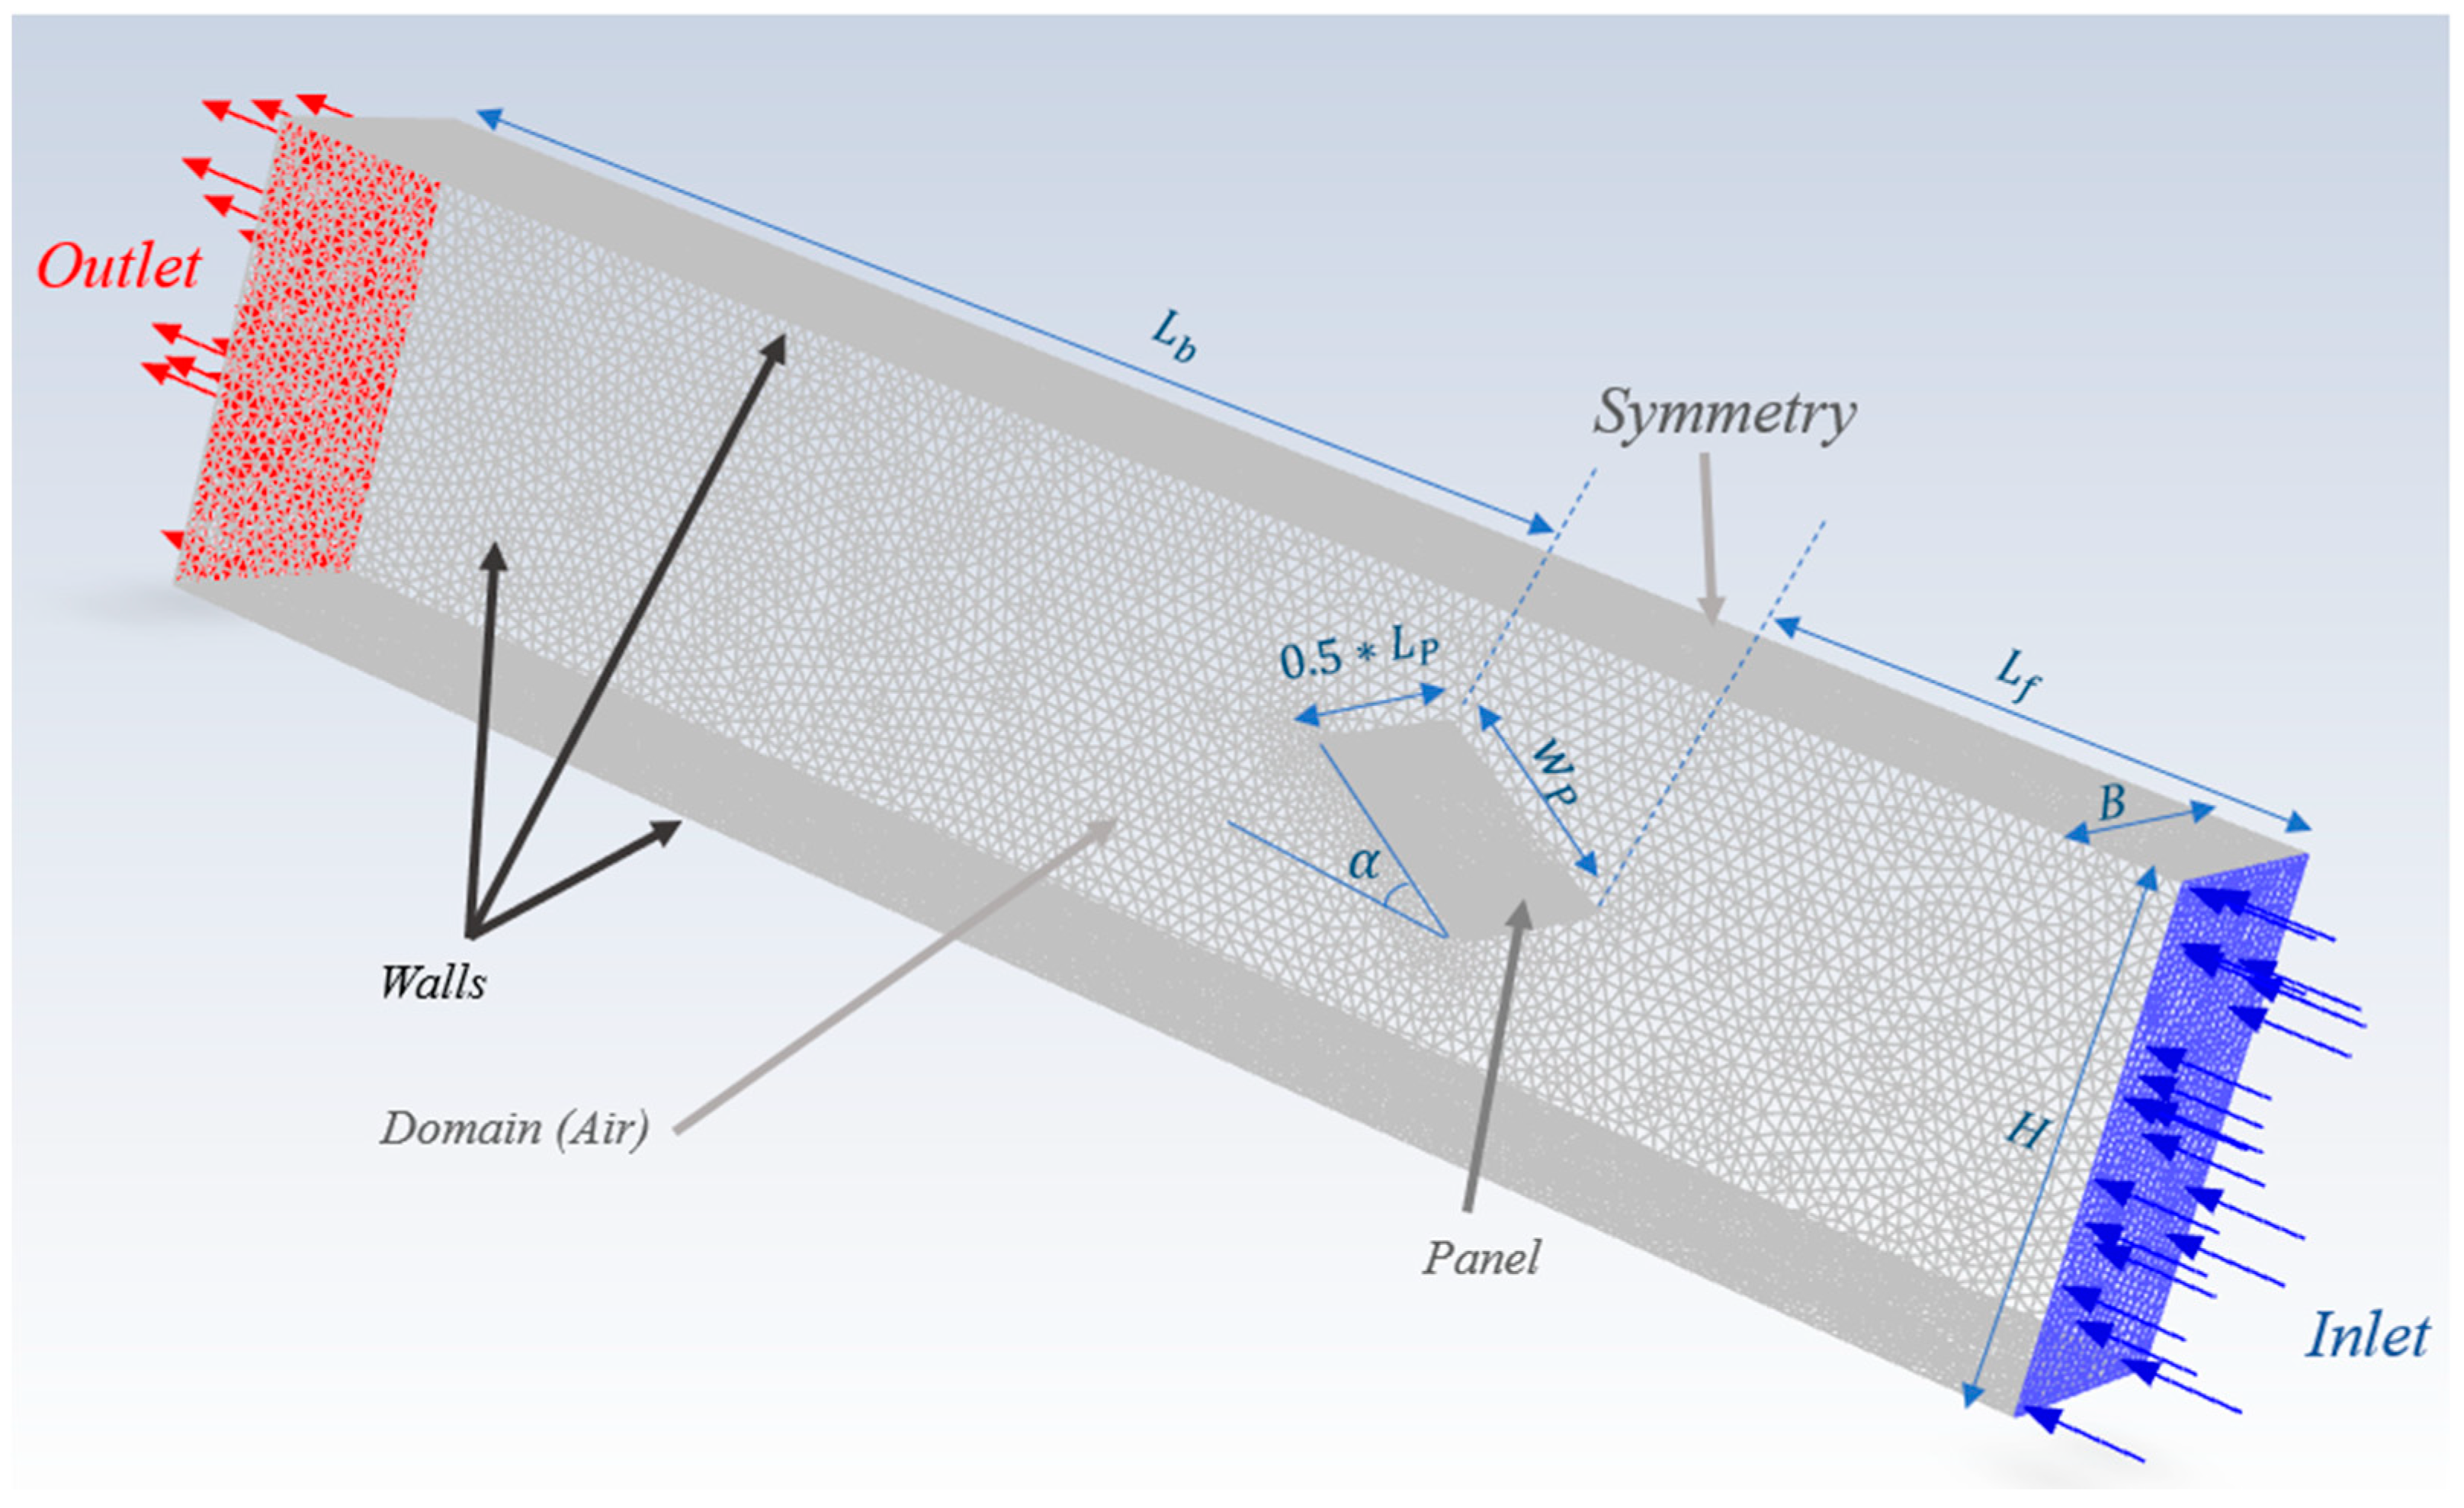
Figure 3 depicts a 3D representation of the CFD model for the scaled solar panel sample (tilt angle, α = 30 degrees) simulated using ANSYS Fluent 2022 R2. Appropriate boundary conditions were applied with a symmetry boundary condition at the mid-section of the panels as illustrated in
Figure 3 to simplify the analysis. The panels at different tilting angles (-35 to 35 degrees) were subjected to wind velocity of 10 m/s.
Table 1 provides information on the dimensions of the panel models and the corresponding domain used in the present simulation, including the full-size panel used in MSPT, scaled panel sample, and panel from the literature [
18].
3.2. Numerical Model
3.2.1. Computational Scheme
All the CFD simulations in this current study assume an isothermal, viscous, and incompressible (constant density) fluid. The incompressible Reynolds Averaged Navier Stokes (RANS) equations for the conservation of mass and momentum described in the literatures govern this flow [
19,
20]. The governing equations are discretized by a finite volume approach and the pressure based segregated solver proposed by Chorin (1968) has been used for the numerical integration [
21].
In this study, the standard k-epsilon turbulence model available in ANSYS Fluent was employed to model the aerodynamic behaviour of a solar PV panels [
22]. The standard k-epsilon model is a widely adopted and robust turbulence model known for accurately representing turbulent flow phenomena. The efficacy of this turbulence model is highlighted in numerous recent research studies examining the impact of wind load and patterns on solar PV panels and arrays, making it a prevalent choice for conducting numerical simulations in this context [
5,
23,
24,
25]. By solving the transport equations for turbulent kinetic energy (k) and the dissipation rate of turbulent kinetic energy (epsilon), the model accurately predicts the flow behaviour. Additionally, the standard k-epsilon model was selected due to its versatility and computational efficiency, making it suitable for the simulation of the aerodynamic effects at varying wind velocities and panel tilting angles. In this present simulations, the coefficients value for the k-epsilon model were set as presented in
Table 2.
3.2.2. Domain Discretisation
The computational domain for this study was meshed in ANSYS Fluent workbench. The unstructured tetrahedral mesh of intermediate mesh density was used for this current study as shown in
Figure 3. The mesh was clustered around the panel surface by the size function tool in ANSYS fluent workbench [
22] to capture the salient features of the flow.
To ensure mesh sensitivity and model accuracy, a grid independence tests were conducted for various meshing configurations. Seven different mesh were created by adjusting the number of elements along the panel's edges (
) and the ratio of the domain wall's mesh size to the panel's edge mesh size,
, as shown in
Table 3. For the scaled panel sample tilted at 30 degrees, the number of mesh elements size ranges from 224 thousand to 2.7 million.
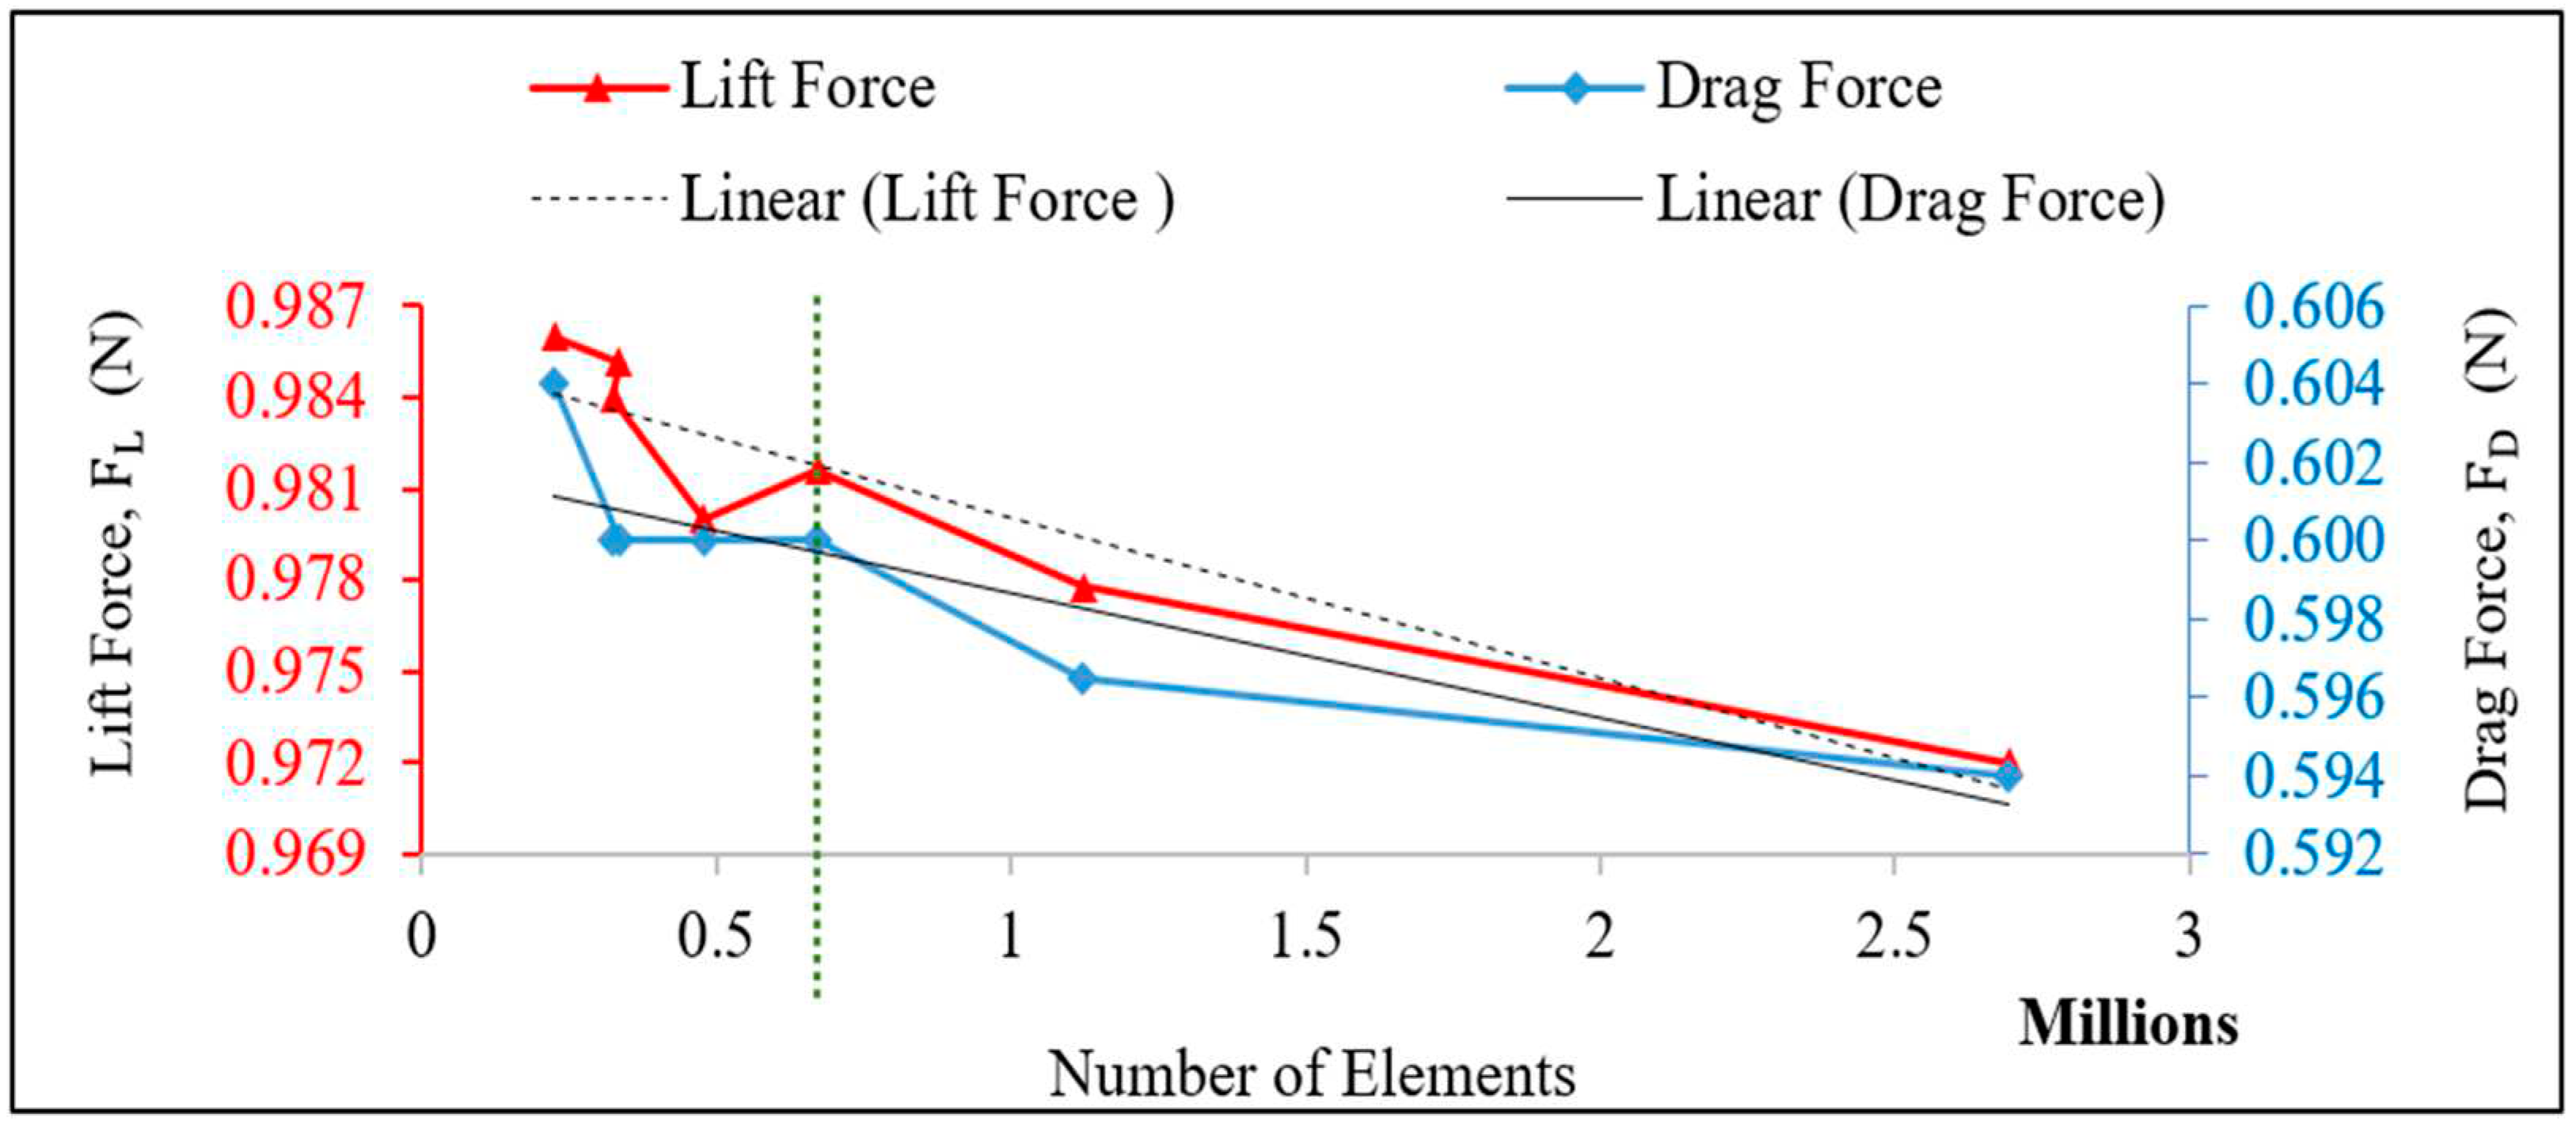
The predictions of the lift and drag forces on the panel were used as monitoring parameters to establish the grid independence of the predictions as shown in
Table 3. The results of the studied models demonstrated a narrow range of lift and drag forces, with less than a 2% difference in values. The results indicate that the different levels of computational mesh refinement have little impact on the lift and drag forces. This indicates that the numerical scheme is predicting similar values at all the seven levels of mesh refinement and that any further increase in grid density may not noticeably improve the accuracy of the RANS predictions.
The computational mesh Type 3, with of 100, of 5.6, and of 672 thousand, shows minimum difference of its corresponding drag and lift forces with the mean values of the forces for all the seven case studies. Then, the mesh Type 3 was chosen for this study as it provides sufficiently grid independent resolution, given the available computational resources.
Figure 4 shows the variation of lift and drag forces with different mesh configurations, displaying linear regression lines that capture the trends of the lift and drag forces as the number of elements in the mesh configuration changes.
3.3. Result Validation
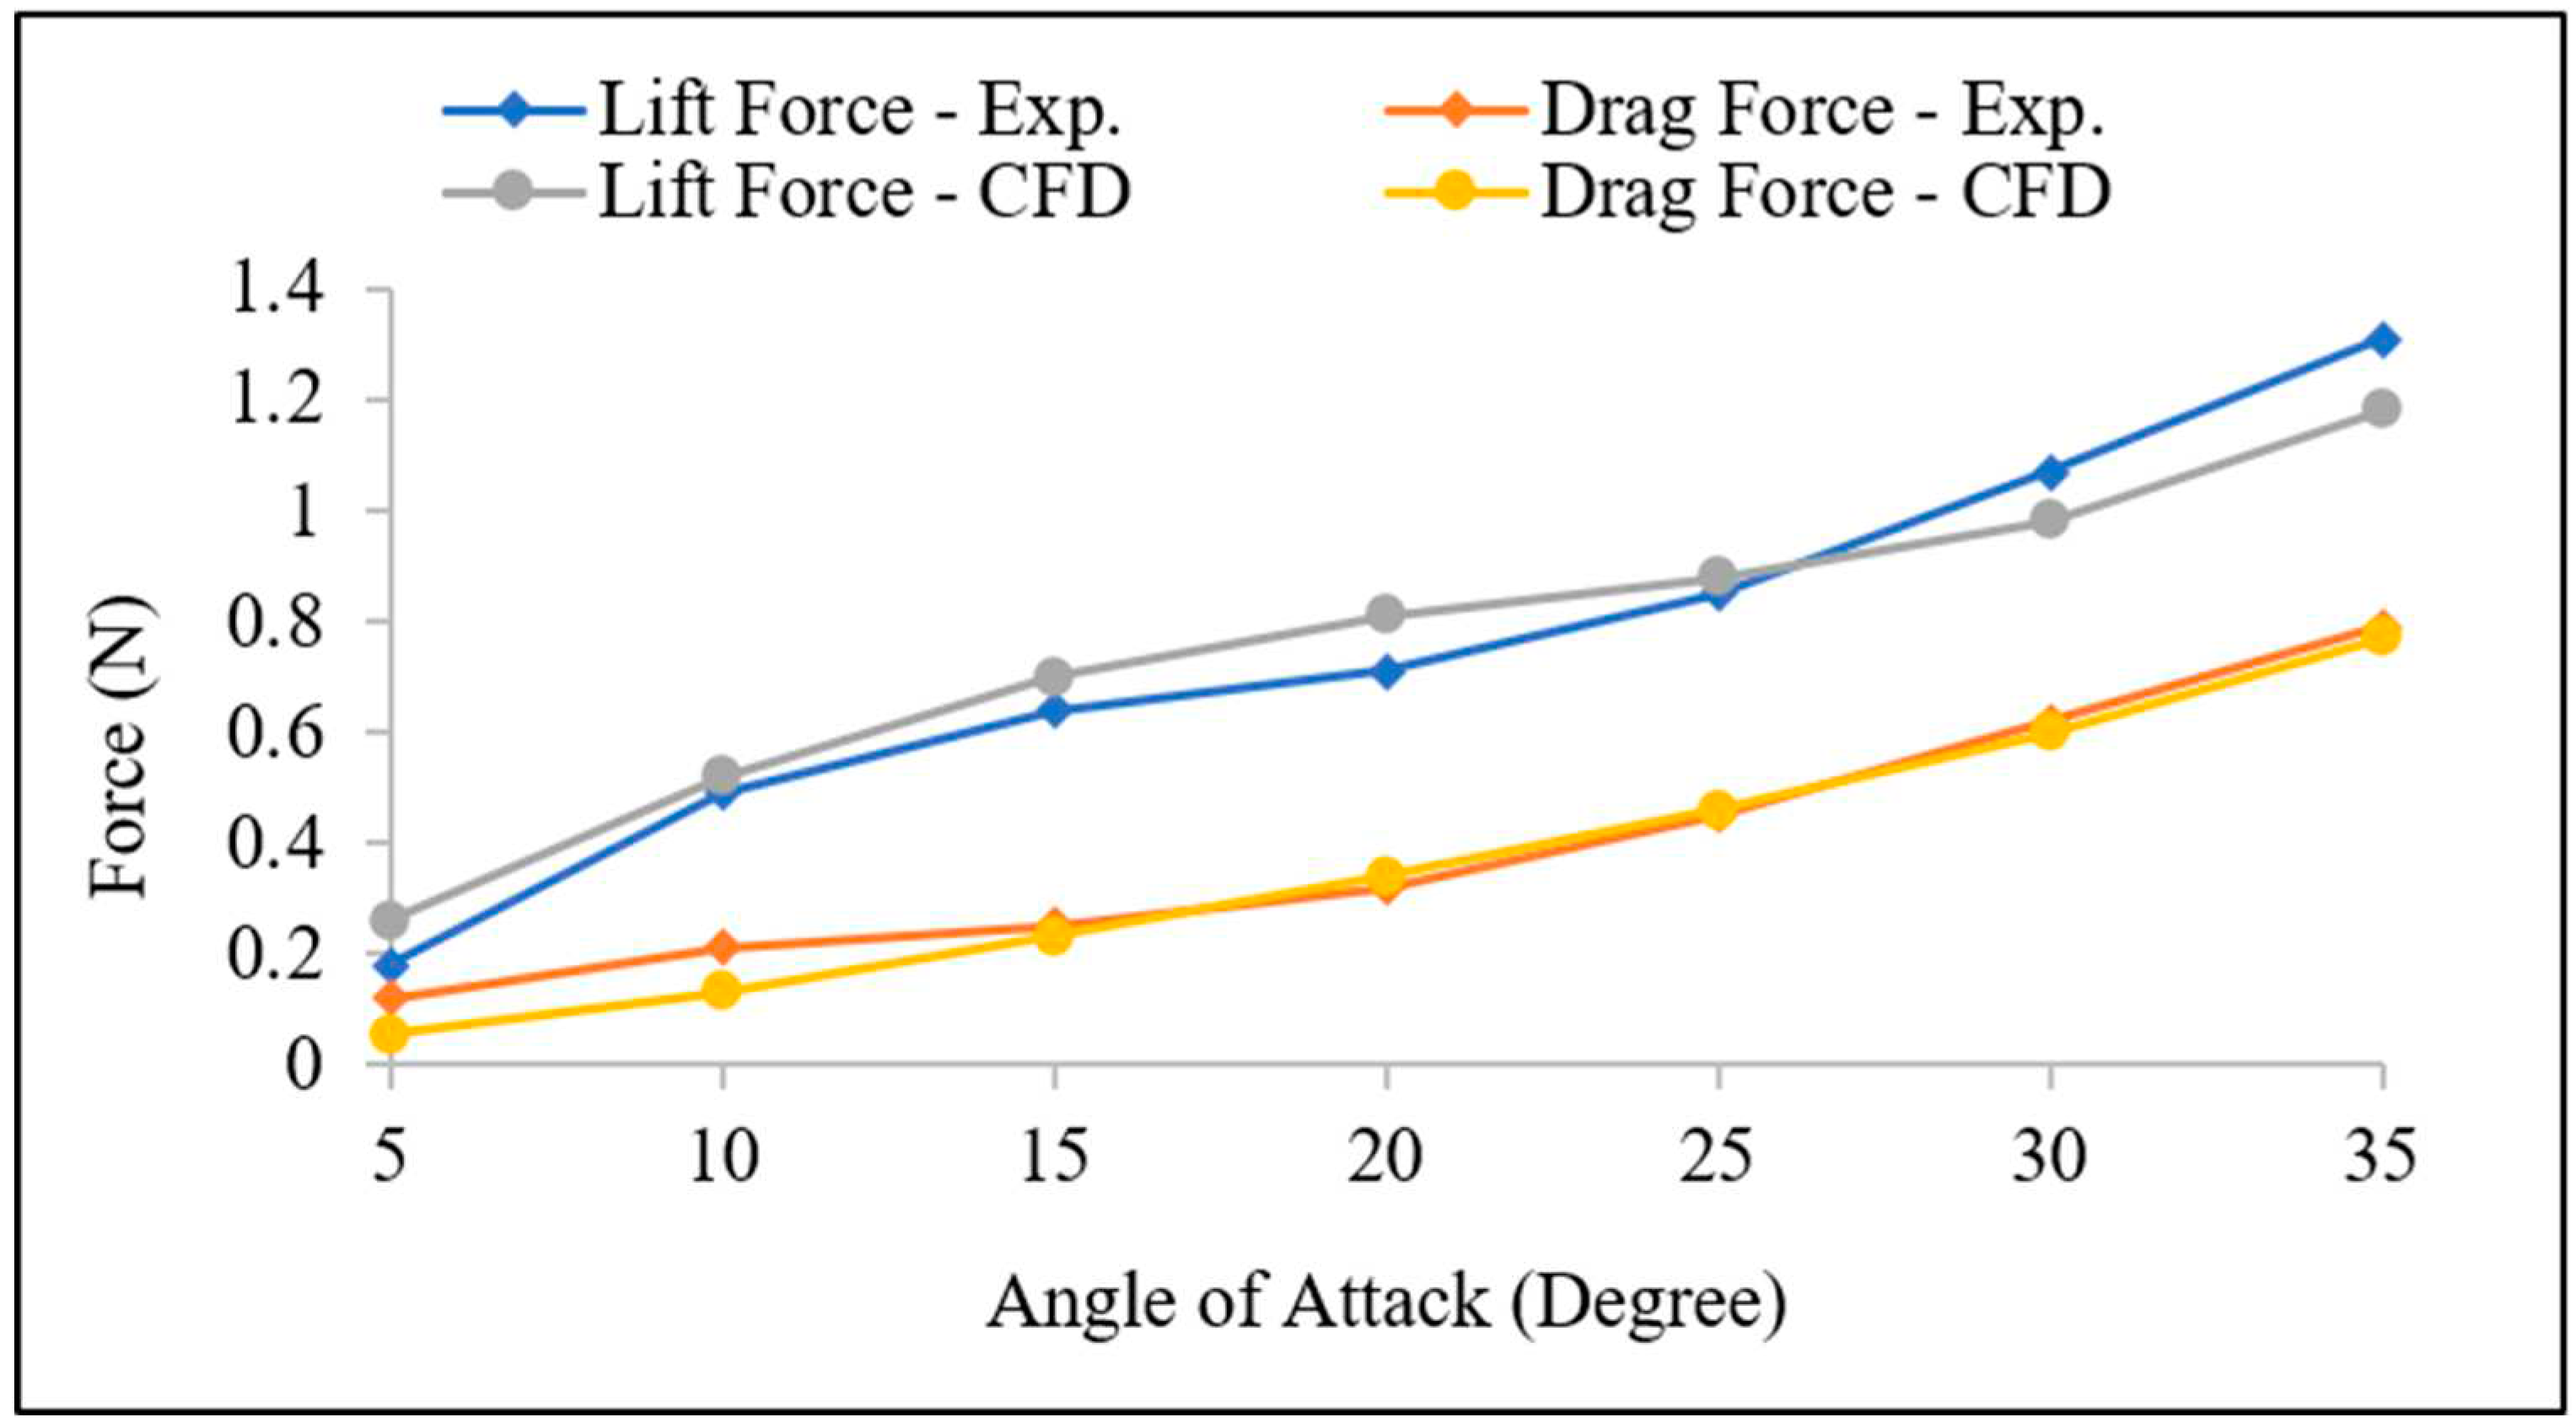
Figure 5 shows the predicted lift and drag forces from the numerical simulation and experimental testing on the scaled solar PV panel sample at a wind velocity of 10 m/s, and varying tilt angles (angel of attack). The results show the drag and lift forces increasing as the angle of attack increases, exhibiting a consistent upward trend. compares the values of drag and lift forces and their corresponding coefficients obtained from both the experiments and the simulation of the scaled panel sample. The simulation results in
Table 4 show an average error of 8.5 % and 4.5 % for the lift and the drag forces, respectively, when the tilt angle is over 15 degrees. The results indicate a good agreement between the predicted numerical simulation and experimental data, thereby validating the simulation's accuracy.
Additionally, the accuracy of the current CFD simulation technique was compared with an unscaled panel described in the literatures from both the numerical investigation [
18] and the experimental investigation [
26]. The unscaled panel shares similar aspect ratio of 2 to the panels used in the MSPT, but have different dimensions as specified in
Table 1 (with the width of 699 mm and the length of 340 mm). The drag and lift forces obtained from the current simulation of the tilted panel at different angles (-35 to +35 degrees) were used to calculate the corresponding lift and drag coefficients using equations 1 and 2. The air density was taken as 1.22 kg/m3, which is the same as the value used for the CFD simulation, and the wind velocity was set at 10 m/s.
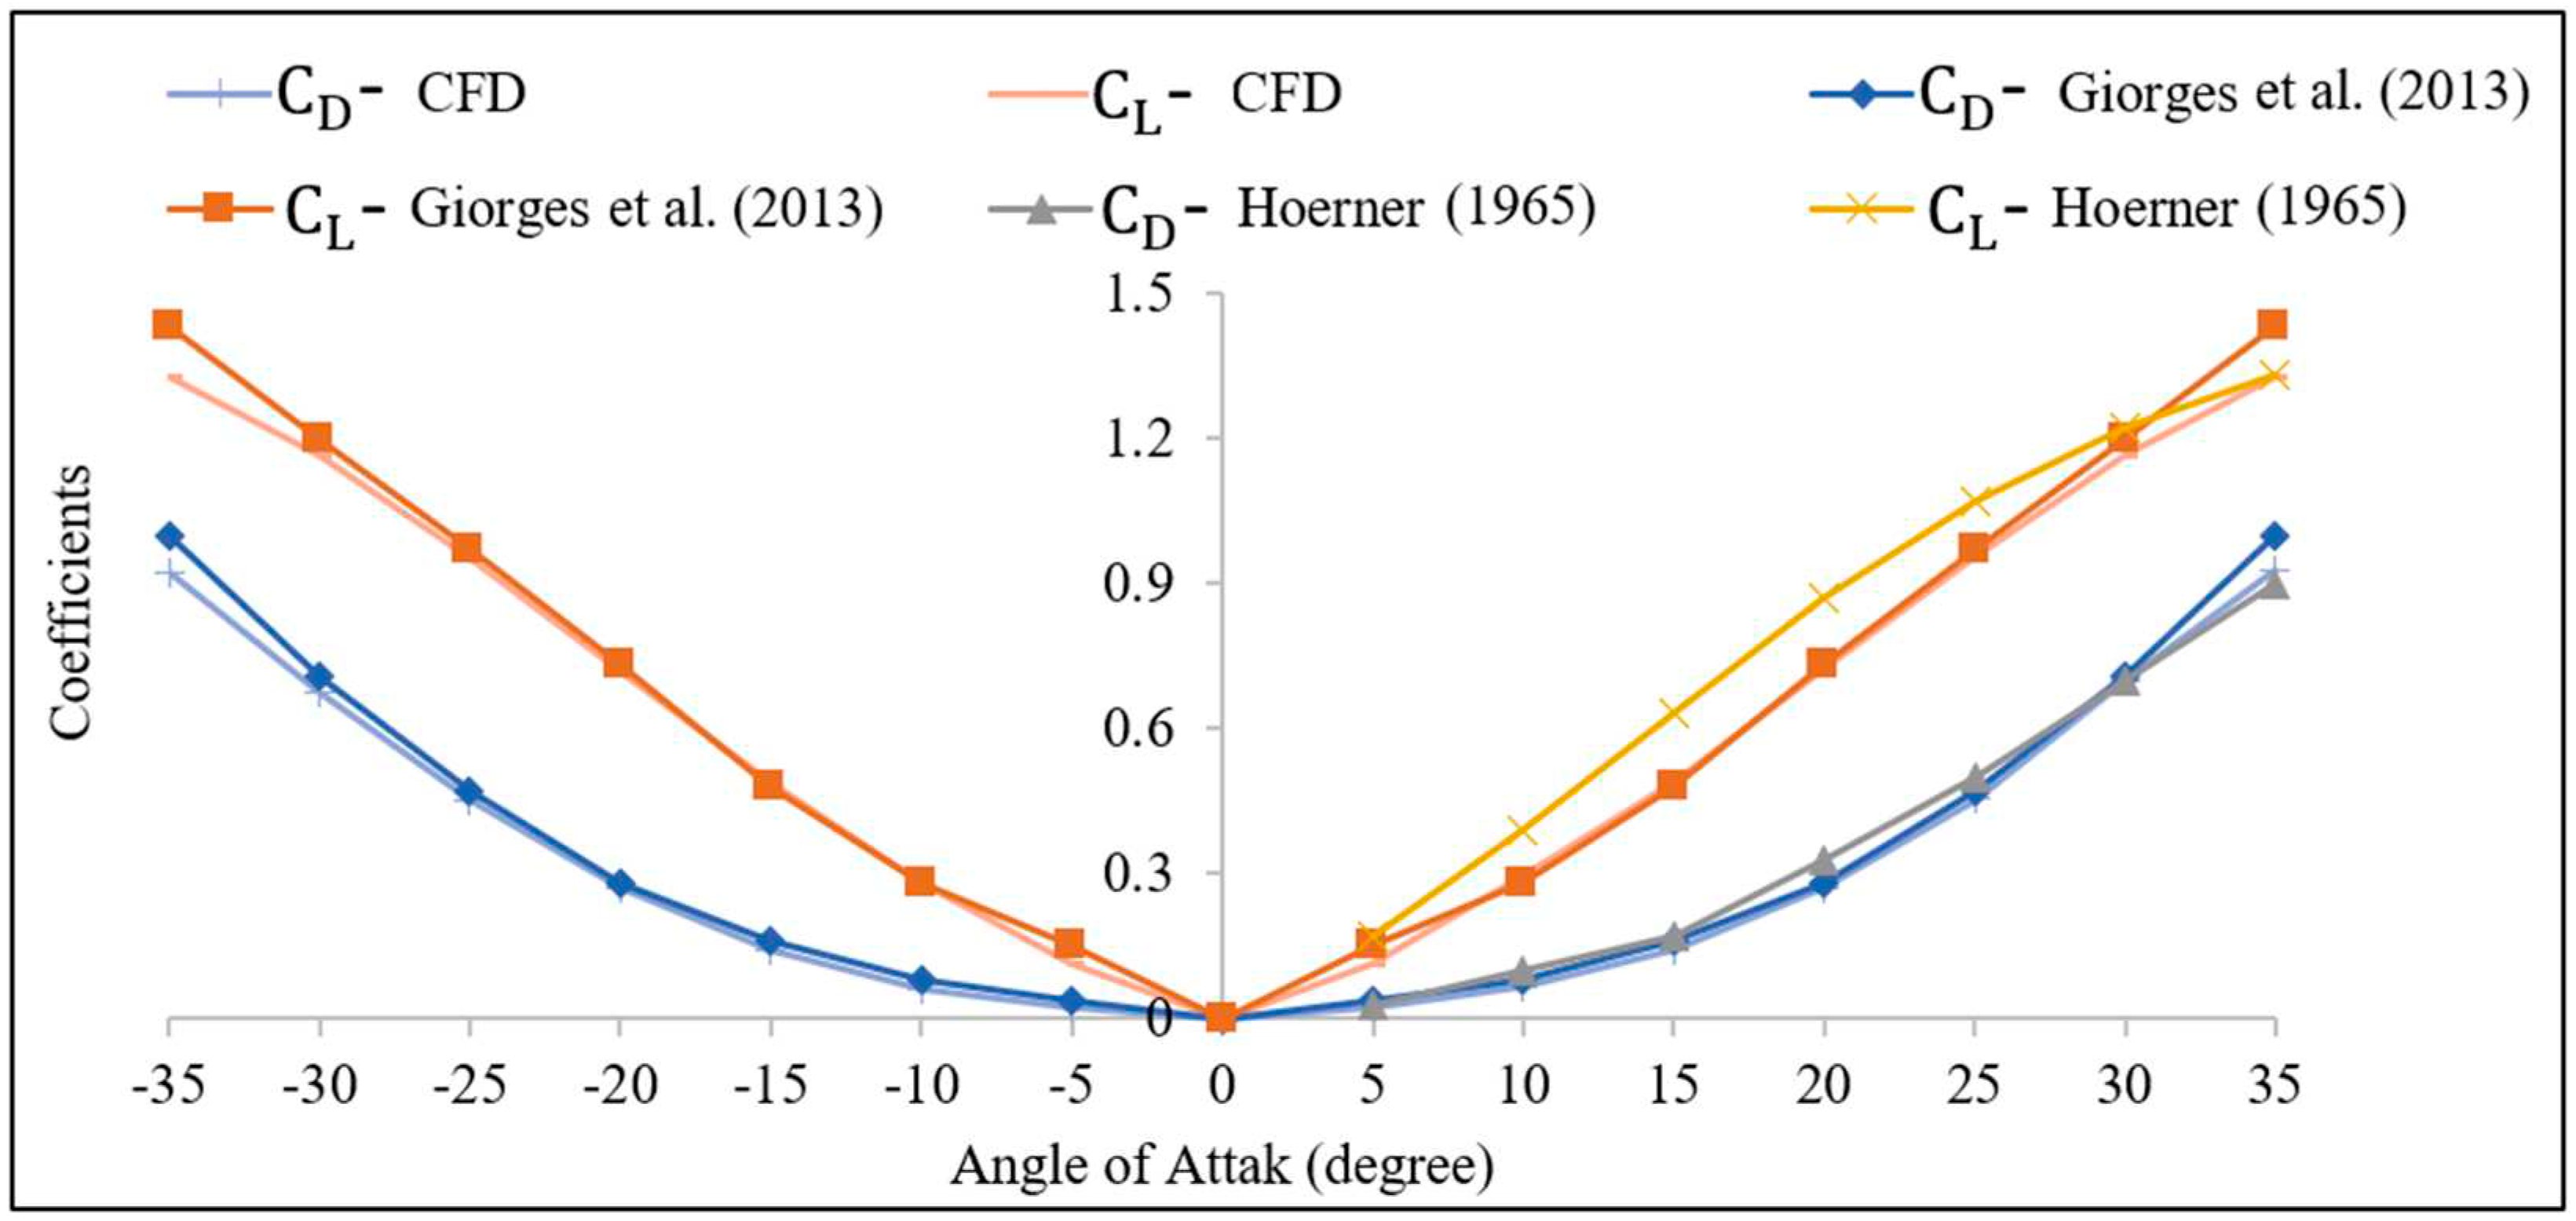
Figure 6 compares the values obtained for the
and
for the current study with the values reported in the literatures. As shown in
Figure 6, there is a good agreement between the values of the lift and drag coefficients, which further demonstrates the validity of simulation set-up used in this study.
Figure 6 also shows that the coefficients exhibit nearly identical values for each tilt angle, indicating that the aerodynamic performance of the panels remains consistent regardless of the wind's direction relative to the panel orientation. This means that the aerodynamic coefficients are not affected by the facing direction of the wind (from front side or back side), whether it is approaching from the front side, or the back side as also reported by Giorges et al. (2013).
4. Results and Discussion
This section presents and discusses the results of predicted numerical simulations of the flow interaction and behaviour around both the solar panel used in the MSPT and the entire MSPT under different wind velocities and various tilt angles. Additionally, the effect of panel scale factor on the drag and lift coefficients were discussed.
Figure 7 displays the static pressure contour at the mid-section of full-size panel (width: 1083 mm, length: 2140 mm) used in the MSPT, tilted at 30 degrees, as obtained from the current CFD simulation. As depicted in
Figure 7, the leading edge of the panel facing the incoming airflow experiences positive pressure, while the trailing edge of the panel encounters negative pressures, indicating the suction side.
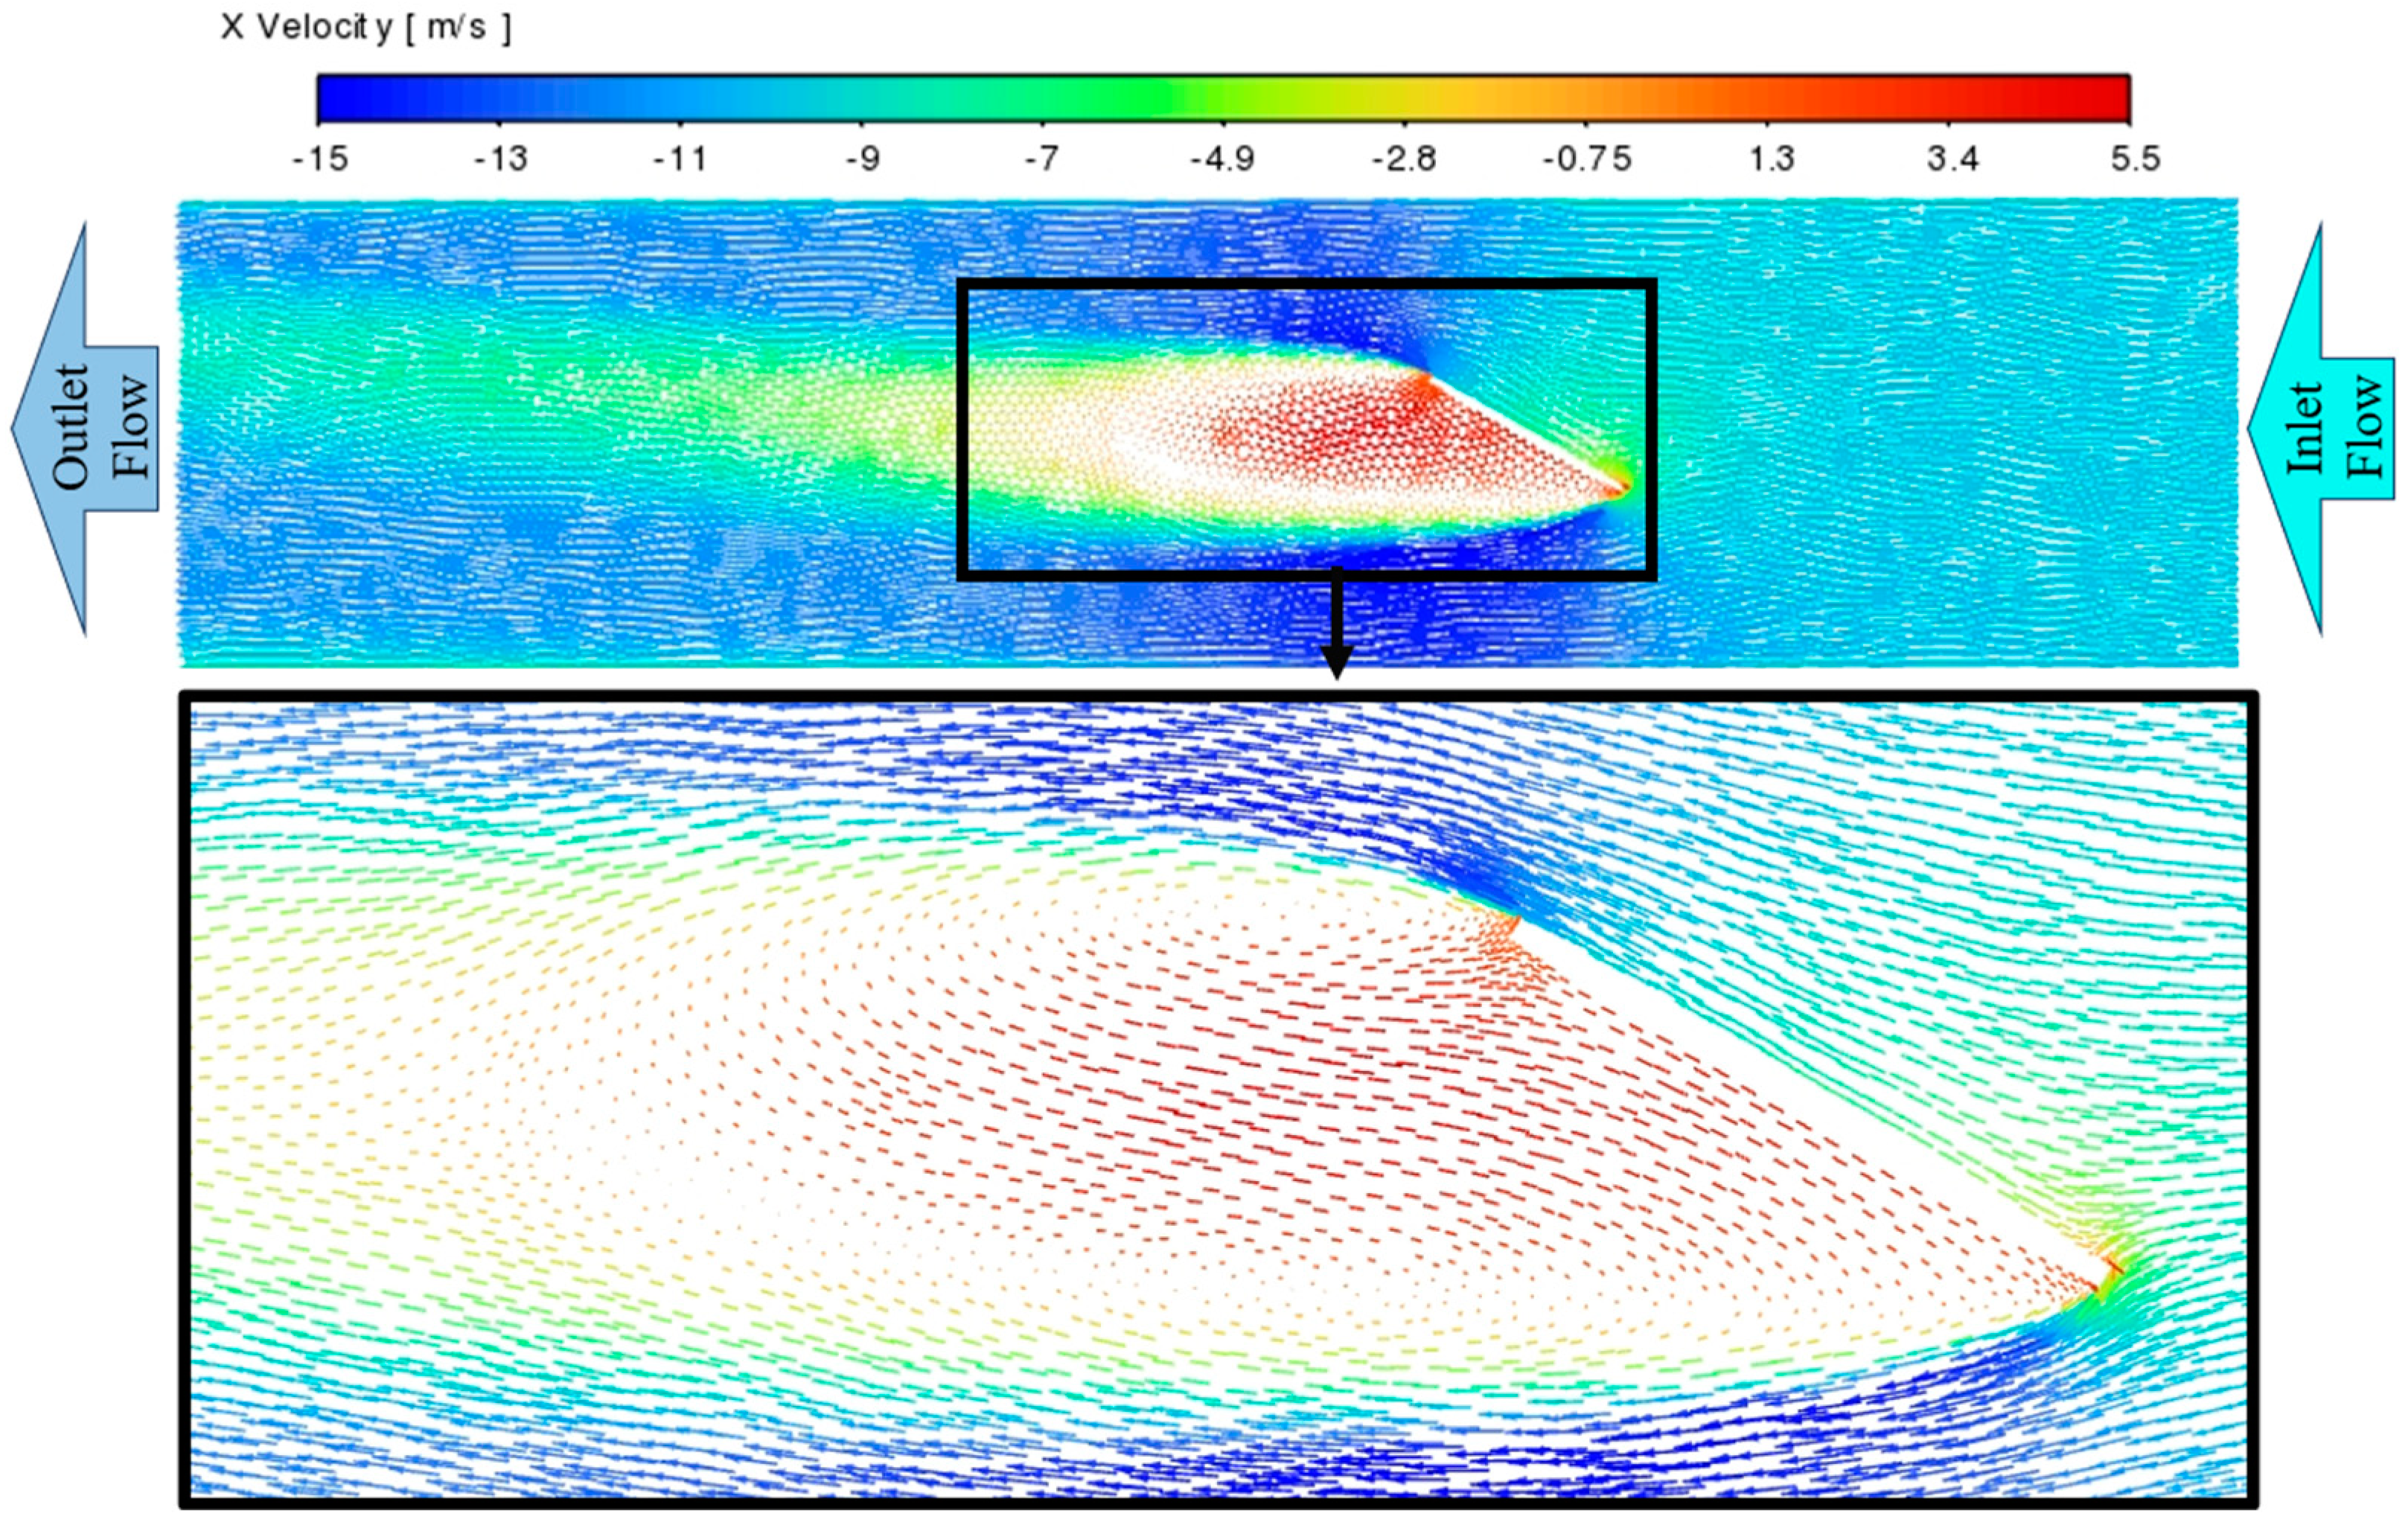
Figure 8 depicts the vector contour of flow velocity in the x direction (inlet to outlet), showing the detailed flow features around the panel from the simulation as in
Figure 7.
Figure 8 illustrates flow separation occurring at the edges of the panel, accompanied by high turbulence and the generation of vortices at the back of the panel near the edges. The separated flow at the top and bottom edges of the panel results in an increase in velocity at the edges, reaching up to 15 m/s. Additionally, the vortices at the back of the panel induce a recirculation flow pattern on the opposite side of the inlet flow with an average velocity of 5.5 m/s, thus indicating suction effects at the back of the panel.
4.1. Effects of Wind Velocity
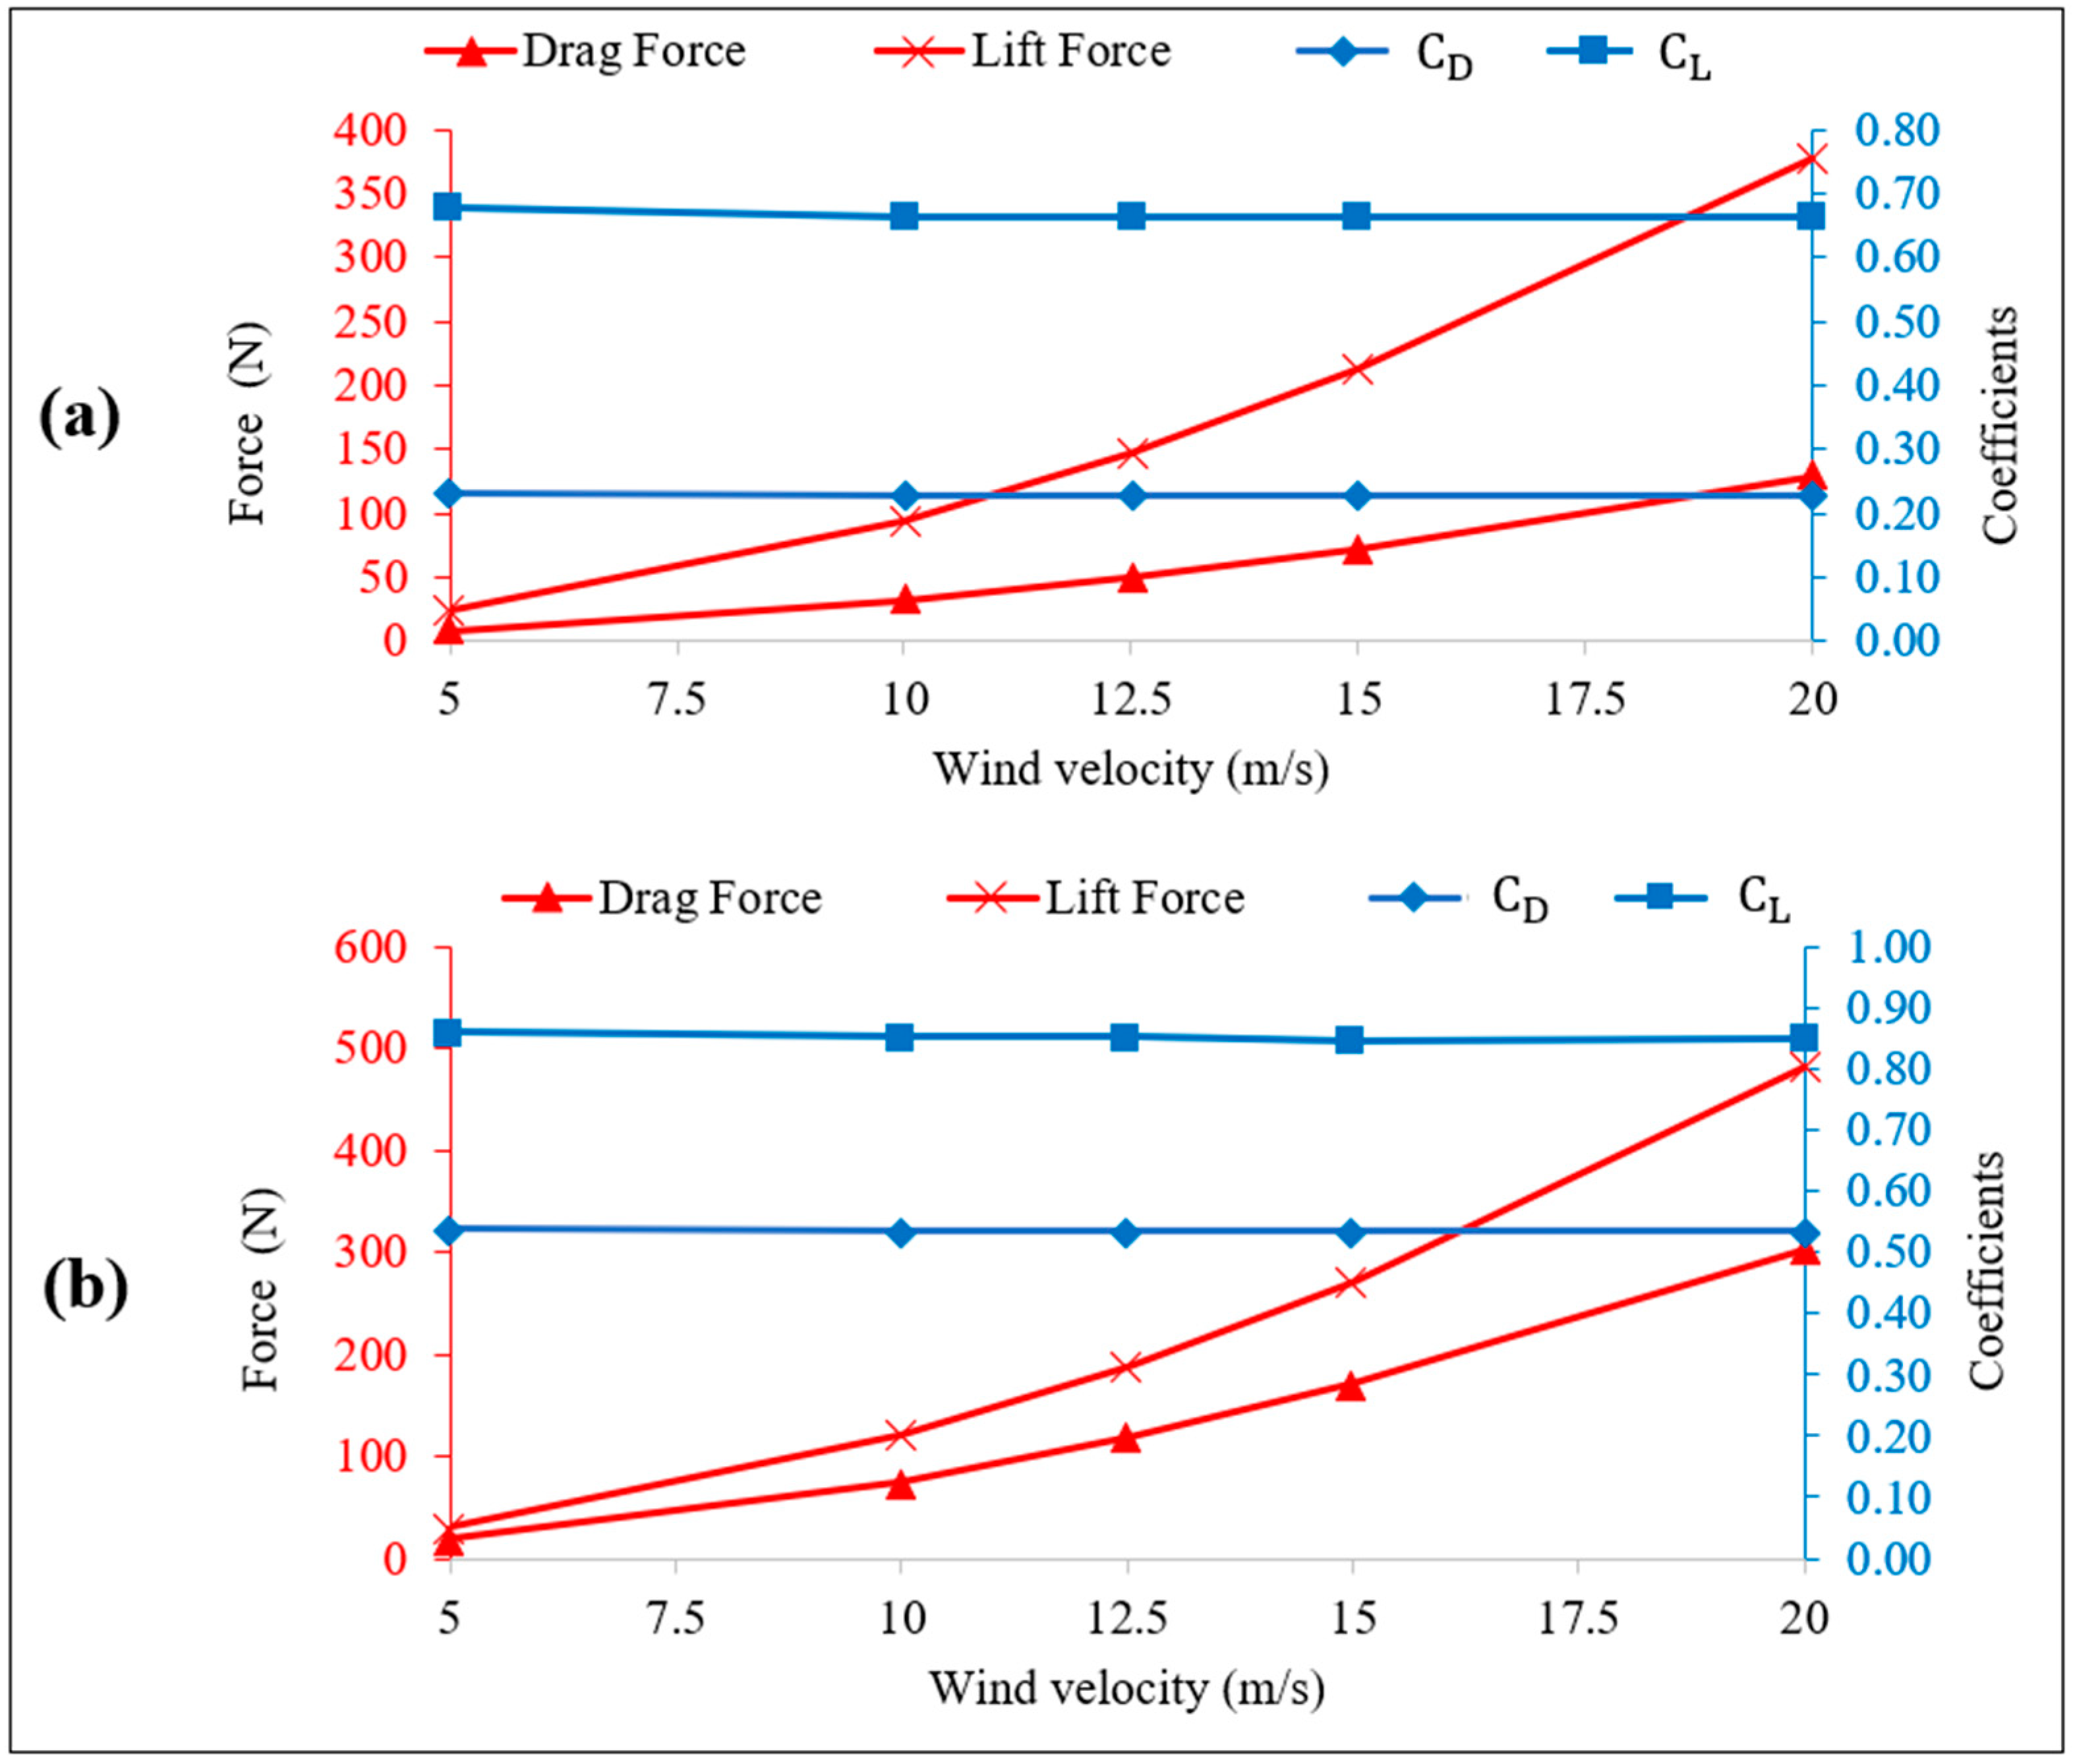
Figure 9a,b illustrate the variations in drag and lift forces, as well as the corresponding drag and lift coefficients, for the full-size panel used in the MSPT. These variations are observed under different wind velocities and at tilt angles of 15 degrees and 30 degrees.
The figures illustrate a consistent trend across different tilt angles, demonstrating that drag and lift forces increase with a quadratic relationship as wind velocities rise. For instance, in
Figure 9a, when the panel was tilted at 15 degrees and exposed to a 10 m/s wind, the drag and lift forces measured 32.8 N and 94.2 N, respectively. Doubling the wind velocity to 20 m/s led to an approximate increase to 128 N (drag force) and 377 N (lift force). Notably, the values of
and
for the 15-degree tilted panel remained nearly constant across different wind velocities, with approximate values of 0.23 and 0.66, respectively.
In
Figure 9b, with the panel tilted at 30 degrees and subjected to a 10 m/s wind, the drag and lift forces were 76 N and 121 N, respectively. Upon increasing the wind velocity to 20 m/s, the corresponding forces were approximately 303 N (drag force) and 483 N (lift force). Remarkably, the values of
and
for the 30-degree tilted panel remained consistent, unaffected by changes in wind velocity, at 0.53 and 0.85, respectively.
4.2. Effect of Tilt Angle
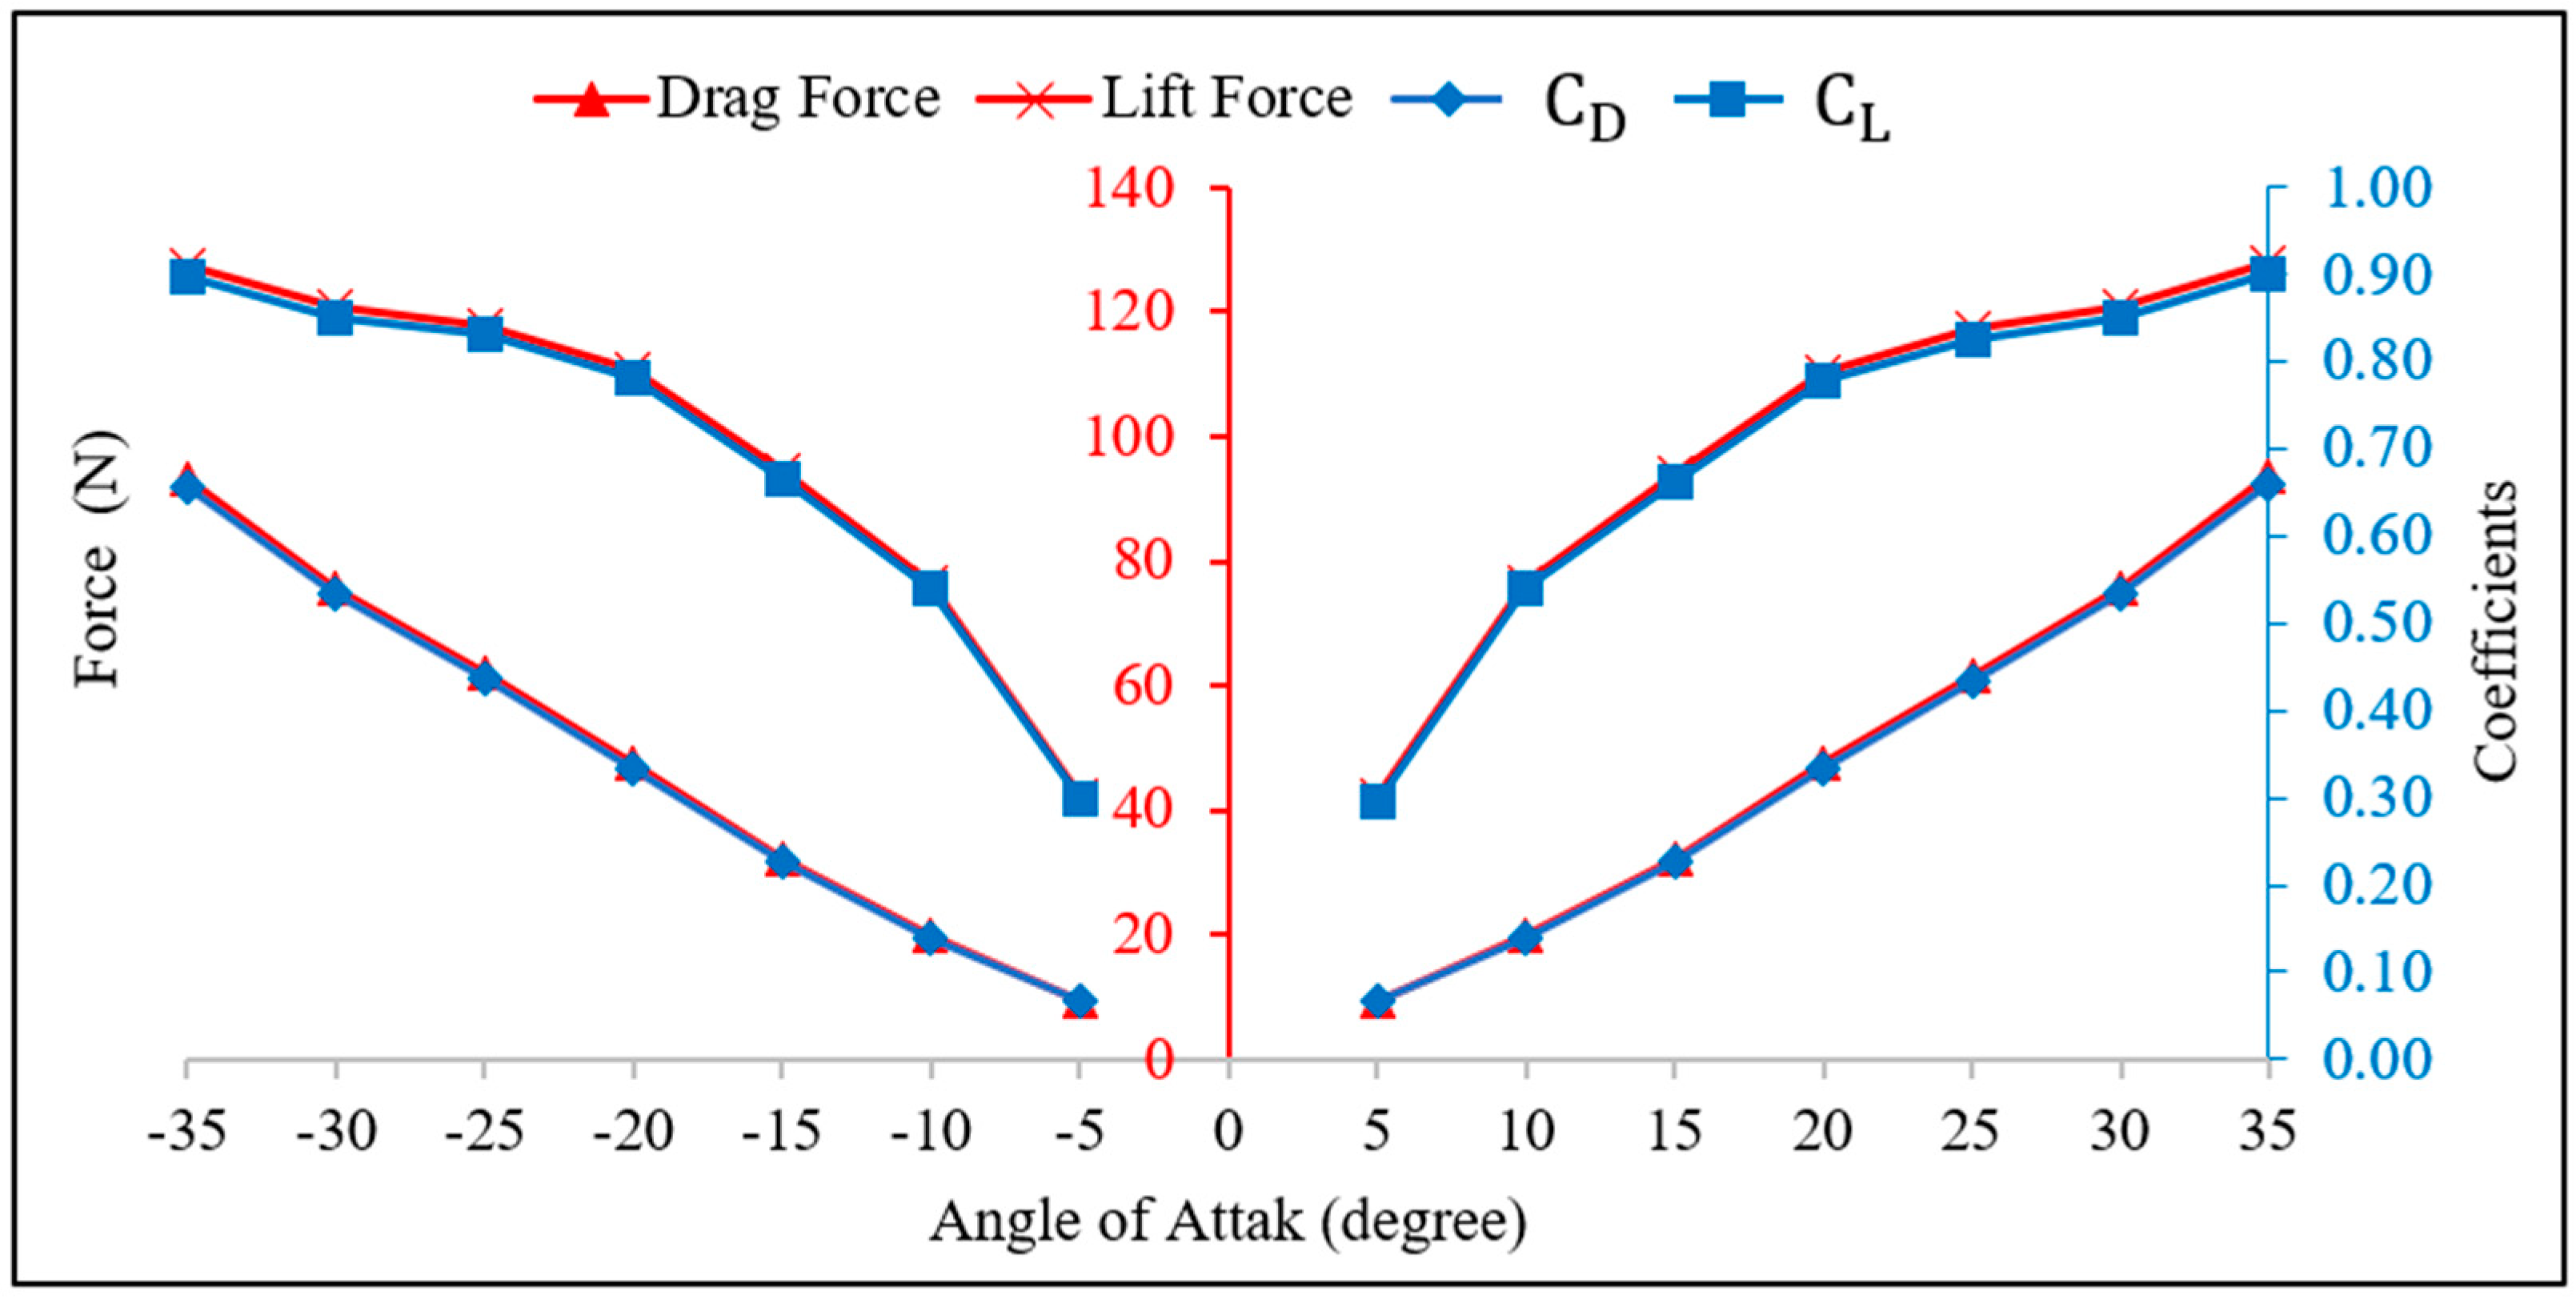
Figure 10 illustrates the variation of drag and lift forces, as well as the corresponding lift and drag coefficients on the full-size panel with an aspect ratio of two (width: 1083 mm, length: 2140 mm) at different tilt angles (-35 to +35 degrees) and with 10 m/s wind velocity. It is evident from
Figure 10 that the trend of drag and lift forces closely follows the trend of the coefficients.
In agreement with previous results of
Figure 6 (representing a panel with a different size and aspect ratio, 0.5), it was apparent from
Figure 10 that the coefficients
and
are not influenced by the direction of the tilt angle. Also, comparing the results from
Figure 10 and
Figure 6, a similar trends were observed with the values of
and
, however, different numerical values were obtained. Consequently, this led to further investigation on the effects of panel size (scaling factor) and panel aspect ratio on the aerodynamic coefficients as discussed in sections 4.3 – 4.4. This further investigation aims to deepening knowledge and understanding of the interaction between the different parameters and the resulting aerodynamic of the panels.
4.3. Effect of Panel Scale Factor
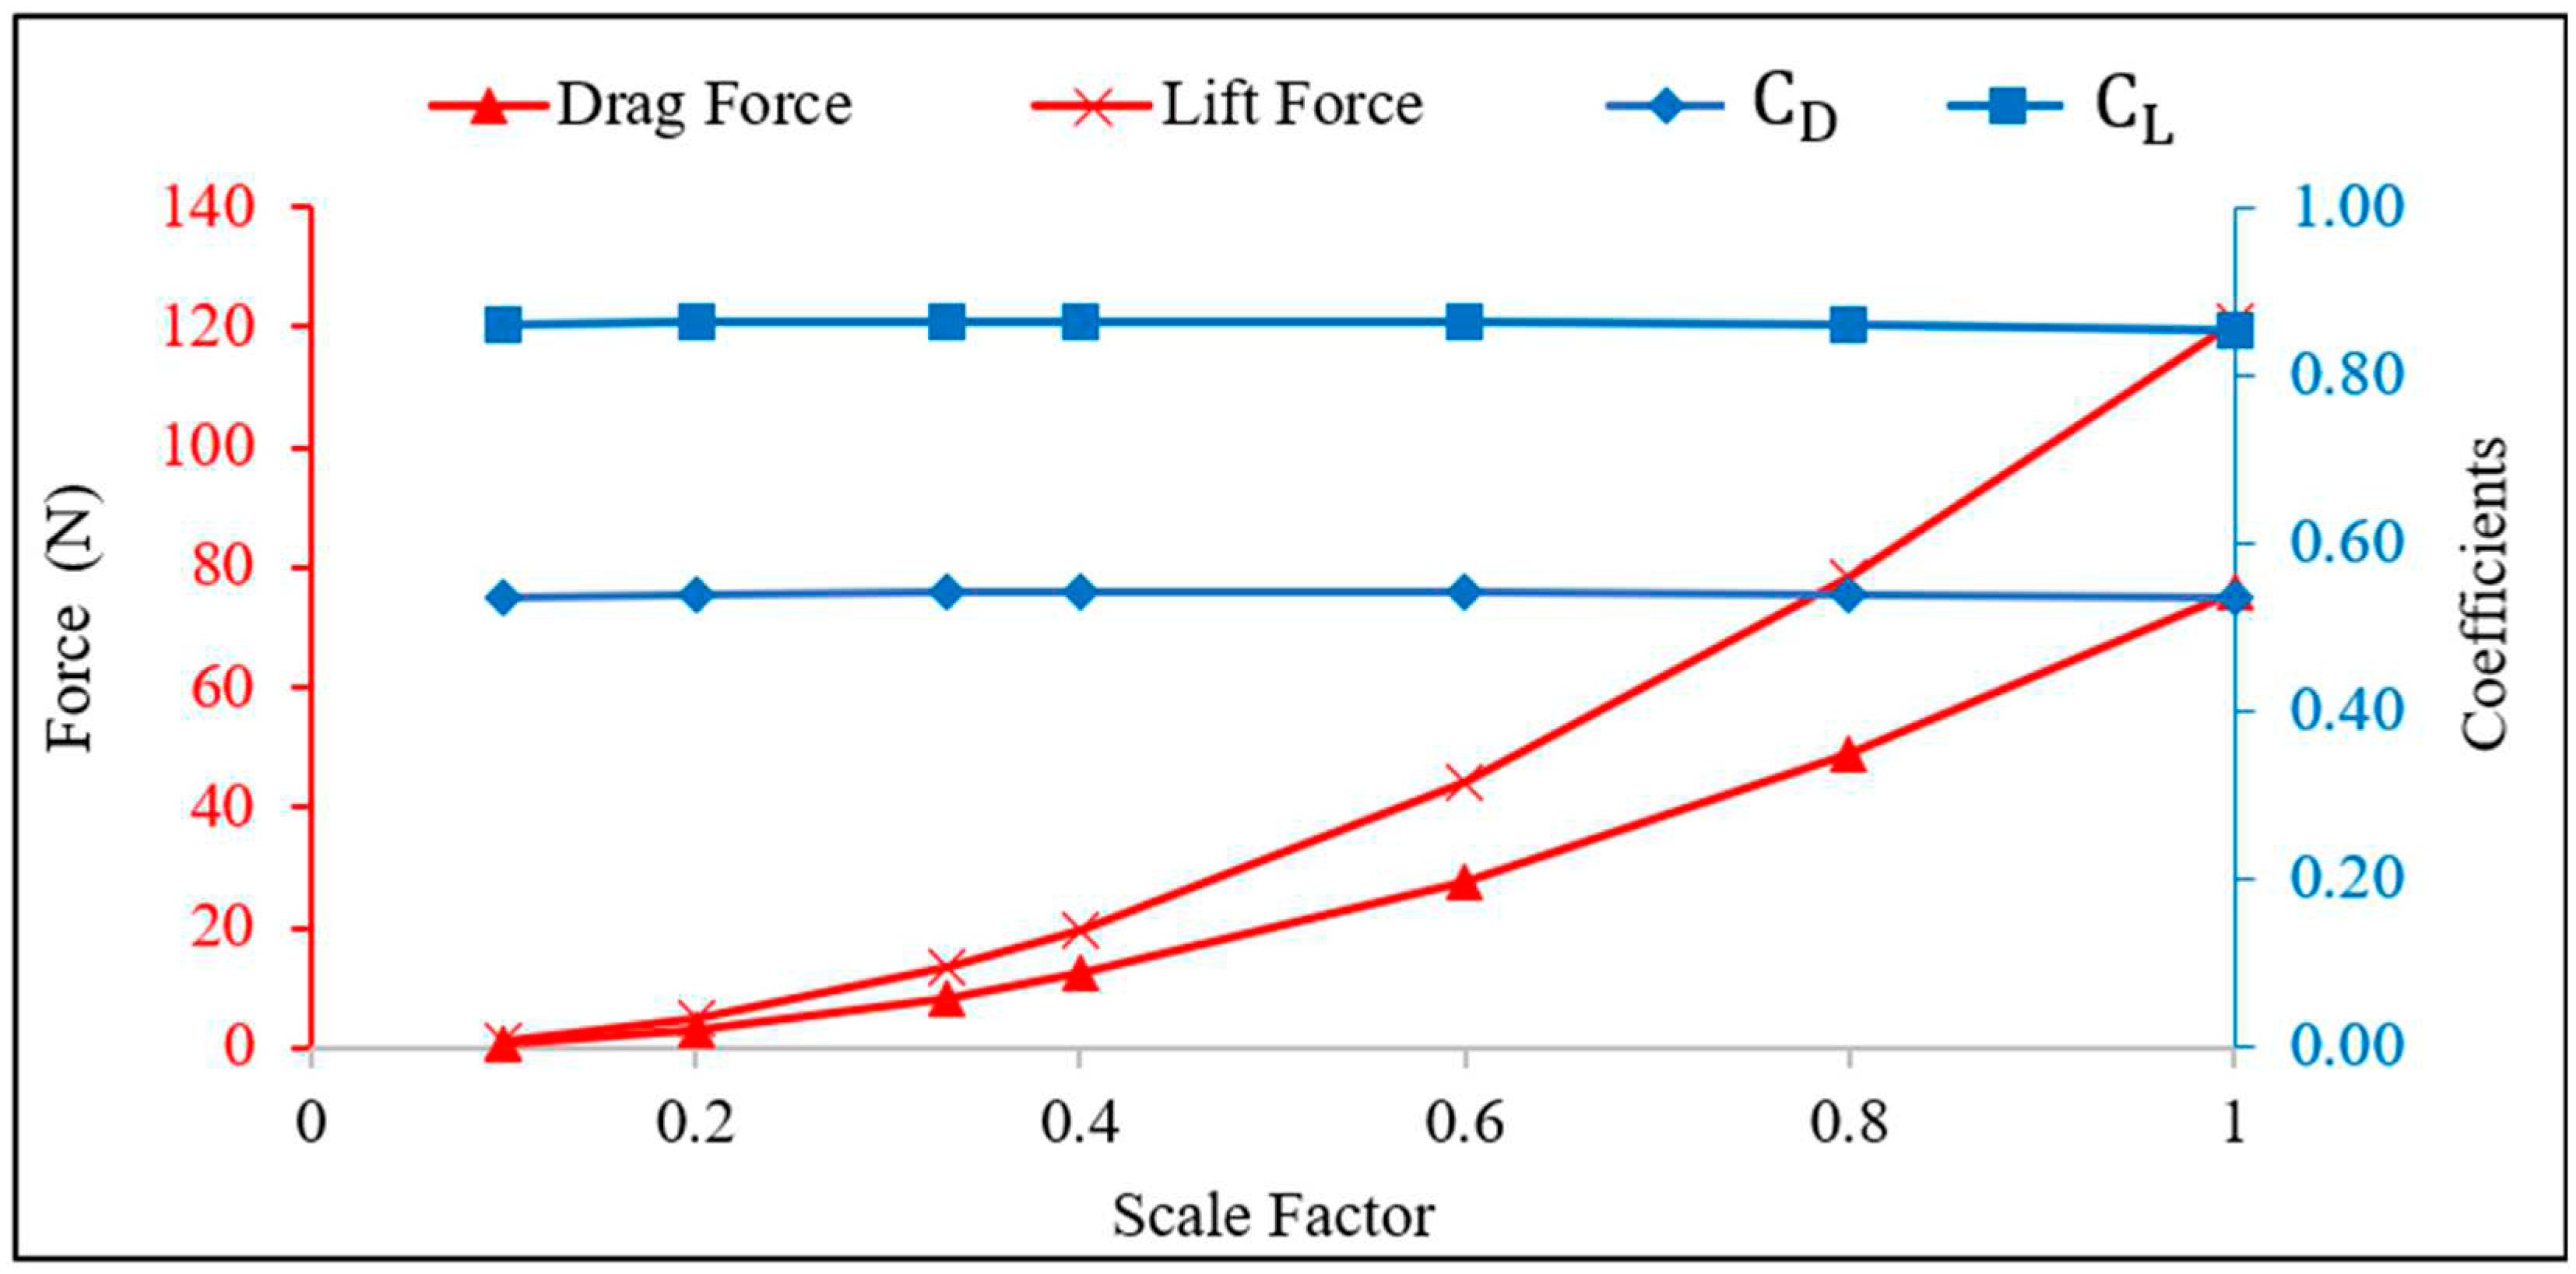
To investigate the impact of panel size on the aerodynamic coefficients of solar PV panels, a further CFD study was conducted on panels with various scaling factors. Specifically, simulations were conducted on the panel with dimensions of 1083 mm in width and 2140 mm in length, tilted at 30 degrees and exposed to a wind velocity of 10 m/s, with the scaling factors ranging from 0.1 to 1. The results of the findings in
Figure 11 show the trends of the forces and coefficients for different scaling factors and, indicate that, as the scaling factor decreases and the panel size reduces, the drag and lift forces decrease significantly. This decrease may be attributed to the reduced surface area of the panel that was exposed to the wind. However, the results show that the corresponding coefficients,
and
, do not exhibit pronounced changes with varying panel size. These coefficients remain almost constant, indicating that they are not influenced by panel scaling factor.
4.4. Effect of Panel Aspect Ratio
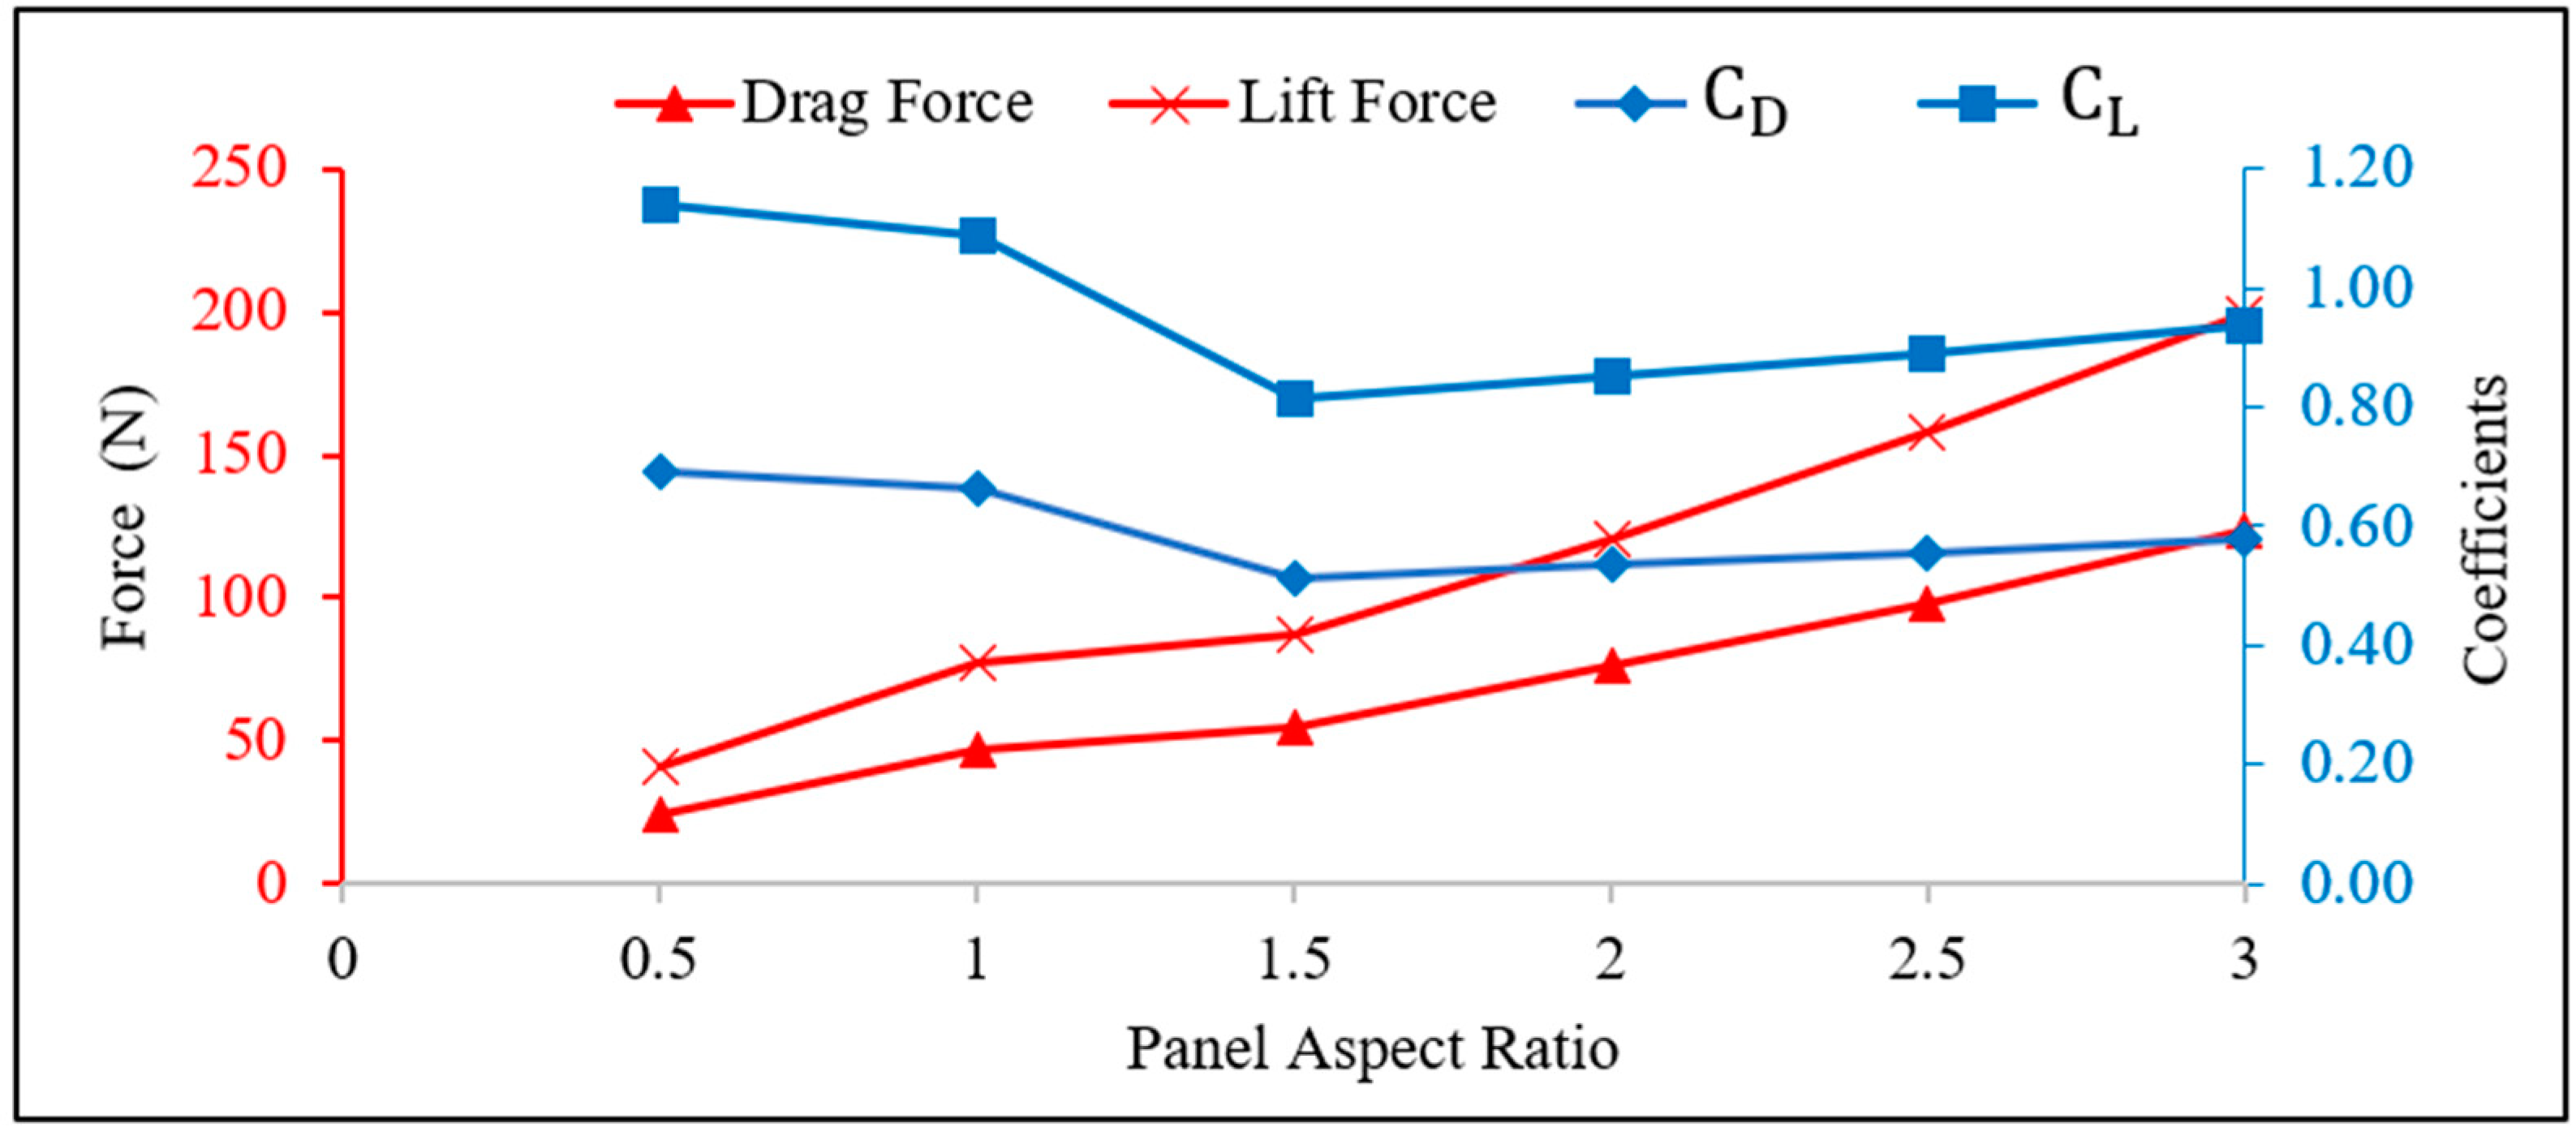
Figure 12 presents the variation of drag and lift forces, and their corresponding coefficients for panels with different aspect ratios between 0.5 to 3. These panels, tilted at 30 degrees and exposed to a wind velocity of 10 m/s, have a fixed width of 1083 mm, while the length ranges from 541 mm to 3249 mm. The findings from the results shown in
Figure 12 reveal that panels with aspect ratios less than 1.5 exhibit higher values of
and
compared to panels with higher aspect ratios. For example, the values of
and
are 1.15 and 0.69, respectively, for the panel with an aspect ratio of 0.5. The results also show a steady increase in lift and drag coefficients with the aspect ratios greater than 1.5, with the values of CD and CL ranges from 0.51 – 0.58 and 0.81 – 0.93 respectively. The observed differences in the values of
and
can be attributed to the influence of the panel aspect ratio on the aerodynamics of the panel.
4.5. Aerodynamic of MSPT
A full-scale representation of the MSPT as illustrated in
Figure 2 for the fabricated prototype, consisting of nine panels tilted at a constant angle of 30 degrees, was modelled following the previous simulation set-up outlined in section 3. However, symmetry boundary condition was not applied to the MSPT due to inherent asymmetries in the middle of the system. The dimensions of the MSPT, denoted as
and
, are 3612 mm and 6614 mm, respectively. Additionally, the dimensions of the corresponding simulation domain, encompassing
,
, H, and B, are 15500 mm, 7250 mm, 5418 mm, and 13228 mm, respectively.
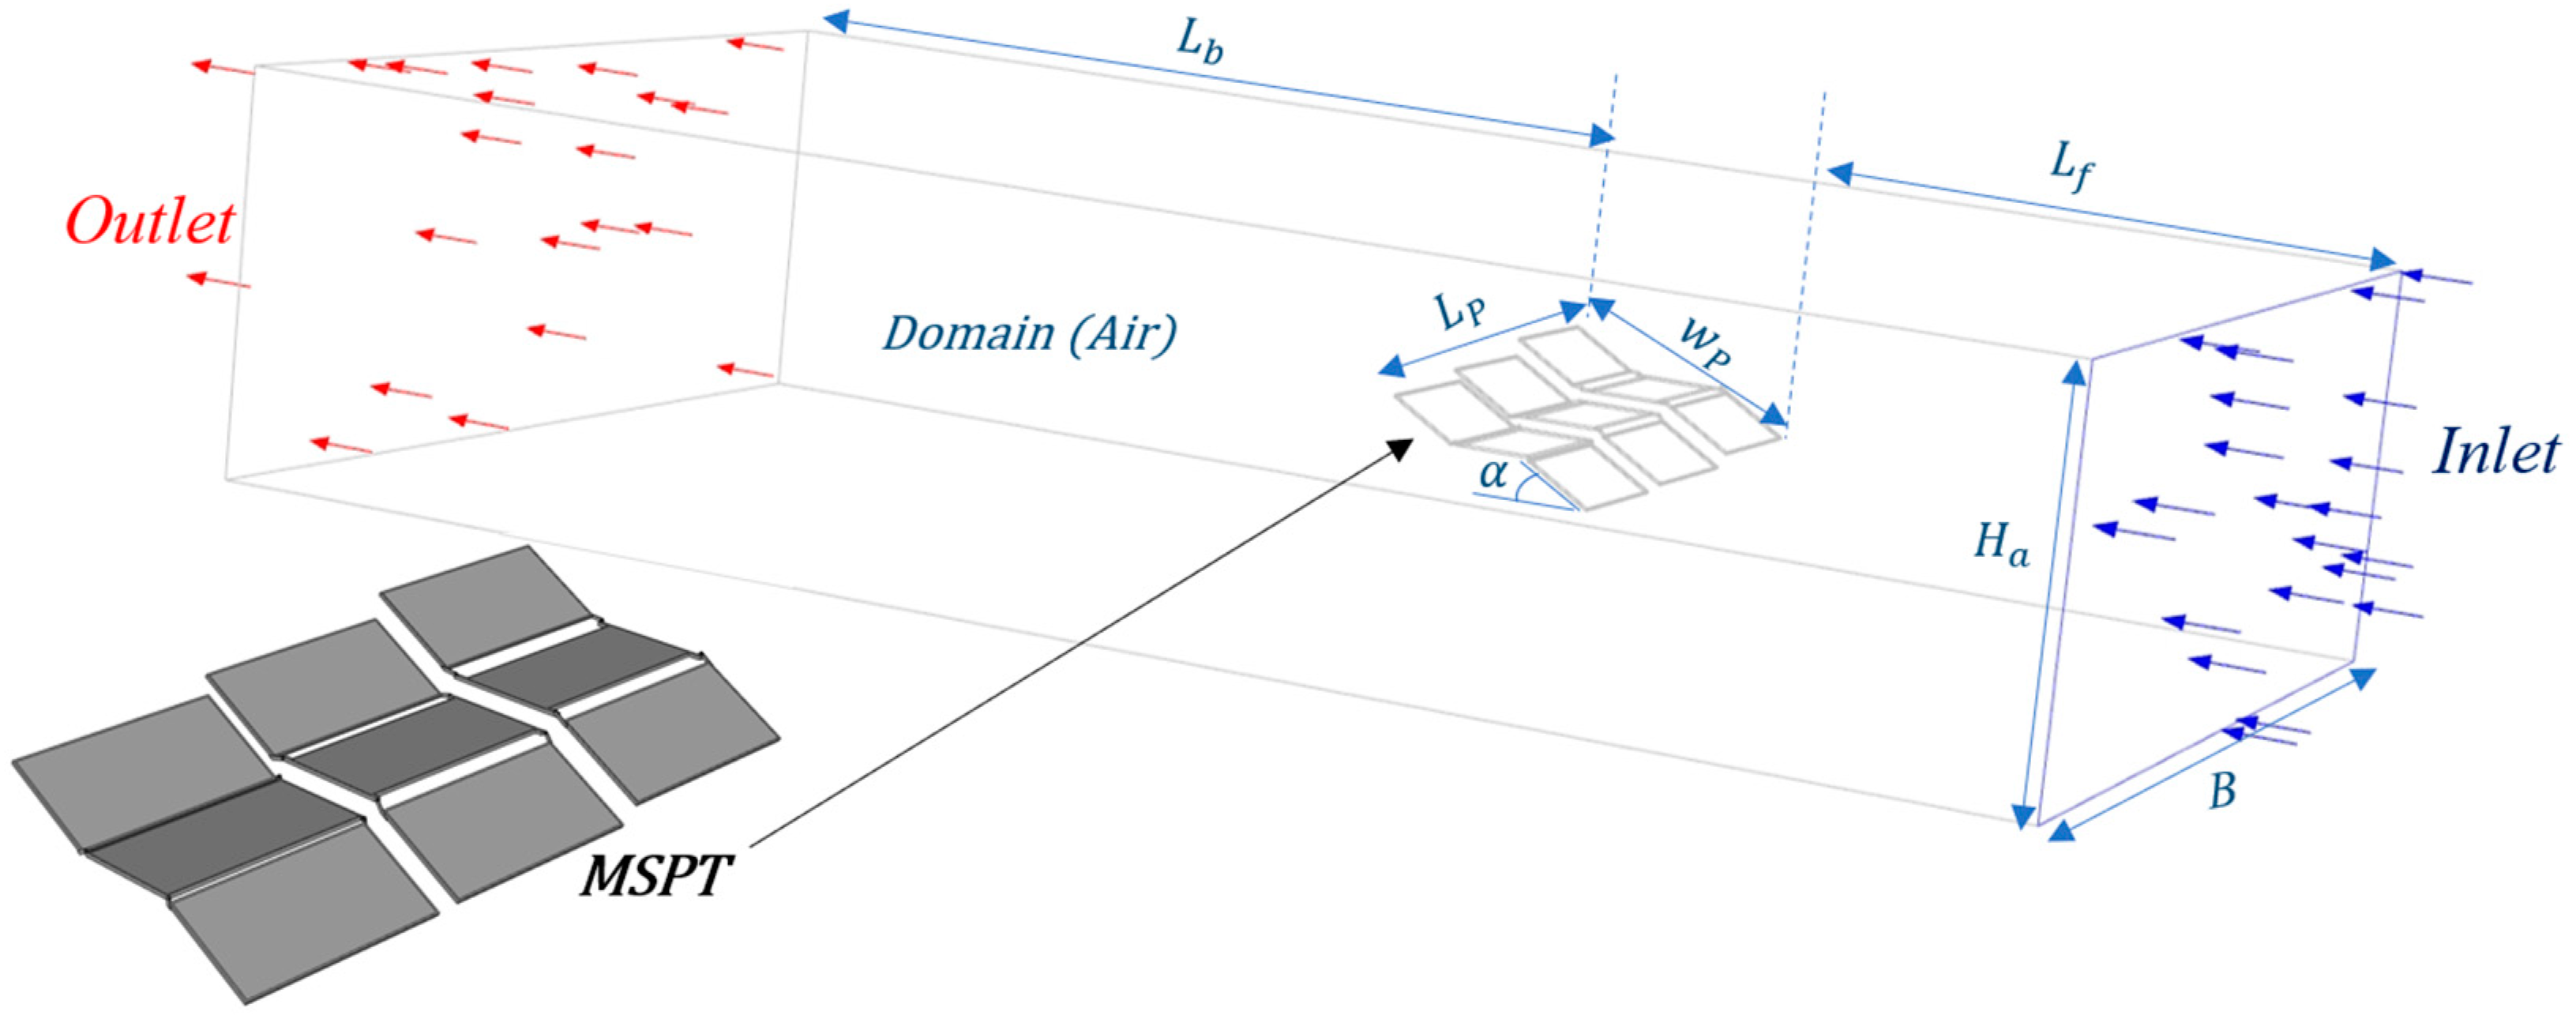
Figure 13 provides a 3D representation of the computational domain including the boundary conditions of the CFD model for the MSPT.
A wind velocity of 10 m/s was employed, as detailed in Section 3.1.2. However, to offer a more comprehensive understanding of the aerodynamic performance of the MSPT, more rigorous parametric studies were explored with wind velocities of 15 m/s and 20 m/s.
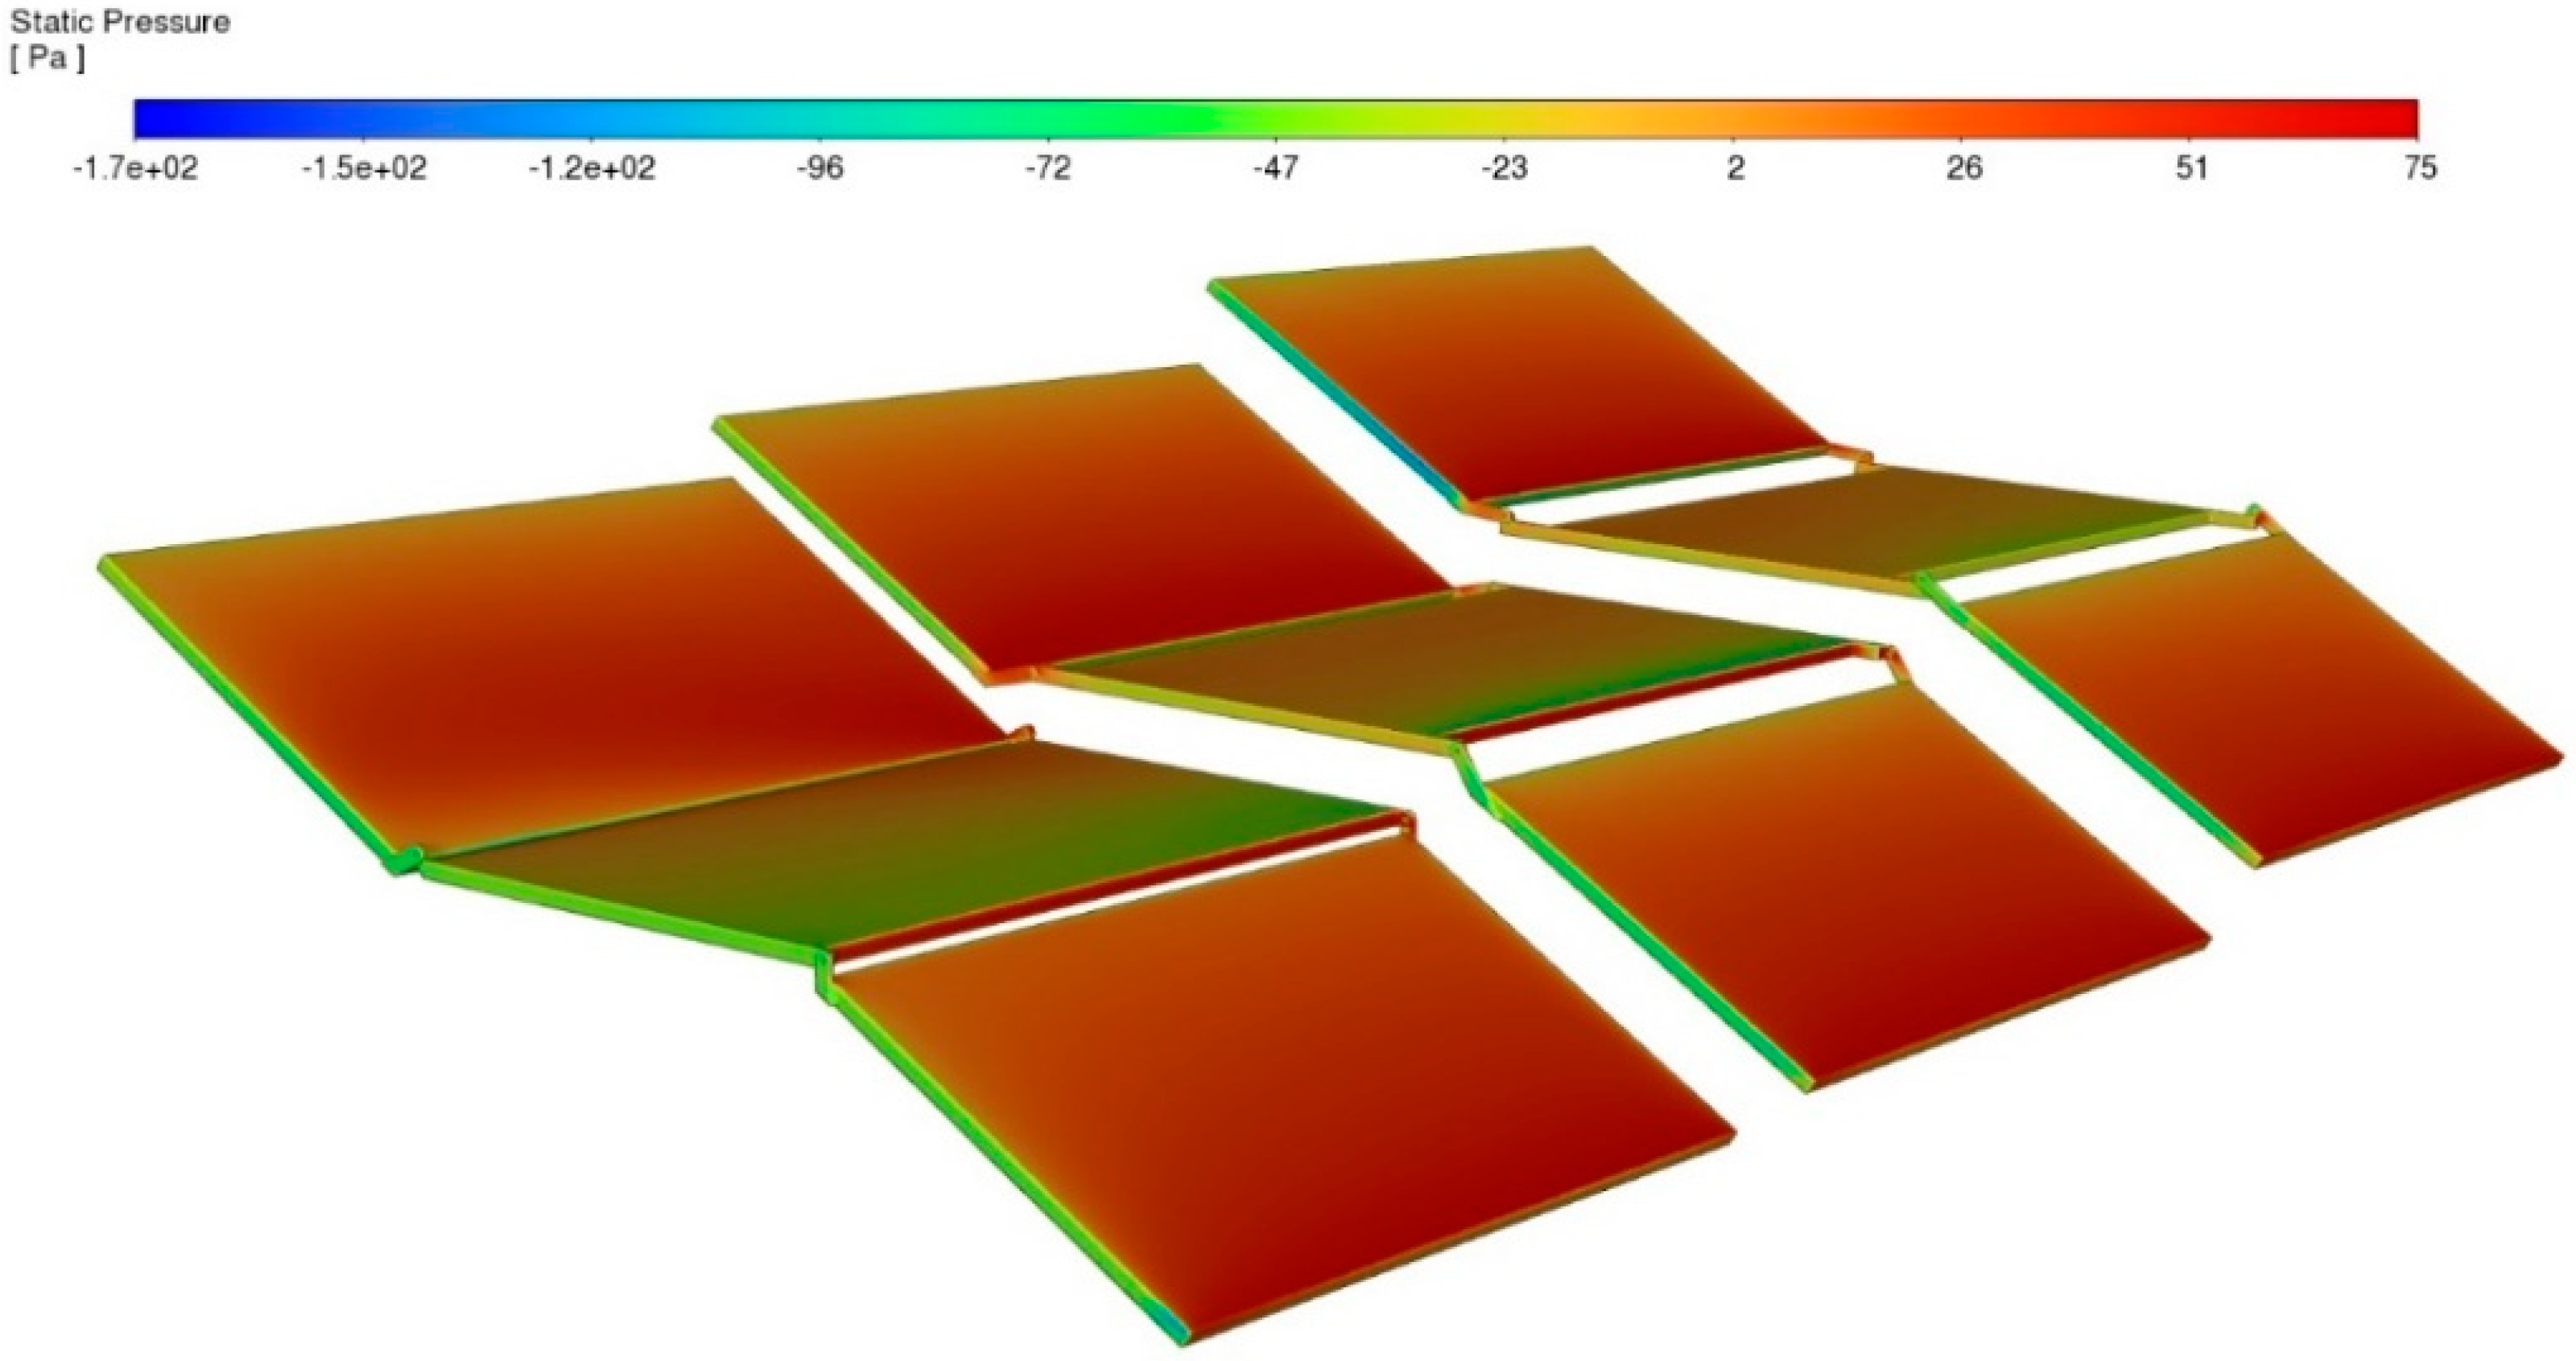
Figure 14 and
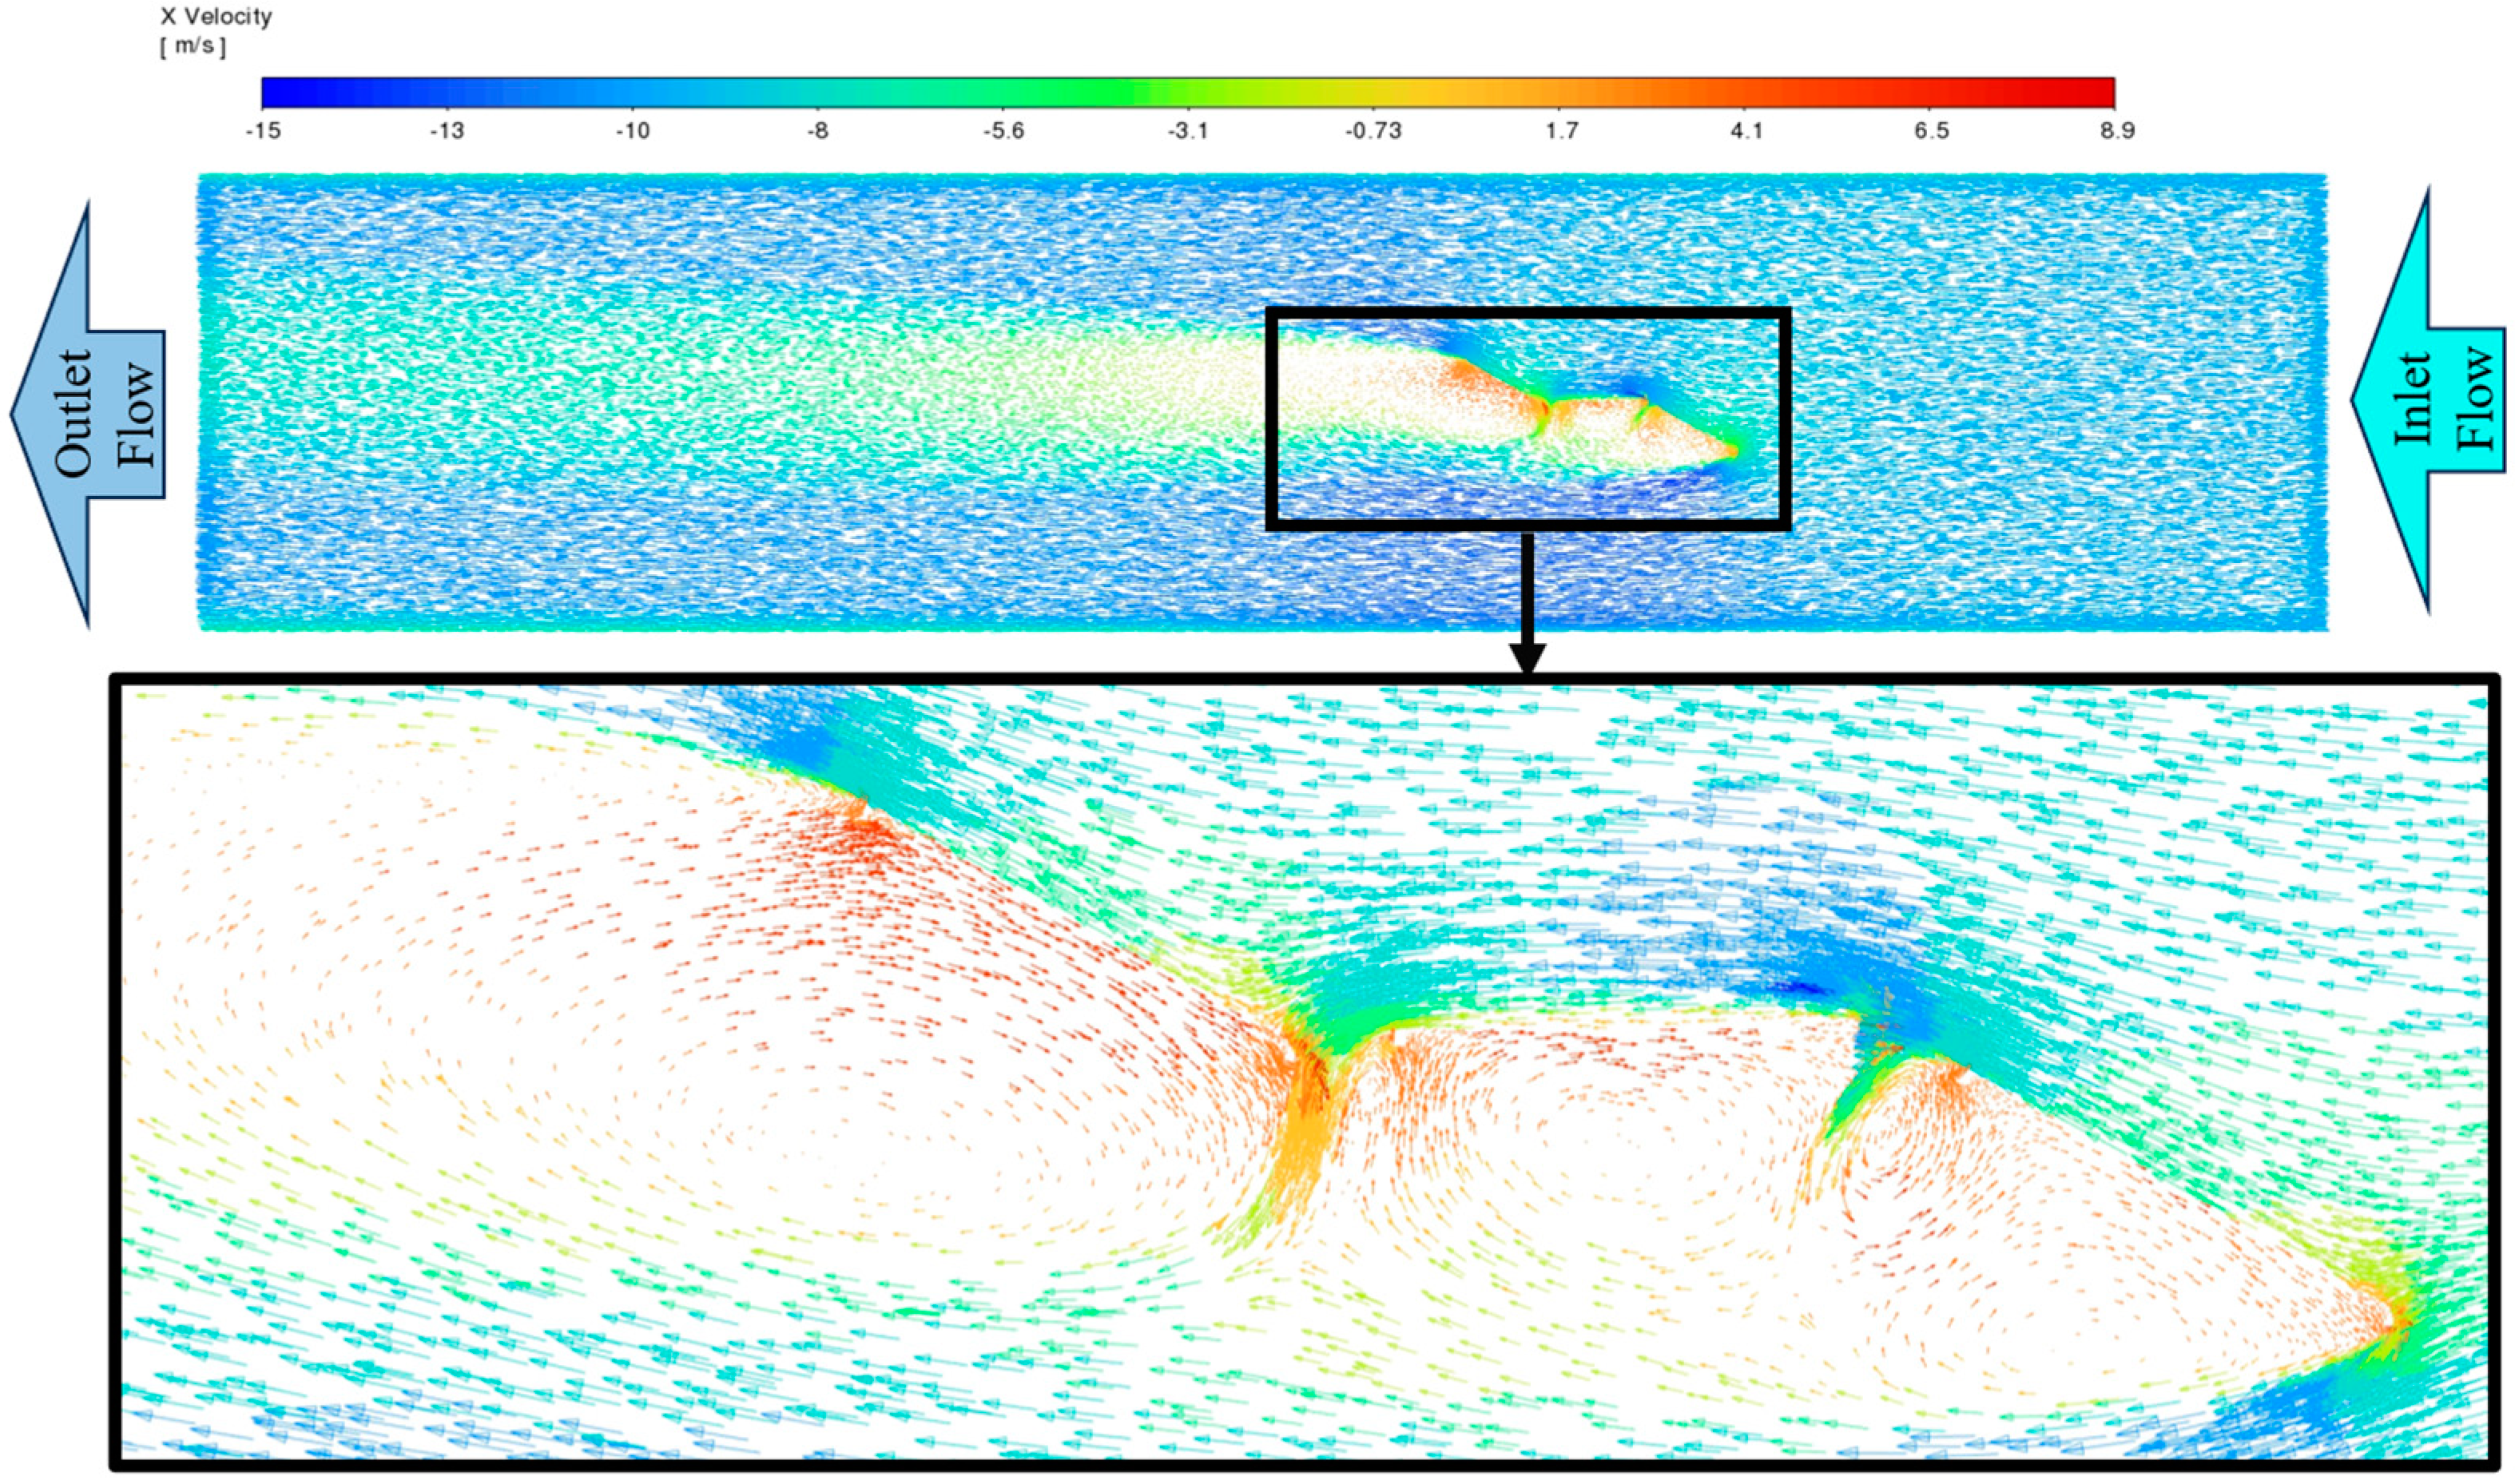
Figure 15 show respectively, the static pressure contour of the panels in the MSPT (tilted at 30 degrees), and the vector contour of flow velocity in the x direction (inlet to outlet) at the mid-section of the MSPT. The result in
Figure 14 show that the bottom of the tilted panels experiences the maximum static pressure as the air flows over the entire MSPT, while the middle panels with no tilt angle exhibit minimum pressure.
Furthermore, as depicted in
Figure 15, flow separation led to a higher velocity magnitude, reaching up to 7.2 m/s compared to the inlet flow. Simultaneously, the back of the panels exhibited a suction flow with a maximum velocity of 6.2 m/s in the opposite direction to the inlet flow.
A comparison between
Figure 15 and
Figure 8, reveals that the magnitude of the suction flow velocity around the MSPT is almost 62% higher compared to the individual panel. Also, comparing the results from
Figure 14 and
Figure 7, the suction pressure occurred at the back of panels in MSPT are approximately 22% greater than that of a single panel. These observed differences may be attributed to the presence of gaps between panels in the MSPT, leading to an increase in turbulence.
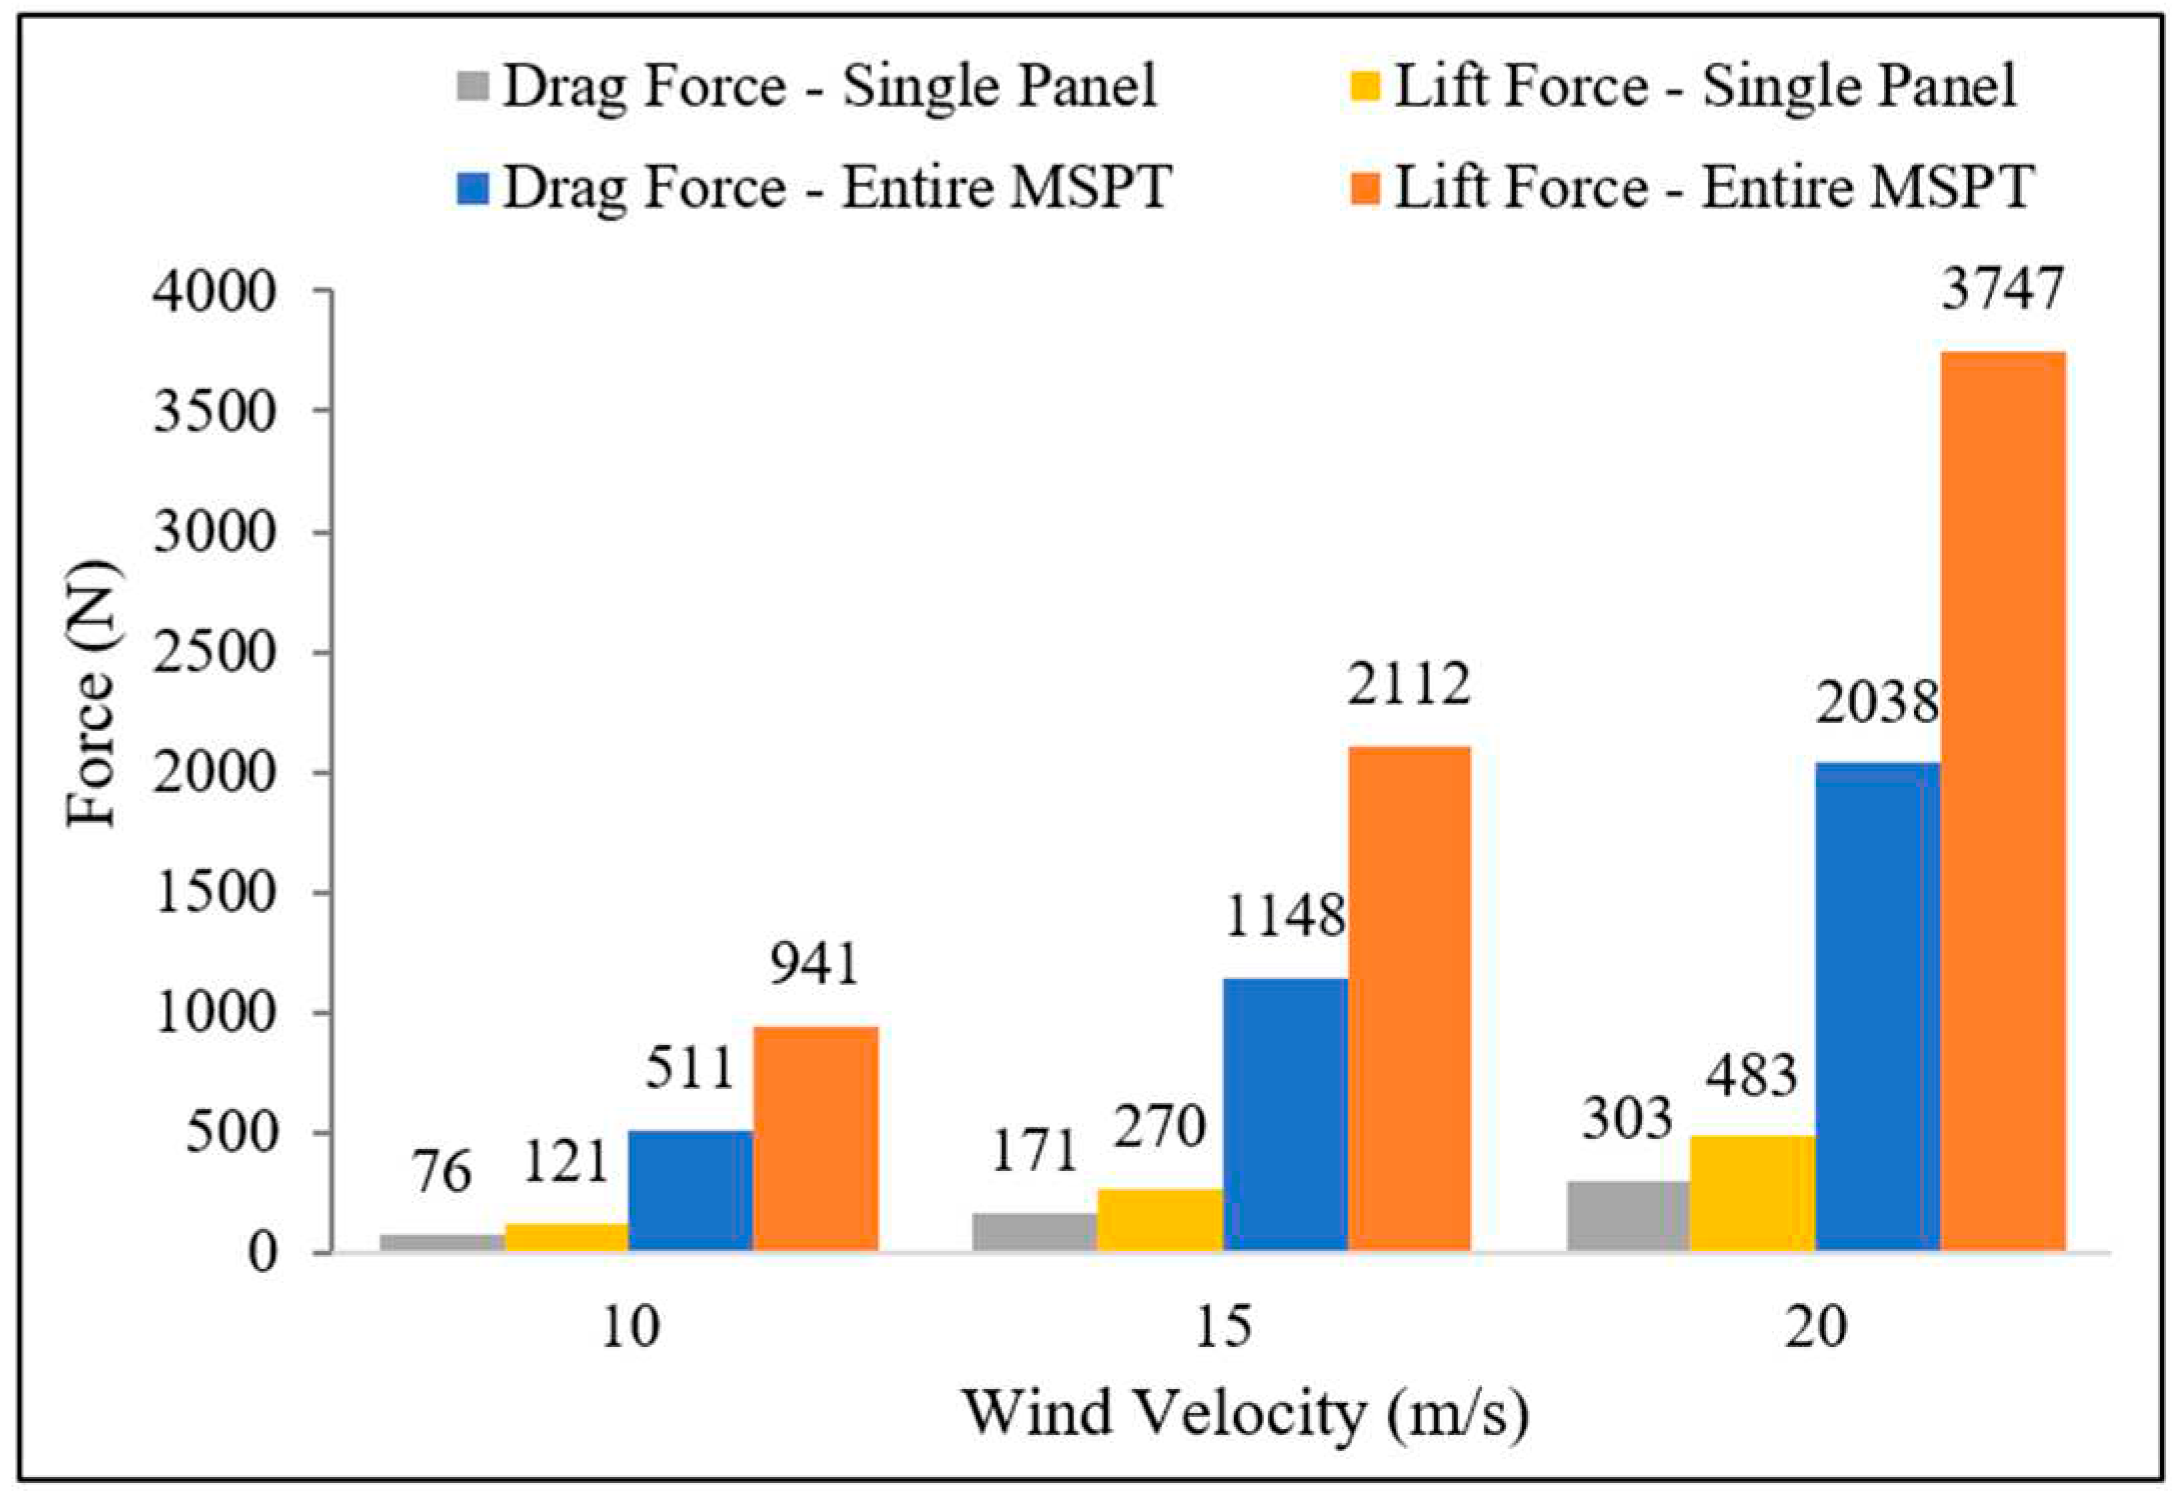
Figure 16 illustrates the drag and lift forces on the entire MSPT and the single panel under varying wind velocities. The drag and lift forces on the entire MSPT under a wind velocity of 10 m/s were found to be 511 N and 941 N, respectively. The data indicates that the drag and lift forces at a wind velocity of 20 m/s are slightly more than four times greater than the corresponding forces at a wind velocity of 10 m/s.
Figure 16 also shows the drag and lift forces on the entire MSPT under different wind velocities to be approximately 6.7 and 7.8 times greater than the corresponding forces on a single panel with a 30-degree tilt angle used in the MSPT.
Utilizing equations 1 and 2, and considering the total area of the 9 panels in the MSPT as 20.85 m2, an air density of 1.22 kg/m3, the drag and lift coefficients for the entire MSPT, considering all three investigated wind velocities, were determined to be 0.40 and 0.74, respectively. It's important to note that these coefficients remained consistent and were not influenced by changes in wind velocity. As discussed in section 4.1, it's noteworthy that for a single panel with a tilt angle of 30 degrees, the drag and lift coefficients were determined to be 0.53 and 0.85, respectively. This implies that simple superposition assumptions, such as considering nine or six times the forces on a single panel (accounting for the 9 panels, with 6 tilted at 30 degrees), does not provide sufficient accuracy for determining the aerodynamic forces on the entire MSPT.
5. Conclusion
Mobile solar PV systems were increasingly recognized as crucial solutions for clean and renewable energy, especially in off-grid areas. This study employed numerical and experimental techniques to scrutinize the aerodynamic characteristics of an innovatively designed MSPT system, featuring nine large solar PV panels.
The focus was on an average wind velocity of 10 m/s, reflective of Sub-Sharan Africa, specifically Nigeria's annual wind speeds. The investigation explored the impacts of wind velocity and tilt angles on drag and lift forces. The primary comparative parameters for aerodynamic analysis were the lift and drag coefficients ( and ). Employing ANSYS-Fluent software, the simulations were validated through experimental tests on a 1:15 scaled-down model. Additionally, the study validated the numerical approach by comparing the results with documented cases of a solar PV panel found in the literature.
The results across all studied scenarios indicated that aerodynamic coefficients remained unaffected by wind direction, whether the wind approach the solar panel from the front or back side. The CFD analysis on a single full-size panel in the MSPT revealed a nonlinear increase in drag and lift forces with higher wind velocities. Scaling down the panels showed a significant decrease in forces due to reduced wind exposure, following a power-law relationship. However, lift and drag coefficients exhibited minimal changes with varying panel size. Panels with aspect ratios below 1.5 demonstrated higher and values compared to those with higher aspect ratios.
Examining the overall wind force on the entire MSPT accounted for combined wind flow and system geometry effects. The CFD results indicated increased turbulence caused by gaps between panels, leading to almost 62% higher suction flow velocity and 22% higher suction pressure compared to a single panel. Furthermore, drag and lift forces on the entire MSPT were approximately 6.7 and 7.8 times greater than those on a single panel with the same 30-degree tilt angle. The corresponding drag and lift coefficients for the entire MSPT were found to be 0.40 and 0.74, respectively, while for a single panel tilted at 30 degrees, the values of and were 0.53 and 0.85, respectively. It is clear from this current study that, simple superposition assumptions, considering multiple times the forces on a single panel, may not accurately predict the aerodynamic forces on the entire MSPT. Therefore, a further aerodynamic investigation is recommended to determine the wind effects more accurately on the entire system.
In conclusion, this study provided significant insights into the aerodynamic behaviour of mobile solar PV systems, facilitating a comprehensive understanding of their performance under diverse wind conditions. These findings would be vital for optimizing the design and operation of such systems, ultimately enhancing their efficiency and reliability. The integration of CFD simulations and experimental validation contributed to the knowledge in the field, opening avenues for further advancements in mobile solar PV technology.
Author Contributions
Conceptualization, A.E.M., F.T.-M and D.S.A.; methodology, A.E.M. and D.S.A..; investigation, A.E.M. and D.S.A..; resources, A.E.M., D.S.A and F.T.-M.; data curation, A.E.M., F.T.-M., D.S.A., N.N.E., J.W., D. N. and Z.M.; writing—original draft preparation, A.E.M., F.T.-M. and D.S.A.; writing—review and editing, A.E.M., F.T.-M., D.S.A., N.N.E., J.W., D. N. and Z.M. ; visualization, A.E.M., F.T.-M., D.S.A., N.N.E., J.W., D. N. and Z.M..; supervision, F.T.-M., D.S.A and N.N.E.; project administration, F.T.-M. and D.S.A.; funding acquisition, F.T.-M. and D.S.A. All authors have read and agreed to the published version of the manuscript.
Funding
This work was funded by the INNOVATE UK project No: 833831 and partially supported by the ReACTIVE Too project that has received funding from the European Union’s Horizon 2020 Research, Innovation and Staff Exchange Programme under the Marie Skłodowska-Curie Action (Grant Agreement No. 871163).
Acknowledgments
The authors would also like to acknowledge the support of Paul Bates and George Dye for building the sample for the test.
Conflicts of Interest
The authors declare no conflicts of interest. The funders had no role in the design of the study; in the collection, analyses, or interpretation of data; in the writing of the manuscript; or in the decision to publish the results.
References
- Jacobson, M.Z.; Delucchi, M.A.; Bauer, Z.A.F.; Goodman, S.C.; Chapman, W.E.; Came7ron, M.A.; Bozonnat, C.; Chobadi, L.; Clonts, H.A.; Enevoldsen, P.; et al. 100% Clean and Renewable Wind, Water, and Sunlight All-Sector Energy Roadmaps for 139 Countries of the World. Joule 2017, 1, 108–121. [Google Scholar] [CrossRef]
- Yemenici, O.; Aksoy, M.O. An Experimental and Numerical Study of Wind Effects on a Ground-Mounted Solar Panel at Different Panel Tilt Angles and Wind Directions. Journal of Wind Engineering and Industrial Aerodynamics 2021, 213, 104630. [Google Scholar] [CrossRef]
- Peng, H.Y.; Dai, S.F.; Liu, H.J. Wind Loading Characteristics and Roof Zoning of Solar Arrays Mounted on Flat-Roofed Tall Buildings. Journal of Building Engineering 2023, 66, 105823. [Google Scholar] [CrossRef]
- Stathopoulos, T.; Zisis, I.; Xypnitou, E. Local and Overall Wind Pressure and Force Coefficients for Solar Panels. Journal of Wind Engineering and Industrial Aerodynamics 2014, 125, 195–206. [Google Scholar] [CrossRef]
- Su, K.-C.; Chung, P.-H.; Yang, R.-Y. Numerical Simulation of Wind Loads on An Offshore PV Panel: The Effect of Wave Angle. Journal of Mechanics 2020, 37, 53–62. [Google Scholar] [CrossRef]
- You, J.; Lim, M.; You, K.; Lee, C. Wind Coefficient Distribution of Arranged Ground Photovoltaic Panels. Sustainability 2021, 13, 3944. [Google Scholar] [CrossRef]
- Browne, M.T.L.; Taylor, Z.J.; Li, S.; Gamble, S. A Wind Load Design Method for Ground-Mounted Multi-Row Solar Arrays Based on a Compilation of Wind Tunnel Experiments. Journal of Wind Engineering and Industrial Aerodynamics 2020, 205, 104294. [Google Scholar] [CrossRef]
- International Code Council (ICC). 2021 International Building Code (IBC); International Code Council, INC: Country Club Hills, 2022. [Google Scholar]
- American Society of Civil Engineers. Minimum Design Loads and Associated Criteria for Buildings and Other Structures; American Society of Civil Engineers: Reston, VA, 2021; ISBN 9780784415788. [Google Scholar]
- Naeiji, A.; Raji, F.; Zisis, I. Wind Loads on Residential Scale Rooftop Photovoltaic Panels. Journal of Wind Engineering and Industrial Aerodynamics 2017, 168, 228–246. [Google Scholar] [CrossRef]
- Stenabaugh, S.E.; Iida, Y.; Kopp, G.A.; Karava, P. Wind Loads on Photovoltaic Arrays Mounted Parallel to Sloped Roofs on Low-Rise Buildings. Journal of Wind Engineering and Industrial Aerodynamics 2015, 139, 16–26. [Google Scholar] [CrossRef]
- Wang, Z.Y.; Plate, E.J.; Rau, M.; Keiser, R. Scale Effects in Wind Tunnel Modelling. Journal of Wind Engineering and Industrial Aerodynamics 1996, 61, 113–130. [Google Scholar] [CrossRef]
- Aly, A.M.; Bitsuamlak, G. Aerodynamics of Ground-Mounted Solar Panels: Test Model Scale Effects. Journal of Wind Engineering and Industrial Aerodynamics 2013, 123, 250–260. [Google Scholar] [CrossRef]
- Khan, A.K.; Shah, T.R.; Khosa, A.A.; Ali, H.M. Evaluation of Wind Load Effects on Solar Panel Support Frame: A Numerical Study. Eng Anal Bound Elem 2023, 153, 88–101. [Google Scholar] [CrossRef]
- Wittwer, A.R.; Podestá, J.M.; Castro, H.G.; Mroginski, J.L.; Marighetti, J.O.; De Bortoli, M.E.; Paz, R.R.; Mateo, F. Wind Loading and Its Effects on Photovoltaic Modules: An Experimental–Computational Study to Assess the Stress on Structures. Solar Energy 2022, 240, 315–328. [Google Scholar] [CrossRef]
- Adaramola, M.S.; Oyewola, O.M. On Wind Speed Pattern and Energy Potential in Nigeria. Energy Policy 2011, 39, 2501–2506. [Google Scholar] [CrossRef]
- Gesto NIGERIA RE PROJECTS: SOLAR AND WIND POTENTIAL EVALUATION Available online:. Available online: https://gestoenergy.com/nigeria-re-projects-solar-and-wind-potential-evaluation (accessed on 13 August 2023).
- Giorges, A.T.G.; Amador, G.J.; Caravati, K.; Goodman, J. Numerical Simulation of Aerodynamic Force on Solar Panels. In Proceedings of the Volume 6A: Energy; American Society of Mechanical Engineers, November 15 2013. [Google Scholar]
- Versteeg, H.K.; Malalasekera, W. An Introduction to Computational Fluid Dynamics:The Finite Volume Method, 2nd ed.; Pearson Prentice Hall: Essex, UK, 2007. [Google Scholar]
- Anderson, John.D. Computational Fluid Dynamics: The Basics with Application; McGraw-Hill: NewYork, NY, USA, 1995. [Google Scholar]
- Chorin, A.J. Numerical Solution of the Navier-Stokes Equations. Math Comput 1968, 22, 745–762. [Google Scholar] [CrossRef]
- ANSYS Inc. ANSYS Fluent 2022 R2, Computer Software. ANSYS Inc., Canonsburg. 2022. [Google Scholar]
- Fogaing, M.B.T.; Hemmati, A.; Lange, C.F.; Fleck, B.A. Performance of Turbulence Models in Simulating Wind Loads on Photovoltaics Modules. Energies (Basel) 2019, 12, 3290. [Google Scholar] [CrossRef]
- Wu, M.; Zhou, X. Study on Simulation of Wind Load Characteristics for Photovoltaic Generation Systems. Vibroengineering PROCEDIA 2020, 33, 107–112. [Google Scholar] [CrossRef]
- Su, K.-C.; Chung, K.-M.; Hsu, S.-T. Numerical Simulation of Wind Loads on Solar Panels. Modern Physics Letters B 2018, 32, 1840009. [Google Scholar] [CrossRef]
- Hoerner, S.F. Fluid-Dynamic Drag; Bakersfield, CA 93390, 1965. [Google Scholar]
Figure 1.
Solar PV panel sample examined in the wind tunnel.
Figure 1.
Solar PV panel sample examined in the wind tunnel.
Figure 2.
Unfolded state of the MSPT with six panels (top and bottom) tilted at 30 degrees.
Figure 2.
Unfolded state of the MSPT with six panels (top and bottom) tilted at 30 degrees.
Figure 3.
3D view of the CFD model (showing the boundary conditions and the meshing system) used to simulate the panel sample examined in the wind tunnel.
Figure 3.
3D view of the CFD model (showing the boundary conditions and the meshing system) used to simulate the panel sample examined in the wind tunnel.
Figure 4.
Variation of lift and drag forces with mesh configuration, showing the linear regression lines for lift force (in red) and drag force (in blue).
Figure 4.
Variation of lift and drag forces with mesh configuration, showing the linear regression lines for lift force (in red) and drag force (in blue).
Figure 5.
Lift and drag forces on solar PV panel sample (scaled 1:15) at 10 m/s wind velocity carried out by experiment and simulation for different tilt angles.
Figure 5.
Lift and drag forces on solar PV panel sample (scaled 1:15) at 10 m/s wind velocity carried out by experiment and simulation for different tilt angles.
Figure 6.
and
for the unscaled panel (with the width of 699 mm and the length of 340 mm) in different tilt angles from the present study and the literatures [
18,
26].
Figure 6.
and
for the unscaled panel (with the width of 699 mm and the length of 340 mm) in different tilt angles from the present study and the literatures [
18,
26].
Figure 7.
Static pressure contour at the mid-section of full-size solar PV panel used in the MSPT, tilted at 30 degree.
Figure 7.
Static pressure contour at the mid-section of full-size solar PV panel used in the MSPT, tilted at 30 degree.
Figure 8.
Vector contour of flow velocity in the x direction (inlet to outlet) at the mid-section of full-size solar PV panel used in the MSPT, tilted at 30 degree.
Figure 8.
Vector contour of flow velocity in the x direction (inlet to outlet) at the mid-section of full-size solar PV panel used in the MSPT, tilted at 30 degree.
Figure 9.
Drag and lift forces (in red) and corresponding coefficients, and (in blue), on the full-size panel (width: 1083 mm, length: 2140 mm) with different wind velocities, (a) panel tilted at 15 degrees, (b) panel tilted at 30 degrees.
Figure 9.
Drag and lift forces (in red) and corresponding coefficients, and (in blue), on the full-size panel (width: 1083 mm, length: 2140 mm) with different wind velocities, (a) panel tilted at 15 degrees, (b) panel tilted at 30 degrees.
Figure 10.
Drag and lift forces and coefficients on the full-size panel (width: 1083 mm, length: 2140 mm) at different tilt angles and 10 m/s wind velocity. The primary axis (in red) represents the magnitude of drag and lift forces, while the secondary axis (in blue) shows the corresponding coefficients, and .
Figure 11.
Drag and lift forces (in red) and corresponding coefficients, and (in blue), on the panel with different scale factors at a 30-degree tilt angle and 10 m/s wind velocities.
Figure 11.
Drag and lift forces (in red) and corresponding coefficients, and (in blue), on the panel with different scale factors at a 30-degree tilt angle and 10 m/s wind velocities.
Figure 12.
Drag and lift forces (in red), and corresponding coefficients, and (in blue), on the panel with different aspect ratio at a 30-degree tilt angle and 10 m/s wind velocities.
Figure 12.
Drag and lift forces (in red), and corresponding coefficients, and (in blue), on the panel with different aspect ratio at a 30-degree tilt angle and 10 m/s wind velocities.
Figure 13.
3D view of the CFD model showing the boundary conditions used to simulate the entire MSPT system (tilt angle, α = 30 degrees).
Figure 13.
3D view of the CFD model showing the boundary conditions used to simulate the entire MSPT system (tilt angle, α = 30 degrees).
Figure 14.
Static pressure contour on the unfolded panels of the MSPT (tilted at 30 degrees).
Figure 14.
Static pressure contour on the unfolded panels of the MSPT (tilted at 30 degrees).
Figure 15.
Vector contour of flow velocity in the x direction (inlet to outlet) at mid-section of the MSPT.
Figure 15.
Vector contour of flow velocity in the x direction (inlet to outlet) at mid-section of the MSPT.
Figure 16.
Drag and lift forces acting on the single panel and the entire MSPT system under different wind velocities.
Figure 16.
Drag and lift forces acting on the single panel and the entire MSPT system under different wind velocities.
Table 1.
Model size of the panel (tilted at 30 degrees) and the domain for the present simulations.
Table 1.
Model size of the panel (tilted at 30 degrees) and the domain for the present simulations.
| |
|
|
|
|
|
B |
Unit |
|
Scaled panel sample (scaled 1:15) |
72 |
145 |
400 |
200 |
150 |
150 |
mm |
| Full-size panel used in the MSPT |
1080 |
2140 |
4320 |
2160 |
1620 |
2140 |
|
Panel from Lit. [18] |
699 |
349 |
2794 |
1397 |
1034 |
524 |
Table 2.
The coefficients used for the standard k-epsilon model in the present simulation using ANSYS Fluent 2022 R2.
Table 2.
The coefficients used for the standard k-epsilon model in the present simulation using ANSYS Fluent 2022 R2.
| |
Empirical Constants |
Turbulent Prandtl Numbers |
| Coefficient |
|
|
|
|
|
| Value |
0.09 |
1.44 |
1.92 |
1 |
1.3 |
Table 3.
Mesh sensitivity of the simulation of the scaled panel sample tilted at 30 degrees.
Table 3.
Mesh sensitivity of the simulation of the scaled panel sample tilted at 30 degrees.
| Model Number |
|
|
|
Lift (N) |
Drag (N) |
| Type 1 |
100 |
2.9 |
2,693,877 |
0.972 |
0.594 |
| Type 2 |
100 |
4.2 |
1,123,048 |
0.978 |
0.597 |
| Type 3 |
100 |
5.6 |
672,426 |
0.982 |
0.600 |
| Type 4 |
100 |
6.9 |
478,405 |
0.980 |
0.600 |
| Type 5 |
100 |
9.7 |
325,716 |
0.984 |
0.600 |
| Type 6 |
72 |
5.6 |
335,949 |
0.985 |
0.600 |
| Type 7 |
50 |
5.6 |
224,593 |
0.986 |
0.604 |
| |
|
Mean |
0.981 |
0.600 |
| |
|
Difference (%) |
1.42 |
1.66 |
| |
|
Standard Deviation |
0.005 |
0.003 |
Table 4.
Lift and drag forces on the scaled panel sample from experiment and CFD simulations.
Table 4.
Lift and drag forces on the scaled panel sample from experiment and CFD simulations.
| Angle of attack (degree) |
Lift (Exp.) (N) |
Drag (Exp.) (N) |
Lift (CFD) (N) |
Drag (CFD) (N) |
Lift Error (%) |
Drag Error (%) |
| 5 |
0.18 |
0.12 |
0.26 |
0.055 |
30.8 |
54.2 |
| 10 |
0.49 |
0.21 |
0.52 |
0.13 |
5.8 |
38.1 |
| 15 |
0.64 |
0.25 |
0.7 |
0.23 |
8.6 |
8.0 |
| 20 |
0.71 |
0.32 |
0.81 |
0.34 |
12.3 |
5.9 |
| 25 |
0.85 |
0.45 |
0.88 |
0.46 |
3.4 |
2.2 |
| 30 |
1.07 |
0.62 |
0.98 |
0.6 |
8.4 |
3.2 |
| 35 |
1.31 |
0.79 |
1.18 |
0.77 |
9.9 |
2.5 |
| Average Error (%) for angles of attack > 15 degree |
8.5 |
4.5 |
|
Disclaimer/Publisher’s Note: The statements, opinions and data contained in all publications are solely those of the individual author(s) and contributor(s) and not of MDPI and/or the editor(s). MDPI and/or the editor(s) disclaim responsibility for any injury to people or property resulting from any ideas, methods, instructions or products referred to in the content. |
© 2024 by the authors. Licensee MDPI, Basel, Switzerland. This article is an open access article distributed under the terms and conditions of the Creative Commons Attribution (CC BY) license (http://creativecommons.org/licenses/by/4.0/).
