1. Introduction
Sustainable management of forests implies adopting a proper management according to national (regional) strategies, depending on the needs of society [
1], environmental protection, and, last but not least, landscape conservation at a given moment. The promotion of adequate, sustainable management of forests also requires the alignment of wood consumption with the preservation of the forest ecosystem [
2].
As a result, the analysis, study, and simulation of the stand structure is an essential element in the planning process of forest management for the sustainable exploitation of the forestry potential of the forests [
3]./ forest potential
At present, with the help of various specialized software related to the forestry sector, it is also possible to design a sustainable forest management plan [
4] with optimal efficiency.
Currently, the promotion of beech stands, naturally regenerated, under shelter, on the sites favorable to this way of regeneration, represents the main (defining) objectives of the forest management from Romania, because the beech species occupies approximately 32% of the surface of the national forest fund [
5] .
The performance of forestry works (silvotechnical interventions) in young, mixed, and naturally-regenerated stands is generally based on knowing the optimal and, respectively, the actual number of trees per surface unit (ha) in order to control interspecific and intraspecific competition, with direct implications on the growing space and implicitly of the internal environment of the forest phytocenosis.
The number of trees per surface unit (ha) can be determined expeditiously, directly in the field, through full or partial statistical-mathematical inventories based on the correlations between their main dendrometric elements (average height, crown diameter, etc.) [
6], and indirectly, using general production tables [
7].
The determination of the number of trees by expeditious methods is frequently accomplished by using the known correlations between the height of the trees and the diameter of their crowns (depending on the degree of development of the crowns or the size of the crowns), finally being able to evaluate (appreciate) the size of the tree, the spacing index of the stand s
% [
6] and the crown competition factor (CCF) [
8].
The growing space necessary for each tree for optimal growth and development is constituted by the overground volume, which is delimited by the average diameter of the crown (
Dcrw) and the average height of the tree (
H), to which the volume of soil in which the trees have fixed their roots is added [
6].
Because the roots of the neighboring trees can use the same volume of soil through concrescence without being decisively influenced, it is conventionally considered that the growing space corresponding to each tree corresponds to the space in which the trunk and its crown develop and which can be calculated with the relation [
6]:
Since in the even-aged stands, with a regular structure, it is considered that
H is relatively the same (equal) for all the neighboring trees (from biogroups), from the upper ceiling (from the crown), having a relatively constant value; as a result, it will not influence the size of the growing space. Consequently, relation (1) becomes:
As a result,
Sg represents the projection of the tree crown in the horizontal plane, which is similar with the potential area of the tree crown projection area (cpa) [
8], and which represents the size of the land surface that must be provided to a tree, to grow and develop normally in height and thickness, and to achieve (develop) a well-proportioned crown, with a length between 0.33 and 0.50 of the trunk height.
The potential area of the tree crown projection (cpa) can be calculated using the following formula [
8]:
where:
- -
cpa - potential area of the tree crown projection;
- -
a0, a1- coefficients of the regression equation
- -
dbh- diameter at breast height (measured at 1.30 m from the ground).
The height of the trees represents an essential morphometric variable of the stand, which is found in all forest management inventories [
9], because it is an indicator of the growth and development of the stand, of the production and productivity of the stand, of the synthetic structural indices, being used to evaluate the volume of the tree stand.
The literature in the field shows that in the case of deciduous species, the diameter of the crown d
c is considered to range (varies) between 0.16 and 0.20 of the average height. For oak species,
Dcrw = 0.20·
H, and
Dcrw = 0.16·
H for beech species. For coniferous species,
Dcrw is between 0.25 - 0.33 of the average height [
6].
As a result, the value of the growing space (potential crown projection area) Sg (cpa) can be determined according to the correlation between the average height of the trees and the diameter of the crowns and/or depending on the correlation between dbh and the diameter of the tree crowns.
The notion of growing space (Sg) will be used when the correlation between the average height of the trees and the diameter of the crowns is analyzed.
To determine the number of trees per surface unit
Ncrw - respectively per hectare, depending on the diameter of the crown
Ncrw, the value of the growing space S
g will be used, according to the following relationship: [
6]
Because the crown development indices - respectively, the correlations between the average height of the trees
H and the diameter of the related crowns
Dcrw vary depending on a series of factors (species, age, vegetation conditions, silvotechnical interventions) [
6], for determining the number of trees
Ncrw with high precision, an appropriate mathematical model is required, for the precise establishment of the correlation (allometric relations) between h and
Dcrw.
A series of studies have analyzed and highlighted the allometric relationships that can be established between the height of the trees, the breast-high diameter dbh, their volume, and current growth.
Recent studies show that the pruned height (of the crown base) is directly correlated with the total height of the tree, thus highlighting a close, obvious allometric relationship between the two essential morphometric variables of trees and stands [
9].
Interesting studies for green spaces, urban forests, and a series of stands have addressed the correlations between the characteristics of the tree crown and the surface occupied by them [
10]. The dependence between the different shapes of tree crowns and their status in the forest phytocenosis was also studied and analyzed [
11].
The sizes and shapes of tree crowns can also be determined by digital analysis of the images, recorded on vertical terrestrial photographs inside the stands, using specially designed software [
12], provided that the thickness (density) of the stands allows (facilitates) the recording of field data.
All these research and studies highlight the interest in a series of allometric relations between the various dendrometric characteristics of trees and stands for the successful implementation and promotion of adaptive forest management measures, which ensure the sustainable management of forest resources [
13].
In order to establish the allometric relations between the average height of the trees and, respectively, the average diameter of the crowns corresponding to the studied stands, the possibility of using the cubic spline regression will be analyzed.
As a mathematical model, to serve the purpose of the present study, a cubic spline regression technique is considered, and based on this approach, the appropriate dependence law between tree height and crown diameter for beech species will be determined. The corresponding cubic spline will have a cubic Hermite polynomial expression, as in formula (6), where the experimental data are interpolated, and the values of the local derivatives remain free.
There are many procedures in the literature for calculating these derivatives. Thus, it is worth mentioning the works of Akima [
14], Catmull and Rom [
15], Kobza [
16], as well as recent works [
17,
18,
19,
20,
21]. Quartic spline regression could also be used, as in [
22], but this approach is left for a future study. In this paper, the local derivatives are calculated using a regression model so that the residual function to be minimized. Furthermore, the obtained cubic spline will be used to calculate the average crown diameter of the involved tree.
The value of the average diameter of the crowns, determined with the presented model, will be used to determine some structural and synthesis characteristics of the stands for the optimization of the silvotechnical interventions and implicitly for the implementation of a suitable management for the sustainable management of forest resources.
Recent studies analyzed a mathematical model combining quantile regression with nonlinear mixed effects modeling (QR-NLME) to establish the maximum crown width [
23] and the crown competition factor, in beech and pine species.
2. Materials and Methods
The case study was carried out within the Sălaj Forest Department, Zalău Forest District, Răstolţ Forest Management Unit (FMU) in the beech stands, in the plots 112C, 114C and 115B. -
Figure 1 The most representative characteristics of the stands in the plots under study, depending on the data from the forest management plan [
24] and the field, respectively, are presented synthetically in
Table 1.
Figure 1.
Location of the case study [
25,
26,
27].
Figure 1.
Location of the case study [
25,
26,
27].
The research methods used in this study are bibliographic documentation, partial inventory (statistical-mathematical), observations on the itinerary, site observations, experiments, mathematical modeling, simulation, and comparison.
To carry out the case study, statistical-mathematical inventories were made on experimental areas following the algorithm presented in Biometry of trees and stands from Romania, 1972 edition [
7]. As a result, experimental plots of circular shape, with an area of 300 square meters, were established and delimited in the field.
The number of experimental areas was established with the following relationship [
7,
28]:
where:
F - the surface of the stand;
- admissible tolerance;
t - coefficient corresponding to the considered coverage probability;
f - size of the experimental plot;
s% - variation coefficient of the volume per stand.
The volume variation coefficient for the studied stands (determined according to the stand’s homogeneity class) is
s = 25%, the tolerance used was
t = 10%, and the coverage probability was
p = 90% [
7]. Depending on the surface of each stand, the number of experimental plots was established -
n, as well as the distance between their centers - d. These data can be found in
Table 2.
Data from the field for each tree are represented by: the current number, species, crown diameter, total height, and pruning height. The average slope for each experimental plot was also determined.
The total height of the trees in the experimental plots was measured with a Vertex 5, using a T3 model transponder.
Due to the high thickness of the studied stands, the pruned height was measured (in cm) with a graded telescopic rod, which can be used for heights of up to 8.0 m.
Although, there are established methods [
10,
29,
30] for determining the radius of the tree crown and implicitly of the crown diameter for young beech stands that are naturally regenerated and have a high thickness, in the case of the stands under study, these methods are relatively difficult to apply.
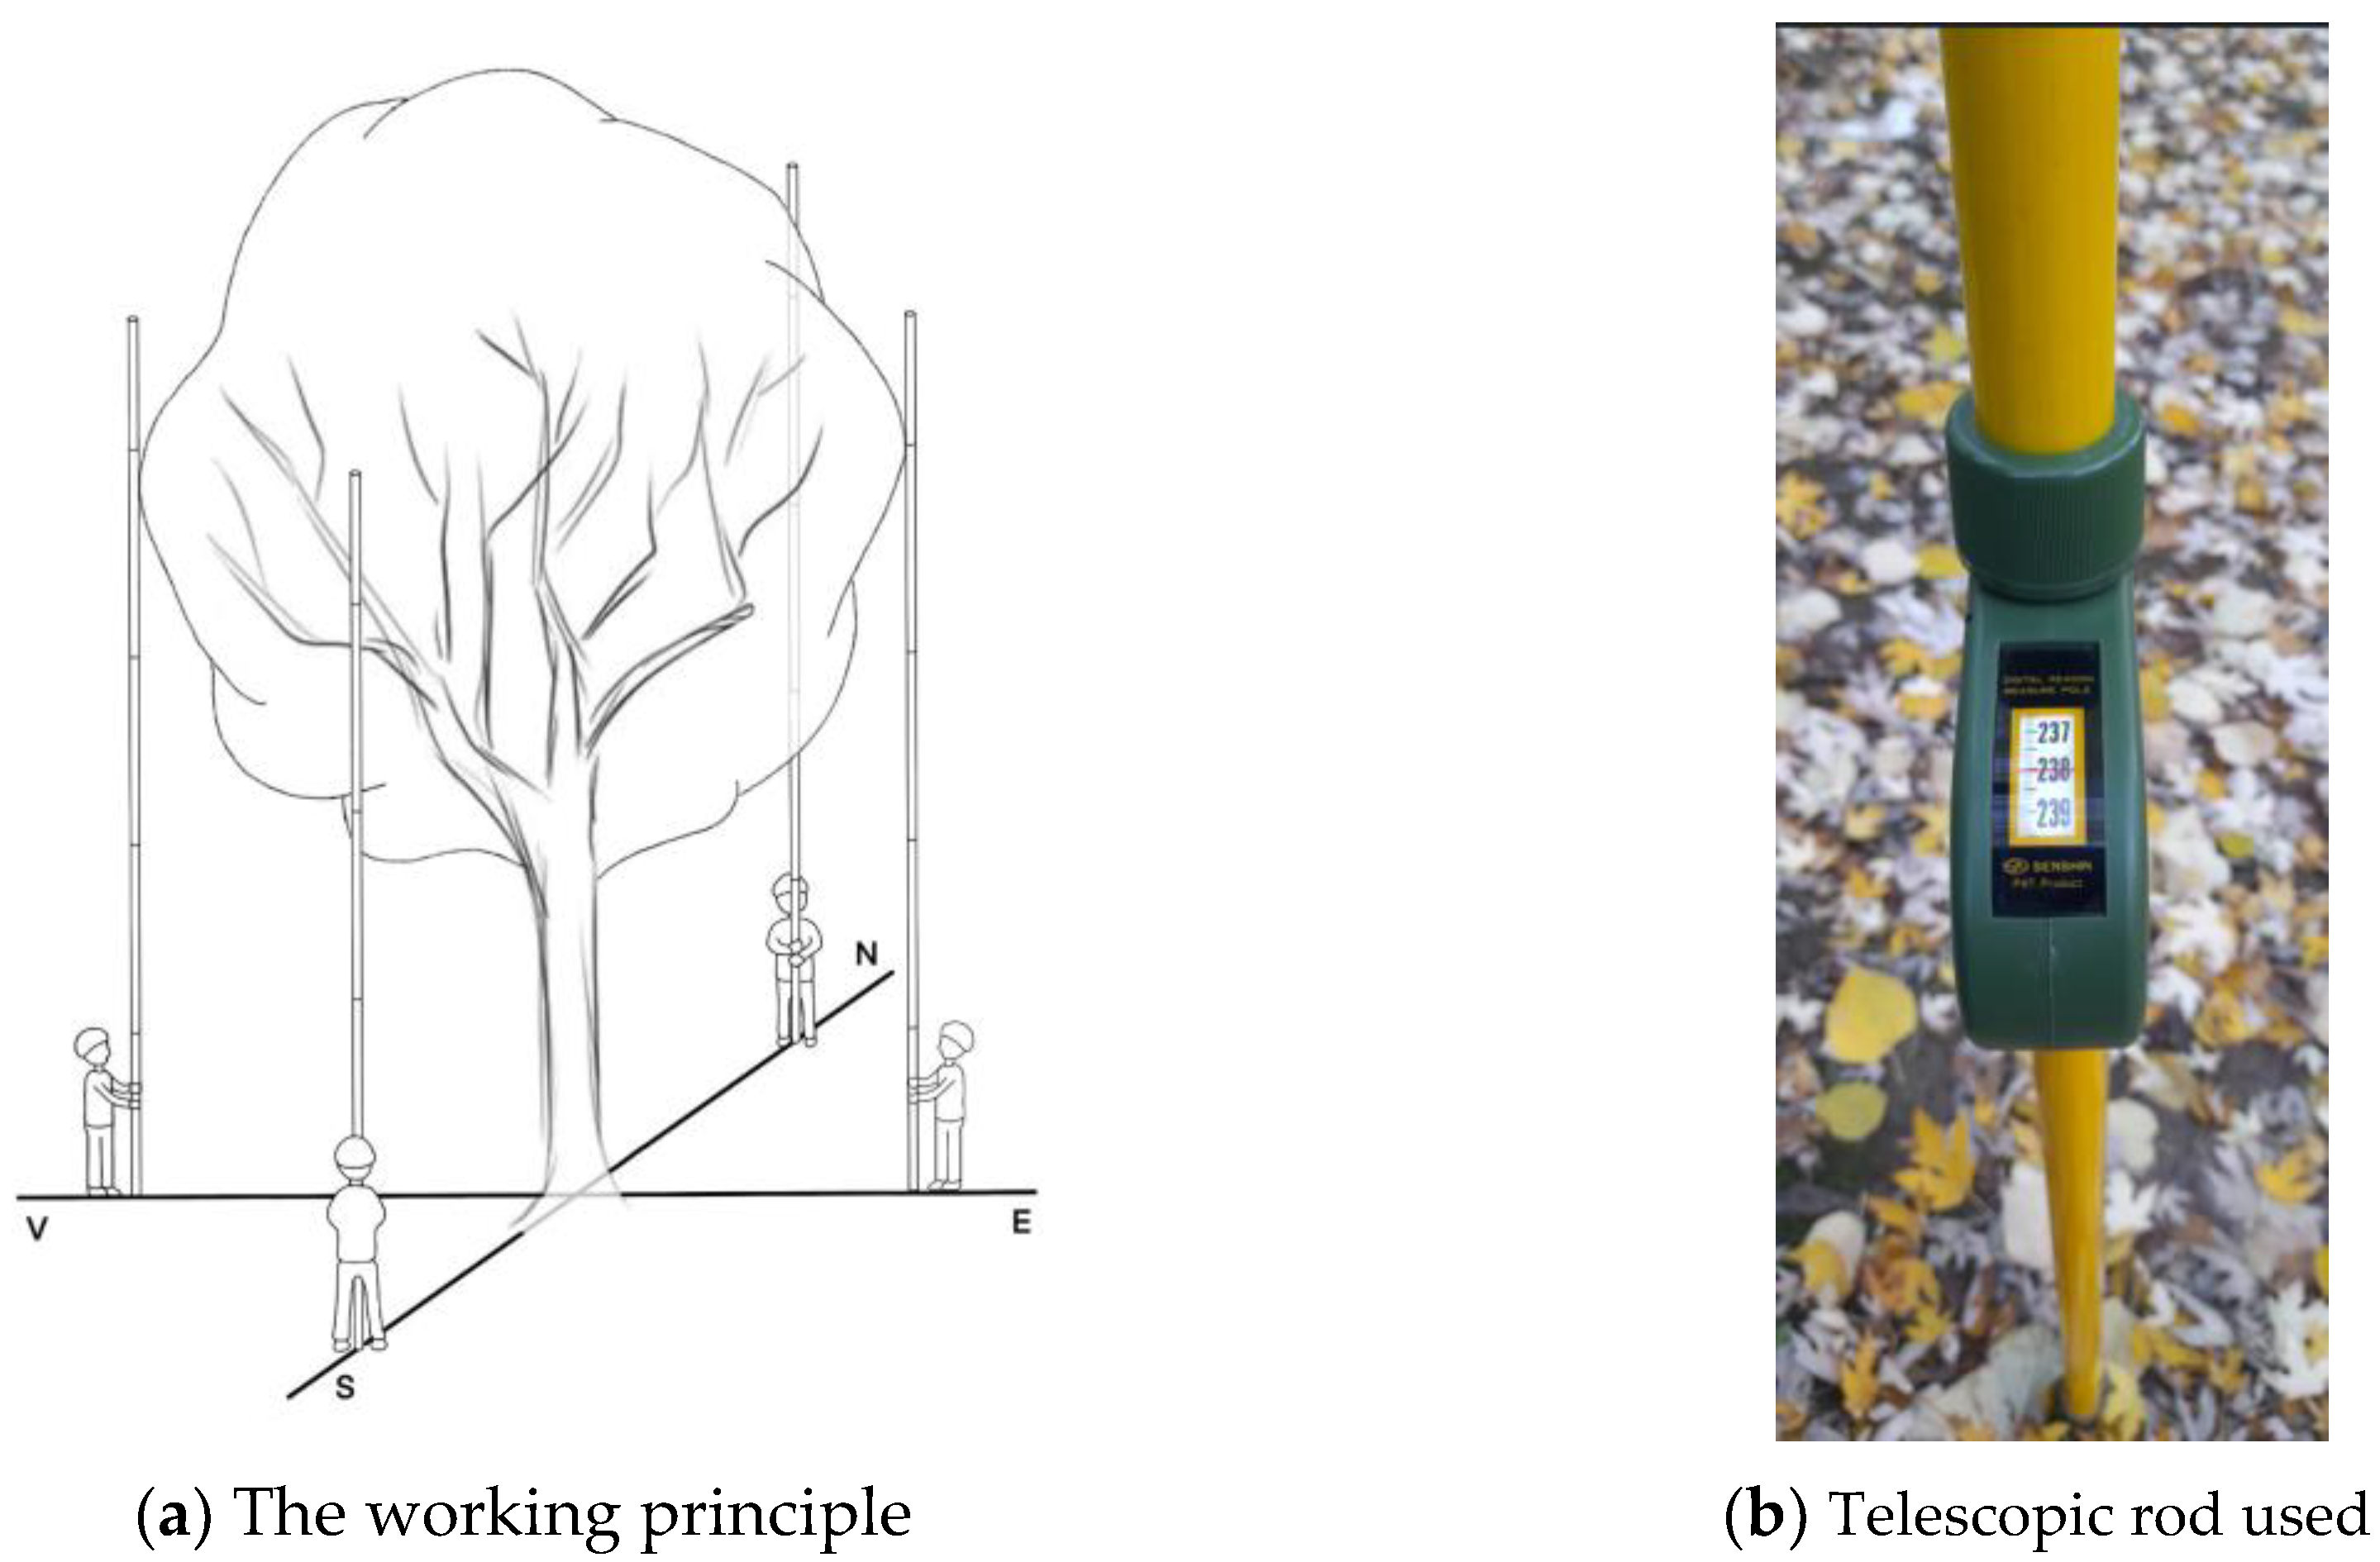
In order to make the process of collecting data from the field more efficient, the crown diameter of the inventoried trees was determined in two perpendicular directions.
As a result, the transmission of the extreme points of the crown to the ground level was achieved in two perpendicular directions with the help of the graded rod, which was used in a vertical position
Figure 2 b. Next, the inventoried trees' crown diameter was determined by a graded square ruler (in cm) horizontally in the two cardinal directions at ground level -
Figure 2 a.
Along with the regional ecological evaluations, it is necessary to inform on the presentation of the stand profiles under study as well as on the forest ecosystem management activities, which are based on the evaluation of the functional relationships between ecosystem-level processes and forest ecosystem services [
31].
The PROARB 2.0 application [
32] was used for the plane representation and perspective of some representative samples from the studied and analyzed stands (on rectangular experimental plots) and implicitly for the realization of the related profiles, the data from the field being recorded in standardized field sheets-
Table 1.
In order to create the spatial structure of the stand, it is usually necessary to measure the total height of the trees and their pruned height, elements that are frequently used as input data for their growth and development models [
33].
Figure 2.
Measurement of the crown diameter for the inventoried trees.
Figure 2.
Measurement of the crown diameter for the inventoried trees.
The experimental plots used to create the profiles are rectangular, and the necessary data, collected (inventoried) from the field, are represented by:
- -
Lep - the length of the experimental plot (m);
- -
lep - the width of the experimental plot (m);
- -
Crt.no - current number
- -
X and Y coordinates in the horizontal plane in a local rectangular system of reference (m);
- -
H - the total height of the tree (m);
- -
Hp - the pruned height of the tree, respectively the height from which the crown begins (m);
- -
Dcrw1 - diameter of the crown on the X axis (South-North direction) (m);
- -
Dcrw2 - diameter of the crown on the Y axis (West-East direction) (m);
- -
total number of trees inventoried in the experimental plot;
- -
species
- -
average slope of the land - grades.
The right angles related to the rectangular experimental surfaces were traced in the field with the arpentor’s square, or as the case may be, depending on the land, using the properties of Pythagorean numbers
Mathematical model
The promotion of young stands, naturally regenerated, with a standard (regular) structure, within which appropriate silvotechnical interventions [
33], rigorously implemented are systematically applied, based on dedicated mathematical models, ensures the successful promotion of sustainable forest management.
Partial inventories were carried out in the field, with a series of data on the structural and qualitative indicators of the stands, of which the most relevant for the case study are crown diameter (
Dcrw) and height (
Hcrw) (See
Table 4), for the inventoried trees. There were considered young beech stands in which some (in two stands) or no interventions (in one stand) were applied, that is, beech (
Fagus sylvatica) as in
Table 3.
It is of interest to establish a functional dependence between the height of the tree and the diameter of its crown, leading to a correlation with the thickness and the spacing index in the deciduous stand, using the experimental data presented in
Table 4. Such a correlation will suggest the necessary silvotechnical interventions and solutions to optimize the production process in the forestry sector. For this purpose, a cubic spline regression function is designed which is defined on two intervals due to the irregularity of the above data and based on experimental observations.
The experimental results suggest a linear dependence between the variables H and Dcrw, which will be tested. The intervals of the spline function are determined by the intersection of the linear regression line with the experimental data curve near the interval's midpoint [x1, xn].
Let v
2 be the abscissa of this intersection point. In this way, the cubic Hermite spline is defined on the intervals [
v1,
v2] and [
v2,
v3] such that
v1=
x1 and
v3=
xn. If
xk <
v2 <
xk+1, then
q2=0.5(
yk+
yk+1), and
q1 =
y1,
q3 =
yn, and, consequently, the expression of Hermite cubic polynomials (see [
34] and [
35]) for i=2 and i=3, will be:
Here , and the local derivatives m1, m2 and m3 remain free.
The cubic spline regression problem
This cubic spline is helpful for obtaining the average crown diameter involved in the decision on appropriate silvotechnical interventions.
The objective is to determine the local derivatives m
1, m
2 and m
3 to obtain the cubic spline function, representing the solution of the spline regression problem. Different from [
14,
17,
18,
19,
20,
21,
37,
38,
39] and [
16], here the local derivatives m
1, m
2 and m
3 are computed by using the least squares method in order to minimize the residual function
For this purpose, it is noted that the points x1, …, xk belong to the interval [v1 ,v2], while xk+1, …, xn range within the interval [v2, v3].
Theorem 1. The values (m1, m2, m3) that minimize the residual function are uniquely determined, obtaining the unique cubic spline S as the solution of the regression spline problem of the data.
Proof of Theorem 1. By applying the least squares method to the residual function R(m1, m2, m3), the values (m1, m2, m3) will be the solution of the system of normal equations:
Let l=n-k, and after an elementary calculus, this system has the following three-diagonal form:
The matrix 3x3 of the diagonally dominant linear system (2) is:
By an elementary computation, det(U)>0 is obtained. Thus, the system has a unique solution that can be solved using the Gaussian elimination technique (see [
34], pages 14-15).
Here the Hessian matrix of the residual function is:
After elementary calculus, it is inferred that all diagonal minors are strictly positive. Consequently, the above-determined point (m1, m2, m3) minimizes the residual function R. Thus, the cubic spline S with these local derivatives m1, m2, m3 is the unique solution of the cubic spline regression problem.
Now, the resulting cubic spline, with
m1,
m2 and
m3 previously calculated, is used to determine the average crown diameter by the following formula:
The elements
e1,
e2,
f0,
f1,
f2,
g0,
g1,
r0,
r1,
r2 of the corresponding linear system (7) for each stand 112C, 114C, 115B, and the solution of the linear system (7) were obtained using Matlab 6.0 software [
40,
41] and the values of the average diameter of the crown according to the integrals in formula (18) were calculated using the Scientific Workplace software [
42]. In
Figure 3,
Figure 4, and
Figure 5, linear regression equations and R
2 values were obtained using SPSS.
3. Results
3.1. Determination of tree crown diameter
The data recorded through statistical-mathematical inventories in the experimental areas located in the three studied and analyzed stands were primarily processed separately for each stand.
In the stand from plot 112C, following statistical-mathematical inventories in the 16 experimental plots, with a total (cumulated) area of 4800 m2, a number of 2448 beech trees were inventoried (registered).
In the stand from plot 114C, a number of 608 beech trees were also inventoried on the 16 experimental plots.
In the same manner, a number of 2080 trees of the beech species were inventoried in the stand from plot 115B on the 16 experimental plots.
The data on the trees inventoried in the experimental plots from the studied stands were processed with the EXCEL program.
For each stand under study, the trees were divided into whole value height classes, with the size of the interval between the classes of one meter, for which the corresponding average values of the crown diameter were optimal determined by using the above presented mathematical model.
Next, the records of the relative frequencies related to the height classes and their graphic representation for each studied stand are presented.
3.1.1. Presentation of the results for the stand in plot 112C
The records of the relative frequencies for the height classes corresponding to the tree crown diameters in the case of the stand in plot 112C are presented in
Table 5.
Table 6 shows the records of crown diameters, by height class, for the 2448 trees, which were inventoried in the 16 experimental plots of 300 square meters.
The arithmetic mean of the crown diameters is calculated, Damcrw = 1.409, and the average crown diameter d is obtained by applying formula (18). Here, the experimental data set is divided into two intervals for tree height (with l = 3, k = 4) having v1 = 4, v2 = 7, v3 = 10, with corresponding diameter values q1 = 1, q2 = 1,24, q3=1,83, and the local derivatives m1 = 0.4558, m2 = 0.6194 and m3 = - 0.2049 are obtained. The average crown diameter Dscrw = 1.4101 m is obtained (calculated with spline model) using the formula (18).
The following residual value is considered as a measure of the deviation of the cubic spline by the regression line:
obtaining a small value e = 0.07124 m.
Furthermore, it is noticed that the values of Dscrw = 1.410 m and Damcrw = 1.409 m are very close. This fact (together with the value of e) validates the effectiveness of the spline regression method and indicates the linear regression equation as the most appropriate dependence of the crown diameter according to the height of the trees.
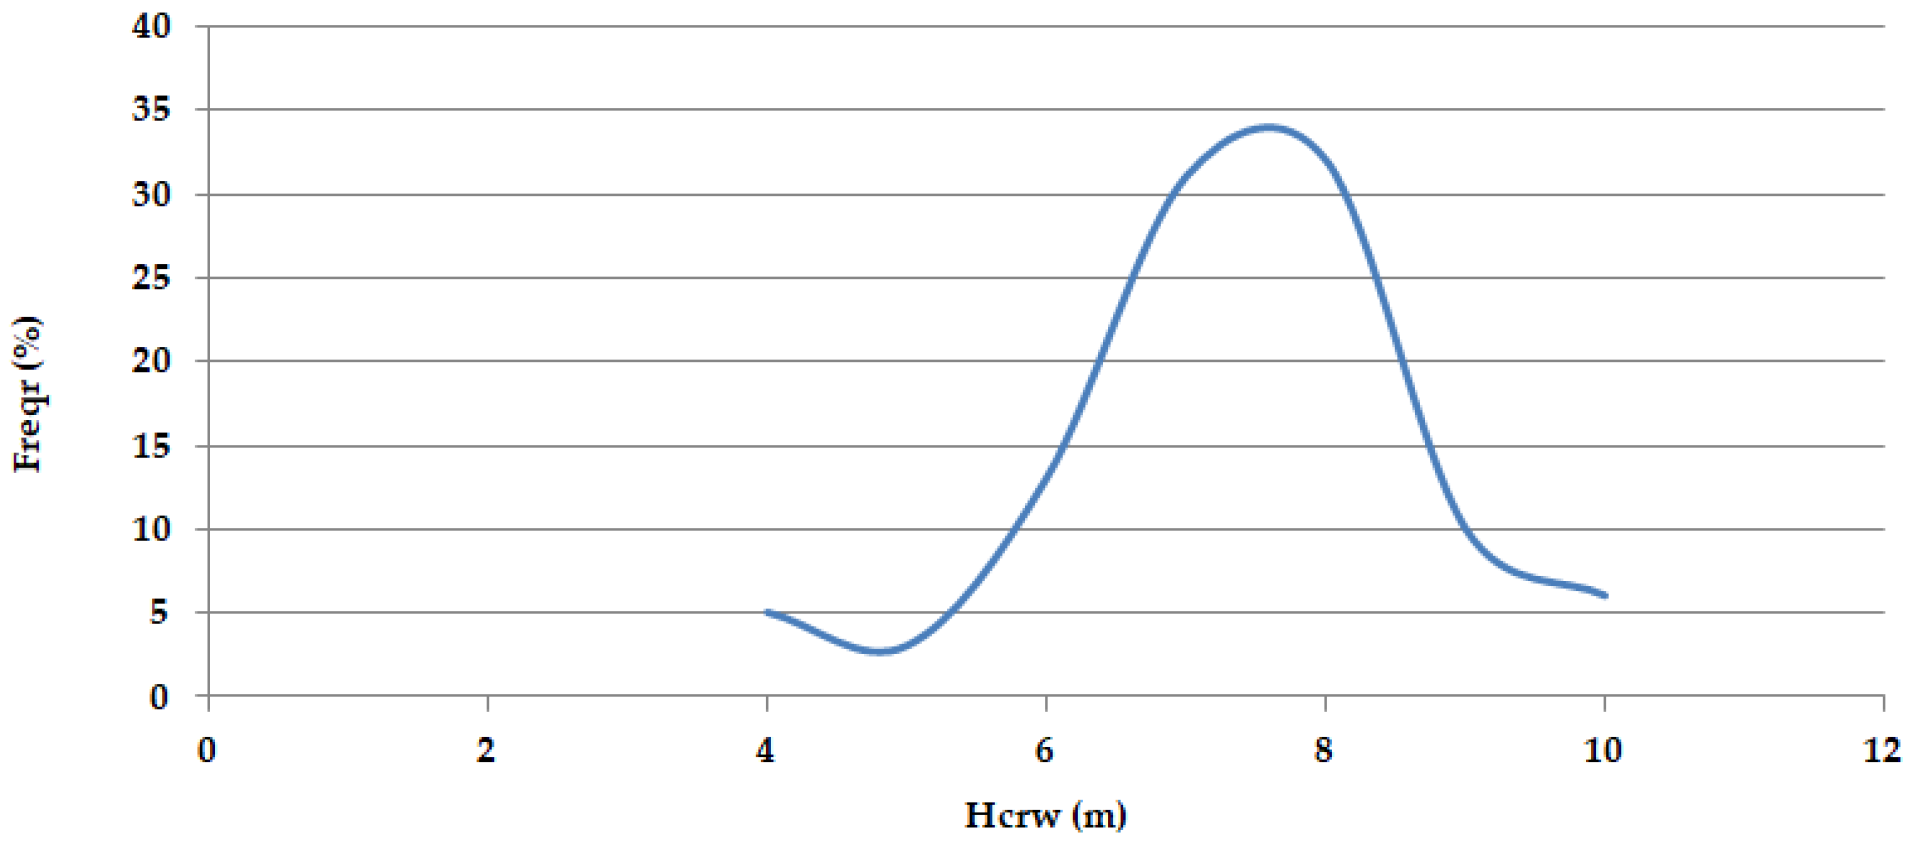
Figure 3.
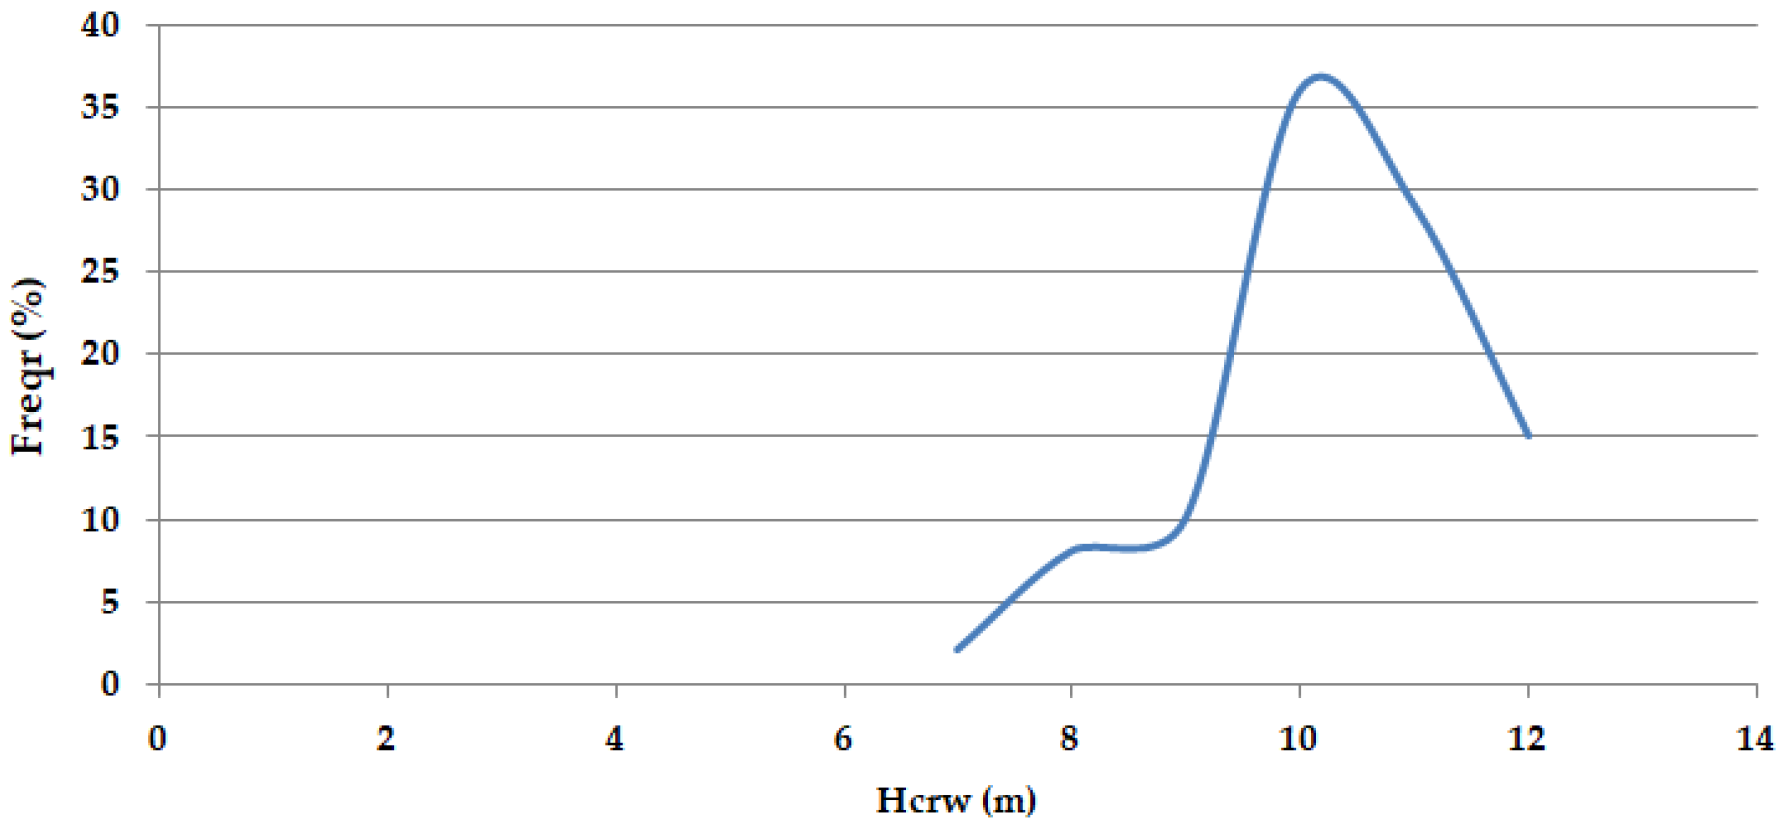
Distribution of relative frequencies (Freqr) by height classes for the stand in plot 112C.
Figure 3.
Distribution of relative frequencies (Freqr) by height classes for the stand in plot 112C.
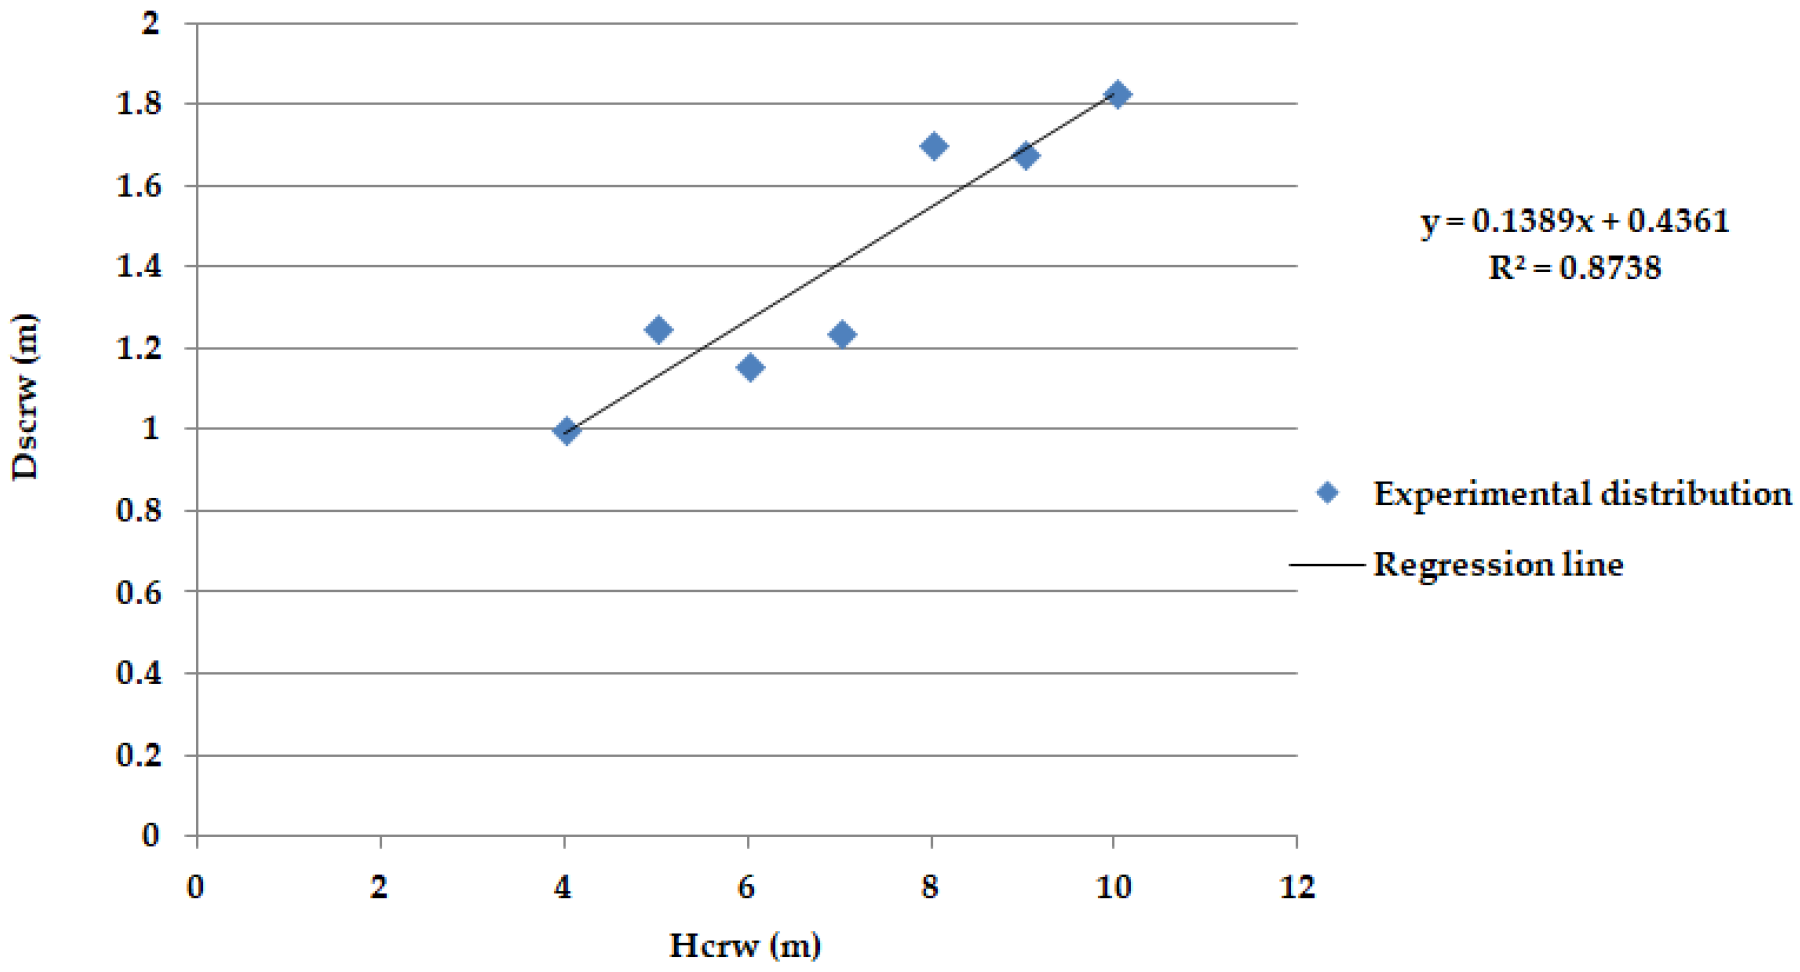
Figure 4.
Correlation between crown diameter (Dscrw) and height of the trees (Hcrw), for the stand in plot 112C.
Figure 4.
Correlation between crown diameter (Dscrw) and height of the trees (Hcrw), for the stand in plot 112C.
Distribution of relative frequencies (Freqr) by height classes for the stand in plot 112C
Figure 3, is closely akin to the Gauss type normal distribution
.
The geometric properties of the obtained cubic spline suggest a linear regression law between the crown diameter and the tree's height in a young stand in which there was no silvotechnical intervention, as seen in
Figure 4.
3.1.2. Presentation of the results for the stand in plot 114C
The records of the relative frequencies for the height classes corresponding to the tree crown diameters in plot 114C are presented in
Table 7.
Table 8 shows the records of crown diameters, by height classes, for the 608 trees, which were inventoried in the 16 experimental plots of 300 square meters.
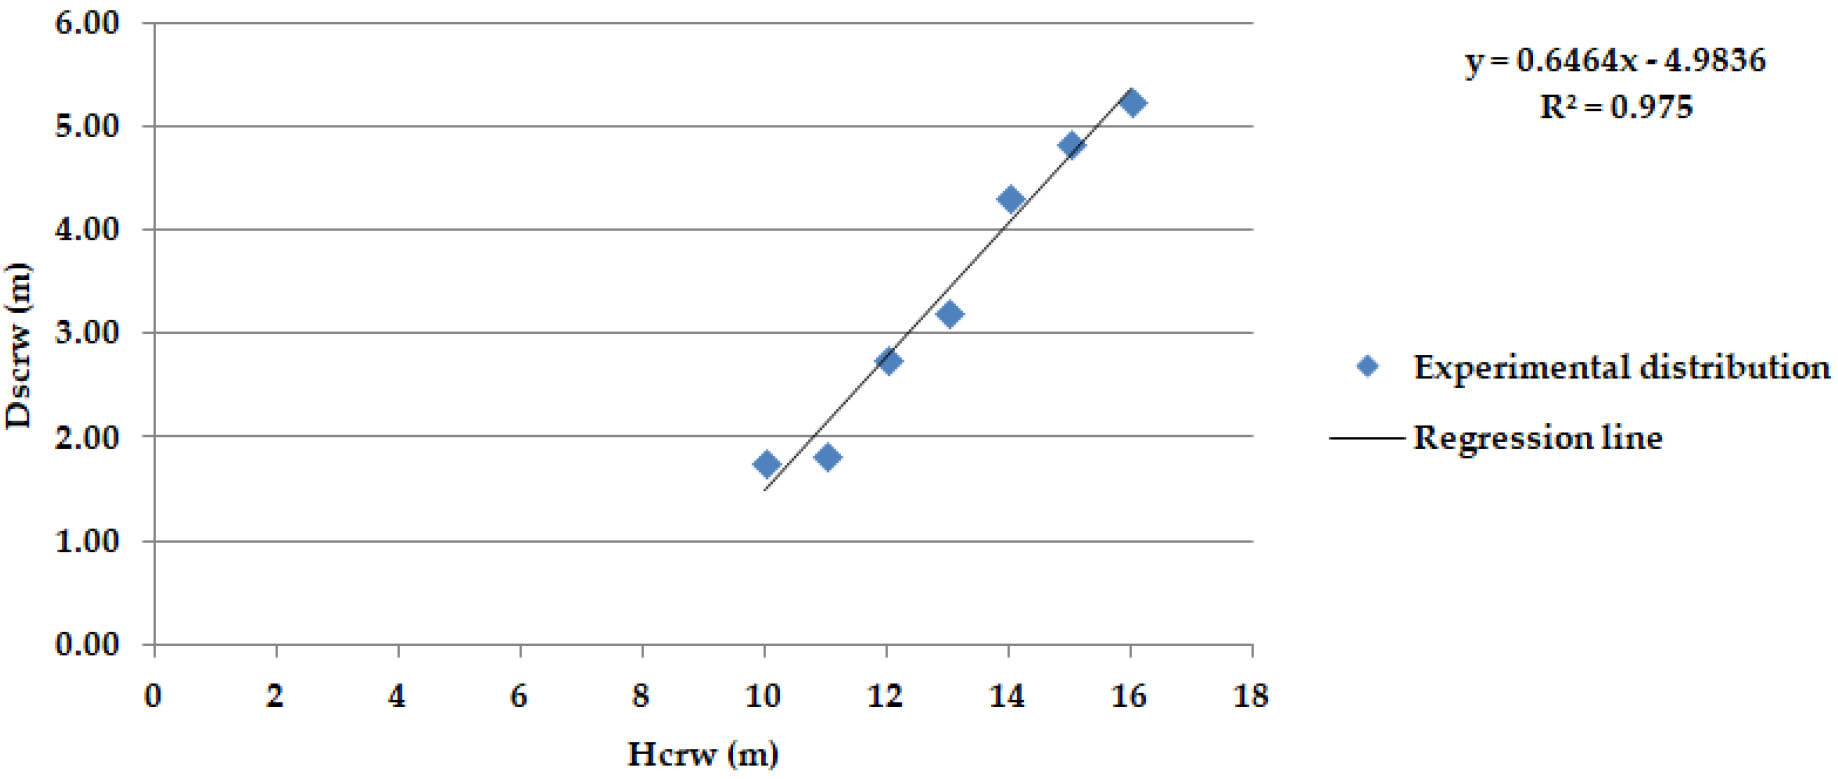
The arithmetic mean of the crown diameters, Damcrw = 3.420 m, is obtained, and the average crown diameter Dscrw will be determined using the formula (18). Here, the experimental data set is divided into two intervals for tree height by taking l=3, k=4, v1=10, v2=13, v3=16, with the corresponding diameter values q1=1.75, q2=3.20, q3=5.25, and m1=-0.3110, m2=0.2963, m3=0.5203 are obtained, the average crown diameter being Dscrw=3.2461 m.
As a measure of the deviation of the cubic spline calculated by the regression line, the value e=0.08336 m is obtained, similarly as in formula (19). It can be noted that very close values for Damcrw=3.420 m and Dscrw=3.2461m are obtained again, validating the accuracy of the spline regression model and the adequacy of the linear regression law.
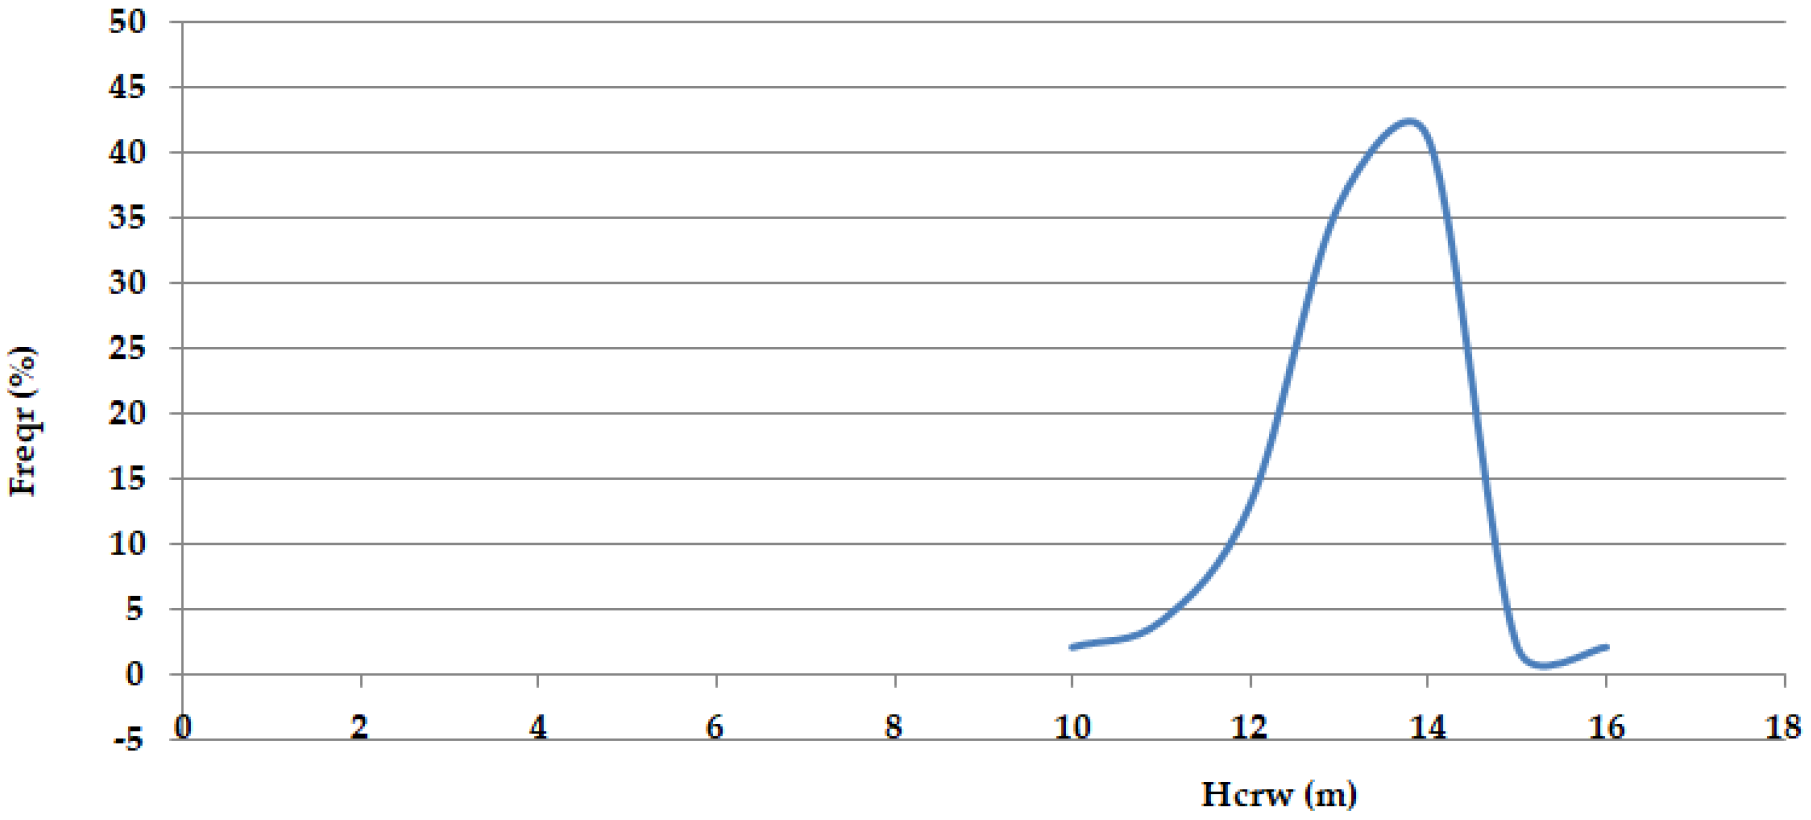
Figure 5.
Distribution of relative frequencies, depending on the height classes for the stand in plot 114 C.
Figure 5.
Distribution of relative frequencies, depending on the height classes for the stand in plot 114 C.
Figure 6.
Correlation between crown diameter (Dscrw) and height of the trees (Hcrw), for the stand in plot 114C.
Figure 6.
Correlation between crown diameter (Dscrw) and height of the trees (Hcrw), for the stand in plot 114C.
Distribution of relative frequencies, depending on the height classes for the stand in plot 114C–
Figure 5, is closely akin to the Gauss type normal distribution, with left skewness.
The cubic spline properties and the data in
Figure 6 b lead again to a linear regression law for the dependence of crown diameter and tree height.
3.1.3. Presentation of the results for the stand in plot 115B
The records of the relative frequencies for the height classes corresponding to the tree crown diameters in plot 115B are presented in
Table 9.
Table 10 shows the records of crown diameters, by height classes, for the 2080 trees, which were inventoried in the 16 experimental plots of 300 square meters.
Table 10 shows the records of crown diameters, by height classes, for the 4992 trees, which were inventoried in the 16 experimental plots of 300 square meters.
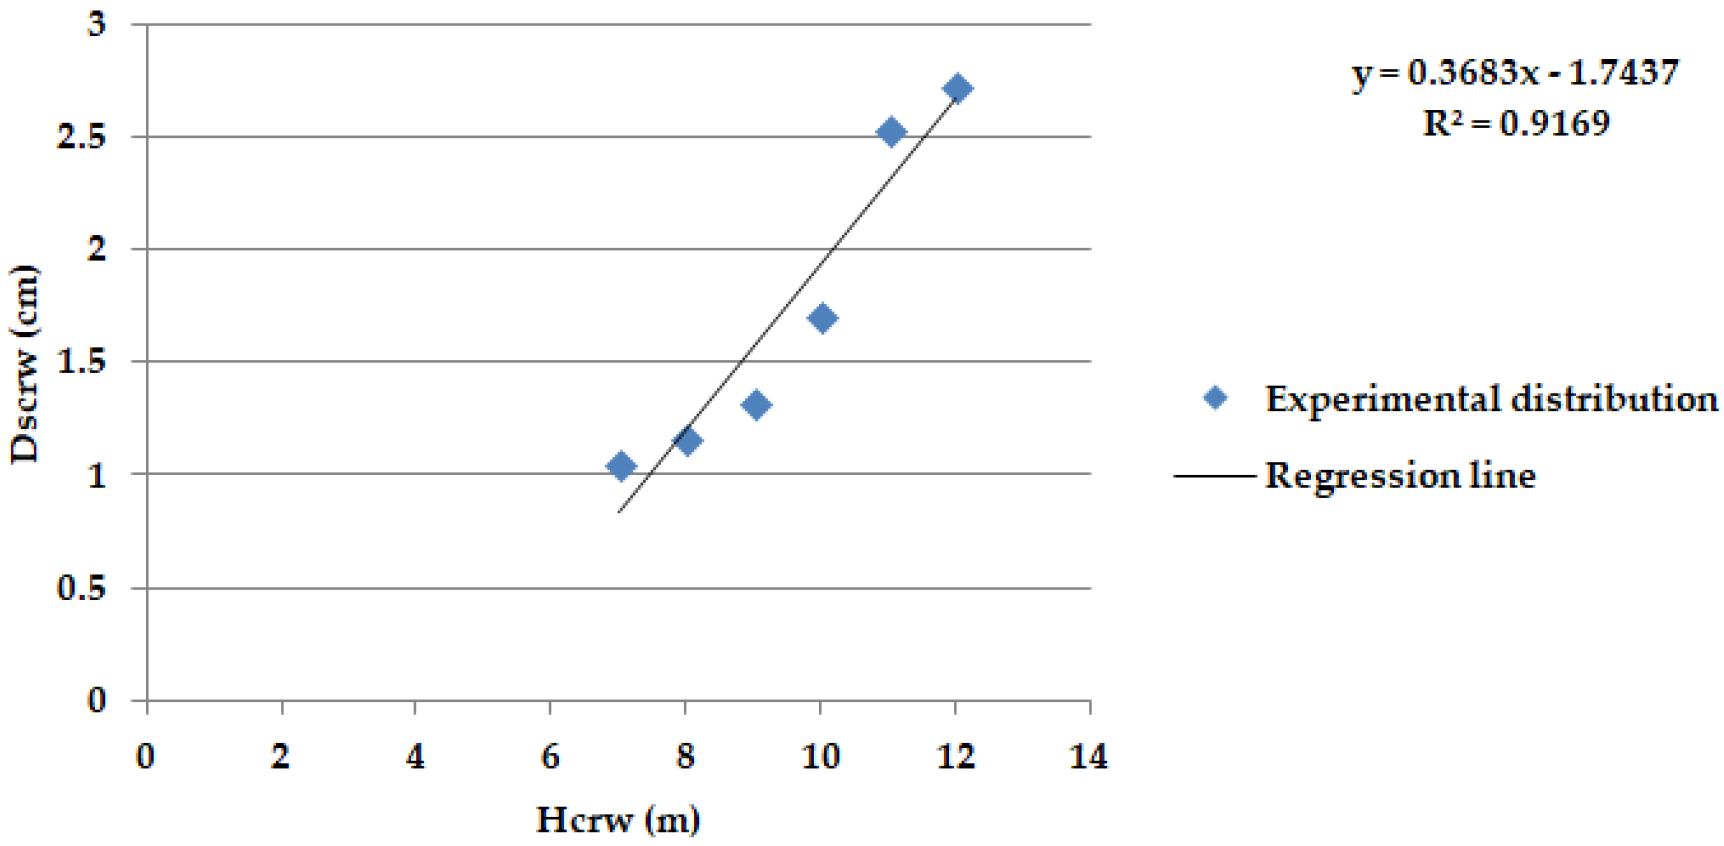
Here, the arithmetic mean of the crown diameter is Damcrw=1.755 m, and the average crown diameter Dscrw is obtained using formula (18). The experimental data set is divided into two intervals for tree height, taking l = 3, k = 3, v1 = 7, v2= 9.5, v3 =12, with the corresponding diameter values q1= 1.05, q2= 1.52, q3= 2, 73, and m1= 0.2536, m2= -0.1787, m3=0.8094 are obtained, while the average crown diameter is Dscrw = 1.6346 m. Closed values for Damcrw = 1.755 m and Dscrw = 1 .6346 m validate again the spline regression model. Moreover, the value of the deviation of the cubic spline calculated from the regression line, similarly to (19), is e = 0.141m, in this case, which confirms the relevance of using the linear regression law for the dependence of the crown diameter on tree height.
Figure 7.
Distribution of relative frequencies, depending on the height classes for the stand in plot 115B.
Figure 7.
Distribution of relative frequencies, depending on the height classes for the stand in plot 115B.
Figure 8.
Correlation between crown diameter (Dscrw) and height of the trees (Hcrw), for the stand in plot 115 B.
Figure 8.
Correlation between crown diameter (Dscrw) and height of the trees (Hcrw), for the stand in plot 115 B.
The distribution of the relative frequencies, depending on the height classes for the stand in plot 115B, presented in
Figure 7, looks like a bimodal distribution.
The law of linear regression dependence between crown diameter and tree height can be seen in
Figure 8.
3.2. Determination of the actual number of trees per surface unit (ha)
After determining the value of the crown diameter Dscrw with the presented mathematical model, it will be possible to determine the actual number of trees per surface unit (Nscrw)using the formulae 2 and 4.
Another possibility of determining the number of trees per surface unit is represented by the use of the arithmetic mean diameter of the crowns Damcrw , related to the trees distributed by height classes.
Finally, in the case of the present study, the actual number of trees can be determined by extrapolating the number of inventoried trees – (Nextrp), cumulated from all the experimental surfaces, for each tree to the surface unit (ha).
The values related to the number of trees, determined by the three methods, are presented in
Table 11.
By analyzing the results presented in
Table 11, it can be noticed that the number of trees determined by the three variants are relatively close in value, and the small differences are due to the calculation method.
3.3. Determination of thickness for the stands under study
Since the number of trees is determined by the three methods, it is possible to determine the value of thickness index In for the stands under study, using for this purpose the optimal (theoretical) number of trees, recommended by the production tables, drawn up for the stands of the national forest fund.
The formula used to determine the tree thickness index is as follows [
43]:
where:
Nfield - number of trees in the field per surface area (ha);
Ntable - number of trees in the production tables, per surface unit (ha), for the same species, production class and age.
As a result, the values of the thickness indices for the studied stands will be presented in three variants (the
Table 12), using the actual number of trees in the field, which was determined with the presented algorithms.
From the analysis of the data in
Table 12, it is found that the thickness index in the stand where there were no silvotechnical interventions is more than one, and in the stands where there were silvotechnical intervention tends to one.
3.4. Determination of the spacing index S%
The tree spacing can be determined using the values of
the S% spacing index, proposed by Hart-Beking [
6], using the established formula.
where:
- -
a - theoretical distance between the trees
- -
N - number of trees per hectare;
To determine the dominant height -
hdom in the studied stands, the following relationship is used:
- - dominant height of the stand;
- - average height of the stand.
To determine the theoretical distance between the trees, two variants of the arrangement of the trees in the stand are considered respectively, the trees arranged in the corners of a square of a4 side and the trees arranged in the center and corners of a regular hexagon (quincunx) of side a6.
The formulae for determining the value of the theoretical distance between the trees in the two variants are presented below.
As a result, the relations for determining the value of the spacing index in the two variants become:
The values of the spacing indices of the studied stands are presented in
Table 13, for each stand.
From the analysis of the results in
Table 13, it can be seen that the values of the spacing index S% determined by the six variants are relatively close in the case of each stand.
3.5. Establishing the specificity and intensity of the interventions in the studied stands
In order to optimize the growth and development of the naturally-regenerated cultivated stands, within which maintenance cuts are systematically applied, in the context of the application of sustainable management of the forest resources, it is necessary to analyze some characteristics (structural) related to some stands in virgin or quasi-virgin forests (with regular and/or irregular structure), to be used as a reference model [
44].
Although the young specimens of beech tolerate shading well, in the case of young beech stands, regenerated naturally under shelter, through repeated regeneration cuts, with an average regeneration period, it is necessary to apply specific maintenance cuts at the right time, for achieving balanced dendrometric elements, obtaining optimal growth, and achieving a stable dynamic balance [
45].
Due to the age and dendrometric characteristics of the three stands under study, it is necessary to apply maintenance cuts related to young stands, respectively, combined selective thinning.
The establishment of the intensity of silvotechnical interventions in the stands under study takes into account the specifics of the interventions, age, the actual and optimal number of trees per surface unit, consistency, thickness index, and spacing of the stands.
To determine the amount of intervention intensity according to the number of trees, it is necessary to know the number of trees in the field and, respectively, the number of trees in the production tables [
7] for the same species, production class, and age.
The calculation algorithm for the number of extracted trees and the intensity of the intervention is presented in the following relations.
Nextracted - number of extracted trees- piece/ha ;
Nfield – real number of trees in the field, after intervention - piece/ha;
Ntable – number of trees in the production tables - piece/ha;
In - intensity of the intervention depending on the number of extracted trees (%);
Since the number of trees in the field was determined in the three variants presented in
Table 11., and for the amount of intervention intensity (depending on the number of trees), three corresponding (related) variants will be determined.
For the stands under study, the intensity of the interventions will be analyzed for each stand, depending on the presented elements.
In
Table 14, the values of the intensity of the intervention per number of trees in the three variants for the stand in plot 112C and plot 115B are presented.
From the data analysis in the table 14, it can be seen that the intensity of the intervention per number of trees, in the stand in plot 112C, in the three variants, ranges between 20 - 22%, being considered a strong intensity.
A selective thinning at the age of 45 was performed in the stand in plot 114C, the thickness index, consistency, and spacing index confirming this aspect, and as a result, at the time of this study, no intervention is necessary - respectively, a selective thinning.
From the analysis of the results presented in
Table 14, it can be seen that the value of the intensity of the intervention, determined per number of trees, for the stand in plot 115B, in the three variants ranges between 18% and 25%, which can be assimilated with strong intensity.
3.6. Presentation of the profiles of the stands under study
The implementation of forest management, which is based on the analysis of the spatial structure of stands, represents a scientific and easy-to-use method for the sustainable management of forests, which is currently relatively frequently used [
46] As a result, a series of structural characteristics of the stands are analyzed synthetically for the efficient establishment of silvotechnical decisions, with direct implications on the functions of the forests and, respectively, the services they offer.
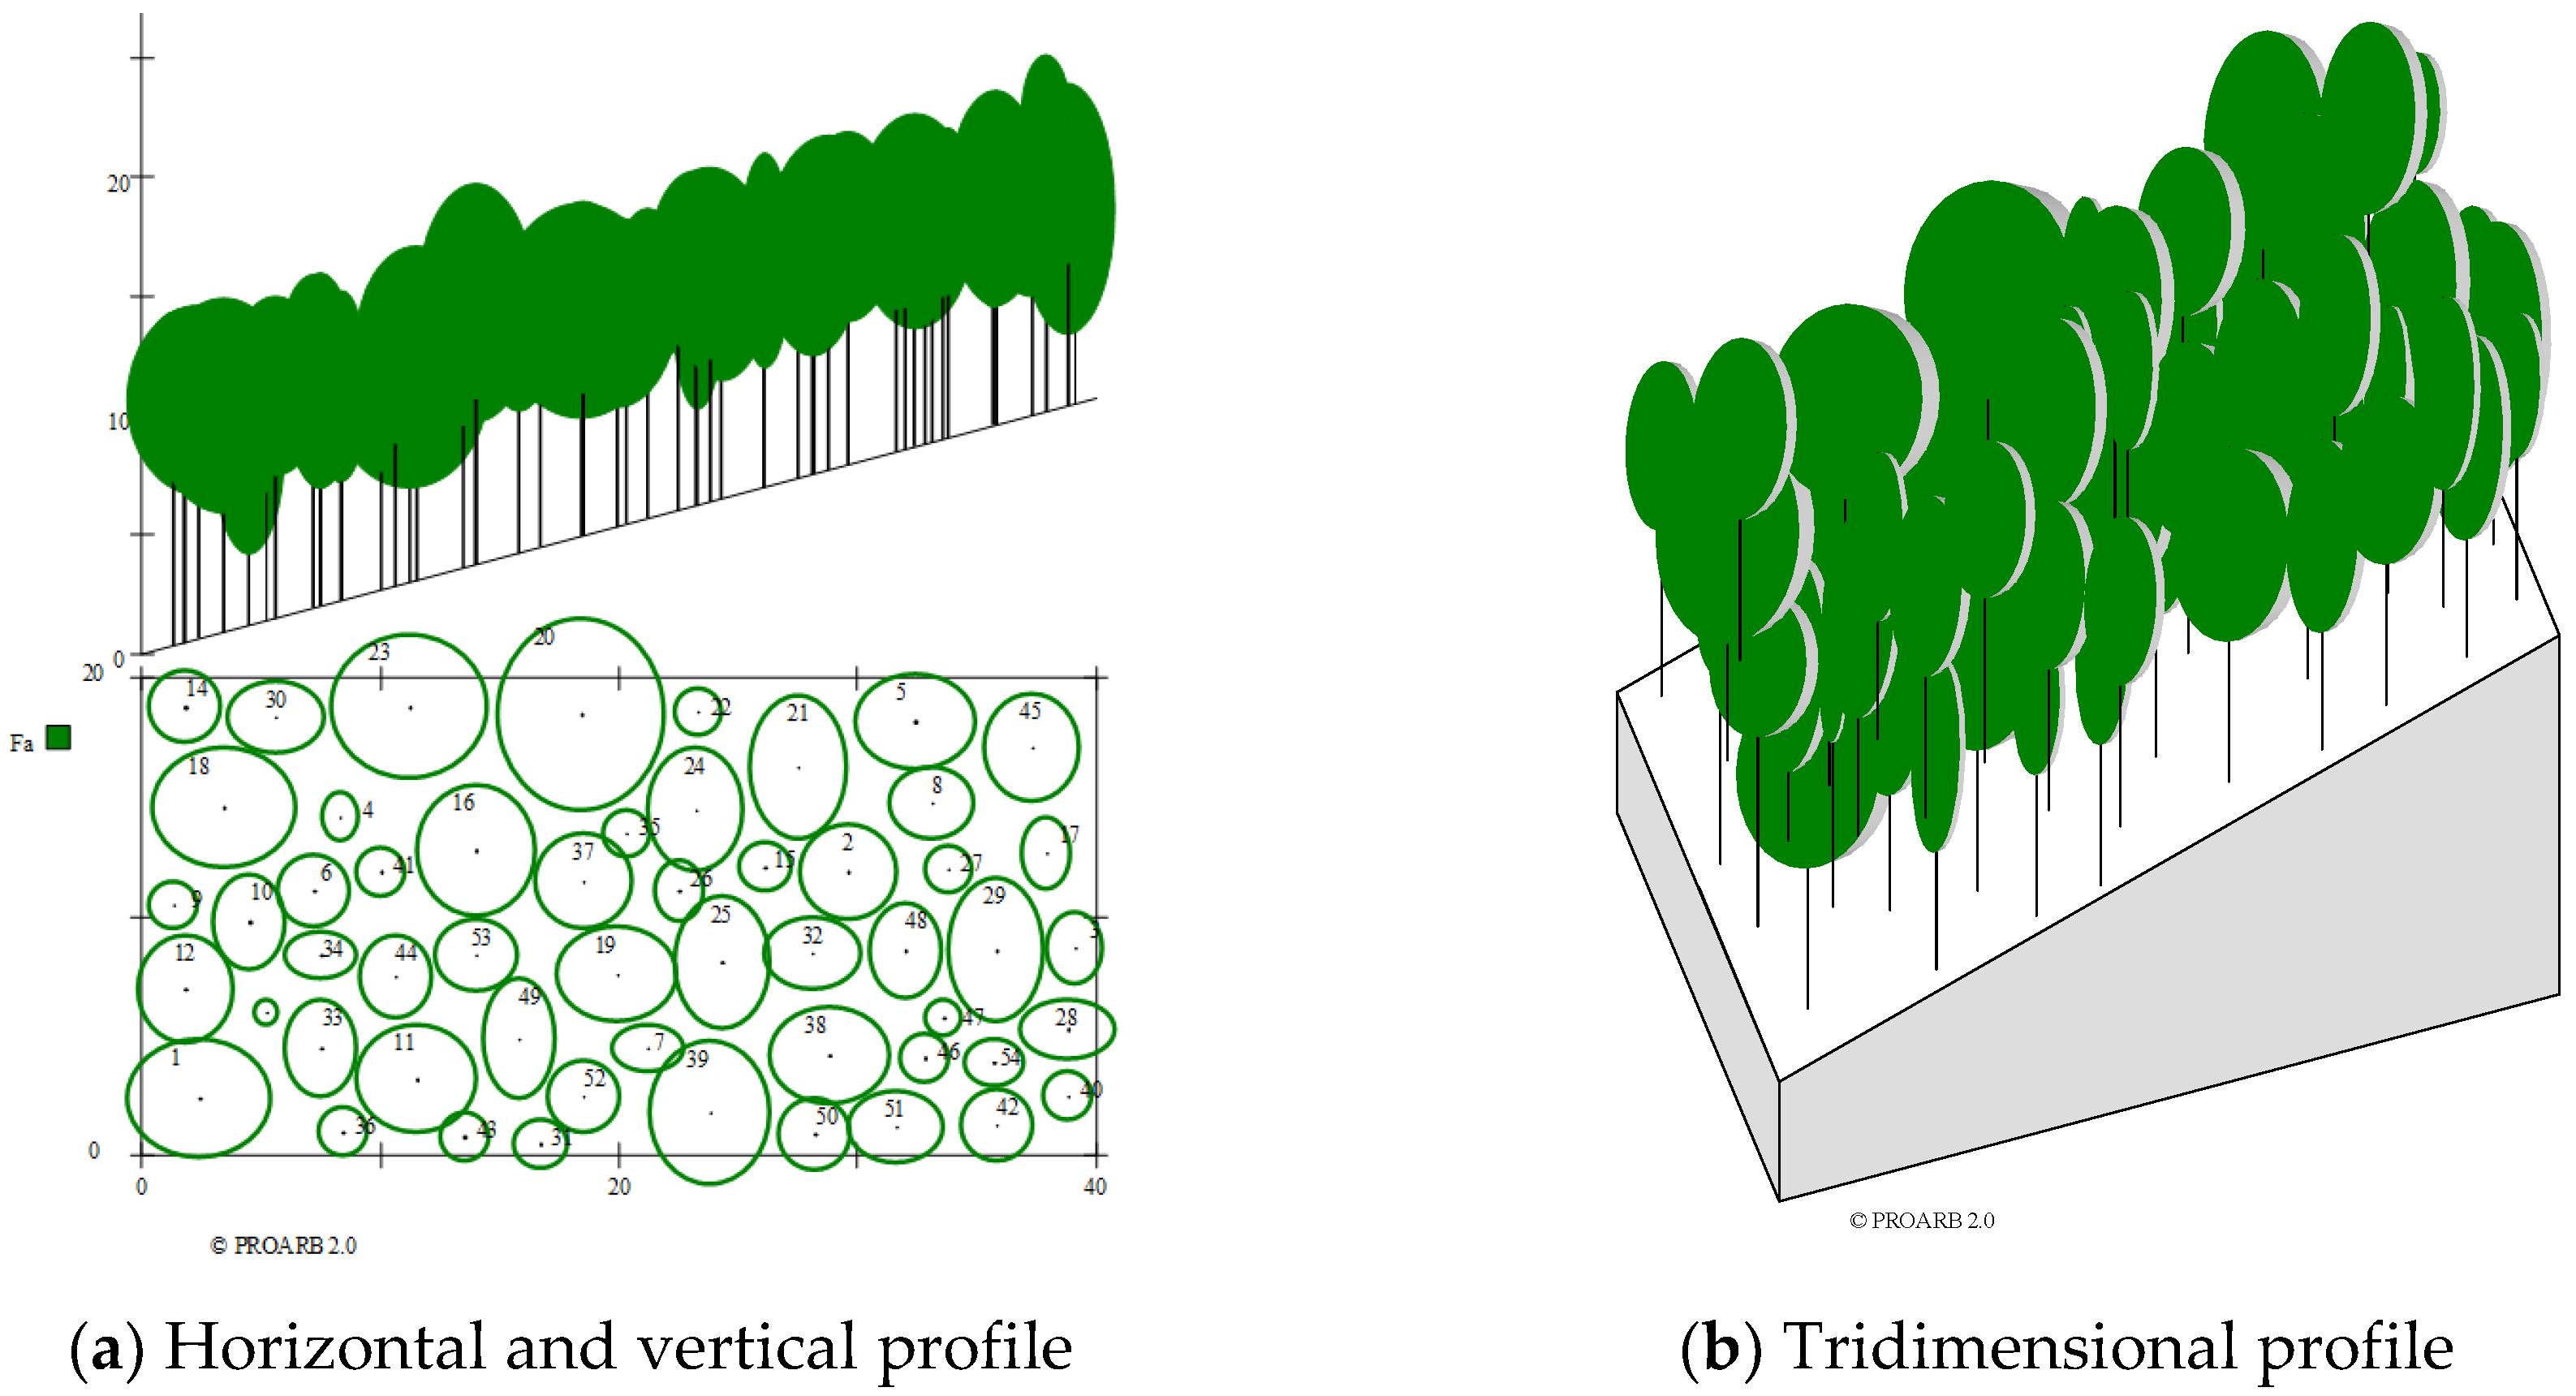
It is essential to present the profiles of the studied stands because a series of dendrometric elements (total and pruned height - up to the first green branch from the base of the tree crown, diameter of the crown in two perpendicular directions) and spatial positioning of the trees have been recorded (inventoried), elements that characterize the tree's horizontal and vertical structure.
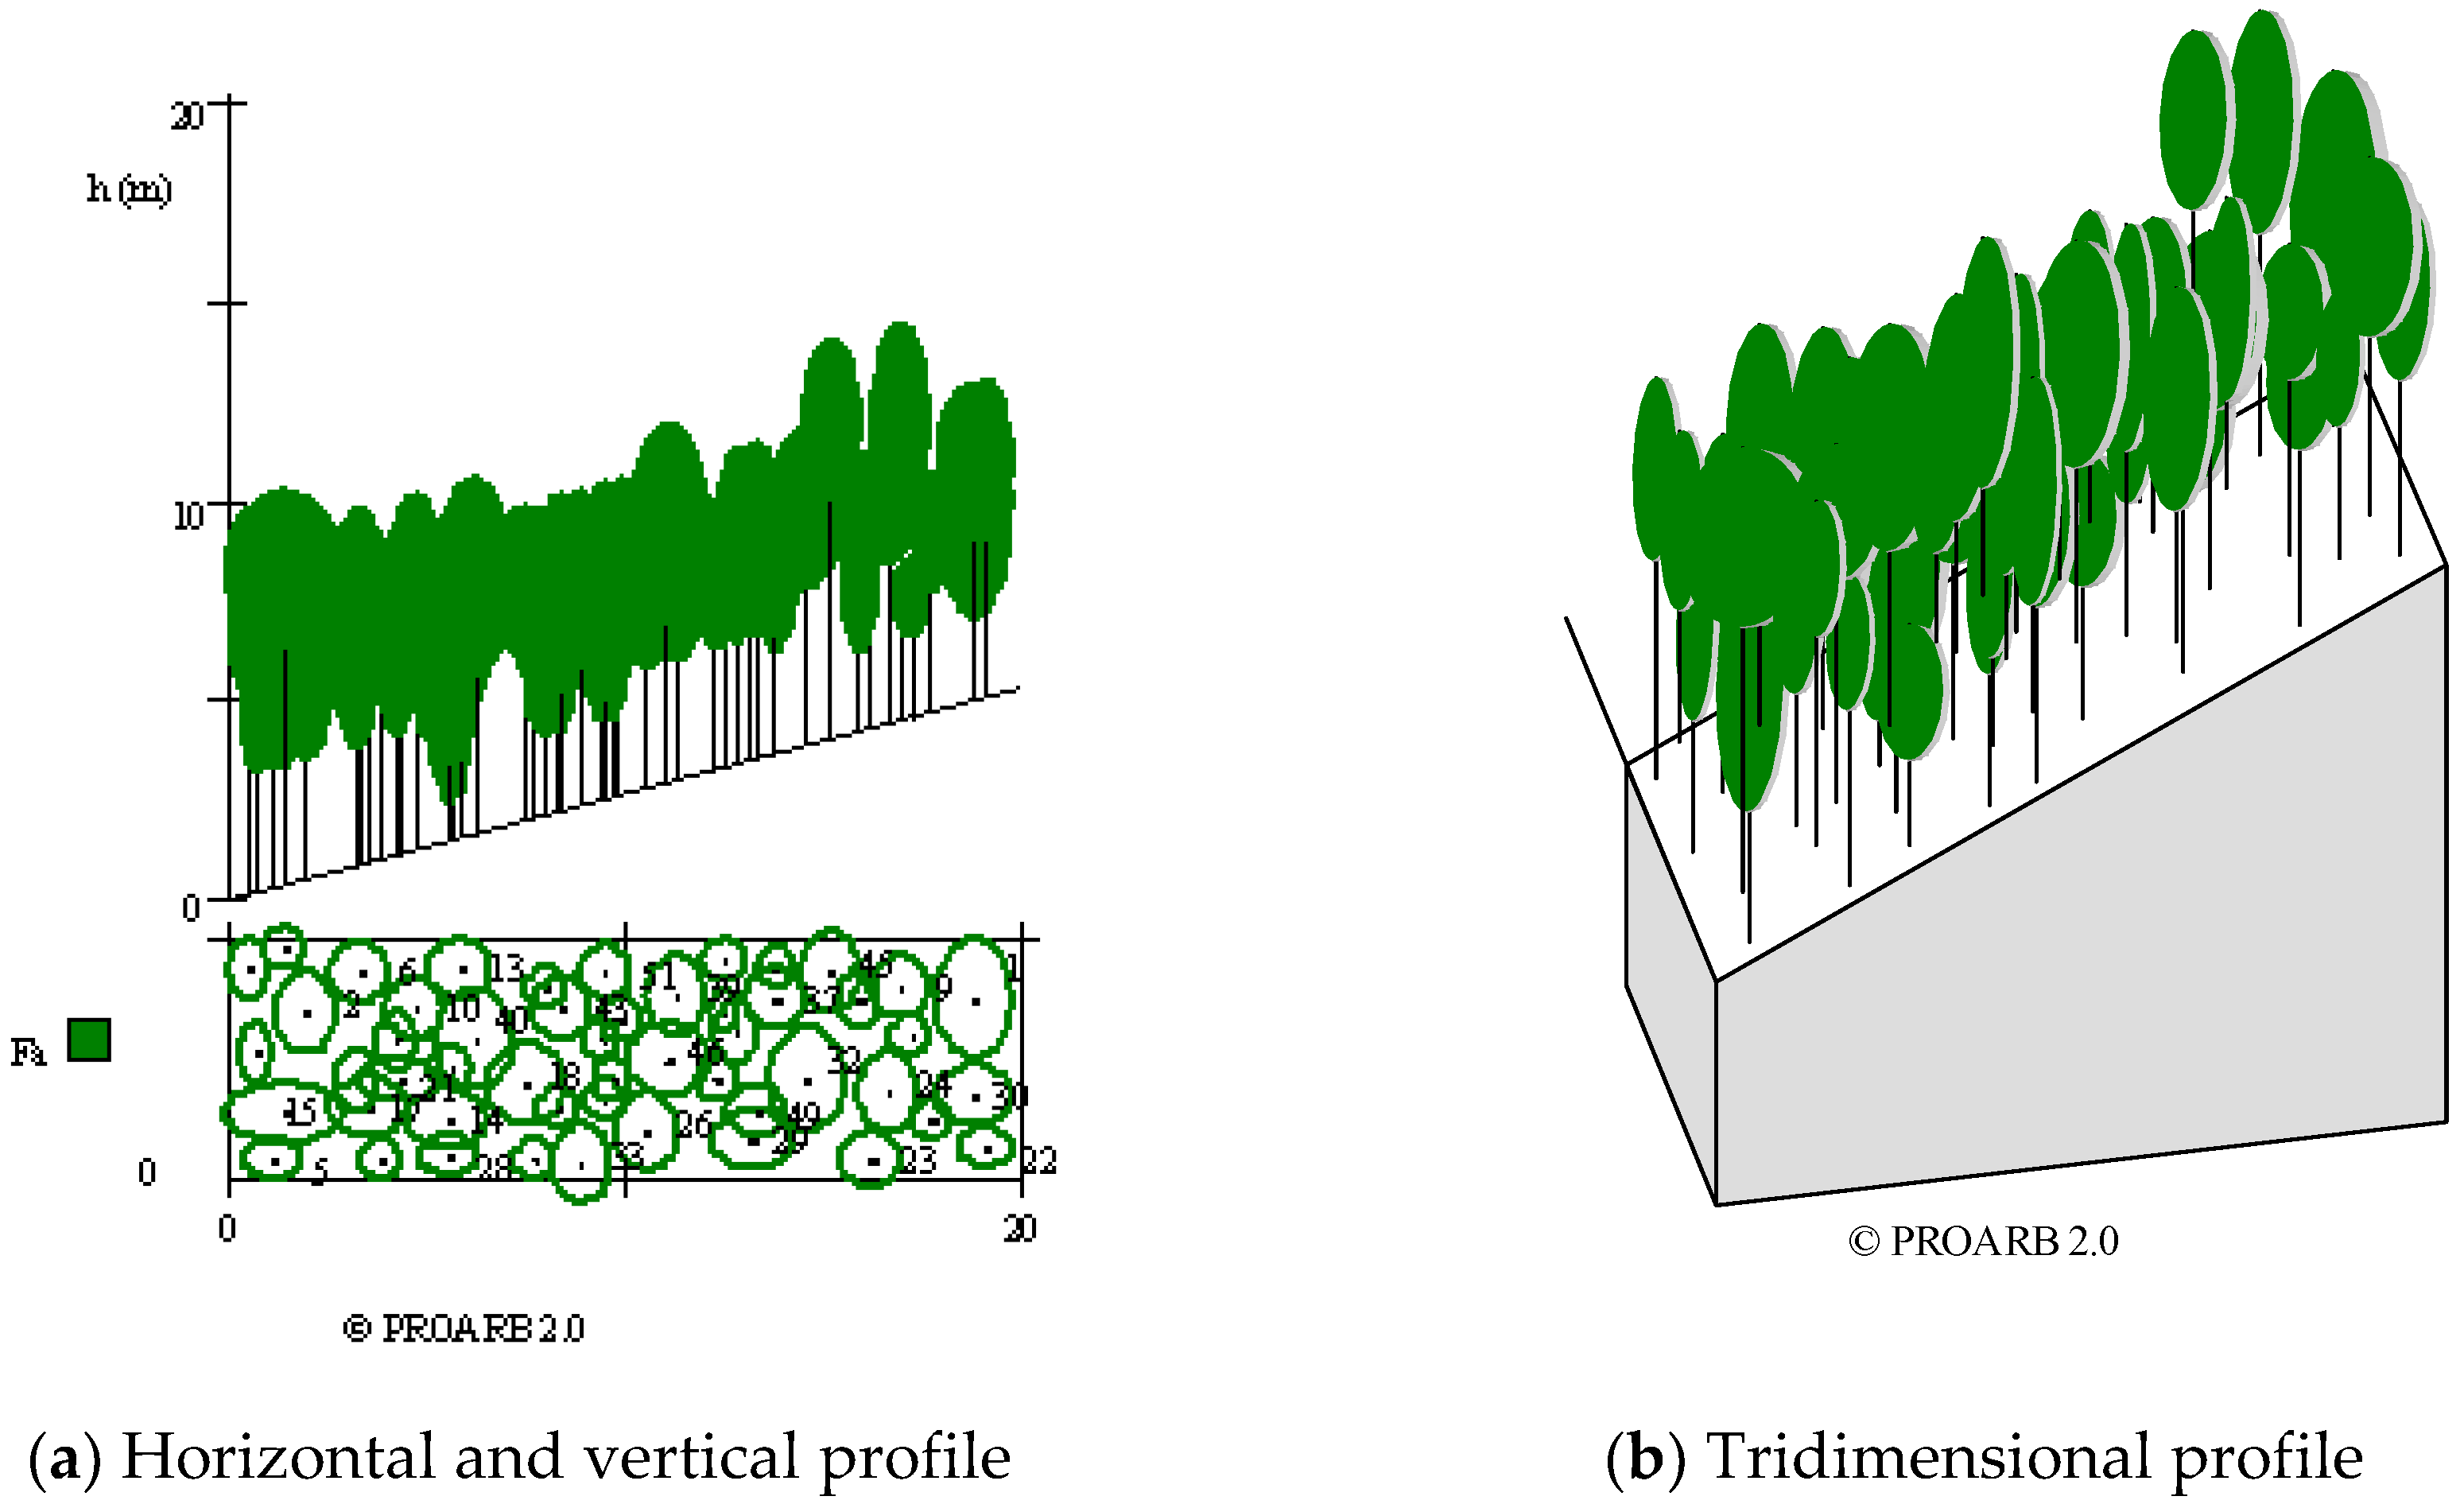
The horizontal, vertical, and three-dimensional profile of the tree can currently be drawn (drawn) with various specialized programs, offering a representative (suggestive) image of the various structural characteristics, which constitute edifying arguments for the establishment and effective application of silvotechnical interventions, in various stands.
The PROARB 2.0 program was used to draw the profiles related to the studied stands, and to process the data collected from the field in the appropriate sheets according to the model presented in the table 3.
Figure 9 present the profiles of a representative sample for the stand in plot 112C.
It can be seen that the studied stand has a high-thickness index from the analysis of the profiles. In this stand, silvotechnical interventions did not realized in accordance with the growth stage, or selective combined thinning, respectively.
Figure 10 present the profiles of a representative sample for the stand in plot 114C.
It can be seen that the studied stand has a high-thickness index from the analysis of the profiles.
Analysing the profiles in
Figure 10, we see that the stand in plot 114C does not have fully richness (k<1), because in this stand interventions were carried out in accordance with the growth stage (combined thinning).
Figure 11 present the profiles of a representative sample for the stand in plot 115B.
It can be seen that the studied stand has a high-thickness index from the analysis of the profiles. In this stand, the situation is similar to that of the stand in plot 112C.
4. Discussion
Determination of the dependence of the average diameter of the crowns on the relative (corresponding) height of the trees from the young beech stands allows the calculation of the potential area of the average crown with relatively high precision and implicitly of the optimal growing space of the trees in the studied stand.
The distribution of the average diameter of the crowns in the case of the inventoried trees, by height classes, with the interval between classes of one meter, allows us to apply the mathematical model effectively. It can be observed that the distribution of the relative frequencies of the heights according to the height classes approaches a normal distribution, with some minor deviations
Figure 3,
Figure 5 and
Figure 7 [
47,
48,
49,
50,
51]
Having the mathematical model and, respectively, the spline regression for young beech stands from production class II, depending on the average height of the stand (which can be measured with precision on site), the average value of crown diameter Dscrw can be calculated with relatively high precision for a similar stand.
Determination of the arithmetic average diameter of the crowns Dacrw requires the accomplishment of some statistical-mathematical inventories on the experimental areas, which in young and dense stands is relatively difficult due to both the specifics of the data that must be recorded and the work process.
The analysis of the two possible options for determining the average diameter of the crowns highlights the advantage of using the cubic spline regression, compared to the determination of the arithmetic average diameter of the crowns, taking into account the previously mentioned aspects, but also the insignificant differences between the values of the calculated average diameters.
If the error value e is analyzed, which is calculated with the formula (17) for the two values of the crown diameter (with spline and linear regression), it is found that they are very close in value.
The differences between the two average values of the diameter of the tree crowns are mainly due to the calculus algorithm and, to a small extent, to the precision of the field determination of some dendrometric elements, such as the diameter of the crown in the two perpendicular directions.
The strong, linear correlations between the average diameter of the crowns and the corresponding average heights for the inventoried trees, expressed by the values of R2, in each stand under study, highlight the fact that these allometric correlations can be successfully used to determine the average diameter of the crown with high precision for various beech stands, depending on the average height.
The average diameter of the crowns calculated due to the two variants was used to determine the optimal growing space Sg [
6], which is synonymous with the potential area of the average crown cca [
8] Depending on the value of the growing space, the optimal number of trees per surface unit was obtained - 10,000 m
2 (formula (3)) in two variants.
In the case of the third variant, the number of trees per surface unit was also calculated based on the number of trees inventoried on the experimental plots, which was extrapolated from 4800 m2 to 10000 m2.
As a result, three values were determined for the number of trees per hectare using three different methods –
Table 11, in order to carry out an appropriate comparative analysis.
The differences regarding the number of trees determined in the three variants are due to the different calculation methods used.
The process of intraspecific and interspecific competition of the trees in the stand determines the density and spacing of the stand, with direct implications on the growth in height, growth and development of crowns, growth in diameter at breast height (D
bh) [
52], of the increase in volume and implicitly on the assortments of raw wood.
The consistency of the stands under study was expressed with the thickness index according to the number of trees. In this context, the thickness indices were calculated in three variants for the three analyzed beech stands, depending on the method of determining the number of trees in the field. The number of trees in the table was extracted (used) from the general production tables [
7] for the same species, production class, and age.
The values of the consistency indices for each stand are relatively close. For the stand in plot 112C, wherein no combined selective thinning was performed, the thickness indices calculated in the three variants values more than one -
Table 12 that are relatively identical, indicating a high thickness.
In the stand in plot 114C, the thickness indices have below par units, relatively close, tending to 1 -
Table 12, because a combined selective thinning was applied in the respective stand four years ago, and the full consistency is not totally restored (on the entire surface of the stand).
For the stand in plot 115B, for which no first combined selective thinning was performed, the values of thickness indices calculated in the three variants have close above par values -
Table 12, highlighting its high thickness.
From the analysis of the thickness index values, calculated in the three variants, for each stand under study, it is found that regardless of the method of determining the number of trees, the index values are close or even identical.
As a result, the cubic spline regression method used to determine the diameter of the crowns and later for other characteristics of the stands ensures a high precision.
The spacing of stands represents a characteristic of their synthesis, which can provide information about the size and growing space of stands, with implications on the specificity and intensity of silvotechnical interventions, the growth, and development of trees and stands, in the context of the implementation and application of sustainable management of wood forest resources.
The tree spacing is expressed using the Hart-Beking spacing index (21), in two ways of determining the theoretical distance between the trees, when they are arranged on the site under the form of a square of side a4, and respectively in the center and corners of a regular hexagon of side a6.
The dominant height hdom for the studied beech stands was determined with a linear equation (22), depending on the average height of the trees inventoried in the experimental areas.
The value of the number of trees per hectare, determined in the three variants, was used to calculate the theoretical distance between the trees.
As a result, two variants of three values of the
S% spacing index were determined for each tree -
Table 13.
From the analysis of the results presented in
Table 13, it is found that in the stands where no combined selective thinning was applied, the spacing indices have values in the range 12.3% - 16,5% respectiv 13,3%-17,8%. In the stands where thinnings were performed, the spacing indices have values in the range 19,8% - 21,4% respectiv 19,8 - 21,4%.
The intensity of the intervention in the analyzed stands can be established according to the value of the spacing factor S%, or it can be calculated according to the number of trees to be extracted, formula 27 and formula 28.
The values of the spacing indices can suggest the state of the stand’s density and the limits of the amount of the intervention intensity per number of trees. In this context, if S% > 20%, the stand has a typical density; if
S% = 15 - 20%, the stands are relatively dense; if S% = 10 - 15%, the stands are dense and relatively unstable; and if
S% < 10%, the stands are excessively dense [
6].
In the stand from plot 112C, the intervention intensity can be moderate up to 15%, and in the stand from plot 115B, the intervention intensity can be low by up to 10% [
54].
The intensity of the intervention per number of trees was determined depending on the number of trees in the stand calculated at the time of the inventory due to the three variants and, respectively, the number of trees in the production tables for the same species, production class and age.
As a result, three values related to the intensity of the intervention were obtained for each studied stand -
Table 14.
The value of the intensity of the intervention to be adopted must be correlated with the size/density and spacing of the stand, although in some silvicultural interventions applied in the beech stands in Europe, the value of the intensity of the intervention is predetermined, being usually high [
53]. In this context, to ensure a sustainable management of wood forest resources, the intensity of the interventions for the stands under study must be moderate, considering their structural characteristics and the periodicity of the interventions that are relatively short, respectively, of 5 - 7 years [
54].
Considering these aspects regarding the recommended intensity of combined selective thinning in the studied stands, consolidated ecosystemic stability can be ensured, with direct implications on the continuity of the forest in space and time and, respectively, on the sustainable and optimal valorization of products and services provided by the forest.
The promotion of some silvotechnic interventions with low to moderate intensities in young naturally-regenerated beech stands will also positively influence carbon sequestration, an important aspect in the context of current climate change mitigation strategies [
55].
The valorization (use) of the wood resulting from the application of silvotechnical interventions in young beech stands will allow the optimization of the heating costs for various users in the analyzed adjacent area, aspects that have also been reported on the occasion of relatively recent studies[
56].
In the future, the intention is to extend the research in naturally regenerated beech stands of various production classes and ages in order to establish spleen-type regressions between the average height and their crown diameter.
The research area will also be extended to young oak and resinous stands, in order to establish some correlations between the average height and average diameter of the tree crowns. As a result, expeditious and precise options will be proposed for establishing the number of trees and implicitly the intensity of the intervention per number of trees, in the mentioned stands, because the area covered by them occupies more than 50% of the national forest fund.
5. Conclusions
The regression spline method used in this paper allowed to establish the law of dependence between the crown's diameter and the tree's height in the case of the young beech stand where there was no intervention or little intervention. The properties of the obtained cubic spline suggest a linear dependence, which can be achieved through a linear regression of the experimental data.
Consequently, this paper establishes that the most suitable dependence law between the crown diameter and the height of trees for young beech stands is the linear dependence with a positive slope. This aspect was exemplified on three plots, the linear dependence being obtained with precise values for each plot.
By integrating the obtained spline function, the optimal value of the average diameter for each plot was also determined. This average value of the crown diameter contributes to establishing the optimal number of trees per surface unit and to the determination of some structural and synthetical stand characteristics.
As a result, the intensity of silvotechnical interventions per tree number in young stands can be scientifically rigorously substantiated, taking into account the number of existing trees per hectare, determined according to the diameter of the crowns and the average height and, respectively, the optimal number of trees recommended by the production tables for the same stand type.
The study and analysis of the spatial profiles, and implicitly of their structural characteristics, are useful for the adoption of sustainable forest management solutions.
In future works, it would be interesting to establish the correlations between the average heights and the diameters of the tree crowns for various species, ages, production classes, and, respectively, for various cultural operations-specific maintenance cuts.
