Preprint
Article

Energy Levels and Transition Data of Cs VI

Altmetrics

Downloads

87

Views

44

Comments

0

A peer-reviewed article of this preprint also exists.

This version is not peer-reviewed

Submitted:

08 January 2024

Posted:

09 January 2024

You are already at the latest version

Alerts
Abstract
Previously reported atomic data (spectral lines, wavelengths, energy levels, and transition probabilities) have been collected and systematically analyzed for the Cs VI. The present theoretical analysis is supported by extensive calculations made for Cs VI with a pseudo-relativistic Hartree--Fock (HFR) method together with the superposition of configuration interactions implemented in Cowan's codes. In this critical evaluation, we provided several possibly observable lines with Ritz-wavelengths, computed from the optimized energy levels, and theoretical transition probabilities with their estimated uncertainties. In addition, we provided the radiative transition parameters for several forbidden lines within the ground configuration $5s^25p^2$ of Cs VI.
Keywords: 
Subject: Physical Sciences  -   Atomic and Molecular Physics

1. Introduction

In general, accurate atomic data on wavelengths, energy levels, transition probabilities, and oscillator strengths are needed to determine the atmospheric abundances of elements in any astrophysical source or object. By using these atomic data astronomers have for the first time identified elements heavier than hydrogen and helium in the atmospheres of white dwarfs. These were mostly traces of trans-iron elements (atomic numbers Z ≥ 30) detected in the atmospheres of different hot white dwarfs G191-B2B, Feige 24, GD 246, HD 149499B, HZ 21, and RE 0503-289 [1,2,3,4,5]. Recently, Chayer et al. [6] identified the presence of cesium (Z = 55) by means of observing the several absorption lines of Cs IV-VI in the Far Ultraviolet Spectroscopic Explorer (FUSE) spectrum of the hot He-rich white dwarfs (spectral type DO) HD 149499B. The atomic structure and radiative transition parameters data for these atomic/ionic species, up to the ionization stage VII, were necessary to obtain accurate stellar atmospheric models for white dwarfs. Chayer et al. [6] calculated oscillator strengths for the bound–bound transitions of Cs IV-VI ion with AUTOSTRUCTURE and GRASP2K atomic structure codes. Both AUTOSTRUCTURE and GRASP2K calculations were performed with the same sets of atomic models, however, an extensive radiative transition parameter data set was provided from the AUTOSTRUCTURE calculations only, and the GRASP2K results were used for the comparison purpose. For Cs VI spectrum, these are for the 5 s 2 5 p 2 { 5 s 5 p 3 + 5 s 2 5 p 5 d + 5 s 2 5 p 6 s } transitions.
In terms of experimental observations, the first study on Cs VI spectrum was made by Tauheed et al. [7]. They reported the levels of the ground configuration 5 s 2 5 p 2 and those for the excited 5 s 5 p 3 , 5 s 2 5 p 5 d , and 5 s 2 5 p 6 s configurations, with the help of the spectra of cesium photographed in the 325–1400 Å wavelength region on a 3-m normal-incidence vacuum spectrograph at the Antigonish laboratory, Canada. The spectrograph was equipped with a 2400 lines/mm holographic grating giving a reciprocal dispersion of 1.385 Å/mm in the first order of wavelength. The cavities of the aluminum electrodes, filled with pure cesium carbonate and cesium nitrate salts, were used in a triggered spark source, which acts as a light source. A 30 kV trigger unit with a little current to initiate a 6 kV spark discharge in vacuum was used. Additionally, the wavelength information was also supplemented from the previously captured spectra of cesium, which were recorded on a 10.7-m normal incidence vacuum spectrograph at the National Institute of Standards and Technology (NIST), Gaithersburg. The Kodak short wave radiation (SWR) plates were used for all spectral exposures. The calibrations of spectrograms were carried out using the known lines of carbon, oxygen, and nitrogen present in the spectra as impurities, and they claimed an accuracy of 0.005 Å for strong and unperturbed lines in the entire wavelength region mentioned above. Tauheed et al. [7] findings were included in the latest spectral compilation of Cs I-LV provided by Sansonetti [8], and the same was also available in the NIST’s Atomic Spectra Database (ASD) [9].
In the present work, our motivation is to provide an extensive atomic data set for the Cs VI spectrum, also to carry out critical evaluations for these data by means of their comparison with the existing data in the literature. In addition to these, we aim to compute radiative transition parameters for the forbidden lines between the levels of the ground configuration 5 s 2 5 p 2 .

2. Results and Discussion

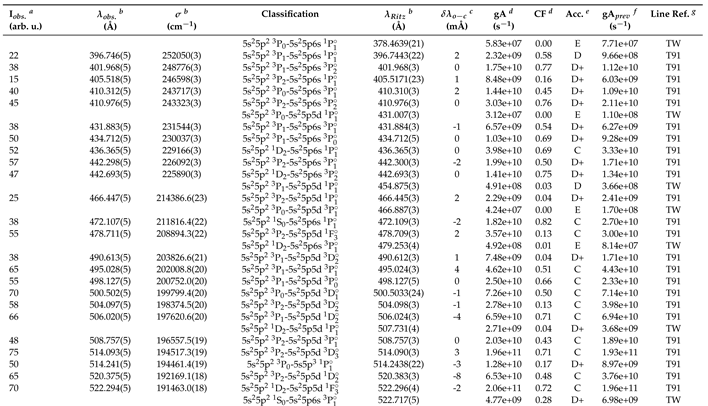
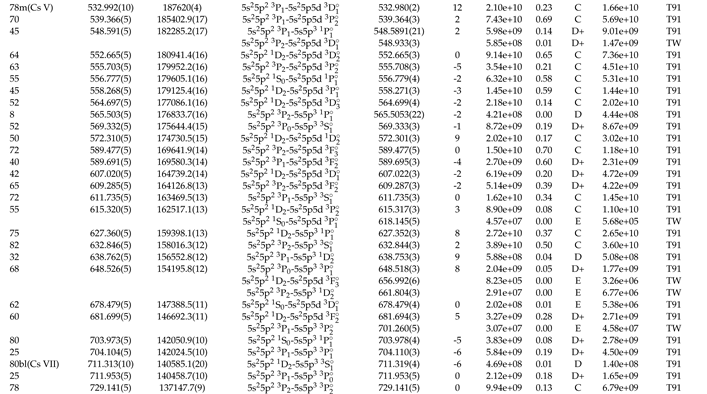
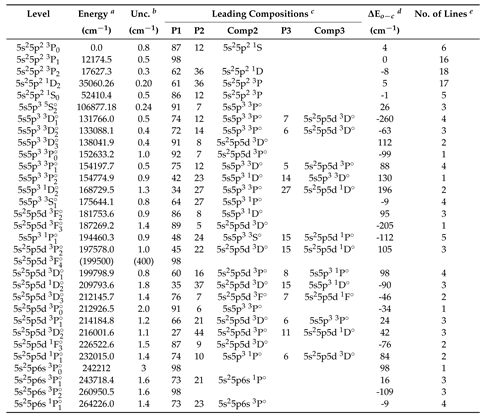
The main results of our work on Cs VI are summarized in Table 1 and Table 2. In Table 1 we present the classified lines of Cs VI with their radiative transition parameters and Table 2 describes the optimized energy levels with their LS compositions. The LS composition vectors are computed using the theoretical calculations made with Cowan’s codes (see Section 2.2). Nevertheless, specific details of the current analysis are discussed in the sections below.

2.1. Optimization of Energy Levels

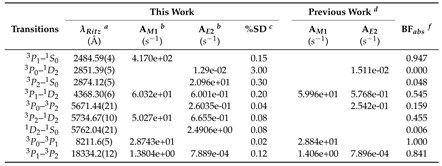
First, we collected all experimentally observed wavelength data of Cs VI in the literature [7]. Those are for the 5 s 2 5 p 2 5 s 5 p 3 , 5 s 2 5 p 2 5 s 2 5 p 5 d , and 5 s 2 5 p 2 5 s 2 5 p 6 s transition arrays. The energy values of the levels involved in transition were computed from their observed spectral line data, i.e., transition wavelengths with uncertainties. In this regard, we used a least-squares level optimization code, `LOPT’ [10]. The transition wavelength, its measurement uncertainty, and unique lower and upper-level designation for each transition were necessary data inputs to the "LOPT-code". In the initial stage of the optimization, only observed wavelengths of Cs VI reported by Tauheed et al. [7] with an uncertainty of 0.005 Å were included as an input to the code. The levels involved were supported by 67 observed lines, resulted with their optimized energy values and uncertainties (see Table 2). For each of the observed wavelengths, their counterpart (precise) Ritz wavelengths with uncertainties were determined from the optimized energy levels. Furthermore, we use the optimized energy levels to derive the accurate Ritz wavelengths for several possibly observable lines of Cs VI (see Table 1) and for the forbidden transitions within the ground configuration (see Section 2.3).

2.2. Theoretical Calculations and Transition Probabilities

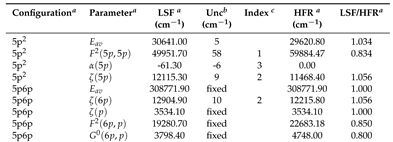
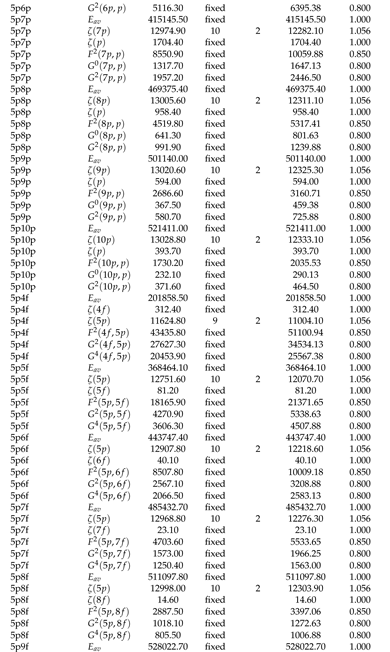
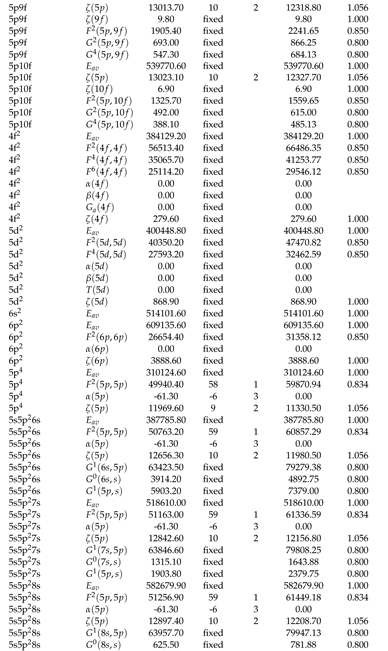
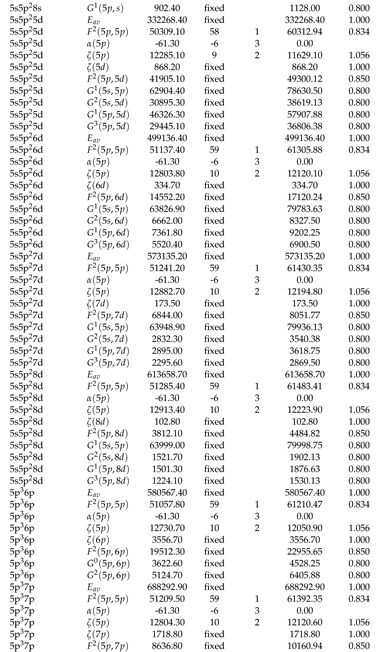
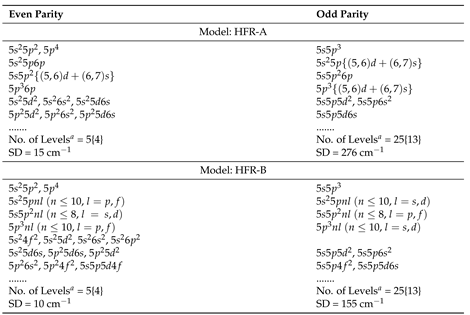
To support the present experimental observations, theoretical calculations were made within the framework of a pseudo-relativistic Hartree-Fock (HFR) approach with the superposition of interacting configurations, which implemented in Cowan’s suite of codes [11]. Two sets of atomic models with varying configuration types, described in Table 3, were considered in this work. In both models the Slater’s parameters were kept at 85% of the HFR-value for the F k , 80% for the G k , 70% for R k , and the E a v and ζ n , l parameters were fixed at 100% of their HFR-values. A least-squares parametric fitting (LSF) was performed to minimize the differences between the observed and theoretical energy values in the Cs VI. The standard deviation (SD) of the parametric LSF is given in Table 3 together with the total number of known levels and the number of free parameters involved in the fitting process, the latter is given in curly brackets. All fitted parameters together with their values in the LSF of the present HFR-B model is supplemented by us in Table A1. Using these fitted energy parameters, the transition probabilities (TPs or gA-values) were re-calculated for Cs VI. The obtained gA-values from the HFR-B model along with their cancellation factor ( | C F | -values) are given in Table 1. The LS percentage compositions of the observed energy levels from the present HFR-B calculations are given in Table 2. As we compared our present LS percentage compositions with previously reported LS percentage compositions in references [7,8] a good matching was found. The LS assignments for most of the levels were found to be good without any ambiguity in our extensive calculation except for two levels of 5 s 2 5 p 5 d configuration:-   1 D 2 at 209793.6 cm   1 and   3 D 2 at 216001.6 cm   1 , which were assigned to their second-largest LS percentage component (see Table 2). This observation is in agreement with those made previously by Tauheed et al. [7].
Our main purpose of employing two different models – HFR-A and HFR-B with varying configuration types – was to compute and compare the transition probabilities data. Accordingly to compare and estimate the uncertainties of the transition probabilities with those reported by Chayer et al. [6] for the transition 5 s 2 5 p 2   { 5 s 5 p 3 + 5 s 2 5 p 5 d + 5 s 2 5 p 6 s } arrays in Cs VI. In their recent work, Chayer et al. used the multiconfiguration Breit-Pauli (MCBP) method to compute the A-values of C IV-VI. The MCBP method was implemented in the AUTOSTRUCTURE atomic structure code [12,13]. The configuration sets included in our HFR-A calculations are the same as those used in the MCBP calculations for Cs VI by Chayer et al., whereas those in our HFR-B model are more extensive in terms of the number of interacting configuration sets included in these calculations (see Table 3). Two types of comparison were employed in this work:- i) a qualitative scheme using gA-values and ii) a quantitative scheme, described in refs. [14,15,16,17], based on d S -values. The results of these comparisons were illustrated in Figure 1. The agreement between gA-values obtained from the present HFR-A and HFR-B calculations is shown in Figure 1(a), and their comparison of corresponding S-values given in Figure 1(b). The latter d S comparison shows gross disagreements within 26% for HFR-A and HFR-B models. Indeed the uncertainty for 56 strong lines with S≥0.10 AU (atomic units) was 9% and 47% for the remaining 27 weak lines (see Figure 1(a)). All of these weak lines are strongly affected by cancellations, i.e., those having | C F | < 0.10 , as a consequence, their S-values or gA-values are less reliable in comparison to those unaffected ones with | C F | 0.10 (see details ref. [11]). There is an alternate method to derive the uncertainty for each S-value by means of generating different sets of LSF calculations with varying parameters within their uncertainty bounds. We use this method to estimate the uncertainty for each of the S-values obtained from the present HFR-B model. A total of six sets of LSF calculations were performed with varying parameters, and SDs of their S-values were computed and the same were taken to be an estimator for uncertainties in S-values. It should be noted that these SDs served as internal uncertainties for S-values obtained from the present HFR-B model, therefore, they represent as error bars in our final comparison model (see Figure 1(d)). Nonetheless, the strong lines with S≥0.10 AU have an average uncertainty 5% and 18% for the other weak lines. The S-values which suffer strong cancellations have an average uncertainty of about 18% and unaffected ones were accurate within 3%. Our final comparison model for gA-values from the HFR-B with those from the MCBP method by Chayer et al. [6] is shown in Figure 1(c), and their corresponding S-values comparison is given in Figure 1(d). To obtain more reliable estimates, this comparison model was selected, and its main results are summarized here. Though the gross disagreements between two sets of S-values fall within 160%, the strong lines with S≥1 AU are accurate within 24%, 34% for the lines within the mid-range of S∈[0.1, 1) AU, it is about 50% for weak lines with S∈[0.01, 0.1) AU, and the remaining very weak lines are accurate within two to three orders of magnitude. It has been found that most of the cancellation affected (25 out of 33) transitions from the HFR-B model with | C F | < 0.10 fall in the category of accuracy >50%, and they are also the weak lines with S < 0.10 AU. All transitions listed Table 1 were provided with gA-values and their uncertainty codes and | C F | -values. The uncertainty codes are C types with an accuracy ≤25%, D+ with ≤40%, D with ≤50%, and those E types with an accuracy >50%.
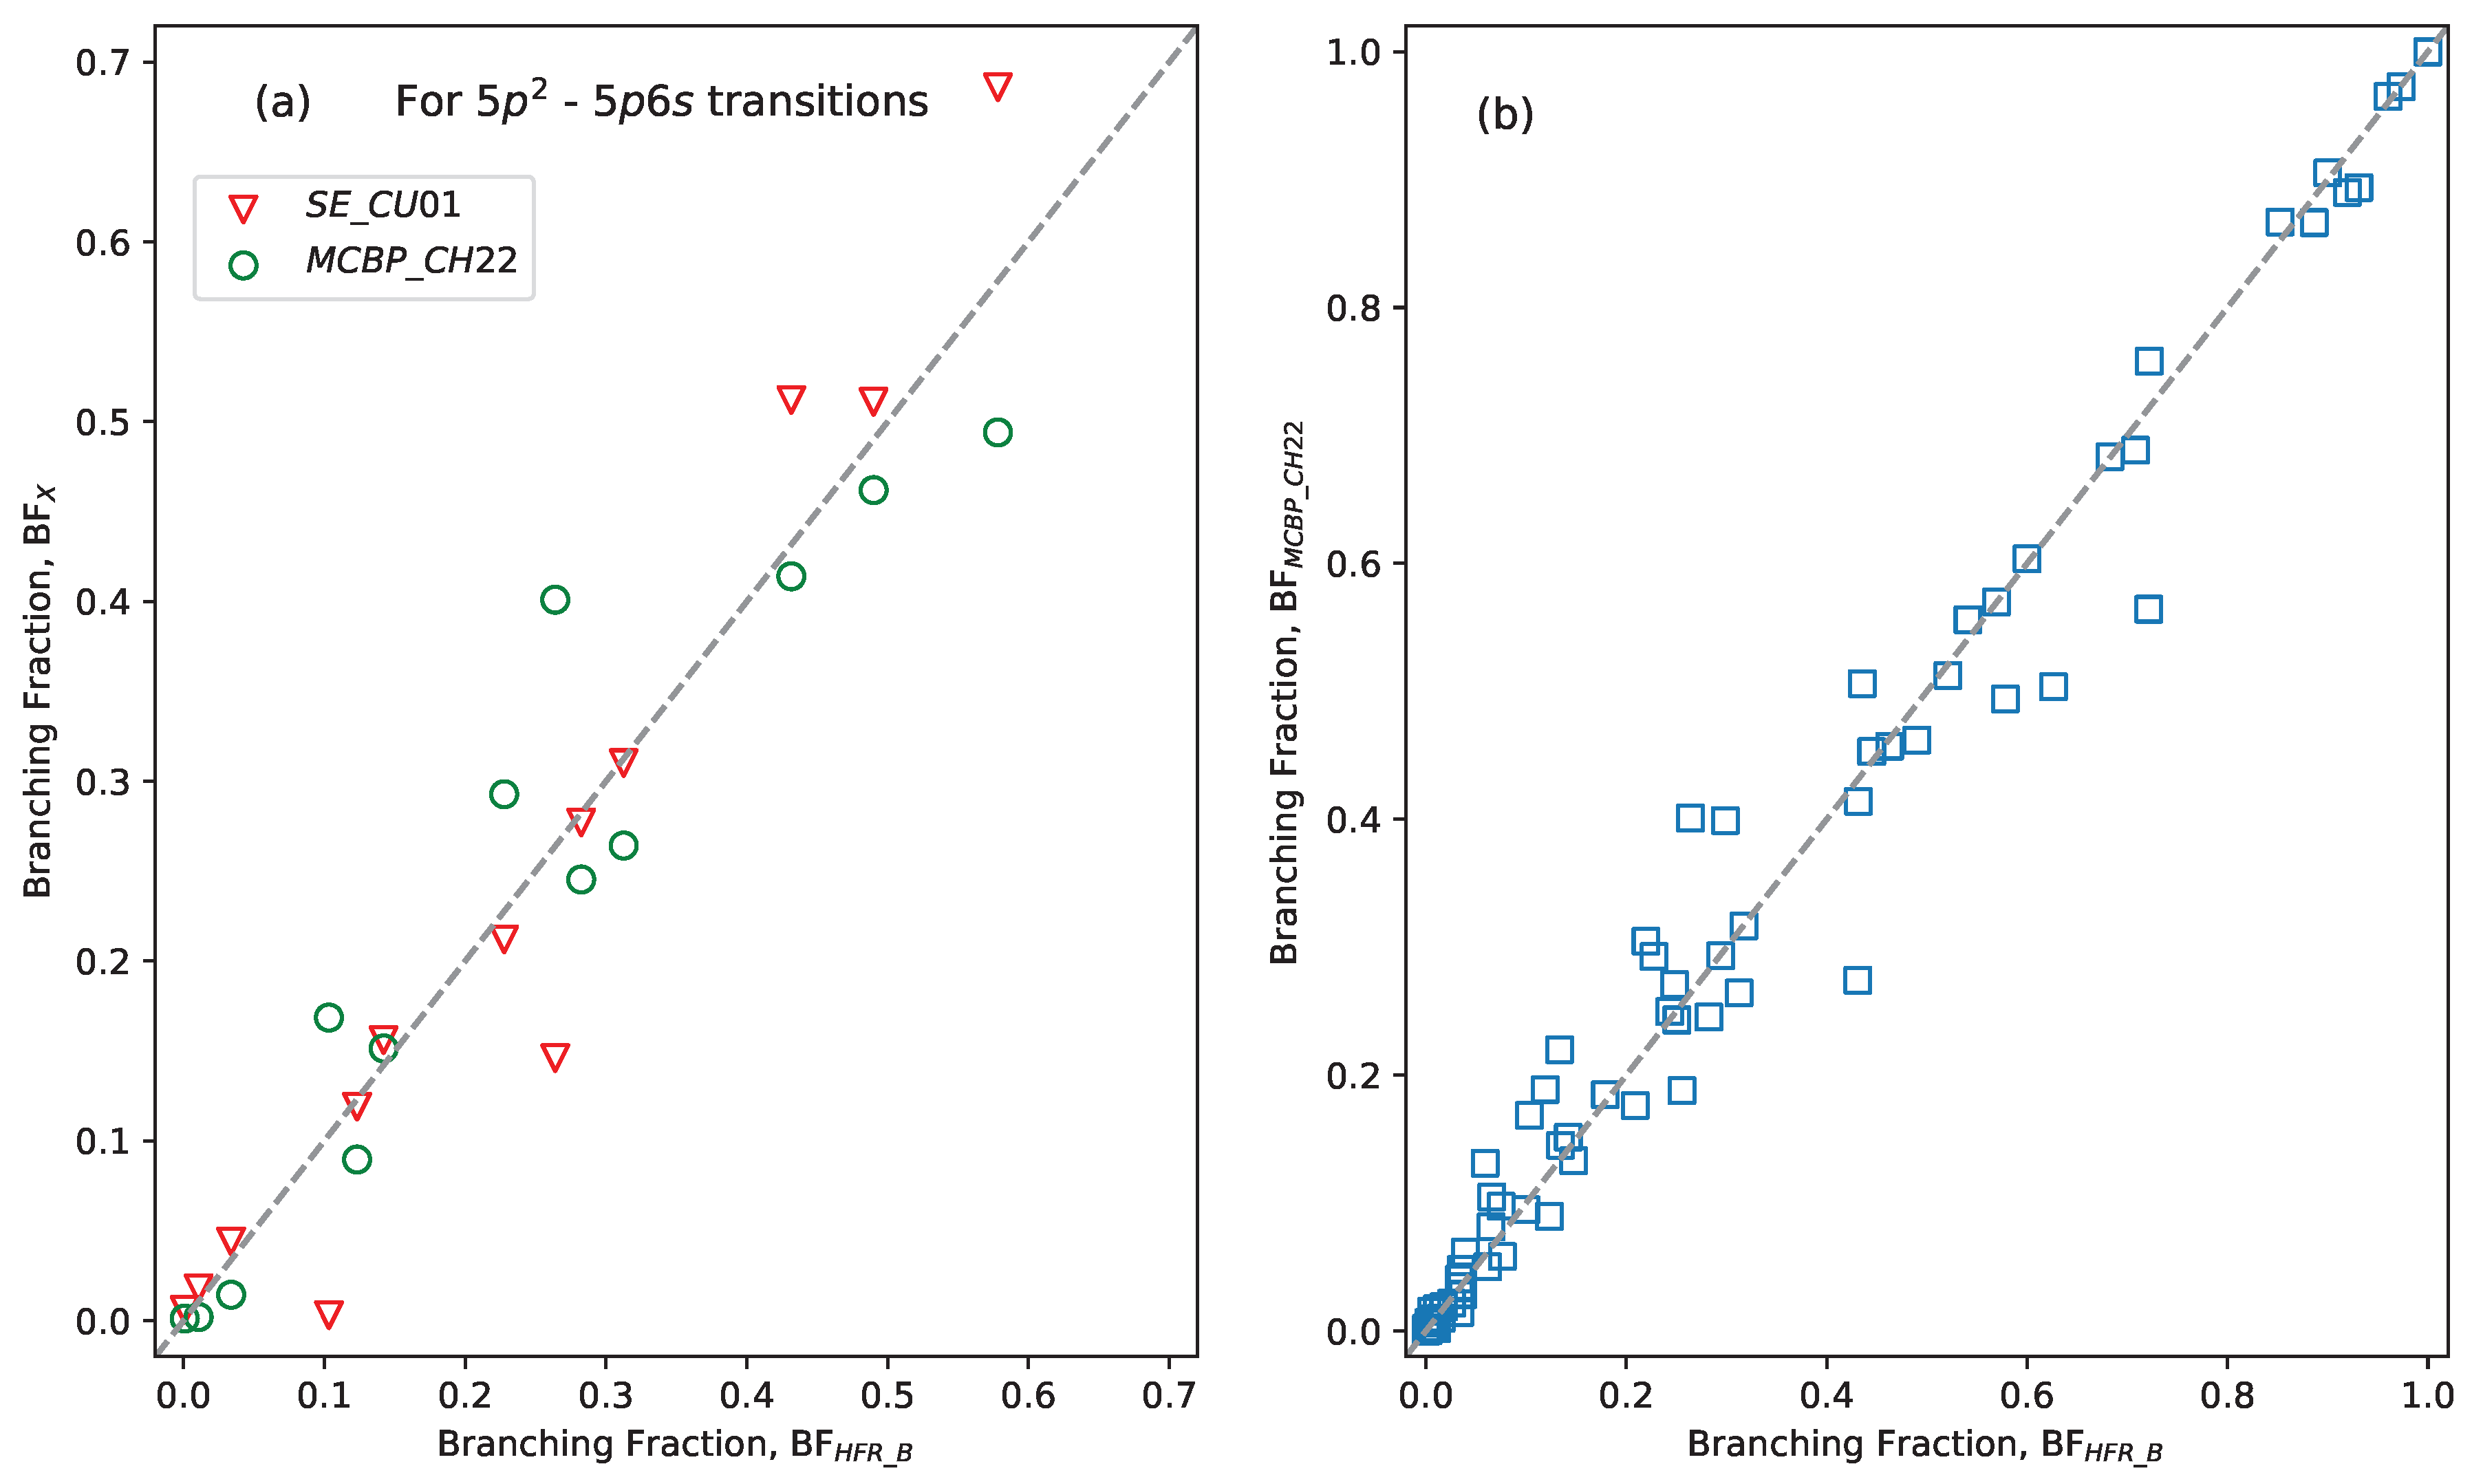
Curtis [18] previously determined semi-empirical branching fraction (BF) for lines in the 5 s 2 5 p 2 - 5 s 2 5 p 6 s transition array in Sn I isoelectronic sequence (Sn I-Cs VI) by (least-squares) adjusting energy values of the levels involved, thereby obtained the optimized values for F 2 and ζ p p parameters for 5 s 2 5 p 2 and G 1 and ζ p for 5 s 2 5 p 6 s configuration, followed by determination of the mixing angles to compute the relative transition rates (A-values). Recently, Chayer et al. [6] also reported the branching fractions (BFs), which computed from the MCBP A-values, for 5 s 2 5 p 2 5 s 2 5 p 6 s transitions. The comparison of these two BF data sets with 13 lines shows a gross disagreement within 300%. The most deviated data points were for the following (mostly) inter-combination transitions: 5p2 1S0–5p6s 1,3 P 1 , 5p2 3P0–5p6s 1 P 1 , 5p2 3P1–5p6s 1 P 1 , and 5p2   1 D2–5p6s 3P   1 . This indicates that either the singlet-triplet mixing angles were not computed accurately in the calculations of Curtis [18] or partly some of the MCBP A-values of Chayer et al. [6] are largely uncertain for the 5 s 2 5 p 2 - 5 s 2 5 p 6 s transitions. To investigate this, we compute the BFs for these transitions from their corresponding gA-values of the present HFR-A and HFR-B models. A good agreement (within 10%) between BF-values obtained from HFR-A and HFR-B models was found for the 5 s 2 5 p 2 - 5 s 2 5 p 6 s transitions. Nevertheless, the BFs from the extensive HFR-B model was selected by us for their consequent comparison with those of Curtis [18] and Chayer et al. [6]. The results of this comparison are shown in Figure 2(a). It has been found that the general agreement between BFs of HFR-B and those of Curtis is good except for two inter-combinations 5p2   1 S0–5p6s   3 P 1 and 5p2   3 P0–5p6s   1 P 1 transitions, which shows that the computed singlet-triplet mixing angles alone were inadequate to define A-values for these transitions by Curtis [18]. It should be noted that the intermediate coupling semi-empirical approaches of Curtis [18] are valid in the absence of configuration interaction. However, this assumption is not fully true for complex atomic systems, including Cs VI, in which both intra- and inter-configuration interactions are significant and particularly for the spin-forbidden inter-combination lines which are more sensitive to cancellation effects [19]. Figure 2(b) shows the gross comparison of the BFs from the present HFR-B model with those from the MCBP calculations of Chayer et al. [6] the transition 5 s 2 5 p 2   { 5 s 5 p 3 + 5 s 2 5 p 5 d + 5 s 2 5 p 6 s } arrays, and their overall agreement is found to be reasonably good.

2.3. Radiative parameters for transitions within the ground configuration

Biemont et al. [20] reported energy levels and radiative transition probabilities for states within the 5 s 2 5 p k ( k = 1 5 ) configurations of atoms and ions in the indium, tin, antimony, tellurium, and iodine isoelectronic sequences. These transitions are astrophysically important forbidden types having magnetic-dipole (M1) and/or electric-quadrupole (E2) components. For Cs VI spectrum, Biemont et al. [20] reported 3 M1 and 4 E2 transitions within the states of the ground configuration 5 s 2 5 p 2 . We also made a separate HFR calculations [11] with the even parity configurations in our HFR-B model. Our calculations are more extensive than the previous one made by Biemont et al. [20] for Cs VI. The obtained line parameters for 5 M1 and 7 E2 transitions of Cs VI are summarized in Table 4. To estimate the uncertainties of the presently obtained A-values, we performed a Monte Carlo technique suggested by Kramida [21]. This method evaluates the uncertainties of A-values by randomly varying the Slaters parameters of the known configurations included in the LSF. A total of 20 trials were made to estimate the uncertainties (%SD) of A-values of the transitions within the ground configuration and those are also given in Table 4.

3. Conclusion

In this work, a thorough critical analysis of the Cs VI spectrum has been carried out with the help of extensive HFR calculations made by us using Cowan’s codes. This compilation provided a set of optimized energy levels (Table 2) of Cs VI ion with their uncertainties, as well as observed and Ritz wavelengths with their uncertainties for the levels involved. To the best of our knowledge, the accurate Ritz wavelengths with their uncertainties for this spectrum have been derived for the first time, and the same has been presented in Table 1 along with gA-values. The uncertainty estimates have been made of gA-values from their comparison with the previous data [6]. In addition, we report the radiative parameters for the forbidden (M1 and E2) lines within the ground configuration 5s25p2 of Cs VI.

Author Contributions

Conceptualization, K.H.; methodology, K.H.; software, A.H., K.H. and A.T.; validation, A.H. and K.H.; formal analysis, A.H. and K.H.; investigation, A.H. and K.H.; data curation, K.H.; writing—original draft preparation, A.H. and K.H.; writing—review and editing, K.H. and A.T.; visualization, A.H. and K.H.; supervision, K.H. and A.T.; project administration, K.H.. All authors have read and agreed to the published version of the manuscript.

Funding

This research received no external funding.

Conflicts of Interest

The authors declare no conflict of interest.

Appendix A. Supplementary Data
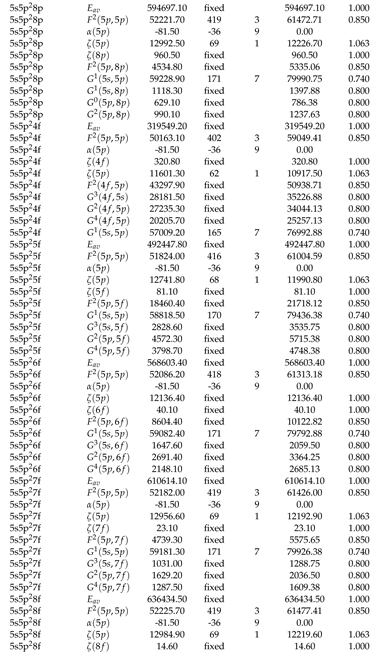
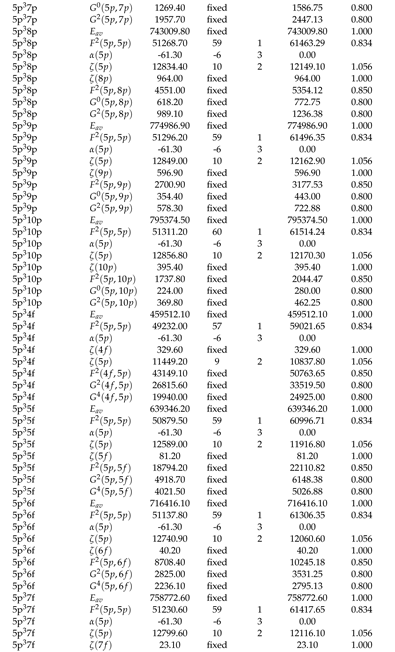
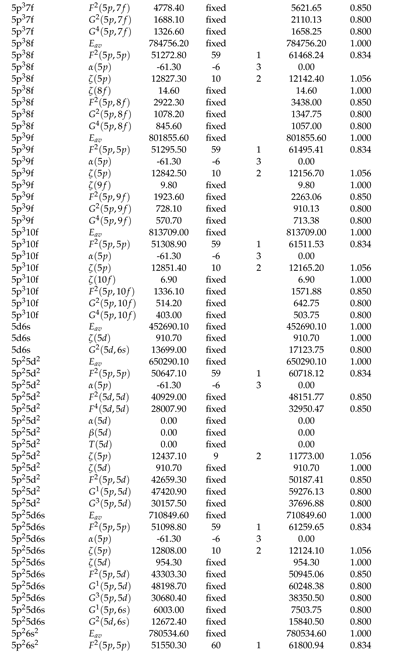
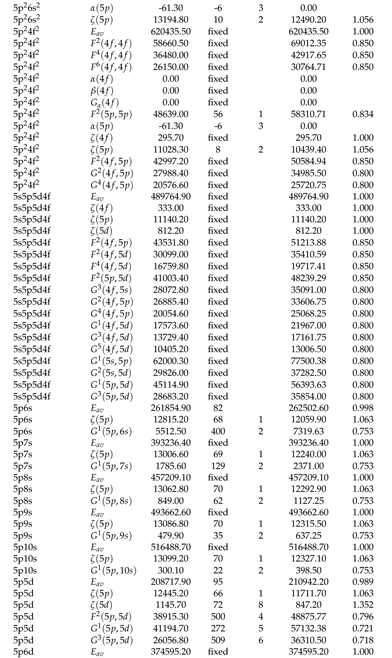
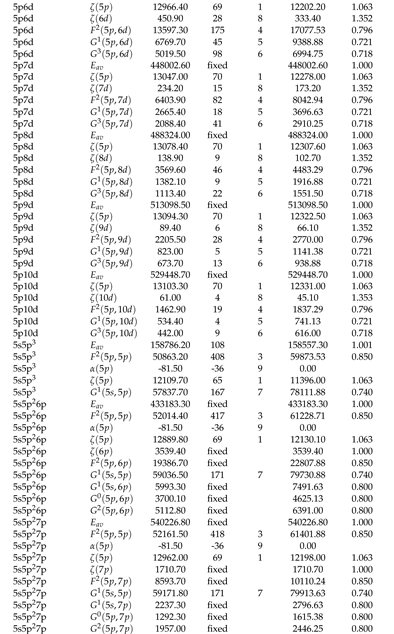
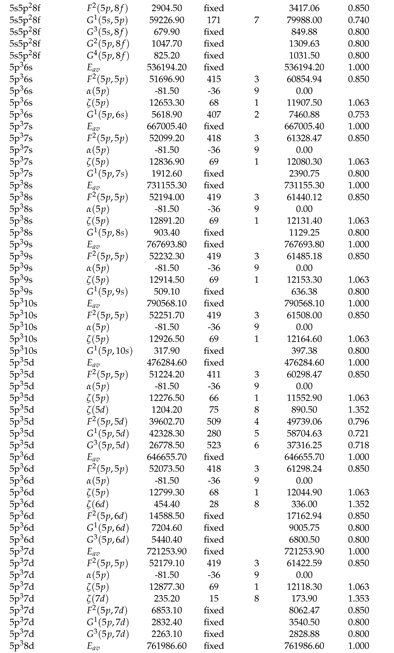
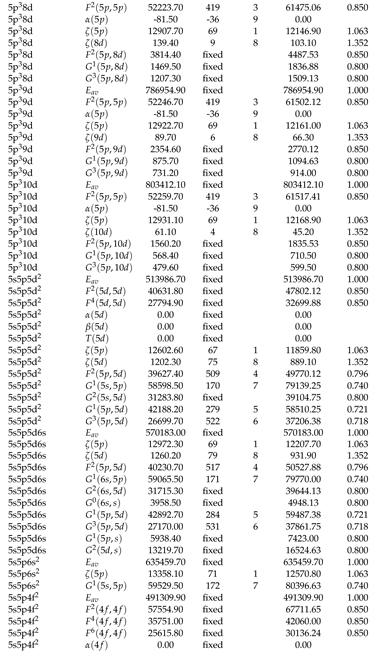
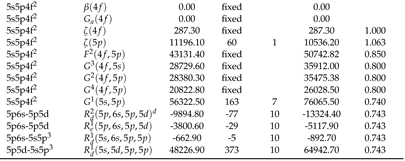
Table A1. Least-Squares Fitted Parmeters of Cs VI.
Preprints 95784 i007
Preprints 95784 i008
Preprints 95784 i009
Preprints 95784 i010
Preprints 95784 i011
Preprints 95784 i012
Preprints 95784 i013
Preprints 95784 i014
Preprints 95784 i015
Preprints 95784 i016
Preprints 95784 i017
Preprints 95784 i018
a Configurations involved in the calculations and their Slater parameters with the corresponding Hartree–Fock (HFR) and/or least-squares-fitted (LSF) values and their ratios. b Uncertainty of each parameter represents its standard deviation. c Parameters in each numbered group were linked together with their ratio fixed at the HFR level. d All other configuration-interaction (Rk) parameters for both parities were fixed at 70% of their HFR values.

References

  1. Vennes, S.; Chayer, P.; Dupuis, J. Discovery of Photospheric Germanium in Hot DA White Dwarfs. Astrophys. J. Lett. 2005, 622, L121–L124. [CrossRef]
  2. Chayer, P.; Vennes, S.; Dupuis, J.; Kruk, J.W. Abundance of Elements beyond the Iron Group in Cool DO White Dwarfs. Astrophys. J. Lett. 2005, 630, L169–L172. [CrossRef]
  3. Rauch, T.; Quinet, P.; Knörzer, M.; Hoyer, D.; Werner, K.; Kruk, J.W.; Demleitner, M. Stellar laboratories . IX. New Se V, Sr IV-VII, Te VI, and I VI oscillator strengths and the Se, Sr, Te, and I abundances in the hot white dwarfs G191-B2B and RE 0503-289. Astron. Astrophys. 2017, 606, A105. arXiv:astro-ph.SR/1706.09215]. [CrossRef]
  4. Werner, K.; Rauch, T.; Knörzer, M.; Kruk, J.W. First detection of bromine and antimony in hot stars. Astron. Astrophys. 2018, 614, A96. arXiv:astro-ph.SR/1803.04809]. [CrossRef]
  5. Löbling, L.; Maney, M.A.; Rauch, T.; Quinet, P.; Gamrath, S.; Kruk, J.W.; Werner, K. First discovery of trans-iron elements in a DAO-type white dwarf (BD-223467). Mon. Not. R. Astron. Soc. 2020, 492, 528–548. arXiv:astro-ph.SR/1911.09573. [CrossRef]
  6. Chayer, P.; Mendoza, C.; Meléndez, M.; Deprince, J.; Dupuis, J. Detection of cesium in the atmosphere of the hot He-rich white dwarf HD 149499B. Mon. Not. R. Astron. Soc. 2023, 518, 368–381. arXiv:astro-ph.SR/2211.01868. [CrossRef]
  7. Tauheed, A.; Joshi, Y.N.; Kaufman, V. Analysis of the four lowest configurations of five times ionized cesium (Cs VI). Phys. Scr. 1991, 44, 579–581. [CrossRef]
  8. Sansonetti, J.E. Wavelengths, Transition Probabilities, and Energy Levels for the Spectra of Cesium (Cs I-Cs LV). J. Phys. Chem. Ref. Data 2009, 38, 761–923. [CrossRef]
  9. Kramida, A.; Ralchenko, Y.; Reader, J.; NIST ASD Team. NIST Atomic Spectra Database, Version 5.8 (Gaithersburg, MD: National Institute of Standards and Technology). Available online: http://physics.nist.gov/asd, 2020.
  10. Kramida, A.E. The program LOPT for least-squares optimization of energy levels. Comput. Phys. Commun. 2011, 182, 419–434. [CrossRef]
  11. Cowan, R.D. The Theory of Atomic Structure and Spectra (Berkeley, CA: University of California Press) and Cowan code package for Windows by A. Kramida, 1981. [CrossRef]
  12. Eissner, W.; Jones, M.; Nussbaumer, H. Techniques for the calculation of atomic structures and radiative data including relativistic corrections. Comput. Phys. Commun. 1974, 8, 270–306. [CrossRef]
  13. Badnell, N.R. A Breit-Pauli distorted wave implementation for AUTOSTRUCTURE. Comput. Phys. Commun. 2011, 182, 1528–1535. [CrossRef]
  14. Kramida, A. Critical evaluation of data on atomic energy levels, wavelengths, and transition probabilities. Fusion. Sci. Technol. 2013, 63, 313–323. [CrossRef]
  15. Kramida, A. Critically evaluated energy levels and spectral lines of singly ionized indium (In II). J. Res. Natl. Inst. Tech. 2013, 118, 52. [CrossRef]
  16. Kramida, A. A critical compilation of energy levels, spectral lines, and transition probabilities of singly ionized silver, Ag II. J. Res. Natl. Inst. Tech. 2013, 118, 168. [CrossRef]
  17. Haris, K.; Kramida, A.; Tauheed, A. Extended and revised analysis of singly ionized tin: Sn II. Phys. Scr. 2014, 89, 115403. arXiv:physics.atom-ph/1312.0261]. [CrossRef]
  18. Curtis, L.J. Branching Fractions for the 5s25p2 - 5s25p6s Supermultiplet in the Sn Isoelectronic Sequence. Phys. Scr. 2001, 63, 104–107. [CrossRef]
  19. Oliver, P.; Hibbert, A. Energy level classifications and Breit Pauli oscillator strengths in neutral tin. J. Phys. B-At. Mol. Opt. 2008, 41, 165003. [CrossRef]
  20. Biemont, E.; Hansen, J.E.; Quinet, P.; Zeippen, C.J. Forbidden transitions of astrophysical interest in the 5pk(k = 1-5) configurations. Astron. Astrophys. Suppl. 1995, 111, 333.
  21. Kramida, A. Assessing Uncertainties of Theoretical Atomic Transition Probabilities with Monte Carlo Random Trials. Atoms 2014, 2, 86–122. [CrossRef]
  22. Peck, E.R.; Reeder, K. Dispersion of Air. J. Opt. Soc. Am. 1972, 62, 958. [CrossRef]
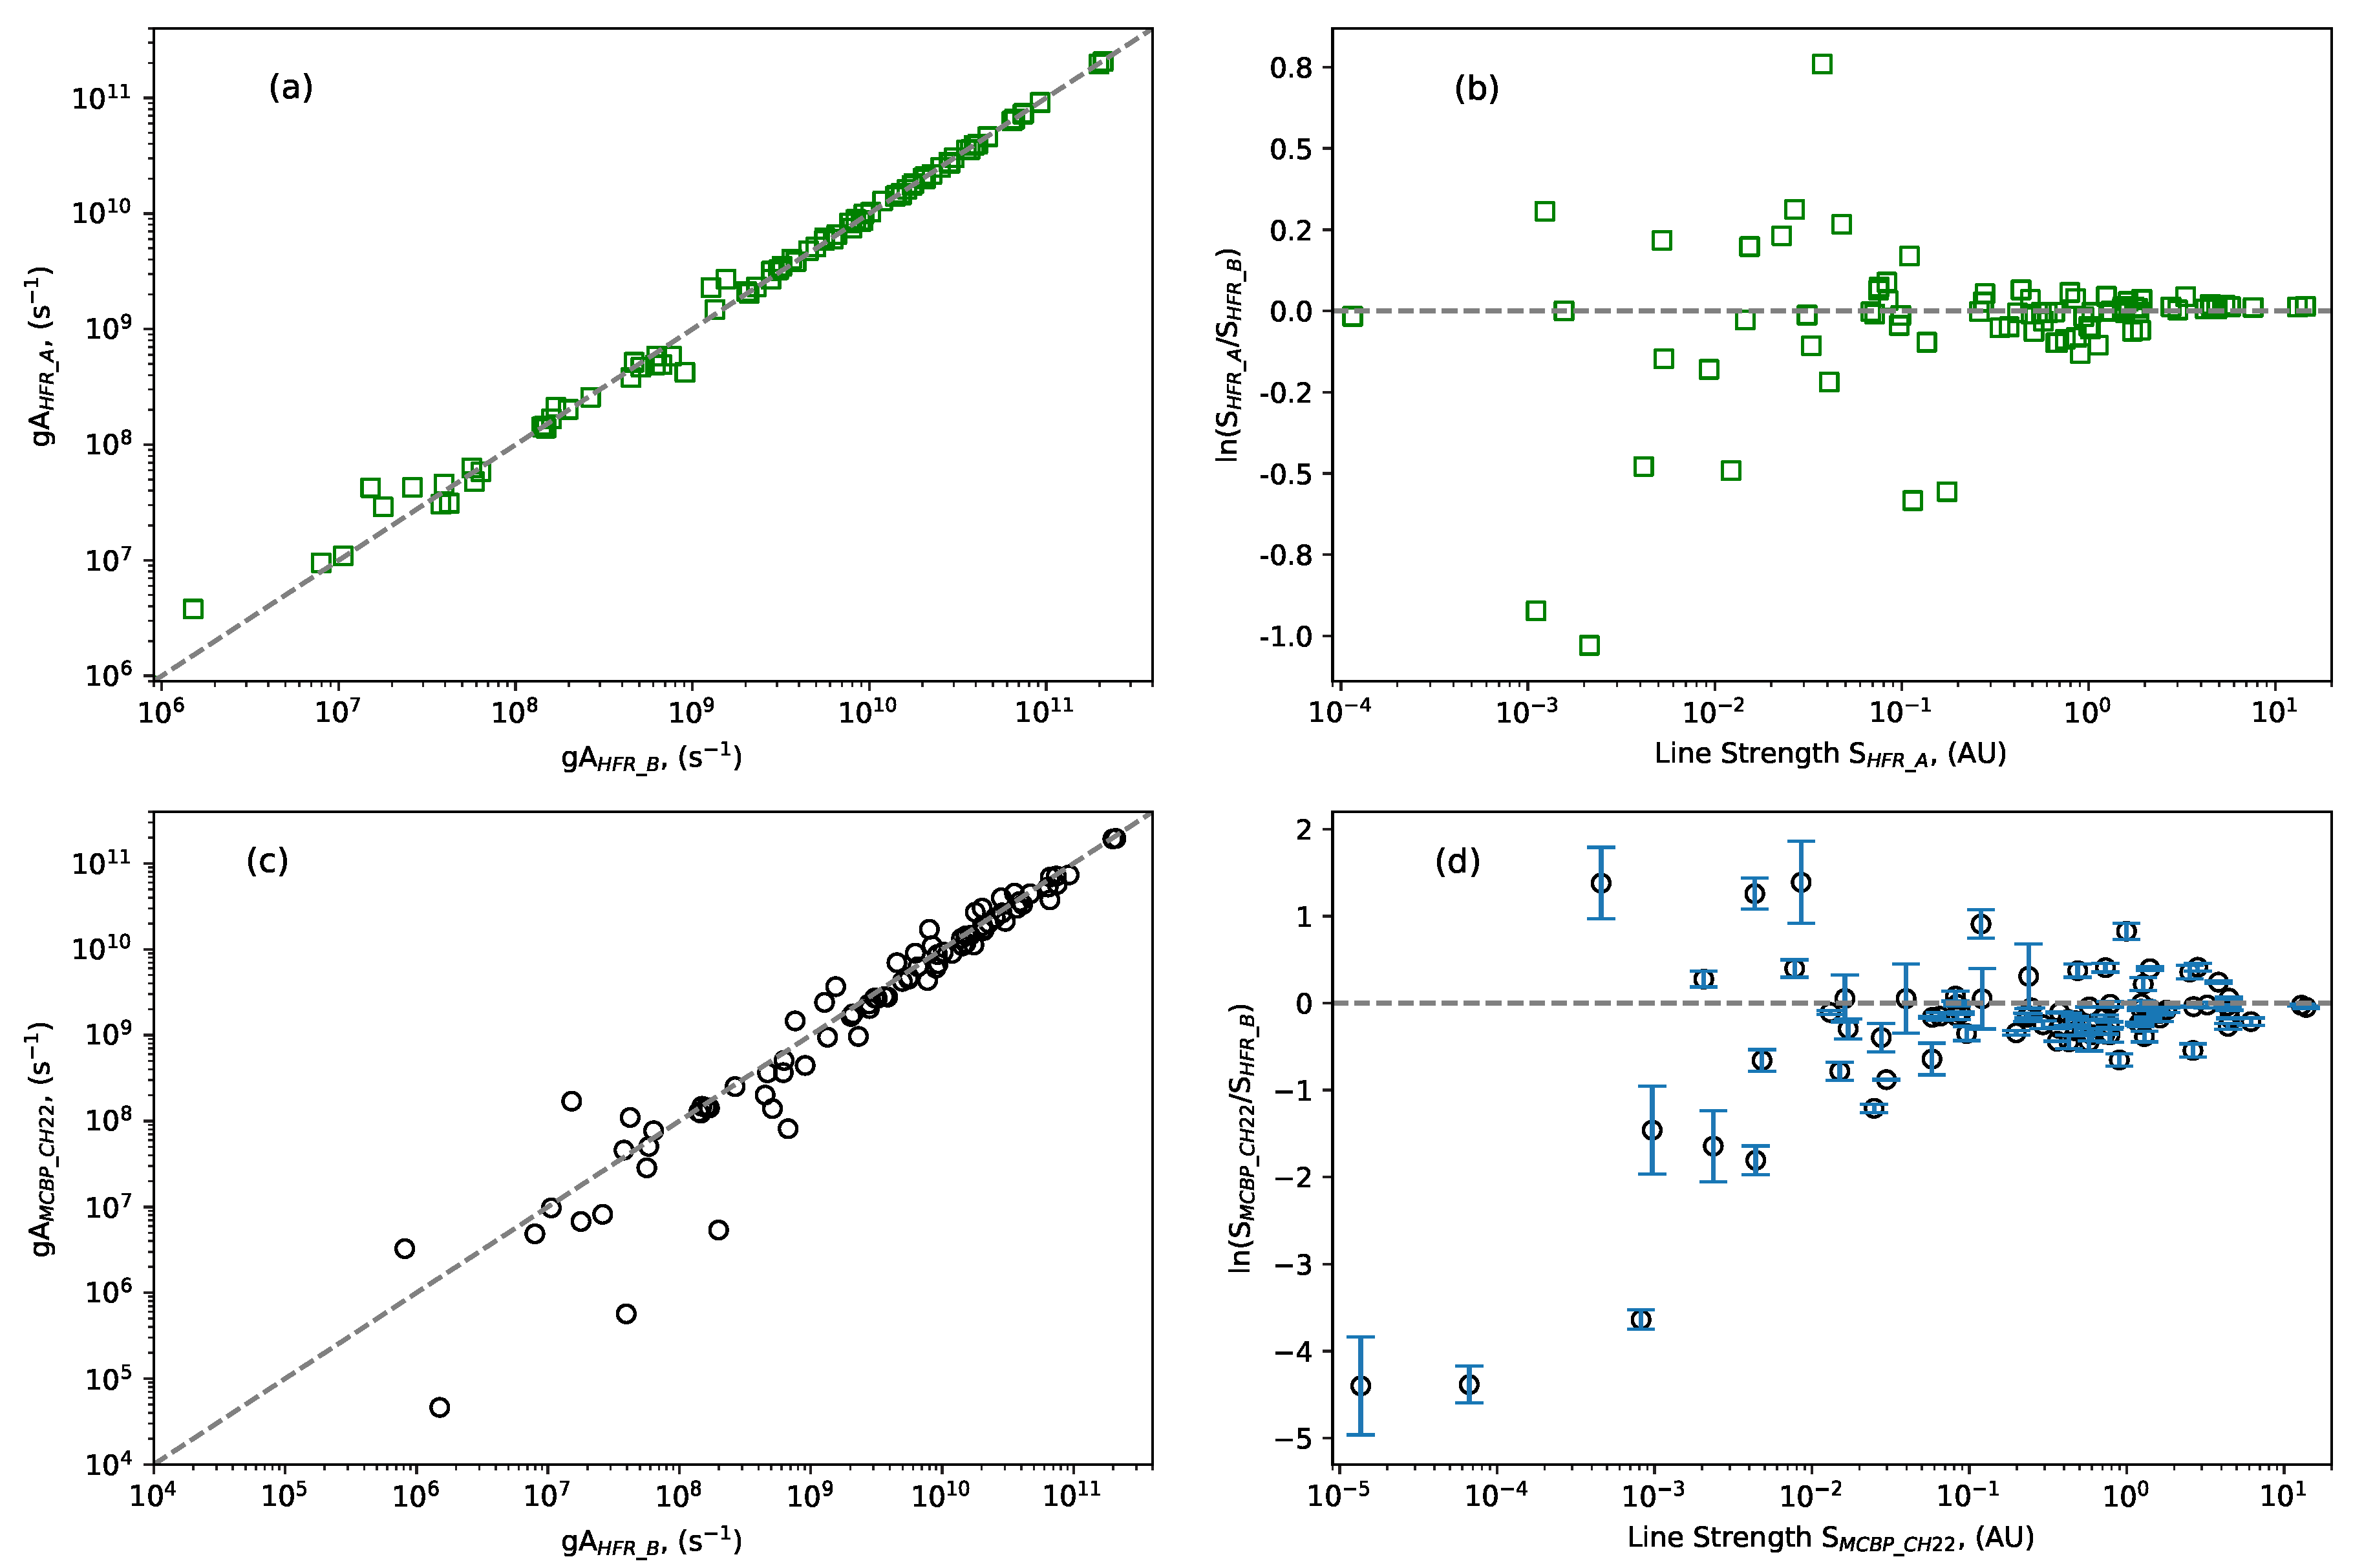
Figure 1. Comparison plots for gA-values and S-values: (a),(b) computed with our HFR-A and HFR-B models and (c),(d) obtained from HFR-B with those of the MCBP model by Chayer et al. [6]. The Error bars in panel (d) represent the internal uncertainties of S-values obtained from the HFR-B model (see the text)
Preprints 95784 g001
Figure 2. A comparison of (a) theoretical branching fractions BF   H F R _ B obtained from the gA-values of the present HFR-B model with those semi-empirical BF   S E _ C U 01 -values (in triangles) reported by Curtis [18] and with those theoretical BF   M C B P _ C H 22 (in circles) computed from the MCBP A-values of Chayer et al. [6] for the selected 5 s 2 5 p 2 5 s 2 5 p 6 s transitions (b) theoretical BF   H F R _ B with those BF   M C B P _ C H 22 for the transition 5 s 2 5 p 2   { 5 s 5 p 3 + 5 s 2 5 p 5 d + 5 s 2 5 p 6 s } arrays (see the text).
Preprints 95784 g002
Table 1. Classified lines of Cs VI.
Preprints 95784 i001
Preprints 95784 i002
Preprints 95784 i003
a Observed relative intensities in arbitrary units, which were taken from T91–Tauheed et al. [7], character of the observed line: bl–blended by a close line, m–masked by a stronger neighboring line. b Observed and Ritz wavelengths (in Å) are given in vacuum for all observed wavenumbers (σ) expressed in cm−1 unit. The quantity given in parentheses is the uncertainty in the last digit. c Difference between the observed and Ritz wavelengths in mÅ, and 1m Å= 10−3 Å. d Weighted transition probability (gA-value) and absolute cancellation factor from the present HFR-B calculations (see Section 2.2). e Accuracy code of the gA-value explained in Section 2.2. f gA-values obtained from the A-values reported previously by Chayer et al. [6]. g Line reference: T91-Tauheed et al. [7], TW—this work.
Table 2. Optimized energy levels of Cs VI.
Preprints 95784 i004
a Optimized energy values obtained using LOPT code [10]. The value given in parentheses and its uncertainty are the theoretical ones from the LSF of Cowan’s code (see Section 2.2). b Uncertainties resulting from the level optimization procedure is the D1 uncertainty (D1 is close to the minimum estimated dispersion relative to any other term; see further detail in ref. [10]). c The LS-coupling percentage compositions determined in this work were made by parametric least-squares fitting with Cowan’s codes (see text), wherein P1 refers to the first percentage value of the configuration and term given in the first column of the table. The remaining percentage (P2, P3) values are provided with their corresponding components. d Differences between observed and calculated energies in the parametric least-squares fitting. Blank for unobserved levels. e Number of observed lines determining the level in the level optimization.
Table 3. Configurations used in HFR models of Cs VI.
Preprints 95784 i005
  a Total number of known levels and the number of free parameters in the LSF, the latter quantity is given in parentheses.
Table 4. Radiative rates for forbidden lines within the levels of ground 5s25p   2 configuration in Cs VI.
Preprints 95784 i006
a Ritz wavelengths (in standard air [22]) and quantity given in parentheses is the uncertainty in the last digit. Wavelength uncertainties are determined in the level optimization procedure (see Section 2.1). b The scaled A-values for M1 and E2 components from the present HFR-B calculations (see Section 2.3). The scaling was carried out with the help of experimental transition energies computed from Table 2. c Uncertainties (%SD) of A-values for M1 and E2 components, obtained using the Monte Carlo method (see the text). d A-values for M1 and E2 components previously reported by Biemont et al. [20]. f Absolute branching fractions for the spectral lines are calculated from the present A-values given in columns 3 & 4.
Disclaimer/Publisher’s Note: The statements, opinions and data contained in all publications are solely those of the individual author(s) and contributor(s) and not of MDPI and/or the editor(s). MDPI and/or the editor(s) disclaim responsibility for any injury to people or property resulting from any ideas, methods, instructions or products referred to in the content.
Copyright: This open access article is published under a Creative Commons CC BY 4.0 license, which permit the free download, distribution, and reuse, provided that the author and preprint are cited in any reuse.
Prerpints.org logo

Preprints.org is a free preprint server supported by MDPI in Basel, Switzerland.

Subscribe

© 2024 MDPI (Basel, Switzerland) unless otherwise stated