1. Introduction
The high collision risk and frequent congestion that arise from traffic merge regions in highway networks are closely related to the frequent and required merging behaviors, especially the transition procedures from an on-ramp to the main roadway [
1,
2]. Among existing research, gap acceptance theory has been extensively explored, which provided a simplified framework for understanding merging behavior mechanism based on gap size and surrounding vehicle positions [
3,
4,
5]. Some scholars have also delved into the impact of external variables on merging behavior at a medium granularity [
6], thereby further strengthened the understanding of merging behavior mechanism.
Even with the advancements in integrating behavior analysis, there still remain gaps that need for more research.
(1) Data Processing and Trajectory Extraction: Existing dataset processing phase is often treated as a black box. The obtained results are difficult to replicate, and the accuracy of conclusions are challenging to verify. The great precision and richness of HD maps, along with their advancement, present an opportunity to improve the accuracy of data processing. Nevertheless, there is currently a dearth of study on how to effectively utilize the volume of data in HD maps to examine driving behavior.
(2) Classification of Merging Patterns: Existing studies categorized merging types into free merging, cooperative merging, and forced merging, with a focus on the impact of merging vehicles on lead and lag vehicles in the target lane [
7]. Zhang et al. categorized merging patterns into nine modes based on the merging speed, acceleration [
6]. Jiang categorization of convergence patterns into four types – no cars, cars in front, cars behind, and cars both in front and behind[
8]. Many scholars investigated merging behavior patterns, often focusing on specific macro traffic flow conditions or considering variations in a single variable over time while neglecting spatial dynamics. In general, their categorization lacks generalizability.
(3) In-depth Analysis of Driving Behavior: Existing studies often fall short in providing a comprehensive perspective. Some of them failed to consider the temporal aspect adequately, focusing solely on specific time frames [
9]. Others overlooked the importance of spatial dimension sub-division within scenarios, which is critical in understanding driving behavior intricacies. Furthermore, existing research often ignored the inherent heterogeneity among different vehicle types.
To bridge the above gaps, we aim to unravel spatial-temporal patterns and heterogeneity of merging behavior. Specifically, we initially establish a trajectory extraction framework utilizing HD maps, aimed at precisely capturing semantic relationships among traffic participants, thereby ensuring accurate data for trajectory mining. Subsequently, we integrate both temporal and spatial dimensions to develop a method for the classification of merging behavior patterns. Finally, we conduct similarity tests to analyze the characteristics of merging patterns, identifying high-risk scenarios in the process. The rest of the paper is organized as follows:
Section 2 provides a literature review.
Section 3 details the processing of the dataset and the establishment of a trajectory extraction framework based on HD maps.
Section 4 presents the results and discussion, including the spatiotemporal merging Pattern Classification and heterogeneity analysis. Conclusions and recommendations for future research end the paper.
2. Literature Review
A merging scenario describes a driving scene where a vehicle approaches the expressway mainline from an acceleration lane. This scenario comprises three components: The first is the static road geometry of the merging area. This includes an acceleration lane with varying dimensions such as length, width, and curvature, as well as an on-ramp lane. The second component is the initial condition and characteristics of the merger scenario. This encompasses the vehicle's starting position, speed, and acceleration, along with the type of vehicle and driver characteristics. The third component is the sequence of action behaviors exhibited by the merging vehicles.
Typically, the merging scenarios involve the following three types of surrounding vehicles:
Lead-vehicle (LV): On the outer side of the expressway main line, the front vehicle closest to the merging vehicle is identified as the leading vehicle. The presence of a LV may affect the selection of a gap that can be inserted.
Rear-vehicle (RV): On the outer side of the expressway main line, the behind vehicle closest to the merging vehicle is identified as the RV.
Alongside vehicle: There may be alongside vehicle during the merging process, which overlap with the merging vehicle in the longitudinal direction. Such a vehicle may end up being the lead or RV. Scenarios with this type of vehicle can be extremely challenging to merging vehicles.
2.1. Public datasets
The existing public available datasets about the merging behavior are NGSIM, INTERACTION [
10], AUTOMATUM [
11] and AD4CHE [
12]. Although these datasets are invaluable for data-driven driving behavior analysis, they have certain shortcomings. Mainly measured by a static camera, NGSIM data contains only 9206 trajectories and about 3% truck trajectories. The INTERACTION dataset is lacking the trajectories of heavy vehicles. In addition, the NGSIM datasets and INTERACTION are missing precise map reference. The HD map is one of the important technologies for autonomous driving, providing a large amount of more precise vehicle spatial-temporal data. Even though AUTOMATUM contains geo-reference, there are only about half as many vehicles per location as in the exiD dataset [
13]. The AD4CHE dataset gives geo-referenced data, but lacks trajectory of van [
12].
Although the release of some trajectory datasets supported effectively traffic flow research, they also suffer from the dilemma of insufficient sample size, lack of special traffic scenarios, or low traffic density in specific scenarios. These limitations prevent comprehensive research on the interaction between different vehicle types in merging scenarios.
2.2. Merging Pattern Analysis
Recently, scholars categorize merging behavior into several patterns and subsequently conducting analyses on driving behavior based on these classifications. However, as shown in
Table 1, it is not well studied how to interpret merging patterns uniformly and what are the differences between these merging patterns. Daamen et al. divided the merging behavior into five types based on the structure of the road space, but ignored the variations in the temporal dimensions [
14]. Based on the changes in the distance between merging vehicles and the following vehicles in the target lane over a certain time period, Hidas categorized merging behaviors into three types: Free merging, Cooperative merging, and Forced merging [
7].
Subsequently, Ye et al. discovered that the distance between the merging vehicles and the following vehicles did not exhibit significant patterns of change in high-density merging areas [
15]. Instead, they identified a new phenomenon of mutual progressive consistency between merging vehicles and the following vehicles in the target lane, defining it as the " Forced-Cooperative merging ". Zhang et al. considered velocity and acceleration variables and introduced the time-series K-means clustering method to partition segments of merging trajectories into nine merging behavior patterns [
6].
Table 1.
Spatiotemporal merging behavior patterns assessment.
Table 1.
Spatiotemporal merging behavior patterns assessment.
| Year |
Author |
Dataset |
Driving risk analysis |
Consider the critical moments and Situation |
Consider heterogeneity |
Application of HD map |
| 2010 |
Daamen et al. [14] |
NGSIM |
N |
N |
N |
N |
| 2014 |
Sun et al. [16] |
Two On-ramp Bottlenecks in Shanghai, China |
N |
N |
N |
N |
| 2019 |
Liu et al. [17] |
NGSIM |
N |
N |
N |
N |
| 2022 |
Zhang et al. [6] |
INTERACTION |
Partial Y |
N |
N |
N |
| 2022 |
Wang, et al. [18] |
INTERACATION |
Partial Y |
Partial Y |
N |
N |
| 2022 |
Lu et al. [19] |
Outer Ring Expressway, Shanghai, China |
Partial Y |
N |
Y |
N |
| 2023 |
Zhang et al. [20] |
AD4CHE |
Partial Y |
Partial Y |
N |
N |
| Our study |
exiD |
Y |
Y |
Y |
Y |
2.3. Contributions
Our contributions are threefold. Firstly, we introduce the HD maps in the merging area to aid in the extraction of semantic relationships among traffic participants and merging trajectories, which is of significant importance as precise data processing is critical in the study of merging behavior, and offers more reliable research results. Secondly, we examine both temporal and spatial dimensions, revealing various merging patterns and exploring the complexity and dynamics of the merging process. Furthermore, it identifies high-risk merging patterns and highlights the heterogeneity of driving behaviors. The study of heterogeneity in merging behavior lays the groundwork for more adaptive and context-aware autonomous driving algorithms, which are crucial for the seamless integration of autonomous vehicles with human-driven ones.
The trajectory extraction framework not only provides more reliable research results but can also be applied to other areas of traffic behavior analysis. In comparison to existing research that predominantly focused on the variation of following distance in the target lane, this paper considers the dynamic changes in the spatial positions of leading and following vehicles over a specified time range. It places special emphasis on parallel vehicles that frequently interact with merging vehicles but are often overlooked. The inclusion of both temporal and spatial dimensions in our methodology contributes to a more comprehensive understanding of merging behavior, enabling the capture of its dynamic and complex nature. This is of paramount importance for traffic management and safety. Furthermore, the identification of high-risk scenarios contributes to the ability of autonomous vehicles to take preventive or corrective actions, thereby enhancing overall traffic safety.
3. Dataset description and processing
3.1. exiD Dataset
exiD dataset is employed in this paper so as to comprehensively analyze merging behavior in the real world. This dataset records real-world driving data of 69,172 vehicles at seven different locations of German freeway entrances and exits [
13], and offers four files for each recording at every location. These four files include:
A georeferenced road cross-section image is added for each recording session. This image is created by applying filters to remove all moving vehicles from the recorded data as illustrated in
Figure 1.
This file contains the metadata for each recorded video, providing an overall summary of the recording session, such as the recording time, the segment of the road captured, and the total number of tracked objects.
This file contains an overview of all trajectories. The purpose of this file is to allow filtering of trajectories by category, such as based on the type of objects.
This file contains all time-related values for each trajectory, including information such as the current position, speed, and acceleration.
The variables in this paper follow the settings in the exiD dataset, with detailed descriptions of the key variables provided in
Table 2. For explanations of other variables, please refer to the official website.
Through the single-frame images in
Figure 2, we can gain a brief understanding of the conditions at seven locations. Seven collection locations are similar, but they differ in terms of road conditions, mainly the number of lanes and the presence of diversion sections. There are two consecutive merging at location0. There is an intertwined area at Location1. There is not a lane reduction working condition at Location4, which leads to a difference between vehicle driving behaviors. Therefore, this paper selects the vehicles collected in Location2, 3, 5, and 6. It will be studied in future articles for the special working condition of location0 and Location1.
3.2. HD Maps Lanelet2
In addition to these four files for each recording, maps for the seven recording locations are also provided, including Lanelet2 maps [
21] and OpenDRIVE maps [
22]. HD maps contain comprehensive information about the vehicle's surroundings. This information encompasses not only road geometry and road topology but also includes details about traffic regulations and neighboring regions. The readily available road topology in HD maps simplifies the extraction of semantic relationships among traffic participants. Lanelet2 is an open-source map format [
21].
Unlike other map formats such as OpenDrive [
23], HERE [
24], and TomTom [
25], Lanelet2 does not simulate the world from a top-down perspective but starts from defining individual lane edges and extends to entire streets. This subsection will primarily discuss the constituents of HD maps and the associated elements of Lanelet2 [
26]. Detailed information regarding semantic extraction will be presented in
Section 2.3.
Points are fundamental elements in cartography. An individual point can represent vertical structures, such as utility poles. Typically, they are part of line strings. Each point is described by its three-dimensional position in the metric coordinate system. Points are the only primitives that actually contain location information. All other primitives are composed directly or indirectly of points. This fundamental nature of points makes them central to geographic information processing and cartography, providing a solid foundation for the establishment of geographic information systems and spatial analysis.
A line string is an ordered array of two or more points with linear interpolation between them. It is used to represent the shape of elements in a map, such as road markings, curbs, building facades, fences, and more. Line strings can also be virtual, for instance, when they form implicit boundaries of a lane. The reason for choosing line strings as a representation is their ability to describe any one-dimensional shape and discretize it to a high degree if necessary. In comparison to spline curves, they are computationally efficient and can be used to represent sharp angles.
Lanelets define directional atomic segments within a map, including examples such as regular lanes, pedestrian crosswalks, and rail tracks. Atomic implies that within a Lanelet, the currently applicable traffic rules remain constant, and the topological relationship with other lanes does not change. A Lanelet is defined by a line string serving as the left boundary and another line string as the right boundary. Additionally, it can contain multiple regulatory elements expressing traffic rules applicable to the lane. Lanelets can also overlap or intersect.
Zones are map segments where directed or undirected movement is not permitted. Examples include parking areas, squares, green spaces, or buildings. They are defined by one or more linestrings that collectively establish a closed outer boundary. Additionally, they may contain one or more linestrings that collectively define multiple inner boundaries, thus creating voids within the area.
Regulatory elements define traffic rules, such as speed limits, right-of-way rules, or traffic signals. Due to the various types of traffic rules, the exact structure of regulatory elements can vary significantly. Typically, they reference elements that define the rules (e.g., traffic signs) and, when necessary, reference elements that revoke the rules (e.g., signs indicating the end of a speed limit zone). They can also reference features like stop lines. The attributes of regulatory elements specify the type of rule they represent.
3.3. Trajectory Extraction
Through cleaning and filtering, it ensures that the foundational data for analysis is reliable and accurate. Specifically, this paper employs the following heuristic rules to filter out abnormal trajectories in the dataset:
Filtering out the data if the longitudinal velocity of a vehicle is always nega-tive (opposite to the direction of travel), e.g., recordingId=74, trackId=785.
Selecting the vehicle driving data at the moment of ‘laneChange’=1, ‘latLan-eCenterOffset’≈ laneWidth/2.
The trajectory metadata, overview data, and time-related information are integrated to generate a comprehensive and diverse merged trajectory dataset, thereby capturing key moments of the entire merging behavior through annotation. The recording and tracks data are thoroughly examined to identify potential issues, including checking for consistency in data format and addressing any possible outliers or abnormal trajectories.
By mapping traffic participants to lanes in HD maps, semantic connections between these participants can be deduced. These semantic relationships may involve scenarios where vehicles are traveling in adjacent lanes or at intersections. The advantages of extracting merging trajectory and acquire semantic relationships among traffic participants based on HD maps can be summarized as follows:
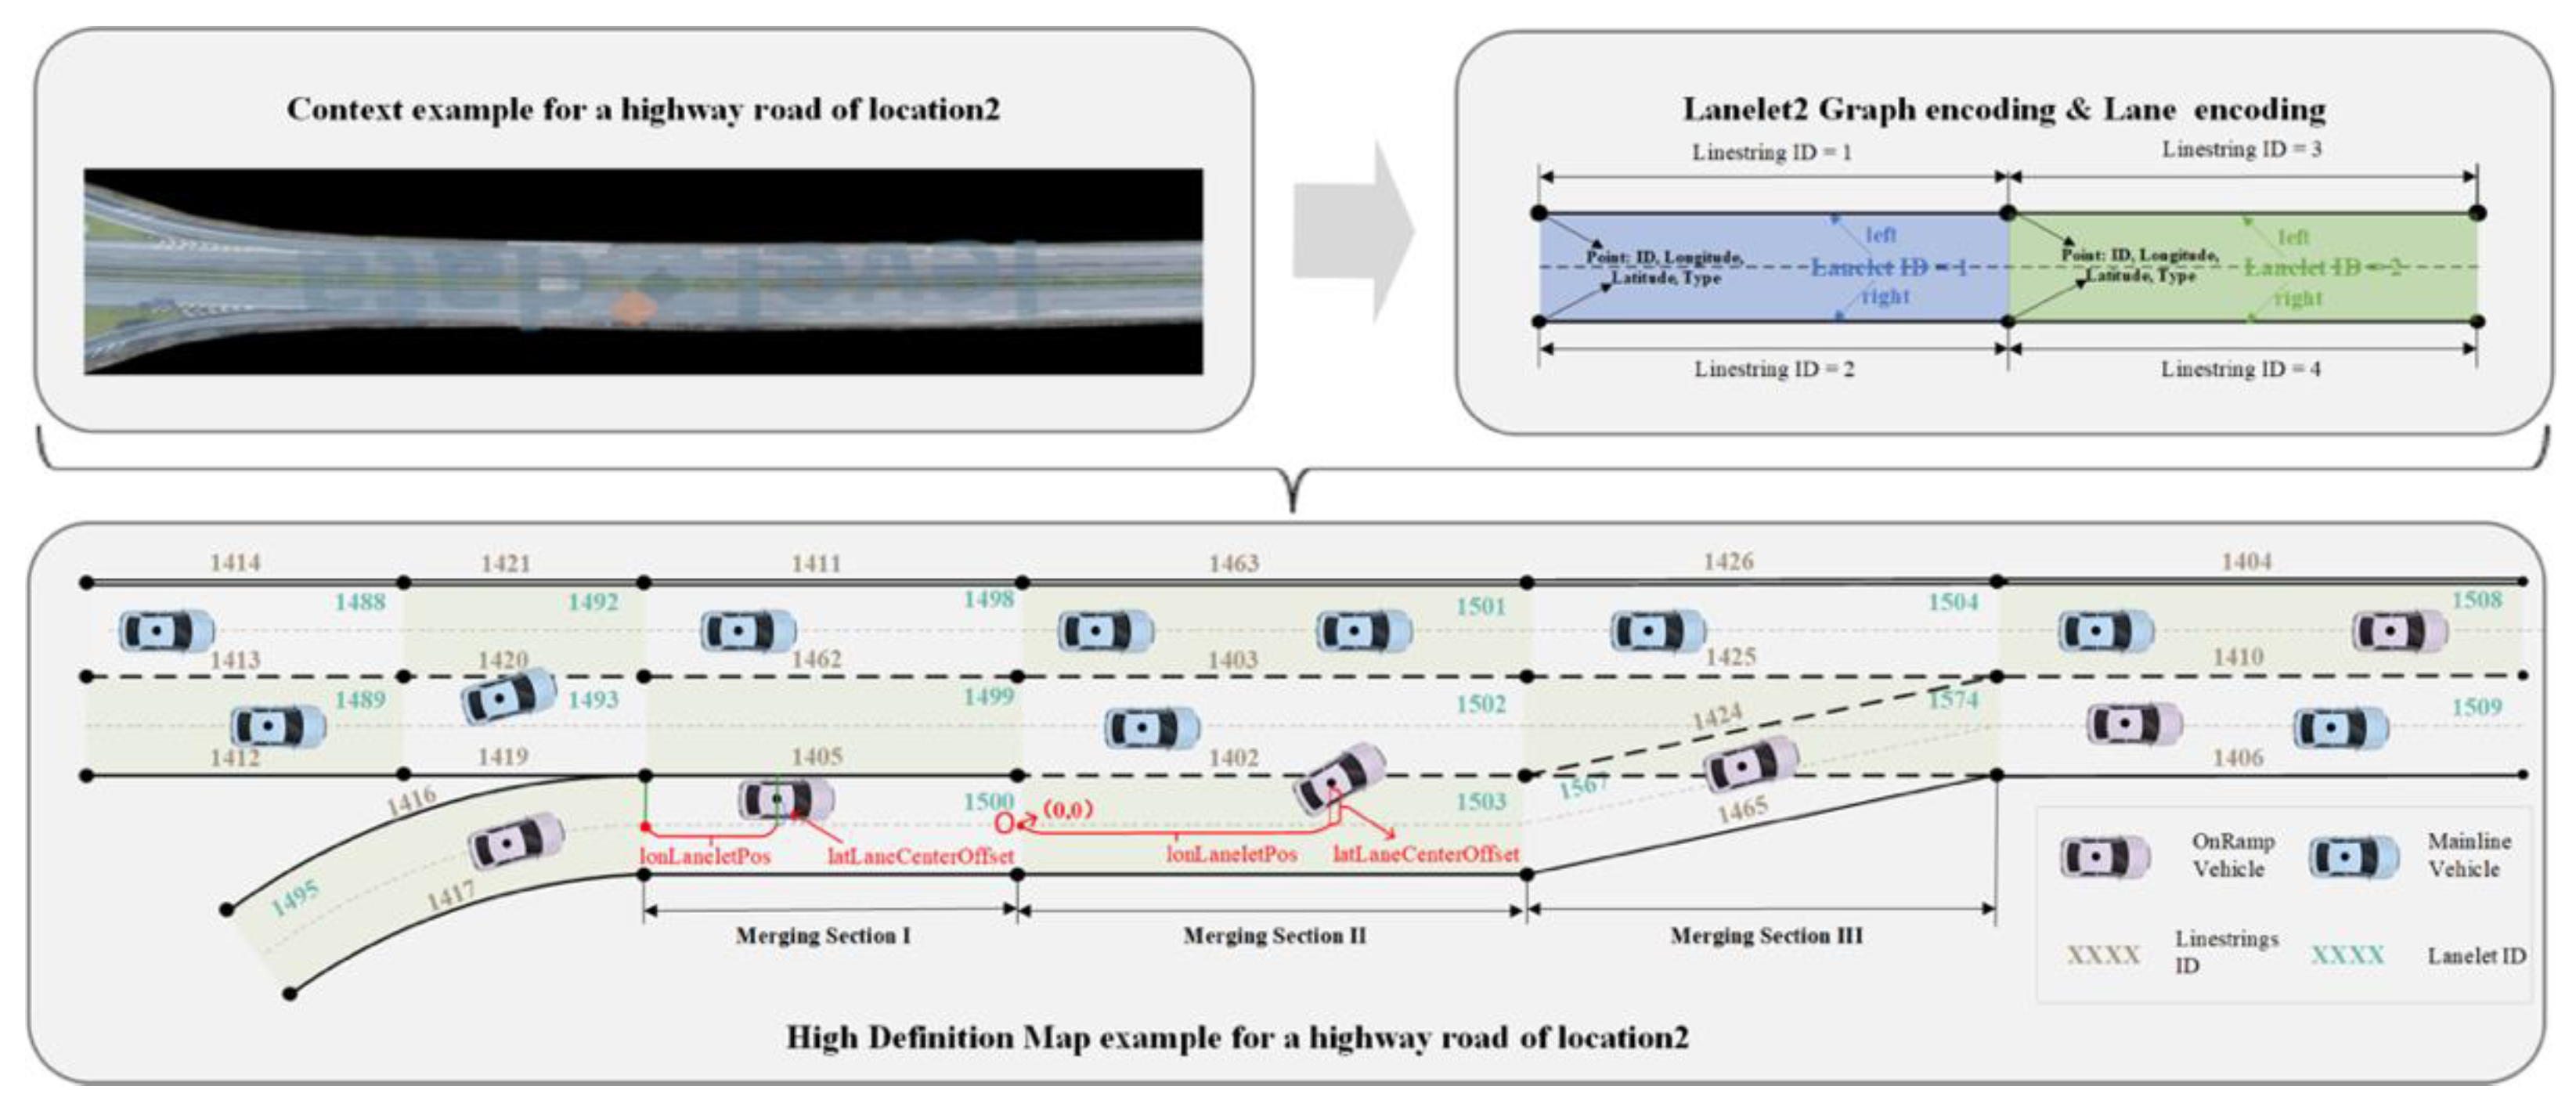
Finer-Grained Trajectory Recognition: High-precision maps enable the precise identification of the spatiotemporal positions of vehicles in each frame, including areas like Merging SectionⅠ, Merging SectionⅡ, and Merging SectionⅢ, as illustrated in
Figure 3. This finer-grained recognition enhances our ability to understand the movements of vehicles within the traffic context.
Enhanced Vehicle Identification and Scene Classification: In-depth analysis of each frame's trajectories allows for accurate vehicle relationship matching and scene classification. For instance, it facilitates the identification of parallel vehicles on the main lane, improving our comprehension of complex traffic scenarios.
Objective Metric Definitions: The segmentation of each trajectory, as exemplified in
Figure 3, supports the establishment of standardized criteria, leading to more objective metric definitions. This standardization contributes to greater consistency and objectivity in metric assessments.
Support for Reproducible Research: High-definition maps provide robust support for reproducible research endeavors. Researchers can conduct experiments and comparisons in a consistent environment using the same map data, bolstering the validation and replicability of their research.
The framework for trajectories extraction based on HD maps is depicted in
Figure 3. Firstly, the stereo images of location sites are displayed as background images in the editor. Secondly, the ‘Linestring’ and the ‘Lanelet number’ in Lanelet2 are used as the basis for manual annotation to establish a relational sequence of merging road segments. Finally, the membership information of the lanes upstream of the lanelet are matched with the 'odrRoadId' in the tracks files to manually label the vehicles with the typical pattern in which they are classified.
These semantic relationships include driving in adjacent lanes or intersecting roadways, as detailed in
Table 3.
The main loop of the code read tracks, recordingMeta, and trackMeta files at location 2, 3, 5, and 6. The sub-loop includes the following:
- a)
Iterating through each vehicle and determining whether it is a mainline vehicle, an on-ramp vehicle, or an off-ramp vehicle based on its laneletID list.
- b)
Extracting frames with laneChange =1, filtering out frames with smaller consecutive IDs, and determining if they represent off-ramp lane change actions.
- c)
Matching the longitudinal and lateral velocity, acceleration, and position of the preceding and following vehicles.
- d)
The code extracts the following parameters:
- ■
TIMESTEP: The default parameter value is 0.04 seconds, representing the time interval between two consecutive frames.
- ■
LOOKBACK: Selecting data for each of the last LOOKBACK frames before a lane change event with laneChange =1. The default value is set to 5 to ensure trajectory extraction accuracy.
- ■
Distance: Filtering neighboring vehicles within this range. Sensitivity analysis is performed on the threshold value to explore whether changes in its numerical value affect scenario classification.
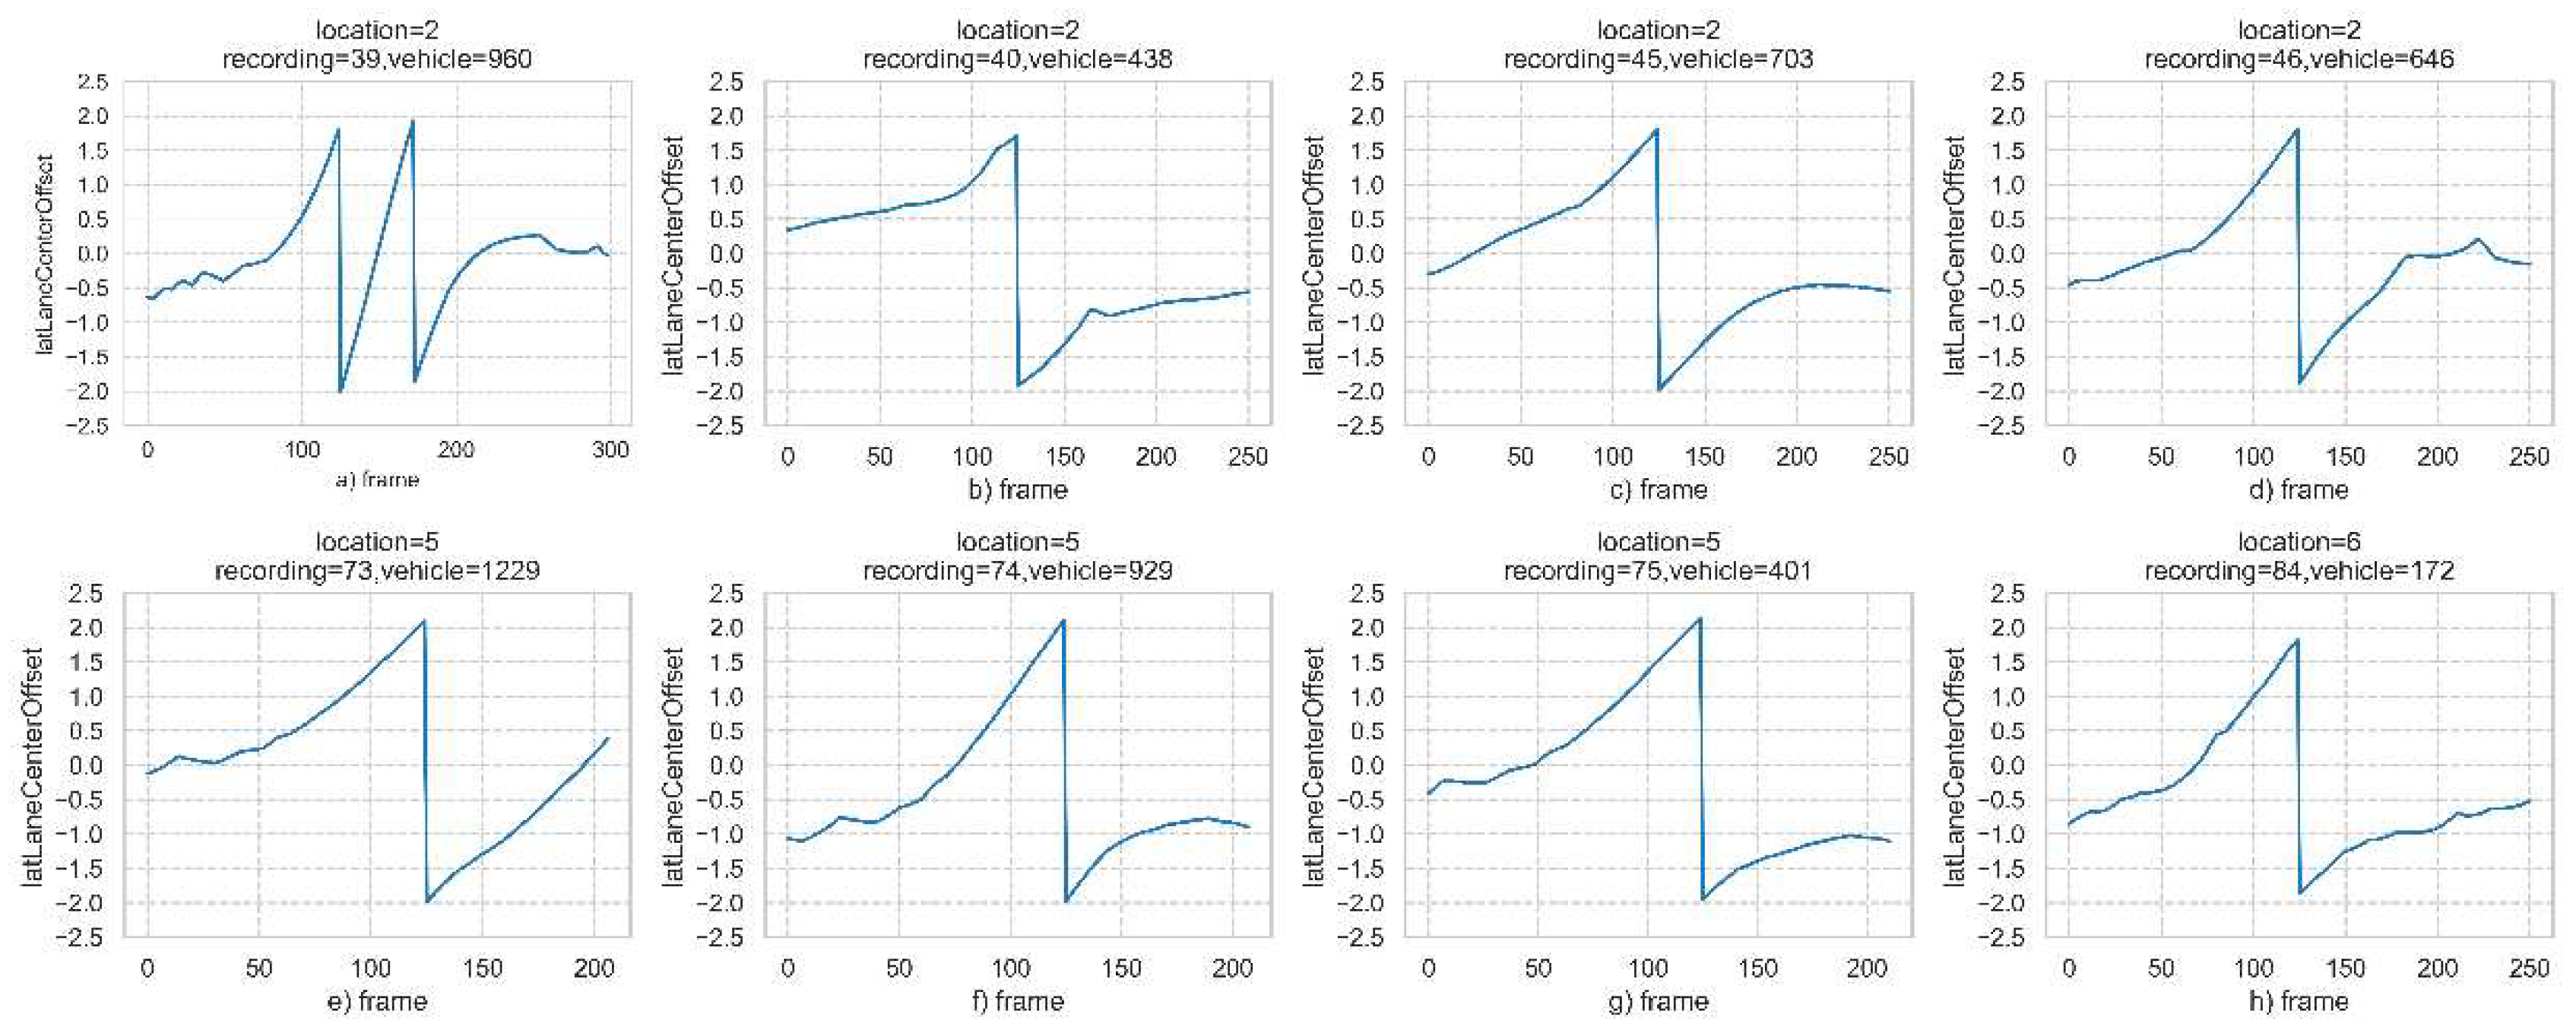
The trajectories of eight randomly selected samples are presented in
Figure 4. The 'latlanecenteroffset' value undergoes a transition from +2 to -2 in frames where laneChange =1. This indicates that the vehicle's center point has shifted from its original lane to the target lane. In subplot (a), the vehicle promptly transitions to the inner lane upon merging onto the mainline, resulting in two abrupt shifts in its 'latLaneCenterOffset' value from +2 to -2.
As shown in
Figure 4(a), this merging trajectory demonstrates two distinct lane-changing events. The first 100 frames exhibit a preliminary lane change, as evidenced by lateral vehicle position oscillations centered around -0.5 meters. Between frames 100 and 115, the vehicle's lateral motion becomes increasingly pronounced, signifying the commencement of the initial lane-changing. By frame 115, the vehicle successfully completes its first lane change, transitions into the new lane, and initiates the second lane change. The slope of lateral deviation during the second lane change is steeper than that of the first one, resulting in a shorter completion time for this subsequent maneuver.
After successfully executing these two lane-changing maneuvers, the vehicle maintains a smooth trajectory in the center of the roadway. At the onset of merging, as illustrated in
Figure 4(a), (c), (d), (e), (f), (g), and (h), the initial positions of the merging trajectories are all slightly offset towards the outer side of the road center. In
Figure 4 (b), however, the trajectory initiates the merging process with an initial position slightly shifted towards the inner side of its respective lane center. Upon completion of merging, even in
Figure 4 (b), there is a noticeable shift towards positioning on the outer side of its corresponding lane center.
4. Results and Discussions
4.1. Preliminiar Analysis
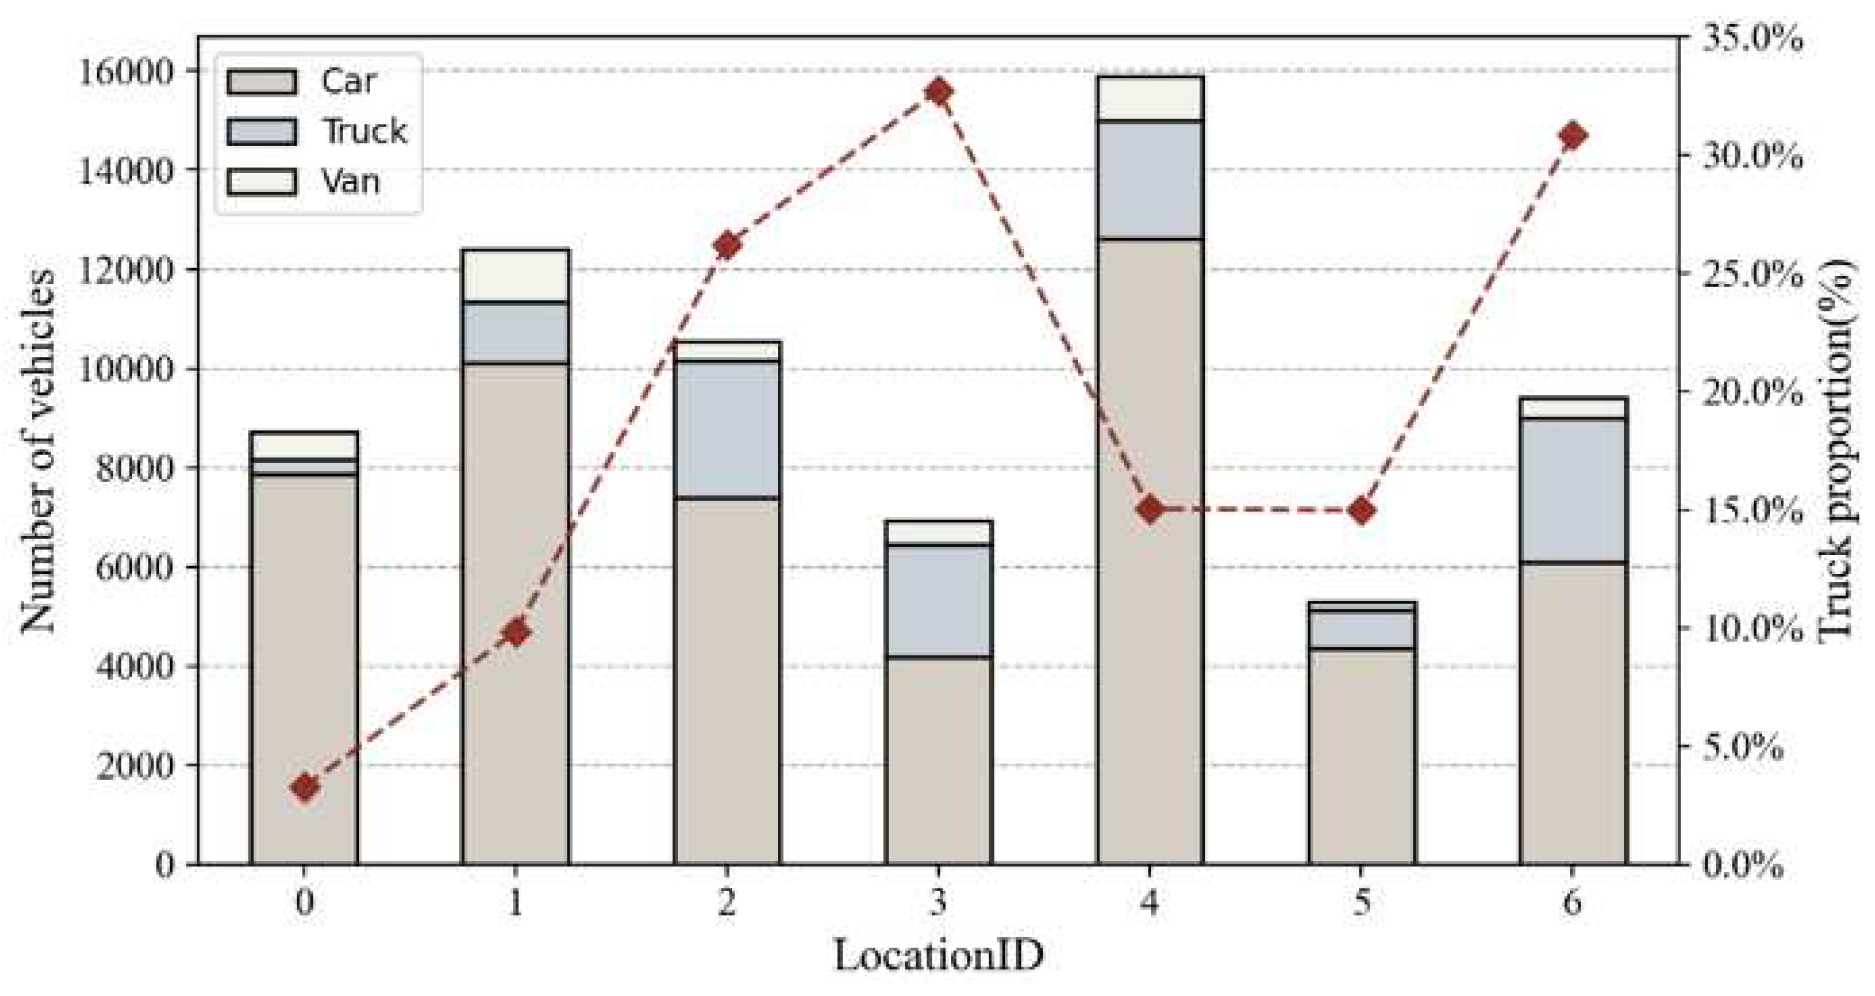
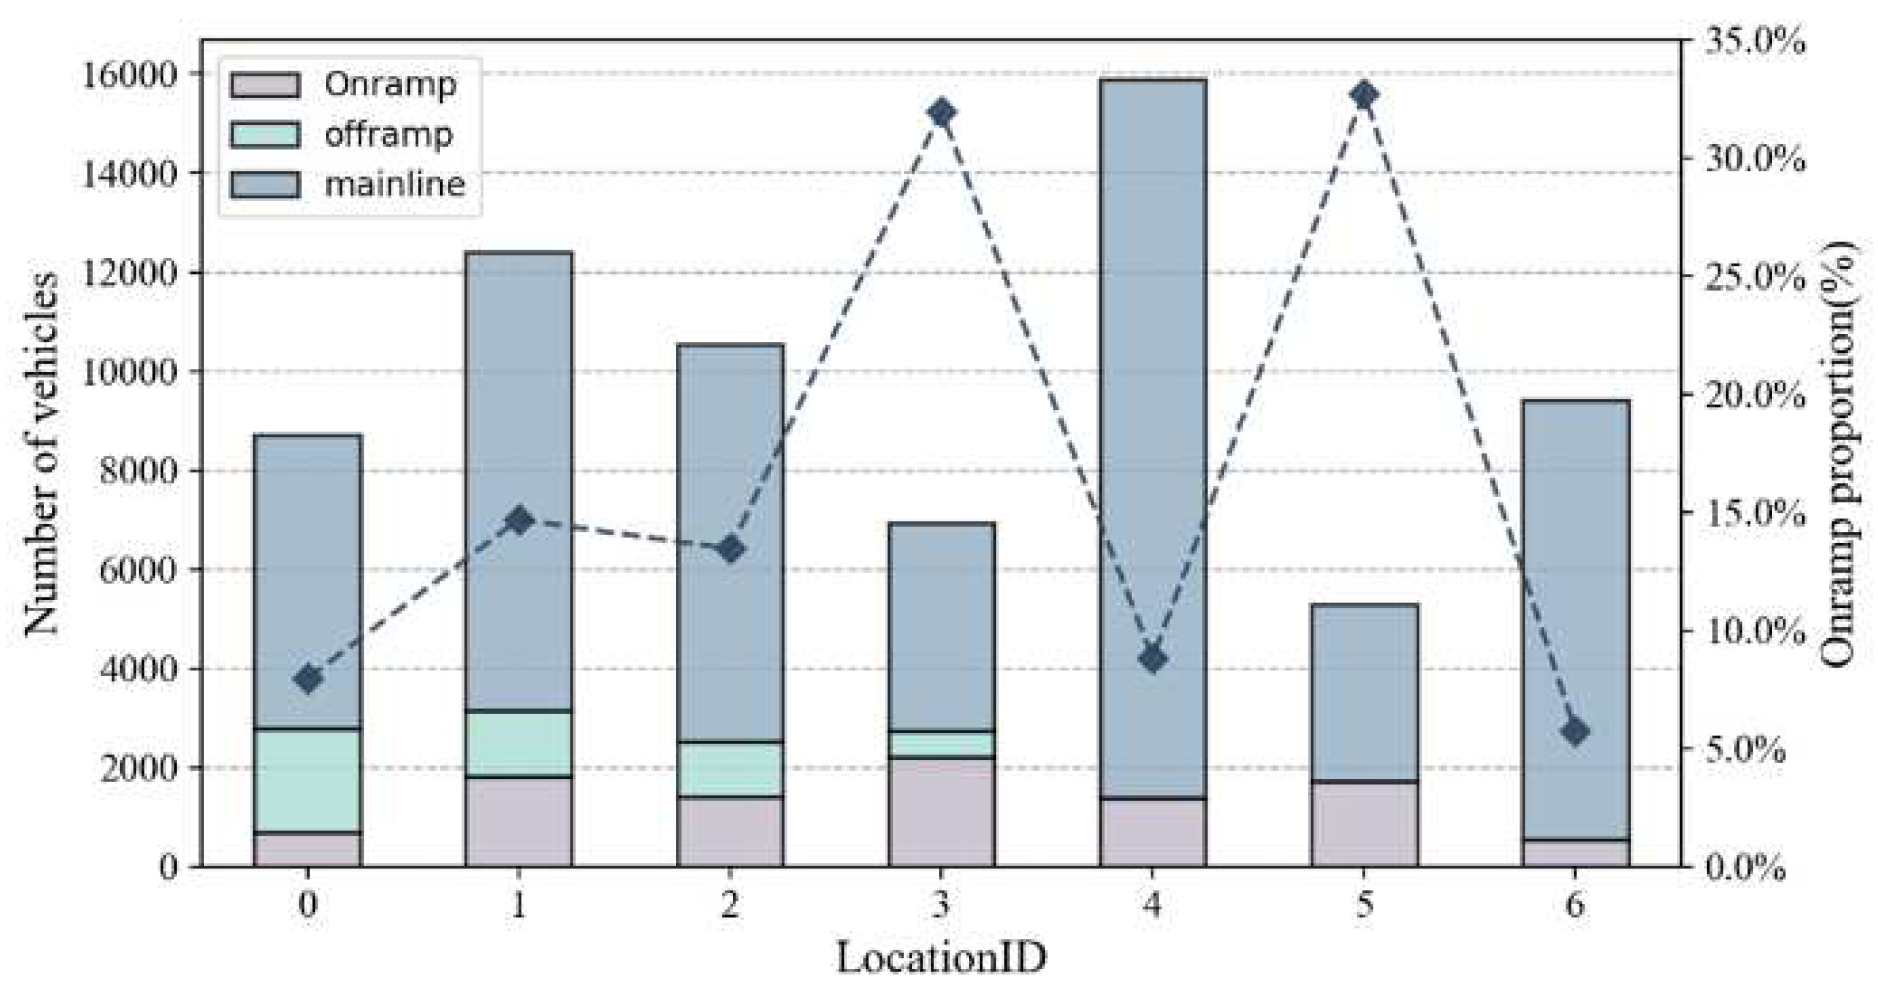
To assess the proportion of trucks and merging vehicles, a statistical analysis of data for different vehicle types from the seven data collection locations was conducted. Combining
Figure 5 and
Figure 6, it was found that the proportion of recorded trucks in the morning is higher than during the afternoon peak hours. The truck proportions at both Location3 and Location6 exceed 30%. The higher number of vehicles per unit time recorded at Locations 0, 1, and 4 can be attributed to their role as major entry and exit points for Cologne, the fourth-largest city in Germany, resulting in a greater demand for travel. Locations 3 and 5 exhibit a significant proportion of merging vehicles, accounting for more than 30% of the total road users, thereby posing a higher likelihood of disrupting traffic flow.
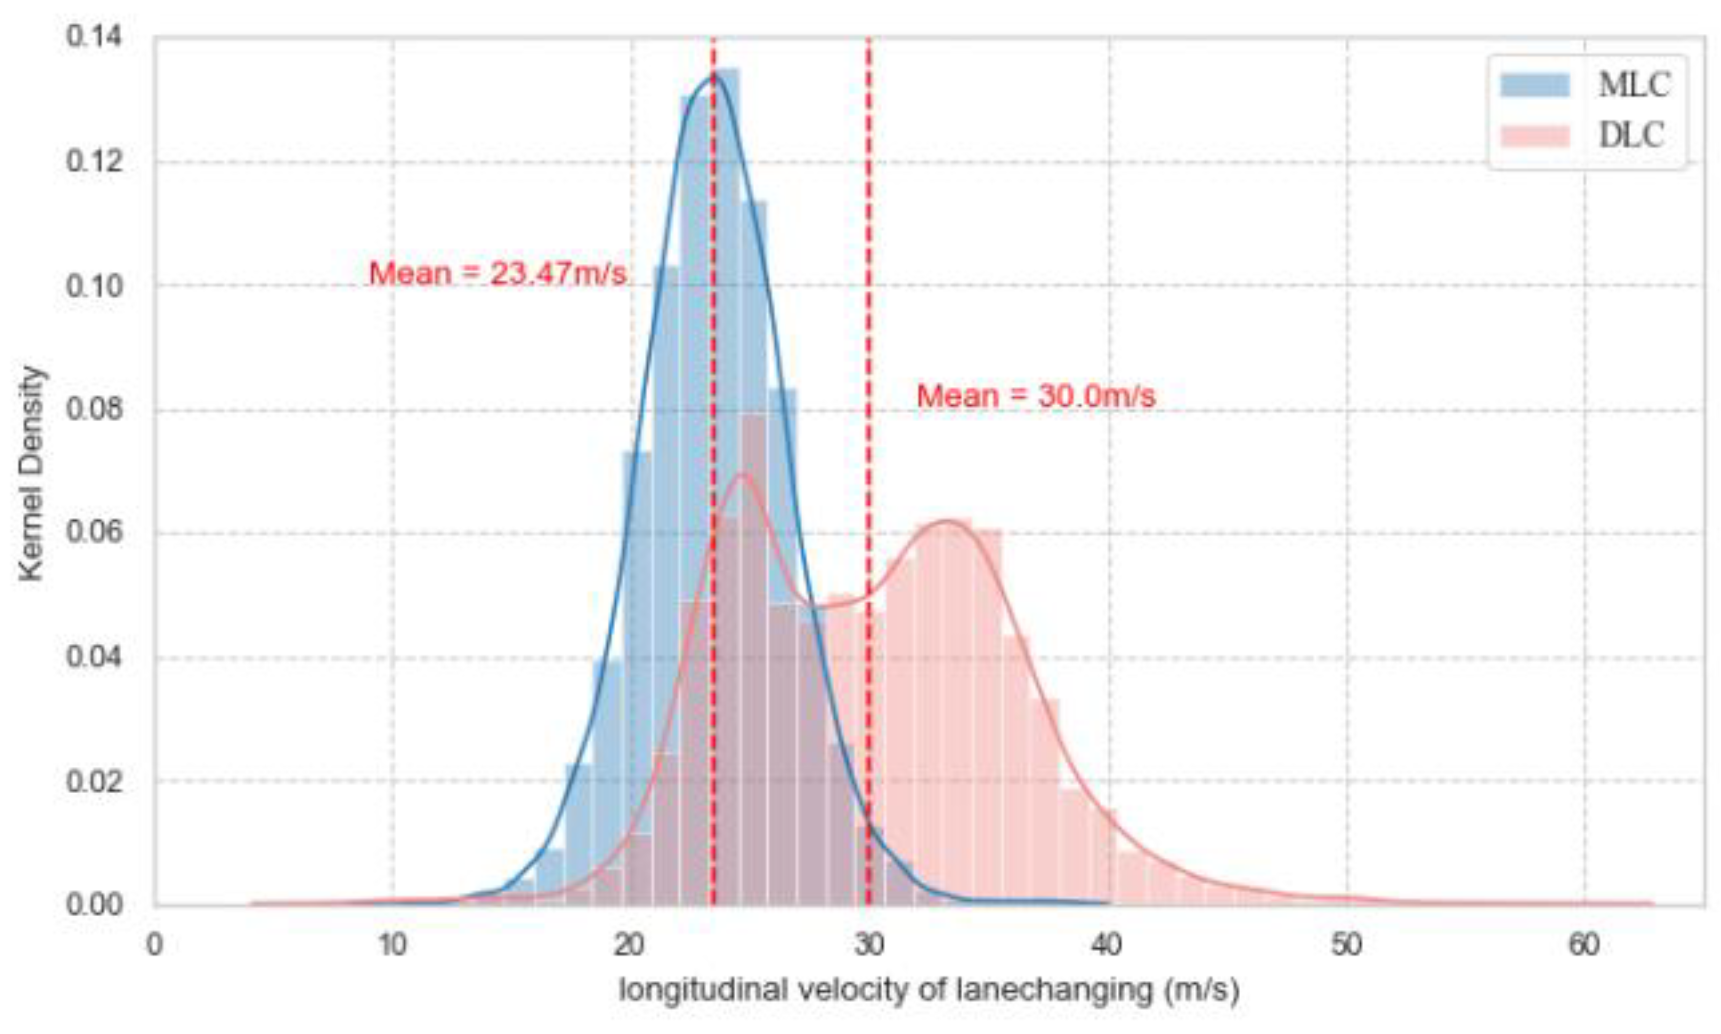
A comparative analysis of merging speed was conducted between "Main Lane Vehicles (DLC)" and "Merging Lane Change Vehicles (MLC)." As shown in
Figure 7, the average lane change speed for DLC is 30.0 m/s, while MLC has an average speed of 23.4 m/s. Mainline vehicles typically have more time and autonomy when changing lanes, allowing them to choose the right moment for lane changes when traffic flow is relatively stable. In contrast, merging vehicles face more urgent situations when changing lanes on the ramp; they need to quickly integrate into the main road traffic flow, thus emphasizing speed to match the speed of main lane vehicles to ensure traffic continuity.
The average speed for merging vehicles is 23.47 m/s, while for mainline vehicles, it is 30.0 m/s. The presence of a distinct bimodal distribution in the lane change speed of mainline vehicles, as depicted in
Figure 6, is noteworthy. This observed bimodal Pattern Arises from significant disparities in the state of mainline vehicles prior to and subsequent to the formation of bottleneck congestion.
Prior to the occurrence of congestion, speeds tend to concentrate in the high-speed range; however, following the onset of congestion, there is a significant decrease in lane change speed for mainline vehicles.
We introduce a variable ‘Merging Distance’ to investigate the spatial characteristics, and designate the center point of the acceleration lane as the coordinate origin O (0,0), as shown in
Figure 3. The distance calculation formula is presented in Equation 1 below. The lateral distance of the vehicle’s center point at the merging position from the merging point O is referred to as
.The merging position is defined as the geometric centroid of the merging vehicle when it crosses the lane line.
i——index;
The scatter plot in
Figure 8 illustrates the merging points of different types of vehicles across various locations.
Majority of vehicles merge in the Merging Section II. However, more than 30% of vehicles in Location2 and Location5 violate the traffic rules and choose to merge in Merging Section I (the solid line of the acceleration lane). This is an illegal and incorrect traffic behavior, and the following excavation for merging behavior will exclude vehicles that driving across the solid line of the acceleration lane.
As the merging position is forward, the higher the vehicle merging speed. The trend line of car is at the top, the image is on the upper left; The trend line of truck is at the bottom, the image is on the lower right; The trend line of van is in the middle of car and truck.
The car’s driver speed variability is the largest, the gap can reach more than 20m/s in the same merging position. It is more flexibility for car driver to operate. The truck’s driver variability followed by the same merging position, the maximum gap of merging speed is about 10m/s. The load weight and length are different for light trucks and heavy trucks. The variability of van’s driver is the smallest.
Figure 8.
Scatter plots of merging positions and velocities for different vehicle types.
Figure 8.
Scatter plots of merging positions and velocities for different vehicle types.
4.2. Spatial-Temporal Patterns Analysis
While the significance of merging behavior in the context of traffic flow and safety has been well-established, ongoing research continues to explore the intricacies of driver interactions within these dynamic scenarios. It is crucial to delve deeper into this complex facet of highway operation to address its implications for traffic management, safety, and the integration of autonomous vehicles.
We will consider both spatial and temporal dimensions and divide the real merging scenario into limited merging patterns. These merging patterns are analyzed in detail across two dimensions: time duration and spatial location movement of the merging vehicles. The relevant terminology used in this study will then be defined.
Temporal Dimension: the driving behavior is examined over a specific spatial duration, beginning with the moment they enter the ramp, followed by their merging maneuvers, and ending with the completion of the merge. Merging duration is also considered.
Spatial Dimension: this study focuses on the geographical distribution of merging speed, the characteristics of the lead- vehicle and the rear-vehicle in the target lane, the merging distance (ratio), and high-risk merging scenarios.
Heterogeneity: the heterogeneity of merging behavior here encompasses various combinations of ego vehicle and surrounding vehicles. For example, when the ego vehicle is a car, the alongside vehicle may be either a car or a truck. Furthermore, we examine the differences of the merging patterns. Specifically, scenario1 involves an alongside vehicle accelerating to prevent the ego vehicle from cutting in, while scenario2 entails the alongside vehicle reducing its speed to facilitate smooth merging for the ego vehicle. Whether there exists a significant difference in driving speed of the ego vehicle between these two scenarios will be further investigated.
The analysis process in existing studies exhibits a higher degree of subjectivity, and the rules for selecting variables are not clearly stated. Instead of immediately applying commonly used algorithms from previous studies, we propose dividing the scenarios based on changes in the relative position of the vehicle with its surroundings. These algorithms require determining input variables, and their outcomes are somewhat influenced by the dataset or hyperparameters.
This gives rise to the challenge of inadequate trajectory extraction and vehicle matching details, as well as the difficulty in replicating these study results by other researchers. However, the fundamental division method used in this study is universally applicable and remains unaffected by variations in data, algorithms, or hyperparameters. Based on the aforementioned three types of surrounding vehicles, we can categorize eight merging scenarios as shown in
Table 4.
Merging Pattern A: There are no vehicles within the threshold range in the target vehicle. The merging behavior of vehicles in this pattern is less restricted and is influenced by the driver's own driving style and vehicle type.
Merging Pattern B: There is a LV and no RV. When a vehicle exists ahead on the target lane, the merging vehicles will maintain a certain distance from the vehicle ahead and then merge.
Merging Pattern C: The merging vehicle fails to assert its right-of-way against the adjacent vehicle, resulting in the merging vehicle being positioned behind alongside vehicle. At the moment of merging, there is no RV.
Merging Pattern D: The merging vehicles cut in front of the RV. There is RV and no LV at the merging moment. In this pattern, the merging vehicles have an impact on the back traffic flow.
Merging Pattern E: At the moment of vehicle merging, there are rear and LV. Studies have been conducted for this merging pattern. The traffic flow condition (bottleneck), the time gap and the space gap of the RV, and the speed of the merging vehicle are key factors when choosing merging types[
16].
Merging Pattern F: Merging vehicles merge behind alongside vehicle. There is RV at the moment of merging. Compared to merging Pattern C, vehicle merges in Pattern F with vehicles behind it. It needs to be considered whether collisions will be generated and there will be some interference for the behavior of the RV.
Merging Pattern G: The alongside vehicle was originally located ahead on the target lane and the merging vehicle chose to accelerate to cut in. There is no LV after the merging vehicle completed merging.
Merging Pattern H: The difference with the merging Pattern G is the presence of LV after the merge in merging Pattern H.
The merging patterns are shown as
Figure 9. The green vehicle is the merging vehicles. In this study, we selected a 100m area both in front of and behind the target lane during the critical moment of merging behavior for analysis. The critical moment for vehicle merging is defined as when the physical center of the vehicle pressing on the dotted line. Then, a statistical analysis was performed, which revealed that 35.25% of vehicles preferred Pattern B for merging, while only 0.03% opted for Pattern G or H. About 2% of the vehicles selected either Pattern C or F for merging, with a lower percentage second to Pattern G and H. The majority of merging vehicles prefer merging behind the adjacent vehicle rather than cutting in.
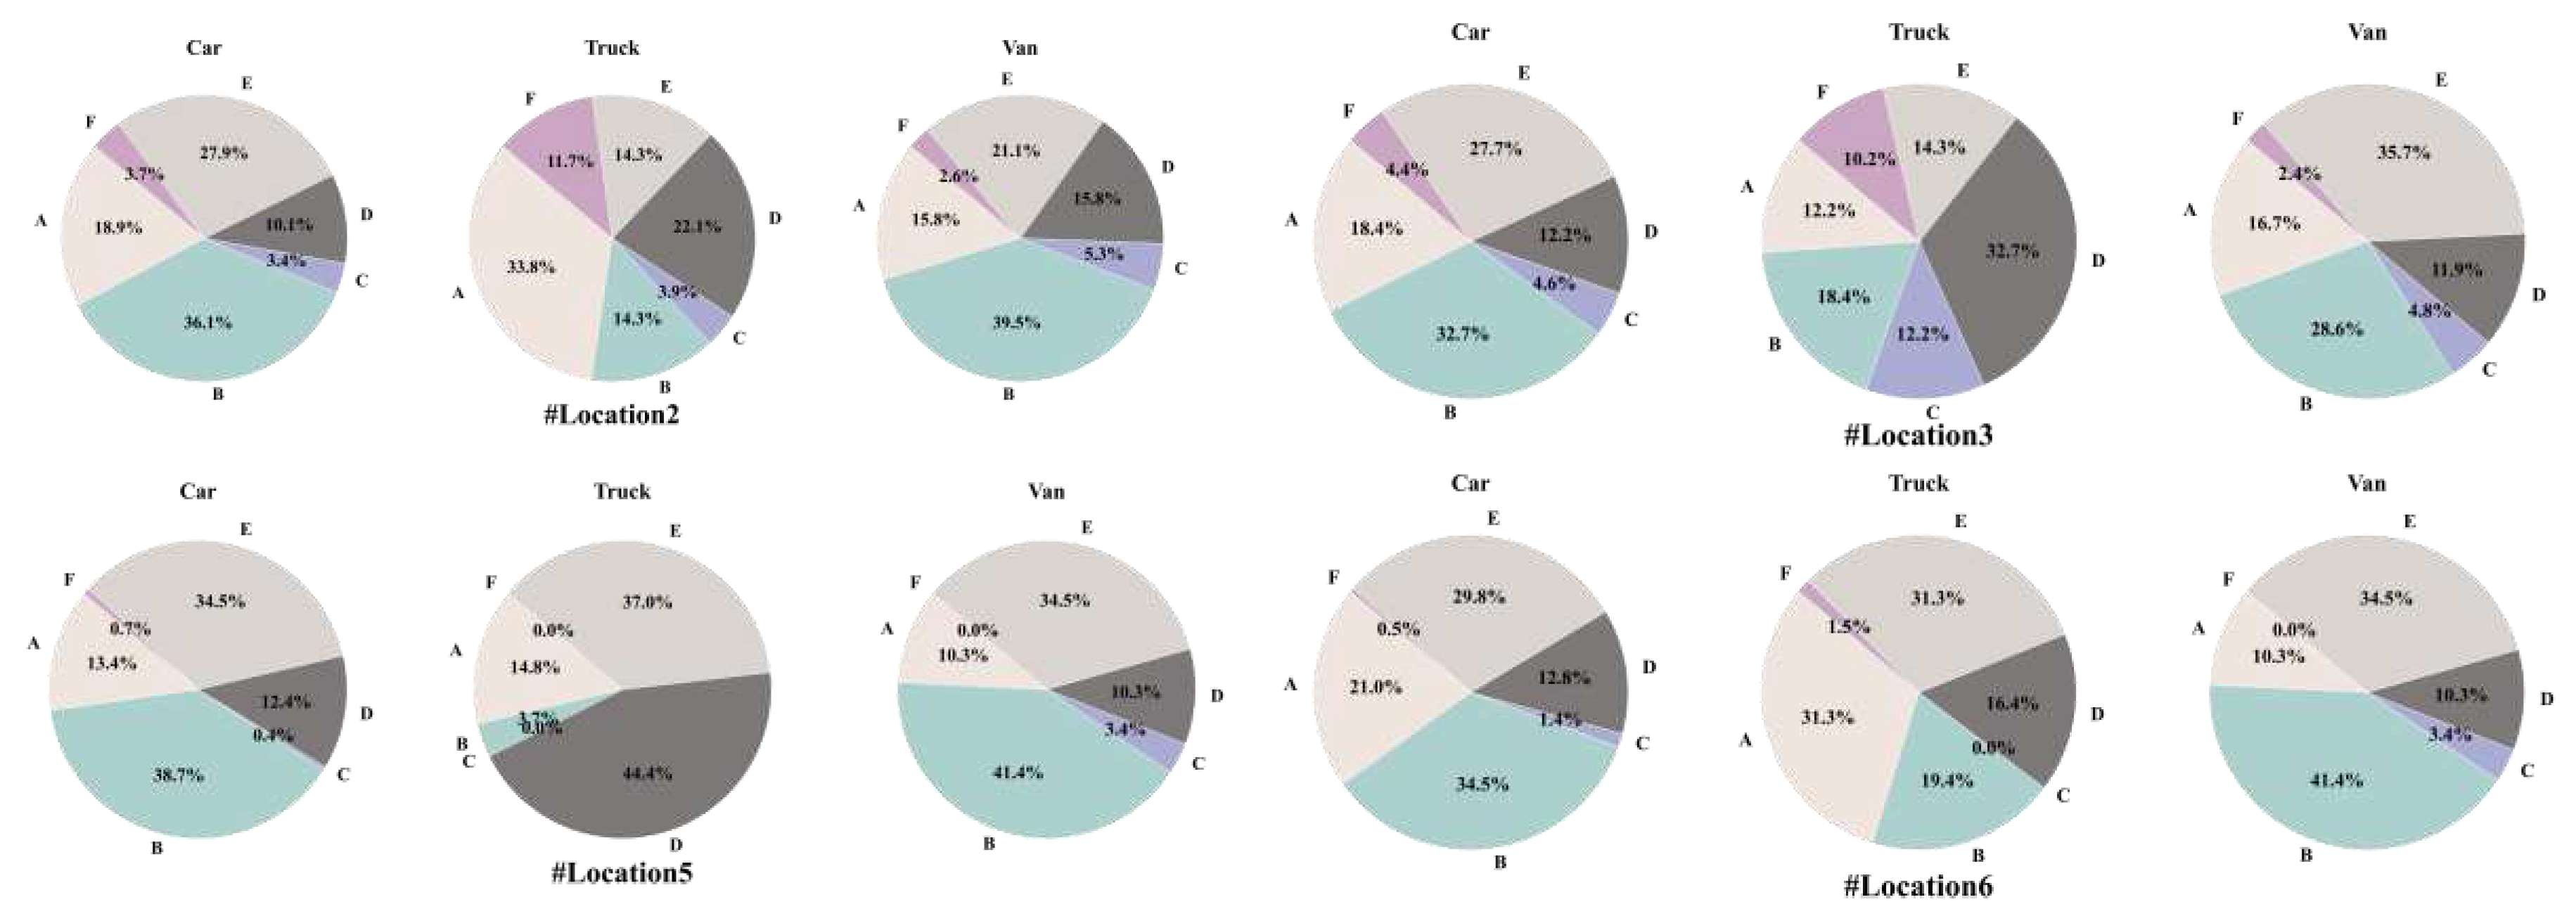
The distribution of merging scenarios at four collection sites is shown in
Figure 10, with each pie chart representing the distribution of a specific type of vehicle merging scenario at a data collection location. The distribution of merging patterns at four collection sites is shown in
Figure 10, with each pie chart representing the distribution of a specific type of vehicle merging patterns at a data collection location. Observations at various locations indicate that cars and vans often prefer to merge when there are vehicles in front but none behind, suggesting that their drivers tend to adopt a conservative merging strategy to minimize potential conflicts with other vehicles. In contrast, truck drivers exhibit a preference for situations where there are no vehicles in front but some behind, possibly due to trucks' larger mass and braking distance necessitating greater safety margins during merging. Furthermore, aggressive merging behaviors by trucks in certain locations (over 15% in Pattern C and F) reveal that some drivers choose riskier strategies even in high-risk situations. Analyzing the selection of merging patterns reveals how human drivers guide their behavior based on different environmental states, and it highlights the significant impact of social preferences in the decision-making process. These findings are crucial for enhancing decision-making designs in autonomous vehicles to match the level of human drivers.
4.3. Heterogeneity Analysis
This section will begin by introducing a similarity testing model and then proceed to analyze the heterogeneity in the merging spatiotemporal patterns. The skewness and kurtosis are used to describe the distribution of the data. Skewness describes the symmetry of the distribution of a certain overall fetch value. The kurtosis is a statistic that describes the steepness of the distribution of all values in the total. The kurtosis and skewness are calculated as follows:
SD——the Variance.
The Kolmogorov Smirnov test (KS test) is employed to examine the data distribution of the merging variables of different merging patterns. A classical two-sample problem consists of testing the null hypothesis.
against the general alternative:
We determine whether the Merging Variables(i) sample1 and Merging Variables(i) sample2 () come from the same distribution function for the different merging patterns.
Construct test statistic
:
Reject
when the following conditions hold, otherwise accept
:
The
p are calculated as follows:
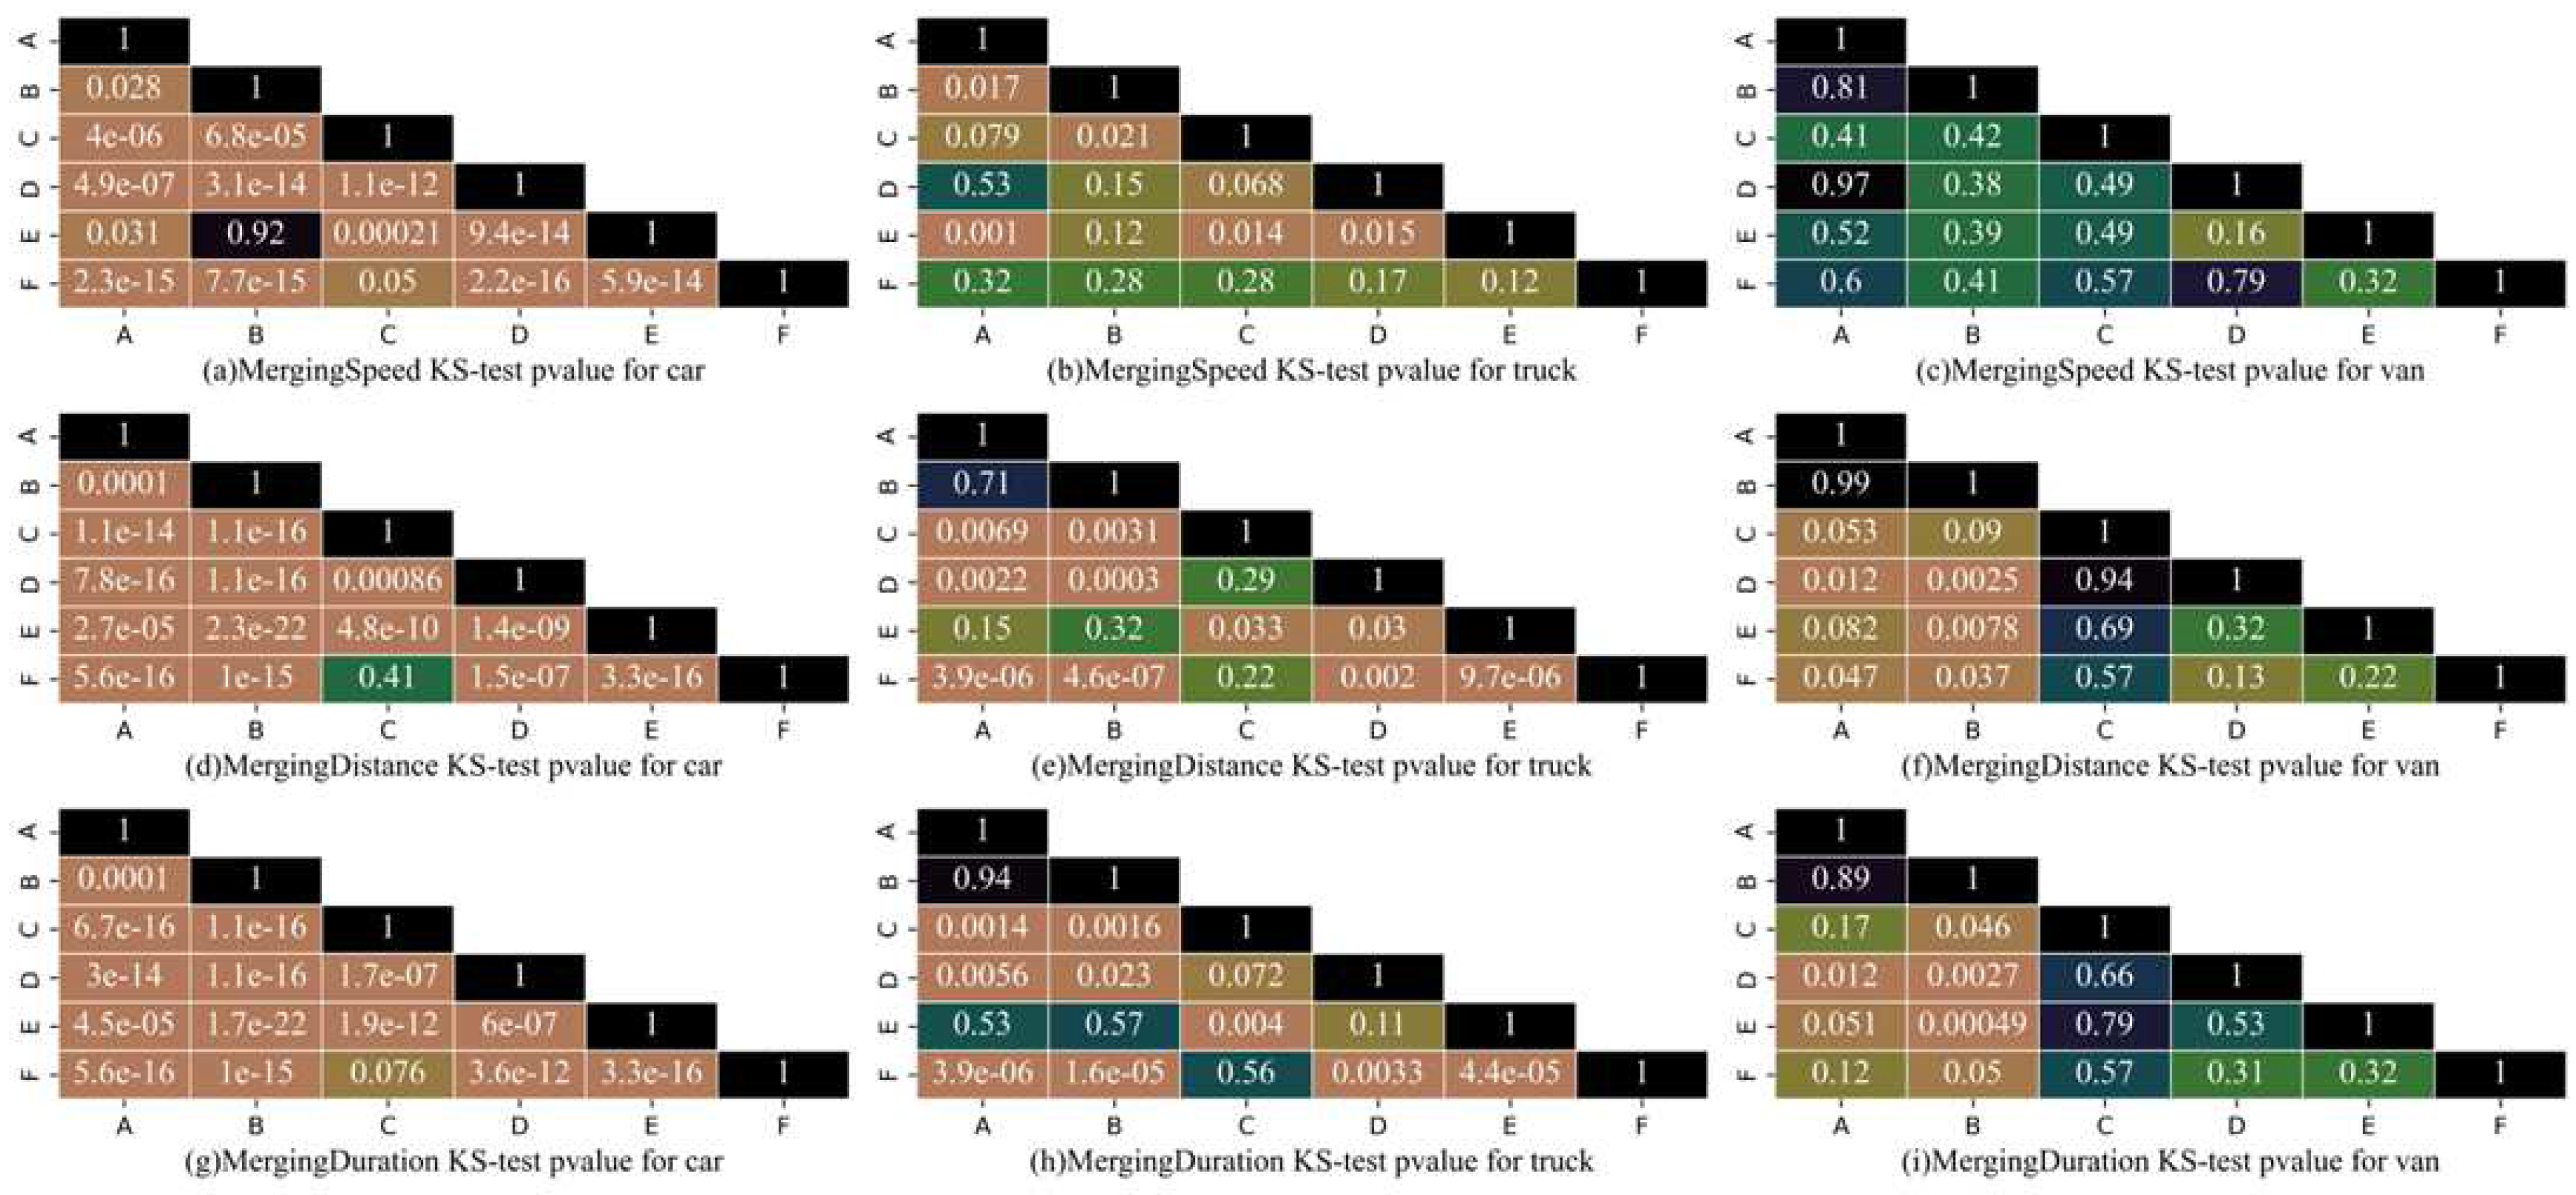
Then, we observe whether there is a significant difference between merging patterns, and then we measure the variability between the scenarios. We focused on the three variables,which are merging speed, merging distance and merging duration for the driving behavior. The results of KS test for different merging patterns feature variables are shown in
Figure 11. The merging speed’s KS-test P-values of car, truck, and van in Pattern B and E are 0.92, 0.12, and 0.39 (all>0.05). The original hypothesis can’t be rejected. There is no significant difference between merging speeds in Pattern B and E. When a vehicle exists ahead the target lane, the presence or absence of RV has no significant effect on the merging speed of drivers. When testing the merging speed of autonomous vehicles, patterns B and E can be divided into one scenario for simulation testing.
The KS-test p-values of merging speed, merging distance, and merging duration for car, truck, and van in Pattern C and F are all greater than 0.05. Therefore, the original hypothesis H_0 is accepted. There is no significant difference in the Pattern C and F. The vehicles in Pattern C and F both have vehicles in the target lane in parallel, and fail to compete for the road access, and then perform the merging operation after the RV moving, at which time there is no significant effect on the presence of the RV. There is no need to waste resources separating Pattern C and F when studying the speed, distance, and duration of autonomous vehicle at merging critical moments.
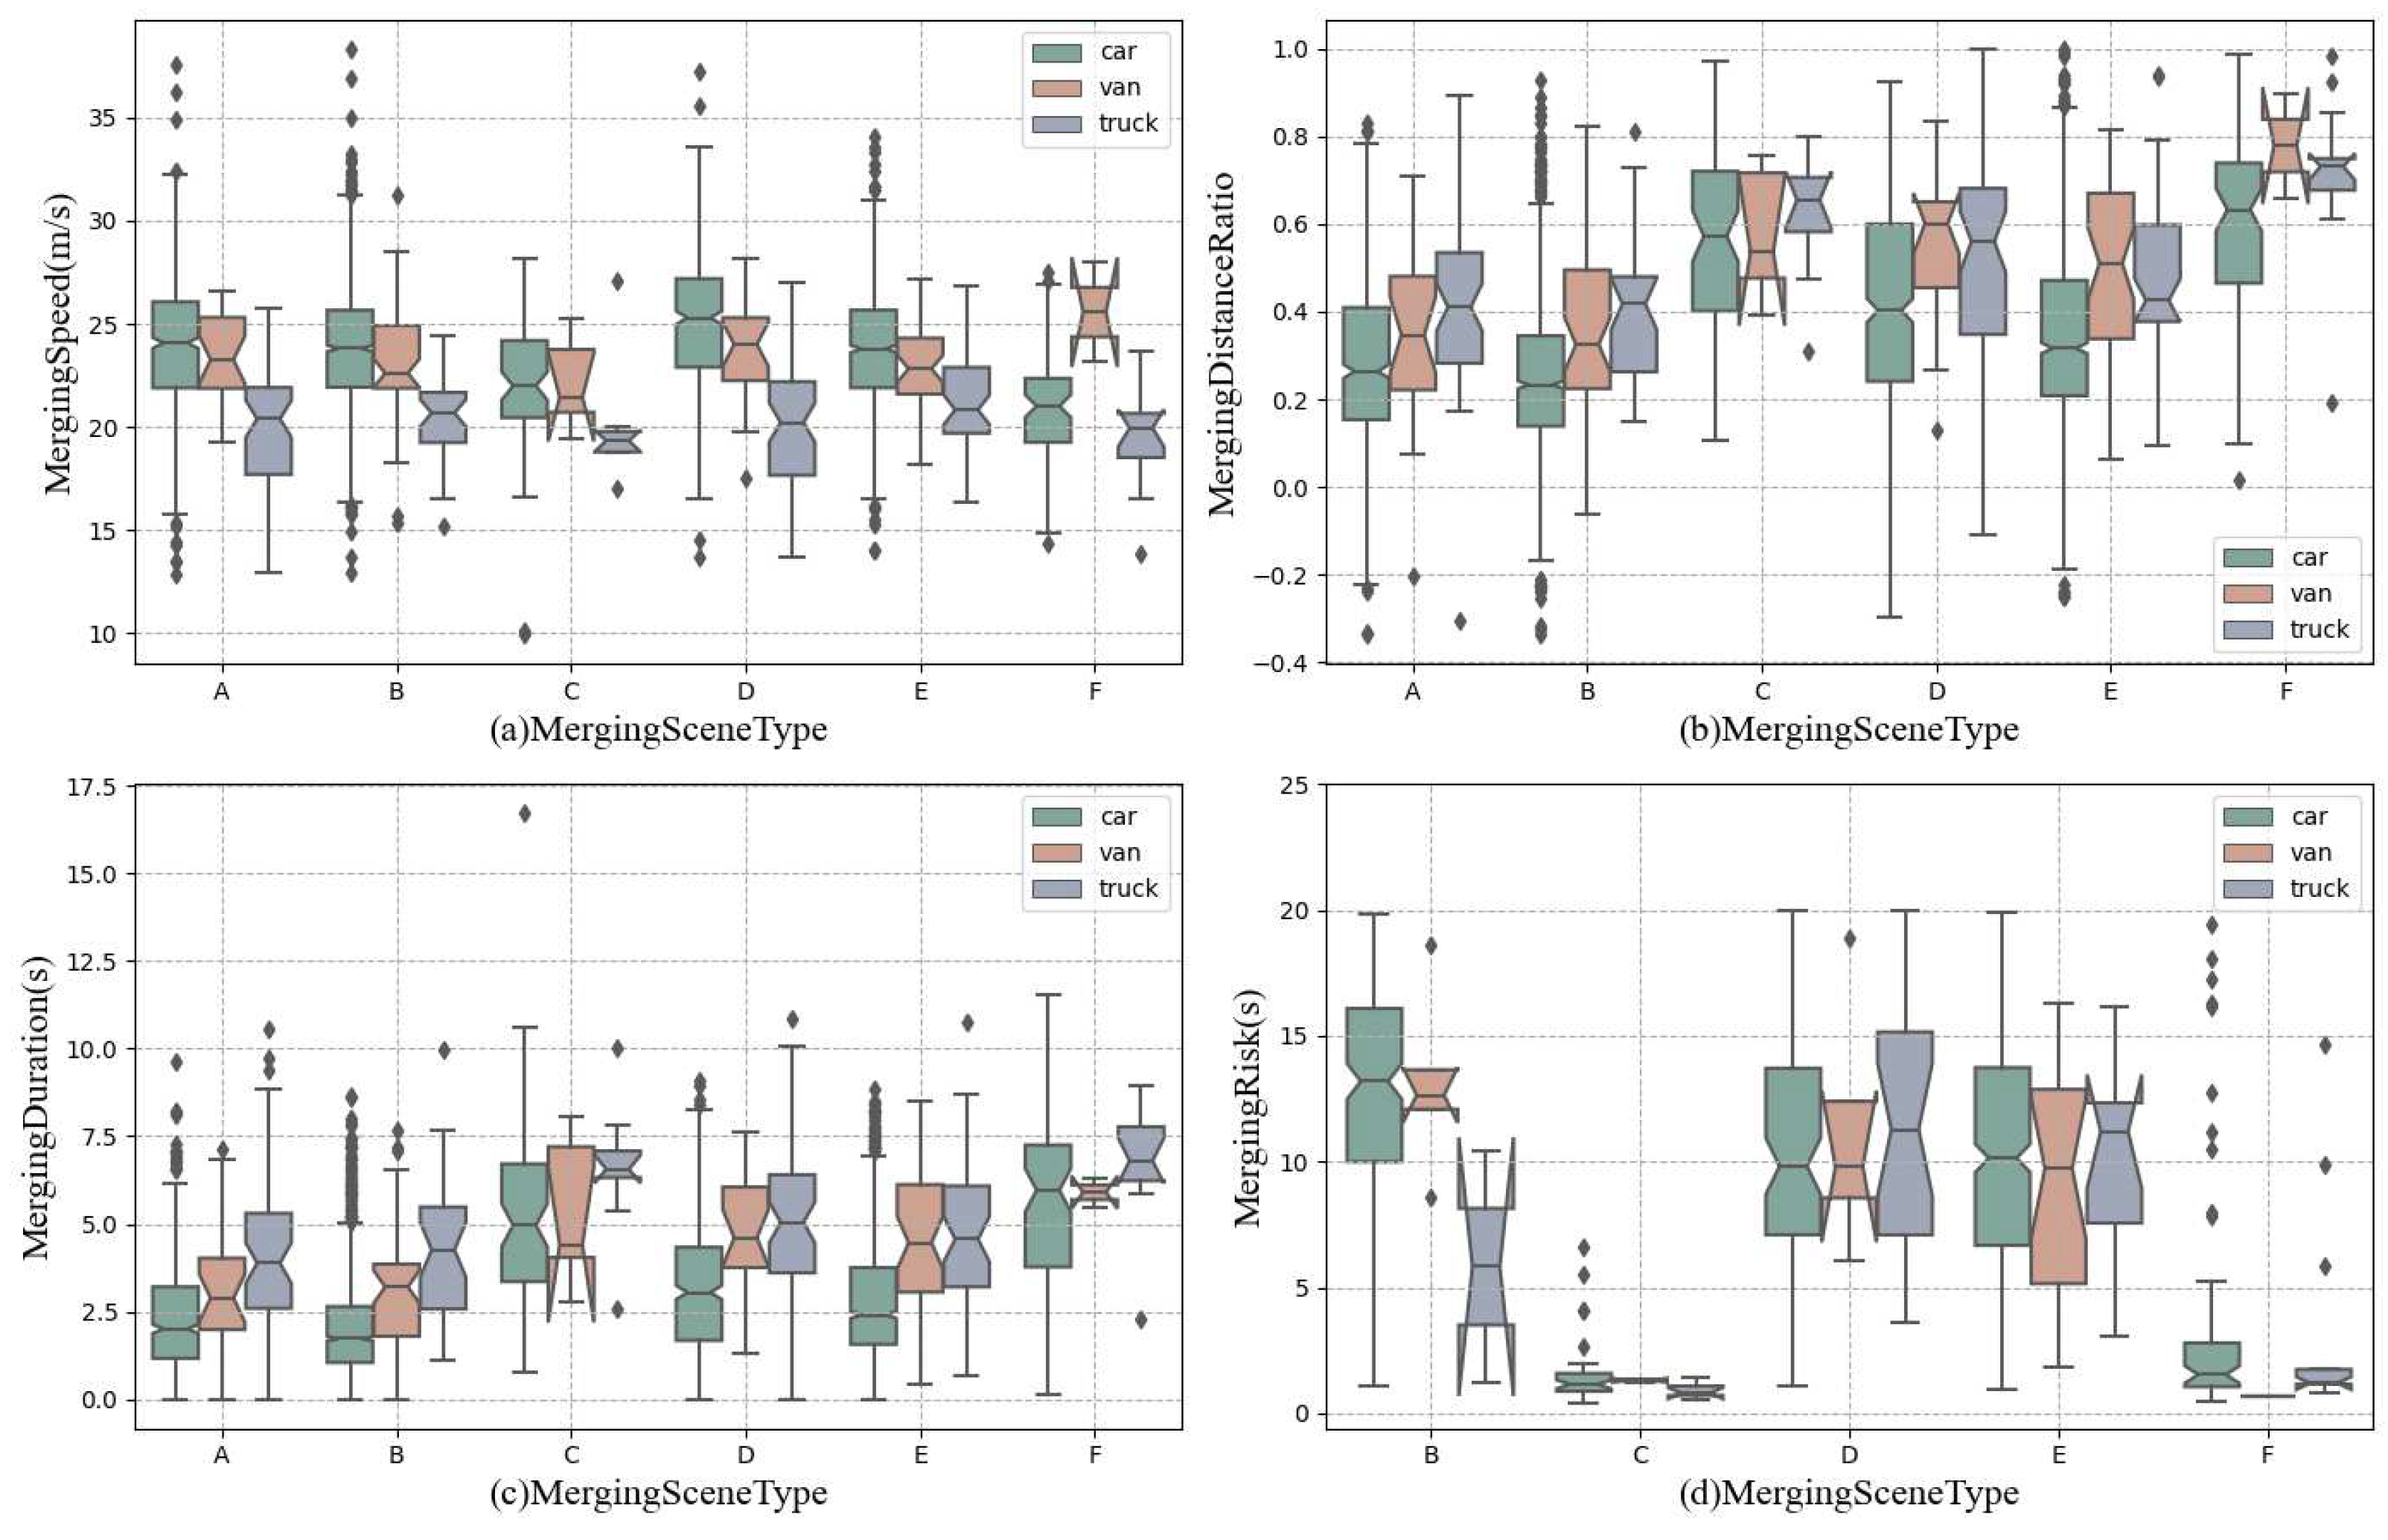
The box plots in
Figure 12 illustrate the statistical differences among various vehicle types. Notably, when it comes to merging, distinct variations can be observed across different vehicle categories. The merging speeds of truck are the lowest among various merging patterns, with an average speed of approximately 20m/s. The ego vehicle in Pattern C or F merges relative slowly compared to other merging patterns. In other words, the ego vehicle's speed is lower at the crucial merging phase as it follows alongside vehicle. When the target lane experiences free-flowing traffic, there is an observed hierarchy in terms of merging speed: car>van> truck; merging distance: truck>van>car; and merging duration: truck>van>car.
The average merging distance ratio of the ego vehicle in Pattern C or F exceeds 0.5, and the merging duration surpasses 5s. Ego vehicles are required to cover more than half of the acceleration lane before initiating a merge. In
Figure 12, TTC values of the merging Pattern C and F are significantly lower than those of the other patterns. The merging Pattern C and F are high-risk merging scenario, which have a greater impact on the safety of the driver. Because the RV must accept a short headway in a very brief amount of time, cut-in behavior is frequently linked to a higher safety risk. There is a high risk of collision between these two cars if the RV is inattentive or aggressive. After identifying the high-risk scenarios, this paper will further analyze their behavioral characteristics in next section.
In
Figure 12 (a) and (b), there are two vans in Pattern F having a merging speed of more than 25m/s and a merging distance of 0.8. These two tracks are extracted and their context information are #1 (recordingId=46, trackId=977) and #2(recordingId=58, trackId=417). The reason is that there is a truck behind on the target lane, and the vans choose to accelerate and keep a certain distance from the truck. This finding also confirms that different vehicle types have different effects on merging behavior. In
Figure 12 (c), there is a car in Pattern C having a long merging duration. This track was extracted and its context information is #3 (recordingId=49, trackId=1031). The finding is that there are four trucks behind car#3. Car#3 waits for four trucks to pass and then merges. Due to the physical and psychological effects they have on the surrounding vehicles [42], the truck platooning has a significantly greater impact on surrounding vehicles. In turn, this has some impact on overall traffic safety and efficiency.
5. Conclusions
The main objective of this study is to uncover the spatial-temporal patterns and heterogeneity of merging behavior. The similarity of the merging patterns is evaluated in terms of spatial and temporal aspects. High-risk situations involving mergers are identified and methodically investigated. The following new insights about merging behavior are presented in this paper: (1) Car and van drivers exhibit a conservative merging preference, often merging with a vehicle in front but none behind. Specifically, truck drivers tend to leave larger gaps in front for safety, a practice vital for refining autonomous vehicle algorithms. (2) The merging patterns B and E, or C and F, exhibit no discernible difference in terms of merging distance, speed, or duration. As a result, these matching patterns can be combined during traffic simulation. (3) The design of automated driving planning and control must consider high-risk scenarios, such as merging patterns C and F. Additionally, careful consideration is required for vehicle merging in truck platooning situation.
These findings are crucial for emulating human-like behaviors in autonomous driving. The categorization of merging patterns provides a foundational basis for advanced study into vehicle interaction behaviors, highlighting the diverse dynamic interactions that occur within different merging scenarios. Additionally, the ability to recognize various merging patterns can enhance decision-making in autonomous vehicles, an aspect slated for in-depth exploration in future research. Moreover, these insights have the potential to improve the safety performance of autonomous driving assistance systems by facilitating more judicious decision-making in autonomous vehicles. This study introduces a framework for extracting merging trajectories using HD maps, providing valuable insights into driving behavior analysis with map references. A spatiotemporal analysis of interactions across various merging patterns can be achieved through the subdivision of these patterns.
Multiple consecutive merging behaviors patterns have not been examined. Due to the limitation of the dataset, there is not enough data for the vans. Future work can further look into the continuous merging behavior at location0. In addition, additional datasets are required to validate the findings of this work in order to draw more precise conclusions.
Author Contributions
Conceptualization, L.B.L., Y.Q.W. and Y.L.; Methodology, Y.Q.W. and Y.L.; Data curation, Y.Q.W. and Y.L.; Formal analysis, Y.Q.W. and S.B.W; Project administration, L.B.L., Y.Q.W. and R.J.L.; Visualization, Y.Q.W. and Y.L.; Writing - original draft, Y.Q.W and S.B.W. All authors have read and agreed to the published version of the manuscript.
Funding
This research was funded by The National Key Technology R&D Program of China (2019YFB1600703).
Data Availability Statement
All data utilized in this manuscript comes from publicly accessible sources that have been cited among the references. The exiD dataset is available free of charge at
https://www.exid-dataset.com.
Acknowledgments
This research was funded by The National Key Technology R&D Program of China (2019YFB1600703).
Conflicts of Interest
The authors declare no conflict of interest.
References
- Sun, J.; Zhao, L.; Zhang, H.M. Mechanism of early-onset breakdown at on-ramp bottlenecks on Shanghai, China, expressways. Transportation Research Record 2014, 2421, 64–73. [Google Scholar] [CrossRef]
- Cassidy, M.J.; Rudjanakanoknad, J. Increasing the capacity of an isolated merge by metering its on-ramp. Transportation Research Part B: Methodological 2005, 39, 896–913. [Google Scholar] [CrossRef]
- Lee, G. Modeling gap acceptance at freeway merges. Massachusetts Institute of Technology 2006. [Google Scholar]
- Marczak, F.; Daamen, W.; Buisson, C. Merging behaviour: Empirical comparison between two sites and new theory development. Transportation Research Part C: Emerging Technologies 2013, 36, 530–546. [Google Scholar] [CrossRef]
- Li, G.; Cheng, J. Exploring the effects of traffic density on merging behavior. Ieee Access 2019, 7, 51608–51619. [Google Scholar] [CrossRef]
- Zhang, Y.; Zou, Y.; Wang, Y.; Wu, L.; Han, W. Understanding the merging behavior patterns and evolutionary mechanism at freeway on-Ramps. Journal of Intelligent Transportation Systems 2023, 27, 573–586. [Google Scholar] [CrossRef]
- Hidas, P. Modelling vehicle interactions in microscopic simulation of merging and weaving. Transportation Research Part C: Emerging Technologies 2005, 13, 37–62. [Google Scholar] [CrossRef]
- Jiang, S. Human-like Merging Strategy for Intelligent Vehicles Focused on Merging Risk Decision, 2022.
- Wu, S.; Zou, Y.; Wu, L.; Zhang, Y. Application of Bayesian model averaging for modeling time headway distribution. Physica A: Statistical Mechanics and Its Applications 2023, 620, 128747. [Google Scholar] [CrossRef]
- Zhan, W.; Sun, L.; Wang, D.; Shi, H.; Clausse, A.; Naumann, M.; Kummerle, J.; Konigshof, H.; Stiller, C.; de La Fortelle, A. Interaction dataset: An international, adversarial and cooperative motion dataset in interactive driving scenarios with semantic maps. arXiv 2019, arXiv:1910.03088. [Google Scholar]
- Spannaus, P.; Zechel, P.; Lenz, K. AUTOMATUM DATA: Drone-based highway dataset for the development and validation of automated driving software for research and commercial applications. In Proceedings of the 2021 IEEE Intelligent Vehicles Symposium (IV), 11-17 July 2021; 2021; pp. 1372–1377. [Google Scholar]
- Zhang, Y.; Wang, C.; Yu, R.; Wang, L.; Quan, W.; Gao, Y.; Li, P. The AD4CHE Dataset and its Application in Typical Congestion Scenarios of Traffic Jam Pilot Systems. IEEE Transactions on Intelligent Vehicles 2023, 1–12. [Google Scholar] [CrossRef]
- Moers, T.; Vater, L.; Krajewski, R.; Bock, J.; Zlocki, A.; Eckstein, L. The exiD dataset: a real-world trajectory dataset of highly interactive highway scenarios in germany. In Proceedings of the 2022 IEEE Intelligent Vehicles Symposium (IV); 2022; pp. 958–964. [Google Scholar]
- Daamen, W.; Loot, M.; Hoogendoorn, S.P. Empirical Analysis of Merging Behavior at Freeway On-Ramp. Transportation Research Record 2010, 2188, 108–118. [Google Scholar] [CrossRef]
- E, Y.j.Y.; I, Y.N.; N., J.S.U. Defining and Modeling Active-responsive Merging Behavior at High-density Expressway On-ramp Bottlenecks. China Journal of Highway and Transport 2022, 35, 278–290. [Google Scholar]
- Sun, J.; Ouyang, J.; Yang, J. Modeling and analysis of merging behavior at expressway on-ramp bottlenecks. Transportation Research Record 2014, 2421, 74–81. [Google Scholar] [CrossRef]
- Liu, Y.; Wang, X.; Li, L.; Cheng, S.; Chen, Z. A novel lane change decision-making model of autonomous vehicle based on support vector machine. IEEE access 2019, 7, 26543–26550. [Google Scholar] [CrossRef]
- Wang, H.; Wang, W.; Yuan, S.; Li, X.; Sun, L. On Social Interactions of Merging Behaviors at Highway On-Ramps in Congested Traffic. IEEE Transactions on Intelligent Transportation Systems 2022, 23, 11237–11248. [Google Scholar] [CrossRef]
- Lu, Y.; Cheng, K.; Zhang, Y.; Chen, X.; Zou, Y. Analysis of lane-changing conflict between cars and trucks at freeway merging sections using UAV video data. Journal of Transportation Safety & Security 2023, 15, 943–961. [Google Scholar] [CrossRef]
- Zhang, Y.; Wang, C.; Yu, R.; Wang, L.; Quan, W.; Gao, Y.; Li, P. The AD4CHE Dataset and its Application in Typical Congestion Scenarios of Traffic Jam Pilot Systems. IEEE Transactions on Intelligent Vehicles 2023. [Google Scholar] [CrossRef]
- Bender, P.; Ziegler, J.; Stiller, C. Lanelets: Efficient map representation for autonomous driving. In Proceedings of the 2014 IEEE Intelligent Vehicles Symposium Proceedings; 2014; pp. 420–425. [Google Scholar]
- Althoff, M.; Urban, S.; Koschi, M. Automatic conversion of road networks from opendrive to lanelets. In Proceedings of the 2018 IEEE International Conference on Service Operations and Logistics, and Informatics (SOLI), 2018; pp. 157–162. [Google Scholar]
- Littman, M.L. Markov games as a framework for multi-agent reinforcement learning. In Machine learning proceedings 1994; Elsevier, 1994; pp. 157–163. [Google Scholar]
- Kita, H. A merging–giveway interaction model of cars in a merging section: a game theoretic analysis. Transportation Research Part A: Policy and Practice 1999, 33, 305–312. [Google Scholar] [CrossRef]
- Elvik, R. A review of game-theoretic models of road user behaviour. Accident Analysis & Prevention 2014, 62, 388–396. [Google Scholar]
- Poggenhans, F.; Pauls, J.-H.; Janosovits, J.; Orf, S.; Naumann, M.; Kuhnt, F.; Mayr, M. Lanelet2: A high-definition map framework for the future of automated driving. In Proceedings of the 2018 21st international conference on intelligent transportation systems (ITSC); 2018; pp. 1672–1679. [Google Scholar]
|
Disclaimer/Publisher’s Note: The statements, opinions and data contained in all publications are solely those of the individual author(s) and contributor(s) and not of MDPI and/or the editor(s). MDPI and/or the editor(s) disclaim responsibility for any injury to people or property resulting from any ideas, methods, instructions or products referred to in the content. |
© 2024 by the authors. Licensee MDPI, Basel, Switzerland. This article is an open access article distributed under the terms and conditions of the Creative Commons Attribution (CC BY) license (http://creativecommons.org/licenses/by/4.0/).


