Submitted:
09 January 2024
Posted:
10 January 2024
You are already at the latest version
Abstract
Keywords:
1. Introduction
2. Experimental Setup
2.1. UAV Description
2.2. Drone Mounting
2.3. Sonic Anemometer Measurement Rig
3. PIF Measurements
3.1. Measurement Pattern
3.2. Data Processing
4. Results and Discussion
4.1. Mean PIF
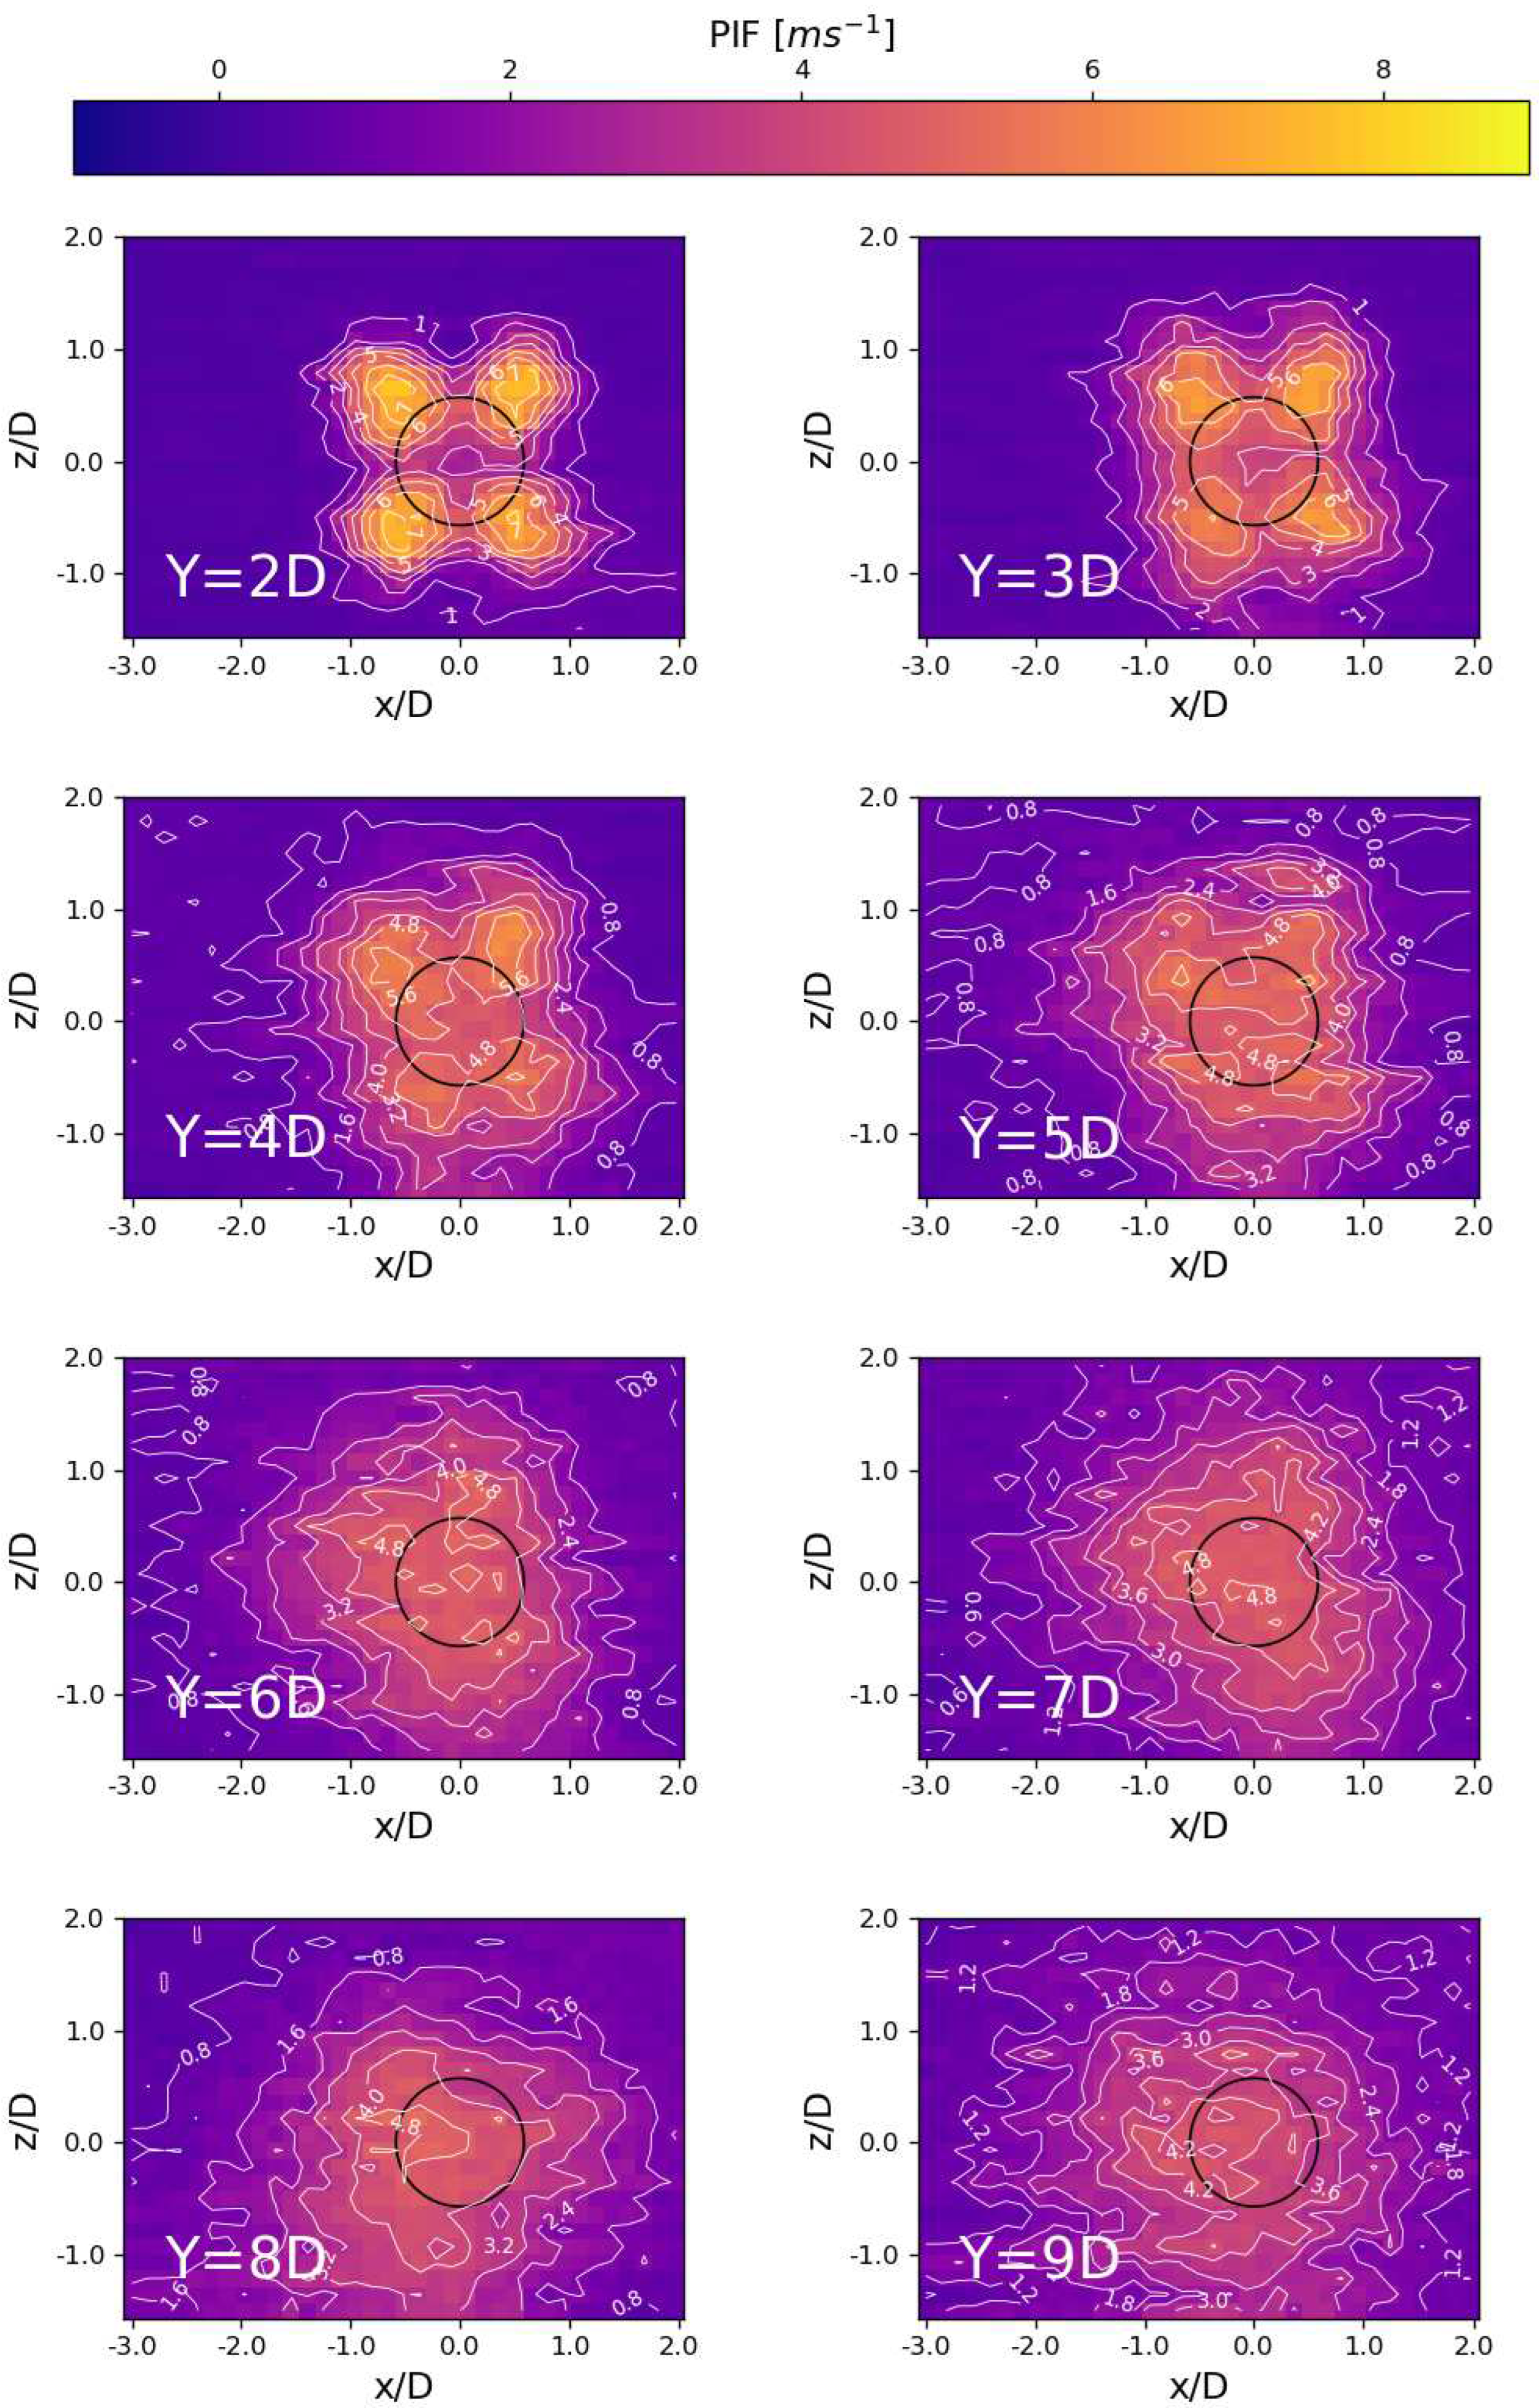
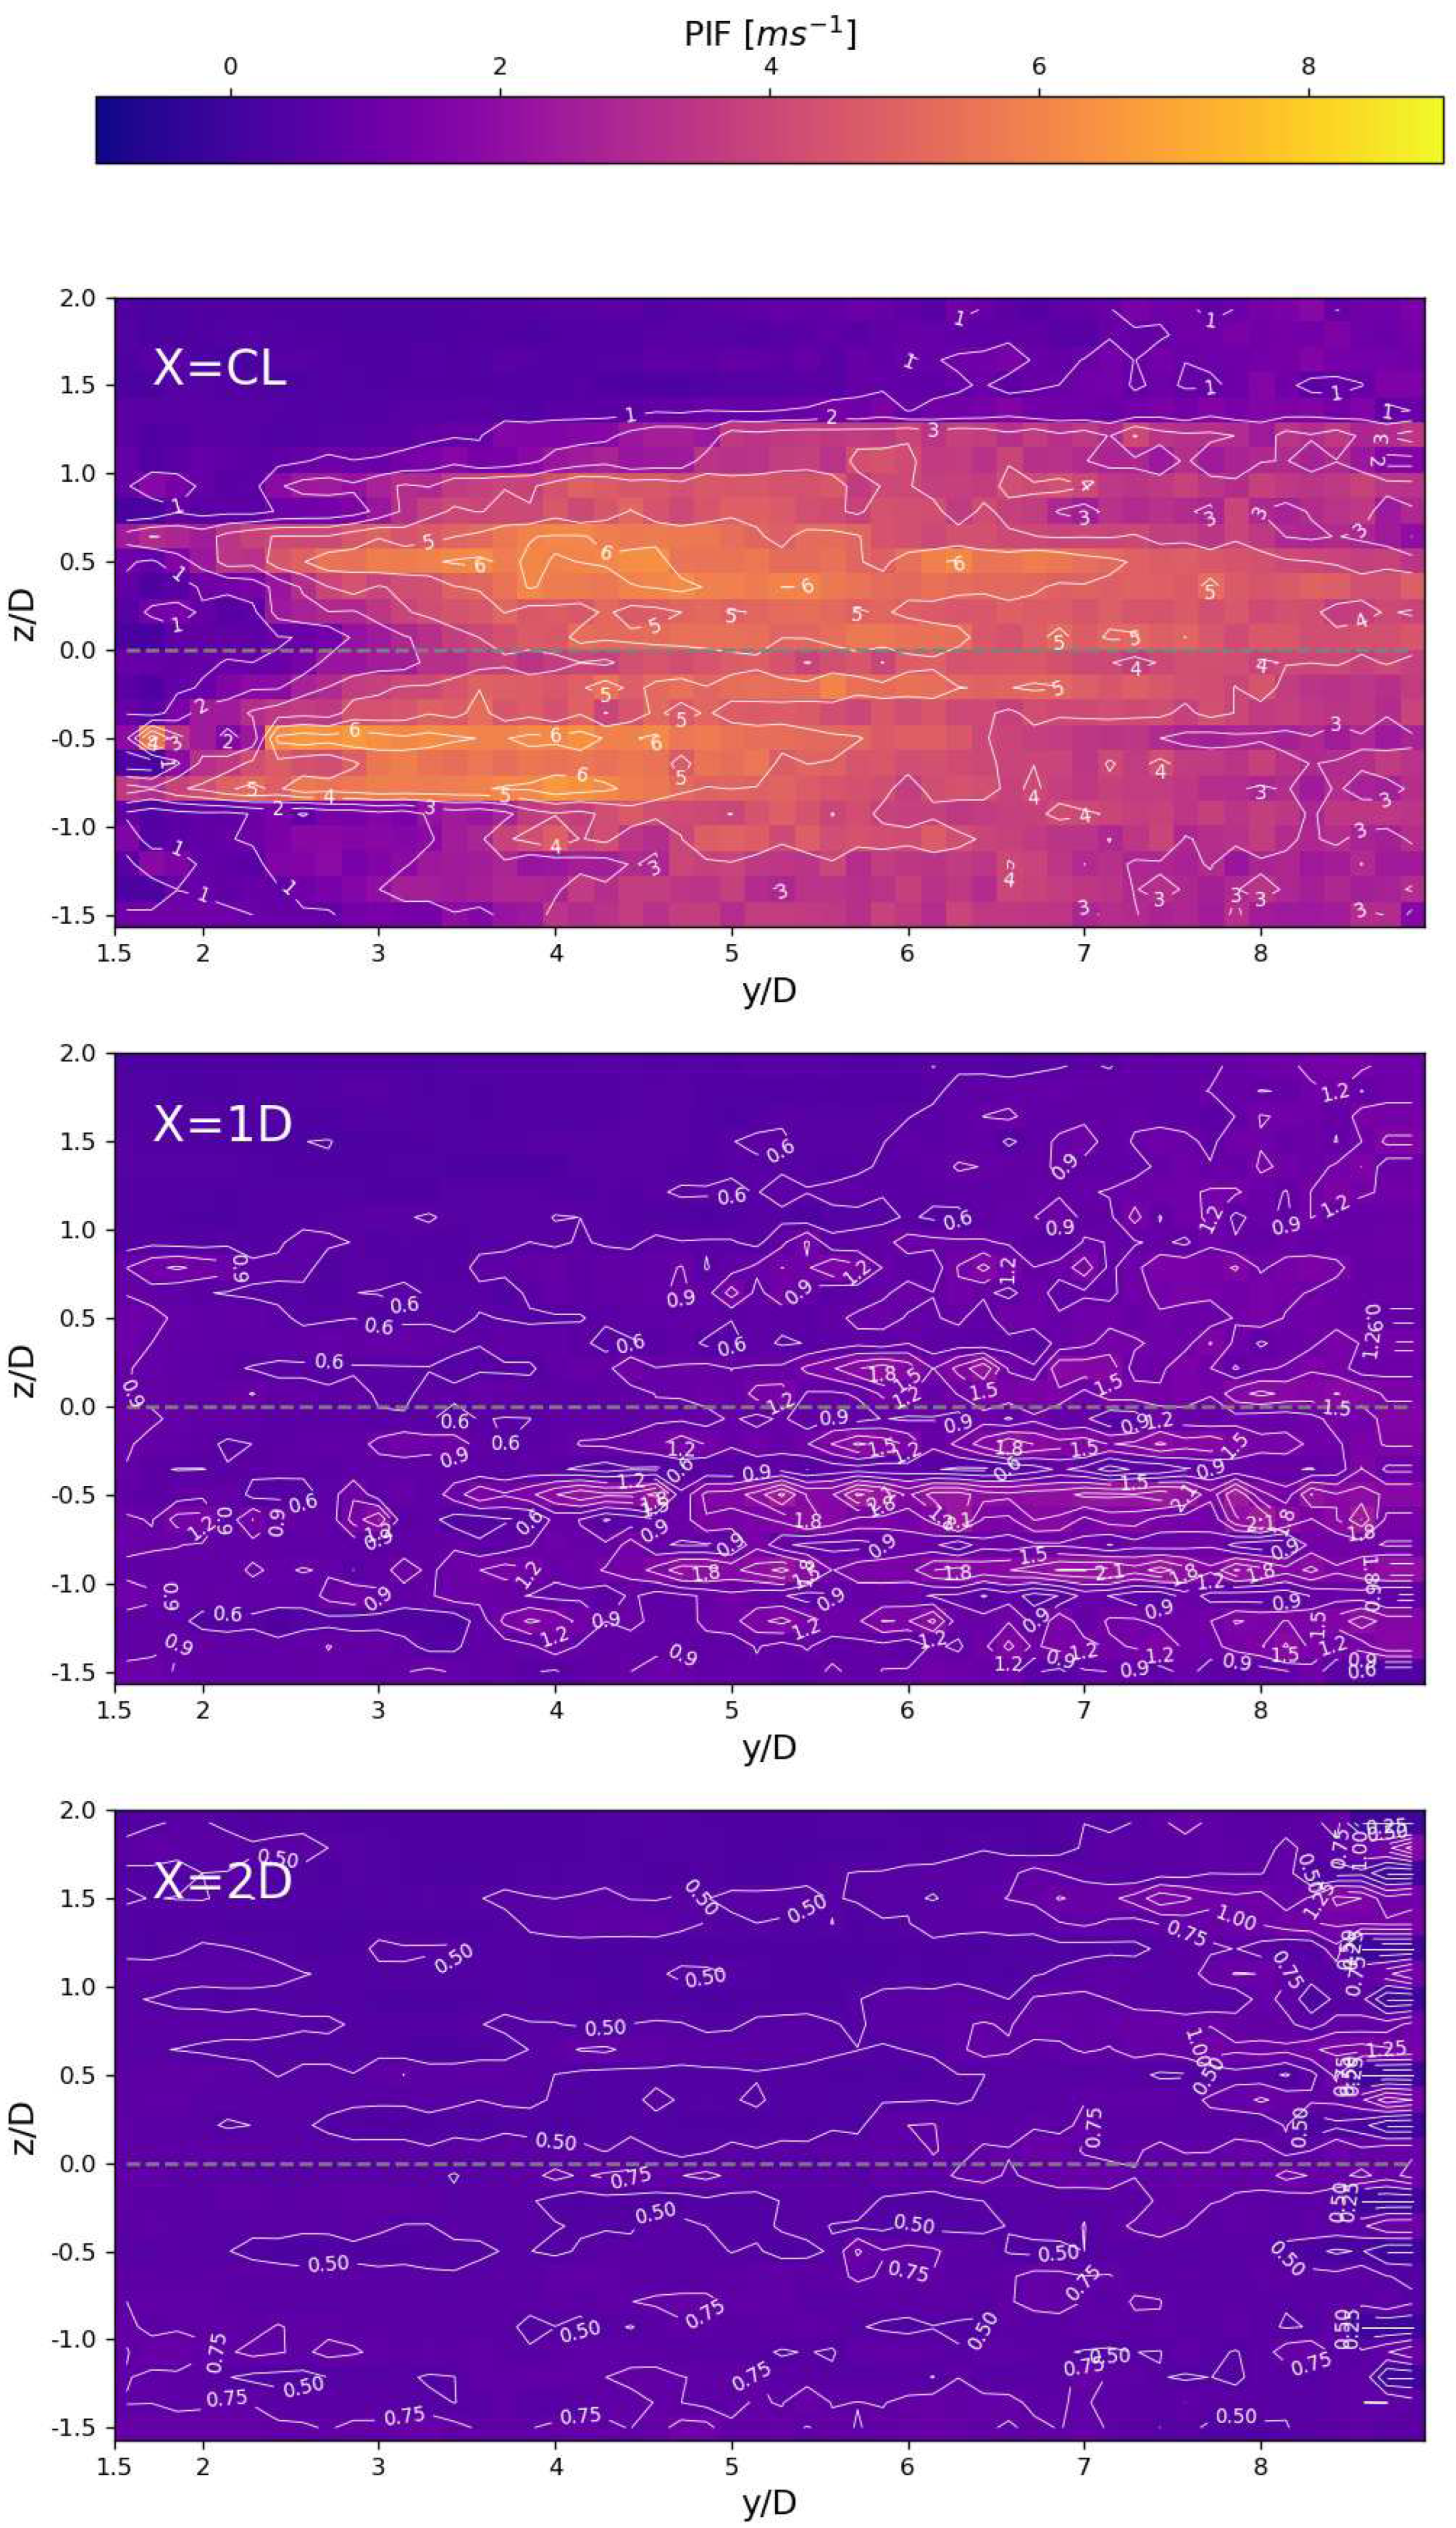
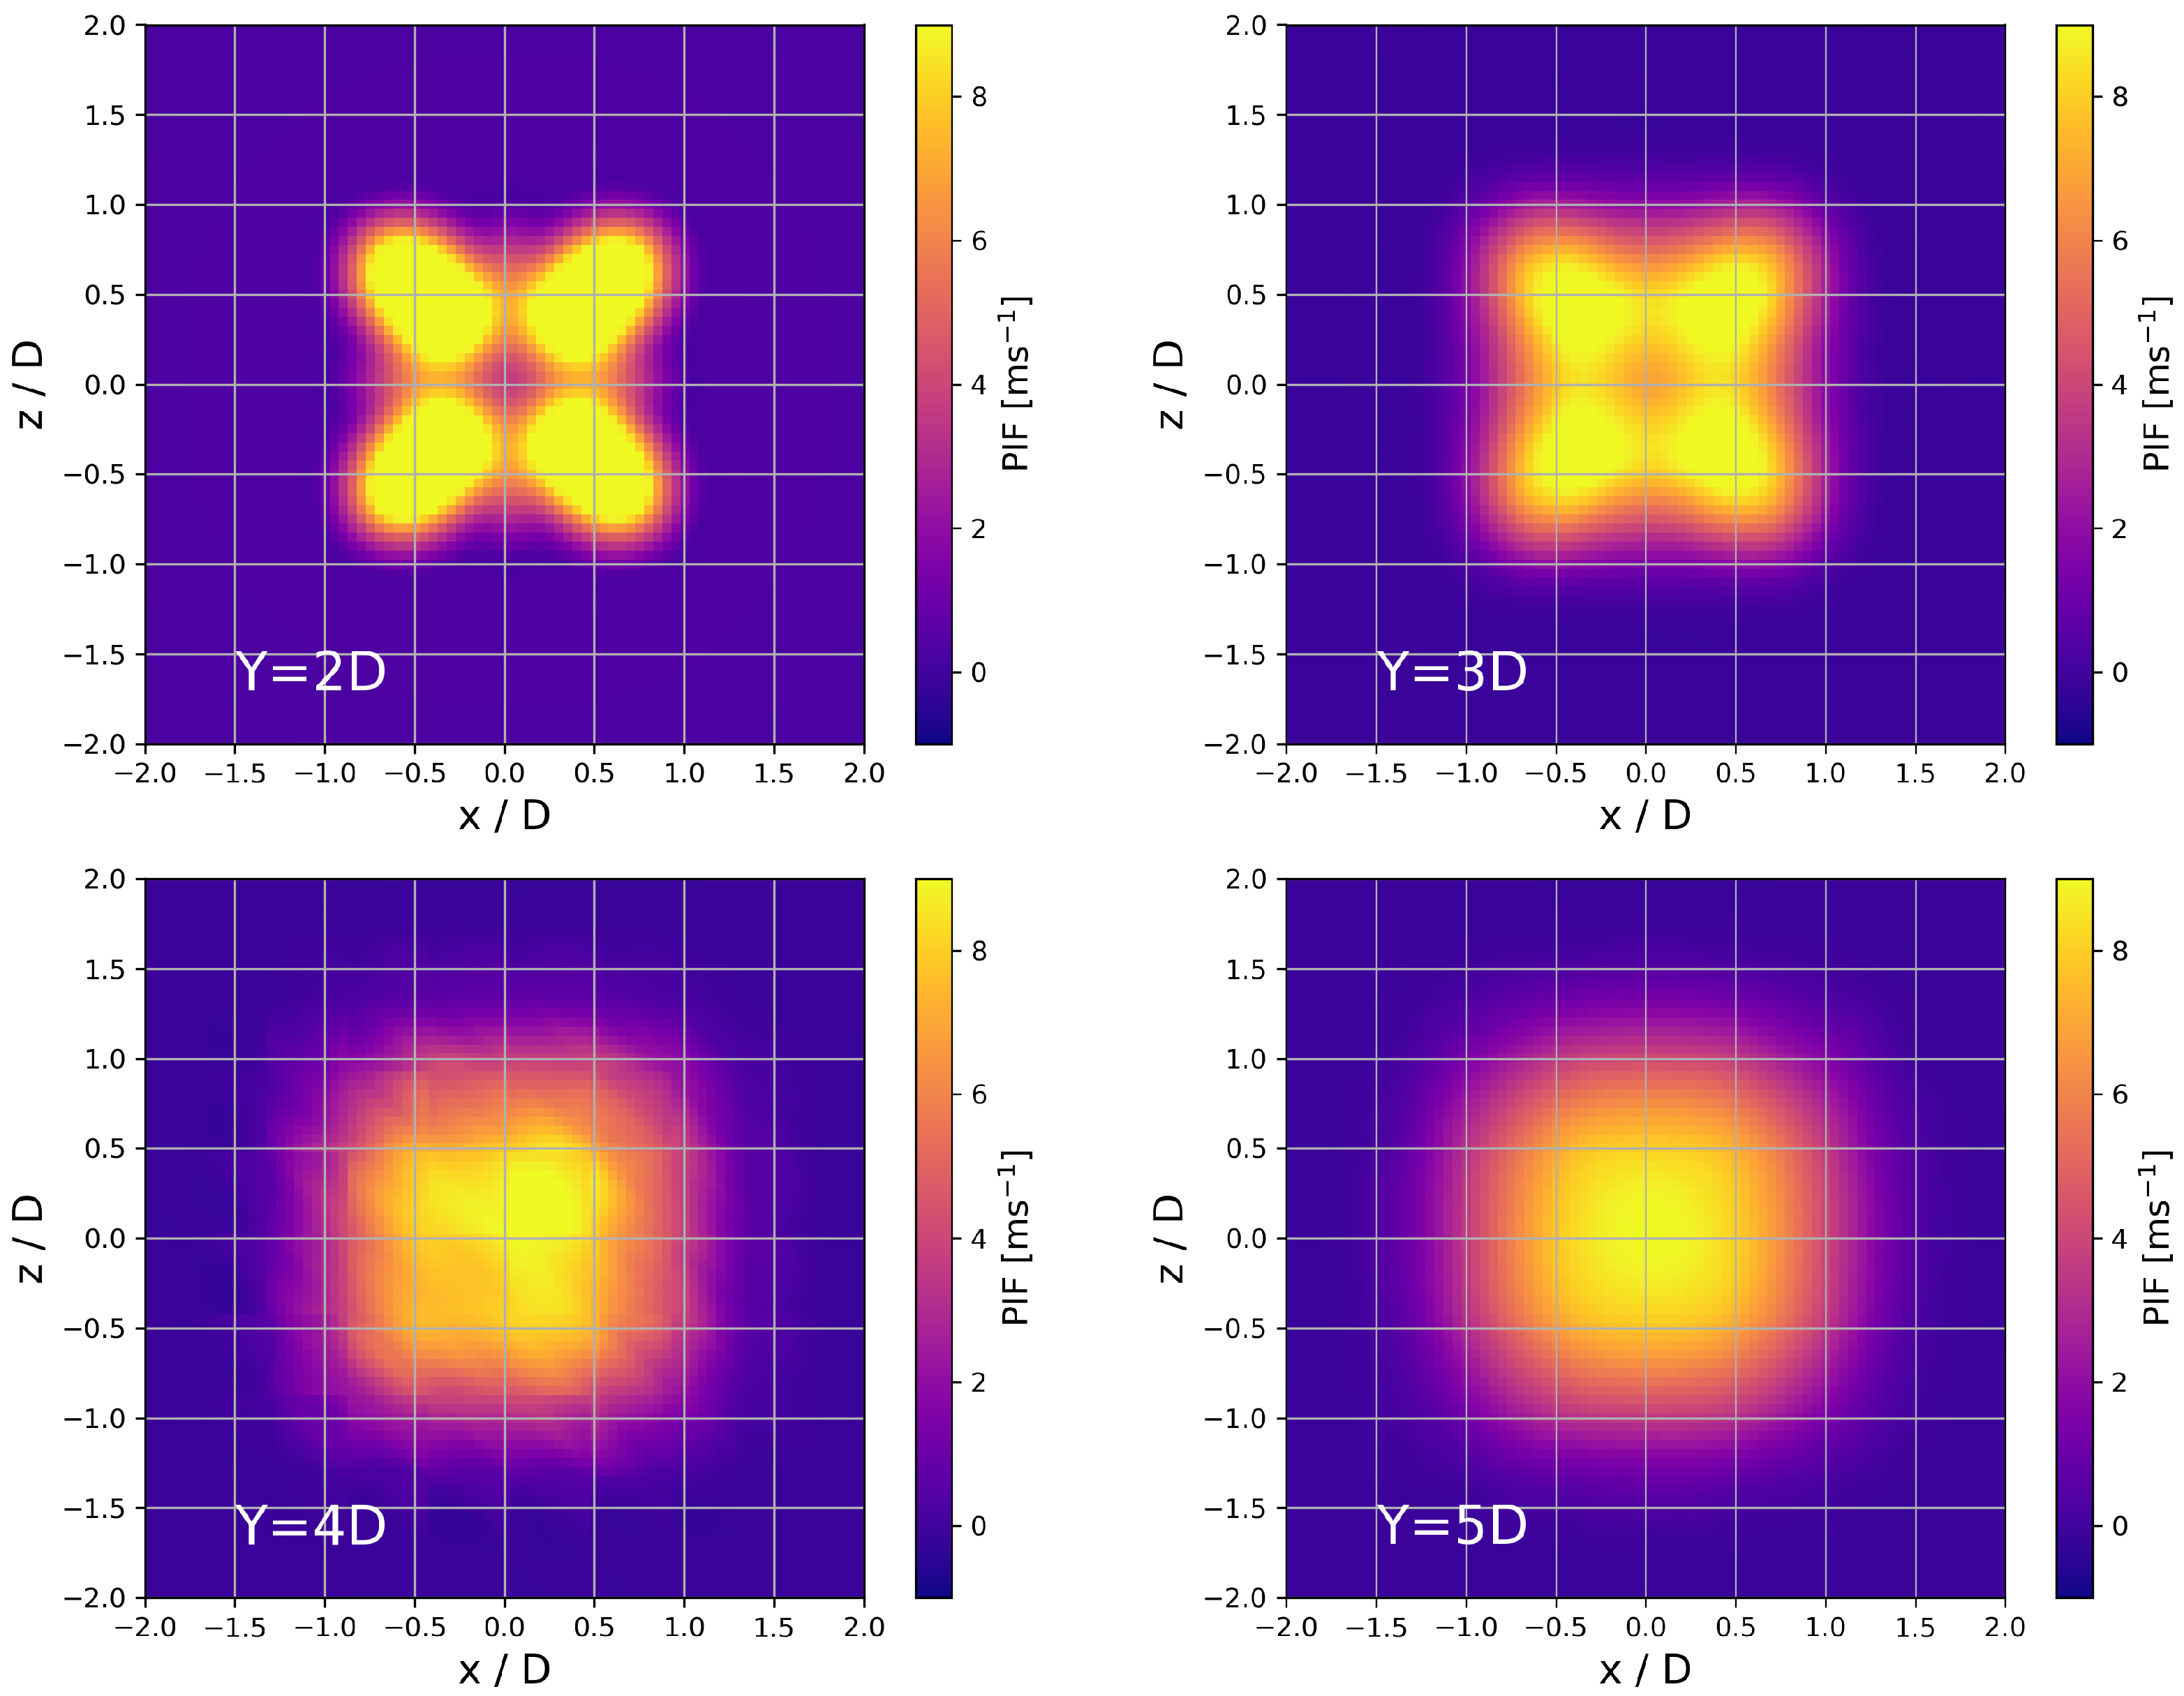
- Distinct hotspots of high PIF are clearly visible, one for each rotor set. The peak velocities within the range of 6 m s−1 to 7 m s−1 are observed at the center of the four hotspots. Beyond a distance equivalent to rotor diameter in x- or z-direction from the drone’s center, there is no substantial observed flow disturbance.
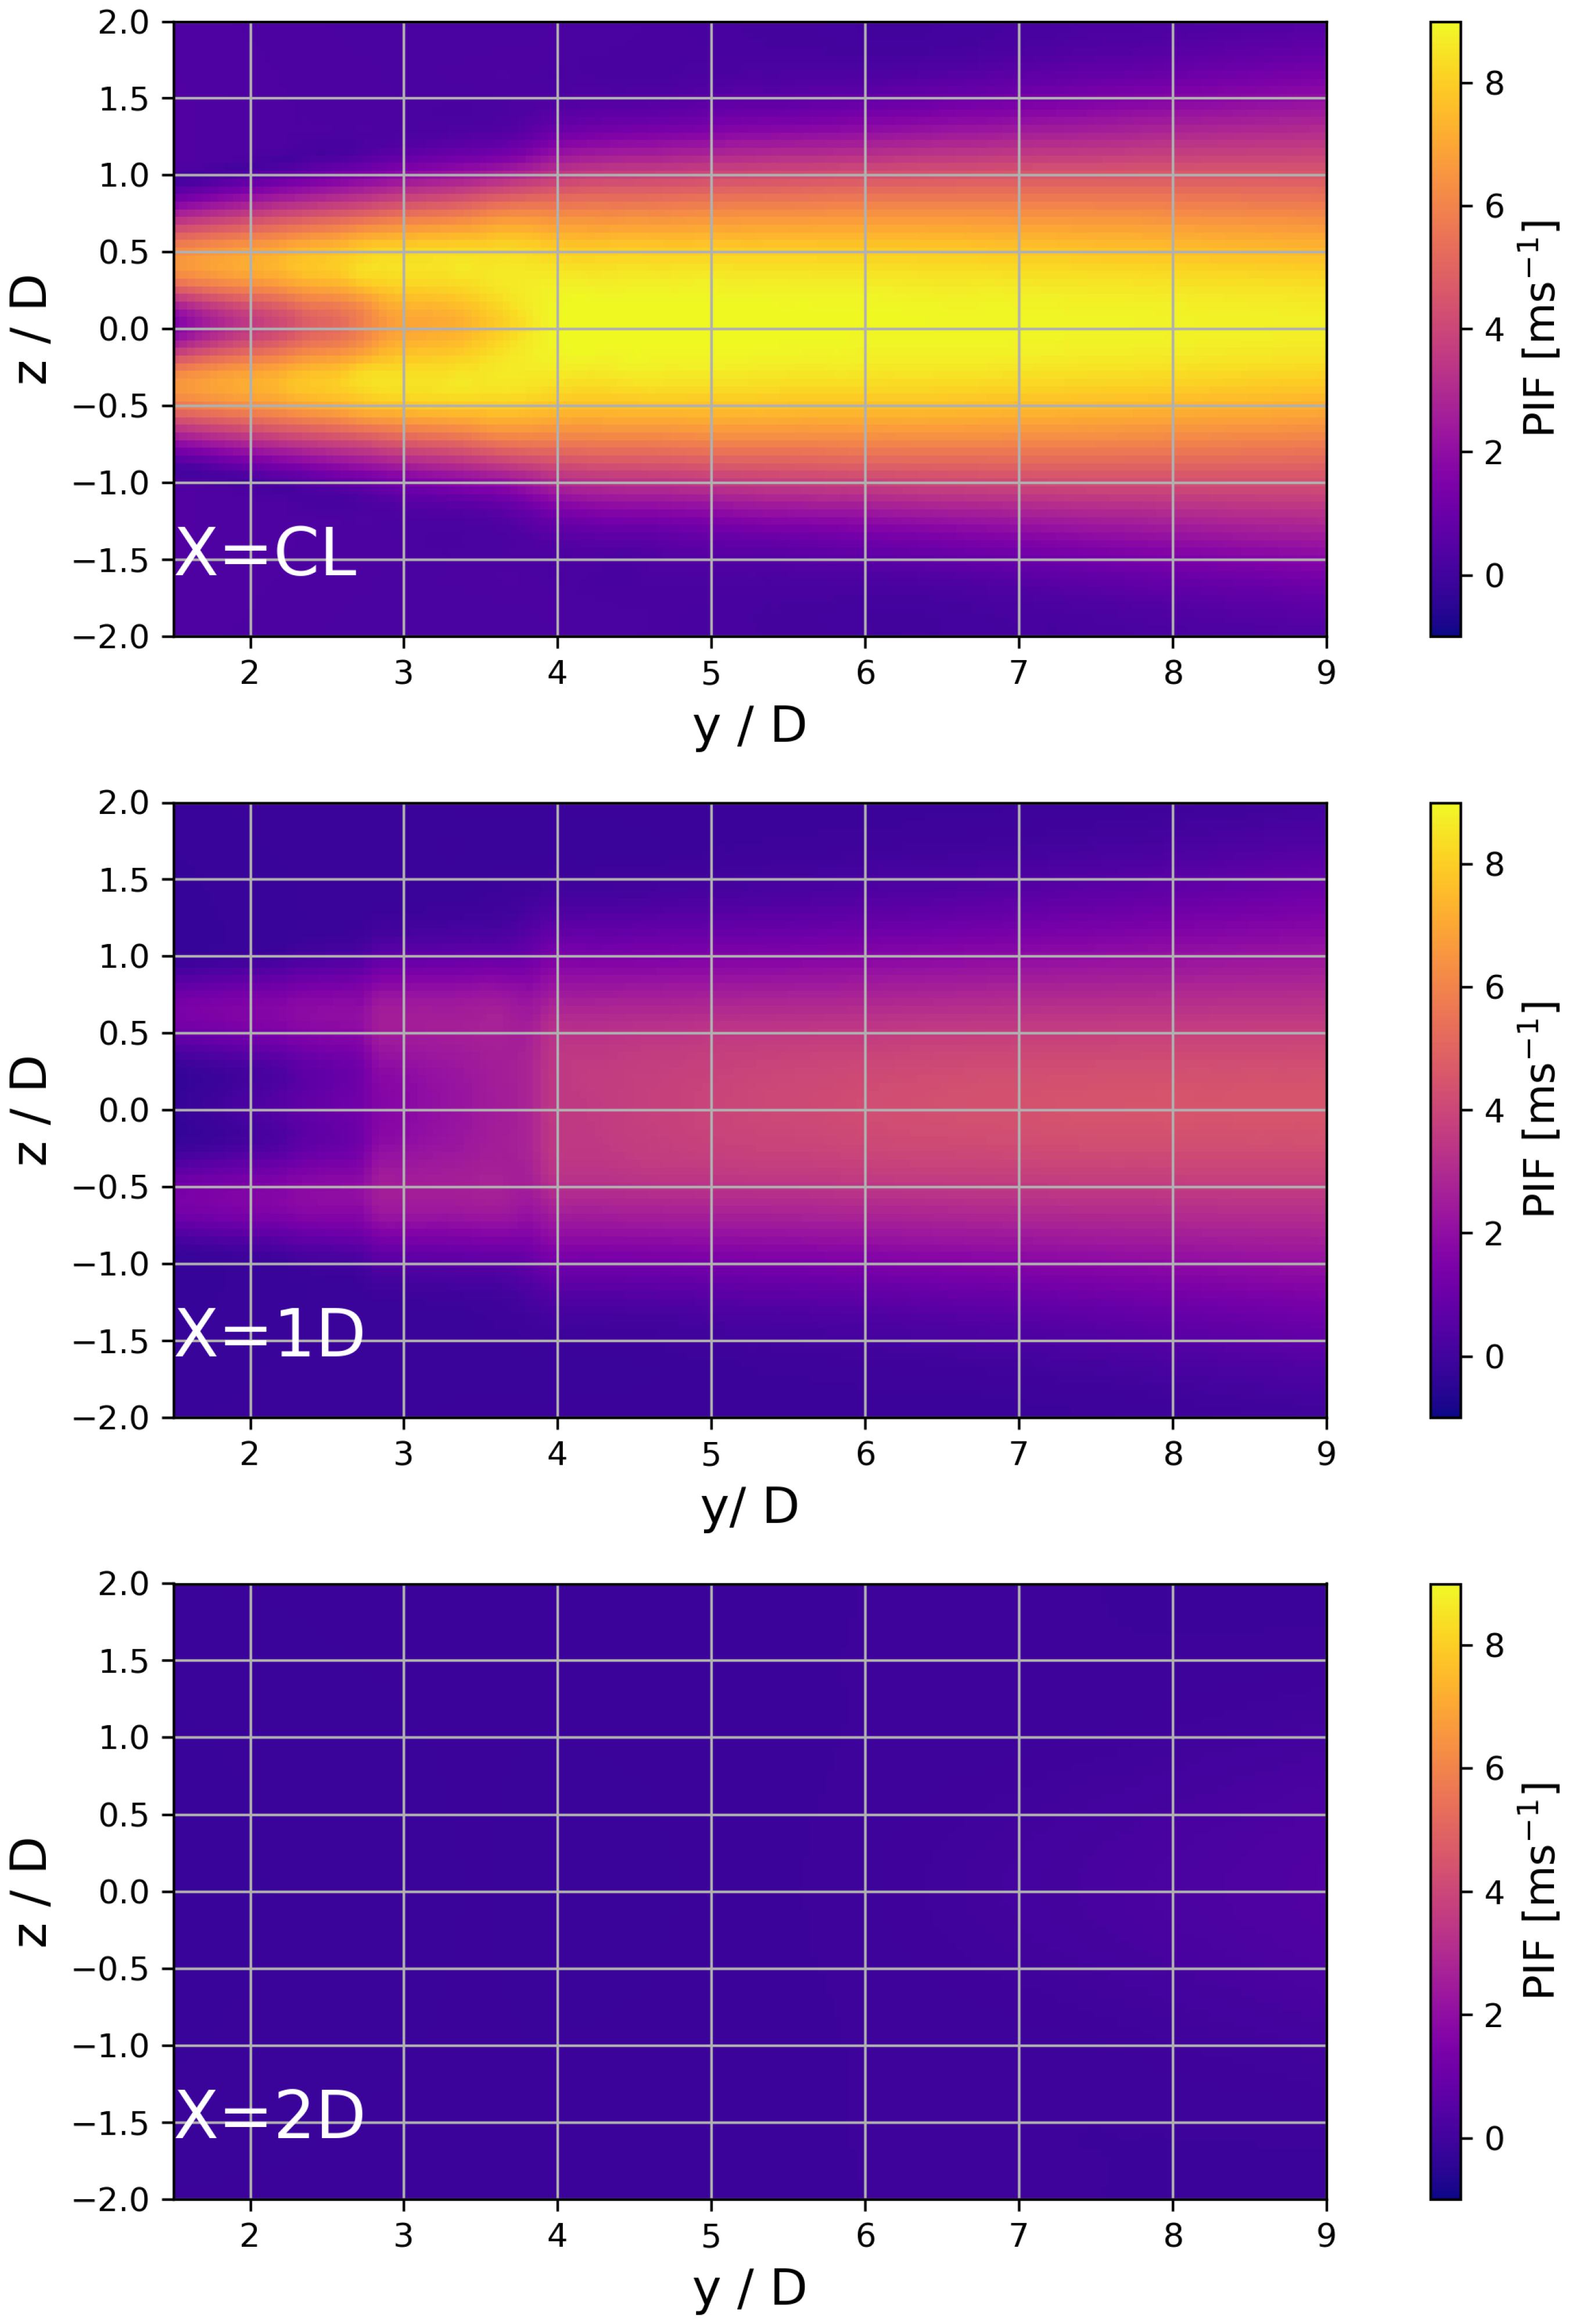
- The initially distinct hotspots begin to converge, forming a more consolidated and uniform downwash structure. The region with the highest velocities is centered behind the drone, with peak velocities of 5 m s−1 to 6 m s−1 for a throttle setting of 35%. The data indicate a more pronounced onset of downwash expansion at this stage. The figures also show that the air between the downwash and the floor, starts to speed up.
- The hotspots corresponding to the four-rotor sets have now completely dissipated. The downwash center, marked by the region of greatest velocities, remains largely centered relative to the drone. Notably, the downwash starts to expand asymmetrically, indicating the potential effect of wall, floor and ceiling in the far-flow of the downwash.
- At this stage, the downwash center has shifted towards the left by about . Peak velocities around 4 m s−1 were observed. The edges of the downwash lean more towards the bottom left.
4.2. PIF Variabillity
4.3. Comparison with CFD Simulations and Environmental Observations
4.3.1. CFD Simulations
4.3.2. Outdoor Observations
5. Conclusions
Author Contributions
Funding
Data Availability Statement
Acknowledgments
Conflicts of Interest
Abbreviations
| ABL | atmospheric boundary layer |
| CFD | computational fluid dynamic |
| GCS | ground control station |
| PIF | propeller induced flow |
| PSU | power supply unit |
| RPAS | remotely piloted aircraft system |
| TKE | turbulent kinetic energy |
| TOW | take-off weight |
| UAS | uncrewed aerial system |
| UAV | uncrewed aerial vehicle |
References
- Stull, R.B. An Introduction to Boundary Layer Meteorology; Springer Netherlands: Dordrecht, 1988. [Google Scholar]
- Wyngaard, J.C. Turbulence in the Atmosphere; Cambridge University Press: Cambridge, 2010. [Google Scholar] [CrossRef]
- Jensen, N.; Hjort-Hansen, E. Dynamic Excitation of Structures by Wind—Turbulence and Response Measurements at the Sotra Bridge. Report No. STF71 A 1977, 78003. [Google Scholar]
- Kristensen, L.; Jensen, N. Lateral coherence in isotropic turbulence and in the natural wind. Boundary-Layer Meteorology 1979, 17, 353–373. [Google Scholar] [CrossRef]
- Kaimal, J.C.; Wyngaard, J.; Izumi, Y.; Coté, O. Spectral characteristics of surface-layer turbulence. Quarterly Journal of the Royal Meteorological Society 1972, 98, 563–589. [Google Scholar] [CrossRef]
- Jensen, N.O. Simultaneous measurements of turbulence over land and water. Boundary-Layer Meteorology 1978, 15, 95–108. [Google Scholar] [CrossRef]
- Mauder, M.; Foken, T.; Aubinet, M.; Ibrom, A. Eddy-Covariance Measurements. In Springer Handbook of Atmospheric Measurements; Foken, Ed.; Springer: Cham, 2021; chapter 55. [Google Scholar]
- Mahrt, L. Stably Stratified Atmospheric Boundary Layers. Annual Review of Fluid Mechanics 2014, 46, 23–45. [Google Scholar] [CrossRef]
- Kral, S.T.; Reuder, J.; Vihma, T.; Suomi, I.; Haualand, K.F.; Urbancic, G.H.; Greene, B.R.; Steeneveld, G.J.; Lorenz, T.; Maronga, B.; et al. The Innovative Strategies for Observations in the Arctic Atmospheric Boundary Layer Project (ISOBAR): Unique Finescale Observations under Stable and Very Stable Conditions. Bulletin of the American Meteorological Society 2021, 102, E218–E243. [Google Scholar] [CrossRef]
- Porté-Agel, F.; Bastankhah, M.; Shamsoddin, S. Wind-Turbine and Wind-Farm Flows: A Review. Boundary-Layer Meteorology 2020, 174. [Google Scholar] [CrossRef] [PubMed]
- Veers, P.; Dykes, K.; Lantz, E.; Barth, S.; Bottasso, C.L.; Carlson, O.; Clifton, A.; Green, J.; Green, P.; Holttinen, H.; et al. Grand challenges in the science of wind energy. Science 2019, 366, eaau2027. [Google Scholar] [CrossRef] [PubMed]
- Mikkelsen, T.; Sjöholm, M.; Angelou, N.; Mann, J. 3D WindScanner lidar measurements of wind and turbulence around wind turbines, buildings and bridges. In Proceedings of the IOP Conference Series: Materials Science and Engineering. IOP Publishing, 2017, Vol. 276, p.012004. [CrossRef]
- Cheynet, E.; Flügge, M.; Reuder, J.; Jakobsen, J.B.; Heggelund, Y.; Svardal, B.; Saavedra Garfias, P.; Obhrai, C.; Daniotti, N.; Berge, J.; et al. The COTUR project: remote sensing of offshore turbulence for wind energy application. Atmospheric Measurement Techniques 2021, 14, 6137–6157. [Google Scholar] [CrossRef]
- Ogawa, Y.; Ohara, T. Observation of the turbulent structure in the planetary boundary layer with a kytoon-mounted ultrasonic anemometer system. Boundary-Layer Meteorology 1982, 22, 123–131. [Google Scholar] [CrossRef]
- Hobby, M.J. Turbulence Measurements from a Tethered Balloon. PhD thesis, University of Leeds, 2013.
- Canut, G.; Couvreux, F.; Lothon, M.; Legain, D.; Piguet, B.; Lampert, A.; Maurel, W.; Moulin, E. Turbulence fluxes and variances measured with a sonic anemometer mounted on a tethered balloon. Atmospheric Measurement Techniques 2016, 9, 4375–4386. [Google Scholar] [CrossRef]
- Blanc, T.V.; Plant, W.J.; Keller, W.C. The Naval Research Laboratory’s Air-Sea Interaction Blimp Experiment. Bulletin of the American Meteorological Society 1989, 70, 354–365. [Google Scholar] [CrossRef]
- Nambiar, M.K.; Byerlay, R.A.E.; Nazem, A.; Nahian, M.R.; Moradi, M.; Aliabadi, A.A. A Tethered Air Blimp (TAB) for observing the microclimate over a complex terrain. Geoscientific Instrumentation, Methods and Data Systems 2020, 9, 193–211. [Google Scholar] [CrossRef]
- Elston, J.; Argrow, B.; Stachura, M.; Weibel, D.; Lawrence, D.; Pope, D. Overview of small fixed-wing unmanned aircraft for meteorological sampling. Journal of Atmospheric and Oceanic Technology 2015, 32, 97–115. [Google Scholar] [CrossRef]
- Pinto, J.O.; O’Sullivan, D.; Taylor, S.; Elston, J.; Baker, C.B.; Hotz, D.; Marshall, C.; Jacob, J.; Barfuss, K.; Piguet, B.; et al. The Status and Future of Small Uncrewed Aircraft Systems (UAS) in Operational Meteorology. Bulletin of the American Meteorological Society 2021, 102, E2121–E2136. [Google Scholar] [CrossRef]
- de Boer, G.; Argrow, B.; Cassano, J.; Cione, J.; Frew, E.; Lawrence, D.; Wick, G.; Wolff, C. Advancing Unmanned Aerial Capabilities for Atmospheric Research. Bulletin of the American Meteorological Society 2019, 100, ES105–ES108. [Google Scholar] [CrossRef]
- Båserud, L.; Reuder, J.; Jonassen, M.O.; Kral, S.T.; Paskyabi, M.B.; Lothon, M. Proof of concept for turbulence measurements with the RPAS SUMO during the BLLAST campaign. Atmospheric Measurement Techniques 2016, 9, 4901–4913. [Google Scholar] [CrossRef]
- Mansour, M.; Kocer, G.; Lenherr, C.; Chokani, N.; Abhari, R.S. Seven-Sensor Fast-Response Probe for Full-Scale Wind Turbine Flowfield Measurements. Journal of Engineering for Gas Turbines and Power 2011, 133, 081601. [Google Scholar] [CrossRef]
- Calmer, R.; Roberts, G.C.; Preissler, J.; Sanchez, K.J.; Derrien, S.; O. ; apos;Dowd, C. Vertical wind velocity measurements using a five-hole probe with remotely piloted aircraft to study aerosol–cloud interactions. Atmospheric Measurement Techniques 2018, 11, 2583–2599. [Google Scholar] [CrossRef]
- Alaoui-Sosse, S.; Durand, P.; Medina, P.; Pastor, P.; Lothon, M.; Cernov, I. OVLI-TA: An Unmanned Aerial System for Measuring Profiles and Turbulence in the Atmospheric Boundary Layer. Sensors 2019, 19, 581. [Google Scholar] [CrossRef]
- Witte, B.; Singler, R.; Bailey, S. Development of an Unmanned Aerial Vehicle for the Measurement of Turbulence in the Atmospheric Boundary Layer. Atmosphere 2017, 8, 195. [Google Scholar] [CrossRef]
- Wildmann, N.; Hofsäß, M.; Weimer, F.; Joos, A.; Bange, J. MASC – a small Remotely Piloted Aircraft (RPA) for wind energy research. Advances in Science and Research 2014, 11, 55–61. [Google Scholar] [CrossRef]
- Wildmann, N.; Ravi, S.; Bange, J. Towards higher accuracy and better frequency response with standard multi-hole probes in turbulence measurement with remotely piloted aircraft (RPA). Atmospheric Measurement Techniques 2014, 7, 1027–1041. [Google Scholar] [CrossRef]
- Lenschow, D.H.; Spyers-Duran, P. Bulletin No. 23. Technical Report 23, NCAR Research Aviation Facility, 1989.
- Crawford, T.L.; McMillen, R.T.; Dobosy, R.J.; MacPherson, I. Correcting airborne flux measurements for aircraft speed variation. Boundary-Layer Meteorology 1993, 66, 237–245. [Google Scholar] [CrossRef]
- Drüe, C.; Heinemann, G. A Review and Practical Guide to In-Flight Calibration for Aircraft Turbulence Sensors. Journal of Atmospheric and Oceanic Technology 2013, 30, 2820–2837. [Google Scholar] [CrossRef]
- Vellinga, O.S.; Dobosy, R.J.; Dumas, E.J.; Gioli, B.; Elbers, J.a.; Hutjes, R.W.a. Calibration and quality assurance of flux observations from a small research aircraft. Journal of Atmospheric and Oceanic Technology 2013, 30, 161–181. [Google Scholar] [CrossRef]
- Davenport, A.G. The response of slender, line-like structures to a gusty wind. Proceedings of the Institution of Civil Engineers 1962, 23, 389–408. [Google Scholar] [CrossRef]
- Shimura, T.; Inoue, M.; Tsujimoto, H.; Sasaki, K.; Iguchi, M. Estimation of Wind Vector Profile Using a Hexarotor Unmanned Aerial Vehicle and Its Application to Meteorological Observation up to 1000 m above Surface. Journal of Atmospheric and Oceanic Technology 2018, 35, 1621–1631. [Google Scholar] [CrossRef]
- Hofsäß, M.; Bergmann, D.; Denzel, J.; Cheng, P.W. Flying UltraSonic - A new way to measure the wind. Wind Energy Science Discussions, 2019; 1–21. [Google Scholar] [CrossRef]
- Thielicke, W.; Hübert, W.; Müller, U.; Eggert, M.; Wilhelm, P. Towards accurate and practical drone-based wind measurements with an ultrasonic anemometer. Atmospheric Measurement Techniques 2021, 14, 1303–1318. [Google Scholar] [CrossRef]
- Bailey, S.C.C.; Sama, M.P.; Canter, C.A.; Pampolini, L.F.; Lippay, Z.S.; Schuyler, T.J.; Hamilton, J.D.; MacPhee, S.B.; Rowe, I.S.; Sanders, C.D.; et al. University of Kentucky measurements of wind, temperature, pressure and humidity in support of LAPSE-RATE using multisite fixed-wing and rotorcraft unmanned aerial systems. Earth System Science Data 2020, 12, 1759–1773. [Google Scholar] [CrossRef]
- McConville, A.; Richardson, T. High-altitude vertical wind profile estimation using multirotor vehicles. Frontiers in Robotics and AI 2023, 10, 1–14. [Google Scholar] [CrossRef]
- Li, Z.; Pu, O.; Pan, Y.; Huang, B.; Z, Z.; H, W. A Study on Measuring the Wind Field in the Air Using a Multi-rotor UAV Mounted with an Anemometer. Boundary-Layer Meteorology 2023, 187, 1–27. [Google Scholar] [CrossRef]
- Prudden, S.; Fisher, A.; Mohamed, A.; Watkins, S. A flying anemometer quadrotor: Part 1. 7th International Micro Air Vehicle Conference and Competition - Past, Present and Future, 2016. [Google Scholar]
- Fabrizio Schiano, J.A.M. Towards Estimation and Correction of Wind Effects on a Quadrotor UAV. 2014. [CrossRef]
- Paz, C.; Suárez, E.; Gil, C.; Vence, J. Assessment of the methodology for the CFD simulation of the flight of a quadcopter UAV. Journal of Wind Engineering and Industrial Aerodynamics 2021, 218, 104776. [Google Scholar] [CrossRef]
- Deters, R.W.; Krishnan, G.K.A.; Selig, M.S. Reynolds number effects on the performance of small-scale propellers. 2014. [CrossRef]
- Kutty, H.A.; Rajendran, P. 3D CFD Simulation and Experimental Validation of Small APC Slow Flyer Propeller Blade. Aerospace 2017, 4. [Google Scholar] [CrossRef]
- Zheng, Y.; Yang, S.; Liu, X.; Wang, J.; Norton, T.; Chen, J.; Tan, Y. The computational fluid dynamic modeling of downwash flow field for a six-rotor UAV. Frontiers of Agricultural Science and Engineering 2018, 5, 159–167. [Google Scholar] [CrossRef]
- Guo, Q.; Zhu, Y.; Tang, Y.; Hou, C.; He, Y.; Zhuang, J.; Zheng, Y.; Luo, S. CFD simulation and experimental verification of the spatial and temporal distributions of the downwash airflow of a quad-rotor agricultural UAV in hover. Computers and Electronics in Agriculture 2020, 172, 105343. [Google Scholar] [CrossRef]
- Guillermo, P.P.H.; Daniel, A.M.V.; Eduardo, G.G.E. CFD Analysis of two and four blades for multirotor Unmanned Aerial Vehicle. Institute of Electrical and Electronics Engineers Inc., 2018. [CrossRef]
- Lei, Y.; Lin, R. Effect of wind disturbance on the aerodynamic performance of coaxial rotors during hovering. Measurement and Control (United Kingdom) 2019, 52, 665–674. [Google Scholar] [CrossRef]
- Ghirardelli, M.; Kral, S.T.; Müller, N.C.; Hann, R.; Cheynet, E.; Reuder, J. Flow Structure around a Multicopter Drone: A Computational Fluid Dynamics Analysis for Sensor Placement Considerations. Drones 2023, 7, 467. [Google Scholar] [CrossRef]
- Rankine, W.J.M. On the mechanical principles of the action of propellers. Transactions of the Institution of Naval Architects 1865, 6. [Google Scholar]
- Froude, R.E. On the part played in propulsion by differences of fluid pressure. Trans. Inst. Naval Architects 1889, 30, 390. [Google Scholar]
- Sayigh, A. Comprehensive Renewable Energy; Vol. 2, Elsevier, 2012.
- Jin, L.; Ghirardelli, M.; Mann, J.; Sjöholm, M.; Kral, S.T.; Reuder, J. Rotary-wing drone-induced flow – comparison of simulations with lidar measurements 2023. [CrossRef]
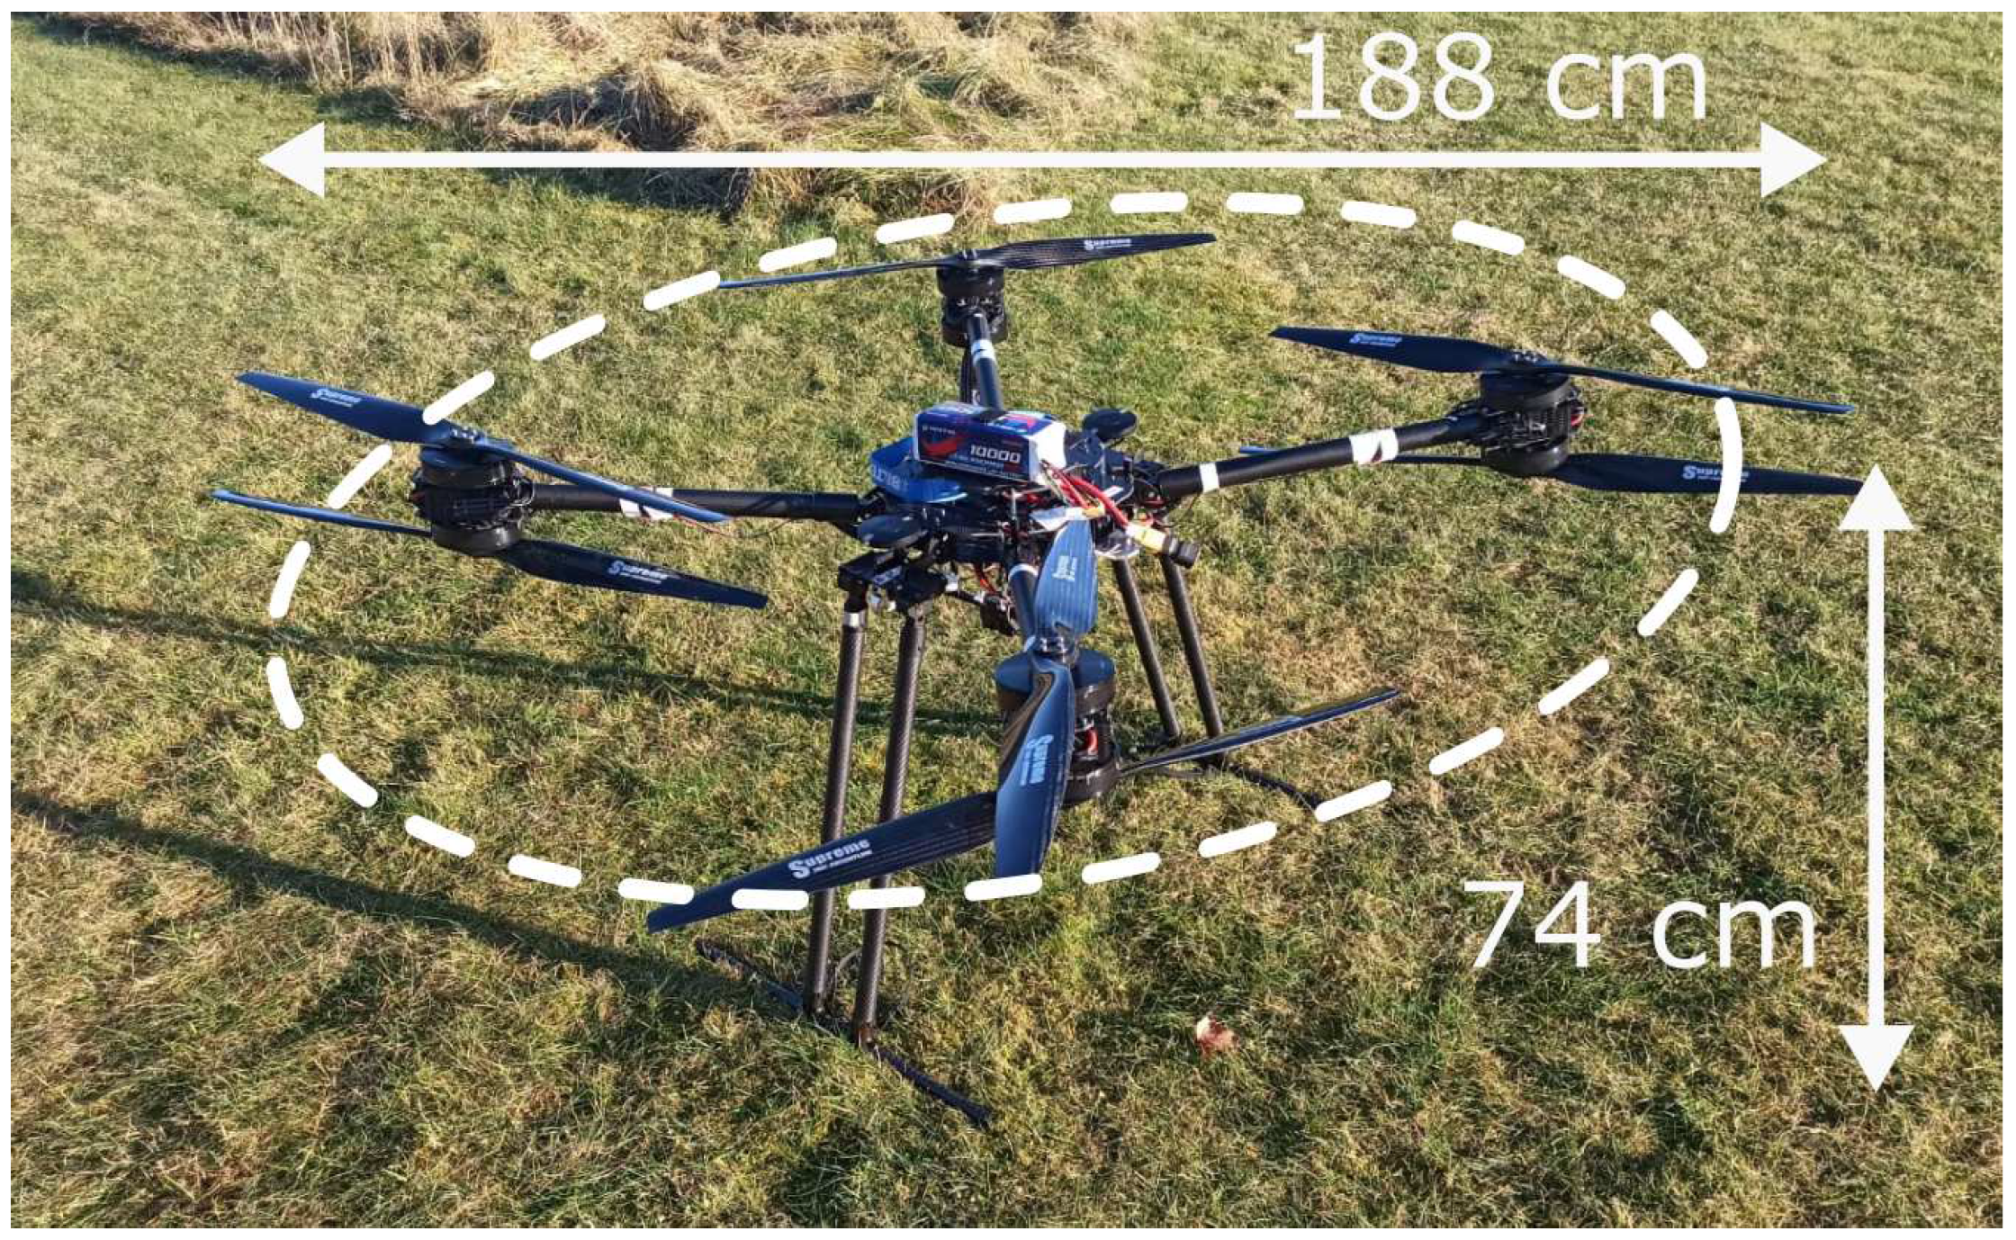
| Dimensions | |
|---|---|
| Width (tip to tip with 28 inch propellers) | |
| Height | |
| Diagonal wheelbase | |
| Weight frame | 9 |
| Weight with batteries | 15 |
| Frame arm length | |
| Propeller size | 28 inch ( ) |
| Propeller pitch | 8° |
| Propulsion System and Autopilot | |
| Speed Controller | T-MOTOR Flame 80A ESC |
| MOTOR | T-MOTOR U10II KV100 |
| Propeller | Foxtech Supreme 2880 Pro CF |
| Flight Controller | Pixhawk Cube Orange |
Disclaimer/Publisher’s Note: The statements, opinions and data contained in all publications are solely those of the individual author(s) and contributor(s) and not of MDPI and/or the editor(s). MDPI and/or the editor(s) disclaim responsibility for any injury to people or property resulting from any ideas, methods, instructions or products referred to in the content. |
© 2024 by the authors. Licensee MDPI, Basel, Switzerland. This article is an open access article distributed under the terms and conditions of the Creative Commons Attribution (CC BY) license (http://creativecommons.org/licenses/by/4.0/).


