1. Introduction
This research introduces the MARINIX Ocean Tech AI-Light Spectrum Replicator (LSR) system, a groundbreaking prototype for simulating in situ primary productivity measurements. Leveraging cutting-edge LED technologies with 12-channel full spectrum LEDs, the LSR allows for independent control of irradiances in each of the 12 illuminated sample chambers. What sets this system apart is the incorporation of Artificial Intelligence (AI) algorithms to precisely replicate in situ irradiance spectra and optimize the incubation process.
The LSR utilizes a sophisticated AI-driven dashboard that employs feed-forward neural networks and genetic algorithms. This approach involves constructing a database of simulated curves through randomizing LSR configurations. The AI model takes 10 numbers representing light spectrum curve peaks as input and outputs 10 numbers representing LSR configuration, with hidden linear layers and ReLU activation functions. The model's training, implemented in the PyTorch framework, showcases the efficiency of AI in capturing complex patterns within the simulated light spectrum data.
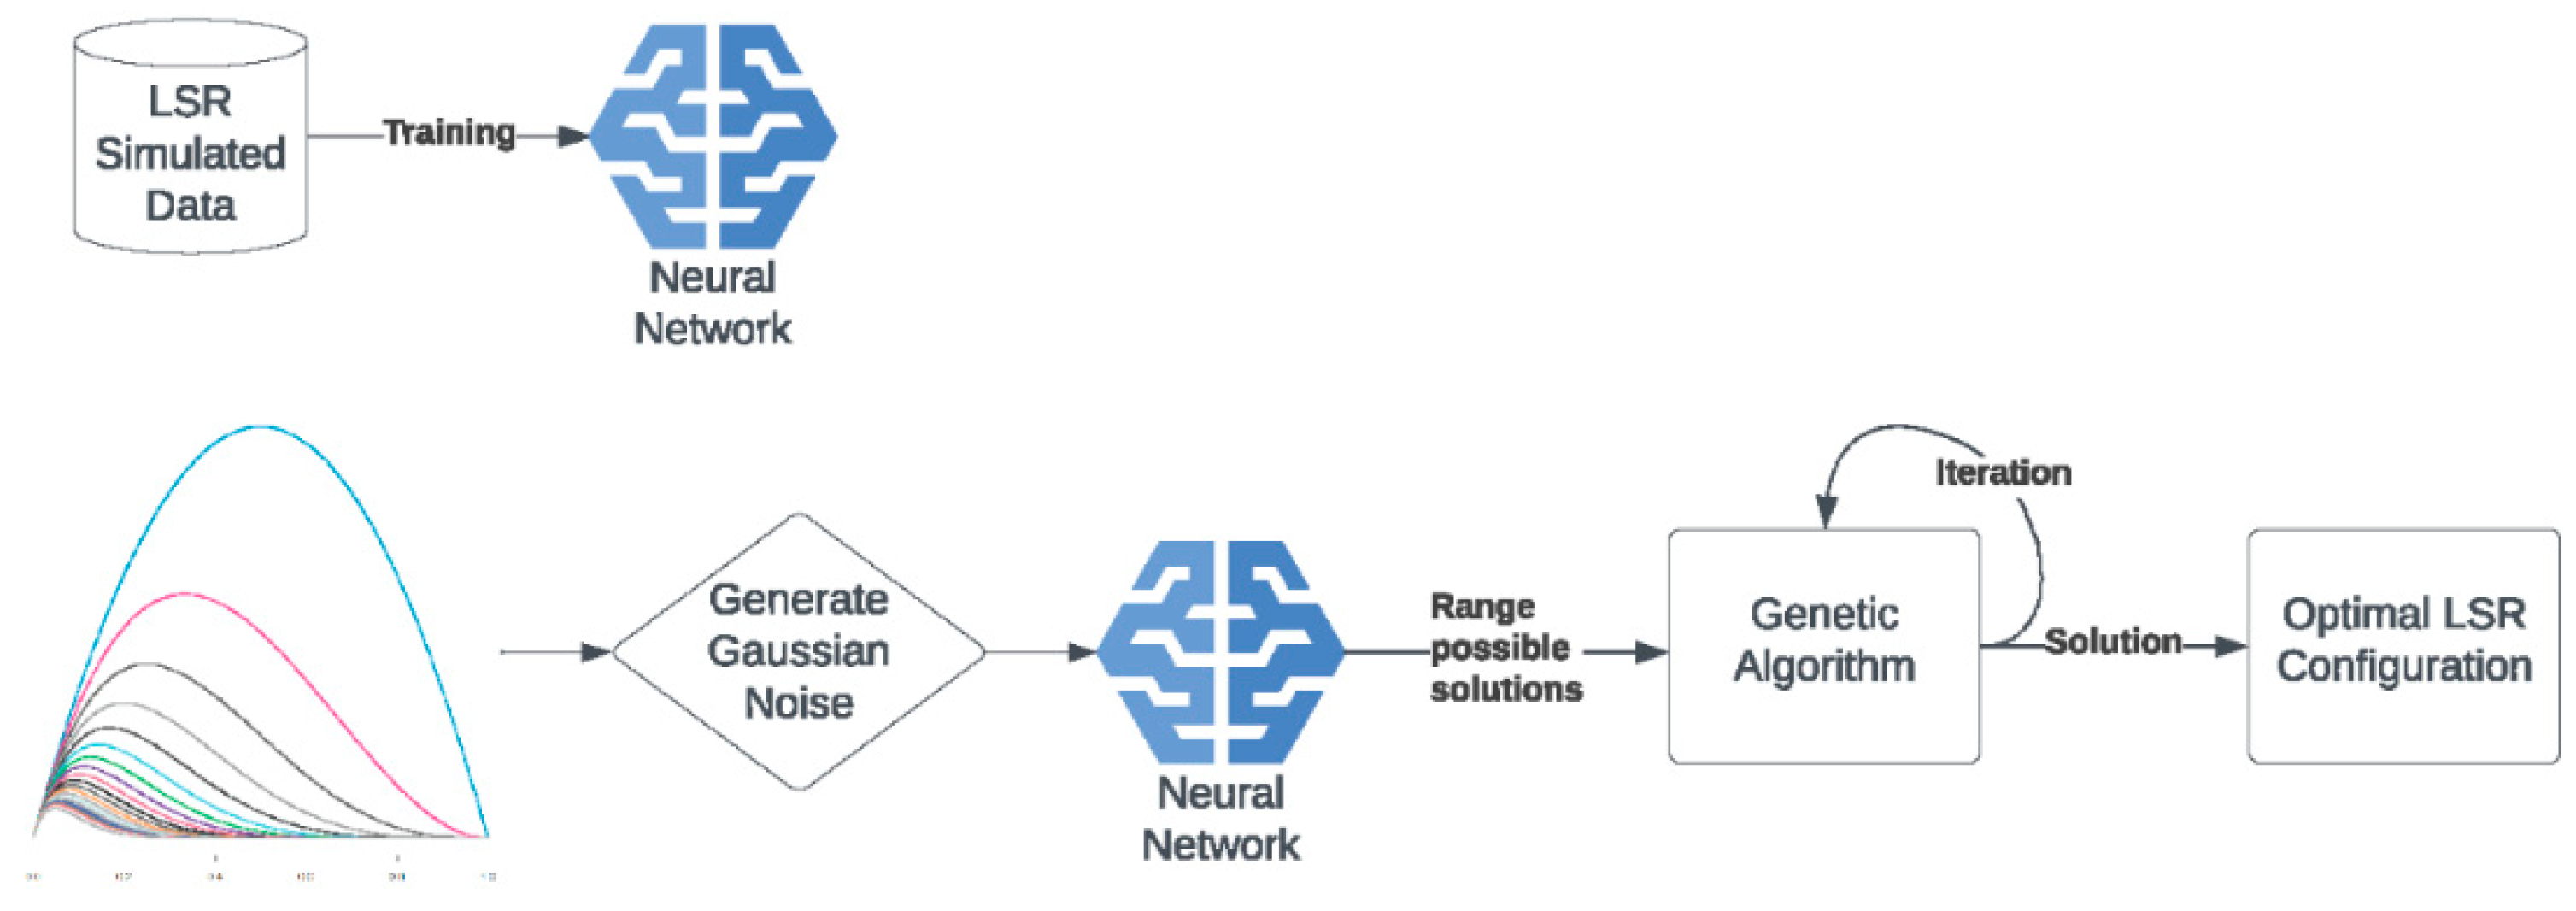
To overcome challenges associated with predicting desired light-spectrum curves directly, the model was employed to find a set of possible LSR configurations by introducing Gaussian noise to the input. The AI-generated solution space was then iteratively refined using a genetic algorithm to find the optimal curve within 10 minutes. This two-way approach, integrating AI into the replication and optimization processes, enhances the accuracy and efficiency of simulating in situ irradiance spectra, providing researchers with a valuable tool for primary productivity studies.
Even though the
14C method for estimating primary productivity [
9] is generally accepted as a highly sensitive assay for estimates of primary production, there is still a wide range of uncertainties related to errors introduced with the maintenance of temperature and irradiance during incubation and manipulation of samples prior and after the incubation within the method. Furthermore, when comparing the
14C method results to other approaches such as the dark-light method (24-hour incubation time),
13C [
10],
18O [
11] or FRRF (fast repetition rate fluorometry) [
12], there can be very large differences between the methods which continue to fuel discussion [
13].
Traditional
14C-POC strictly represents the production recovered in particulate form after the incubation time, not accounting for DOC release nor respiratory losses by the community [
11].
14C-POC probably underestimates net primary production (NPP), as heterotrophic respiration of particulate primary productivity (PPP) consumed by microzooplankton grazers also affects
14C-POC. The measurement of
14C incorporation into total organic matter partially overcomes this problem by short incubation periods (15 - 30 min) and accounting for the
14C recovered in the DOC pool, which can be substantial [
14,
15]. Yet, this estimate of primary production falls short of accounting for respiratory losses, both by autotrophs and heterotrophs [
16].
The dependence of primary productivity on temperature and irradiance (attenuation) has been previously shown [
17]. Approaches to estimating
in situ primary productivity used in previous studies involved different types of shipboard incubators, using attenuation coefficients of solar irradiance, or deriving “composite” P-I parameters from measurements of available data from irradiance and primary productivity measurements measured by either
in situ or simulated methods (e.g. [
18]). To overcome these problems, we used the approach to precisely replicate
in situ irradiance spectrum (300 - 850 nm range) in a desk incubator.
The primary objective of this study was to build and test the new prototype of the MARINIX Ocean Tech Light Spectrum Replicator (LSR) system for simulated in situ primary productivity measurements (particulate primary production - PPP) and compare the measurements with the traditional method for primary productivity measurements as used by the Institute for Oceanography and Fisheries in Split, Croatia for the past 30 years. To our knowledge, our LSR incubator is the first attempt at simulating (replicating/mimicking) in situ irradiance in a ship incubator. We applied newly developed LED technologies (12-channel full spectrum LEDs) with which irradiances in each of the 12 illuminated sample chambers can be independently set by the system software. Thus, we were able to incubate 12 samples at different irradiances (incubate each sample simultaneously on the range of irradiances from maximum to dark).
2. Materials and Methods
2.1. Light spectrum replicator (LSR)
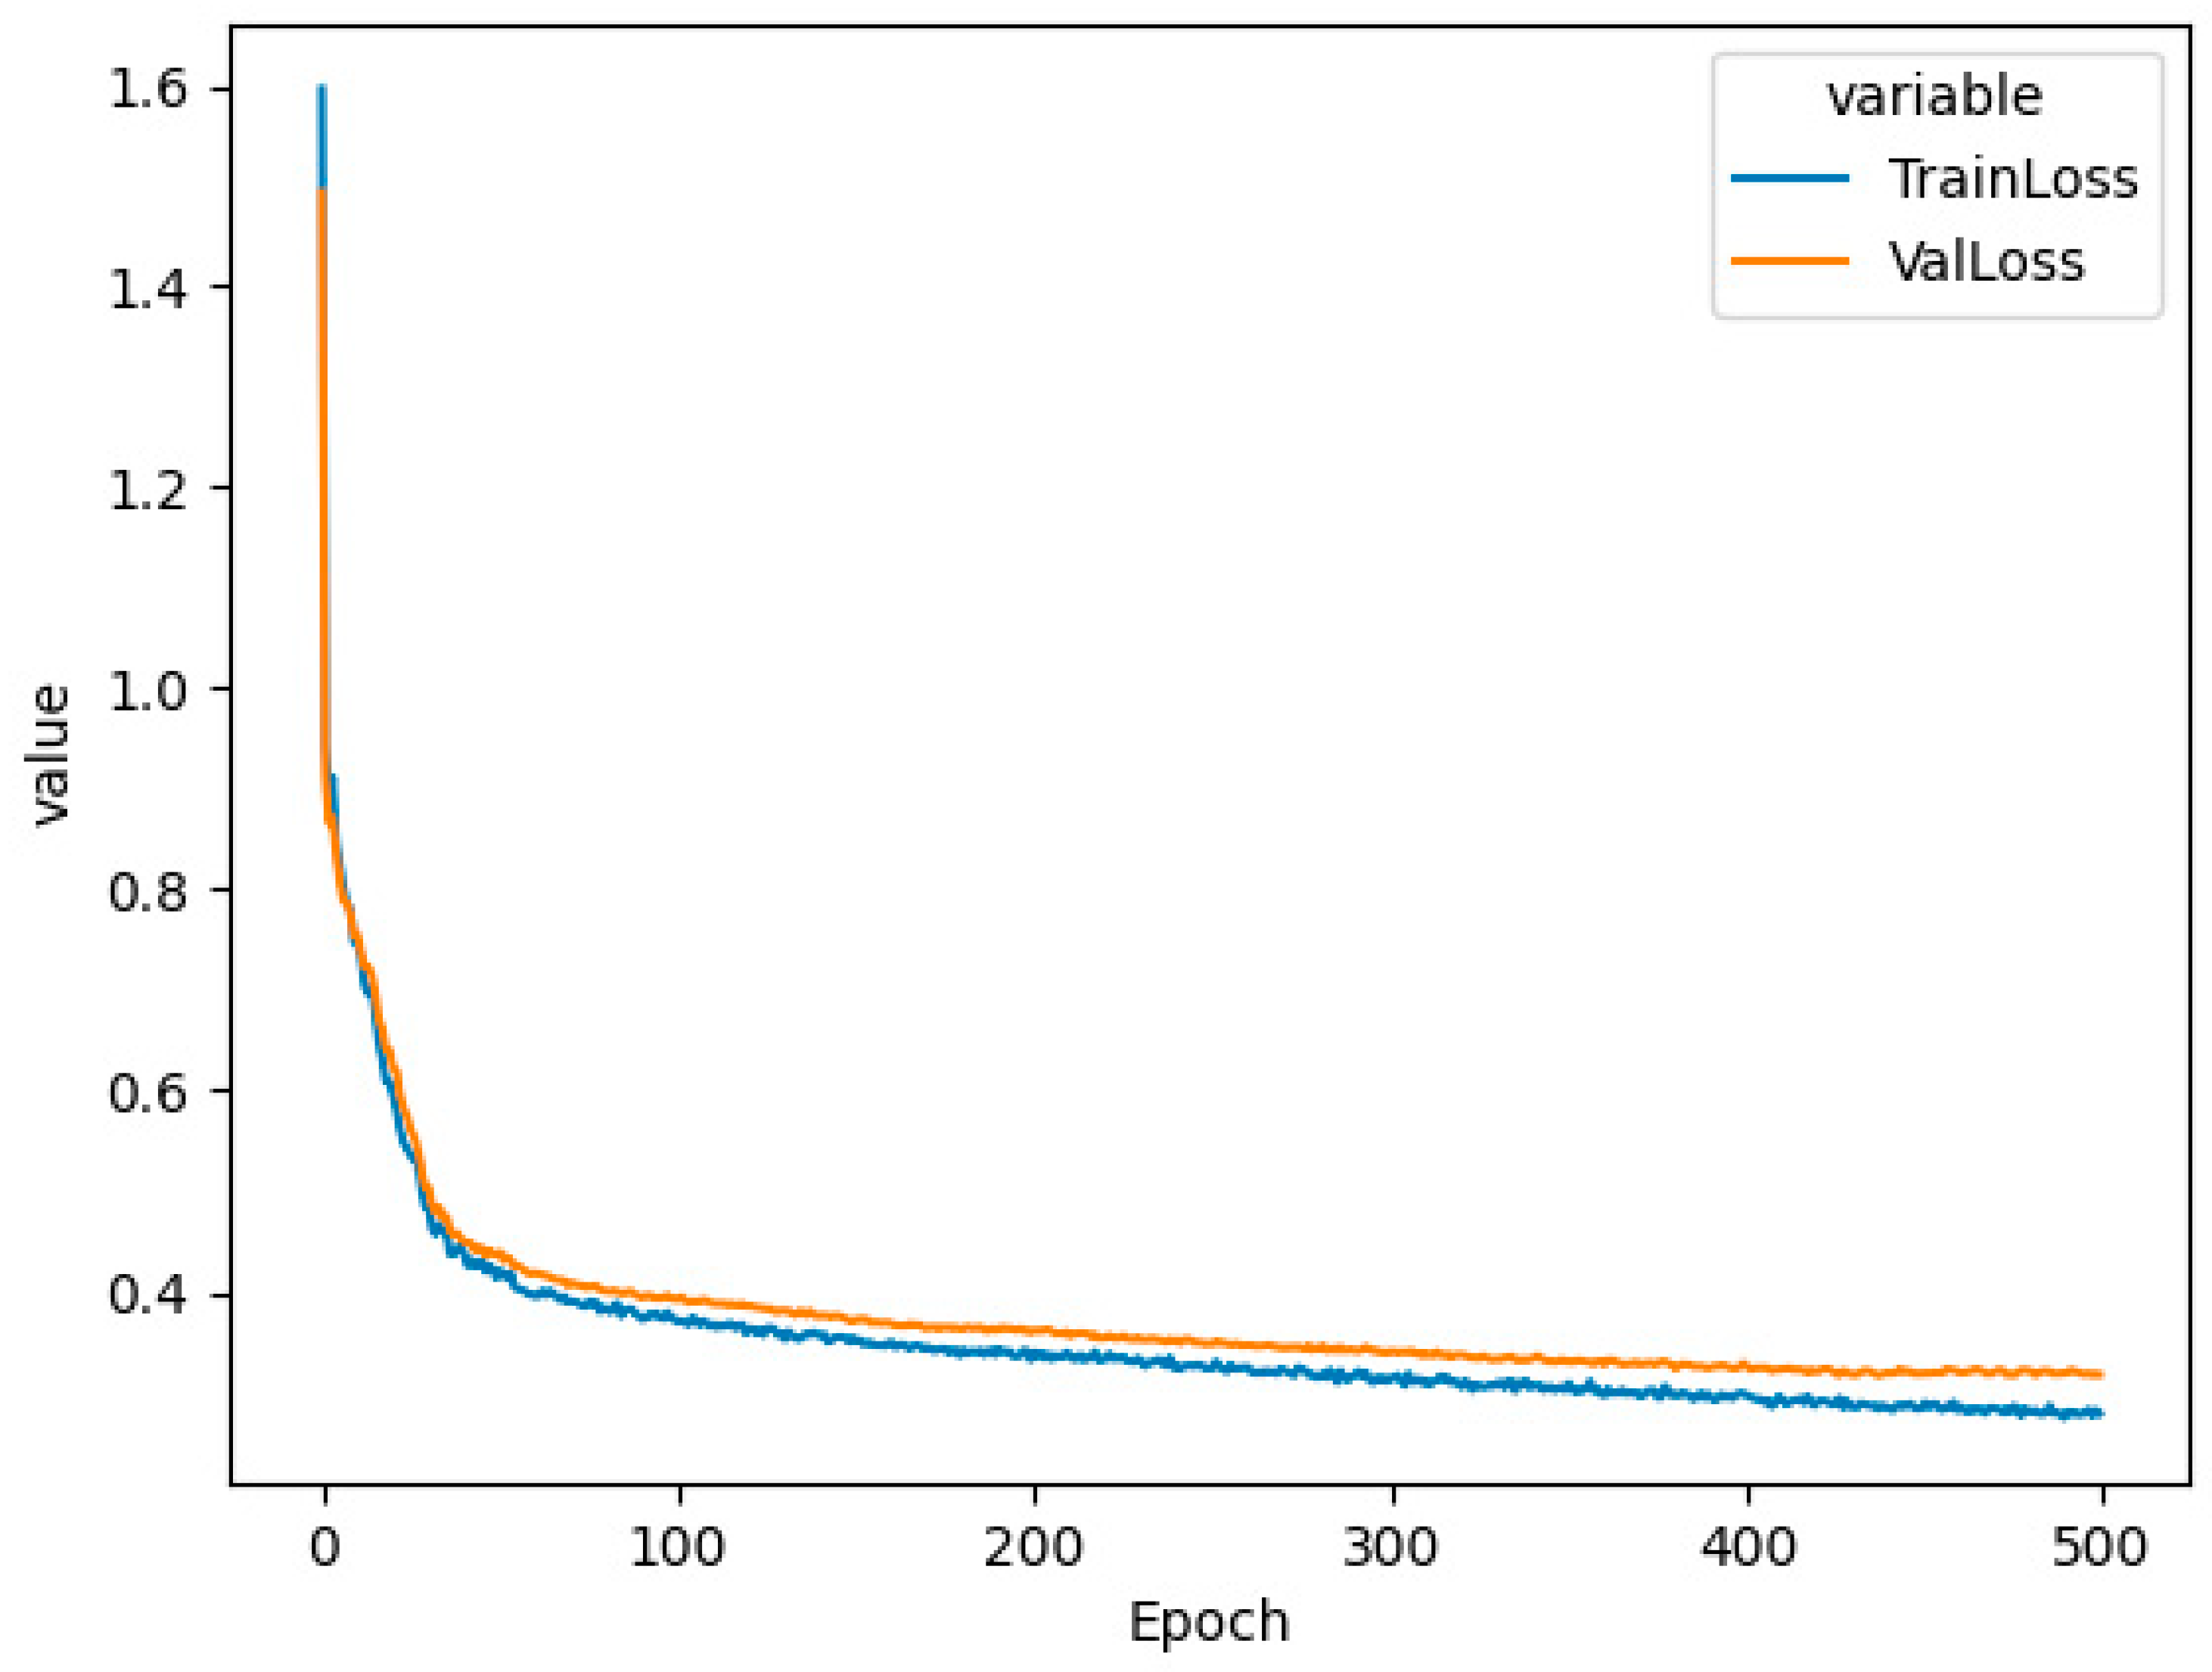
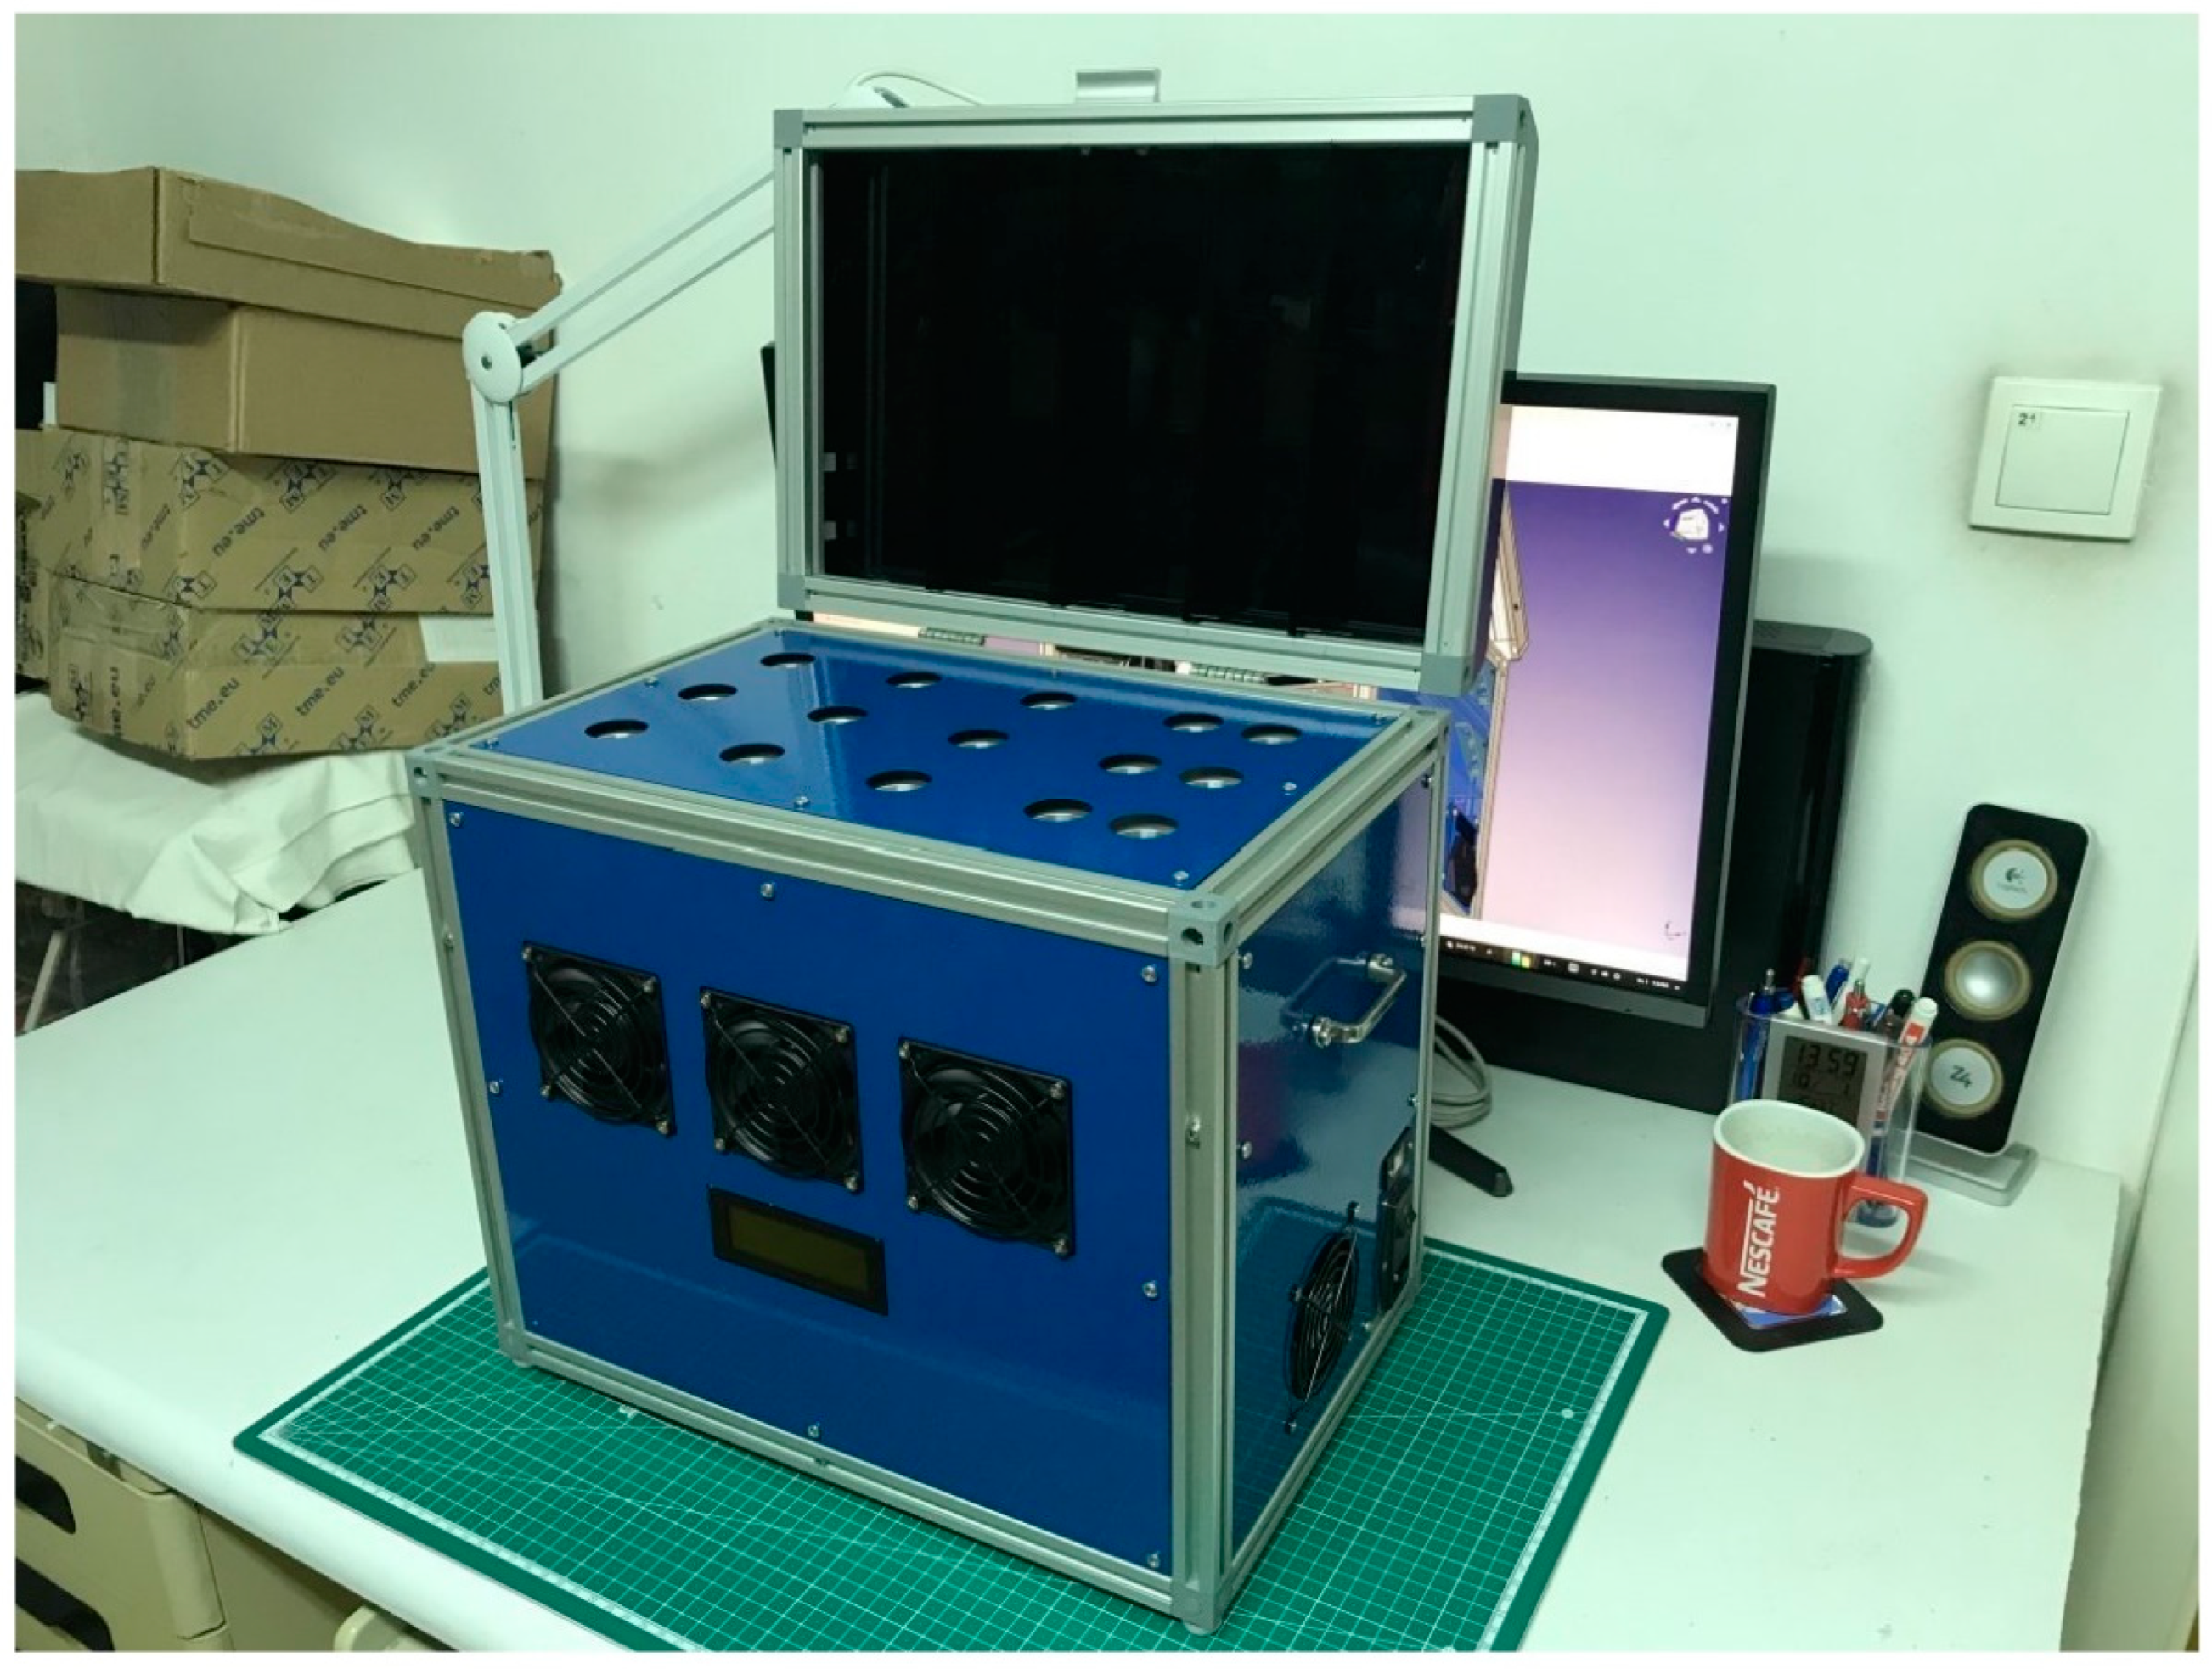
The LSR contains 12 sockets for simultaneous sample incubation using the customized light spectrum. The device's firmware is developed by MARINIX Ocean Tech AS company (Kristiansand, Norway), and it allows communication with the LSR and computer via a USB cable (serial port). This allowed us to send commands to the LSR when reconstructing the light spectrum and setting the incubation temperature. The light replication process was done by precise control of 10 LEDs (IHS, Intelligent Horticultural Solutions, 12 Die High power Mixing Full Spectrum LEDs) located in each socket. Two infrared channels (>900 nm) were not used. To replicate the curve measured in the water column during the study, we built an LSR dashboard that utilized feed-forward neural networks and genetic algorithms. The first step was constructing a database of simulated curves, and for this purpose, we created 10,000 randomized LSR configurations that resulted in 10,000 light spectrum curves. The LSR model’s input is defined as 10 numbers representing 10 light spectrum curve peaks, and the model’s output is defined as 10 numbers representing LSR configuration. The input and output layers were coupled with 3 hidden linear layers with ReLU activation functions. The training of the model was done using holdout cross-validation, where the data was randomly split into two parts: training data (75% of total data) and test data (25% of total data). Using training data, we picked the following hyperparameters: learning rate = 0.5e-3, weight decay = 1e-4, and batch size = 32. The model definition and model training were implemented in the PyTorch (version 1.13.1) framework and ran on the CPU of a standard computer using Adagrad optimizer and standard mean squared error (MSE) loss function [
19]. When testing the model on test data, the model reached an MSE of 0.318 (
Figure 1). See computational requirements for more details.
2.2. Simulating light curves in LSR
Since the model was built on simulated curves from LSR, the model was not capable of predicting the desired light-spectrum curve directly. Therefore, we used the model to find a set of possible LSR configurations by adding Gaussian noise to input multiple times (
Figure 2).
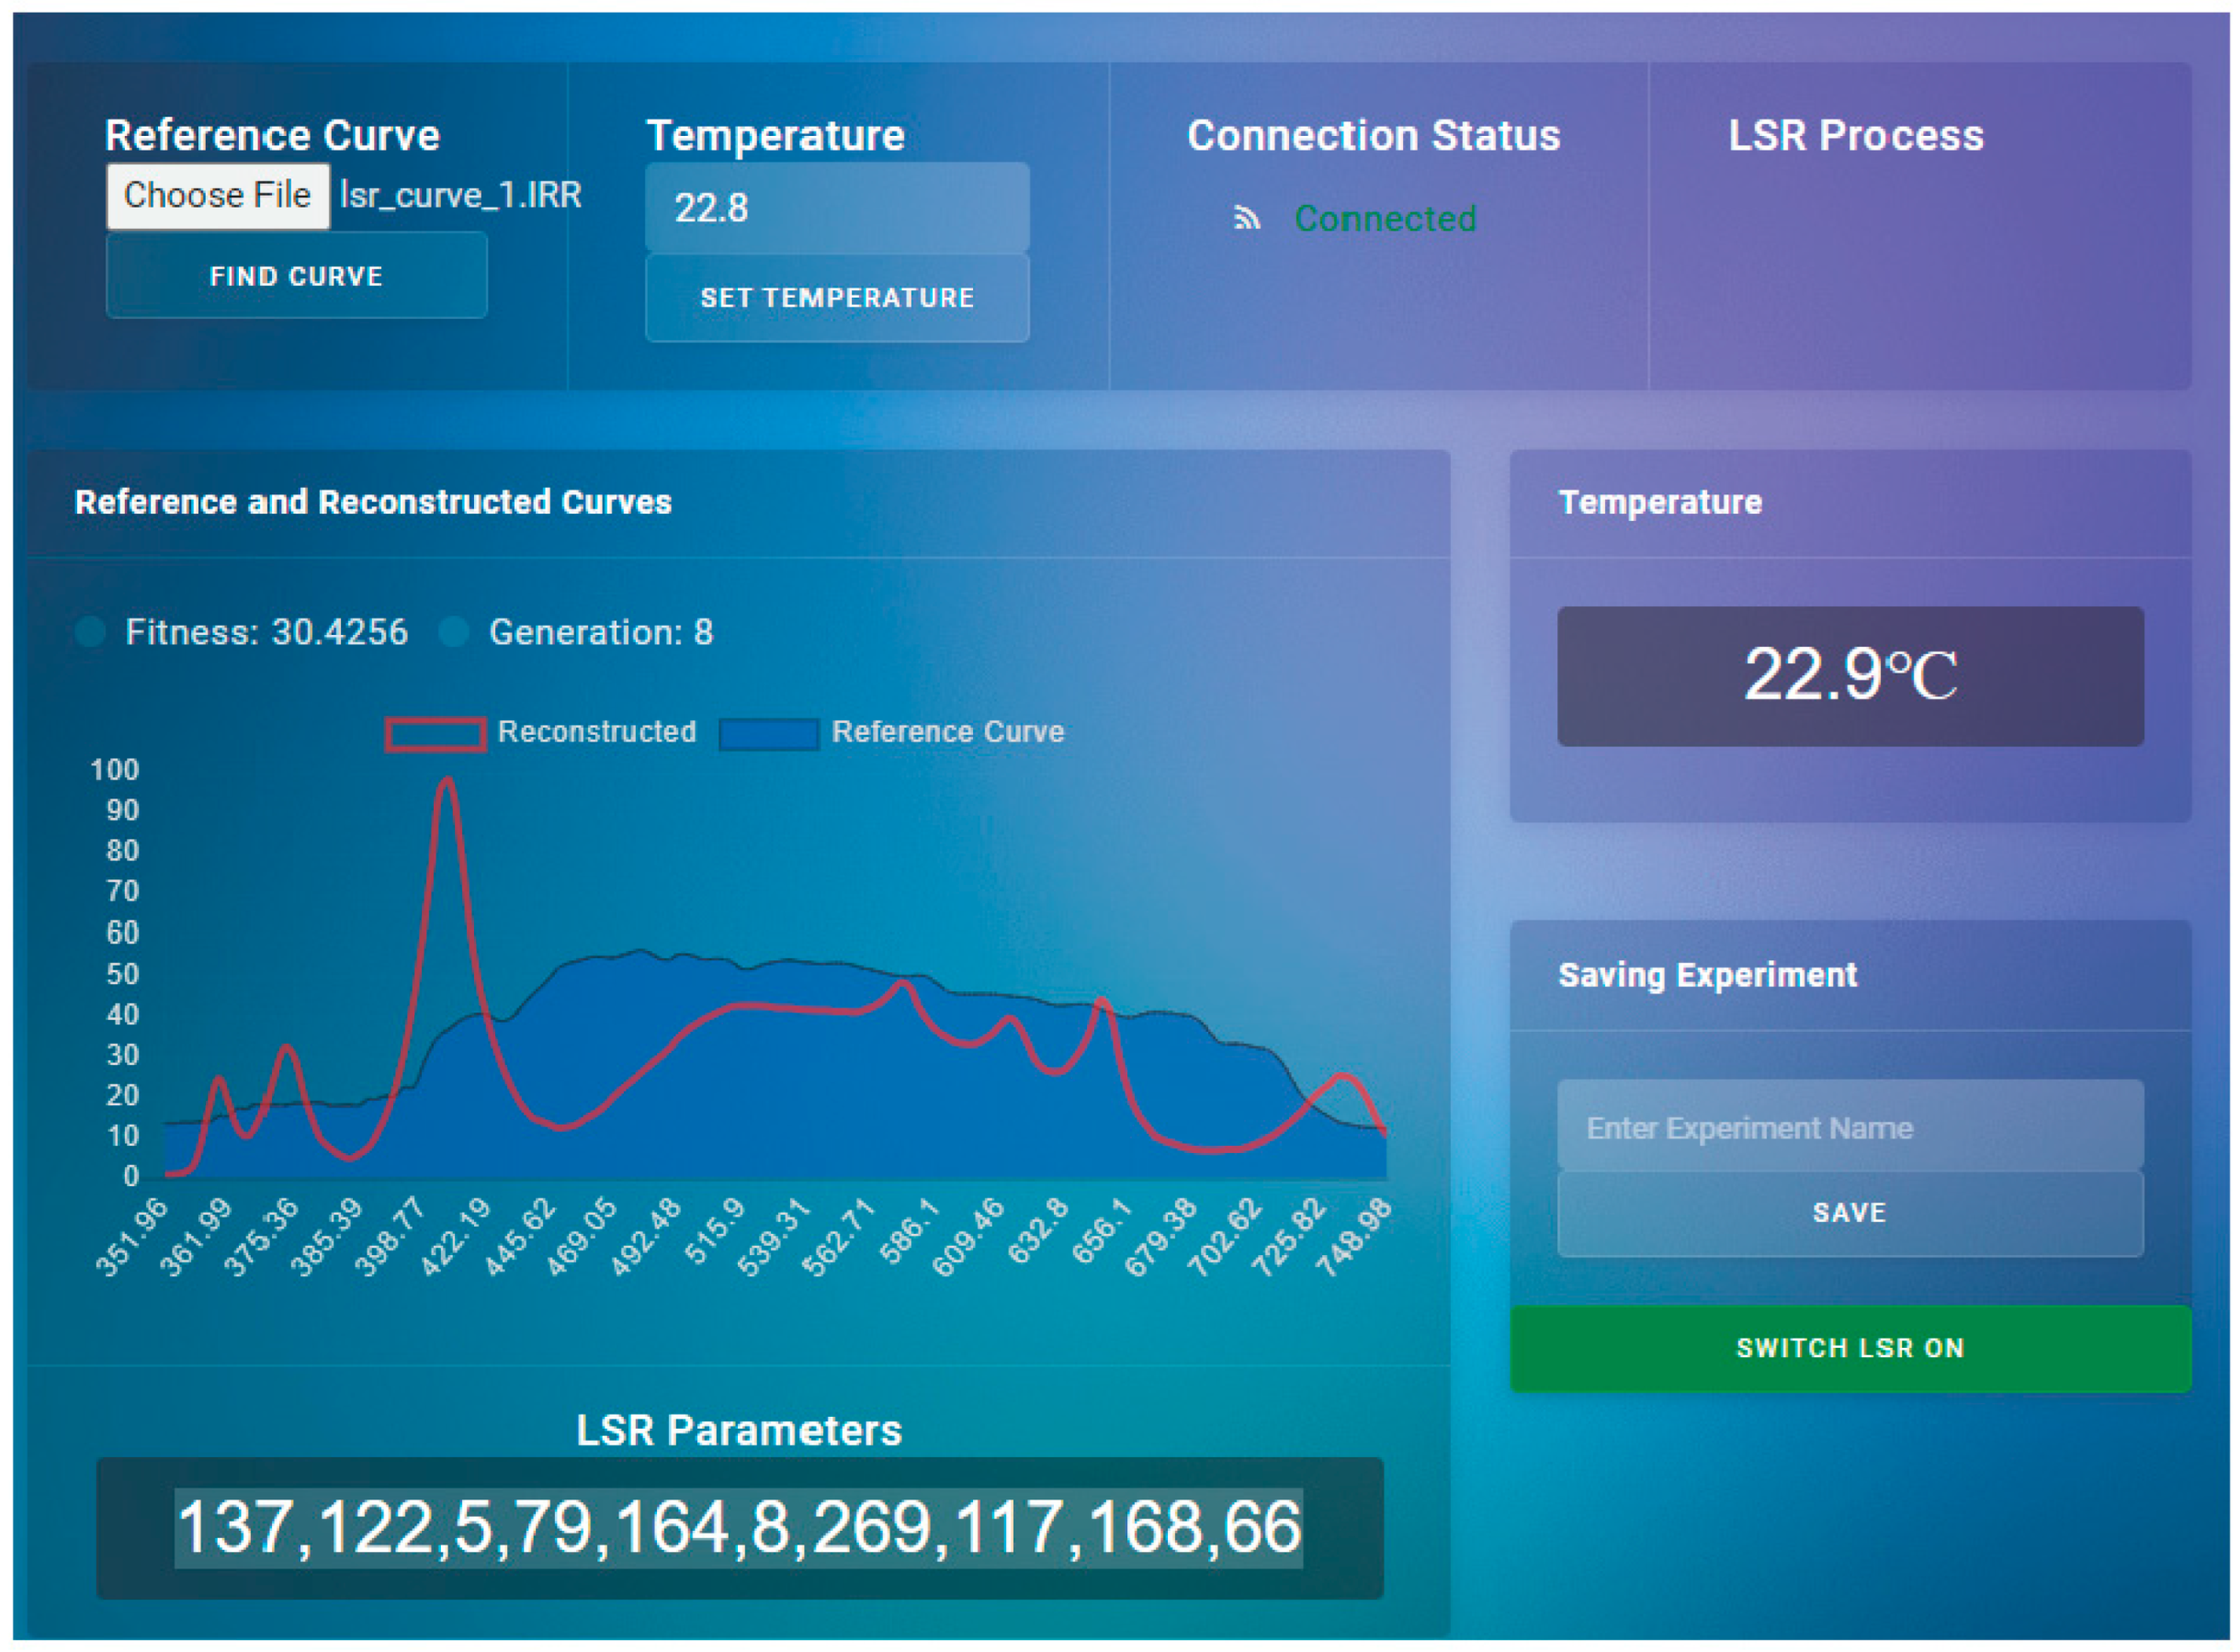
The output of the model represented a wide solution space for LSR configuration. The solution space was then used in the genetic algorithm in an iterative fashion to find the optimal solution (
Figure 2,
Figure 3 and
Figure 4). The genetic algorithm used the MSE as a fitness function and found the optimal curve within 10 minutes. It is important to note that LSR was not equipped with LEDs covering 426 nm, 516 nm, and 726 nm light spectrum areas, which, however, resulted in satisfactory performance (
Figure 3).
The software compensated for the missing frequencies by increasing values in the neighboring areas, resulting in the same irradiance intensities as measured in situ.
2.3. Solar radiation, temperature, and depth measurements
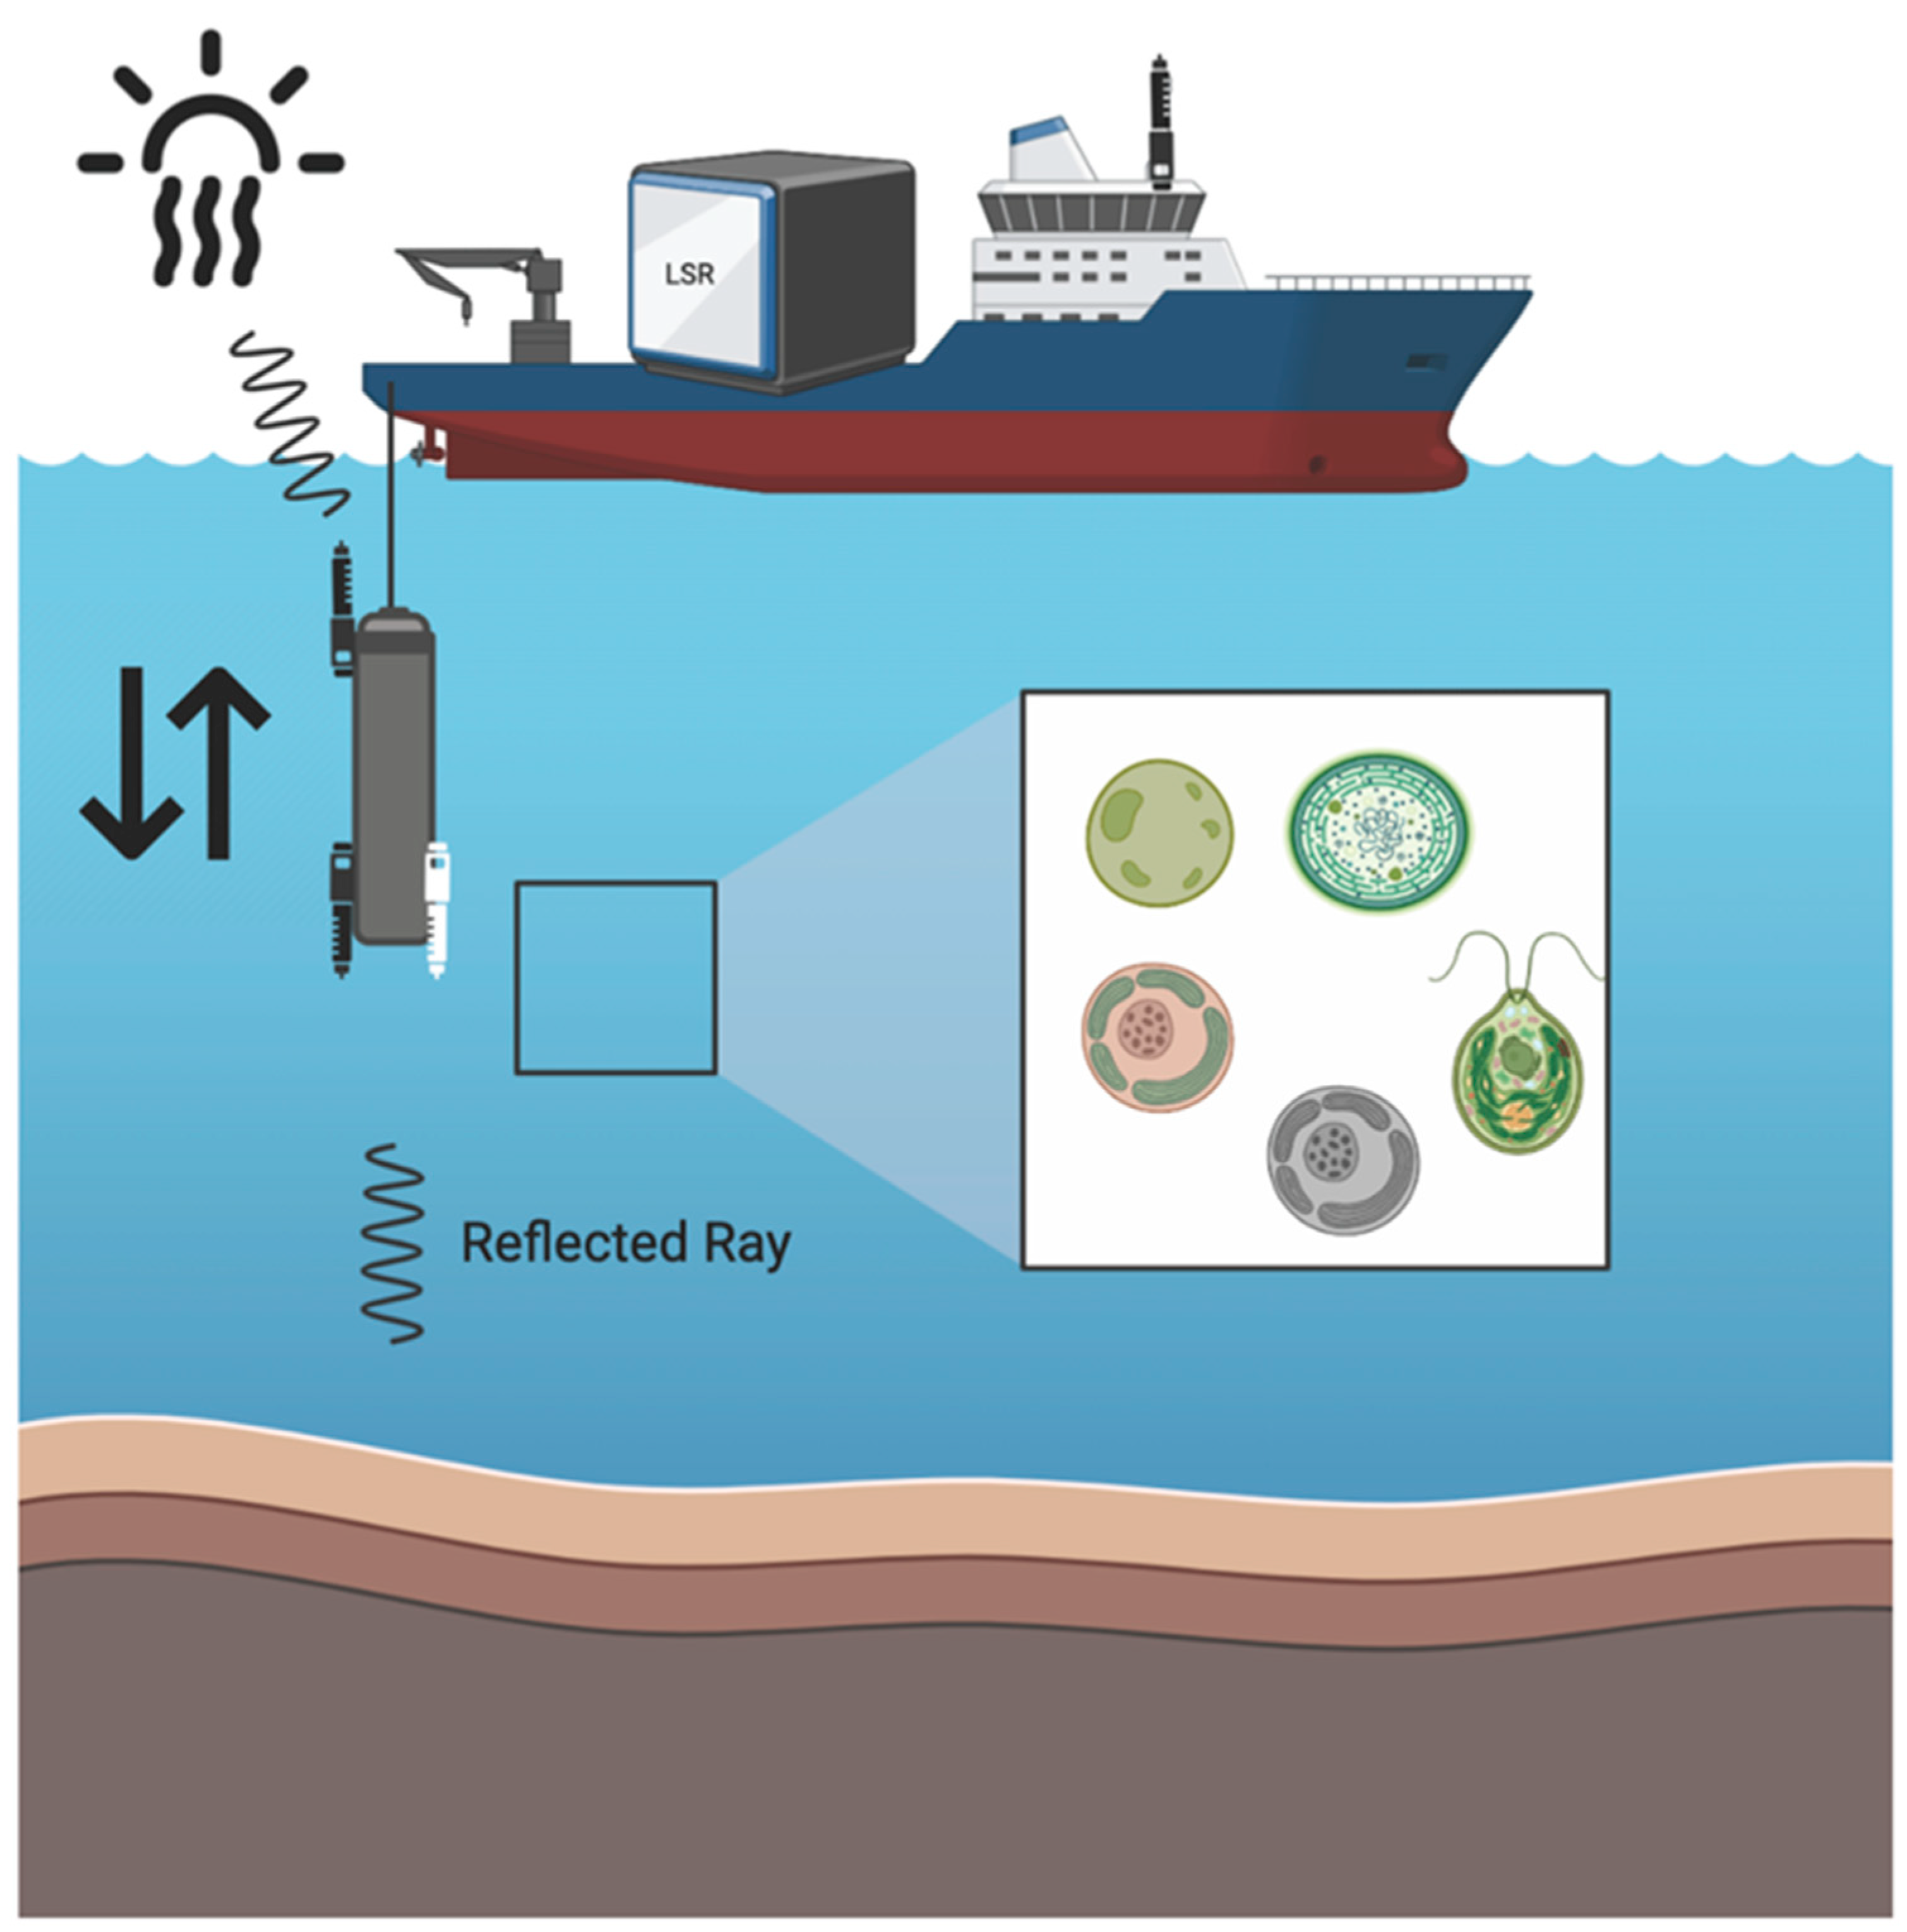
Custom built vertical profiler was used to measure downward and upward irradiance profiles with two Hyperspectral Ocean Color Radiometer (HOCR) (Seabird) sensors calibrated for measurements of downwelling and upwelling radiation with optical data in the range from 350-1200 nm (extended range). HOCR sensors were mounted on a frame equipped with an SBE 39plus temperature (external thermistor), depth (100 m strain gauge pressure sensor), and time sensors. Measured data were recorded in a custom-built data logger built by MARINIX Ocean Tech. The third part of this system was a hyperspectral color radiometer sensor (Apogee PS-200 laboratory hyperspectral radiometer, 300-850 nm range, 0.5 nm sensitivity) that was installed on the highest point on the vessel with the sensor pointed upwards vertically to measure reference surface light spectra during the vertical profile casts of the water column with HOCR (
Figure 5).
2.4. LSR setup
The measured downward light radiation curve from the desired depth (in the range from 300 - 850 nm) was transferred to the LSR dashboard, the temperature was set, and light curve replication was initiated (
Figure 4). LSR stabilized the temperature, and the light curve was replicated within 10 minutes after the initiation of the procedure. Light intensities and spectral data were measured with an Apogee PS-200 hyperspectral radiometer (300 - 850 nm, 0.5 nm sensitivity). Ten incubation chambers in LSR are placed 10 mm above IHS (Intelligent Horticultural Solutions) 12 Die High power Mixing Full Spectrum LEDs mounted below an aluminum cooling sample holder with15 holes for 20 ml glass vials. Three sockets were not illuminated, samples are incubated in the dark.
2.5. Sampling and incubations
Test incubations (LSR and in situ) were conducted on 12 and 13 June 2023 in the central Adriatic Sea in the vicinity of Split and Vis, Croatia, at a site in Kaštela Bay (12 June, 43⁰ 31’ 33.9’’ N, 16⁰ 23’ 17.6’’ E, depth 38.4 m) and near Stončica lighthouse on Vis Island (13 June, 43⁰ 03’ 32.8’’ N, 16⁰ 17’ 19.7’’ E, depth 102.9 m). Sampling depths in Kaštela Bay were 0, 5, 10, 15, 20, 25, and 28m and at Stončica - Vis station, the water column was sampled at 0, 5, 10, 20, 30, 50, and 100 m. Primary productivity incubations in LSR were conducted at Kaštela location at 9:30, 11:00, 12:15, 14:45, 15:15, 16:07 and 17:44 hours (at 0, 5, 10, 15, 20, 25 and 28 m, respectively) and at 8:30, 10:02, 11:30, 13:01, 14:34, 16:04 and 16:52 hours (at 0, 5, 10, 20, 30, 50, and 100 m, respectively) at Stončica - Vis location. In situ incubations were conducted with two transparent and one dark (“black”) 100 mL Winkler flask attached to a moored line at each sampling depth and incubated from 9:00 to 15:00 hours at Kaštela station and from 9:00 to 15:15 hours at Vis station. All samples were taken at predetermined depths by a 5 L Niskin water sampler. Before subsampling, all bottles were rinsed three times with seawater from the sampler. For LSR primary productivity measurements, a 250 mL subsample was taken in a 250 mL Winkler flask with a wide neck using a dark thermally insulated dark sleeve to subdue the light and prevent temperature shock.
2.6. Primary productivity measurements
Prior to each sampling and measurement, vertical profiles of downward and upward (reflected) solar radiation were measured in the water column with the Seabird HyperOCR sensors (
https://www.seabird.com/hyperocr-radiometer/product?id=60762467730). The measured downward light radiation curve from the desired depth (in the range from 300 - 850 nm) was transferred to the LSR dashboard, the temperature was set, and light curve replication was initiated (
Figure 5). LSR stabilized the temperature, and the light curve was replicated within 10 minutes after the initiation of the procedure. Light intensities and spectral data were measured with an Apogee PS-200 hyperspectral radiometer (300 - 850 nm, 0.5 nm sensitivity). Ten incubation chambers in LSR are placed 10 mm above IHS (Intelligent Horticultural Solutions) 12 Die High power Mixing Full Spectrum LEDs with an aluminum cooling sample holder (15 holes for 20 ml glass vials) and temperature tolerance of 0.1 ℃ (
Figure 6 and
Figure 7 a-b).
Photosynthetic uptake of carbon was measured as follows: 25.9 MBq of NaH14CO3 (2.146 GBq mmol; Amersham) was added to a 62 ml aliquot of the sample. The sample was gently stirred and two 100 μL aliquots were transferred to scintillation vials with 8 ml of Insta-Gel Plus (Packard) for total added radioactivity measurements. A PerkinElmer Tri-Carb 3180 TR/SL liquid scintillation counter (LSC) was used for all 14C measurements and corrected for quenching by an internal standards ratio using the direct counting method. Twelve 20 mL glass scintillation vials were placed in the LSR sample holder cooled to in situ temperature, and 5 mL aliquots were transferred to each vial and incubated for 30 min. Incubations were terminated by filtering onto Whatman glass-fiber filters (GF/F, 25 mm diameter) using 100 mm of mercury vacuum. They were rinsed with 10 mL of 0.2-μm-filtered sea water, carefully avoiding exposure of the cells to air prior to completion of the rinse. After desiccation, filters were exposed to concentrated HCl fumes for 10 min. Radioactivity associated with the filters was determined by liquid scintillation counting using 8 mL of Insta-Gel Plus (Packard).
2.7. Traditional in situ primary productivity method (IZOR)
The
14C-radiotracer method was used to measure the assimilation of dissolved inorganic carbon (DIC) by phytoplankton as an estimate of the rate of photosynthetic production of organic matter [
20]. Samples were incubated in 100 mL Winkler flasks. Each sample was incubated in two transparent and one “black” (dark) container. After the flasks had been rinsed three times and filled with seawater, 150 kBq (4 μCi) of NaH
14CO
3 was added to each container. Capped containers were fixed on a moored line on the sampling site and incubated
in situ for 6 hours. The incubations were terminated by filtering the samples onto 0.2 μm pore size Advantec 35 mm filters and carefully rinsed with 0.2 μm filtered seawater, carefully avoiding exposure of the cells to air prior to completion of the rinse using 100 mm of mercury vacuum.
2.8. Computational Requirements
The entire computational workflow, including model training, genetic algorithm, and NMF, ran on a standard laptop with specifications detailed in the computational requirements section: Lenovo IdeaPad 3 - 17ITL6 laptop type 82H9, 17-inch, 11th Generation Intel Core i5 - 1135G7, Intel iRIS graphics, memory 2 x 8 GB DDR4-3200, hard drive 512 GB SSD PCIe. The computational setup demonstrates the efficiency and accessibility of the proposed AI-driven approach, making it a practical solution for researchers with standard computing resources.
3. Results
3.1. LSR temperature setup
Custom made heat exchange cooling system of the aluminum cooling block in the LSR (
Figure 6) provided stable temperature with a tolerance of 0.1 ℃ and temperature stabilization within 10 minutes (
Figure 7 a,b).
3.2. Comparison of LSR (simulated in situ) and in situ incubated productivity measurements
We compared LSR and
in situ particulate primary productivity (PPP) measurements from both locations (Kaštela and Stončica – Vis). For comparison, we used transparent and dark bottle values from
in situ moored incubations and the highest and dark values from LSR (simulated
in situ incubations) (
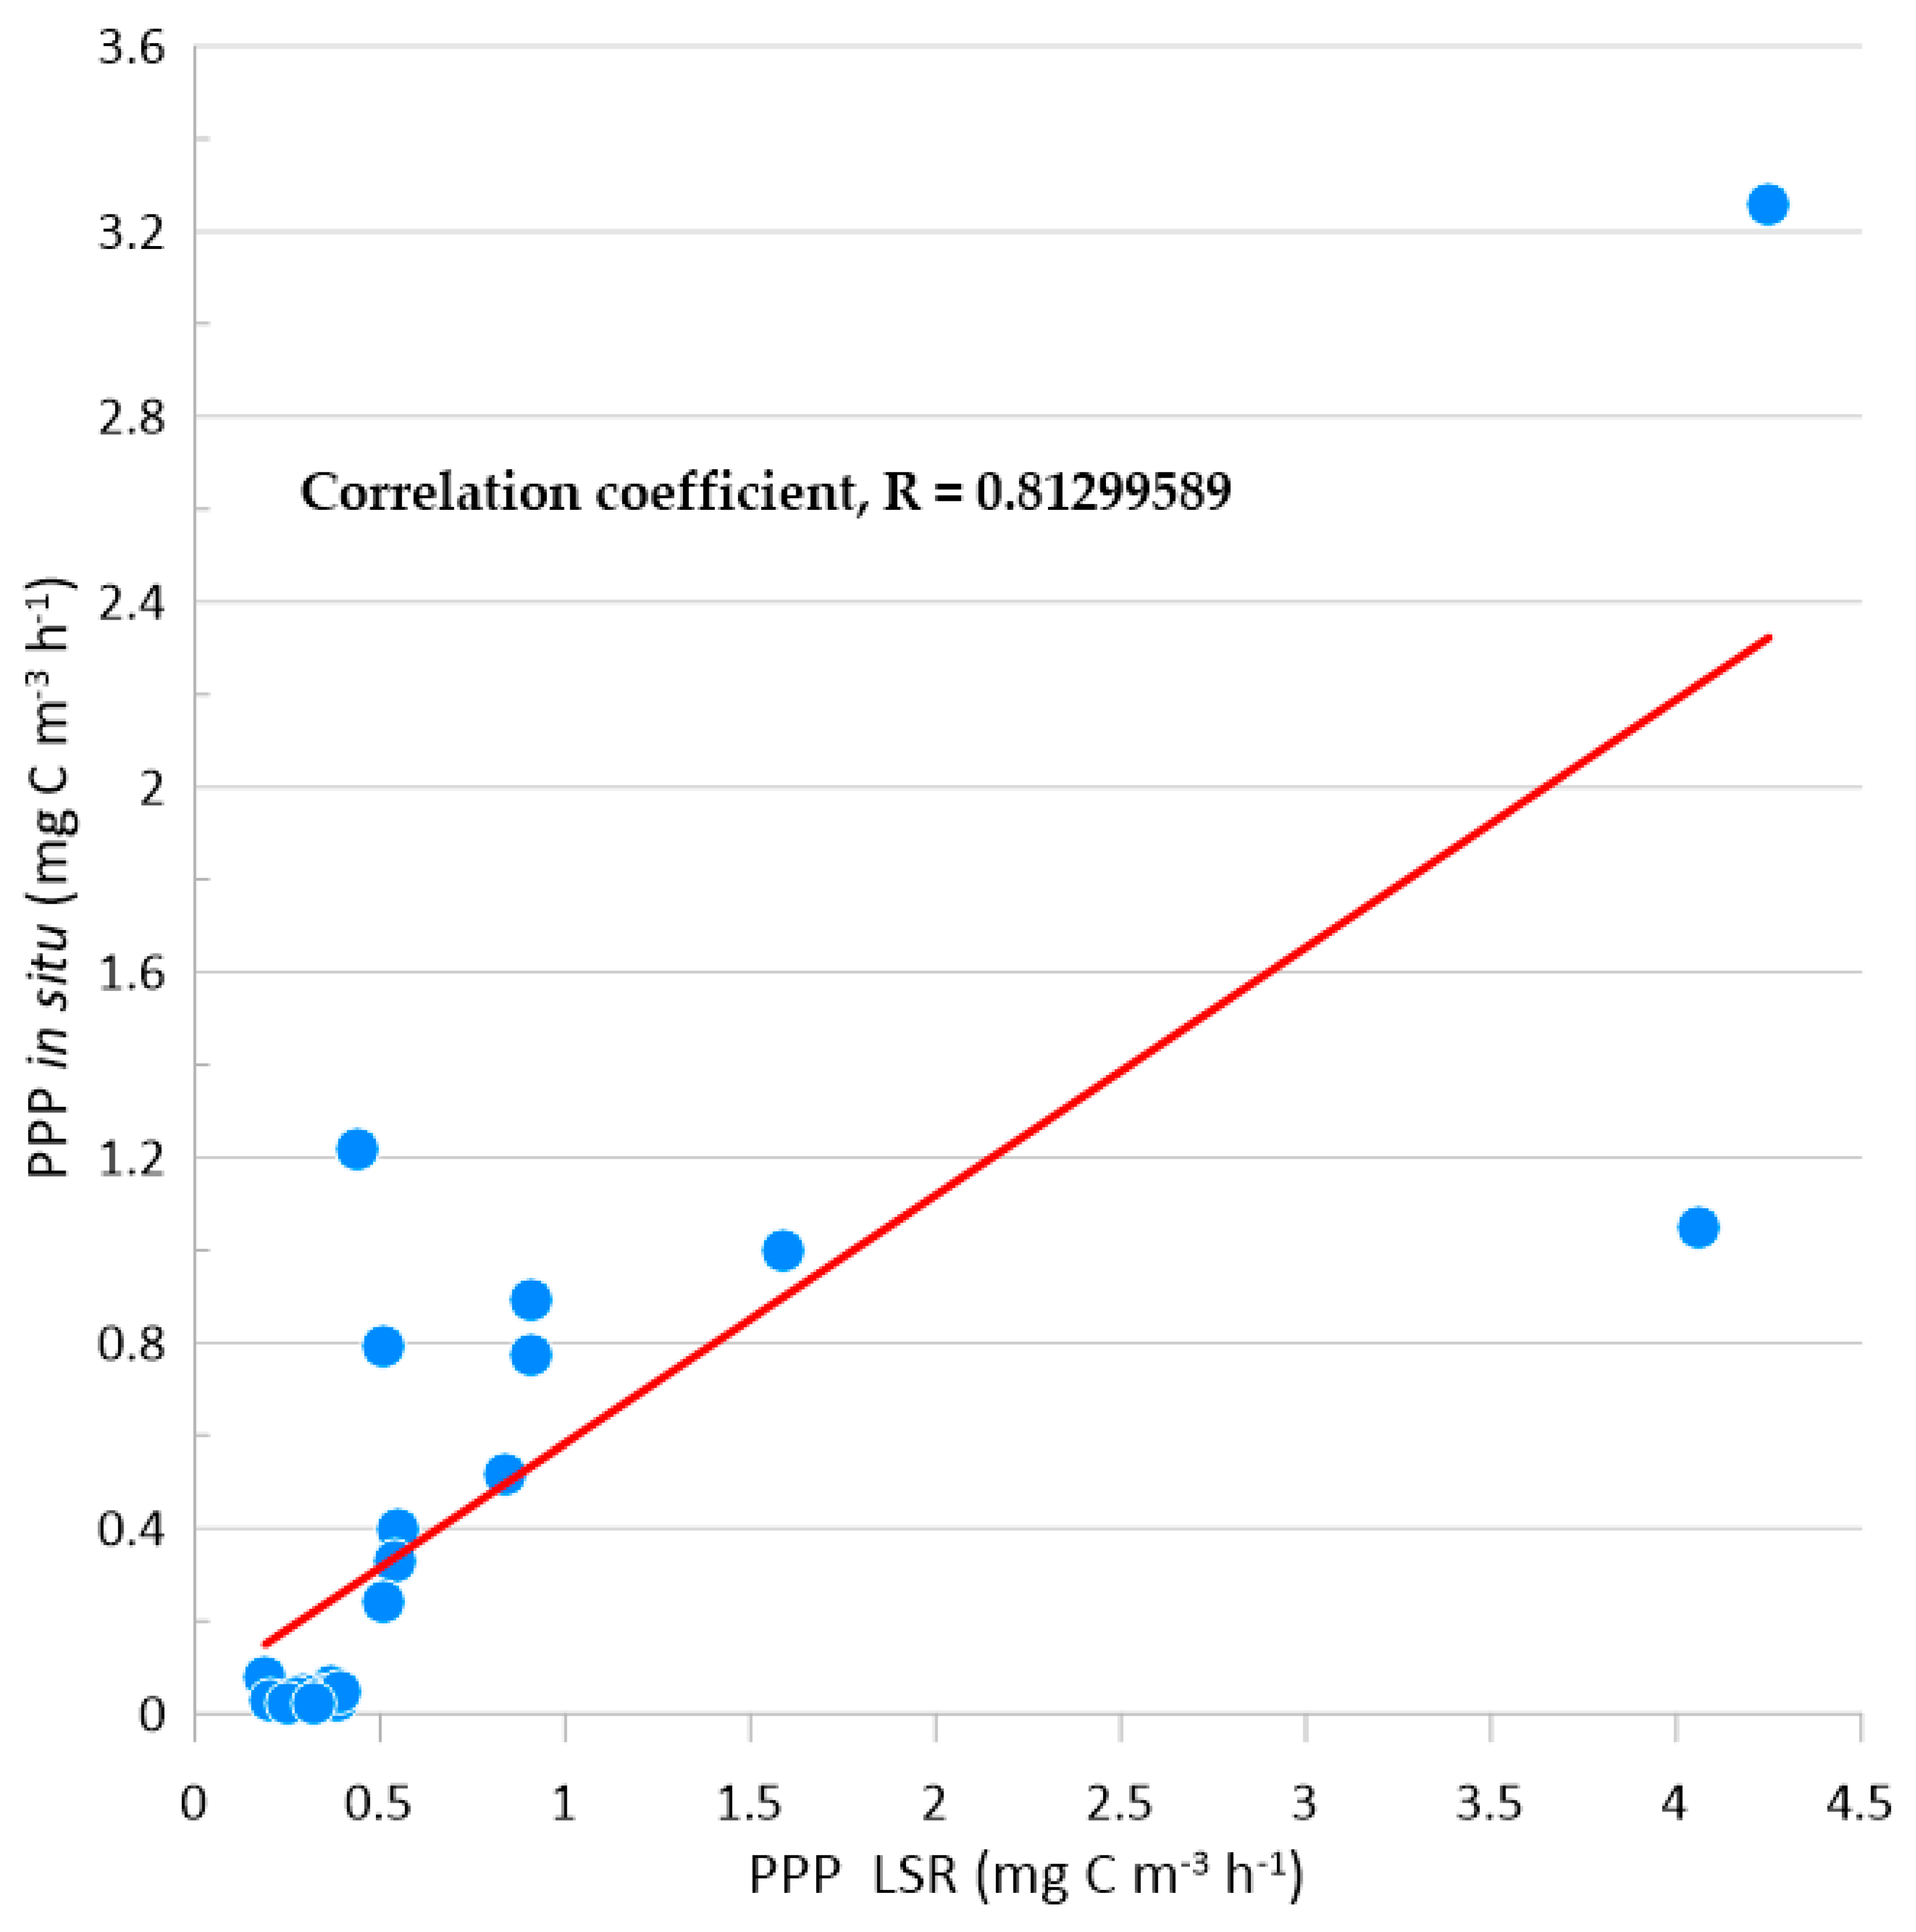
Supplementary Data File). Compared datasets have shown a significant linear correlation (r = 0.81 P < 0.001) (
Figure 8).
On the Kaštela location, the data from LSR incubations in the light ranged from 0.33 to 4.25 mg C m-3 h-1, in the dark from 0.19 mg C m-3 h-1 to 1.21 mg C m-3 h-1, and in situ measurements in the light from 0.79 mg C m-3 h-1 to 3.26 mg C m-3 h-1, while in the dark from 0.03 mg C m-3 h-1 to 0.08 mg C m-3 h-1. On Stončica - Vis, the data from LSR incubations in the light ranged from 0.32 mg C m-3 h-1 to 1.59 mg C m-3 h-1 in the dark from 0.20 mg C m-3 h-1 to 0.39 mg C m-3 h-1, and in situ in the light from 0.242 mg C m-3 h-1 to 0.999 mg C m-3 h-1 and in the dark from 0.02 mg C m-3 h-1 to 0.048 mg C m-3 h-1. In the LSR, the minimum measured values were on Kaštela location 0.19 mg C m-3 h-1 at 0 m depth in the dark chamber and on Stončica - Vis 0.20 mg C m-3 h-1 at 20 m depth in the dark chamber. Within the samples incubated in situ, the minimum measured values were on Kaštela location 0.03 mg C m-3 h-1 at 28 m depth in the dark bottle and on Stončica - Vis 0.02 mg C m-3 h-1 at 50 m depth in the dark bottle. In the LSR, the maximum measured values were on Kaštela location 4.25 mg C m-3 h-1 at 0 m depth at maximum irradiance and on Stončica -Vis 1.59 mg C m-3 h-1 at 0 m depth at the maximum irradiance. Within the samples incubated in situ, the maximum measured values were on Kaštela location 3.26 mg C m-3 h-1 at 0 m depth in the transparent bottle and on Stončica - Vis 1.00 mg C m-3 h-1 at 0 m depth also in the transparent bottle. Except for measurements at location Kaštela at 20 and 28 m depth (36 % and 64 % higher measurements in samples incubated in situ than in the LSR, respectively), all other PPP measurements were significantly higher as measured in the LSR than incubated in situ ranging from 1.89 % to 92 % at Kaštela and 15 % to 93 % at Stončica - Vis location.
4. Discussion
The introduction of the MARINIX Ocean Tech AS (Norway) Light Spectrum Replicator (LSR) system, coupled with AI-driven simulations, presents a pioneering contribution to the field of carbon flux studies. The integration of advanced technologies and computational methods enhances the precision and efficiency of in situ primary productivity measurements, opening new avenues for research in aquatic ecosystems. The AI-driven approach, involving the replication of in situ irradiance spectra, addresses longstanding challenges in primary productivity estimation. By leveraging AI techniques, the LSR not only replicates measured light spectra but also optimizes the incubation process, enhancing the accuracy of primary productivity measurements. The genetic algorithm's ability to find optimal LSR configurations within a short timeframe demonstrates the efficiency of the proposed AI-driven methodology. The availability of code and data on a public GitHub repository ensures transparency and reproducibility, allowing other researchers to validate and build upon the presented methodology. The computational requirements section further emphasizes the accessibility of the proposed AI-driven approach, making it a practical solution for researchers with standard computing resources. The integration of AI algorithms into the MARINIX Ocean Tech Light Spectrum Replicator (LSR) system represents a transformative step in advancing the precision, efficiency, and accessibility of in situ primary productivity measurements. The AI-driven methodology opens new horizons for researchers seeking to unravel complex patterns in carbon flux studies, ultimately contributing to a more comprehensive understanding of aquatic ecosystems and their intricate dynamics.
As shown in the results, the replicated light spectrum curves cannot be called perfect as they do not have the ability to fill the blue and cyan spectra and do not include infrared channels. LSR was not equipped with LEDs covering 426 nm, 516 nm, and 726 nm light spectrum areas. The software compensated for the missing frequencies by increasing values in the neighboring areas, resulting in the same irradiance intensities as measured in situ. Therefore, future improvements to this LSR prototype should include custom building a composite LED with a minimum of 14 channels covering the missing frequencies plus incorporating infrared LEDs.
Higher PPP values measured in LSR at low irradiance intensities (below 300 µW m-2) indicate that the incubation chambers “leaked” light from other chambers or ambient laterally thus influencing primary productivity measurements, resulting in higher values. Therefore, improvements will have to be made to prevent lateral illumination (light “pollution”) of the incubated samples.
This incubator can be used in two different ways depending on the scope of the study. Originally it was designed to provide conditions to incubate one sample simultaneously on daily surface irradiances, from dark to maximum irradiance. Such an approach can provide data for the calculation of daily primary production on a particular location. The other, more complex application is to incubate samples taken at different depths and incubate them on irradiances (dark to maximum) as they appear in situ. To incubate multiple samples simultaneously, such an approach would require use of multiple incubators and one assistant and filtration systems per each incubator. In this study we tested this approach with only one incubator, therefore the incubations at different depths were conducted at different times throughout the day.
We highly recommend the use of Millipore 1225 Sampling Manifold which allows simultaneous filtration of 12 samples and an easy way to collect sample filtrates for the estimation of dissolved primary productivity (extracellular release of dissolved organic carbon).
Supplementary Materials
The following supporting information can be downloaded at the website of this paper posted on Preprints.org.
Author Contributions
Conceptualization, S.P. and K.Y.B.; methodology, S.P. and M.S.; software, M.S.; validation, S.P. and K.Y.B.; formal analysis, S.P. and M.S..; investigation, S.P., M.S., Ž.N. and H.P.; resources, S.P..; data curation, M.S.; writing—original draft preparation, S.P., M.S. and Ž,N.; writing—review and editing, K.Y.B.; visualization, M.S.; supervision, S.P.; project administration, S.P.; funding acquisition, S.P. All authors have read and agreed to the published version of the manuscript.
Funding
This research was funded by Regionale Forskningsfond Agder (RFF Agder), Project number 338390. Development of the new technology used in this study was funded by Innovasjon Norge (Innovation Norway).
Institutional Review Board Statement
Not applicable.
Data Availability Statement
All code for analysis and plotting is available on the public GitHub repository (
https://github.com/mxs3203/MarinixExperimentPaper), whereas the code for LSR is the property of MARINIX and, therefore, cannot be shared. The GitHub repository provides code for the NMF model, HOCR data processing, figures included in the manuscript, and linear regression fit. The repository includes data matrices available as
supplementary material, ensuring transparency and reproducibility of the AI-driven methodology.
Acknowledgments
We would like to thank the NORCE Norwegian Research Centre for the support and making this study possible, Martin Žagar and Adrián Gómez Repollés for comments on the manuscript.
Conflicts of Interest
The authors declare no conflicts of interest. The funders had no role in the design of the study; in the collection, analyses, or interpretation of data; in the writing of the manuscript; or in the decision to publish the results.
References
- Burd, A.B.; Hansell, D.A.; Steinberg, D.K.; Anderson, T.R.; Arístegui, J.; Baltar, F.; Beaupré, S.R.; Buesseler, K.O.; DeHaris, F.; Jackson, G.A.; Kadko, D.C.; Koppelmann, R.; Lampitt, R.S.; Nagata, T.; Reinthaler, T.; Robinson, C.; Robison, B.H.; Tamburini, C.; Tanaka, T. Assessing the apparent imbalance between geochemical and biochemical indicators of meso- and bathypelagic biological activity: What the @$♯! is wrong with present calculations of carbon budgets? Deep Sea Res Part 2 Top Stud Oceanogr. 2010, 57, 1557–1571. [Google Scholar] [CrossRef]
- Lewin, J.C.; Lewin, R.A. Auxotrophy and heterotrophy in marine littoral diatoms. Can J Microbiol. 1960, 6, 127–134. [Google Scholar] [CrossRef] [PubMed]
- White, A.W. Growth of 2 facultatively heterotrophic marine centric diatoms. J Phycol. 1974, 10, 292–300. [Google Scholar] [CrossRef]
- Zubkov, M.V.; Tarran, G.A.; Fuchs, B.M. Depth related amino acid uptake by Prochlorococcus cyanobacteria in the Southern Atlantic tropical gyre. FEMS Microbiol Ecol. 2004, 50, 153–161. [Google Scholar] [CrossRef] [PubMed]
- Puškarić, S.; Mortain-Bertrand, A. Physiology of diatom Skeletonema costatum (Grev.) Cleve photosynthetic extracellular release: evidence for a novel coupling between marine bacteria and phytoplankton. J Plankton Res. 2003, 25, 1227–1235. [Google Scholar] [CrossRef]
- Robinson, C. Heterotrophic bacterial respiration. In Microbial Ecology of the Oceans Kirchman, D.I., Ed.; John Wiley & Sons: Hoboken, New Jersey, USA, 2008. [Google Scholar]
- Nagata, T.; Tamburini, C.; Arístegui, J.; Baltar, F.; Bochdansky, A.B.; Fonda-Umani S, et al. Emerging concepts on microbial processes in the bathipelagic ocean - ecology, biogeochemistry and genomics. Deep-Sea Res II. 2010;57: 1519–1536.
- Moran, M.A.; Kujawinski, E.B.; Stubbins, A.; Fatland, R.; Aluwihare, L.I.; Buchan, A.; Crump, B.C.; Dorresteein, P.C.; Dyhrman, S.T.; Hess, N.J.; Howe, B.; Longnecker, K.; Medeiros, P.M.; Niggeemann, J.; Obernosterer, I.; Repeta, D.J.; Waldbauer, J.R. Deciphering ocean carbon in a changing world. Proc Natl Acad Sci USA. 2016, 113, 3143–3151. [Google Scholar] [CrossRef]
- Steeman-Nielsen, E. The use of radioactive carbon (C14) for measuring organic production in the sea. ICES J Mar Sci. 1952, 18, 117–140. [Google Scholar] [CrossRef]
- Slawyk, G.; Collos, Y.; Auclair, J-C. The use of the 13 C and 15 N isotopes for the simultaneous measurement of carbon and nitrogen turnover rates in marine phytoplankton. Limnol Oceanogr. 1977, 22, 925–932. [Google Scholar] [CrossRef]
- Bender, M.; Grande, K.; Johnson, K.; Marra, J.; Williams, P.J.L.; Sieburth, J.; Pilson, M.; Langdon, C.; Hitchcock, J.; Orchardo, J.; Hunt, C.; Donaghay, P. A comparison of four methods for determining planktonic community production. Limnol Oceanogr. 1987, 32, 1085–1098. [Google Scholar] [CrossRef]
- Kolber, Z.; Falkowski, P.G. Use of active fluorescence to estimate phytoplankton photosynthesis in situ. Limnol Oceanogr. 1993, 38, 1646–1665. [Google Scholar] [CrossRef]
- Marra, J. Comment on “Measuring primary production rates in the ocean: Enigmatic results between incubation and non-incubation methods at Station ALOHA” by P. D. Quay et al. Global Biogeochem Cycles. 2012, 26. [Google Scholar] [CrossRef]
- Puskaric, S.; Smodlaka, N. Production of particulate and dissolved organic carbon by marine phytoplankton in the light and in the dark. Period Biol. 1997, 99, 193–203. [Google Scholar]
- González, N.; Gattuso, J.P.; Middelburg, J.J. Oxygen production and carbon fixation in oligotrophic coastal bays and the relationship with gross and net primary production. Aquat Microb Ecol. 2008, 52, 119–130. [Google Scholar] [CrossRef]
- Bender, M.; Grande, K.; Johnson, K.; Marra, J.; Williams, P.J.L.; Sieburth, J.; Pilson, M.; Langdon, C.; Hitchcock, J.; Orchardo, J.; Hunt, C.; Donaghay, P. A comparison of four methods for determining planktonic community production. Limnol Oceanogr. 1987, 32, 1085–1098. [Google Scholar] [CrossRef]
- Lohrenz, S.E.; Dagg, M.J.; Wbitledge, T.E. Enhanced primary production at the plume/ oceanic interface of the Mississippi River. Cont Shelf Res. 1990, 10, 639–664. [Google Scholar] [CrossRef]
- Lohrenz, S.E.; Dagg, M.J.; Wbitledge, T.E. Enhanced primary production at the plume/ oceanic interface of the Mississippi River. Cont Shelf Res. 1990, 10, 639–664. [Google Scholar] [CrossRef]
- Paszke, A.; Gross, S.; Massa, F.; Lerer, A.; Bradbury, J.; Chanan, G.; Killeen, T.; Lin, Z.; Gimelshein, N.; Antiga, L.; Desmaison, A.; Kopf, A.; Yang, E.; DeVito, Z.; Raison, M.; Tejani, A.; Chilamkurthy, S.; Steiner, B.; Fang, L.; Bai, J.; Chintala, S. PyTorch: An imperative style, high-performance deep learning library. In Advances in Neural Information Processing Systems 32 (NeurIPS 2019); Wallach, H.; Larochelle, H.; Beygelzimer, A., d’Alché-Buc, F., Eds.; NeurIPS Proceedings, 2019. [CrossRef]
- Steeman-Nielsen, E. The use of radioactive carbon (C14) for measuring organic production in the sea. ICES J Mar Sci. 1952, 18, 117–140. [Google Scholar] [CrossRef]
|
Disclaimer/Publisher’s Note: The statements, opinions and data contained in all publications are solely those of the individual author(s) and contributor(s) and not of MDPI and/or the editor(s). MDPI and/or the editor(s) disclaim responsibility for any injury to people or property resulting from any ideas, methods, instructions or products referred to in the content. |
© 2024 by the authors. Licensee MDPI, Basel, Switzerland. This article is an open access article distributed under the terms and conditions of the Creative Commons Attribution (CC BY) license (http://creativecommons.org/licenses/by/4.0/).
