Submitted:
10 January 2024
Posted:
11 January 2024
You are already at the latest version
Abstract
Keywords:
1. Introduction
2. Results
2.1. Impact of inoculation and nitrogen conditions on germination and shoot development
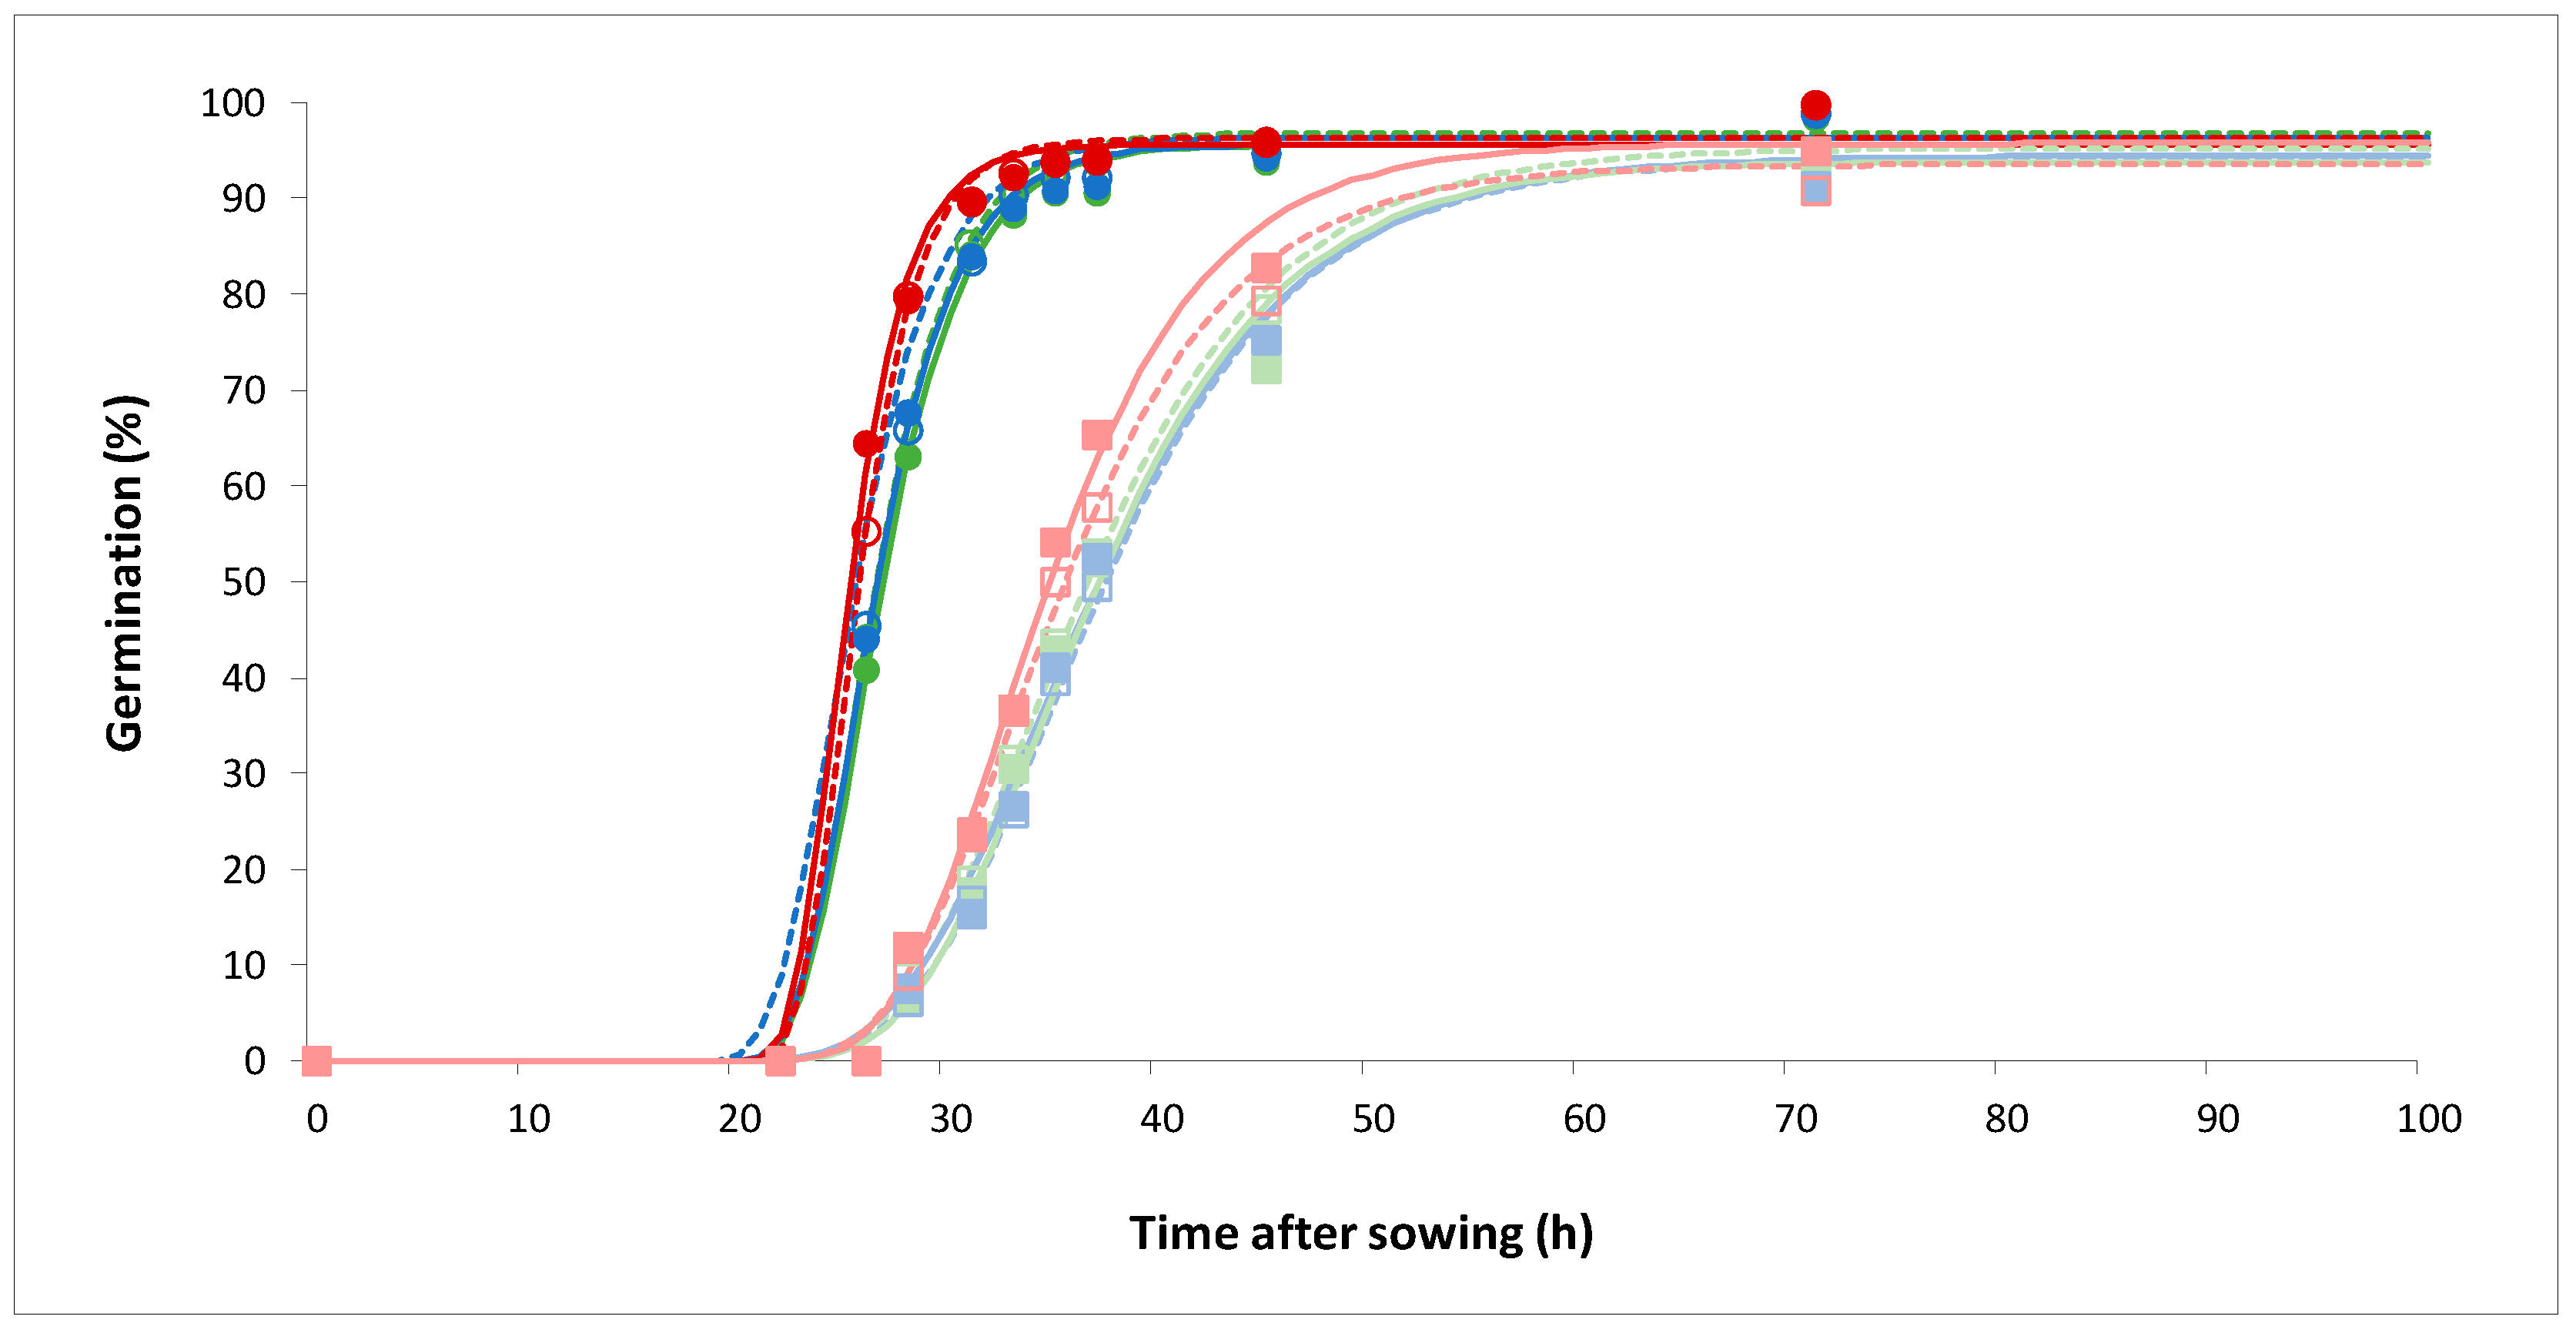
2.1.1. Seed germination
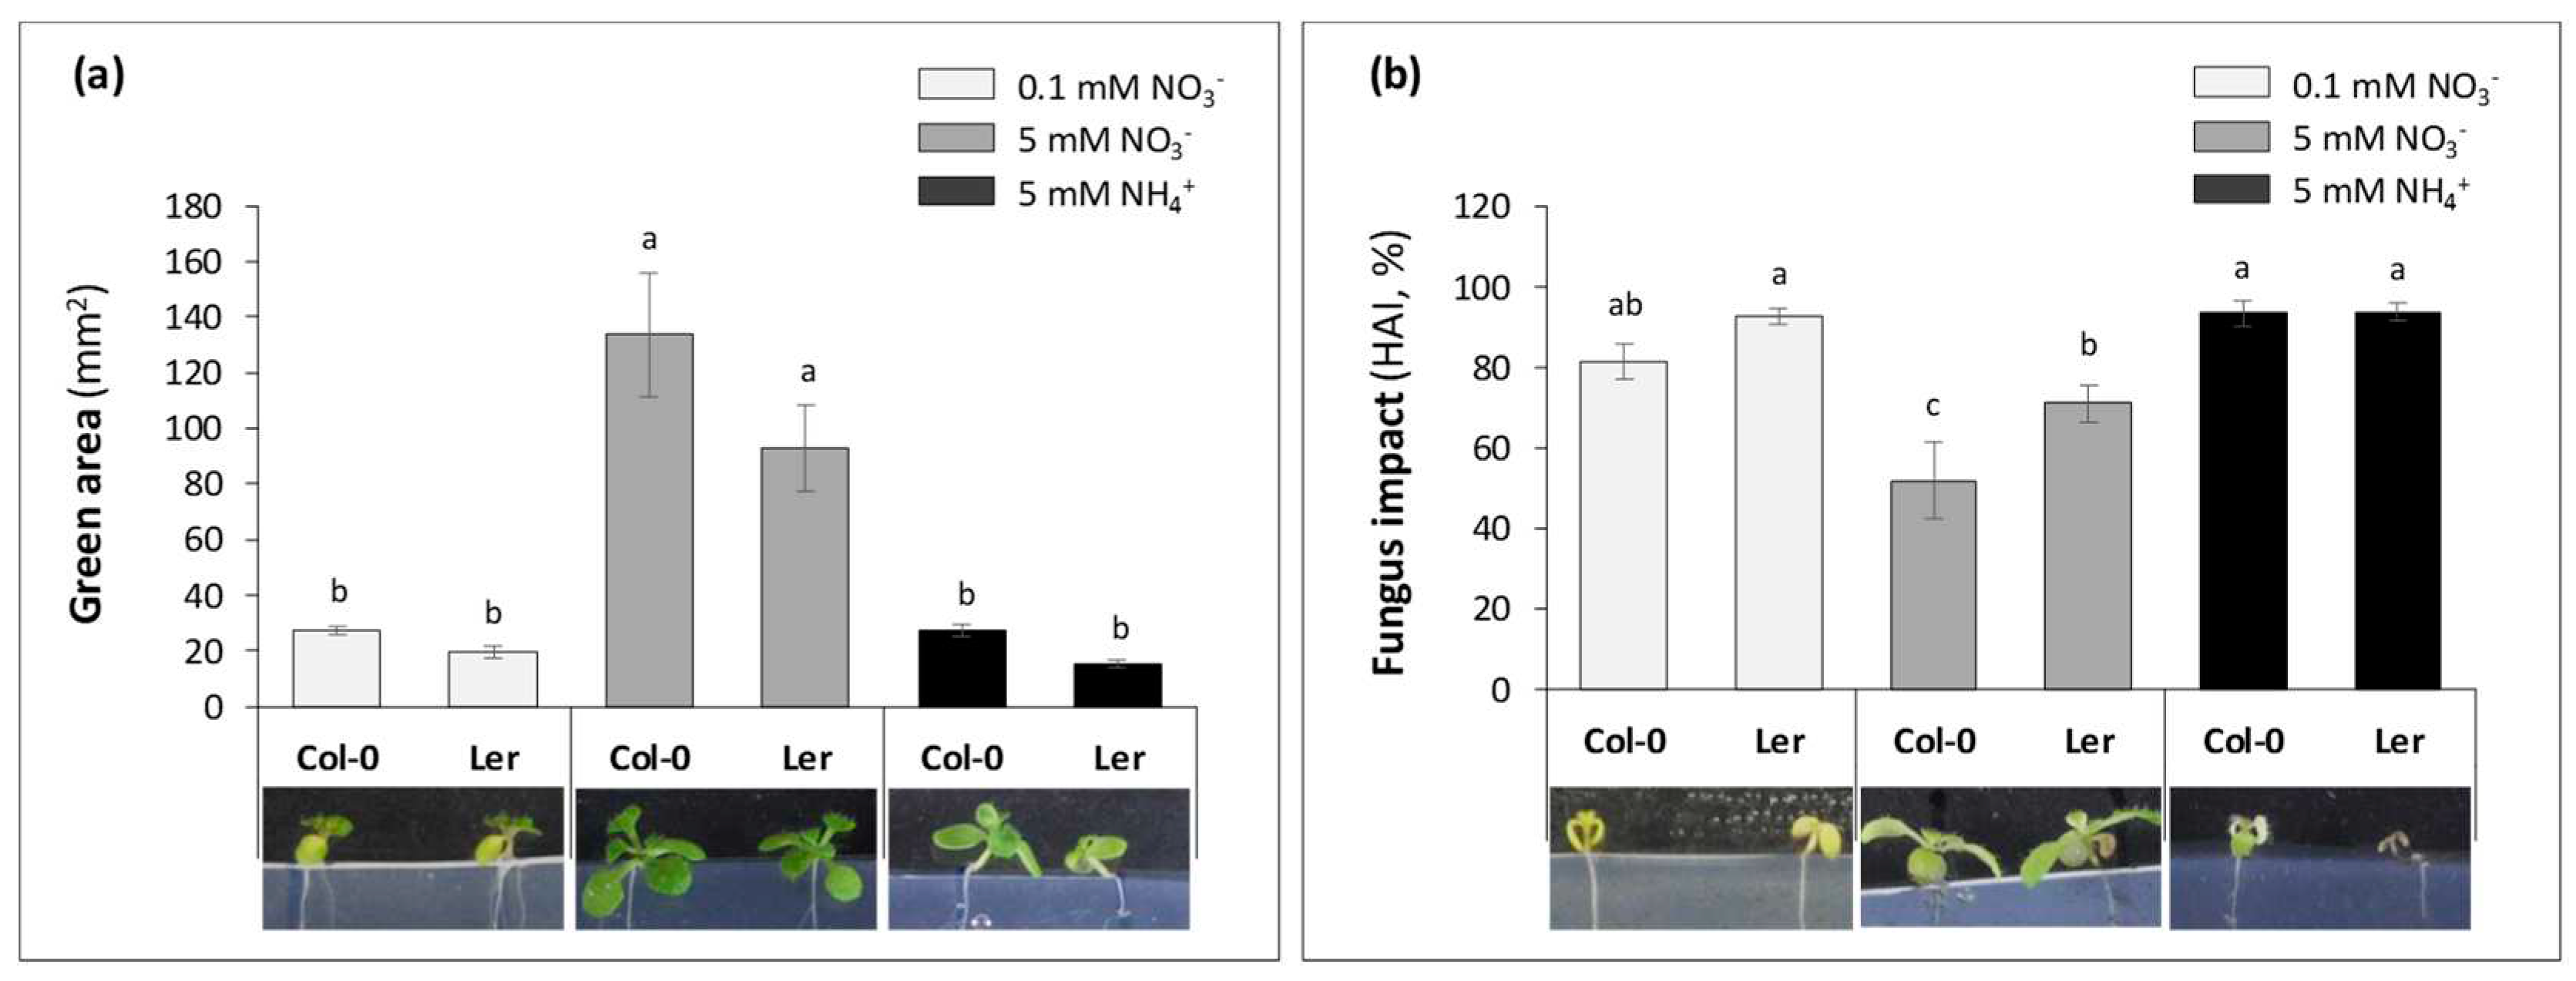
2.1.2. Seedling aerial development
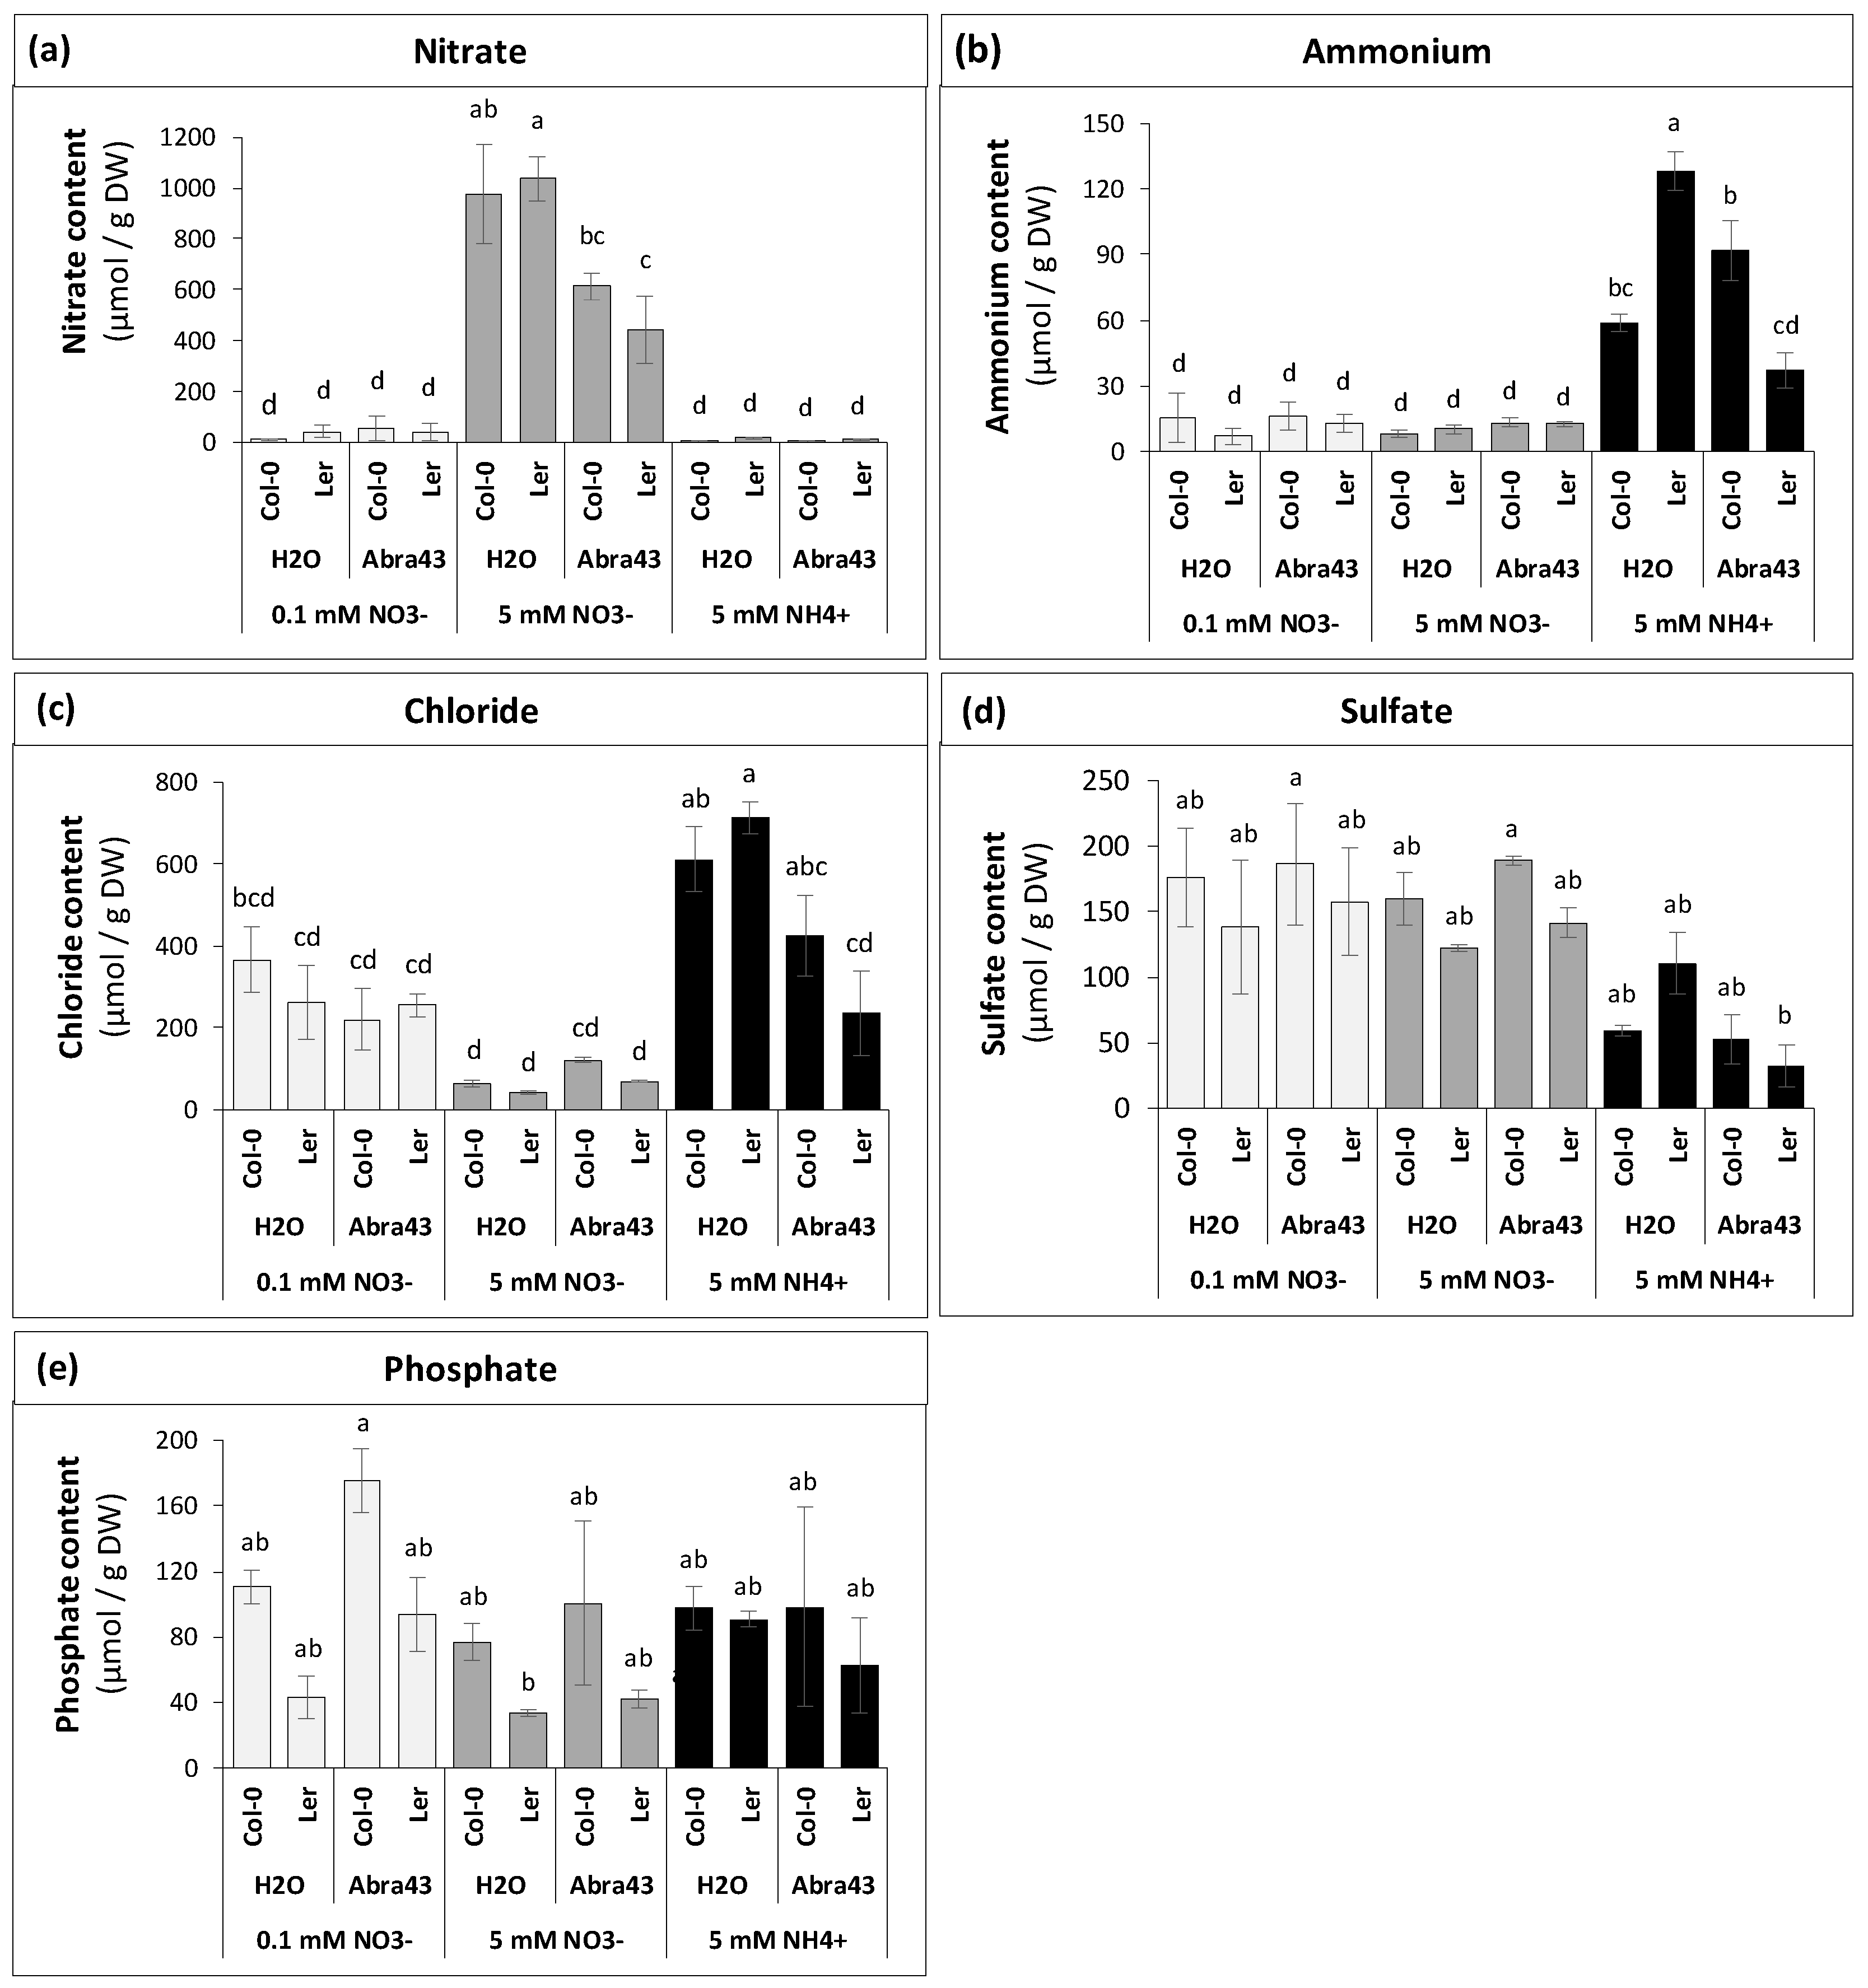
2.2. Impact of inoculation and nitrogen nutrition on ions
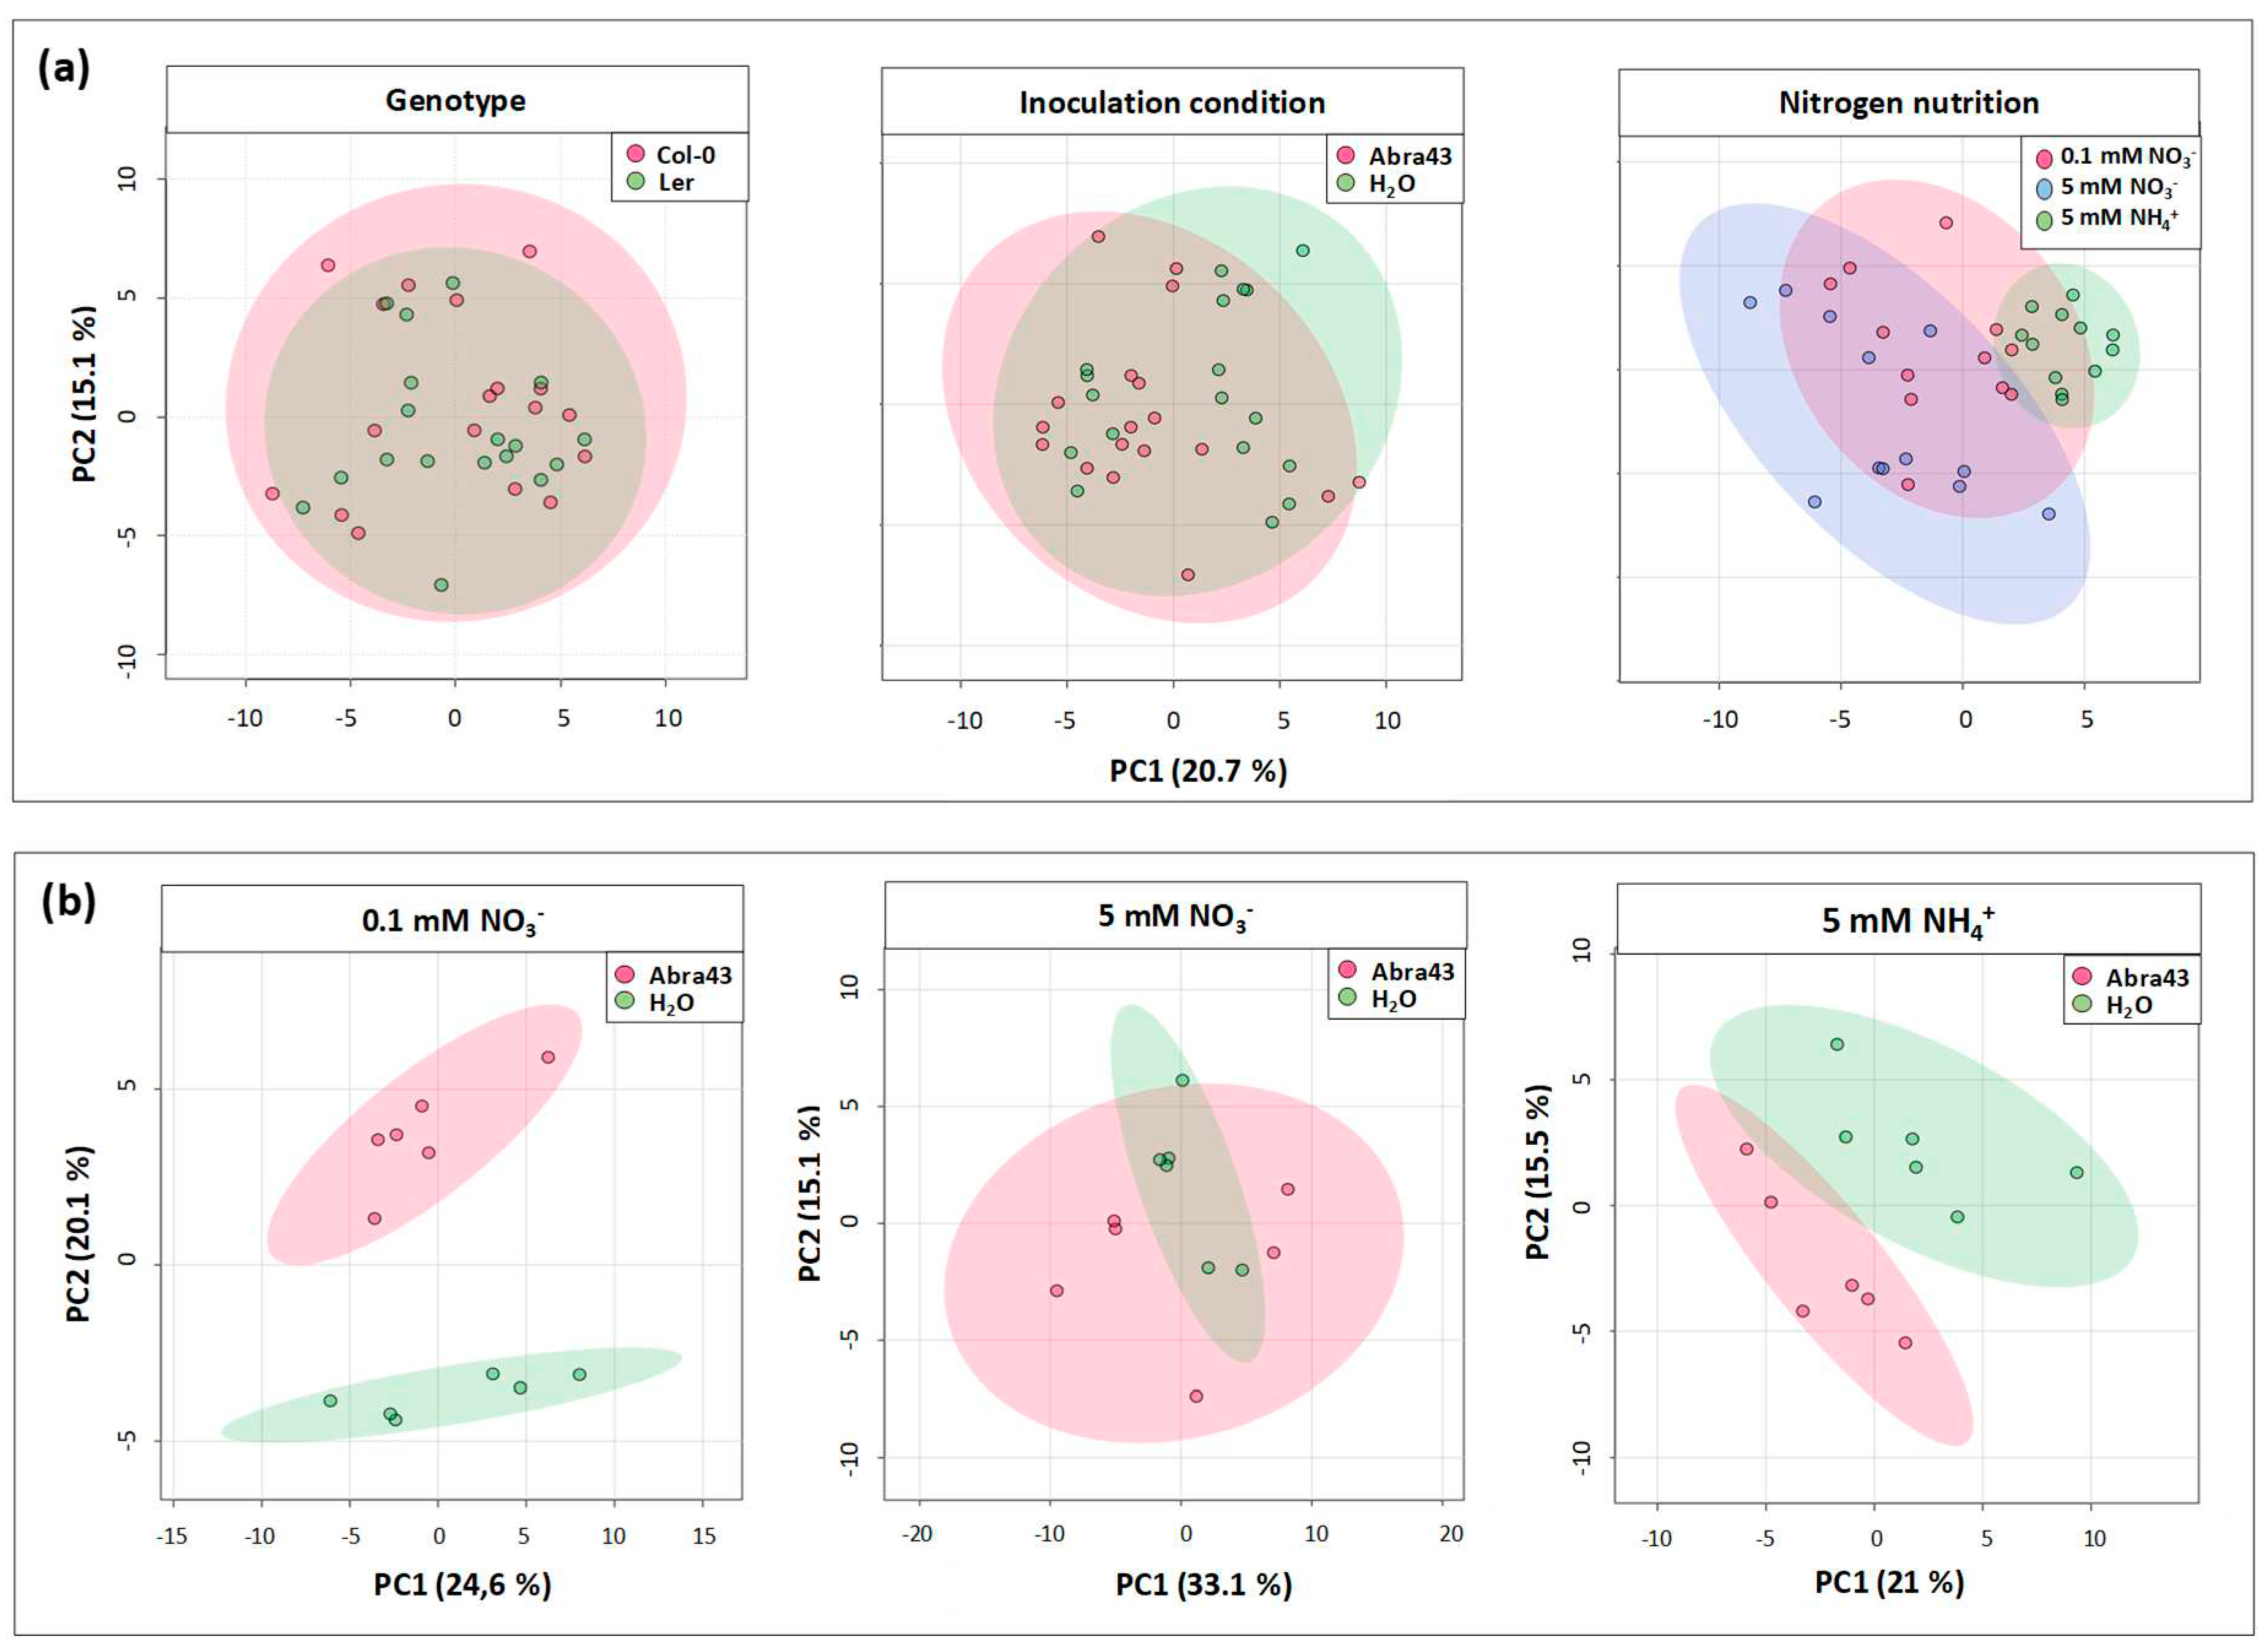
2.3. Effect of genotype, N nutrition and inoculation conditions on seedling metabolome
2.4. Metabolites affected by inoculation and nitrogen nutrition
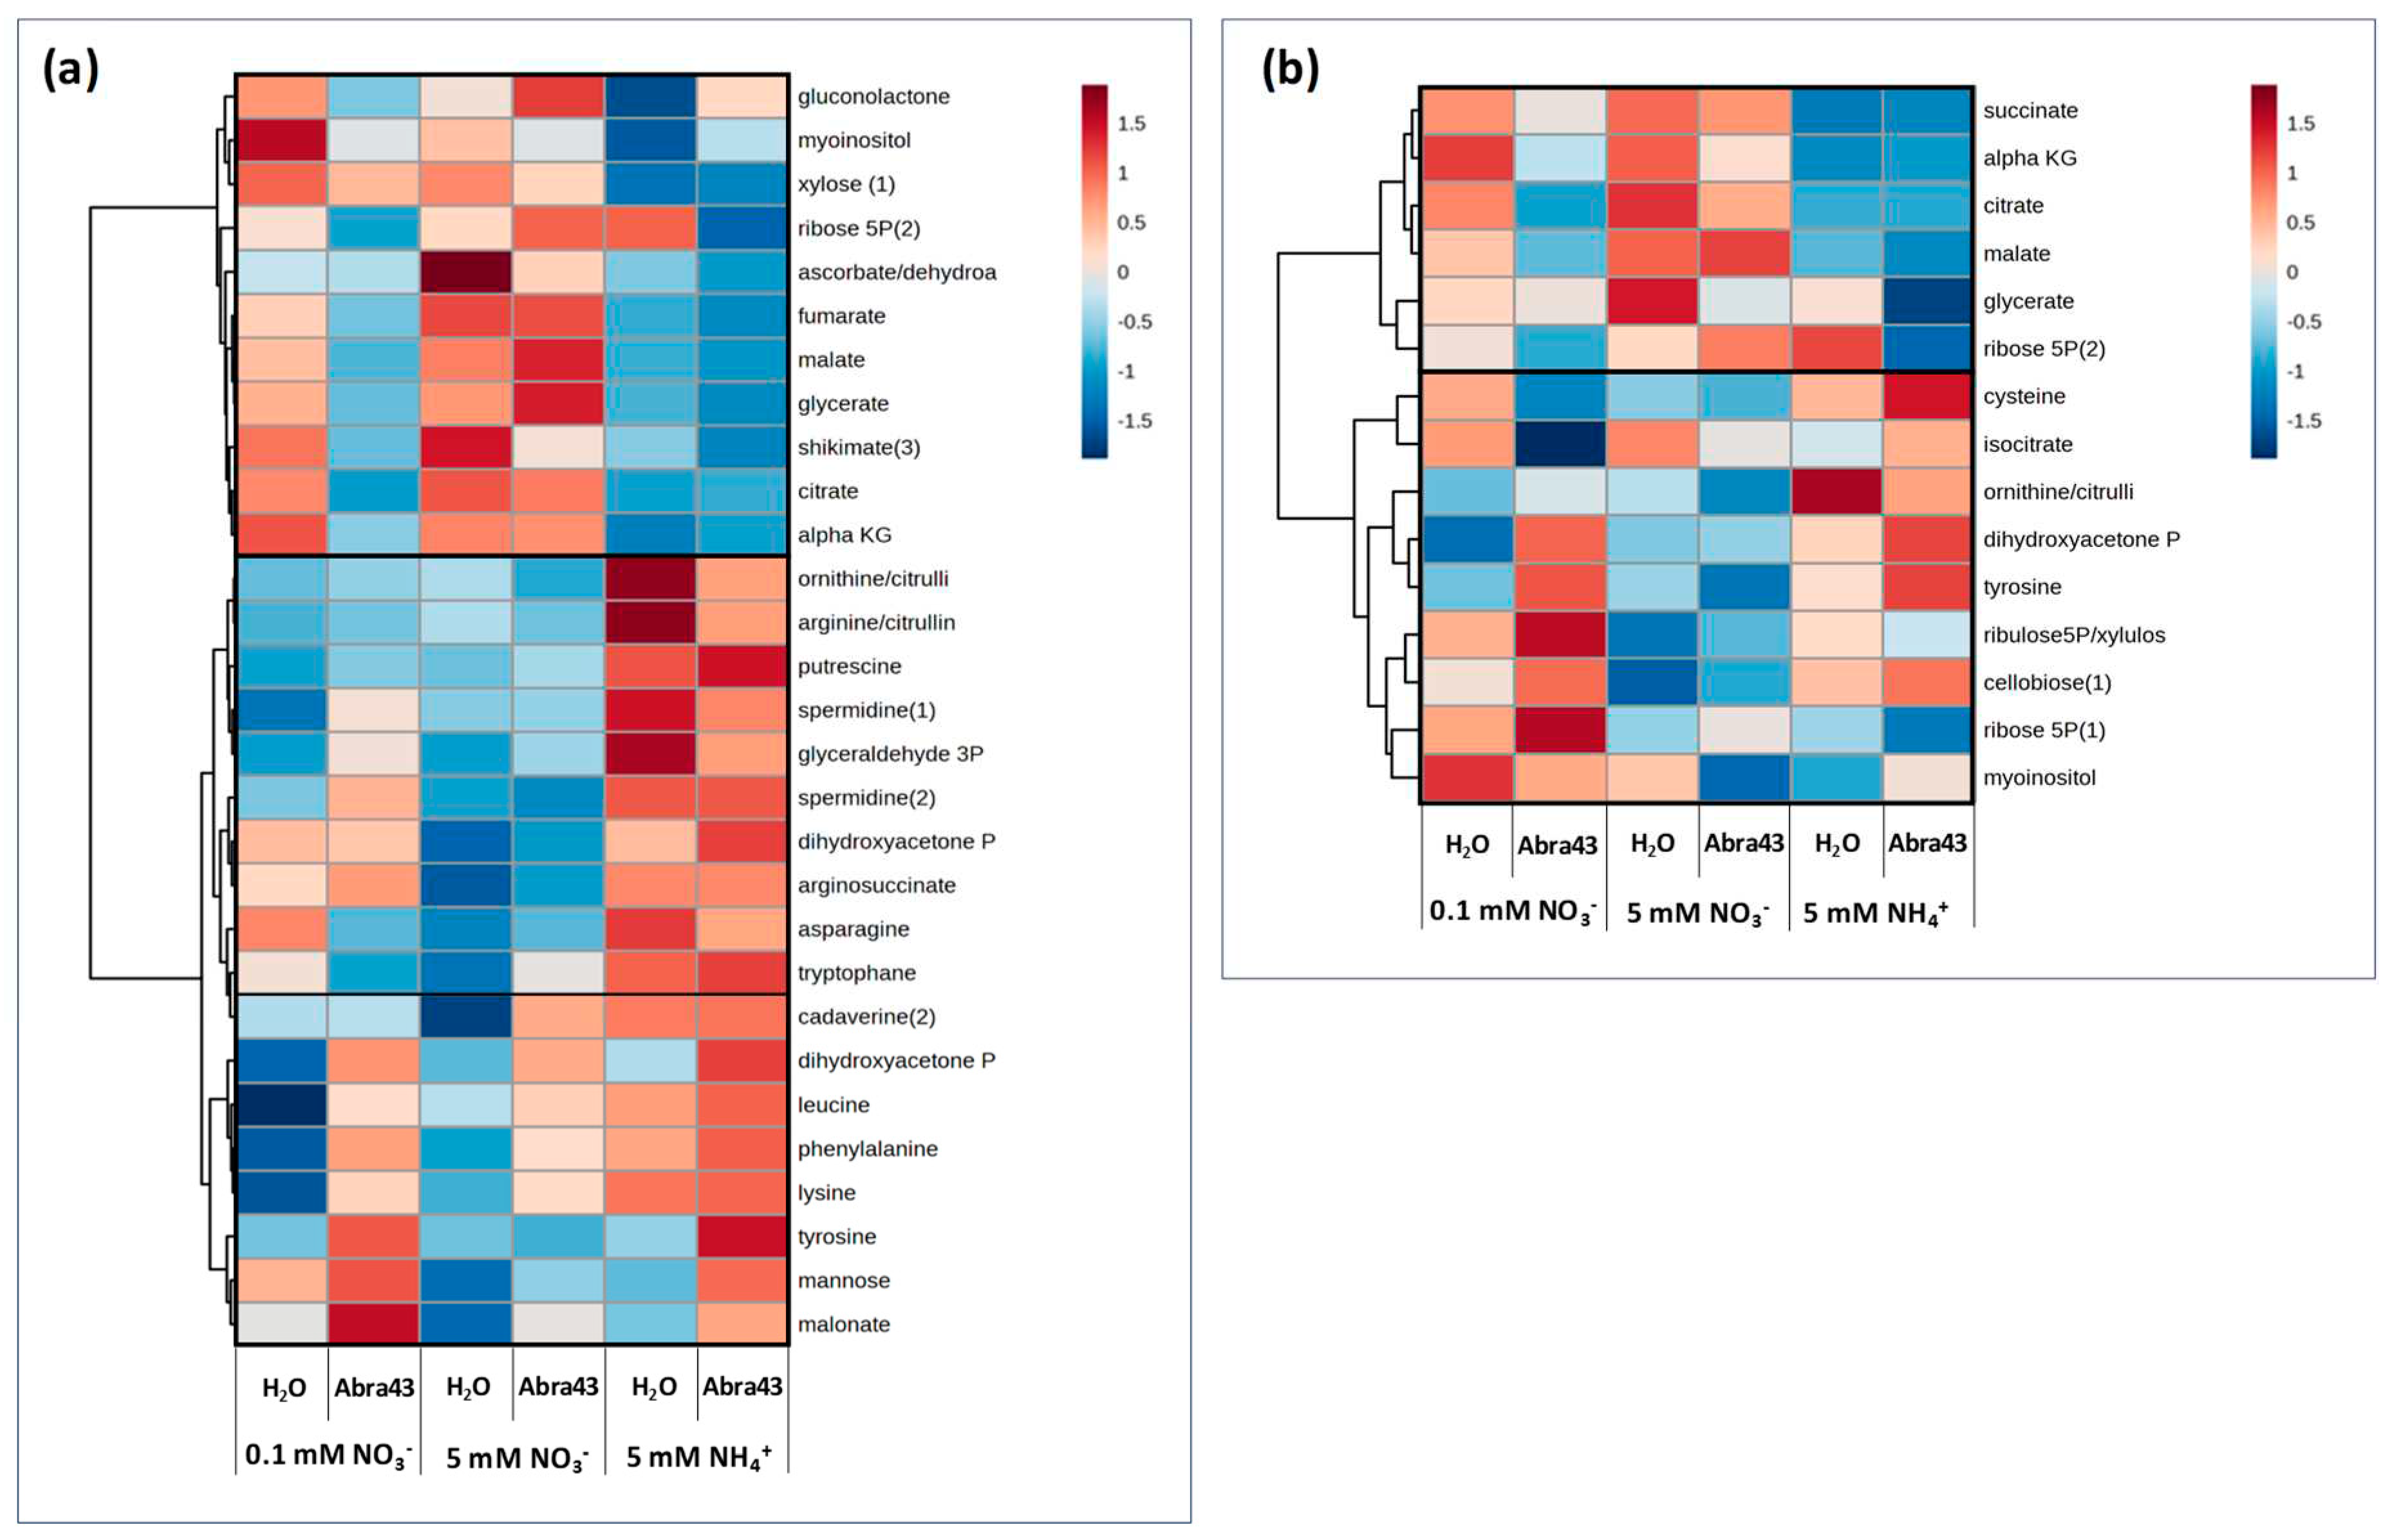
2.4.1. Univariate analysis
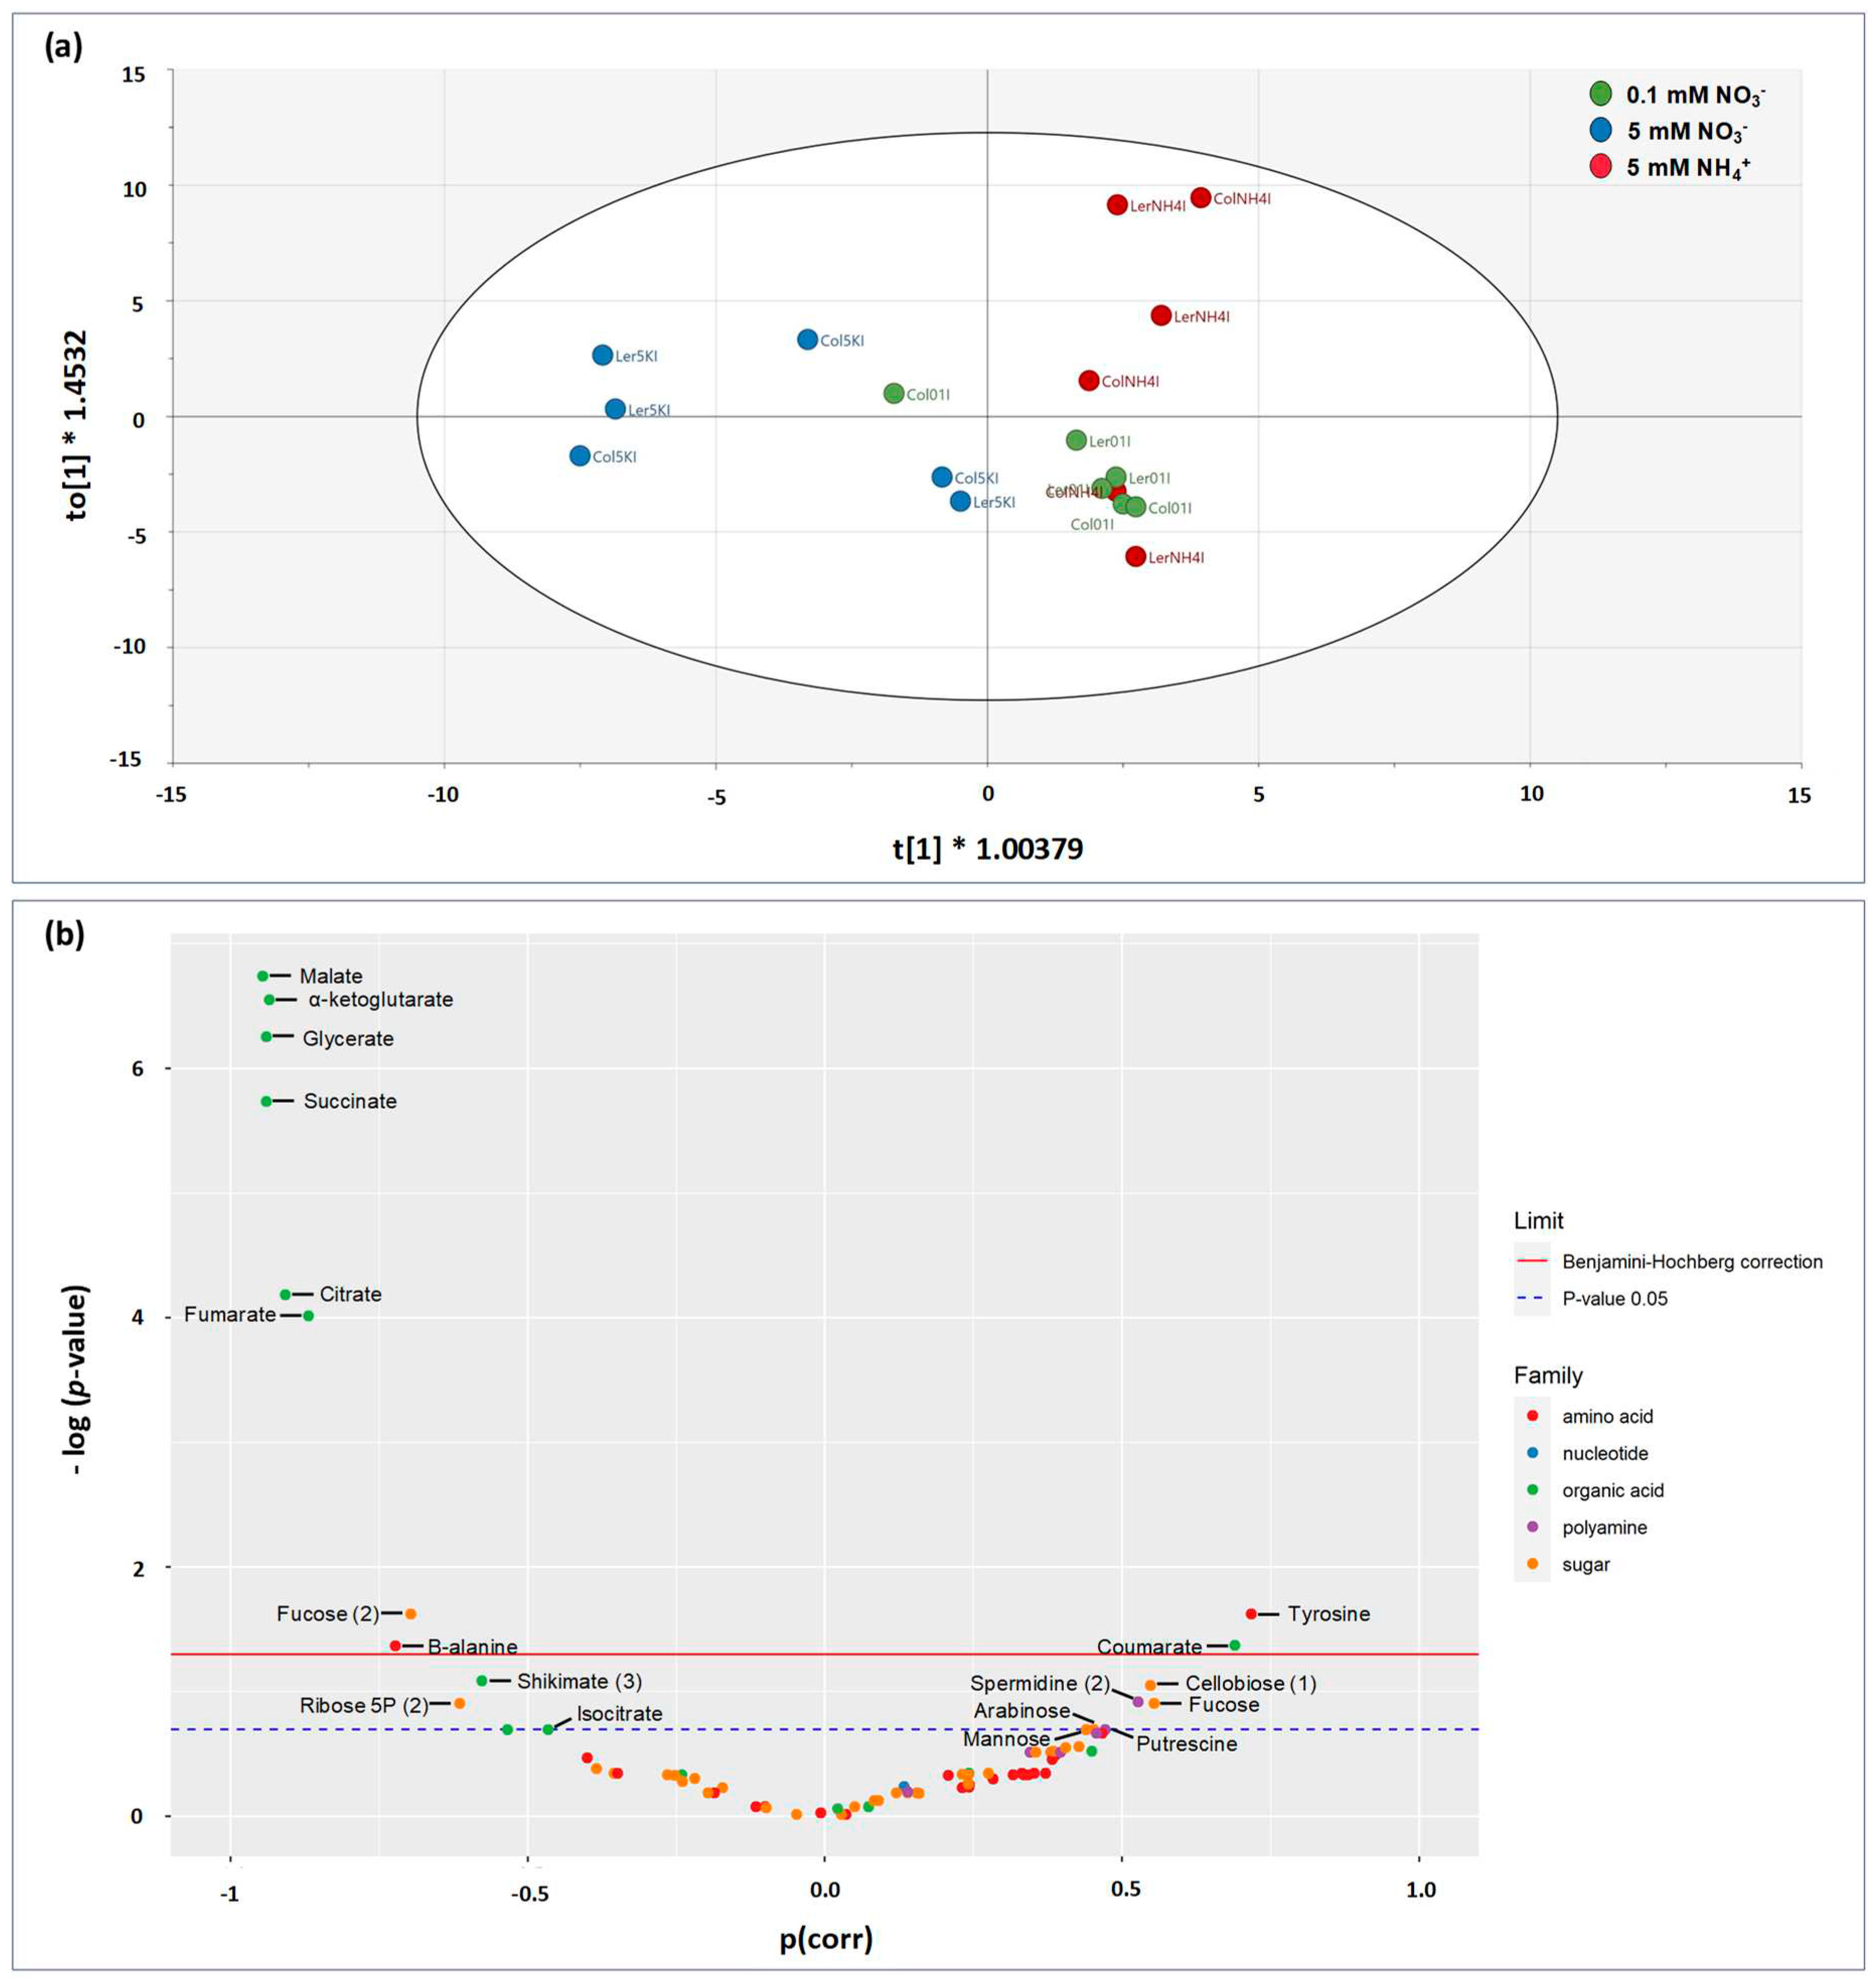
2.4.2. Supervised multivariate analysis (OPLS)
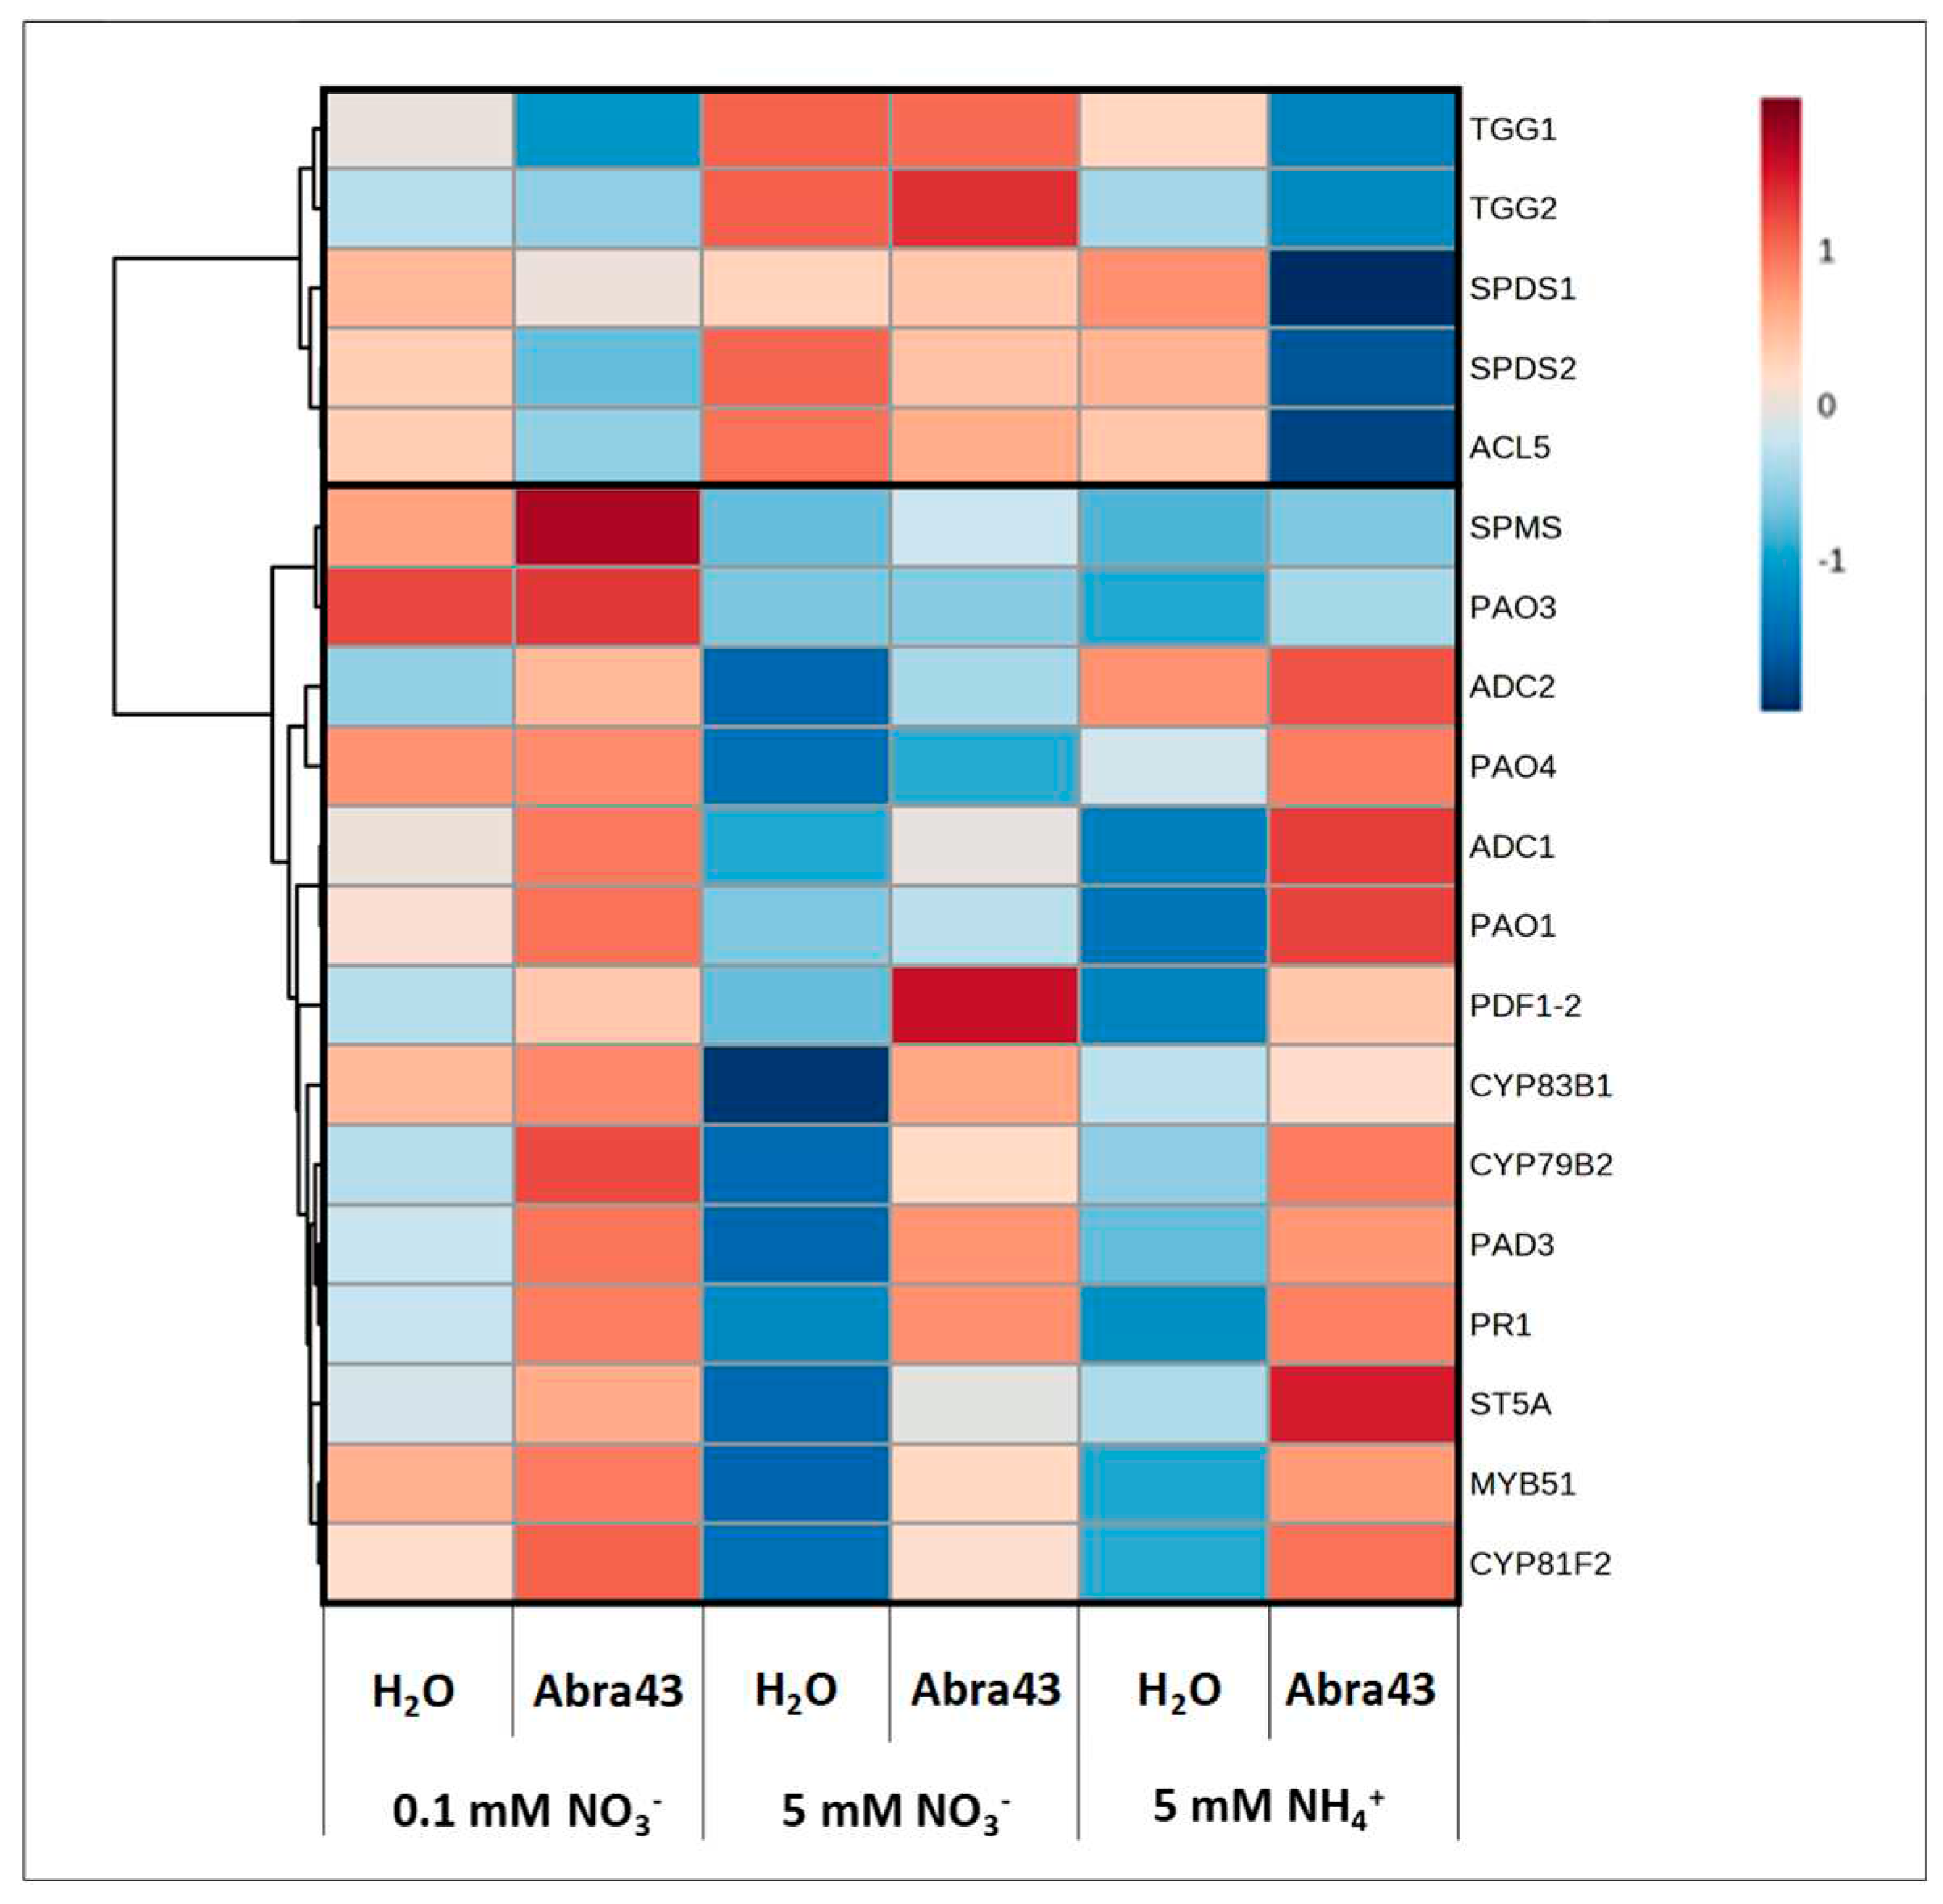
2.5. Transcript abundance of selected genes
3. Discussion
3.1. Beneficial effect of high nitrate conditions on seedling susceptibility
3.2. Metabolism involved in the generic response to A. brassicicola
3.3. Metabolic mechanisms of the effect of N conditions on susceptibility
4. Materials and Methods
4.1. Biological material
4.2. Experimental device developed for Arabidopsis seedling growth
4.3. Seed germination
4.4. Image analysis
4.5. Metabolite profiling on seedlings
Inorganic anions and ammonium contents
GC-MS based targeted metabolomics
4.6. Gene expression profiling by quantitative real-time reverse transcription-PCR
4.7. Statistics
5. Conclusions
Supplementary Materials
Author Contributions
Funding
Data Availability Statement
Conflicts of Interest
References
- McSwiney, C.P.; Robertson, G.P. Nonlinear response of N2O flux to incremental fertilizer addition in a continuous maize (Zea mays L.) cropping system. Glob. Change Biol. 2005, 11, 1712–1719. 5. [Google Scholar] [CrossRef]
- Vitousek, P.M.; Aber, J.D.; Howarth, R.W.; Likens, G.E.; Matson, P.A.; Schindler, D.W.; Schlesinger, W.H.; Tilman, D.G. Human alteration of the global nitrogen cycle: sources and consequences. Ecol. App. 1997, 7, 737–750. [Google Scholar] [CrossRef]
- Dobermann, A.; Cassman, K.G. Plant nutrient management for enhanced productivity in intensive grain production systems of the United States and Asia. Plant Soil 2002, 247, 175. [Google Scholar] [CrossRef]
- Howarth, R.W. Coastal nitrogen pollution: a review of sources and trends globally and regionally. Harmful Algae 2008, 8, 14–20. [Google Scholar] [CrossRef]
- Brühl, C.A.; Schmidt, T.; Pieper, S.; Alscher, A. Terrestrial pesticide exposure of amphibians: An underestimated cause of global decline ? Sci. Rep. 2013, 3, 1–4. [Google Scholar] [CrossRef] [PubMed]
- Mur, L.A.J.; Simpson, C.; Kumari, A.; Gupta, A.K.; Gupta, K.J. Moving nitrogen to the centre of plant defence against pathogens. Ann. Bot. 2017, 119, 703–709. [Google Scholar] [CrossRef] [PubMed]
- Sun, Y.; Wang, M.; Mur, L.A.J.; Shen, Q.; Guo, S. Unravelling the roles of nitrogen nutrition in plant disease defences. Int. J. Mol. Sci. 2020, 21, 572. [Google Scholar] [CrossRef]
- Richard-Molard, C.; Wuilleme, S.; Scheel, C.; Gresshoff, P.M.; Morot-Gaudry, J.F.; Limami, A.M. Nitrogen-induced changes in morphological development and bacterial susceptibility of belgian endive (Cichorium intybus L.) are genotype-dependent. Planta 1999, 209, 389–398. [Google Scholar] [CrossRef] [PubMed]
- Botanga, C.J.; Bethke, G.; Chen, Z.; Gallie, D.R.; Fiehn, O.; Glazebrook, J. Metabolite profiling of Arabidopsis inoculated with Alternaria brassicicola reveals that ascorbate reduces disease severity. Mol. Plant Microbe Interact. 2012, 25, 1628–1638. [Google Scholar] [CrossRef]
- Jiménez-Bremont, J.F.; Marina, M.; Guerrero-González, M. de L.; Rossi, F.R.; Sánchez-Rangel, D.; Rodríguez-Kessler, M.; Ruiz, O.A.; Gárriz, A. Physiological and molecular implications of plant polyamine metabolism during biotic interactions. Front. Plant Sci. 2014, 5, 95. [CrossRef]
- Barrit, T.; Porcher, A.; Cukier, C.; Satour, P.; Guillemette, T.; Limami, A.M.; Teulat, B.; Campion, C.; Planchet, E. Nitrogen nutrition modifies the susceptibility of Arabidopsis thaliana to the necrotrophic fungus, Alternaria brassicicola. Physiol. Plant. 2022, 174, e13621. [Google Scholar] [CrossRef] [PubMed]
- Yamakawa, H.; Kamada, H.; Satoh, M.; Ohashi, Y. Spermine is a salicylate-independent endogenous inducer for both tobacco acidic pathogenesis-related proteins and resistance against tobacco mosaic virus. Plant Physiol. 1998, 118, 1213–1222. [Google Scholar] [CrossRef] [PubMed]
- Tiburcio, A.F.; Altabella, T.; Bitrián, M.; Alcázar, R. The roles of polyamines during the lifespan of plants: from development to stress. Planta 2014, 240, 1–18. [Google Scholar] [CrossRef] [PubMed]
- Liu, J.H.; Wang, W.; Wu, H.; Gong, X.; Moriguchi, T. Polyamines function in stress tolerance: from synthesis to regulation. Front. Plant Sci. 2015, 6, 827. [Google Scholar] [CrossRef]
- Chen, D.; Shao, Q.; Yin, L.; Younis, A.; Zheng, B. Polyamine Function in Plants: Metabolism, Regulation on Development, and Roles in Abiotic Stress Responses. Front. Plant Sci. 2019, 9, 1945. [Google Scholar] [CrossRef] [PubMed]
- Alcázar, R.; Bueno, M.; Tiburcio, A.F. Polyamines: small amines with large effects on plant abiotic stress tolerance. Cells 2020, 9, 2373. [Google Scholar] [CrossRef] [PubMed]
- Paschalidis, K.; Tsaniklidis, G.; Wang, B.Q.; Delis, C.; Trantas, E.; Loulakakis, K.; Makky, M.; Sarris, P.F.; Ververidis, F.; Liu, J.H. The interplay among polyamines and nitrogen in plant stress responses. Plants 2019, 8, 315. [Google Scholar] [CrossRef] [PubMed]
- Iriti, M.; Faoro, F. Chemical diversity and defence metabolism: how plants cope with pathogens and ozone pollution. Int. J. Mol. Sci. 2009, 10, 3371–3399. [Google Scholar] [CrossRef] [PubMed]
- Dixon, R.A.; Paiva, N.L. Stress-Induced Phenylpropanoid Metabolism. Plant Cell 1995, 7, 1085–1097. [Google Scholar] [CrossRef]
- Averesch, N.J.H.; Krömer, J.O. Metabolic Engineering of the Shikimate Pathway for Production of Aromatics and Derived Compounds-Present and Future Strain Construction Strategies. Front. Bioeng. Biotechnol. 2018, 6, 32. [Google Scholar] [CrossRef]
- Zook, M. Biosynthesis of camalexin from tryptophan pathway intermediates in cell-suspension cultures of Arabidopsis. Plant Physiol. 1998, 118, 1389–1393. [Google Scholar] [CrossRef] [PubMed]
- Glawischnig, E.; Hansen, B.G.; Olsen, CE.; Halkier, B.A. Camalexin is synthesized from indole-3-acetaldoxime, a key branching point between primary and secondary metabolism in Arabidopsis. Proc. Natl. Acad. Sci. U.S.A. 2004, 101, 8245–8250. [Google Scholar] [CrossRef] [PubMed]
- Piasecka, A.; Jedrzejczak-Rey, N.; Bednarek, P. Secondary metabolites in plant innate immunity: conserved function of divergent chemicals. New Phytol. 2015, 206, 948–964. [Google Scholar] [CrossRef] [PubMed]
- Sellam, A.; Dongo, A.; Guillemette, T.; Hudhomme, P.; Simoneau, P. Transcriptional responses to exposure to the brassicaceous defence metabolites camalexin and allyl-isothiocyanate in the necrotrophic fungus Alternaria brassicicola. Mol. Plant Pathol. 2007, 8, 195–208. [Google Scholar] [CrossRef]
- Wittstock, U.; Halkier, B.A. Glucosinolate research in the Arabidopsis era. Trends Plant Sci. 2002, 7, 263–270. [Google Scholar] [CrossRef] [PubMed]
- Tao, H.; Miao, H.; Chen, L.; Wang, M.; Xia, C.; Zeng, W.; Sun, B.; Zhang, F.; Zhang, S.; Li, C.; Wang, Q. WRKY33-mediated indolic glucosinolate metabolic pathway confers resistance against Alternaria brassicicola in Arabidopsis and Brassica crops. J. Integr. Plant Biol. 2022, 64, 1007–1019. [Google Scholar] [CrossRef] [PubMed]
- Lv, Q.; Li, X.; Fan, B.; Zhu, C.; Chen, Z. The Cellular and Subcellular Organization of the Glucosinolate-Myrosinase System against Herbivores and Pathogens. Int. J. Mol. Sci. 2022, 23, 1577. [Google Scholar] [CrossRef]
- Solomon, P.S.; Tan, K.C.; Oliver, R.P. The nutrient supply of pathogenic fungi; a fertile field for study. Mol. Plant Pathol. 2003, 4, 203–210. [Google Scholar] [CrossRef] [PubMed]
- Dordas, C. Role of nutrients in controlling plant diseases in sustainable agriculture. A review. Agron. Sustain. Dev. 2008, 28, 33–46. [Google Scholar] [CrossRef]
- Lecompte, F.; Abro, M.A.; Nicot, P.C. Contrasted responses of Botrytis cinerea isolates developing on tomato plants grown under different nitrogen nutrition regimes. Plant Pathol. 2010, 59, 891–899. [Google Scholar] [CrossRef]
- Thalineau, E.; Fournier, C.; Gravot, A.; Wendehenne, D.; Jeandroz, S.; Truong, H.N. Nitrogen modulation of Medicago truncatula resistance to Aphanomyces euteiches depends on plant genotype. Mol. Plant Pathol. 2018, 19, 664–676. [Google Scholar] [CrossRef]
- Gazengel, K.; Aigu, Y.; Lariagon, C.; Humeau, M.; Gravot, A.; Manzanares-Dauleux, M.J.; Daval, S. Nitrogen Supply and Host-Plant Genotype Modulate the Transcriptomic Profile of Plasmodiophora brassicae. Front. Microbiol. 2021, 12, 701067. [Google Scholar] [CrossRef]
- Hoffland, E.; Jeger, M.J.; van Beusichem, M.L. Effect of nitrogen supply rate on disease resistance in tomato depends on the pathogen. Plant Soil 2000, 218, 239–247. [Google Scholar] [CrossRef]
- López-Berges, M.S.; Rispail, N.; Prados-Rosales, R.C.; Di Pietro, A. A nitrogen response pathway regulates virulence functions in Fusarium oxysporum via the protein kinase TOR and the bZIP protein MeaB. Plant Cell. 2010, 22, 2459–2475. [Google Scholar] [CrossRef]
- Gupta, K.J.; Brotman, Y.; Segu, S.; Zeier, T.; Zeier, J.; Persijn, S.T.; Cristescu, S.M.; Harren, F.J.; Bauwe, H.; Fernie, A.R.; Kaiser, W.M.; Mur, L.A. The form of nitrogen nutrition affects resistance against Pseudomonas syringae pv. phaseolicola in tobacco. J. Exp. Bot. 2013, 64, 553–568. [Google Scholar] [CrossRef] [PubMed]
- González-Hernández, A.I.; Fernández-Crespo, E.; Scalschi, L.; Hajirezaei, M.R.; von Wirén, N.; García-Agustín, P.; Camañes, G. Ammonium mediated changes in carbon and nitrogen metabolisms induce resistance against Pseudomonas syringae in tomato plants. J. Plant Physiol. 2019, 239, 28–37. [Google Scholar] [CrossRef]
- Sun, Y.; Li, Y.; Li, Y.; Wang, M.; Mur, L.A.J.; Shen, Q.; Guo, S. Nitrate mediated resistance against Fusarium infection in cucumber plants acts via photorespiration. Plant Cell Environ. 2021, 44(10), 3412–3431. [Google Scholar] [CrossRef] [PubMed]
- Bolton, M.D.; Thomma, B.P.H.J. The complexity of nitrogen metabolism and nitrogen-regulated gene expression in plant pathogenic fungi. Physiol. Mol. Plant Pathol. 2008, 72, 104–110. [Google Scholar] [CrossRef]
- Jensen, B.; Munk, L. Nitrogen-induced changes in colony density and spore production of Erysiphe graminis f. sp. hordei on seedlings of six spring barley cultivars. Plant Pathol. 1997, 46, 191–202. [Google Scholar] [CrossRef]
- Tavernier, V.; Cadiou, S.; Pageau, K.; Laugé, R.; Reisdorf-Cren, M.; Langin, T.; Masclaux-Daubresse, C. The plant nitrogen mobilization promoted by Colletotrichum lindemuthianum in Phaseolus leaves depends on fungus pathogenicity. J. Exp. Bot. 2007, 58, 3351–3360. [Google Scholar] [CrossRef] [PubMed]
- Barrit, T.; Campion, C.; Aligon, S.; Bourbeillon, J.; Rousseau, D.; Planchet, E.; Teulat, B. A new in vitro monitoring system reveals a specific influence of Arabidopsis nitrogen nutrition on its susceptibility to Alternaria brassicicola at the seedling stage. Plant Methods 2022, 18, 131. [Google Scholar] [CrossRef] [PubMed]
- Fredes, I.; Moreno, S.; Díaz, F.P.; Gutiérrez, R.A. Nitrate signaling and the control of Arabidopsis growth and development. Curr. Opin. Plant Biol. 2019, 47, 112–118. [Google Scholar] [CrossRef] [PubMed]
- Swaminathan, S.; Lionetti, V.; Zabotina, O.A. Plant cell wall integrity perturbations and priming for defense. Plants 2022, 11, 3539. [Google Scholar] [CrossRef]
- Kongala, S.I.; Kondreddy, A. A review on plant and pathogen derived carbohydrates, oligosaccharides and their role in plant's immunity. Carbohydr. Polym. 2023, 6, 100330. [Google Scholar] [CrossRef]
- Bellincampi, D.; Cervone, F.; Lionetti, V. Plant cell wall dynamics and wall-related susceptibility in plant-pathogen interactions. Front. Plant Sci. 2014, 5, 228. [Google Scholar] [CrossRef]
- Kubicek, C.P.; Starr, T.L.; Glass, N.L. Plant cell wall-degrading enzymes and their secretion in plant-pathogenic fungi. Annu. Rev. Phytopathol. 2014, 52, 427–451. [Google Scholar] [CrossRef]
- Walters, D.R. Polyamines and plant disease. Phytochemistry 2003, 64(1), 97–107. [Google Scholar] [CrossRef]
- Hussain, S.S.; Ali, M.; Ahmad, M.; Siddique, K.H. Polyamines: natural and engineered abiotic and biotic stress tolerance in plants. Biotechnol. Adv. 2011, 29(3), 300–311. [Google Scholar] [CrossRef]
- Jubault, M.; Hamon, C.; Gravot, A.; Lariagon, C.; Delourme, R.; Bouchereau, A.; Manzanares-Dauleux, M.J. Differential regulation of root arginine catabolism and polyamine metabolism in clubroot-susceptible and partially resistant Arabidopsis genotypes. Plant Physiol. 2008, 146, 2008–2019. [Google Scholar] [CrossRef]
- Vogt, T. Phenylpropanoid biosynthesis. Mol. Plant 2010, 3, 2–20. [Google Scholar] [CrossRef]
- Glazebrook, J. Contrasting mechanisms of defense against biotrophic and necrotrophic pathogens. Annu. Rev. Phytopathol. 2005, 43, 205–227. [Google Scholar] [CrossRef] [PubMed]
- Thaler, J.S.; Humphrey, P.T.; Whiteman, N.K. Evolution of jasmonate and salicylate signal crosstalk. Trends Plant Sci. 2012, 17, 260–270. [Google Scholar] [CrossRef] [PubMed]
- Kazan, K.; Lyons, R. Intervention of Phytohormone Pathways by Pathogen Effectors. Plant Cell. 2014, 26, 2285–2309. [Google Scholar] [CrossRef]
- Bolton, M.D. Primary metabolism and plant defense-fuel for the fire. Mol. Plant Microbe Interact. 2009, 22, 487–497. [Google Scholar] [CrossRef] [PubMed]
- Balmer, A.; Pastor, V.; Glauser, G.; Mauch-Mani, B. Tricarboxylates Induce Defense Priming Against Bacteria in Arabidopsis thaliana. Front. Plant Sci. 2018, 9, 1221. [Google Scholar] [CrossRef] [PubMed]
- Belmas, E.; Briand, M.; Kwasiborski, A.; Colou, J.; N’Guyen, G.; Iacomi, B.; Grappin, P.; Campion, C.; Simoneau, P.; Barret, M.; Guillemette, T. Genome sequence of the necrotrophic plant pathogen Alternaria brassicicola Abra43. Genome Announc. 2018, 6, 01559–17. [Google Scholar] [CrossRef] [PubMed]
- Murashige, T.; Skoog, F. A revised medium for rapid growth and bio assays with tobacco tissue cultures. Physiol. Plant. 1962, 15, 473–497. [Google Scholar] [CrossRef]
- Harris, C.R.; Millman, K.J.; van der Walt, S.J.; Gommers, R.; Virtanen, P.; Cournapeau, D.; Wieser, E.; Taylor, J.; Berg, S.; Smith, N.J.; Kern, R.; Picus, M.; Hoyer, S.; van Kerkwijk, M.H.; Brett, M.; Haldane, A.; Del Río, J.F.; Wiebe, M.; Peterson, P.; Gérard-Marchant, P.; Sheppard, K.; Reddy, T.; Weckesser, W.; Abbasi, H.; Gohlke, C.; Oliphant, T.E. Array programming with NumPy. Nature 2020, 585, 362. [Google Scholar] [CrossRef] [PubMed]
- van der Walt, S.; Schönberger, J.L.; Nunez-Iglesias, J.; Boulogne, F.; Warner, J.D.; Yager, N.; Gouillart, E.; Yu, T. Scikit-image: image processing in Python. Peer J. 2014, 2, e453. [Google Scholar] [CrossRef]
- Hunter, J.D. Matplotlib: A 2D graphics. Comp. Sci. Eng. 2007, 9, 90–95. [Google Scholar] [CrossRef]
- Vega-Mas, I.; Sarasketa, A.; Marino, D. High-throughput quantification of ammonium content in Arabidopsis. Bio-protoc. 2015, 5, 1559. [Google Scholar] [CrossRef]
- Pang, Z.; Chong, J.; Zhou, G.; de Lima Morais, D.A.; Chang, L.; Barrette, M.; Gauthier, C.; Jacques, P.É.; Li, S.; Xia, J. MetaboAnalyst 5.0: narrowing the gap between raw spectra and functional insights. Nucleic Acids Res. 2021, 49, W388–396. [Google Scholar] [CrossRef] [PubMed]
Disclaimer/Publisher’s Note: The statements, opinions and data contained in all publications are solely those of the individual author(s) and contributor(s) and not of MDPI and/or the editor(s). MDPI and/or the editor(s) disclaim responsibility for any injury to people or property resulting from any ideas, methods, instructions or products referred to in the content. |
© 2024 by the authors. Licensee MDPI, Basel, Switzerland. This article is an open access article distributed under the terms and conditions of the Creative Commons Attribution (CC BY) license (http://creativecommons.org/licenses/by/4.0/).


