Submitted:
10 January 2024
Posted:
11 January 2024
You are already at the latest version
Abstract
Keywords:
1. Introduction
2. Materials and Methods
2.1. Plant Materials and Extracts
2.2. Drought and Salt Stress Treatments
2.3. Rice Growth and Relative Water Contents After Drought and Salt Stress
2.4. Photosynthetic Efficiency, Chlorophyll and Carotenoid Contents After Drought and Salt Stress
2.5. Determination of Superoxide Radical (O2−) and H2O2 Contents After Drought and Salt Stress
2.6. Lipid Peroxidation After Drought and Salt Stress
2.7. Proline and Sugar Accumulation After Drought and Salt Stress
2.8. Statistical Analysis
3. Results and Discussion
3.1. Effects of Plant Extracts on Rice Injury and Growth Under Drought and Salt Stress
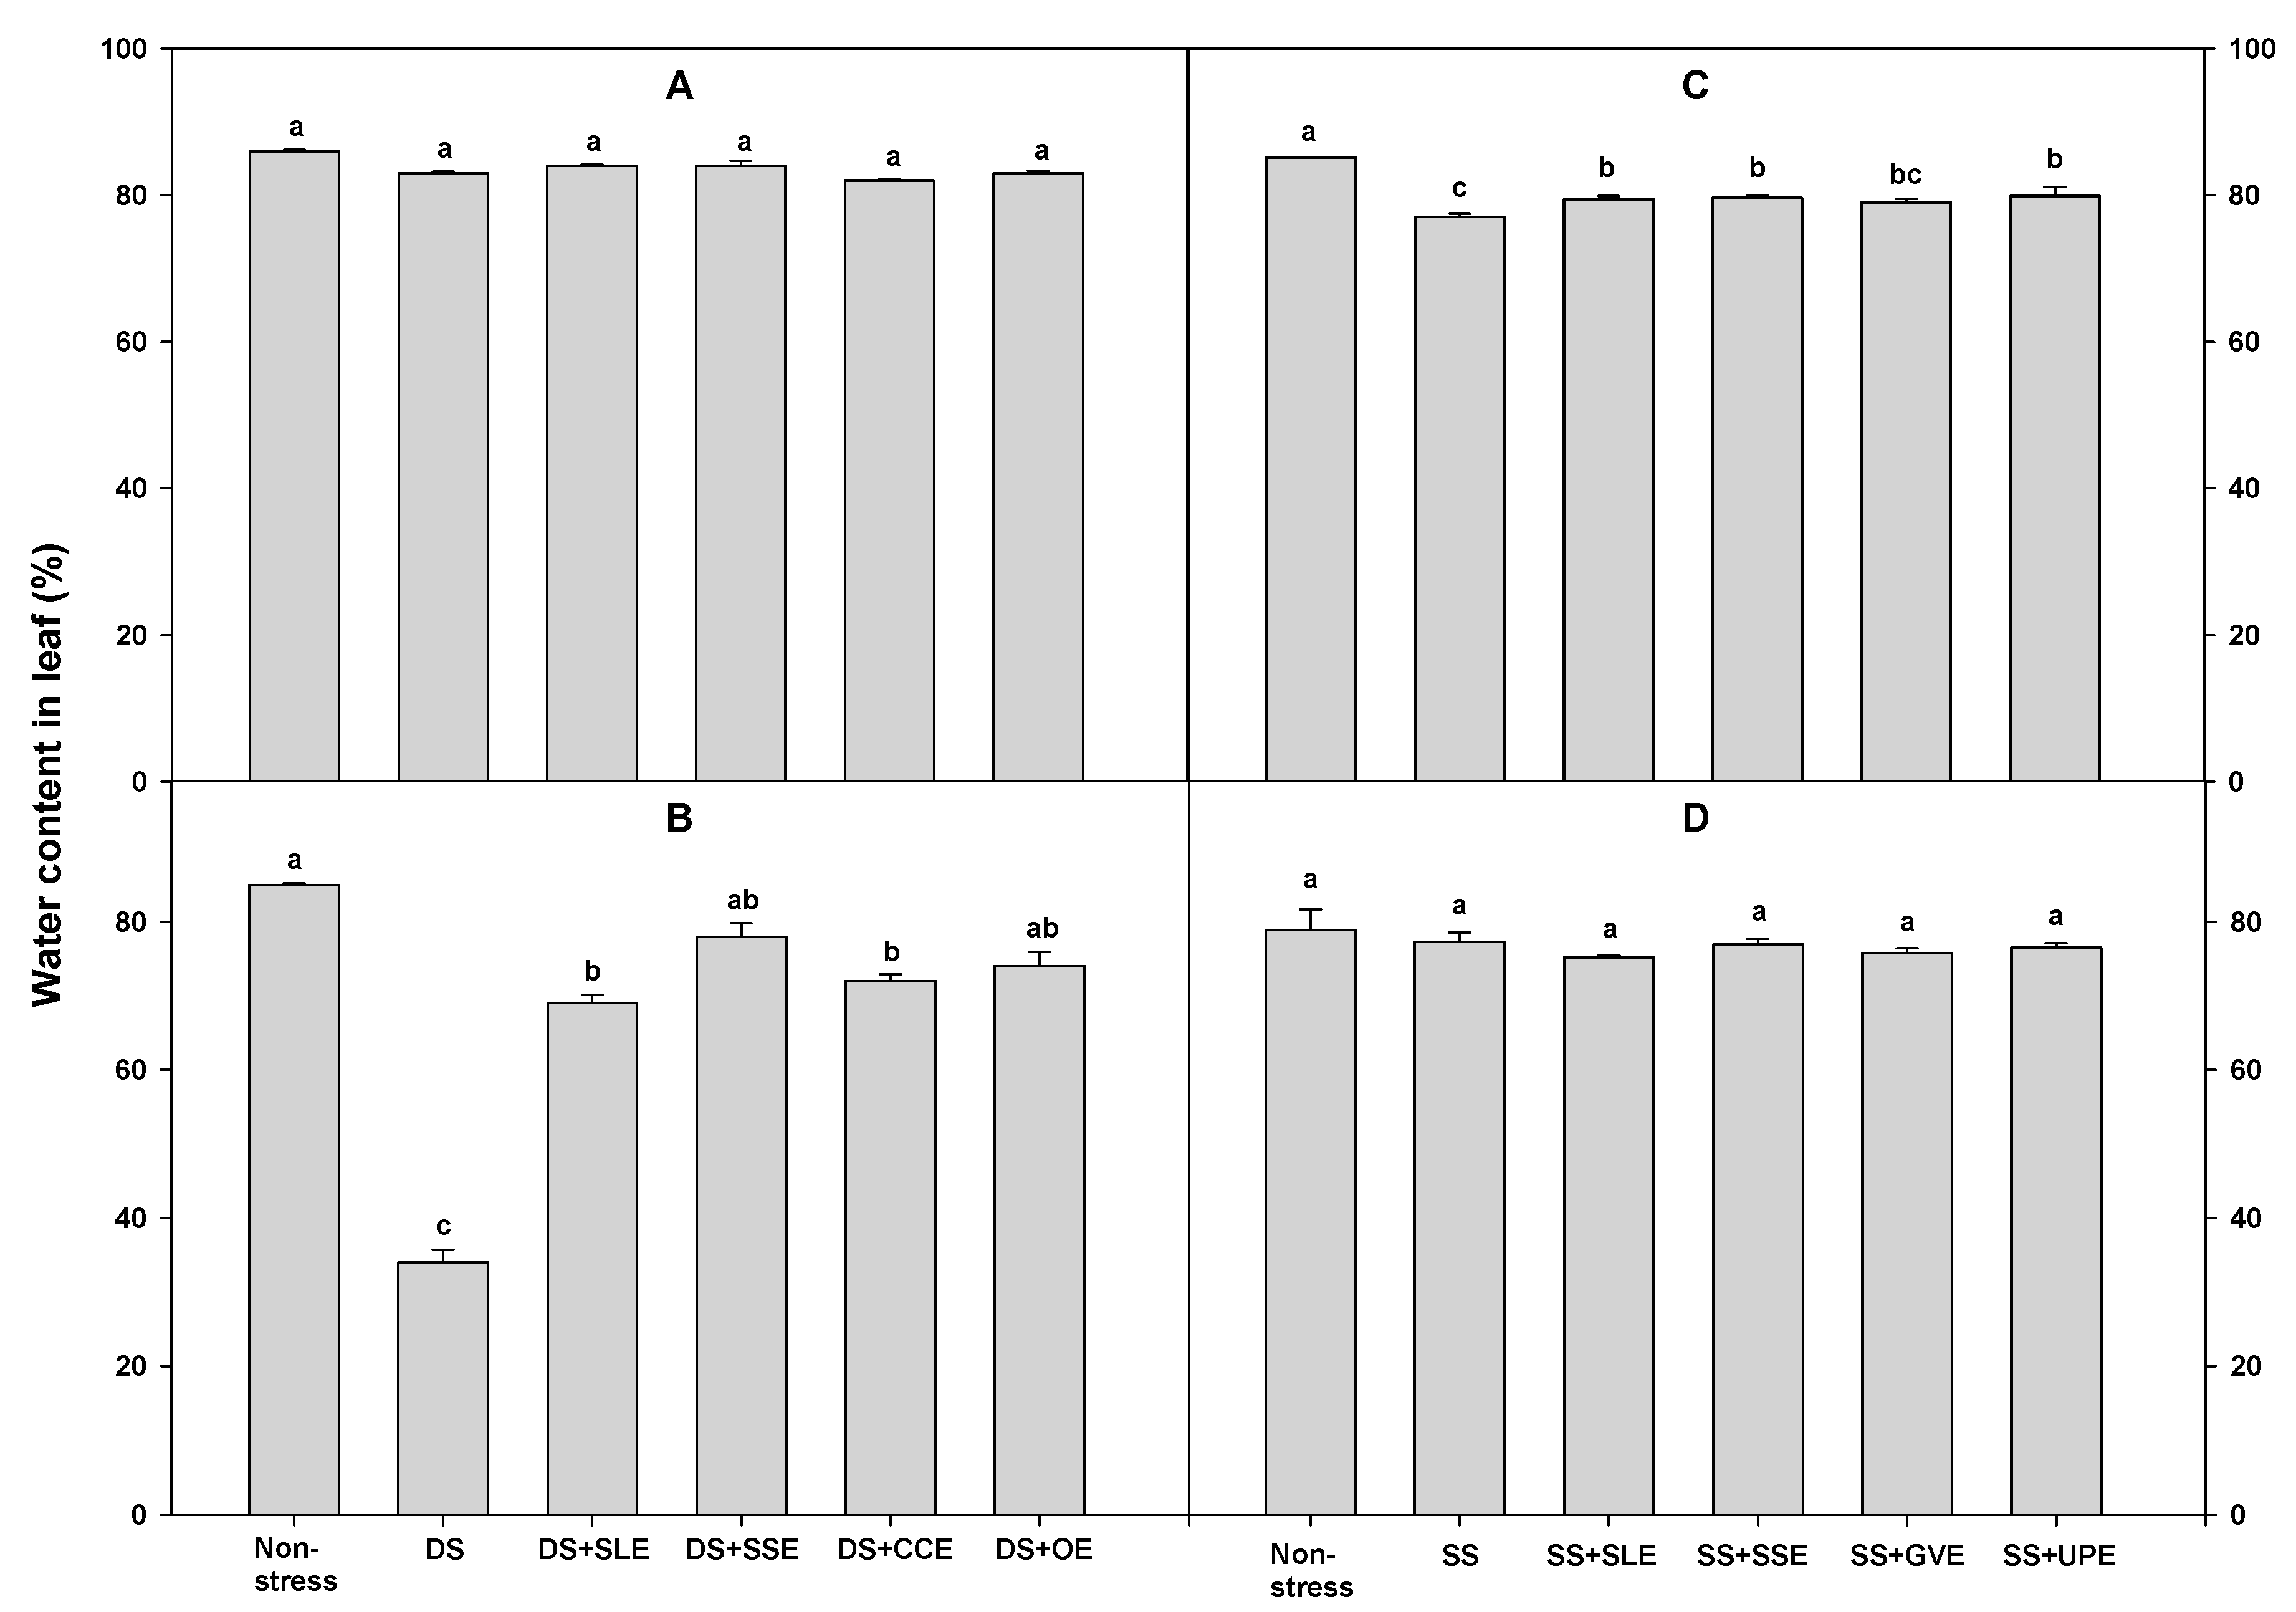
3.2. Effects of Selected Plant Extracts on Relative Water Content Under Drought and Salt Stress
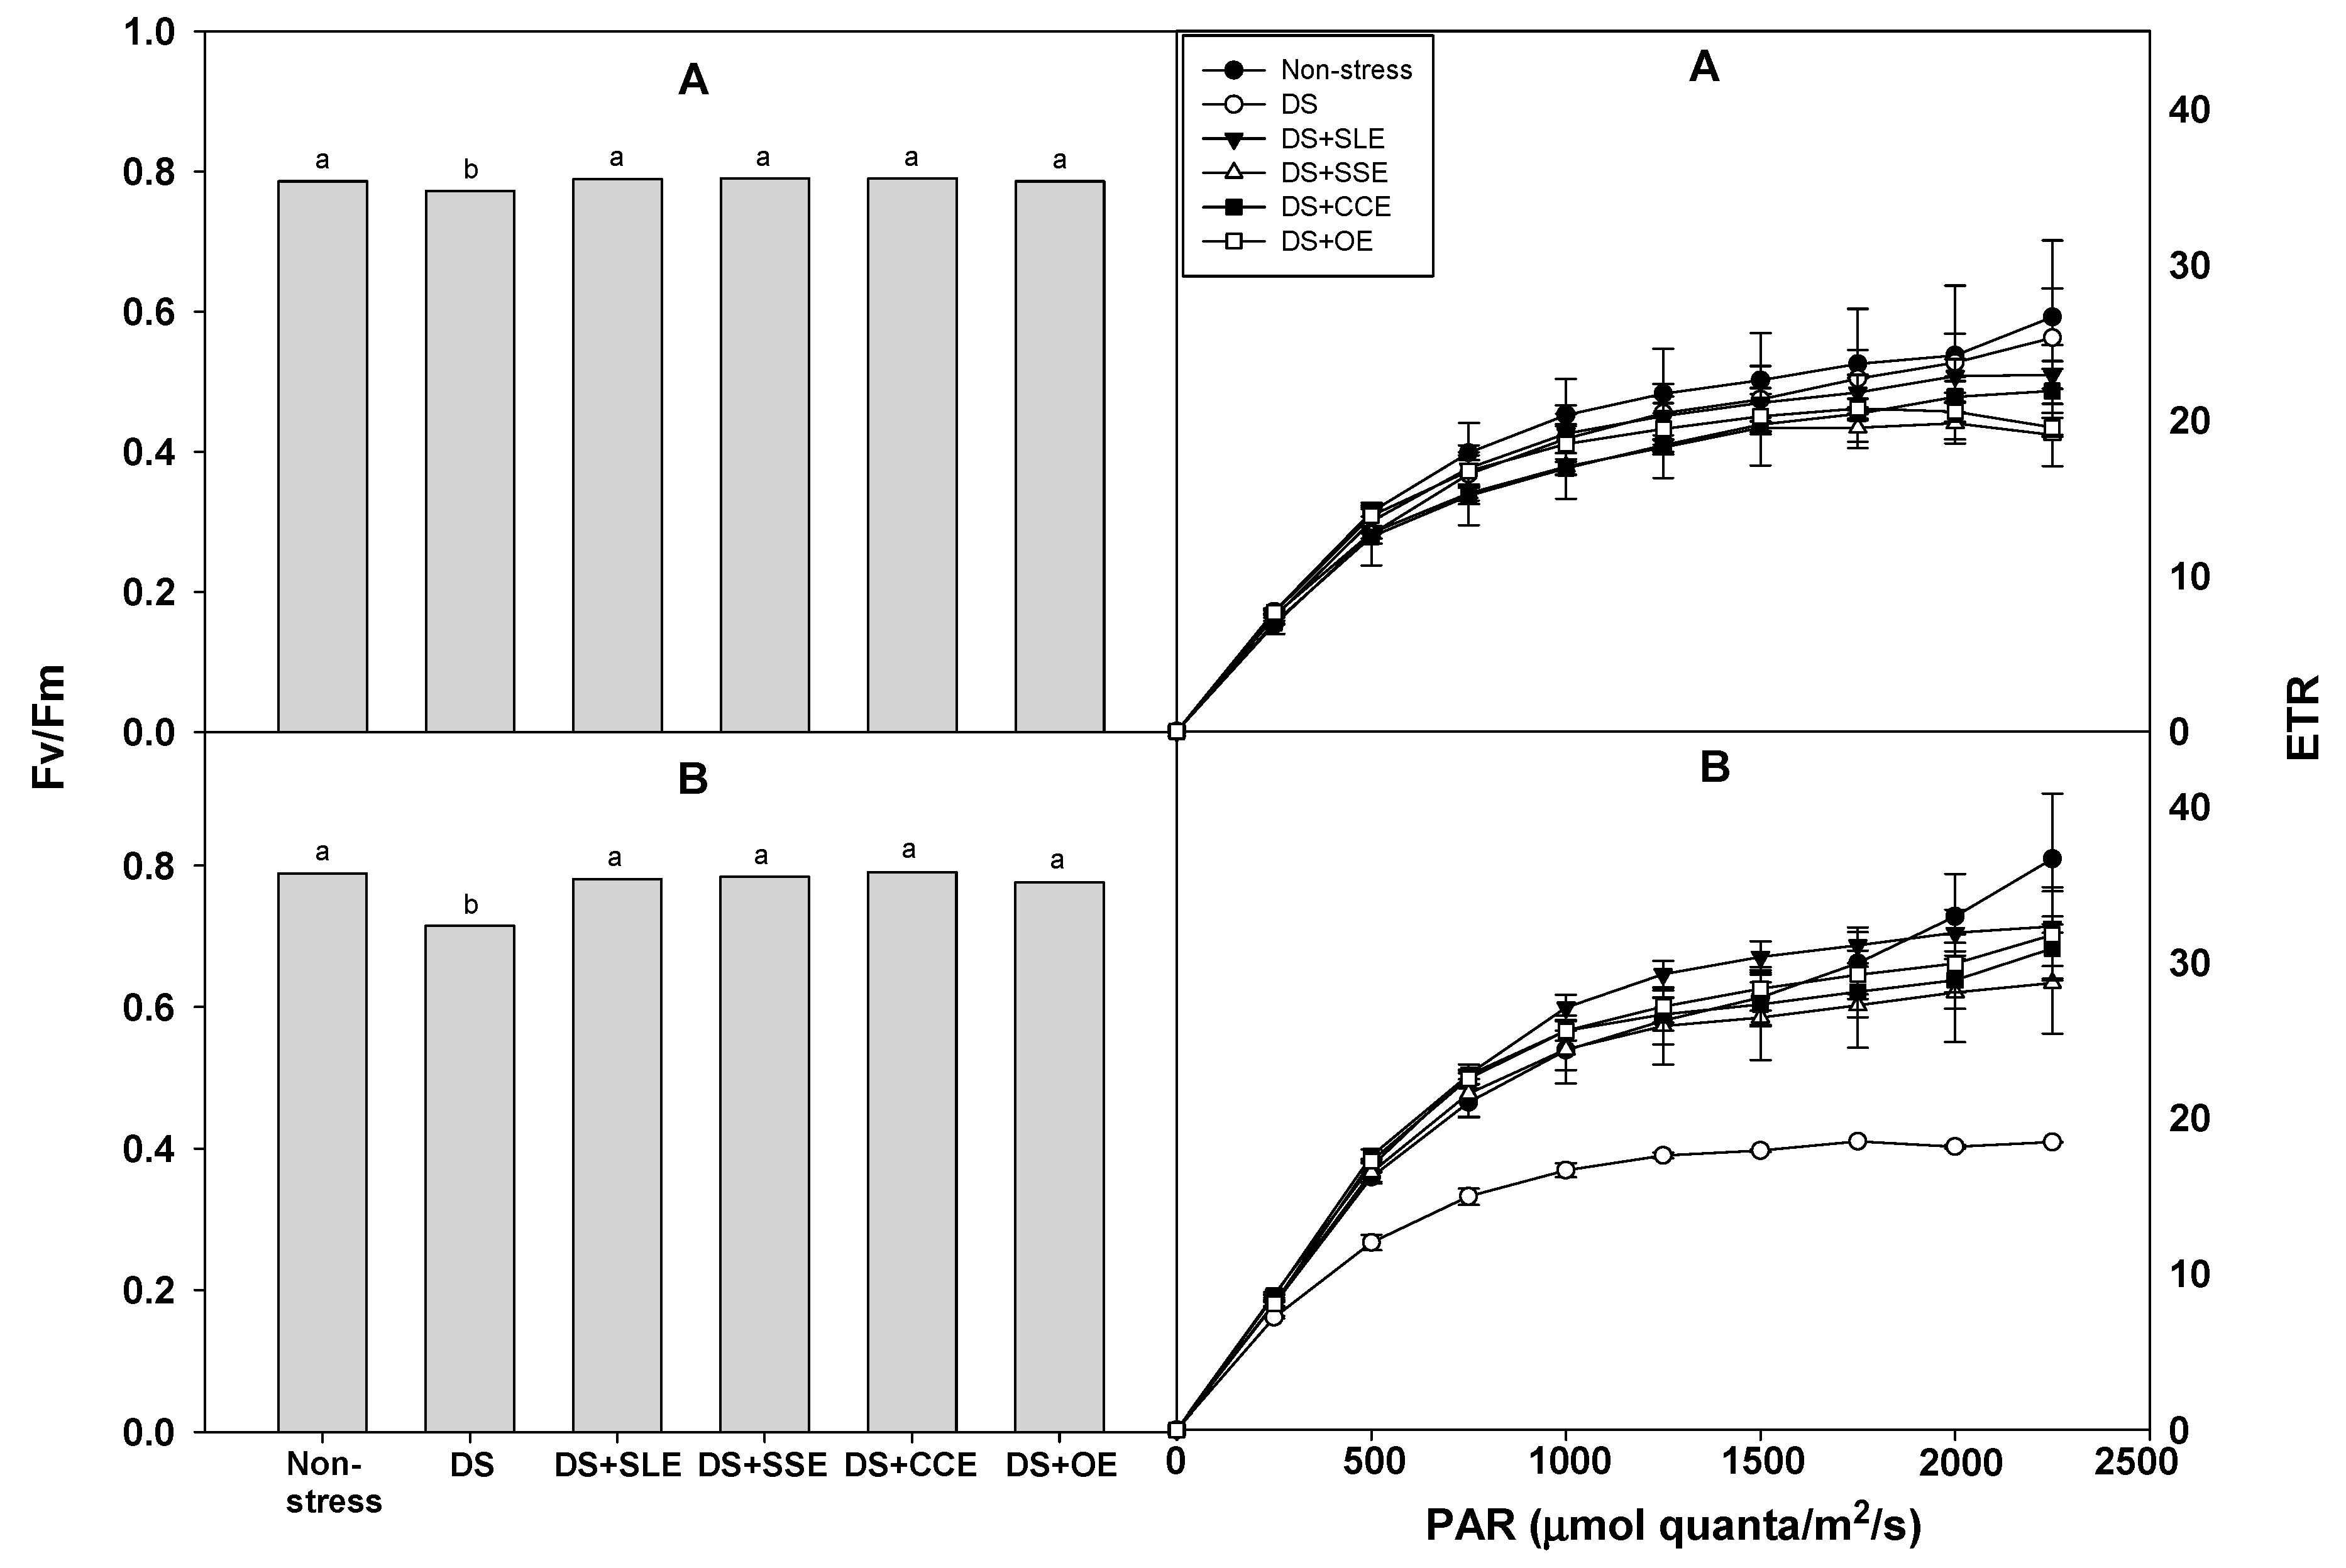
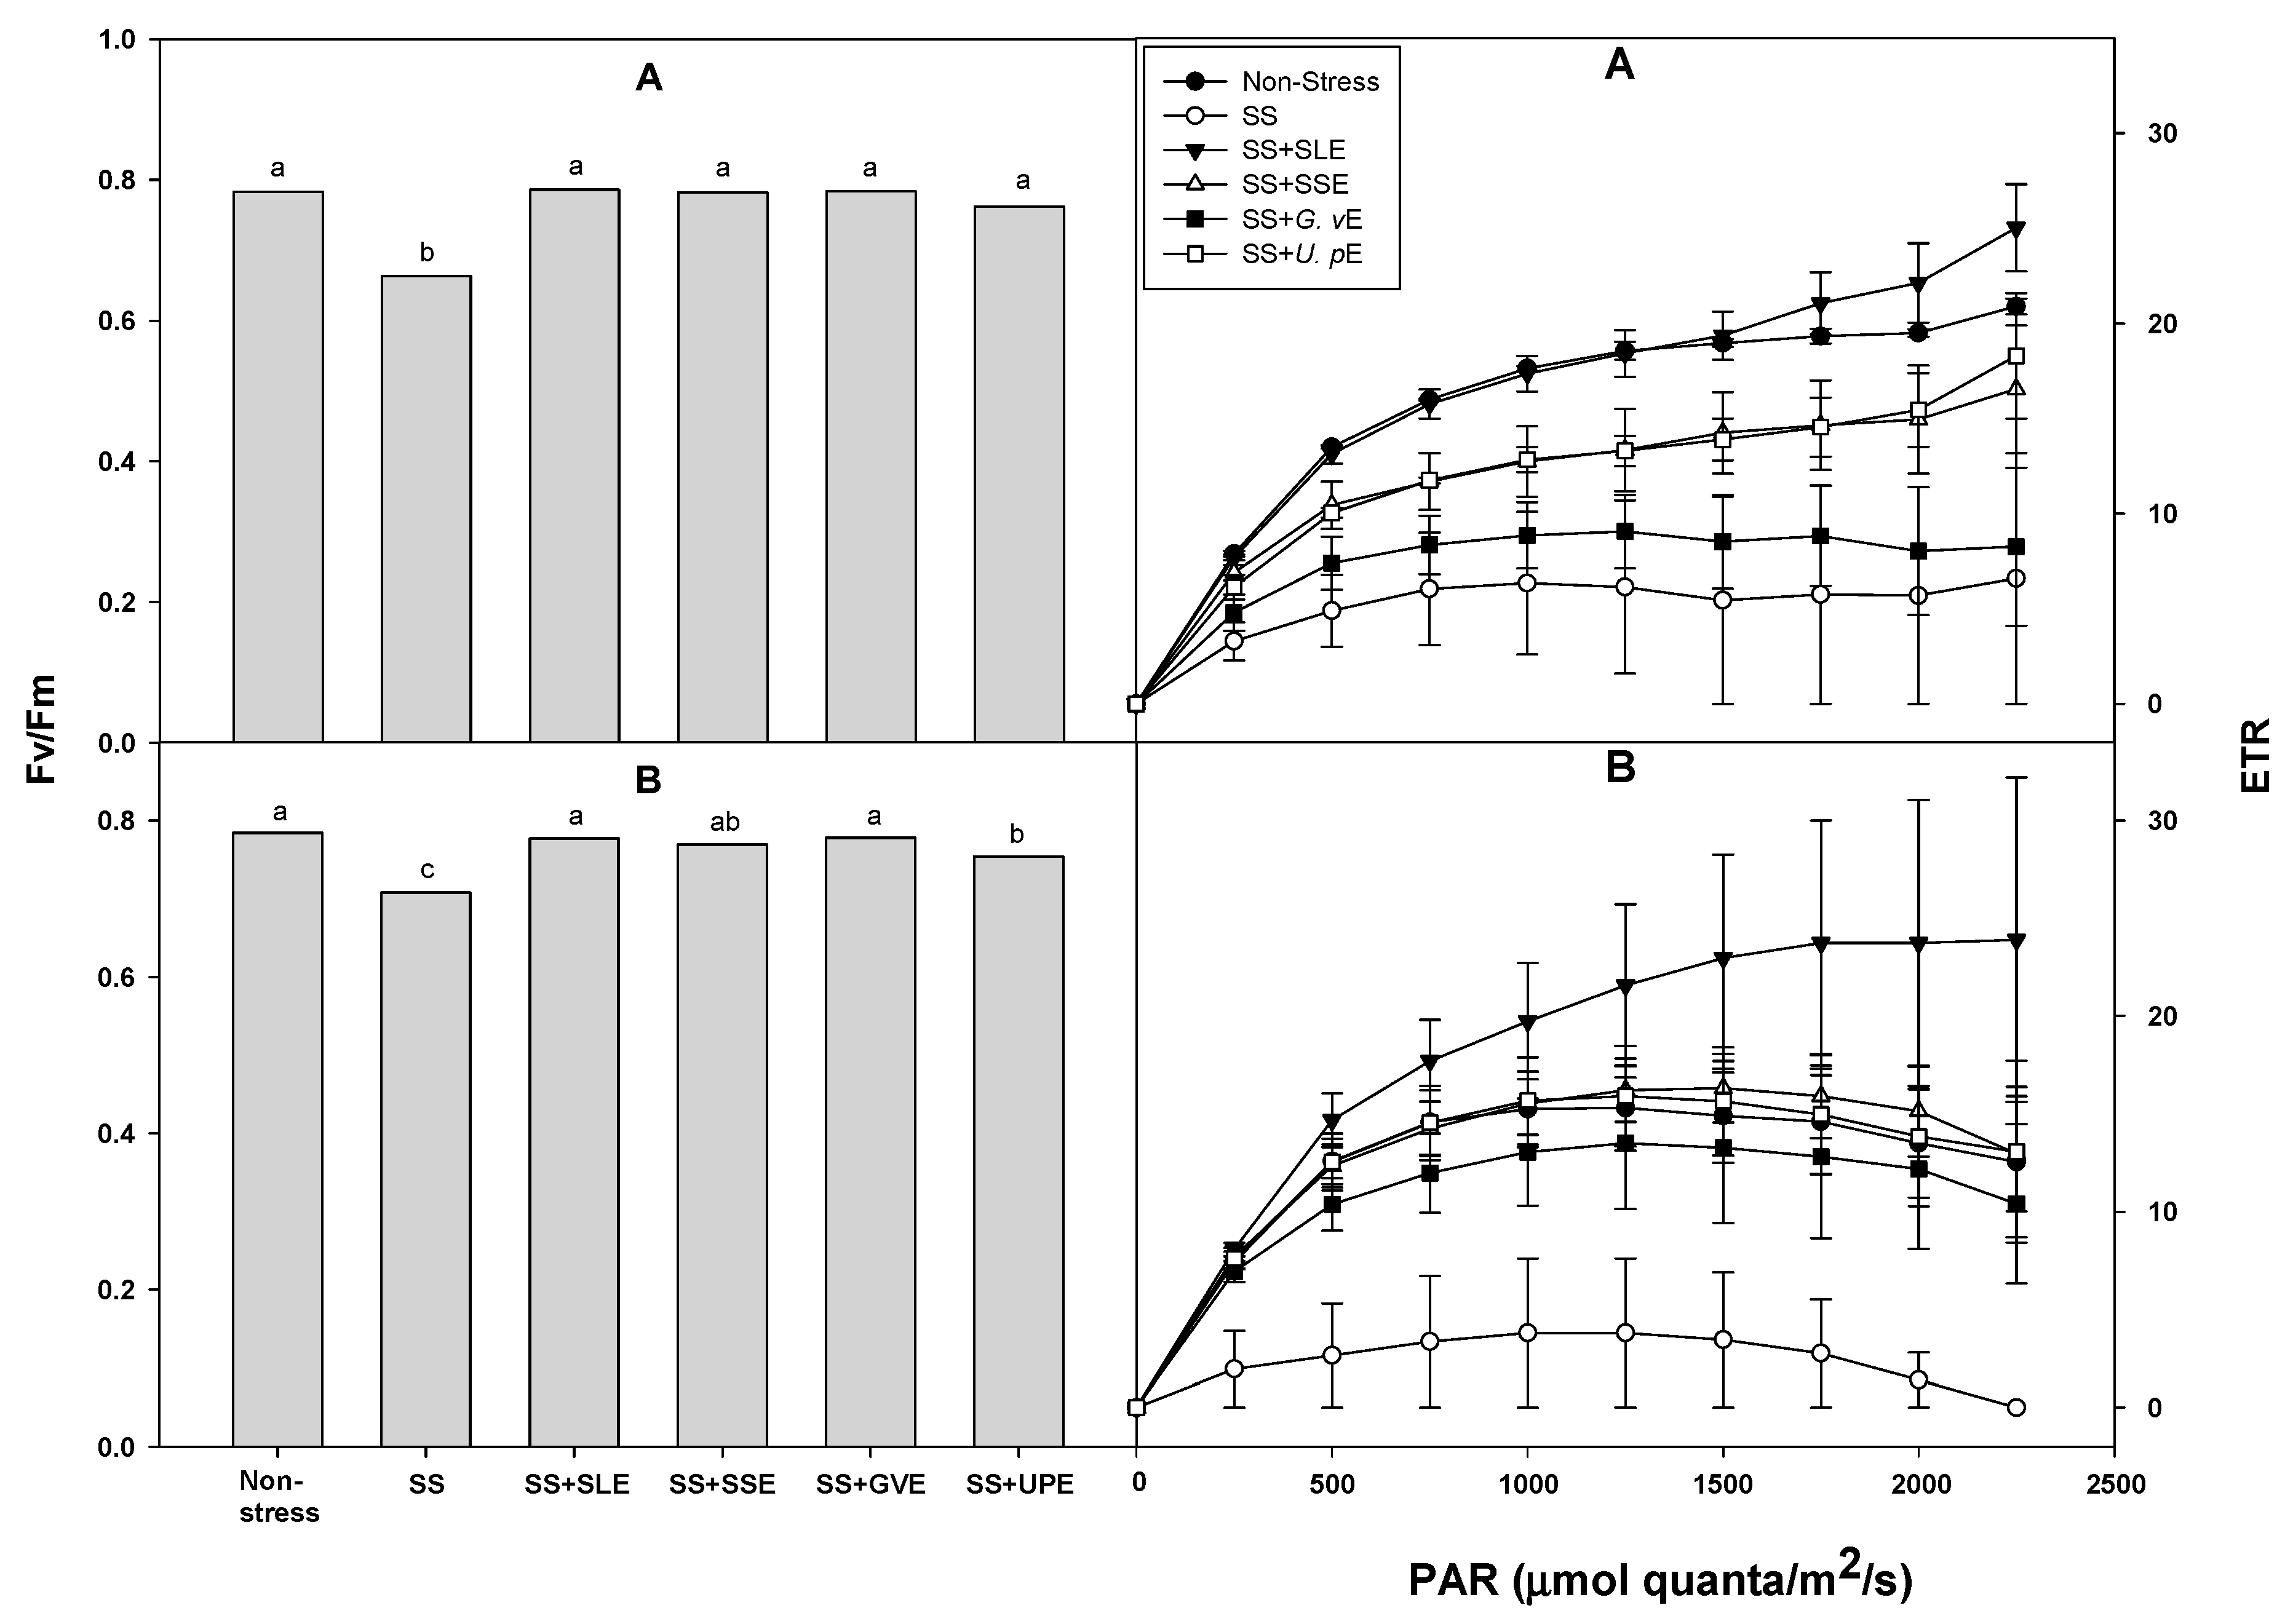
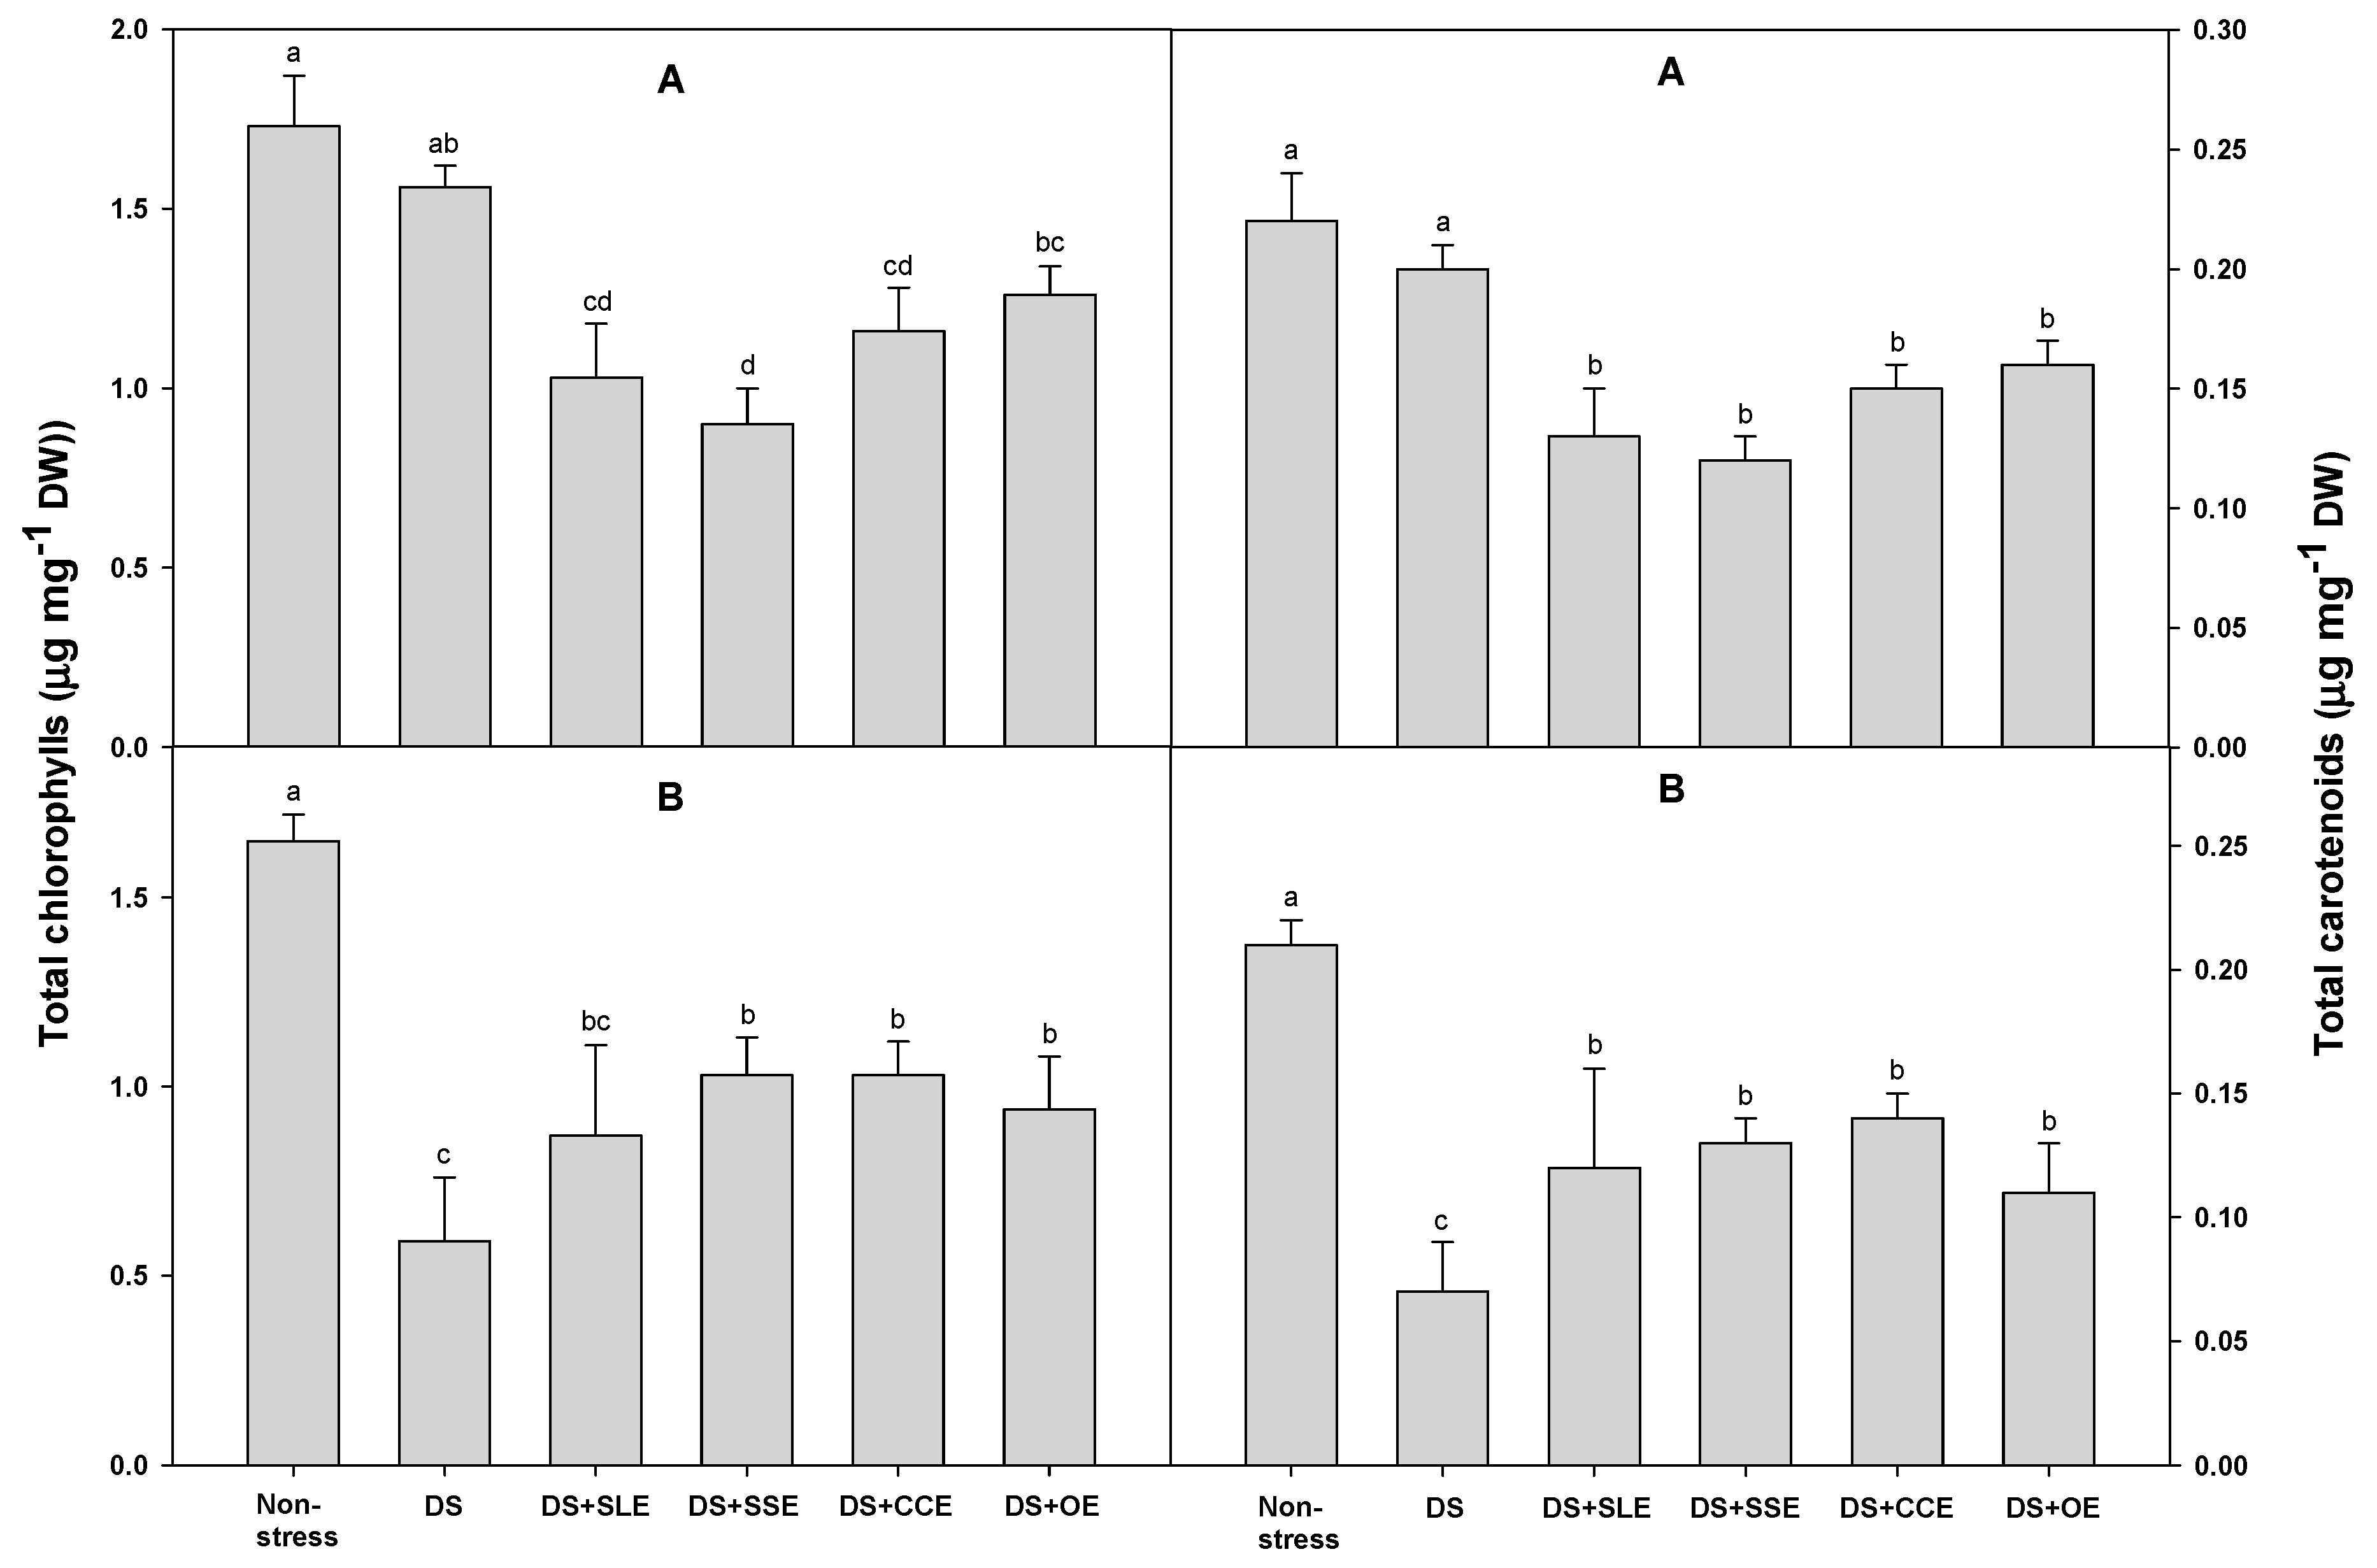
3.3. Effects of Selected Plant Extracts on Photosynthetic Efficiency and Pigments Under Drought and Salt Stress
3.4. Effects of Selected Plant Extracts on Reactive Oxygen Species and Lipid Peroxidation Under Drought and Salt Stress
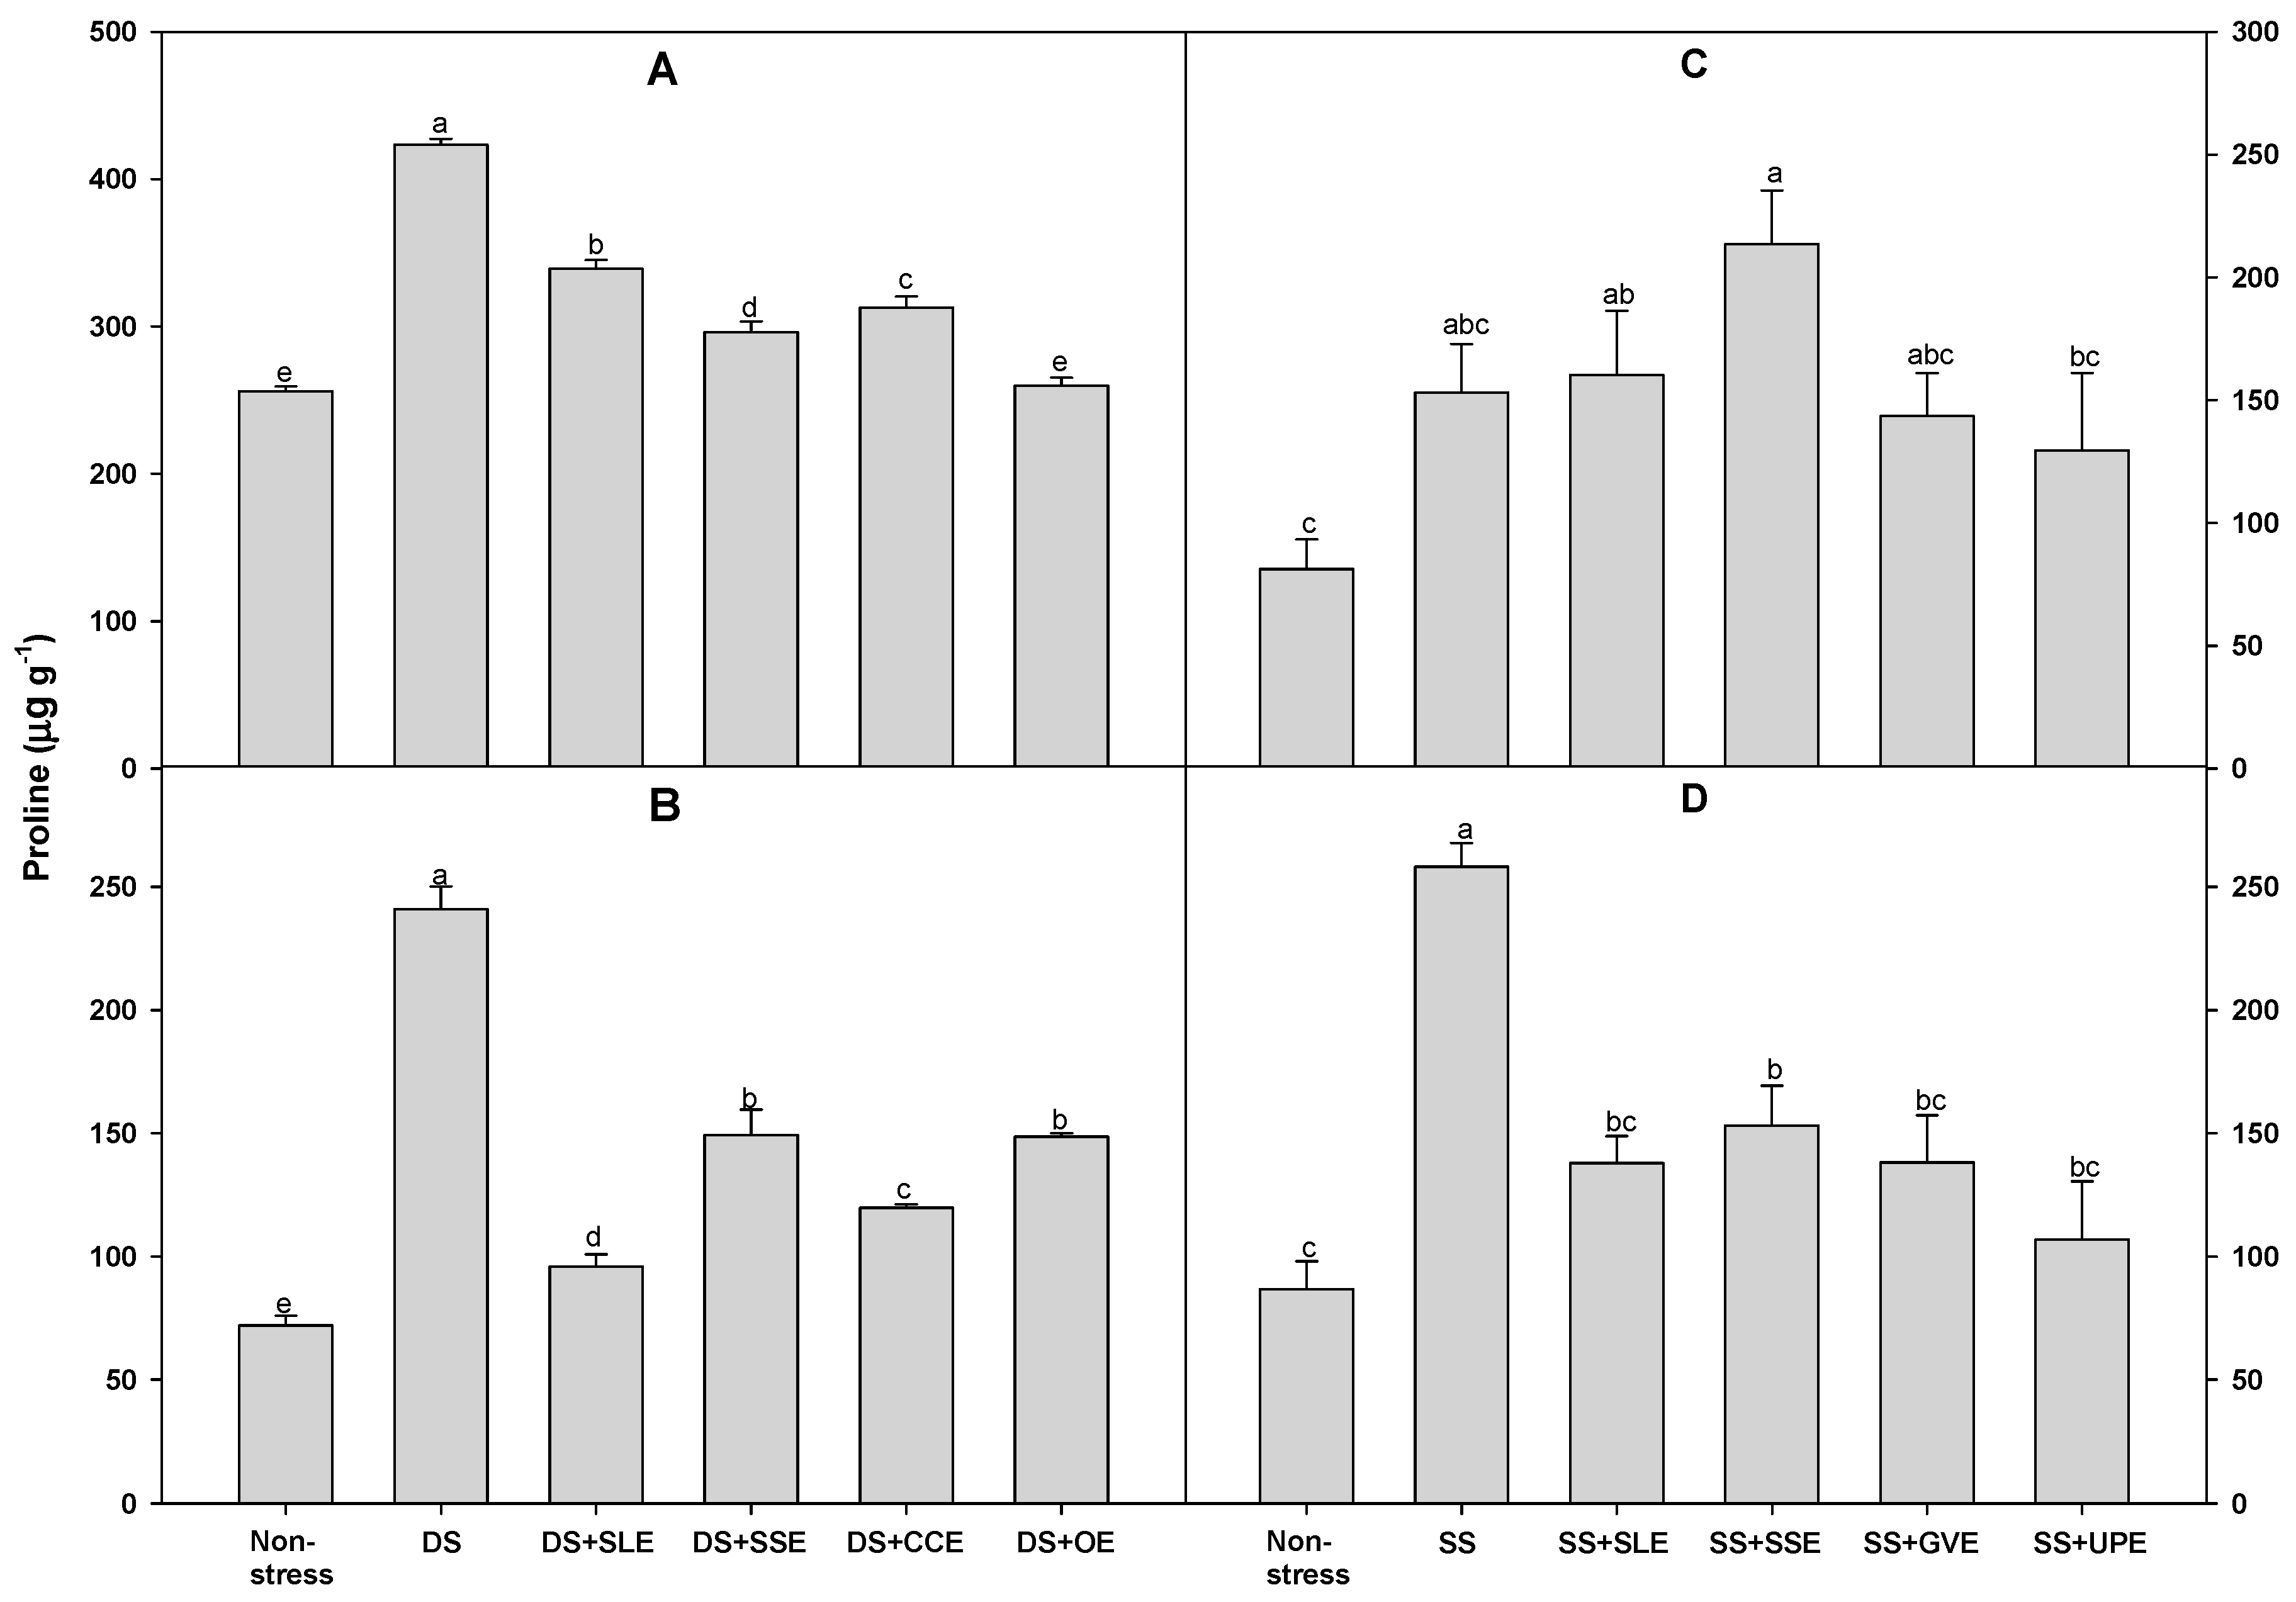
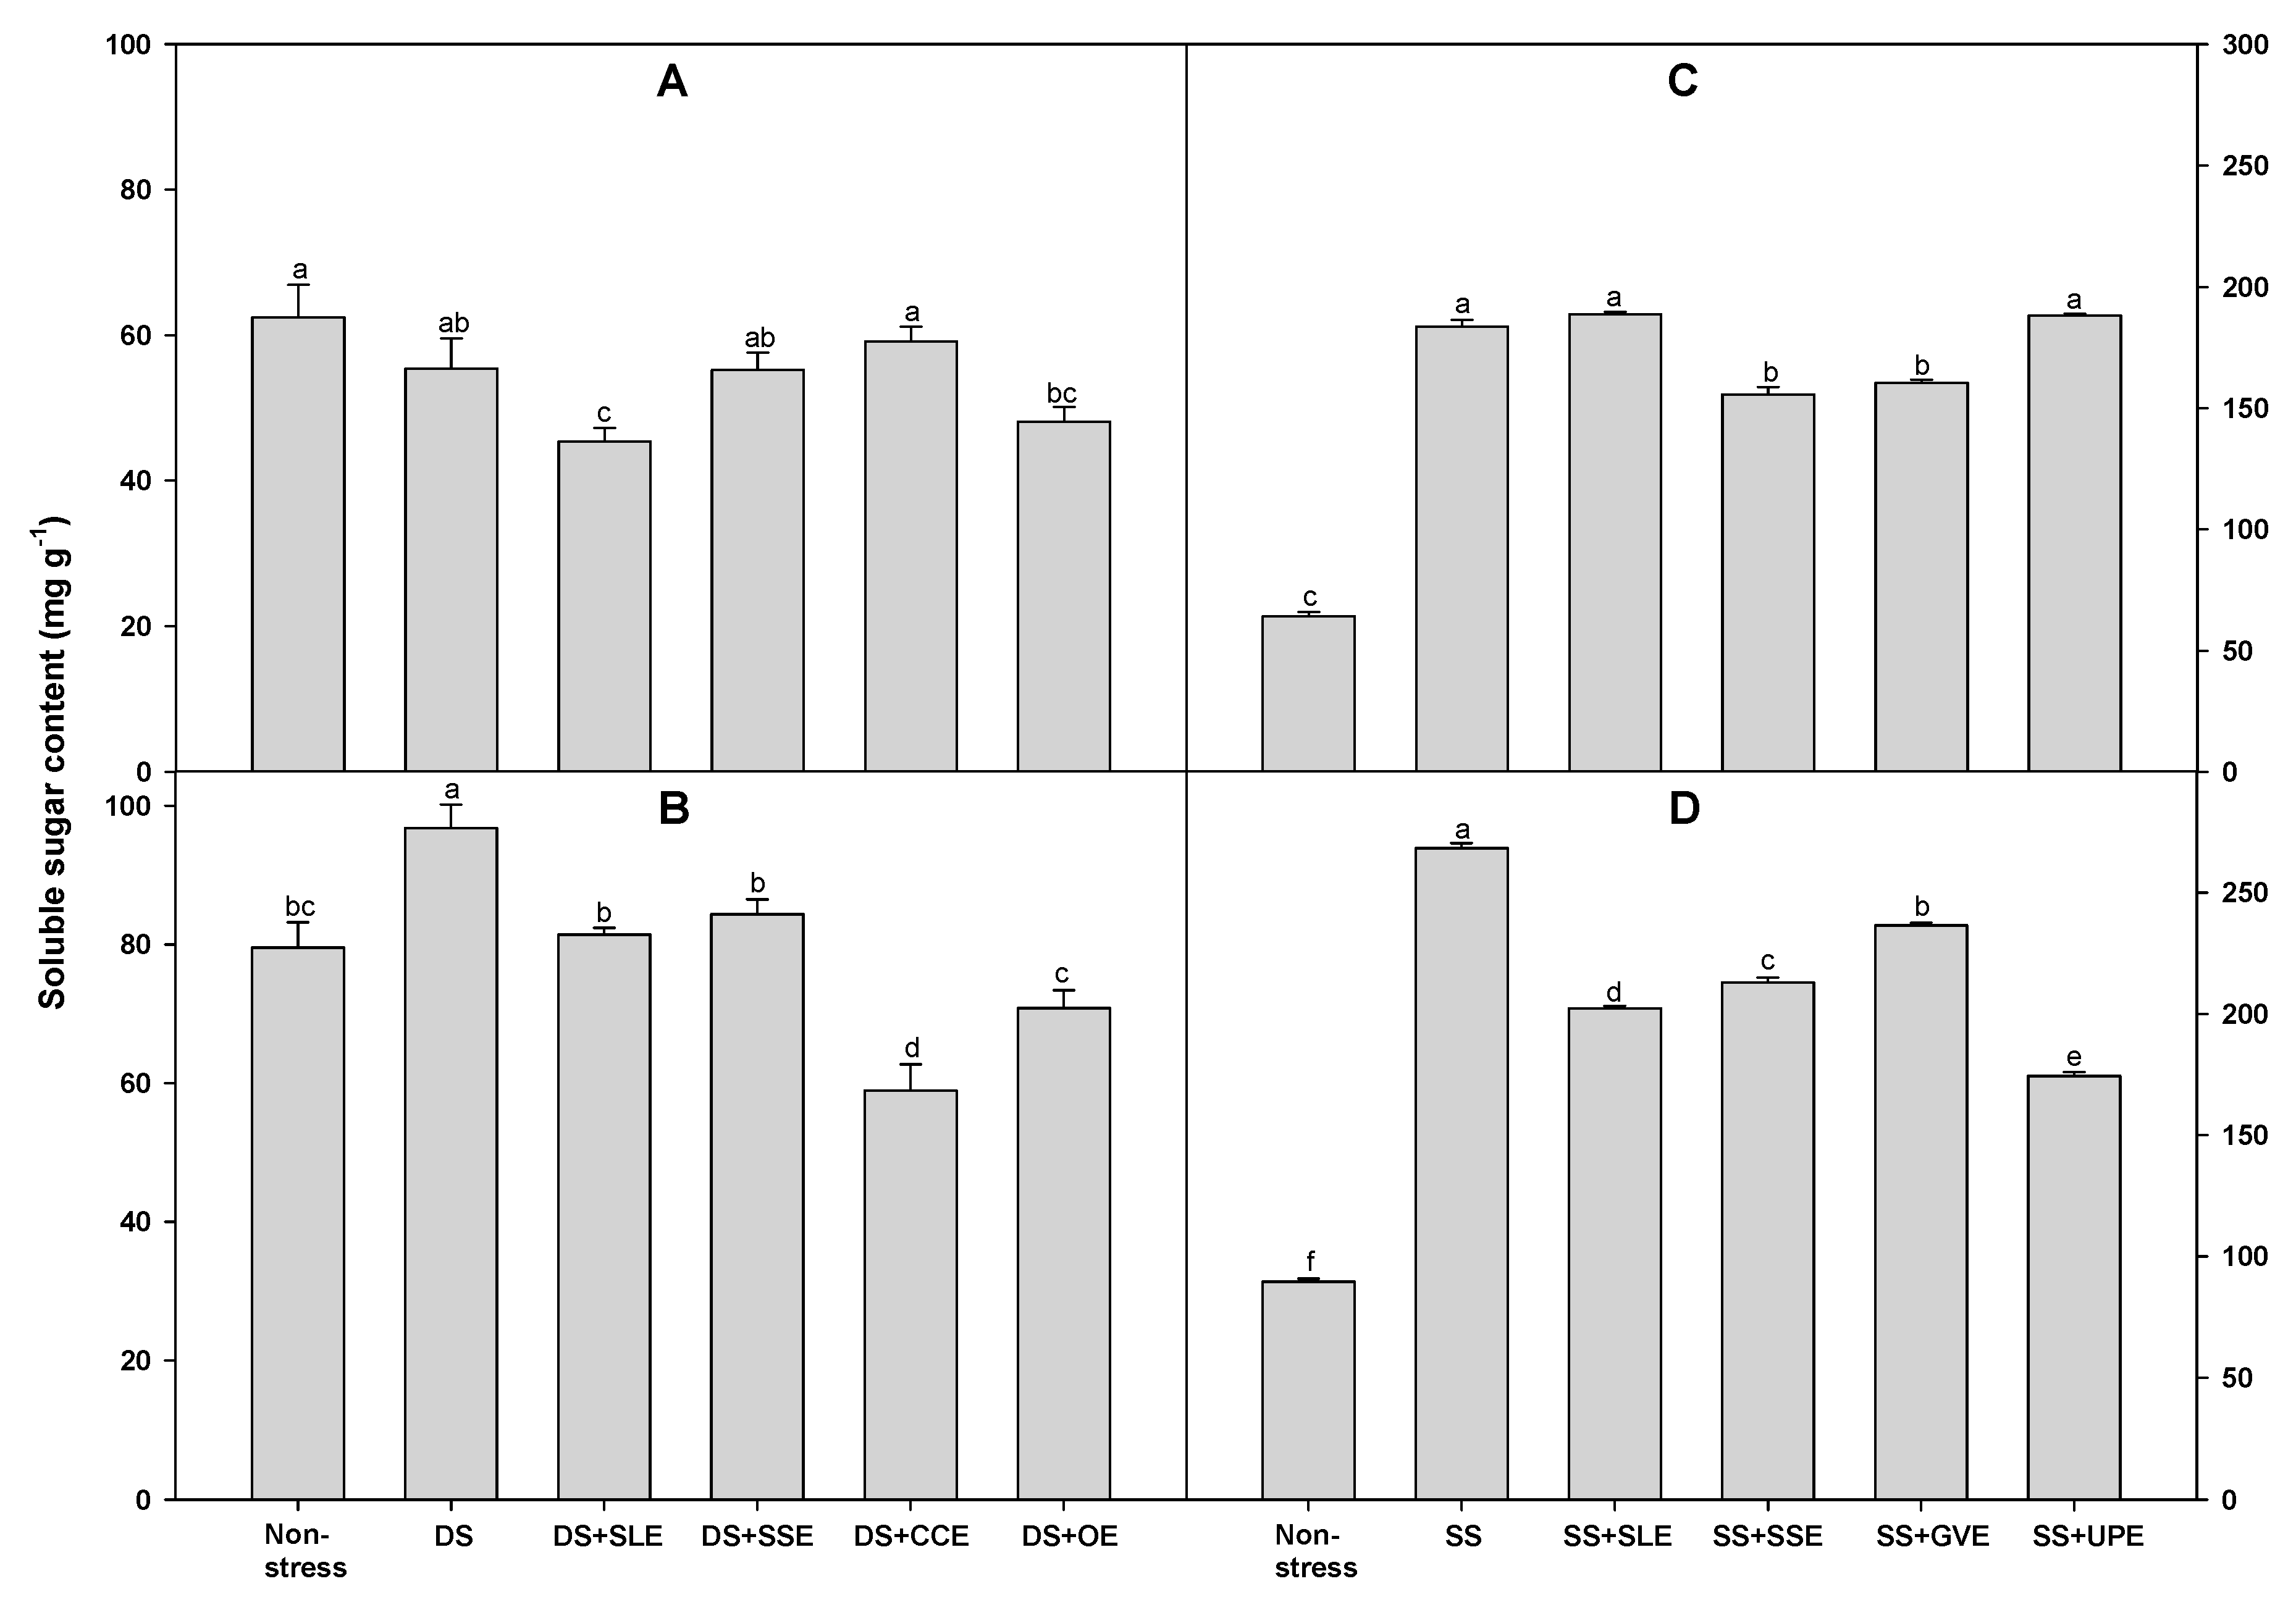
3.5. Effects of Selected Plant Extracts on Proline and Sugar Accumulation Under Drought and Salt Stress
4. Conclusions
Author Contributions
Funding
Institutional Review Board Statement
Informed Consent Statement
Data Availability Statement
Conflicts of Interest
References
- Hadiarto, T.; Tran, L.S.P. Progress studies of drought-responsive genes in rice. Plant Cell Rep. 2010, 30, 297–310. [Google Scholar] [CrossRef] [PubMed]
- Rasheed, A.; Hassan, M.U.; Aamer, M.; Bian, J.M.; Xu, Z.R.; He, X.F.; Wu, Z.M. Iron toxicity, tolerance and quantitative trait loci mapping in rice: A review. Appl. Ecol. Environ. Res. 2020, 18, 7483–7498. [Google Scholar] [CrossRef]
- Rasheed, A.; Fahad, S.; Hassan, M.U.; Tahir, M.M.; Aamer, M.; Wu, Z.M. A review on aluminum toxicity and quantitative trait loci maping in rice (Oryza sativa L). Appl. Ecol. Environ. Res. 2020, 18, 3951–3961. [Google Scholar] [CrossRef]
- Rasheed, A.; Fahad, S.; Aamer, M.; Hassan, M.U.; Tahir, M.M.; Wu, Z.M. Role of genetic factors in regulating cadmium uptake, transport and accumulation mechanisms and quantitative trait loci mapping in rice. Appl. Ecol. Environ. Res. 2020, 18, 4005–4023. [Google Scholar] [CrossRef]
- Swamy, B.P.M.; Kumar, A. Genomics-based precision breeding approaches to improve drought tolerance in rice. Biotechnol. Adv. 2013, 31, 1308–1318. [Google Scholar] [CrossRef]
- Sahebi, M.; Hanafi, M.M.; Rafii, M.Y.; Mahmud, T.M.M.; Azizi, P.; Osman, M.; Abiri, R.; Taheri, S.; Kalhori, N.; Shabanimofrad, M.; Miah, G.; Atabaki, N. Improvement of drought tolerance in rice (Oryza sativa L.): Genetics, genomic tools, and the WRKY gene family. BioMed Res. Int. 2018; 1–20. [Google Scholar]
- Miyan, M.A. Droughts in Asian least developed countries: Vulnerability and sustainability. Weather Clim. Extrem. 2015, 7, 8–23. [Google Scholar] [CrossRef]
- Wang, X.; Liu, H.; Yu, F.; Hu, B.; Jia, Y.; Sha, H.; Zhao, H. Differential activity of the antioxidant defence system and alterations in the accumulation of osmolyte and reactive oxygen species under drought stress and recovery in rice (Oryza sativa L.) tillering. Sci. Rep. 2019, 9, 8543. [Google Scholar] [CrossRef] [PubMed]
- Sharma, A.; Zheng, B. Melatonin mediated regulation of drought stress: Physiological and molecular aspects. Plants 2019, 8, 190. [Google Scholar] [CrossRef]
- Assouline, S.; Russo, D.; Silber, A.; Or, D. Balancing water scarcity and quality for sustainable irrigated agriculture. Water Resour. Res. 2015, 51, 3419–3436. [Google Scholar] [CrossRef]
- Qadir, M.; Quillerou, E.; Nangia, V.; Murtaza, G.; Singh, M.; Thomas, R.J.; Drechsel, P.; Noble, A.D. Economics of salt-induced land degradation and restoration. Nat. Resour. Forum 2014, 38, 282–295. [Google Scholar] [CrossRef]
- Tanou, G.; Job, C.; Rajjou, L.; Arc, E.; Belghazi, M.; Diamantidis, G.; Molassiotis, A.; Job, D. Proteomics reveals the overlapping roles of hydrogen peroxide and nitric oxide in the acclimation of citrus plants to salinity. Plant J. 2009, 60, 795–804. [Google Scholar] [CrossRef]
- Ahmad, P.; Jalee, C.A.; Salem, M.A.; Nabi, G.; Sharma, S. Roles of Enzymatic and non-enzymatic antioxidants in plants during abiotic stress. Crit. Rev. Biotechnol. 2010, 30, 161–175. [Google Scholar] [CrossRef]
- Lobell, D.B.; Banziger, M.; Magorokosho, C.; Vivek, B. Nonlinear heat effects on African maize as evidenced by historical yield trials. Nat. Clim. Chang. 2011, 1, 42–45. [Google Scholar] [CrossRef]
- Cardil, A.; Molina, D.M.; Kobziar, L.N. Extreme temperature days and potential impacts in Southern Europe. Nat. Hazards Earth Syst. Sci. 2014, 14, 3005–3014. [Google Scholar] [CrossRef]
- Lobell, D.B.; Roberts, M.J.; Schlenker, W.; Braun, N.; Little, B.B.; Rejesus, R.M.; Hammer, G.L. Greater sensitivity to drought accompanies maize yield increase in the US Midwest. Science 2014, 344, 516–519. [Google Scholar] [CrossRef]
- Papworth, A.; Maslin, M.; Randalls, S. Is climate change the greatest threat to global health? Geogr. J. 2015, 181, 413–422. [Google Scholar] [CrossRef]
- Senaratna, T.; Touchell, D.; Bunn, E.; Dixon, K. Acetyl salicylic acid (aspirin) and salicylic acid induce multiple stress tolerance in bean and tomato plant. Plant Growth Regul. 2000, 30, 157–161. [Google Scholar] [CrossRef]
- Farooq, M.; Wahid, A.; Kobayashi, N.; Fujita, D.; Basra, S.M.A. Plant drought stress: Effects, mechanisms and management. Agron. Sustain. Dev. 2009, 29, 185–212. [Google Scholar] [CrossRef]
- Abdel Latef, A.A.H.; Srivastava, A.K.; Saber, H.; Alwaleed, E.A.; Tran, L.-S.P. Sargassum muticum and Jania rubens regulate amino acid metabolism to improve growth and alleviate salinity in chickpea. Sci. Rep. 2017, 7, 10537. [Google Scholar] [CrossRef]
- Battacharyya, D.; Babgohari, M.Z.; Rathor, P.; Prithiviraj, B. Seaweed extracts as biostimulants in horticulture. Sci. Hortic. 2015, 196, 39–48. [Google Scholar] [CrossRef]
- Craigie, J.S. Seaweed extract stimuli in plant science and agriculture. J. Appl. Phycol. 2011, 23, 371–393. [Google Scholar] [CrossRef]
- Chouliaras, V.; Tasioula, M.; Chatzissavvidis, C.; Therios, I.; Tsabolatidou, E. The effects of a seaweed extract in addition to nitrogen and boron fertilization on productivity, fruit maturation, leaf nutritional status and oil quality of the olive (Olea europaea L.) cultivar Koroneiki. J. Sci. Food Agric. 2009, 89, 984–988. [Google Scholar] [CrossRef]
- Demir, N.; Dural, B.; Yildirim, K. Effect of seaweed suspensions on seed germination of tomato, pepper and aubergine. J. Biol. Sci. 2006, 6, 1130–1133. [Google Scholar]
- Khan, W.; Rayirath, U.P.; Subramanian, S.; Jithesh, M.N.; Rayorath, P.; Hodges, D.M.; Critchley, A.T.; Craigie, J.S.; Norrie, J.; Prithiviraj, B. Seaweed extracts as biostimulants of plant growth and development. J. Plant Growth Regul. 2009, 28, 386–399. [Google Scholar] [CrossRef]
- Manna, D.; Sarkar, A.; Maity, T.K. Impact of biozyme on growth, yield and quality of chilli (Capsicum annuum L.). J. Crop Weed 2012, 8, 40–43. [Google Scholar]
- Zheng, S.; Jiang, J.; He, M.; Zou, S.; Wang, C. Effect of kelp waste extracts on the growth and development of pakchoi (Brassica chinensis L. ). Sci. Rep. 2016, 6, 38683. [Google Scholar] [CrossRef] [PubMed]
- Aziz, N.; Mahgoub, M.; Siam, Z. Growth, flowering and chemical constituents performance of Amaranthus tricolor plants as influenced by seaweed (Ascophyllum nodosum) extract application under salt stress conditions. J. Appl. Sci. Res. 2011, 7, 1472–1484. [Google Scholar]
- Santaniello, A.; Scartazza, A.; Gresta, F.; Loreti, E.; Biasone, A.; Di Tommaso, D.; Piaggesi, A.; Perata, P. Ascophyllum nodosum seaweed extract alleviates drought stress in Arabidopsis by affecting photosynthetic performance and related gene expression. Front. Plant Sci. 2017, 8, 1362. [Google Scholar] [CrossRef] [PubMed]
- Shukla, P.S.; Shotton, K.; Norman, E.; Neily, W.; Critchley, A.T.; Prithiviraj, B. Seaweed extracts improve drought tolerance of soybeans by regulating stress-response genes. AoB Plants, 2017; 10, plx051. [Google Scholar]
- Layek, J.; Das, A.; Idapuganti, R.G.; Sarkar, D.; Ghosh, A.; Zodape, S.T.; Lal, R.; Yavad, G.S.; Panwar, A.S.; Ngachan, S.; Meena, R.S. Seaweed extract as organic bio-stimulant improves productivity and quality of rice in eastern Himalayas. J. Appl. Phycol. 2018, 30, 547–558. [Google Scholar] [CrossRef]
- Sharma, L.; Banerjee, M.; Malik, G.C.; Gopalakrishnan, V.A.K.; Zodape, S.T.; Ghosh, A. Sustainable agro-technology for enhancement of rice production in the red and lateritic soils using seaweed based biostimulants. J. Clean. Prod. 2017, 149, 968–975. [Google Scholar] [CrossRef]
- Jang, S.J. Control of diseases, insects, and weeds and growth promotion of crops by useful plant extracts. Ph.D. dissertation, South Korea: Sunchon National University, Suncheon, Republic of Korea, 2017; p. 205.
- Moon, G.S.; Ryu, B.M.; Lee, M.J. Components and antioxidant activities of Buchu (Chinese chives) harvested at different times. Korean J. Food Sci. Technol. 2003, 35, 493–98. [Google Scholar]
- Stutte, C.A.; Park, H. Effects of nitrogen source on PRE-point and free amino acids in soybean leaves different in phosphorus sensitivity. Kor. J. Soil Sci. Fertil. 1973, 6, 239–44. [Google Scholar]
- Porter, P.; Banwart, W.L.; Hassett, J.J. Phenolic acids and flavonoids in soybean root and leaf extracts. Environ. Exp. Bot. 1985, 26, 65–73. [Google Scholar] [CrossRef]
- Morsy, S.M.; Drgham, E.A.; Mohamed, G.M. Effect of garlic and onion extracts or their intercropping on suppressing damping-off and powdery mildew diseases and growth characteristics of cucumber. Egyptian J. Phytopathol. 2009, 37, 35–46. [Google Scholar]
- Khan, S.H.; Khan, A.; Litaf, U.; Shah, A.S.; Khan, M.A.; Bilal, M.; Ali, M.U. Effect of drought stress on tomato cv. Bombino. J. Food Process. Technol. 2015, 6, 7. [Google Scholar] [CrossRef]
- Hiscox, J.D.; Israelstam, G.F. A method for the extraction of chlorophyll from leaf tissue without maceration. Can. J. Bot. 1979, 57, 1332–1334. [Google Scholar] [CrossRef]
- Elstner, E.F.; Heupel, A. Inhibition of nitrite formation from hydroxylammonium chloride: a simple assay for superoxide dismutase. Anal. Biochem. 1976, 70, 616–620. [Google Scholar] [CrossRef]
- Jana, S.; Choudhuri, M.A. Glycolate metabolism of three submerged aquatic angiosperms during aging. Aquat. Bot. 1982, 12, 345–354. [Google Scholar] [CrossRef]
- Buege, J.A.; Aust, S.D. Microsomal lipid peroxidation. Meth. Enzymol. 1978, 52, 302–310. [Google Scholar] [CrossRef]
- Du, Z.; Bramlage, W.J. Modified thiobarbituric acid assay measuring lipid oxidation in sugar-rich plant tissue extracts. J. Agric. Food Chem. 1992, 40, 1566–1570. [Google Scholar] [CrossRef]
- Xu, W.; Cui, K.; Xu, A.; Nie, L.; Huang, J.; Peng, S. Drought stress condition increases root to shoot ratio via alteration of carbohydrate partitioning and enzymatic activity in rice seedlings. Acta Physiol. Plant. 2015, 37, 9. [Google Scholar] [CrossRef]
- Ohashi, Y.; Nakayama, N.; Saneoka, H.; Fujita, K. Effects of drought stress on photosynthetic gas exchange, chlorophyll fluorescence and stem diameter of soybean plants. Biol. Plant. 2006, 50, 138–141. [Google Scholar] [CrossRef]
- Bhatt, R.M.; Rao, N.K.S. Influence of pod load on response of okra to water stress. Indian J. Plant Physiol. 2005, 10, 54–59. [Google Scholar]
- Razmjoo, K.; Heydarizadeh, P.; Sabzalian, M.R. Effect of salinity and drought stresses on growth parameters and essential oil content of Matricaria chamomile. Int. J. Agric. Biol. 2008, 10, 451–454. [Google Scholar]
- Fan, D.; Hodges, D.M.; Critchley, A.T.; Prithiviraj, B. A commercial extract of brown macroalga (Ascophyllum nodosum) affects yield and the nutritional quality of spinach in vitro. Commun. Soil Sci. Plant Anal. 2013, 44, 1873–1884. [Google Scholar] [CrossRef]
- Kasim, W.A.; Hamada, E.A.; El-Din, N.S.; Eskander, S. Infuence of seaweed extracts on the growth, some metabolic activities and yield of wheat grown under drought stress. Int. J. Agron. Agric. Res. 2015, 7, 173–189. [Google Scholar]
- Yasmeen, A.; Basra, S.M.A.; Farooq, M.; Rehman, H.; Hussain, N.; Athar, H.R. Exogenous application of moringa leaf extract modulates the antioxidant enzyme system to improve wheat performance under saline conditions. Plant Growth Regul. 2013, 69, 225–233. [Google Scholar] [CrossRef]
- Chanthini, K.M.-P.; Senthil-Nathan, S.; Stanley-Raja, V.; Thanigaivel, A.; Karthi, S.; Sivanesh, H.; Sundar, N.S.; Palanikani, R.; Soranam, R. Chaetomorpha antennina (Bory) Kützing derived seaweed liquid fertilizers as prospective bio-stimulant for Lycopersicon esculentum (Mill). Biocatal. Agric. Biotechnol. 2019, 20, 101190. [CrossRef]
- Lorenzo, P.; Souza-Alonso, P.; Guisande-Collazob, A.; Freitasa, H. Influence of Acacia dealbata Link bark extracts on the growth of Allium cepa L. plants under high salinity conditions. J. Sci. Food Agric. 2019, 99, 4072–4081. [Google Scholar] [CrossRef]
- Hammad, S.A. Physiological and anatomical studies on drought tolerance of pea plants by application of some natural extracts. Annals Agric. Science 2008, 53, 285–305. [Google Scholar]
- Farooq, M.; Rizwan, M.; Nawaz, A.; Rehman, A.; Ahmad, R. Application of natural plant extracts improves the tolerance against combined terminal heat and drought stresses in bread wheat. J. Agron. Crop Sci. 2017, 203, 528–538. [Google Scholar] [CrossRef]
- Gupta, A.; Rico-Medina, A.; Caño-Delgado, A.I. The physiology of plant responses to drought. Science 2020, 368, 266–269. [Google Scholar] [CrossRef] [PubMed]
- Rao, D.E.; Chaitanya, K.V. Photosynthesis and antioxidative defense mechanisms in deciphering drought stress tolerance of crop plants. Biol. Plant 2016, 60, 201–218. [Google Scholar] [CrossRef]
- Nezhadahmadi, A.; Prodhan, Z.H.; Faruq, G. Drought tolerance in wheat. Sci. World J. 2013, 610721. [Google Scholar] [CrossRef] [PubMed]
- Haimeirong; Kubota, F.; Yoshimura, Y. Estimation of photosynthetic activity from the electron transport rate of photosystem 2 in a film-sealed leaf of sweet potato, Ipomoea batatas Lam. Photosynthetica 2002, 40, pp. 337–341. [CrossRef]
- Zhu, R.; Wu, F.Y.; Zhou, S.; Hu, T.; Huang, J.; Gao, Y. Cumulative effects of drought-flood abrupt alternation on the photosynthetic characteristics of rice. Environ. Exp. Bot. 2020, 169, 103901. [Google Scholar] [CrossRef]
- Cuellar-Ortiz, S.M.; De La Paz Arrieta-Montiel, M.; Acosta-Gallegos, J.; Covarrubias, A.A. Relationship between carbohydrate partitioning and drought resistance in common bean. Plant Cell Environ. 2008, 31, 1399–1409. [Google Scholar] [CrossRef] [PubMed]
- Rahdari, P.; Hoseini, S.M.; Tavakoli, S. The studying effect of drought stress on germination, proline, sugar, lipid, protein and chlorophyll content in Purslane (Portulaca oleraceae L.) leaves. J. Med. Plants Res. 2012, 6, 1539–1547. [Google Scholar] [CrossRef]
- Anjum, S.A.; Xie, X.-Y.; Wang, L.-C.; Saleem, M.F.; Man, C.; Lei, W. Morphological, physiological and biochemical responses of plants to drought stress. Afr. J. Agric. Res. 2011, 6, 2026–2032. [Google Scholar] [CrossRef]
- Zhang, J.; Kirkham, M.B. Antioxidant responses to drought in sunflower and sorghum seedlings. New Phytol. 1996, 132, 361–373. [Google Scholar] [CrossRef]
- Karimpour, M. Effect of drought stress on RWC and chlorophyll content on wheat (Triticum durum L.) genotypes. World. Ess. J. 2019, 7, 52–56. [Google Scholar]
- Blunden, G.; Jenkins, T.; Liu, Y. Enhanced leaf chlorophyll levels in plants treated with seaweed extract. J. Appl. Phycol. 1997, 8, 535–543. [Google Scholar] [CrossRef]
- Jannin, L.; Arkoun, M.; Etienne, P.; Laîné, P.; Goux, D.; Garnica, M.; Fuentes, M.; Francisco, S.S.; Baigorri, R.; Cruz, F. Brassica napus growth is promoted by Ascophyllum nodosum (L.) Le Jol. seaweed extract: microarray analysis and physiological characterization of N, C, and S metabolisms. J. Plant Growth Regul. 2013, 32, 31–52. [Google Scholar] [CrossRef]
- Fan, D.; Hodges, D.M.; Critchley, A.T.; Prithiviraj, B. A commercial extract of brown macroalga (Ascophyllum nodosum) affects yield and the nutritional quality of spinach in vitro. Commun. Soil Sci. Plant Anal. 2013, 44, 1873–1884. [Google Scholar] [CrossRef]
- Mancuso, S.; Azzarello, E.; Mugnai, S.; Briand, X. Marine bioactive substances (IPA extract) improve foliar ion uptake and water stress tolerance in potted Vitis vinifera plants. Adv. Hortic. Sci. 2006, 20, 156–161. [Google Scholar]
- Sivasankari, S.; Venkatesalu, V.; Anantharaj, M.; Chandrasekaran, M. Effect of seaweed extracts on the growth and biochemical constituents of Vigna sinensis. Bioresour. Technol. 2006, 97, 1745–175. [Google Scholar] [CrossRef]
- Spinelli, F.; Fiori, G.; Noferini, M.; Sprocatti, M.; Costa, G. A novel type of seaweed extract as a natural alternative to the use of iron chelates in strawberry production. Sci. Hortic. 2010, 125, 263–269. [Google Scholar] [CrossRef]
- Gill, S.S.; Tuteja, N. Reactive oxygen species and antioxidant machinery in abiotic stress tolerance in crop plants. Plant Physiol. Biochem. 2010, 48, 909–930. [Google Scholar] [CrossRef]
- Hernandez, J.A.; Jimene, A.; Mullineaux, P.; Sevilla, F. Tolerance of pea (Pisum sativum L.) to long term stress is associated with induction of antioxidant defences. Plant Cell Environ. 2000; 23, 853–862. [Google Scholar]
- Amirjani, M.R. Effect of NaCl on some physiological parameters of rice. Eur. J. Biol. Sci. 2010, 3, 6–16. [Google Scholar]
- Hasanuzzaman, M.; Hossain, M.A.; Fujita, M. Nitric oxide modulates antioxidant defense and the methylglyoxal detoxification system and reduces salinity-induced damage of wheat seedlings. Plant Biotechnol. Rep. 2011, 5, 353–365. [Google Scholar] [CrossRef]
- Saruhan, N.; Saglam, A.; Kadioglu, A. Salicylic acid pretreatment induces drought tolerance and delays leaf rolling by inducing antioxidant systems in maize genotypes. Acta Physiol. Plant 2012, 34, 97–106. [Google Scholar] [CrossRef]
- Zou, P.; Lu, X.; Zhao, H.; Yuan, Y.; Meng, L.; Zhang, C.; Li, Y. Polysaccharides derived from the brown algae Lessonia nigrescens enhance salt stress tolerance to wheat seedlings by enhancing the antioxidant system and modulating intracellular ion concentration. Front. Plant Sci. 2019, 10, 48. [Google Scholar] [CrossRef] [PubMed]
- Szabados, L.; Savouré, A. Proline: A multifunctional amino acid. Trends Plant Sci. 2010, 15, 89–97. [Google Scholar] [CrossRef] [PubMed]
- Hanson, A.D.; Nelson, C.E.; Everson, E.H. Evaluation of free proline accumulation as an index of drought resistance using two contrasting barley cultivars. Crop Sci. 1977, 17, 720–726. [Google Scholar] [CrossRef]
- Bansal, K.C.; Nagarajan, S. Leaf water content, stomatal conductance and proline accumulation in leaves of potato (Solanum tuberosum L.) in response to water stress. Indian J. Plant Physiol. 1986, 29, 397–404. [Google Scholar]
- Schaflentner, R.; Gaudin, A.; Cuterrez-Rosales, R.O.; Alvarado-Aliaga, C.A.; Bonierbal, M. Proline accumulation and real time PCR expression analysis of genes encoding enzyme s of proline metabolism in relation to drought tolerance in Andean potato. Acta Physiol. Plant 2007, 29, 19–26. [Google Scholar] [CrossRef]
- Mostajeran, A.; Rahimi-Eichi, V. Effects of drought stress on growth and yield of rice (Oryza sativa L.) cultivars and accumulation of proline and soluble sugars in sheaths and blades of their different ages leaves. Am.-Eurasian J. Agric. Environ. Sci. 2009, 5, 264–272. [Google Scholar]
- Nounjan, N.; Theerakulpisut, P. Effects of exogenous proline and trehalose on physiological responses in rice seedlings during salt-stress and after recovery. Plant Soil Environ. 2012, 58, 309–315. [Google Scholar] [CrossRef]
- Bing-Sheng, L.; Hong-Yuan, M.; Xiao-Wei, L.; Li-Xing, W.; Hai-Yan, L.; Hao-Yu, Y.; Zheng-Wei, L. Proline accumulation is not correlated with saline-alkaline stress tolerance in rice seedlings. J. Agron. 2014, 107, 51–60. [Google Scholar] [CrossRef]
- Rosa, M.; Prado, C.; Podazza, G.; Interdonato, R.; González, J.A.; Hilal, M.; Prado, F.E. Soluble sugars: Metabolism, sensing and abiotic stress: A complex network in the life of plants. Plant Signal. Behav. 2009, 4, 388–393. [Google Scholar] [CrossRef]
- Koster, K.L.; Leopold, A.C. Sugars and desiccation tolerance in seeds. Plant Physiol. 1988, 88, 829–832. [Google Scholar] [CrossRef] [PubMed]
- Xu, S.M.; Liu, L.X.; Woo, K.C.; Wang, D.L. Changes in photosynthesis, xanthophyll cycle and sugar accumulation in two North Australia tropical species differing in leaf angles. Photosynthetica 2007, 45, 348–354. [Google Scholar] [CrossRef]
- Xu, W.; Cui, K.; Xu, A.; Nie, L.; Huang, J.; Peng, S. Drought stress condition increases root to shoot ratio via alteration of carbohydrate partitioning and enzymatic activity in rice seedlings. Acta Physiol. Plant 2015, 37, 9. [Google Scholar] [CrossRef]
- Abass, S.M.; Mohamed, H.I. Alleviation of adverse effects of drought stress on common bean (Phaseolus vulgaris L.) by exogenous application of hydrogen peroxide. Bangladesh J. Bot. 2011, 41, 75–83. [Google Scholar] [CrossRef]
| Extract | Con.* (%) |
Leaf injury (%)* | Plant height (cm) | Shoot F.W* (g/plant) |
|||
|---|---|---|---|---|---|---|---|
| 1 DAT | 2 DAT | 4 DAT | 6 DAT | ||||
| Non-stress | 0.0a | 0.0a | 0.0g | 0.0k | 35.9(100)a | 0.339(100)a | |
| Drought stress | 0.0a | 0.0a | 40a | 70a | 29.6(82.2)b | 0.076(22.4)m | |
| Soybean leaf | 1 | 0.0a | 0.0a | 0.0g | 21.3g-i | 31.4(87.2)ab | 0.238(70.0)bcd |
| 3 | 0.0a | 0.0a | 0.0g | 0.0k | 29.6(82.2)b | 0.228(67.4)de | |
| 5 | 0.0a | 0.0a | 0.0g | 3.8jk | 30.9(85.8)ab | 0.246(72.4)bcd | |
| Soybean stem | 1 | 0.0a | 0.0a | 28.8a-c | 32.5fg | 31.1(86.4)ab | 0.159(46.8)ij |
| 3 | 0.0a | 0.0a | 15.0c-f | 18.8g-j | 31.6(87.8)ab | 0.213(62.7)ef | |
| 5 | 0.0a | 0.0a | 7.5e-g | 11.3h-k | 30.9(85.8)ab | 0.199(58.5)fg | |
| Chinese chive | 1 | 0.0a | 0.0a | 3.8fg | 17.5g-j | 29.6(80.8)b | 0.257(75.6)bc |
| 3 | 0.0a | 0.0a | 0.0g | 0.0k | 30.1(83.6)b | 0.244(71.8)bcd | |
| 5 | 0.0a | 0.0a | 5.0fg | 8.8h-k | 31.4(87.5)ab | 0.246(72.4)bcd | |
| Onion | 1 | 0.0a | 0.0a | 25.0b-d | 42.5ef | 30.1(83.6)b | 0.148(43.5)jk |
| 3 | 0.0a | 0.0a | 0.0g | 7.5h-k | 29.7(82.8)b | 0.236(69.4)cd | |
| 5 | 0.0a | 0.0a | 0.0g | 7.5h-k | 31.9(88.6)ab | 0.244(71.8)bcd | |
| Tomato | 1 | 0.0a | 0.0a | 17.5b-f | 41.3ef | 29.3(81.7)b | 0.131(38.5)kl |
| 3 | 0.0a | 0.0a | 25.0b-f | 57.3a-e | 21.3(85.0)c | 0.115(33.8)l | |
| 5 | 0.0a | 0.0a | 38.8b-f | 65.0ab | 29.8(82.8)b | 0.075(22.1)m | |
| Camellia sinensis | 1 | 0.0a | 0.0a | 30.0ab | 57.5a-e | 31.5(87.5)ab | 0.129(37.9)kl |
| 3 | 0.0a | 0.0a | 20.0b-e | 52.5b-e | 31.6(87.8)ab | 0.167(49.4)hij | |
| 5 | 0.0a | 0.0a | 26.3a-c | 46.3c-f | 32.3(89.7)ab | 0.173(50.9)hi | |
| Moringa oleifera | 1 | 0.0a | 0.0a | 16.3b-f | 45.0d-f | 30.9(86.1)ab | 0.157(46.2)ij |
| 3 | 0.0a | 0.0a | 20.0b-e | 57.5 a-e | 29.9(83.3)b | 0.123(36.2)l | |
| 5 | 0.0a | 0.0a | 20.0b-e | 62.5a-c | 31.8(86.9)ab | 0.117(34.4)l | |
| Undaria pinnatifida | 1 | 0.0a | 0.0a | 30.0ab | 67.5ab | 30.1(83.6)b | 0.085(25.0)m |
| 3 | 0.0a | 0.0a | 11.3d-g | 53.8a-e | 29.7(82.5)b | 0.121(35.6)l | |
| 5 | 0.0a | 0.0a | 22.5b-d | 60.0a-d | 29.4(81.7)b | 0.095(27.9)m | |
| Saccharina japonica | 1 | 0.0a | 0.0a | 28.8a-c | 32.5fg | 31.1(86.4)ab | 0.159(46.8)ij |
| 3 | 0.0a | 0.0a | 15.0c-f | 18.8g-j | 31.6(87.8)ab | 0.213(62.7)ef | |
| 5 | 0.0a | 0.0a | 7.5e-g | 11.3h-k | 30.8(85.8)ab | 0.199(58.5)fg | |
| Hizikia fusiforme | 1 | 0.0a | 0.0a | 3.8fg | 6.3h-k | 29.1(80.8)b | 0.187(35.6)gh |
| 3 | 0.0a | 0.0a | 0.0g | 5.0i-k | 30.6(85.0)b | 0.233(68.5)de | |
| 5 | 0.0a | 0.0a | 5.0fg | 15.0h-k | 32.9(91.4)ab | 0.260(72.1)b | |
| Gracilaria verrucosa | 1 | 0.0a | 0.0a | 20.0b-e | 22.5gh | 32.1(89.2)ab | 0.238(62.4)bcd |
| 3 | 0.0a | 0.0a | 16.3b-f | 20.0g-j | 31.2(88.9)ab | 0.229(60.6)de | |
| 5 | 0.0a | 0.0a | 25.0b-d | 32.5fg | 29.6(82.5)b | 0.159(46.8)ij | |
| Treatment | *** | *** | |||||
| Concentration | 0.12 | *** | |||||
| Treatment × Concentration | 0.28 | *** | |||||
| Extract | Con.* (%) |
Leaf injury (%)* | Plant height (cm) | Shoot F.W* (g/plant) |
|||
|---|---|---|---|---|---|---|---|
| 1 DAT | 2 DAT | 4 DAT | 6 DAT | ||||
| Non-stress | 0d | 0g | 0e | 0k | 24.3(100)a-f | 0.230(100)a | |
| Salt stress | 100 mM | 10c | 30a-c | 40a-c | 65a-d | 23.6(97.1)b-f | 0.130(56.5)k-o |
| Soybean leaf | 0.1 | 0d | 10e-g | 20c-e | 20i-k | 24.8(102.1)a-f | 0.195(84.8)b |
| 0.5 | 0d | 10e-g | 20c-e | 20i-k | 25.7(105.8)a-e | 0.224(97.4)a | |
| 1 | 10c | 10e-g | 20c-e | 30g-j | 26.6(109.5)ab | 0.178(77.4)b-d | |
| 3 | 10c | 25b-d | 45ab | 60a-e | 24.6(101.2)a-f | 0.139(60.4)h-n | |
| Soybean stem | 0.1 | 10c | 10e-g | 20c-e | 30g-j | 25.9(106.6)a-e | 0.152(66.1)e-k |
| 0.5 | 10c | 10e-g | 20c-e | 25h-j | 25.3(104.1)a-f | 0.188(81.7)b | |
| 1 | 10c | 10e-g | 20c-e | 25h-j | 25.9(106.6)a-e | 0.217(94.3)a | |
| 3 | 0d | 10e-g | 15de | 20i-k | 26.9(110.7)a | 0.221(96.1)a | |
| Chinese chive | 0.1 | 0d | 10e-g | 20c-e | 50c-g | 23.4(96.6)c-f | 0.154(67.0)e-j |
| 0.5 | 10c | 20c-e | 40a-c | 50c-g | 25.0(102.9)a-f | 0.174(75.6)b-e | |
| 1 | 10c | 30a-c | 45a-e | 70a-c | 25.1(103.3)a-f | 0.149(64.8)f-l | |
| 3 | 30a | 40a | 50a | 80a | 26.1(107.4)a-c | 0.133(57.8)j-o | |
| Onion | 0.1 | 0d | 0g | 30a-d | 45d-h | 22.9(94.2)d-f | 0.125(53.4)m-p |
| 0.5 | 0d | 0g | 30a-d | 50c-g | 23.4(96.3)c-f | 0.130(56.5)k-o | |
| 1 | 10c | 20c-e | 40a-c | 60a-e | 23.7(97.5)b-f | 0.135(58.7)i-o | |
| 3 | 10c | 20c-e | 50a | 80a | 26.3(108.2)a-c | 0.134(58.2)i-o | |
| Tomato | 0.1 | 0d | 10e-g | 20c-e | 50c-g | 24.1(99.2)a-f | 0.134(58.3)i-o |
| 0.5 | 0d | 10e-g | 30a-d | 60a-e | 25.5(104.9)a-f | 0.166(71.2)c-f | |
| 1 | 10c | 25b-d | 40a-c | 60a-e | 23.8(97.9)a-f | 0.146(63.5)f-m | |
| 3 | 25ab | 35ab | 45ab | 75ab | 24.0(98.8)a-f | 0.144(62.6)f-m | |
| Camellia sinensis | 0.1 | 0d | 10e-g | 20c-e | 40e-i | 22.8(93.8)ef | 0.107(46.5)p |
| 0.5 | 0d | 10e-g | 20c-e | 47c-h | 22.5(92.5)f | 0.142(61.7)g-n | |
| 1 | 10c | 10e-g | 20c-e | 47c-h | 25.1(103.3)a-f | 0.129(56.1)l-o | |
| 3 | 5cd | 10e-g | 30a-d | 55b-f | 23.5(96.7)b-f | 0.116(50.4)op | |
| Moringa oleifera | 0.1 | 0d | 5fg | 10de | 30g-j | 23.5(96.7)b-f | 0.149(64.8)f-l |
| 0.5 | 0d | 10e-g | 20c-e | 30g-j | 26.1(107.4)a-d | 0.178(77.4)b-d | |
| 1 | 0d | 15d-f | 25b-d | 40e-i | 24.0(98.8)a-f | 0.121(52.6)n-p | |
| 3 | 20b | 30a-c | 50a | 80a | 25.3(104.1)a-f | 0.108(47.0)p | |
| Undaria pinnatifida | 0.1 | 5cd | 10e-g | 20c-e | 30g-j | 26.0(107.0)a-d | 0.161(70.0)c-h |
| 0.5 | 5cd | 10e-g | 20c-e | 30g-j | 25.6(105.3)a-f | 0.155(67.4)e-j | |
| 1 | 5cd | 10e-g | 15de | 20i-k | 25.8(106.2)a-e | 0.182(79.1)bc | |
| 3 | 5cd | 10e-g | 15de | 20i-k | 24.0(98.8)a-f | 0.175(76.1)b-e | |
| Saccharina japonica | 0.1 | 0d | 10e-g | 30a-d | 50c-g | 25.4(104.5)a-f | 0.150(65.2)f-l |
| 0.5 | 0d | 10e-g | 30a-d | 50c-g | 24.6(101.2)a-f | 0.161(70.0)c-h | |
| 1 | 10c | 20c-e | 40a-c | 45d-h | 25.3(104.1 a-f | 0.162(70.4)c-g | |
| 3 | 10c | 15d-f | 25b-d | 40e-i | 25.3(104.1)a-f | 0.163(70.9)c-g | |
| Hizikia fusiforme | 0.1 | 0d | 10e-g | 20c-e | 40e-i | 23.9(96.7)a-f | 0.139(60.4)h-n |
| 0.5 | 5cd | 10e-g | 30a-d | 47c-h | 24.4(100.4)a-f | 0.153(66.5)e-j | |
| 1 | 5cd | 10e-g | 30a-d | 50c-g | 24.7(101.6)a-f | 0.173(75.2)b-e | |
| 3 | 0d | 10e-g | 30a-d | 45d-h | 24.7(101.6)a-f | 0.146(63.5)f-m | |
| Gracilaria verrucosa | 0.1 | 0d | 10e-g | 15de | 25h-j | 24.4(100.4)a-f | 0.143(62.2)f-n |
| 0.5 | 0d | 5fg | 20c-e | 30g-j | 24.2(99.6)a-f | 0.164(71.3)c-g | |
| 1 | 0d | 5fg | 10de | 15jk | 25.0(102.9)a-f | 0.174(75.7)b-e | |
| 3 | 10c | 20c-e | 20c-e | 35f-j | 25.8(106.2)a-e | 0.156(67.8)d-i | |
| Treatment | ** | *** | |||||
| Concentration | 0.13 | *** | |||||
| Treatment × Concentration | 0.44 | *** | |||||
Disclaimer/Publisher’s Note: The statements, opinions and data contained in all publications are solely those of the individual author(s) and contributor(s) and not of MDPI and/or the editor(s). MDPI and/or the editor(s) disclaim responsibility for any injury to people or property resulting from any ideas, methods, instructions or products referred to in the content. |
© 2024 by the authors. Licensee MDPI, Basel, Switzerland. This article is an open access article distributed under the terms and conditions of the Creative Commons Attribution (CC BY) license (http://creativecommons.org/licenses/by/4.0/).


