Submitted:
10 January 2024
Posted:
11 January 2024
You are already at the latest version
Abstract
Keywords:
1. Introduction
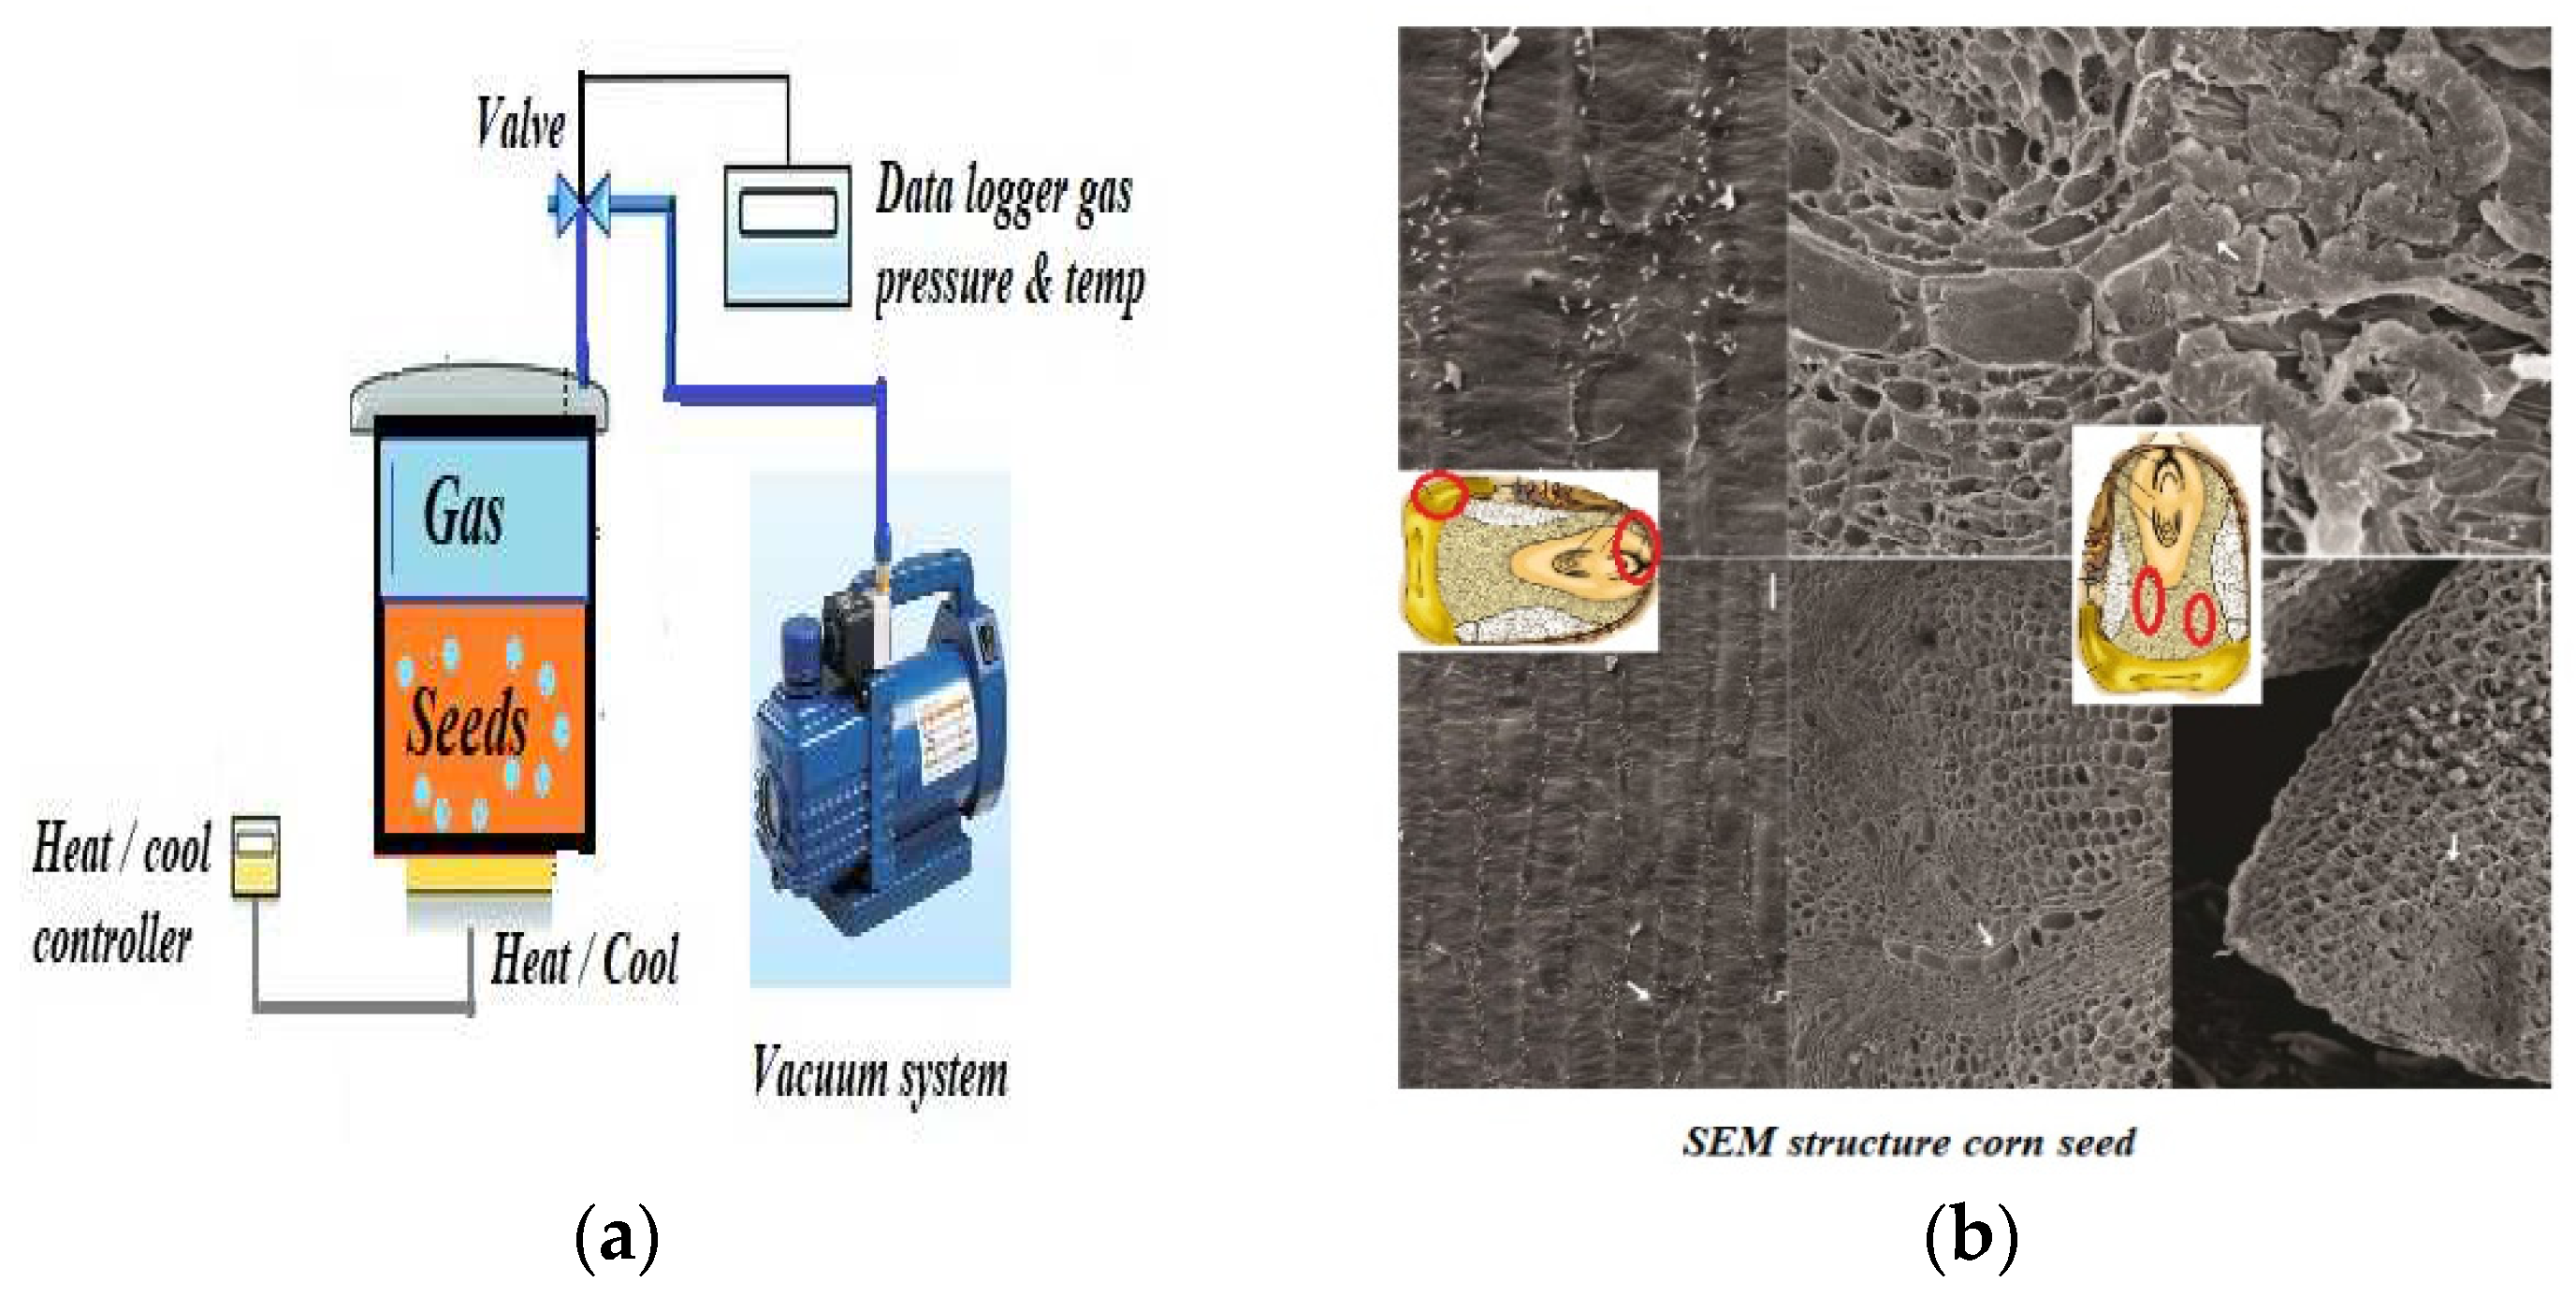
- By removing the air (degassing) around the seeds, oxidation and decomposition are prevented, contributing to their long-term preservation;
- Seeds become more permeable, allowing them to absorb treatment evenly and more efficiently, facilitating the subsequent absorption of water and nutrients necessary for germination [4];
- Vacuum treatment can activate certain enzymes in seeds, accelerating the biochemical processes necessary for germination [6];
2. Materials and Methods
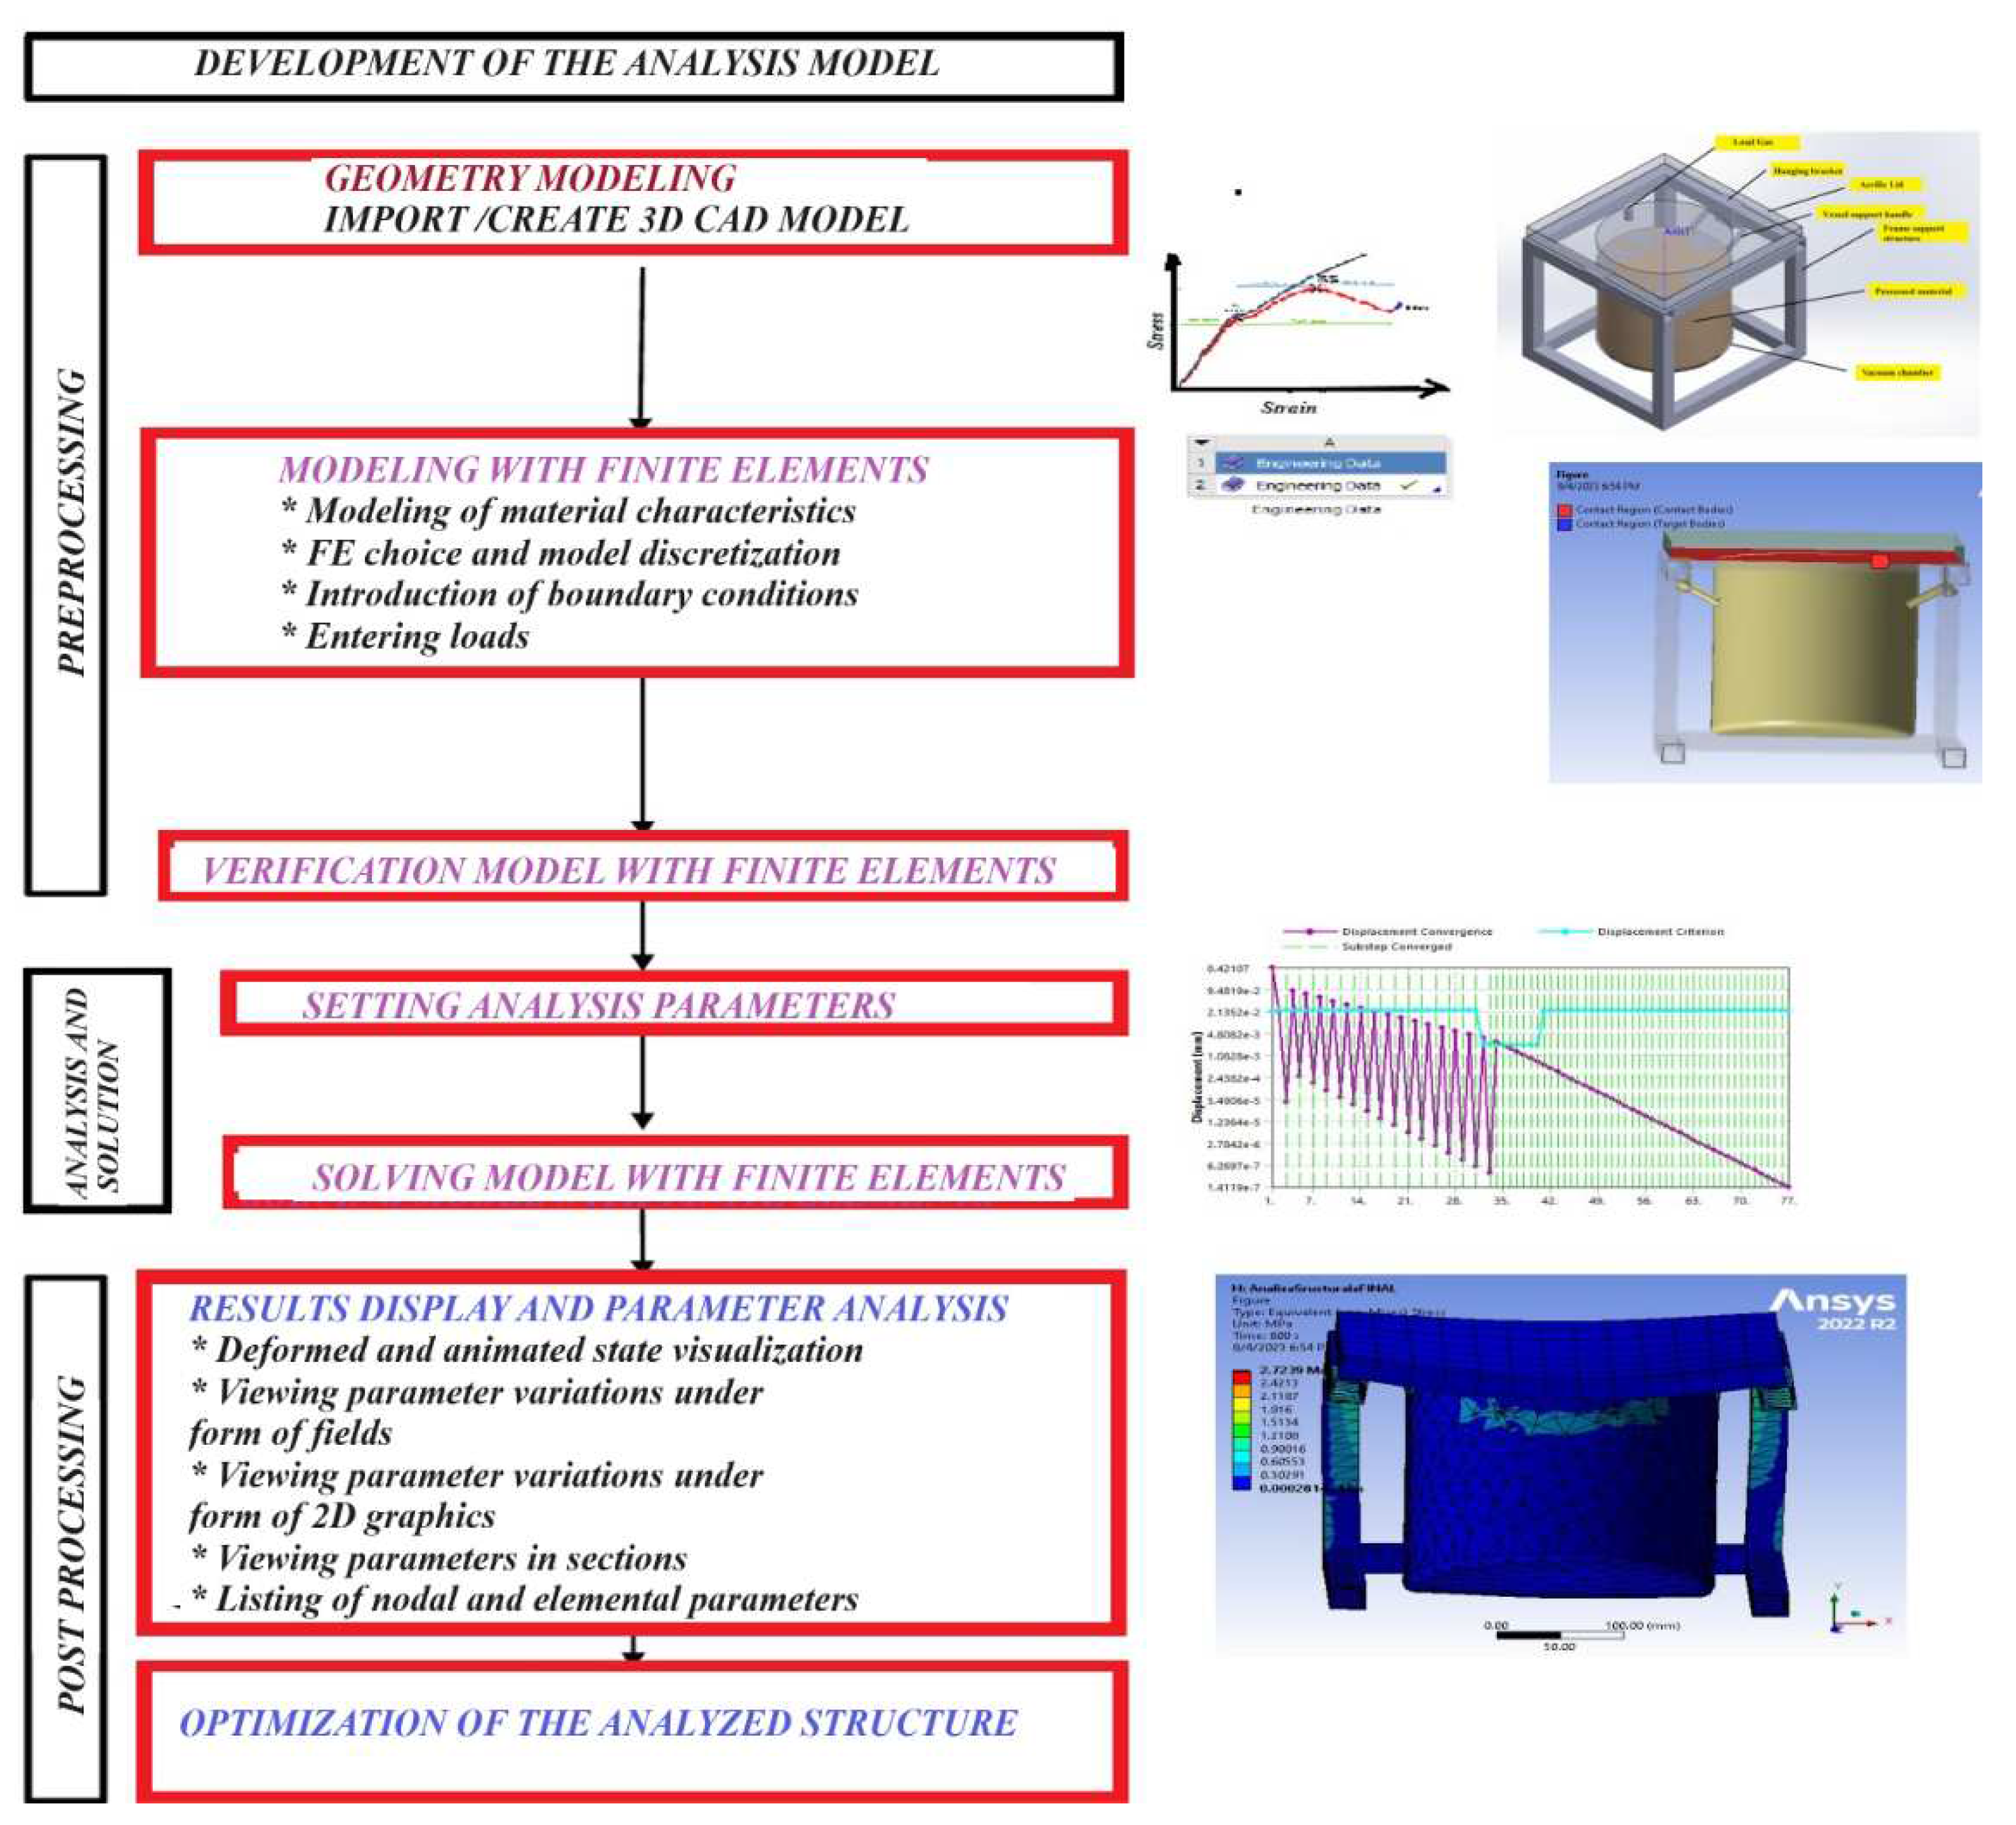
- Pre-processing - where the model is defined (by constructing a mathematical model applied to a 3D geometric element created with CAD software and divided into smaller bodies) that is to be analyzed, along with the ambient environmental factors applied to it;
- Analysis and solving (mainly carried out on computers with high computing power);
- Post-processing of results (using powerful graphic visualization devices) involves analyzing and interpreting the results, as well as identifying issues in the studied structure.
- ➢
- provide the necessary conditions to achieve specific processing conditions for cereal seeds (such as removing dust particles before applying a thin layer of fungicides, insecticides, and bactericides, and evaporating water from the material for conditioning);
- ➢
- be capable of maintaining elevated and cold temperatures for an extended period;
- ➢
- Produce a vacuum environment that encompasses pressures from atmospheric down to 100 Pa at a minimum;
- ➢
- have an interior size of at least 20 liters.
3. Results and Discussion
3.1. Analytical and numerical modeling
- a)
- Finite element mathematical modeling
- ➢
- transient dynamic evaluation, employed to calculate the feedback of a structure to external loads that fluctuate unpredictably over the period.
- b)
- Numerical modeling
 |
(9) |
3.2. Experimental Procedure
- ➢
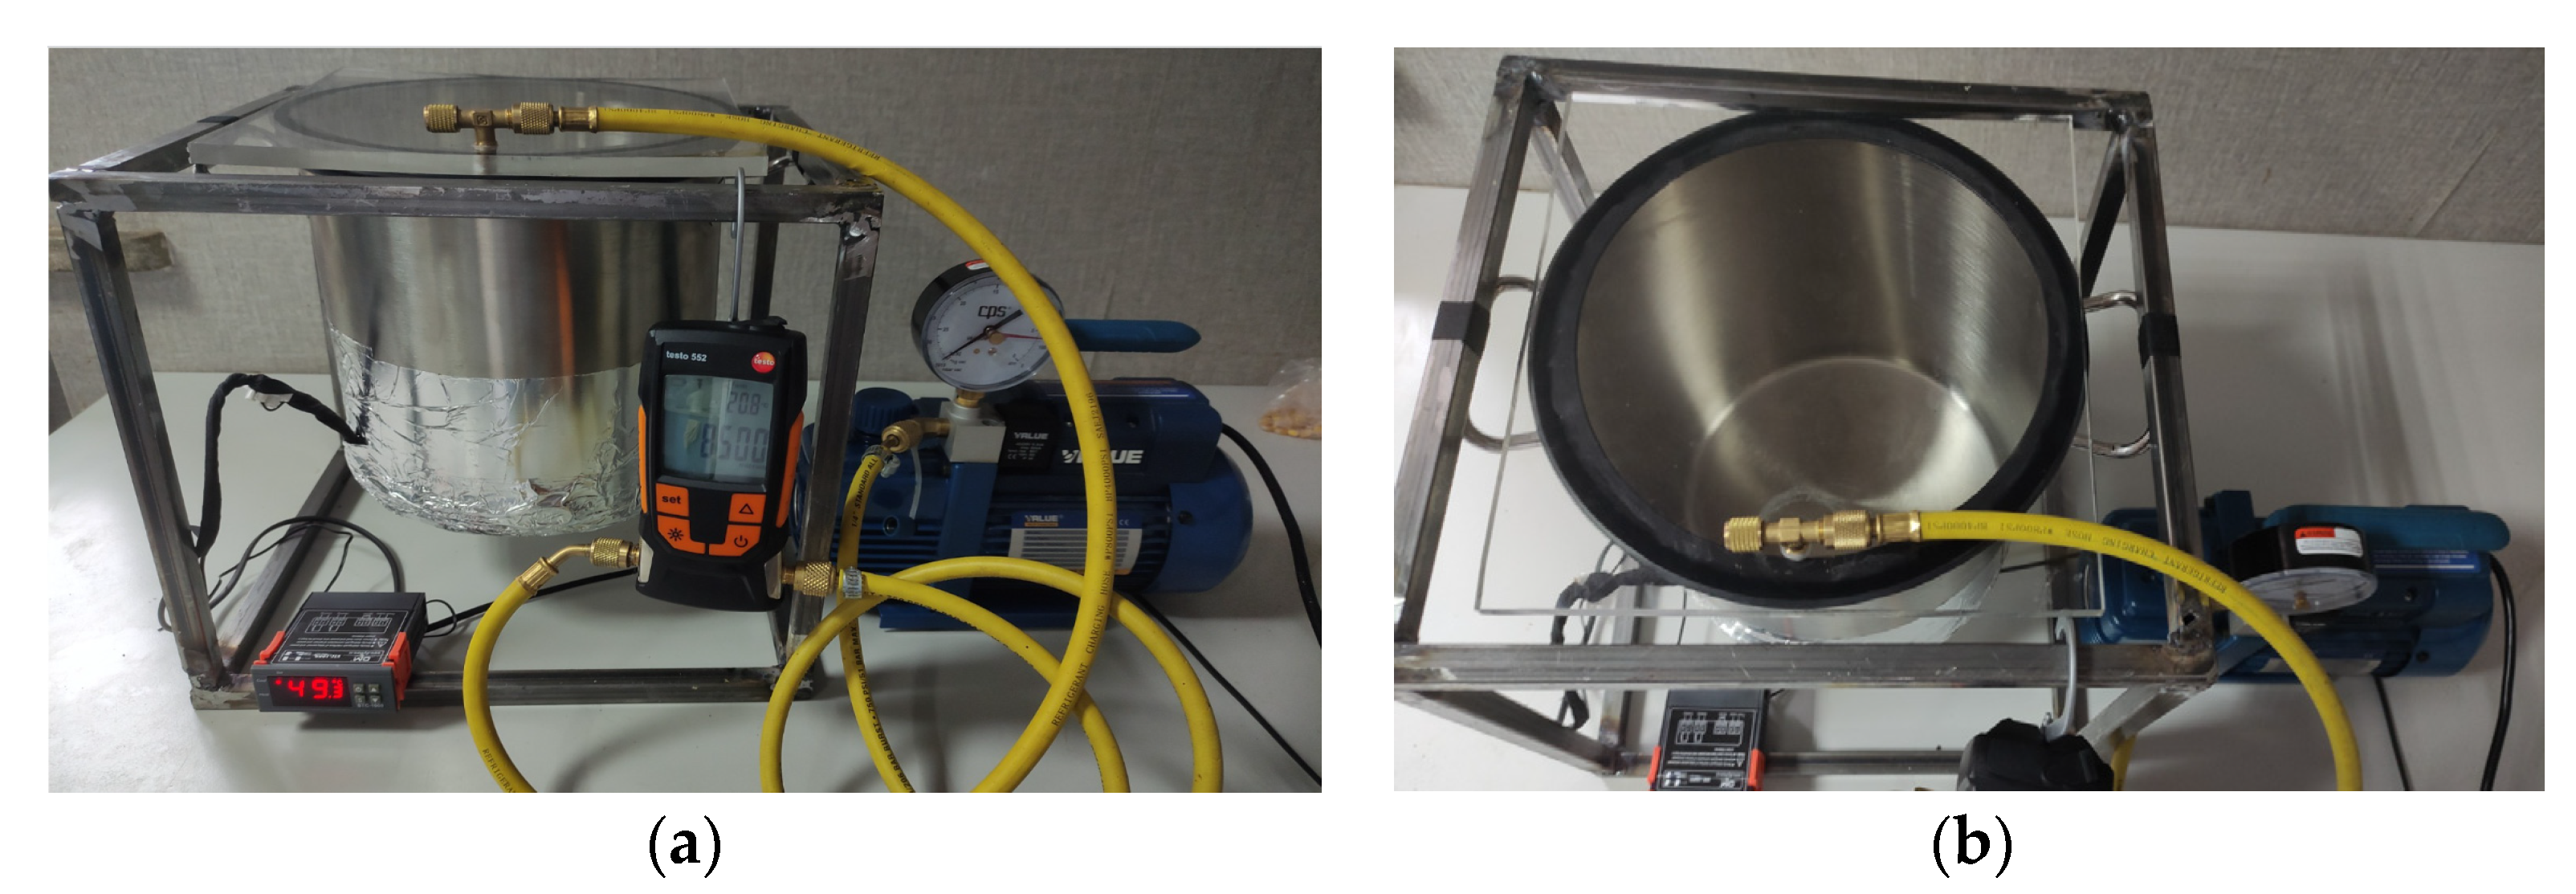
- The first stage is the selection of the material and some details. Several materials can be checked under vacuum pressure; however the most regular category spent are metals, plastics, and their composites [18]. The ANSYS material library provided characteristic values for the materials of the chamber and the lid, as mentioned above, while the temperature and other experimental conditions are detailed below.
- ➢
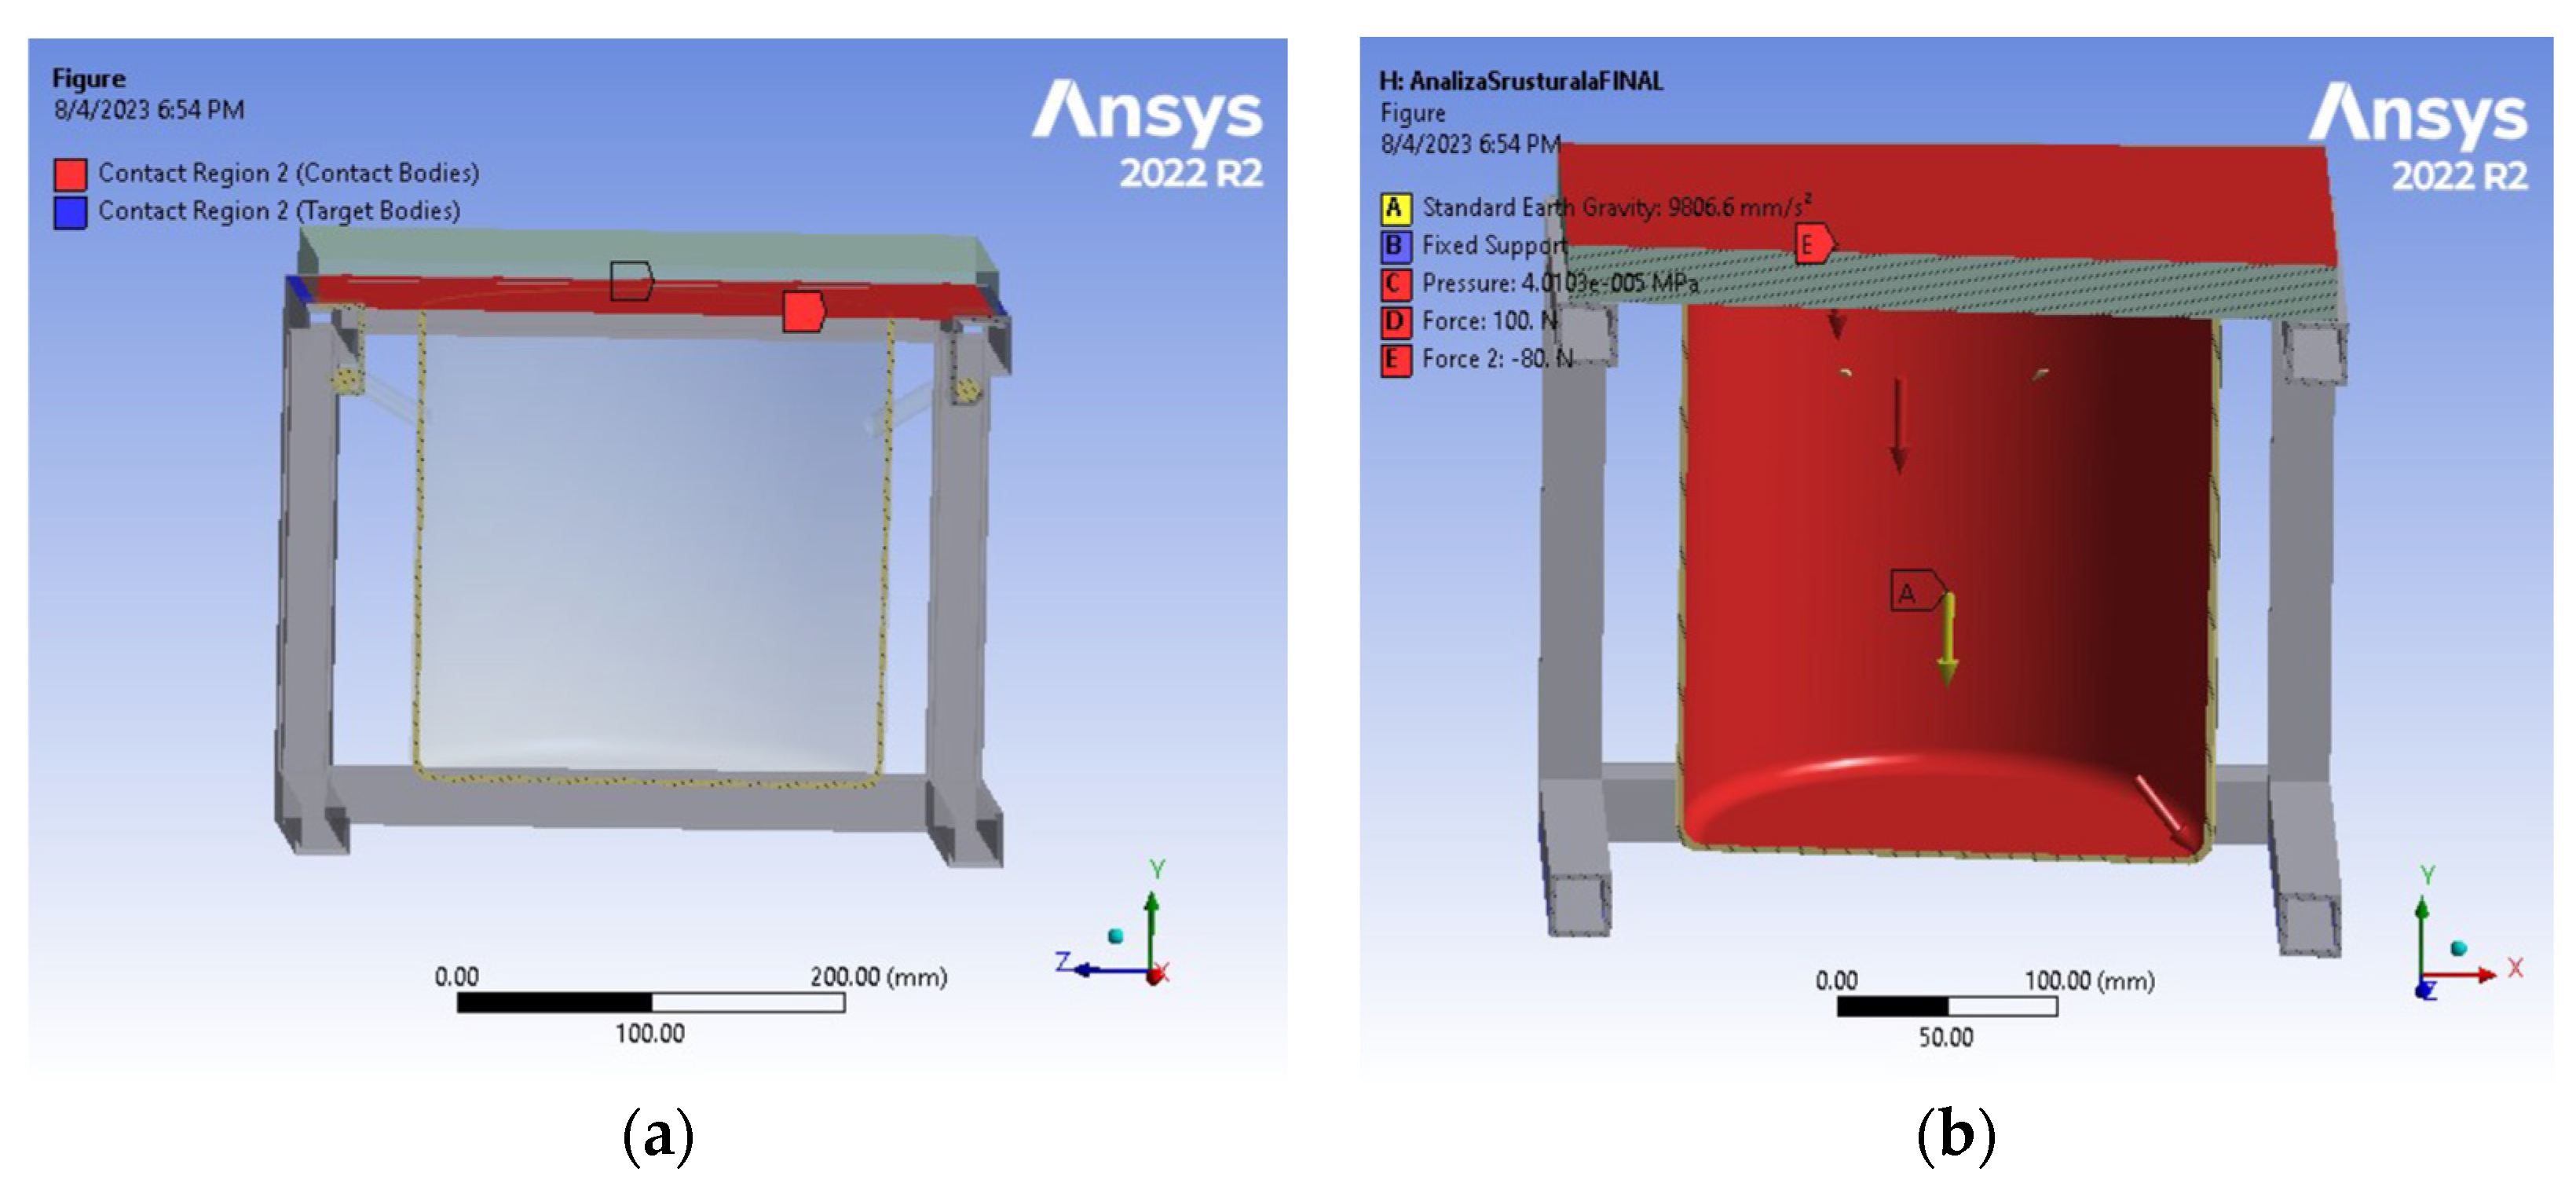
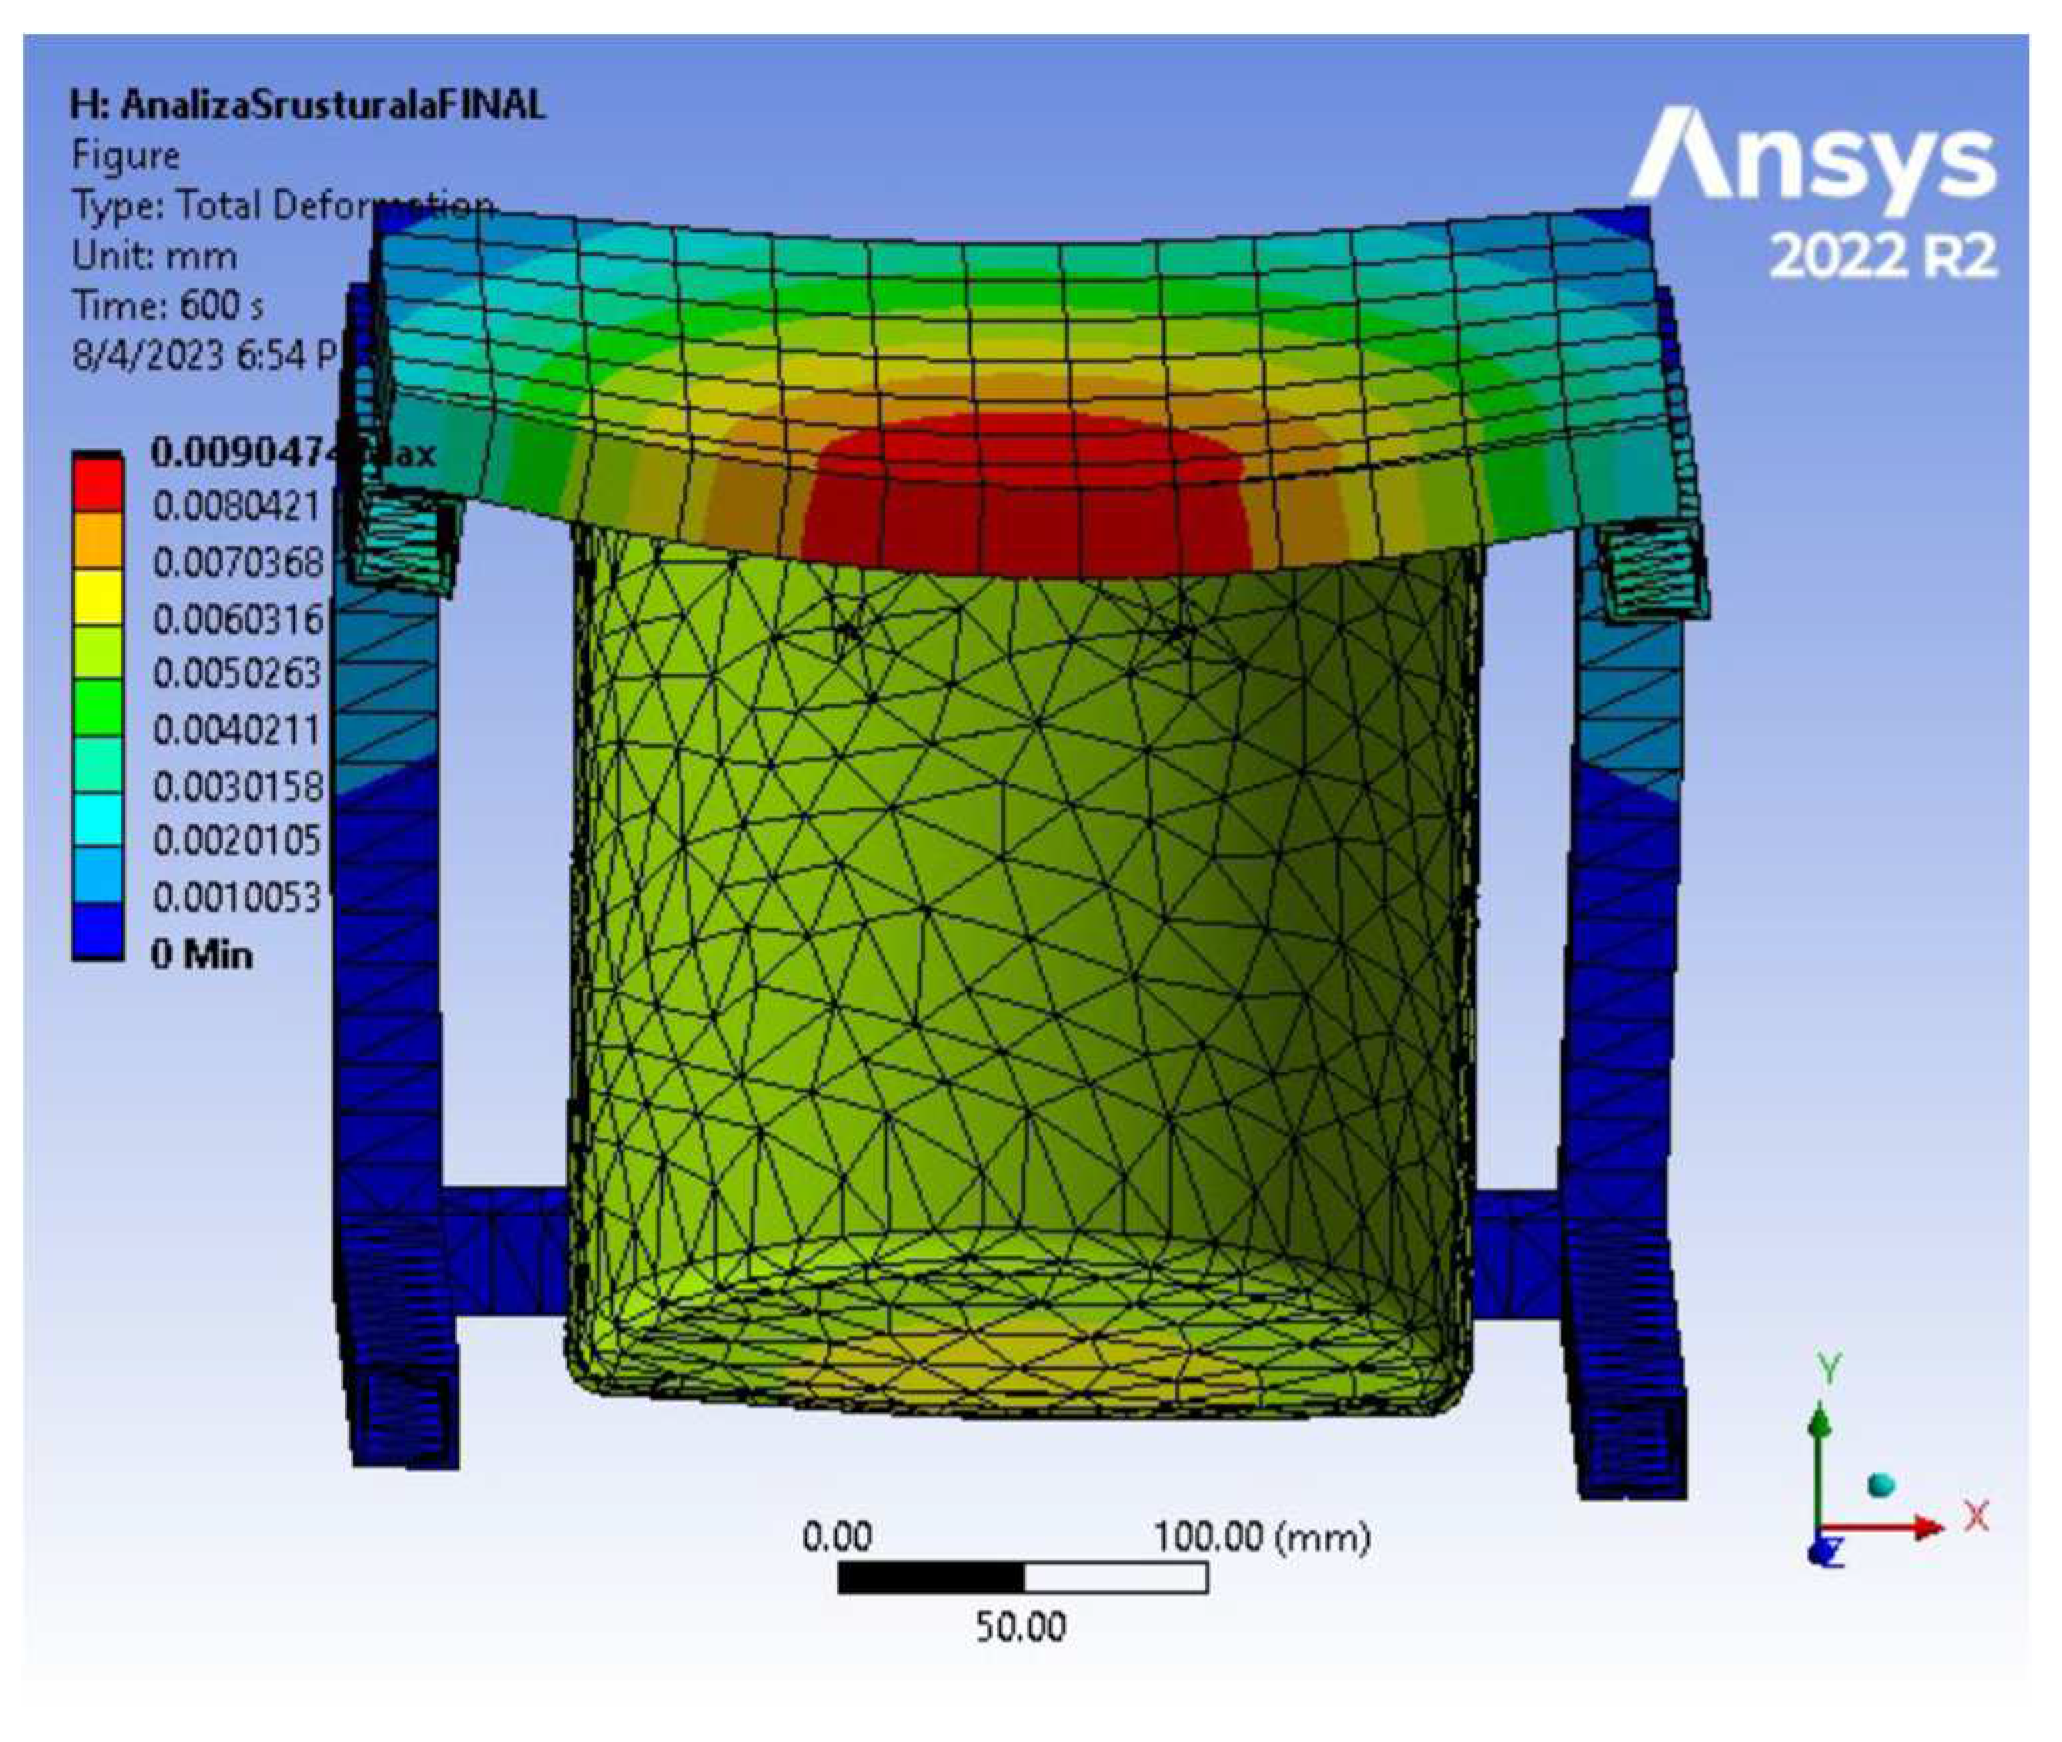
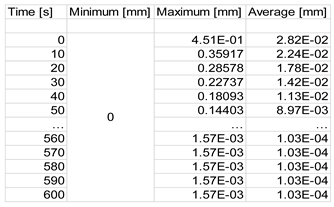
- In the deformation process of the subassembly elements due to the action of vacuum pressure (Figure 5b), increased displacements are observed (max. 0.001569 mm) in the central area of the vessel bottom and (max. 0.000869 mm) in the central area of the lid.
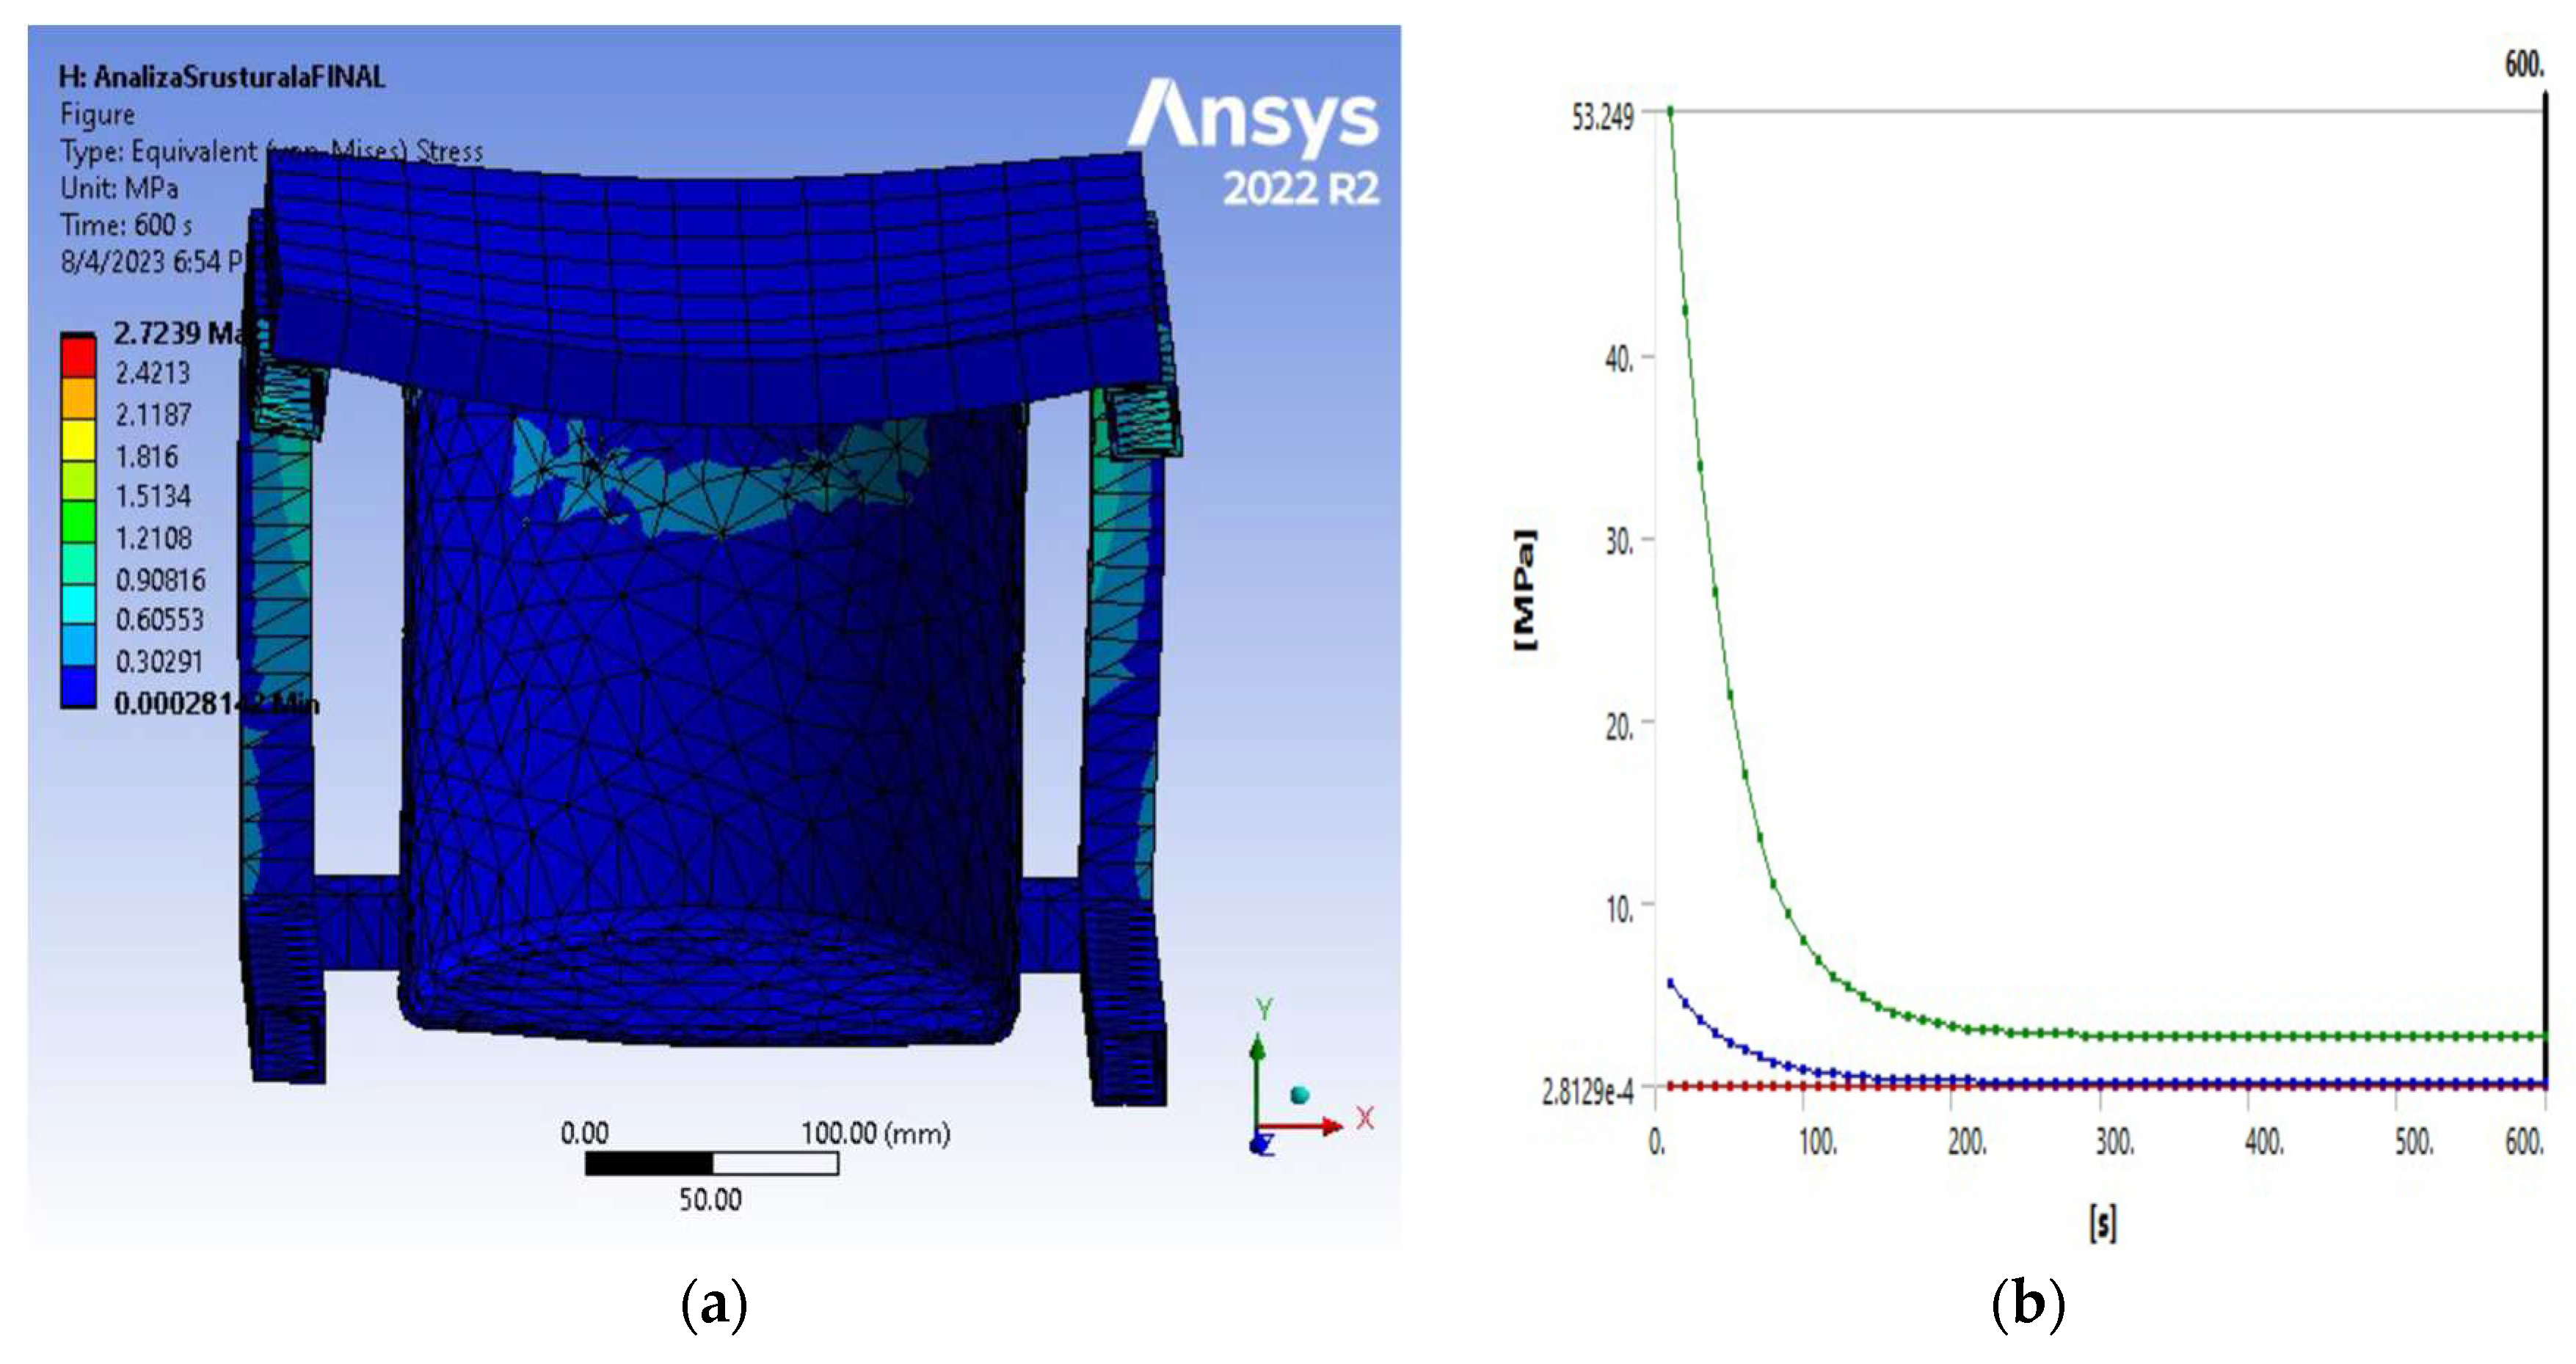
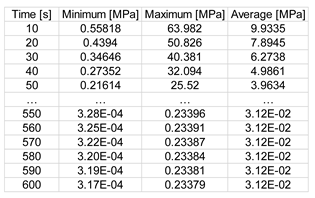
- The equivalent Von Mises stress has increased values (max 63.92 MPa) in the body of the vessel in the middle area of the lower part, while on the lid, the values are insignificant.
- From the analysis of the maximum stress, the main compression load on the chamber body is highlighted, with a maximum value of 74.242 MPa in the connection area from the outside, and the tensile stress is reduced in the contact area with the body of the lid.
- The radial normal stresses, especially compression, have reduced values (52.643 MPa) in the joining area of the vertical wall of the vessel with the lower end portion;
- Increased values (21.434 MPa) of tangential (circumferential) stresses are highlighted in the body of the chamber in the area with the maximum diameter of its bottom, along with a significantly reduced tensile stress in the body of the lid;
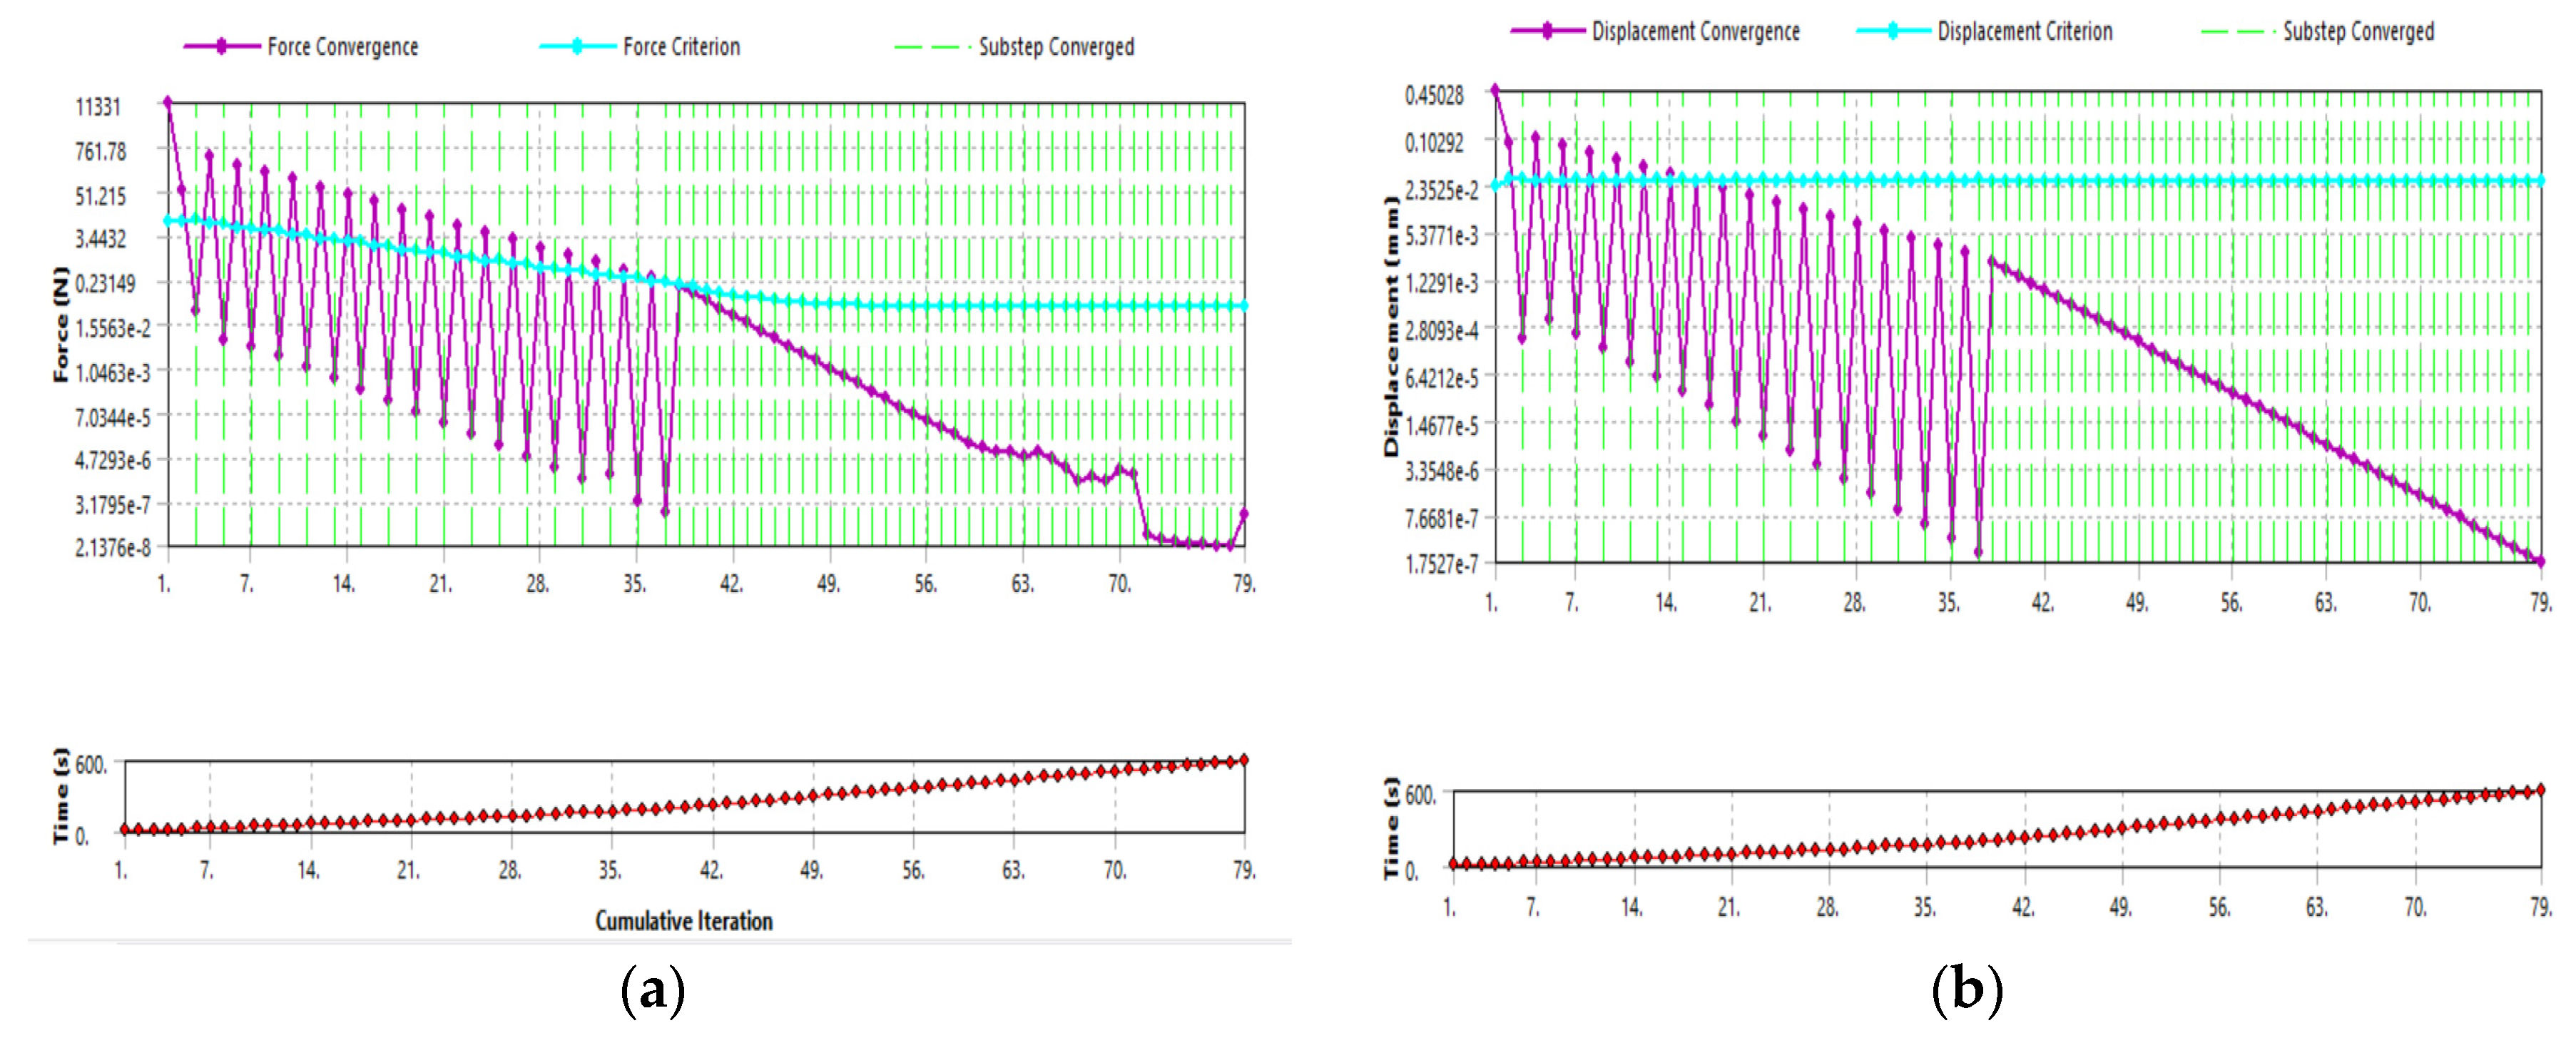
- The total maximum value of the system energy over time was 617.65 mJ, with a predominance of 617 mJ in deformation energy and only 2.0225e-006 mJ in kinetic energy. A small deviation was acquired, demonstrating the validity of the conducted virtual experiment.
5. Conclusions
Author Contributions
Funding
Institutional Review Board Statement
Informed Consent Statement
Data Availability Statement
Conflicts of Interest
References
- Jousten K., Handbook of Vacuum Technology, Second Edition, Wiley-VCH Verlag GmbH&Co.KGaA, 2016, Weinheim, Germany.
- Umrath W., Fundamentals of Vacuum Technology, Oerlikon Leybold Vacuum, 2007, Cologne, Germany.
- *** The Vacuum Technology Book & Know how Book, Volume II, Pfeiffer Vacuum GmbH, 2013, www.pfeiffer-vacuum.com.
- Silverio G-L., Chuck-Hernandez C., Serna-Saldivar S.O., Development and Structure of the Corn Kernel, Corn (Third Edition)- Chemistry and Technology 2019, 147–163. [CrossRef]
- Govindaraj M, Masilamani P, Albert VA, Bhaskaran M. Effect of physcal seed treatment on yield and quality of crops: A review. Agriculture Reviews 2017, 38(1), 1-14. [CrossRef]
- Farooq M.A, Ma W., Shen S., Gu A., Underlying Biochemical and Molecular Mechanisms for Seed Germination, Int. J. Mol. Sci. 2022, 23, 8502. [CrossRef]
- Ramdan E.P., Perkasa A.Y., Azmi T.K.K., Aisyah, Kurniasih R., Kanny P.I., Risnawati, Asnur P., Effects of physical and chemical treatments on seed germination and soybean seed-borne fungi, IOP Conf. Series: Earth and Environmental Science 2021, 883,012022. [CrossRef]
- Sonhaji YS, Surahman M, Ilyas S, Giyanto, Seed treatment improved seed quality, seed production, and controlled downey mildew disease on sweet corn, J. Agron. Indonesia 2013, 41(3), 242-248, http://repository.ipb.ac.id/handle/123456789/67027.
- Deepa G.T., Chetti M., Khetagoudar M., Adavirao G., Influence of vacuum packaging on seed quality and mineralcontents in chilli (Capsicum annuum L.), J Food Sci Technol. 2013, 50(1),153–158. [CrossRef]
- Ramdan E.P., Arti I.M., Risnawati, Evaluation of viability and corn seed-borne pathogens in physical and chemical treatment, J. Berkala Penelitian Agronomi 2020, 8(2),16-24.
- Lawrence B., Bicksler A., Duncan K., Local treatments and vacuum sealing as novel control strategiesfor stored seed pests in the tropics, Agron. Sustain. Dev. 2017, 37, Article number 6. [CrossRef]
- Arbaugh B., Rezaei F., Mohiti-Asli M., Pena S., Scher H., Jeoh T., A Strategy for Stable, On-Seed Application of a Nitrogen-Fixing Microbial Inoculant by Microencapsulation in Spray-Dried Cross-linked Alginates, ACS Agric. Sci. Technol. 2022, 2, 5, 950–959,. [CrossRef]
- Li L., Li J., Shao H., Dong Y., Effects of low-vacuum helium cold plasma treatment on seed germination, plant growth and yield of oilseed rape. Plasma Sci. Technol. 2018, 20, 095502. [CrossRef]
- Kouki A., Theory of vacuum, 2022. [CrossRef]
- Marquardt N., Introduction to the principles of vacuum physics, Inst for Accelerator Phys & Synchrotron Radiat, CAS - CERN Accelerator School: Vacuum Technology 1999, 1-24, e-proceedings. [CrossRef]
- Lateş M-T., Finite element method. Applications, Transilvania University Publishing House Braşov - 2008 (in Romanian).
- Butnariu S., Mogan Gh., Finite element analysis in mechanical engineering. Practical applications in ANSYS, Transilvania University Publishing House in Braşov - 2014 (in Romanian).
- Jamil T., Azher K., Tahir M.A, Ali Z.,, Hameed W., Javed H.H., Experimental and numerical dynamic analysis of plexiglass acrylic for impact energy using indigenously developed testing equipment, U.P.B. Sci. Bull., Series D 2022, 84(3), 191-206.
- Ipate G., Ilie F., Cristescu A.C., Finite element 3D numerical simulation study of car braking systems and brake disc/drum–pad/shoe friction couple materials, TE-RE-RD, E3S Web of Conferences 2020, 180, 03003. [CrossRef]
- Tickoo S., Ansys Workbench 14.0: A Tutorial Approach, Cadcim Technologies 2014.
- Florin Gabriel Blaga F.G., The dynamic action of the wind on multi-storey metal structures. PhD Thesis, Technical University of Cluj Napoca – 2022 (in Romanian).
- Oliveira M.C., Nápoles, S. Using a Spreadsheet to Study the Oscillatory Movement of a Mass-Spring System, Spreadsheets in Education (eJSiE) 2010, 3(3), Art.2, http://epublications.bond.edu.au/ejsie/vol3/iss3/2.
- Ed Bott Ed., Woody Leonhard W., Special Edition Using Microsoft Office 2003, Student-Teacher Edition 2002, Google Books.
- Roman S., (2002). Writing Excel Macros with VBA, 2nd Edition. O'Reilly Media, Inc. 2002.
- Cooksey R., Descriptive Statistics for Summarising Data, Illustrating Statistical Procedures: Finding Meaning in Quantitative Data 2020 PMCID: PMC7221239, 61–139. [CrossRef]
| Maximum rated vacuum | 482.6 mmHg at sea level |
Maximum operating temperature | 70 °C |
| Volume | 20 L | Lid dimensions (diameter x thickness) | 240x15 mm |
| Length of steel wire hose | 1250 mm | Dimensions of the vacuum chamber (diameter x height x thickness) | 240x240x3 mm |
 |
 |
Disclaimer/Publisher’s Note: The statements, opinions and data contained in all publications are solely those of the individual author(s) and contributor(s) and not of MDPI and/or the editor(s). MDPI and/or the editor(s) disclaim responsibility for any injury to people or property resulting from any ideas, methods, instructions or products referred to in the content. |
© 2024 by the authors. Licensee MDPI, Basel, Switzerland. This article is an open access article distributed under the terms and conditions of the Creative Commons Attribution (CC BY) license (http://creativecommons.org/licenses/by/4.0/).


