1. Introduction
Glass-forming materials are often used to create optical elements and components for optical integrated circuits. In the last two decades, the technology of femtosecond laser microfabrication of various optical structures inside glass-forming materials has been intensively developed. Due to the extremely high peak intensities at the focus of femtosecond laser pulses, nonlinear processes such as multiphoton absorption can lead to significant energy absorption even within transparent materials such as glass. Thus, femtosecond laser-induced microstructuring of glass-forming materials opens up wide possibilities for various applications. Laser radiation can cause irreversible local phenomena at the beam focus, such as phase transitions [
1], the formation of bubbles or microfluidic channels [
2,
3,
4,
5], changes in chemical composition or refractive index [
6,
7], for example, diffusion and aggregation of silver ions [
6] or photo-oxidation [
7]. Spatially selective laser-induced crystallization or structure changes of glasses allows direct recording of channel waveguides [
1,
8,
9,
10,
11,
12,
13,
14]. In fact, laser-written waveguides (with improved mode structure of guided light) can be fabricated by local laser heating inside a glass matrix [
8,
9]. Thus, optical integrated circuits can be fabricated using a laser beam that induces local structural changes in a glass [
15,
16,
17,
18]. Photopolymerization and photodamage by highly focused laser pulses can be used in microchemistry and stereolithography [
6,
19]. Moreover, femtosecond laser structuring of glass-forming materials can be used for optical long-term storage of information [
3,
20,
21,
22,
23,
24,
25,
26,
27,
28,
29,
30], photonics [
31], fabrication of phase gratings [
32], nano-gratings [
33], and quantum dots that can be used in various devices [
34,
35,
36]. Notably, optical storage based on glass-forming materials has the potential to replace magnetic storage in the quest to provide high-speed, high-capacity, low-power, low-cost, highly secure, and long-term data storage [
25,
26,
27,
28,
29,
30]. However, for the development of these technologies, theoretical models of thermal processes occurring during spatially selective laser-induced structuring of glass-forming materials are required. For example, understanding the dynamics of the laser crystallization process of amorphous Ge films is important for transistor technology, photovoltaic devices, particle detectors, and photodetectors [
37]. In fact, the laser crystallization method makes it possible to control the local temperature inside the material and avoid random nucleation [
37]. The ability to form and control the dynamics of changes in the temperature distribution
inside the material is very important for the opportunity to control the morphology of the laser-written structure inside the glass matrix [
22,
33,
38]. Thus, a deep understanding of the thermal processes inside glass-forming materials under fast laser thermal perturbations is required. In this paper, we focus on local temperature changes, especially the local cooling rate
in the focal region during laser-writing processes in a glass matrix (where
is the rate of temperature change).
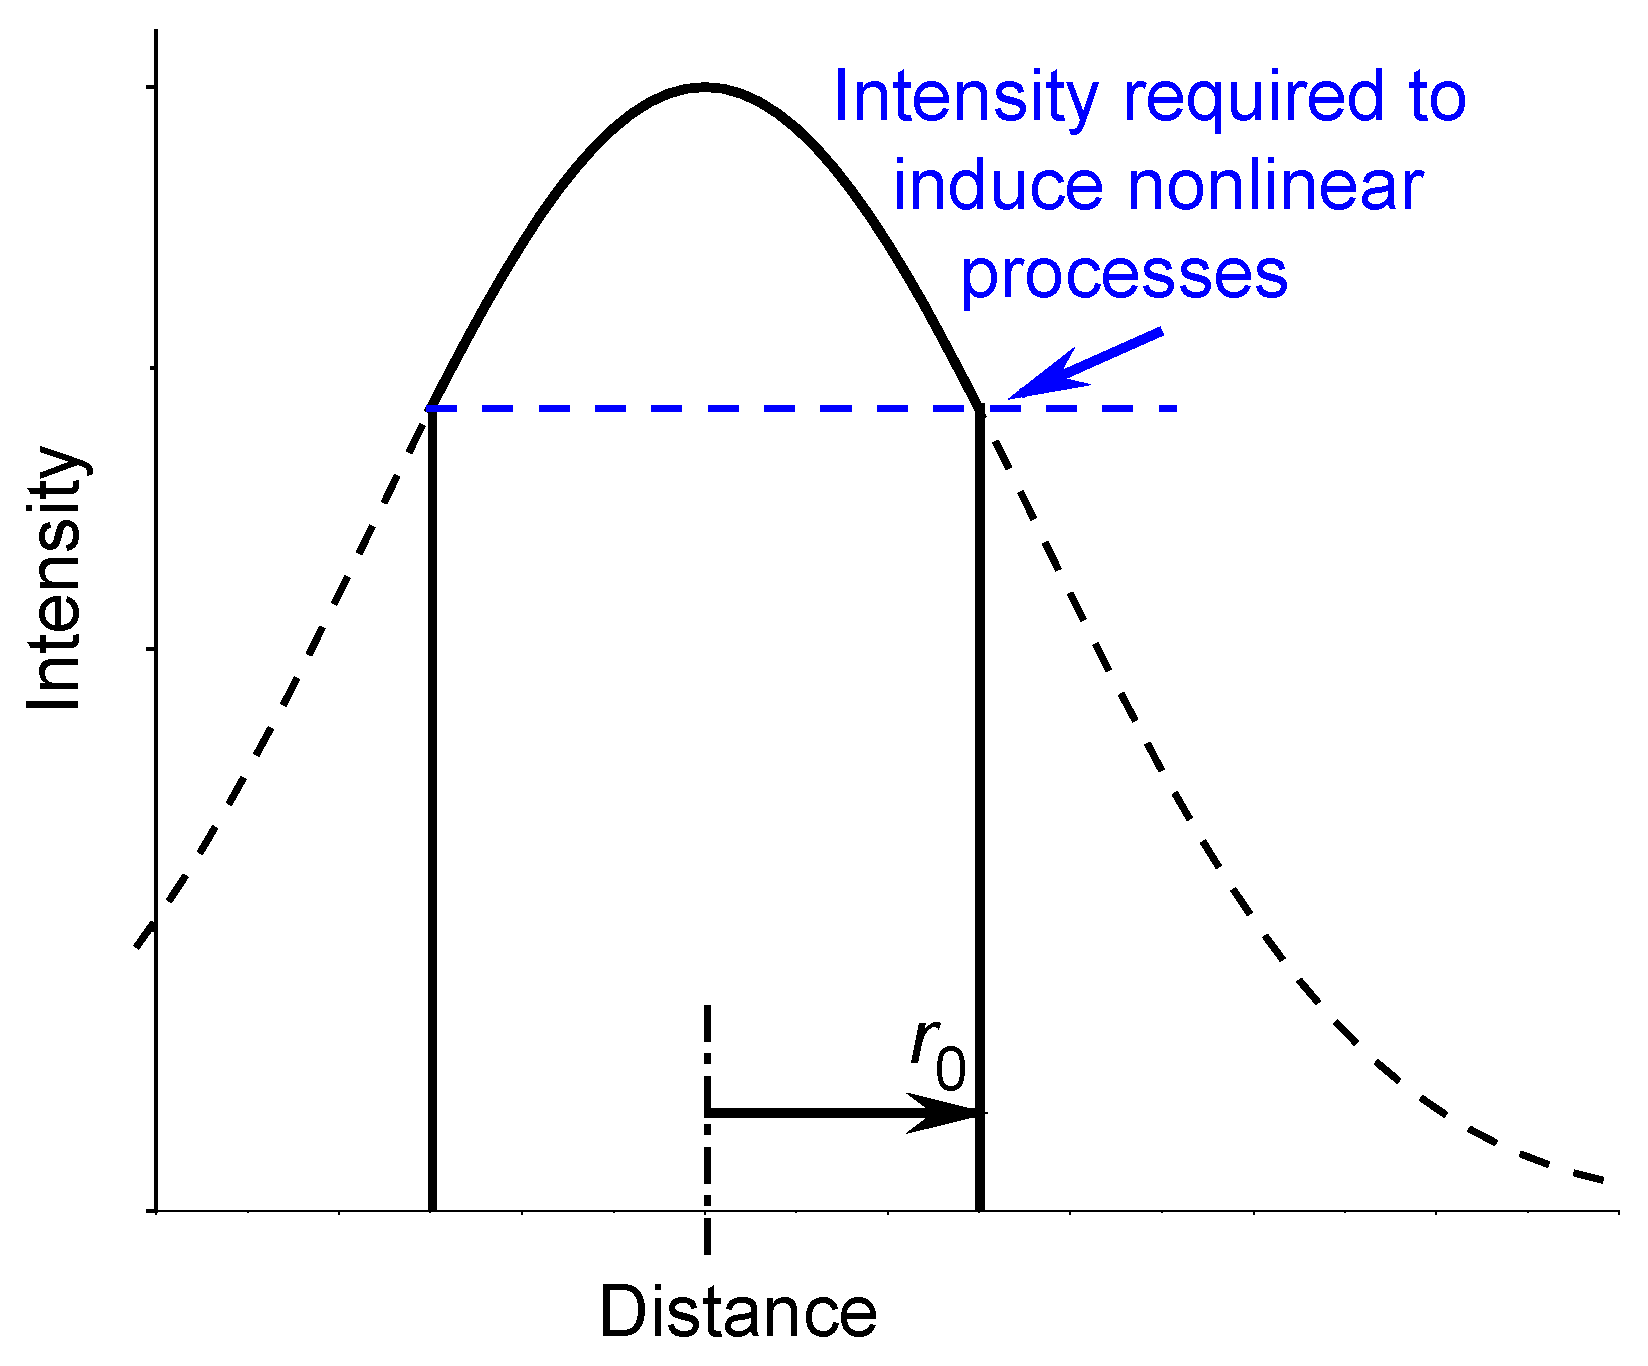
Femtosecond laser-induced microstructuring is a promising tool because the structures induced by femtosecond laser pulses can be even smaller than the optical diffraction limit of the beam focusing, since multiphoton absorption is most effective in the central part of the beam focus. Typically, in laser-induced microstructuring, the laser pulse duration
is of the order of 100 fs and the radiation wavelength is about 1 μm. When a transparent material is irradiated with a powerful femtosecond laser pulse focused into a micro-sized focusing zone, multiphoton absorption of the laser radiation energy by electrons of the irradiated material occurs. The energy of the electrons in the laser focus increases sharply during
due to electron-photon interaction. The electrons then transfer their energy to the lattice through electron-phonon interaction. The thermalization process takes approximately tens or hundreds of picoseconds [
6,
10,
39,
40]. Consequently, the duration of heating pulses
that heat the material can be on the order of tens to hundreds of picoseconds. Thus, the material can be locally heated above the glass transition temperature
and melting temperature
. Heat then spreads through the material and the hot focal zone is rapidly cooled below
.
In this article, we will consider laser pulses of moderate energy
(in the range 10 – 100 nJ), sufficient to locally heat the material well above the glass transition temperature
, but not sufficient to destroy the material with the formation of voids. Thus, the intensity of the laser pulses considered in this article is below the material damage threshold, which, for example, for silica glass is about 10
16 W/cm
2 [
41]. We focus on micrometer-scale local thermal perturbations caused by laser pulses near or below the threshold ionization intensity of a material. The threshold ionization intensity of most transparent solids ranges from 10
13 to 10
14 W/cm
2 for light with a wavelength of about 1 μm [
42,
43]. For example, the threshold intensity in silica glass and similar glass-forming materials is about 10
13 W/cm
2 for light pulses with a wavelength of about 1 μm and a duration of 100 fs [
42].
Thus, we will consider thermal processes in dielectric glasses below the threshold intensity of ionization of the material and in the time interval after electron-phonon thermalization, when there is no electron-hole plasma. Thus, we are interested in changes in lattice temperature on a time scale outside the time interval when a multi-temperature model is usually considered [
12,
13,
14]. In fact, we are interested in changes in lattice temperature that affect the structure of the material at moderate laser pulse energies and time
exceeding the electron-phonon thermalization time.
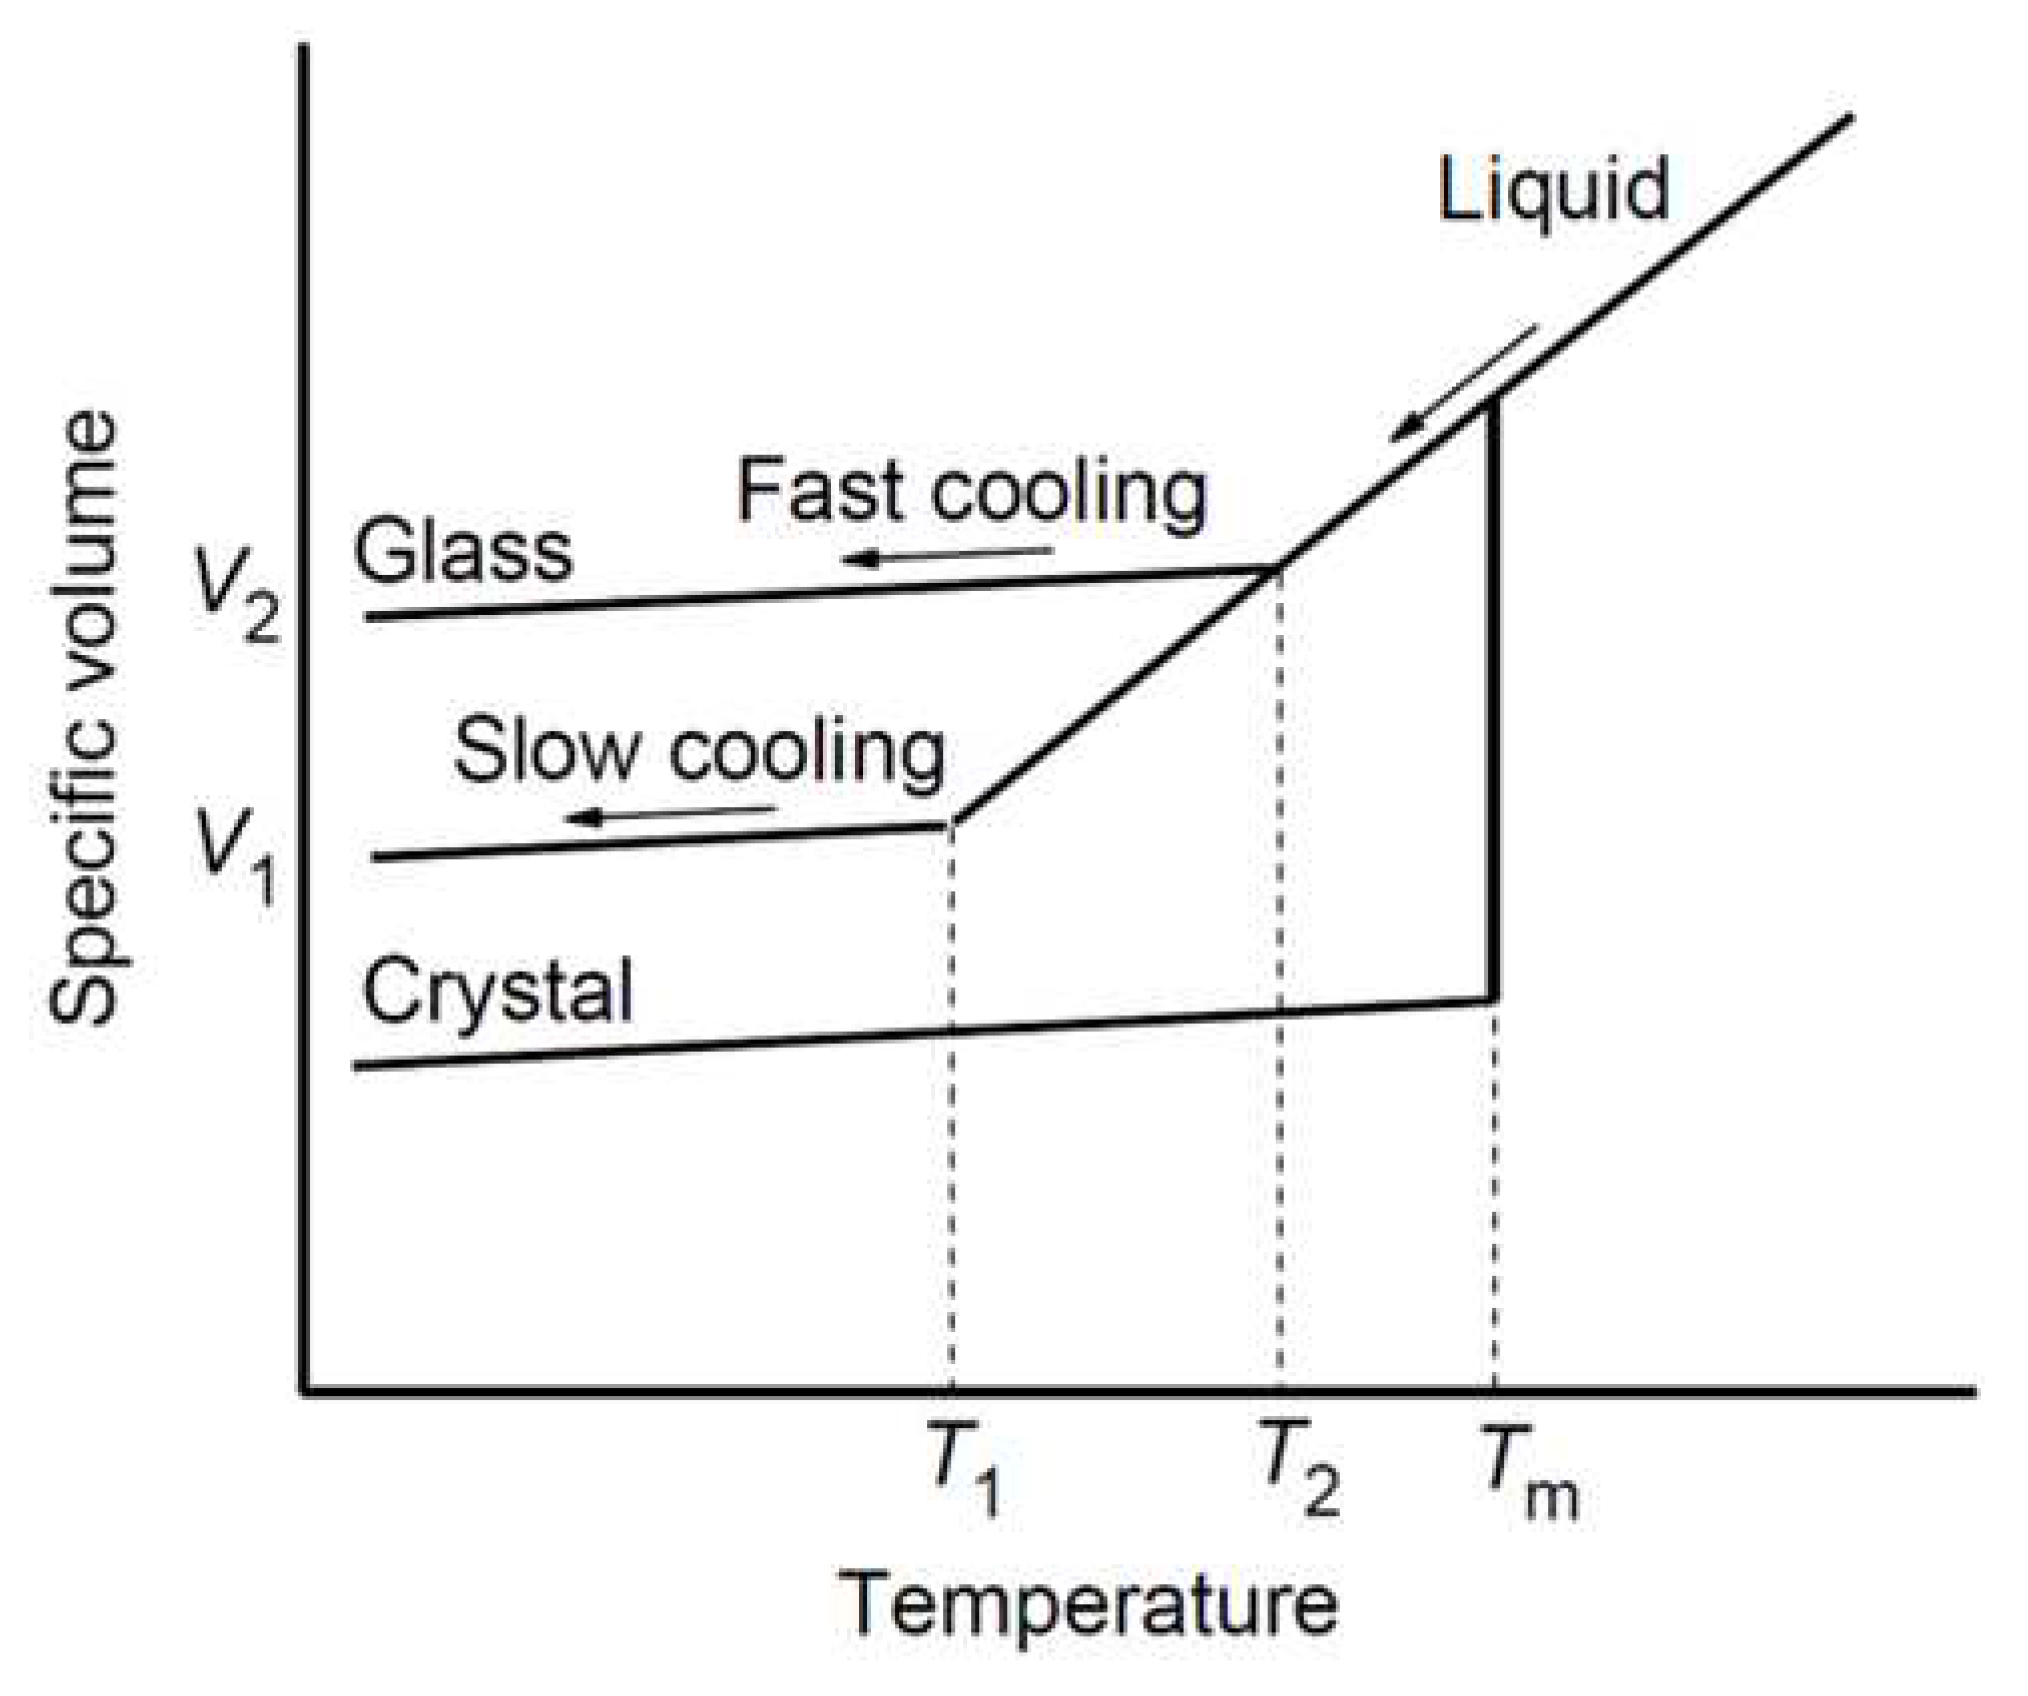
The initial structure of glass-forming materials is not completely restored after the rapid heating-cooling cycle, which leads to a change in the local properties of the material in rapidly cooled areas. The local structure, specific volume, density, Rayleigh scattering loss and refractive index of glass-forming materials significantly depend on the local cooling rate [
19,
44,
45], see
Figure 1.
Figure 1.
Schematic diagram of the specific volume as a function of temperature for glass-forming materials at different cooling rates and . Liquid structures freeze to a glassy state with at .
Figure 1.
Schematic diagram of the specific volume as a function of temperature for glass-forming materials at different cooling rates and . Liquid structures freeze to a glassy state with at .
Thus, we focus on the dynamics of the temperature distribution
and study the local cooling rate
near the focal region during laser-induced microstructuring. Measurements of the temperature distribution at the focus of the laser beam can be carried out using micro-Raman spectroscopy [
46,
47,
48]. However, the time resolution of Raman spectroscopy (with a measuring pulse duration of about 10 ns and a repetition rate of 1 kHz) is not sufficient to detect ultrafast changes in the local temperature
. We found that the local cooling rate
after the end of the heating pulse can reach more than 10
11 K/s in a thin layer around the focus of the laser beam. In fact, to resolve such ultrafast temperature changes at the periphery of the hot focal zone requires a temporal and spatial resolution of at least about 0.1 ns and 10 nm, respectively, since the cooling rate
reaches about 600 GK/s in a narrow layer around the hot zone at the laser focus (see below). Thus, the maximum change in the glass structure occurs at the periphery of the focal region (where the material undergoes ultrafast quenching). In fact, laser microstructuring of glasses makes it possible to form micron-sized domains that are close to spherical or ring-shaped, with a modified glass structure at the periphery of the domains [
19,
34,
36,
40,
46,
49,
50,
51,
52,
53]. For example, local modification of silver-doped phosphate glasses with the laser pulse energies
in the range of 10 – 100 nJ led to the formation of micron-sized ring-shaped domains due to the aggregation of silver nanoclusters at the periphery of the domains [
49]. Laser pulse energy
and pulse repetition rate play an important role in the microstructuring of glass-forming materials. In fact, laser pulses with a sufficient repetition rate can provide cumulative heating near the focus of the laser beam. In this article we will focus on the effect of single laser pulses (the effect of repetition rate will be discussed in a separate article).
The temperature change associated with the heating pulse Is of the order of
, where
and
are the heat capacity and volume of the heating zone;
and
are the density and specific heat capacity of the material. The thermal effect caused by elastic deformations is negligible compared to
, at least at moderate
, say in the range of 10 – 100 nJ for a focal region of about 1 μm radius. Indeed, the thermoelastic pressure in the hot zone is less than the maximum pressure response
to the temperature change
at constant volume, where
and
are the bulk modulus and the volumetric thermal expansion coefficient. However, the volume of the hot zone is not rigidly fixed by the material surrounding this zone. In fact, a pressure wave is created around the hot zone [
54,
55]. In this case, the thermoelastic pressure is even less than
. Thus, the elastic energy associated with the thermoelastic pressure in the hot zone of volume
is less than
. Therefore, the relative effect associated with thermoelastic deformations does not exceed
. For example, for sodium-lime-silicate glasses with the composition Na
2Oꞏ2CaOꞏ3SiO
2,
is about 1% at
2000 K,
55 Gpa,
2.8 g/cm
3,
1.14 J/gK,
, and linear thermal expansion
7.7ꞏ10
-6 1/K [
56,
57,
58,
59,
60]. This ratio is even lower for borosilicate glasses with a low coefficient of thermal expansion [
61]. For example, for borosilicate glasses such as Pyrex, the
ratio is about 0.1% at
2000 K,
33 Gpa,
2.23 g/cm
3,
1.1 J/gK, and
3.3ꞏ10
-6 1/K [
61,
62,
63,
64]. However,
becomes comparable with
at laser pulse energies approximately 2 orders of magnitude higher than those considered in this work. We are interested in local temperature changes in a micron-sized hot zone at
, when the pressure waves created around the hot zone are already at a distance of more than 1 – 2 μm from the hot zone. However, at the same time, the front of the temperature change extends only about ten nanometers from the periphery of the hot zone. Thus, we consider the change in local temperature after the local pressure in the hot zone has almost stabilized. For example, in silicate glasses at
0.5 ns, the distance
is about 3 µm at the longitudinal speed of sound
6ꞏ10
3 m/s [
59], and
10 nm at the thermal diffusion coefficient
of about 3ꞏ10
-7 m
2/s [
57,
63,
65].
It Is noteworthy that an Important property of glass-forming materials is the long-term relaxation of the specific heat capacity with rapid changes in temperature. Thus, the heat capacity of glass-forming materials must be considered as a function of time
[
66,
67,
68]. In fact, if a glass-forming material is heated to a liquid state with heat capacity
from a solid glassy state with heat capacity
, then the heat capacity of the material does not change immediately with the change in temperature, but slowly relaxes from
to
, see below. Long-term relaxation of the dynamic heat capacity
of glasses is due to the slow exchange of energy between different degrees of freedom in glasses. Thus, the thermal response of glass-forming materials to a thermal perturbation at time
depends on the temperature at earlier times. The effect of long-term relaxation of dynamic heat capacity significantly affects the dynamics of local temperature changes
[
69,
70]. In turn, the rate of change in local temperature
can significantly affect the micro-structuring of glass-forming materials [
19,
38,
44,
45,
71]. An experimental study of the dynamics of the temperature distribution
inside a glass matrix under the action of fast laser thermal perturbations is very difficult. Therefore, it is necessary to develop theoretical models of thermal processes occurring during laser-induced structuring of glasses. In this paper, we will focus on modeling such thermal processes, taking into account the relaxation effect of the dynamic heat capacity
. The dynamic behavior of glass-forming materials under fast local thermal perturbations can be described using the integro-differential heat equation with “memory” [
69,
70]. This equation has an analytical solution, at least in spherical, cylindrical and planar geometries [
69,
70,
72]. This work aims to determine the dynamics of local temperature changes, especially the local rate of the temperature change
, associated with laser-induced thermal excitations during laser processing of glasses. An analytical method for determining
and
has been developed. The knowledge obtained can be useful for various technologies related to laser-induced microstructuring.
In the first part of the article, the heat equation with dynamic heat capacity is considered. An analysis of the dynamic heat capacity of glass-forming materials has been conducted and an analytical solution of the heat equation with dynamic heat capacity for a spherically symmetric problem has been constructed. Then, the temperature distribution is calculated for glasses with dynamic heat capacity under local fast laser excitations. Examples with borosilicate and sodium-lime-silicate glasses are considered at different heating pulses and dynamic heat capacity parameters. Finally, the local distribution of the cooling rate and its influence on the microstructuring processes of glasses is discussed.
3. Temperature distribution in glasses under local thermal perturbations
For example, let us consider the two most common types of silicate glasses: sodium-lime-silicate glasses (Na
2O-CaO-SiO
2), as the most widely used of all industrial glasses, known for their low cost and availability, and borosilicate glasses (B
2O
3-SiO
2), which are widely used due to their low coefficient of thermal expansion and high resistance to chemical attack. Sodium-lime-silicate glass with the composition Na
2Oꞏ2CaOꞏ3SiO
2 and borosilicate glass of the Pyrex type were chosen as model systems due to the availability of the necessary parameters [
57,
58,
61,
62,
63,
64,
65]. The thermal parameters of these glasses are collected in
Table 1.
3.1. Influence on of the shape and duration of heating pulses
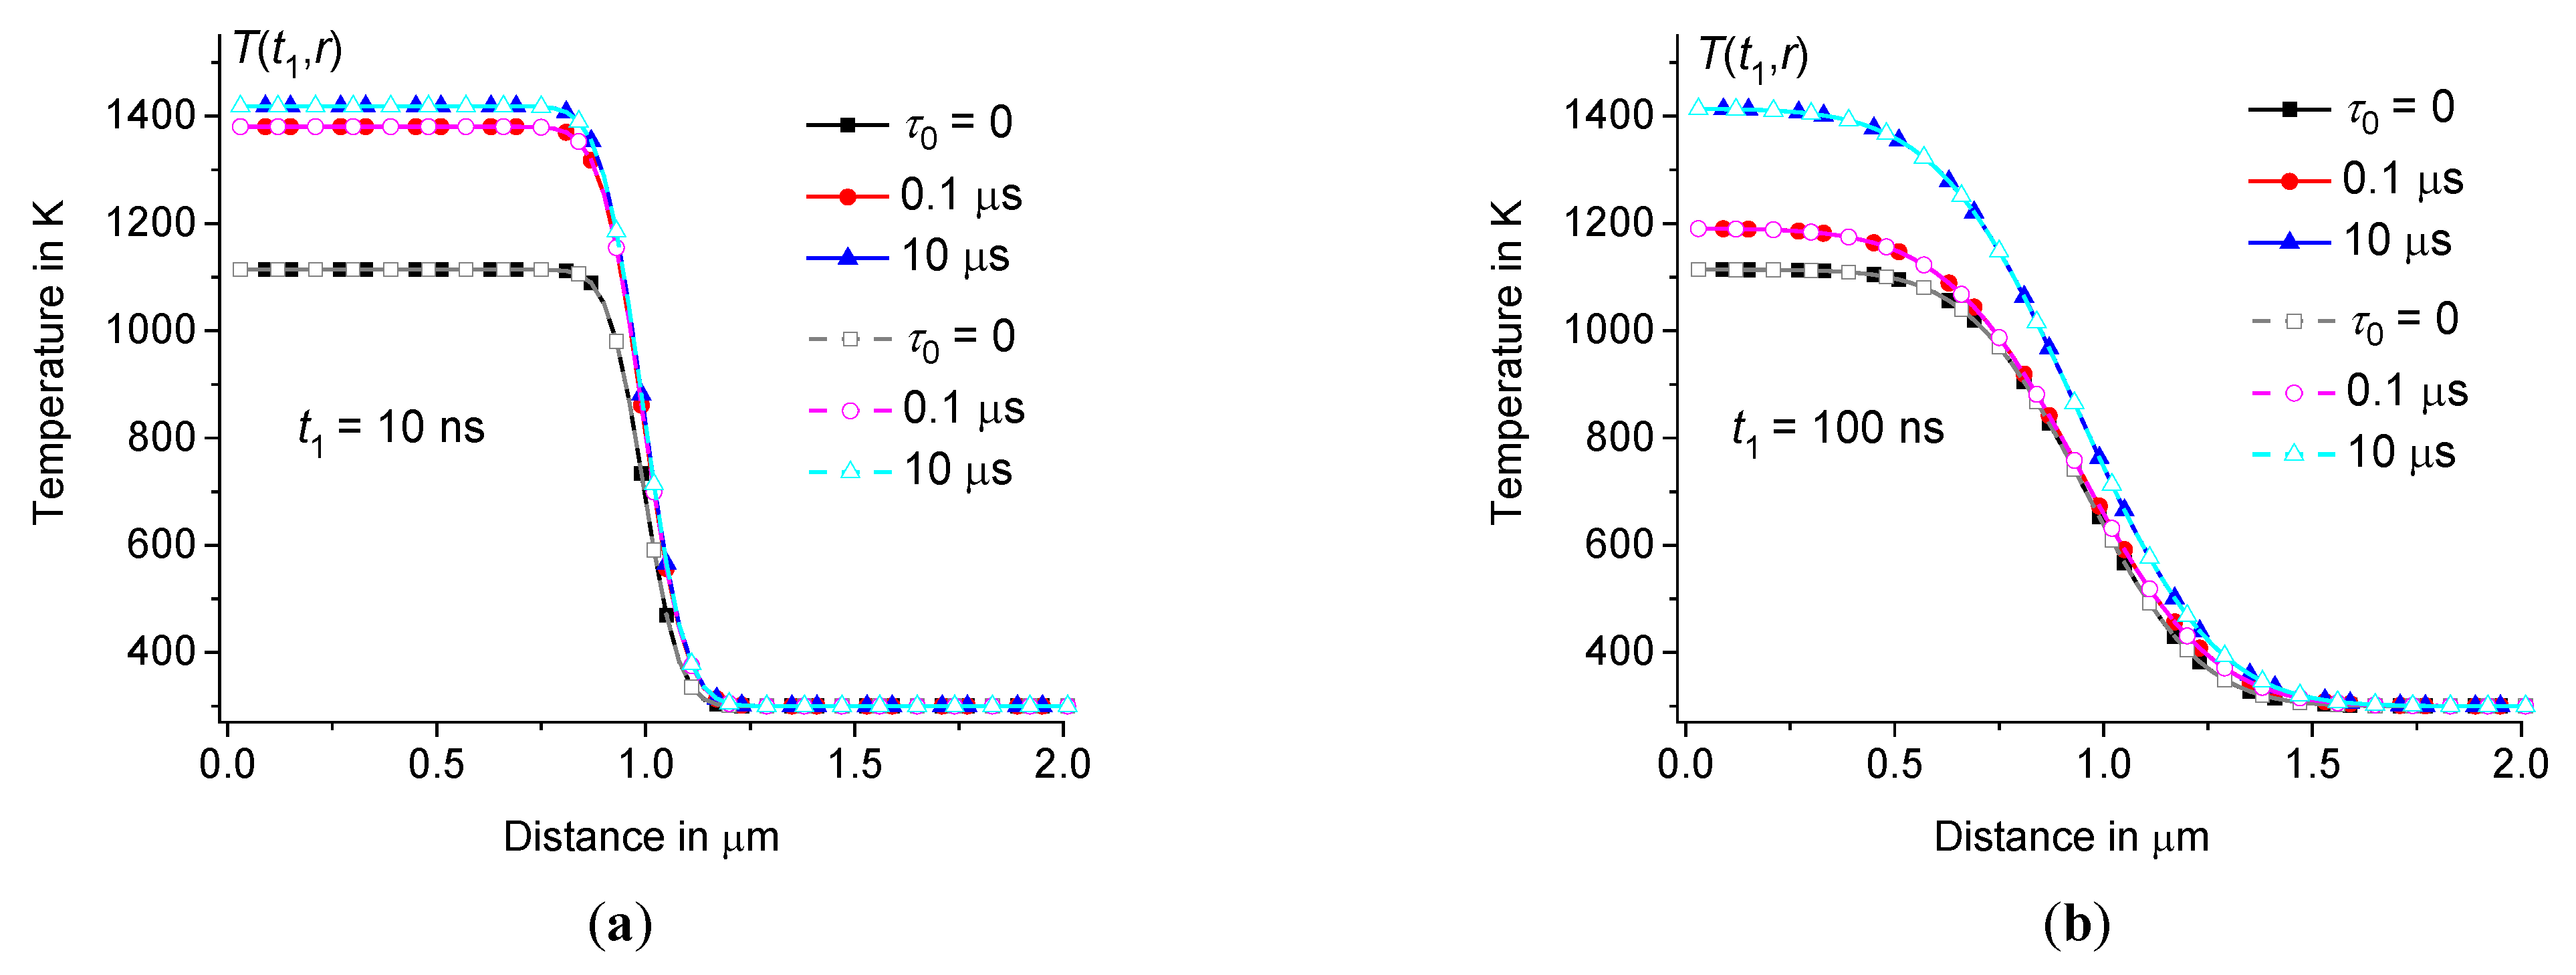
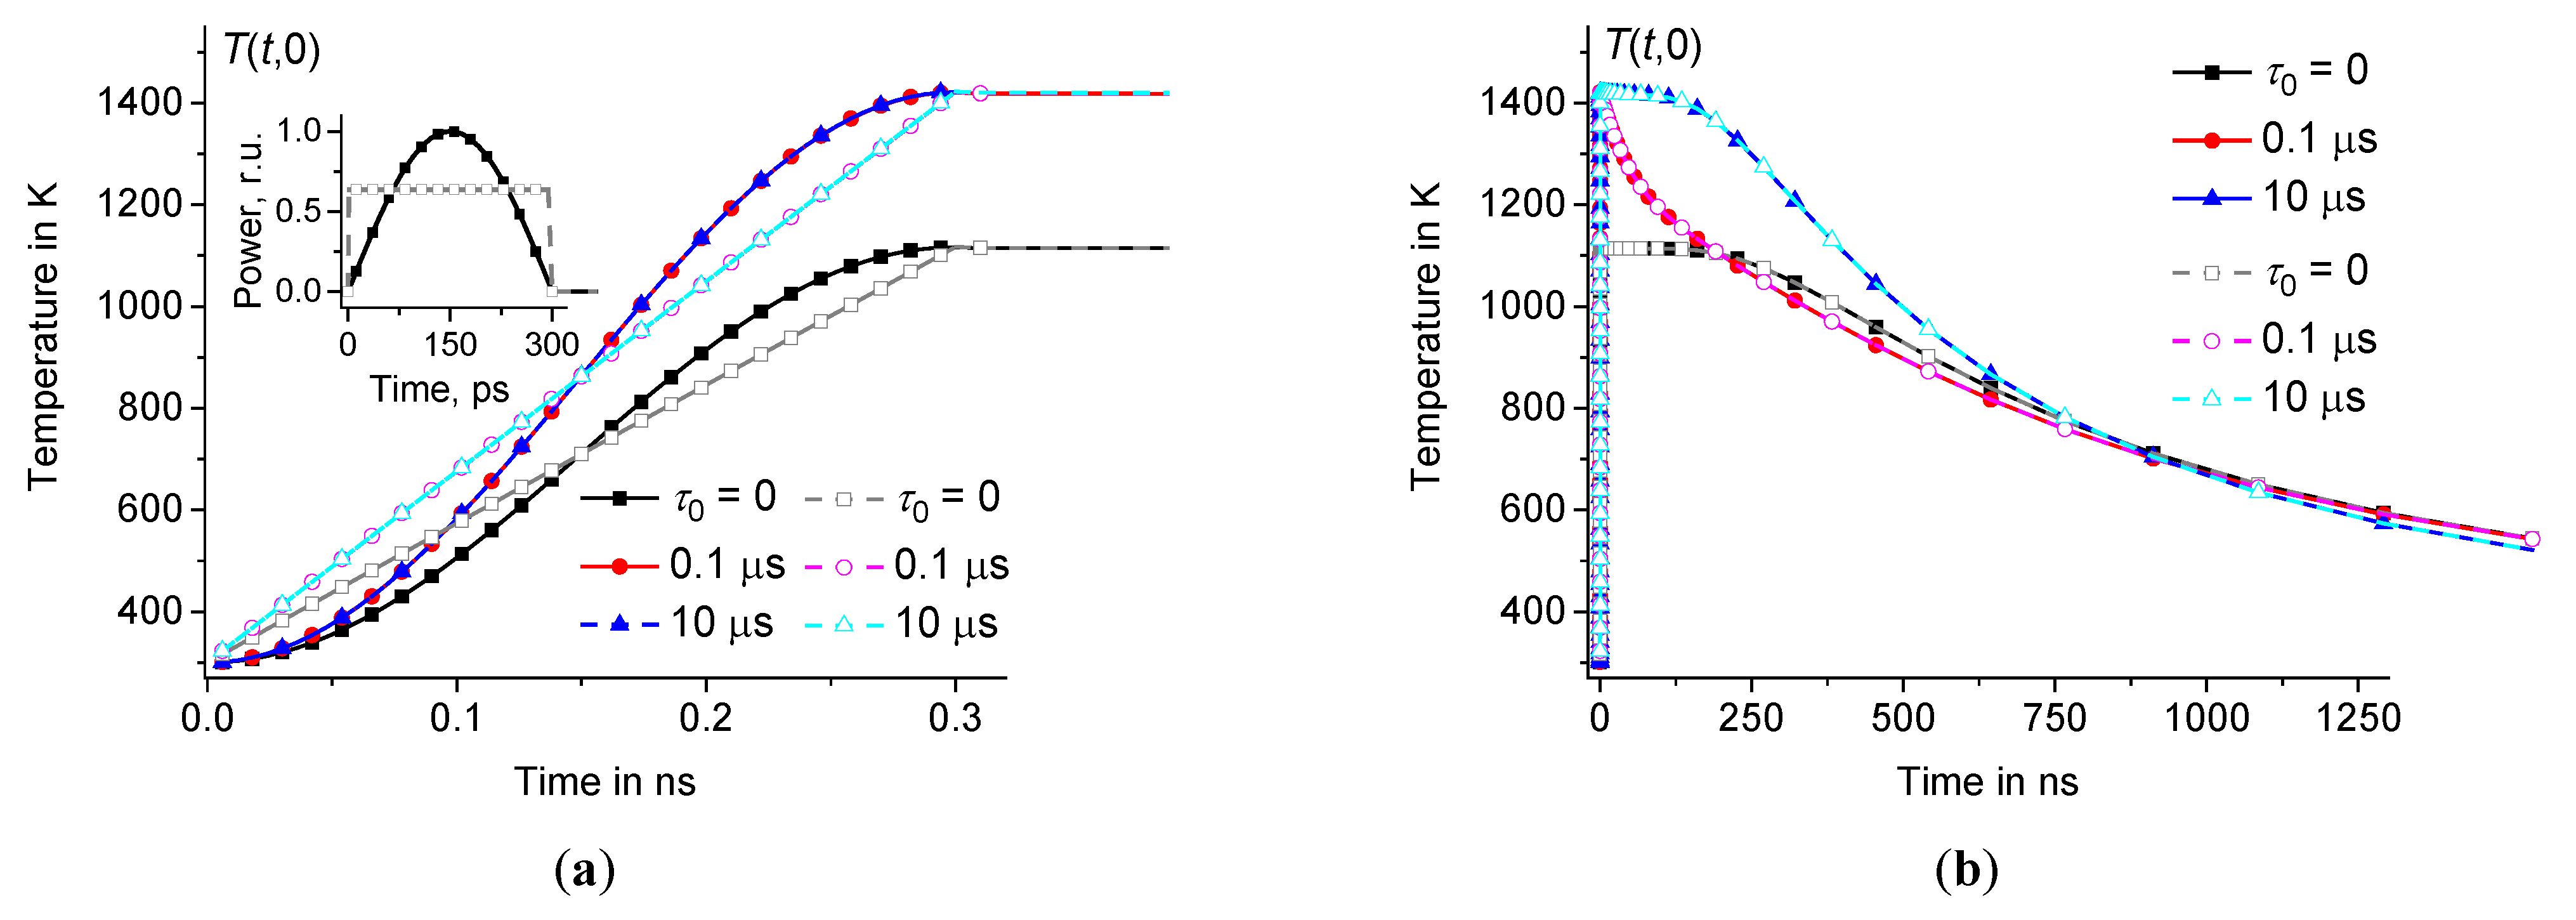
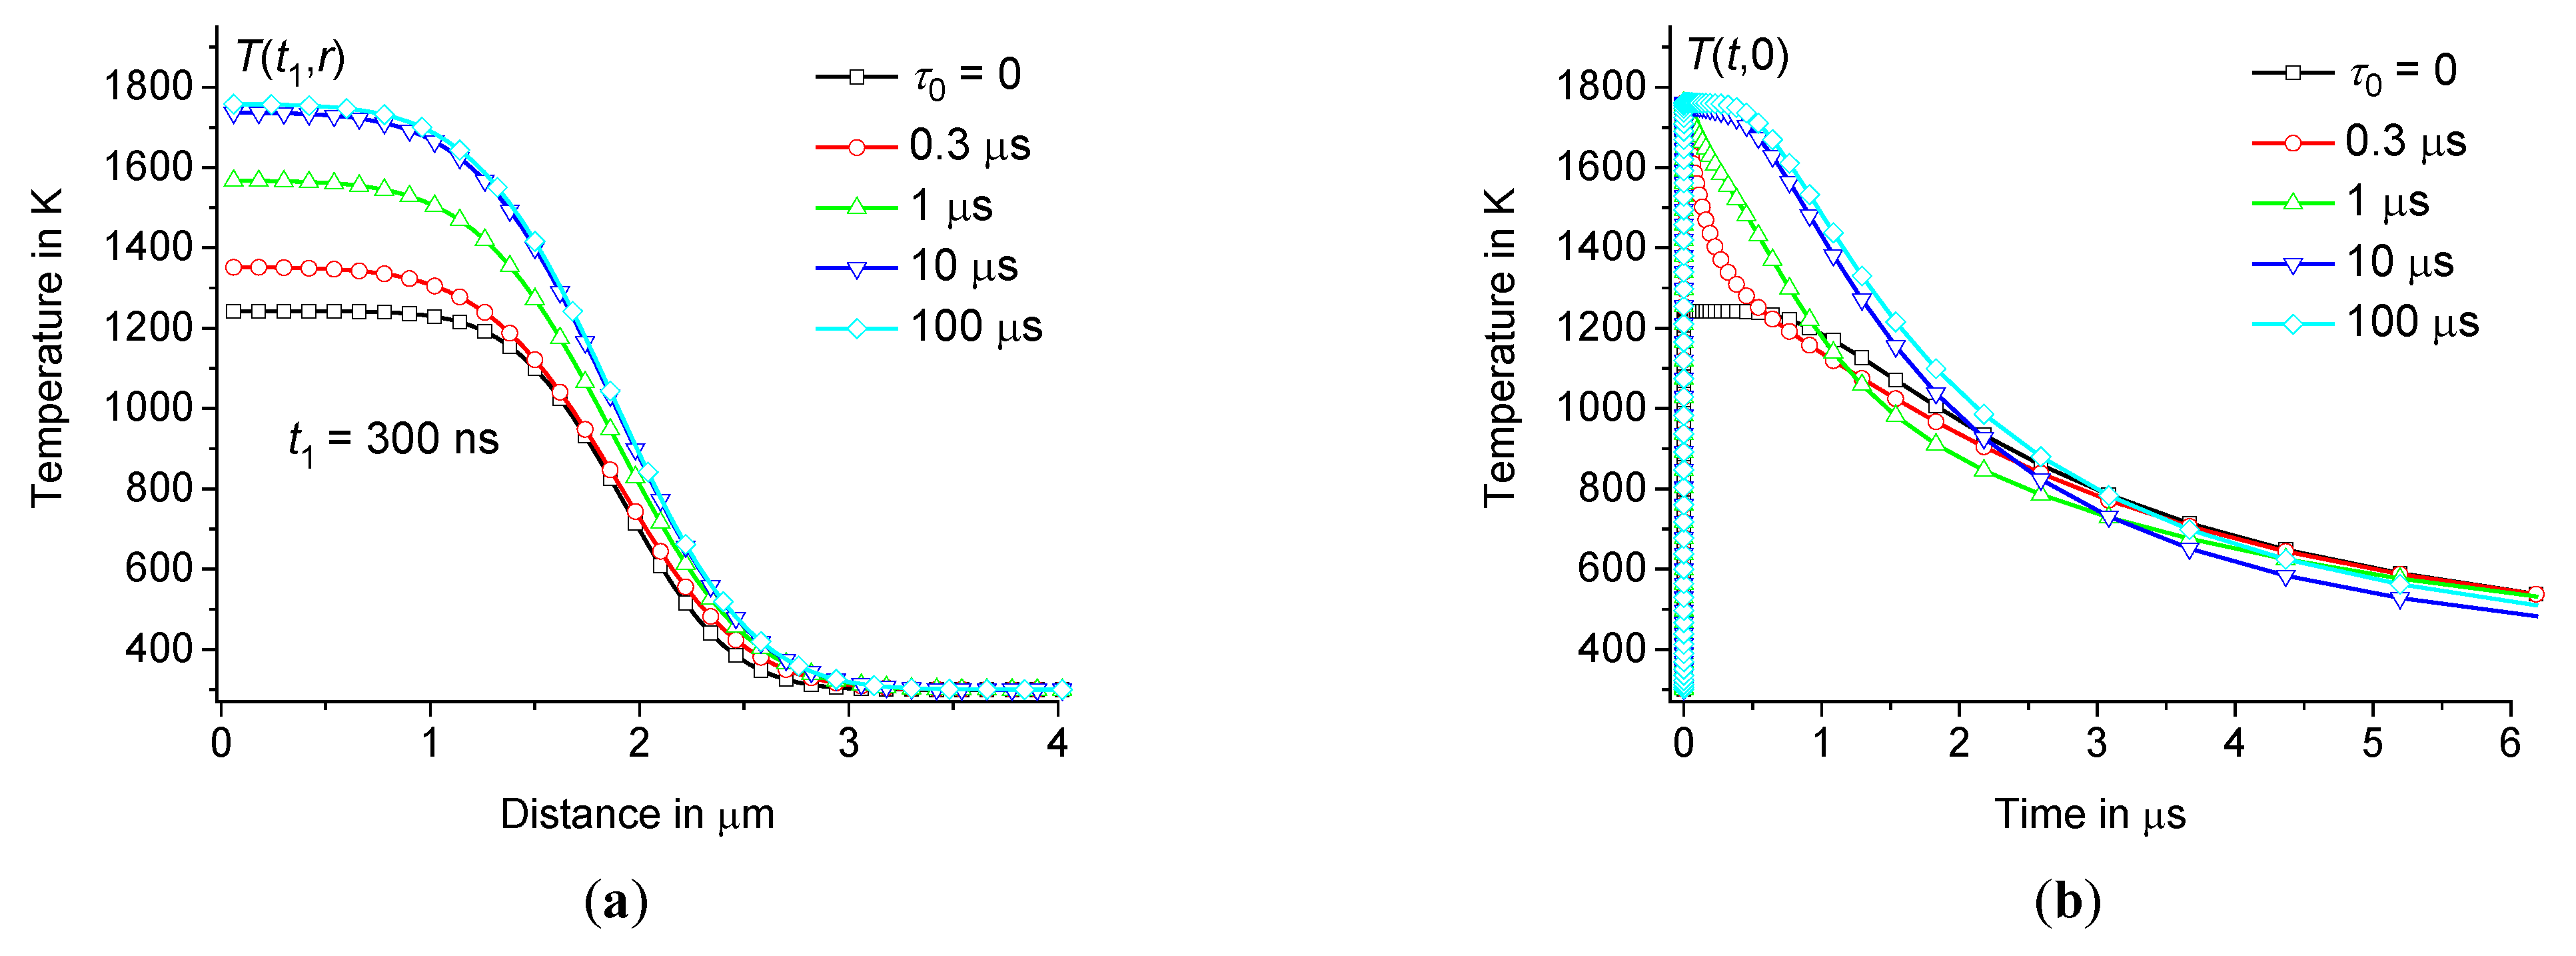
Thus, for model calculations, we use a heating pulse with a power density , acting during the time interval in a spherical region with a radius 1 μm. Let us compare the results for heating pulses with , having half-sinusoidal and rectangular shapes, see Figures3 and 4. Let the initial temperature 300 K, 300 ps, 15 nJ, and the volume of the spherical heating zone . Thus, is equal to and for half-sinusoidal and rectangular heating pulses, respectively. In this case, the energy of these pulses is the same and equal to . The temperature distribution can be calculated according to Eqs.(8) – (9) at various .
For example, for sodium-lime-silicate glass (see Table 1), at 0, 0.1 μs, and 10 μs is represented in Figures3 and 4. The temperature distribution is calculated at (for example, at 30 μm). As follows from direct calculations, the result does not depend on , at least on the time scale , where for the glasses under consideration is about 3 – 4 ms. Whereas we are interested in changes in the temperature distribution on a time scale of microseconds and less, when the temperature changes are localized within a few micrometers, see Figure3.
The influence of the time dispersion of the dynamic heat capacity is significant, see Figures3 and 4. The difference between equilibrium ( 0) and non-equilibrium ( 0) solutions increases with the growth of . The shape of the change in heating power over time is significant only during the time interval , see Figure4(a). However, this shape is not significant at , see Figures3 and 4(b).
Figure 3.
Temperature distribution in the hot zone depending on the distance at 10 ns (a) and 100 ns (b) for heating pulses of half-sinusoidal shape (filled symbols) and rectangular shape (open symbols) in sodium-lime-silicate glass at 1 μm, 300 ps, 15 nJ, and 300 K ( 0, 0.1 μs, and 10 μs – squares, circles, and triangles, respectively).
Figure 4.
Time dependence of in the center of the hot zone during (a) and after (b) the heating pulses of half-sinusoidal shape (filled symbols) and rectangular shape (open symbols) at the same parameters as in Figure3 ( 0, 0.1 μs, and 10 μs – squares, circles, and triangles, respectively). Inset (a) shows pulse power as a function of time.
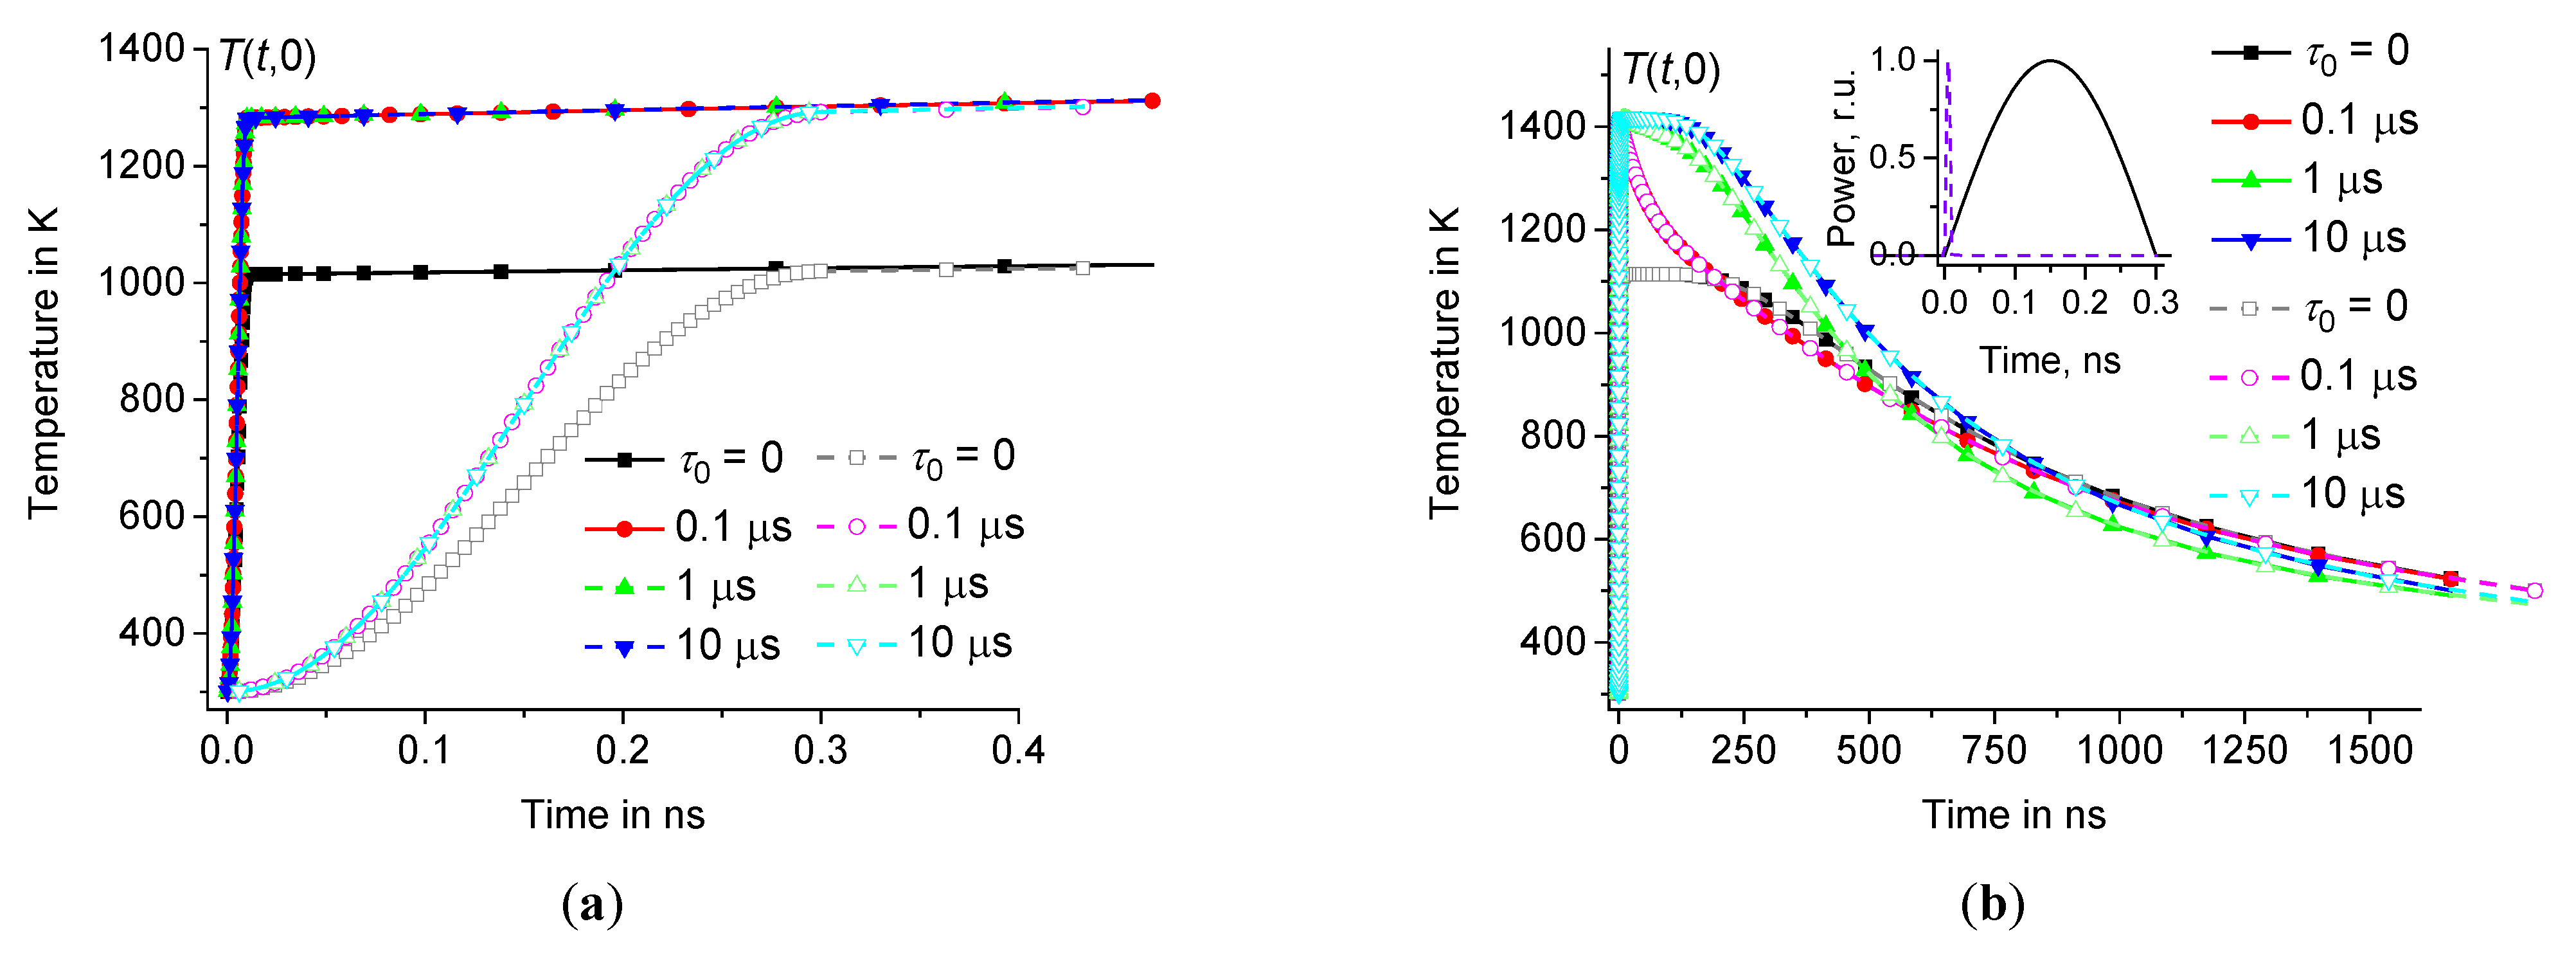
The duration of the heating pulses is also not significant for the temperature distribution at , see Figure5. For example, compare for pulses with 10 ps and 300 ps and the same parameters as in Figure3. The duration of heating pulses is significant only during the time interval , see Figure5(a). However, this duration is not significant at , see Figure5(b).
Figure 5.
Time dependence of in the center of the hot zone during (a) and after (b) the heating pulse of half-sinusoidal shape at 10 ps and 300 ps – filled and open symbols, respectively, at the same parameters as in Figure3 ( 0, 0.1 μs, 1 μs, and 10 μs – squares, circles, triangles up, and triangles down, respectively). Inset (b) shows pulse power as a function of time for short and long pulses – dotted and solid lines, respectively.
Thus, the temperature at the center of the hot zone increases very fast over the time interval from to the maximum value and then relaxes relatively slowly on a microsecond time scale, see Figures4 and 5. The influence of time dispersion of dynamic heat capacity is significant on time scales of several hundred nanoseconds or less. The solution associated with the dynamic heat capacity (at 0) tends to the classical solution (corresponding to 0) when reaches approximately 1 μs, see Figures4(b) – 5(b).
3.2. Comparison with the fundamental solution of the classical problem
It is often believed that the hot focal spot should spread and cool down according to the law
and
, respectively [
19,
47,
81,
82]. This assumption is based on the fundamental solution of the Fourier heat equation, which can be represented by the following function [
83]:
where
is the Heaviside unit step function and
is the distance from the instantaneous point heat source. However, for a non-point heat source, the approximation of
by this function is not satisfactory. The real dependence
differs significantly from Eq.(11) [
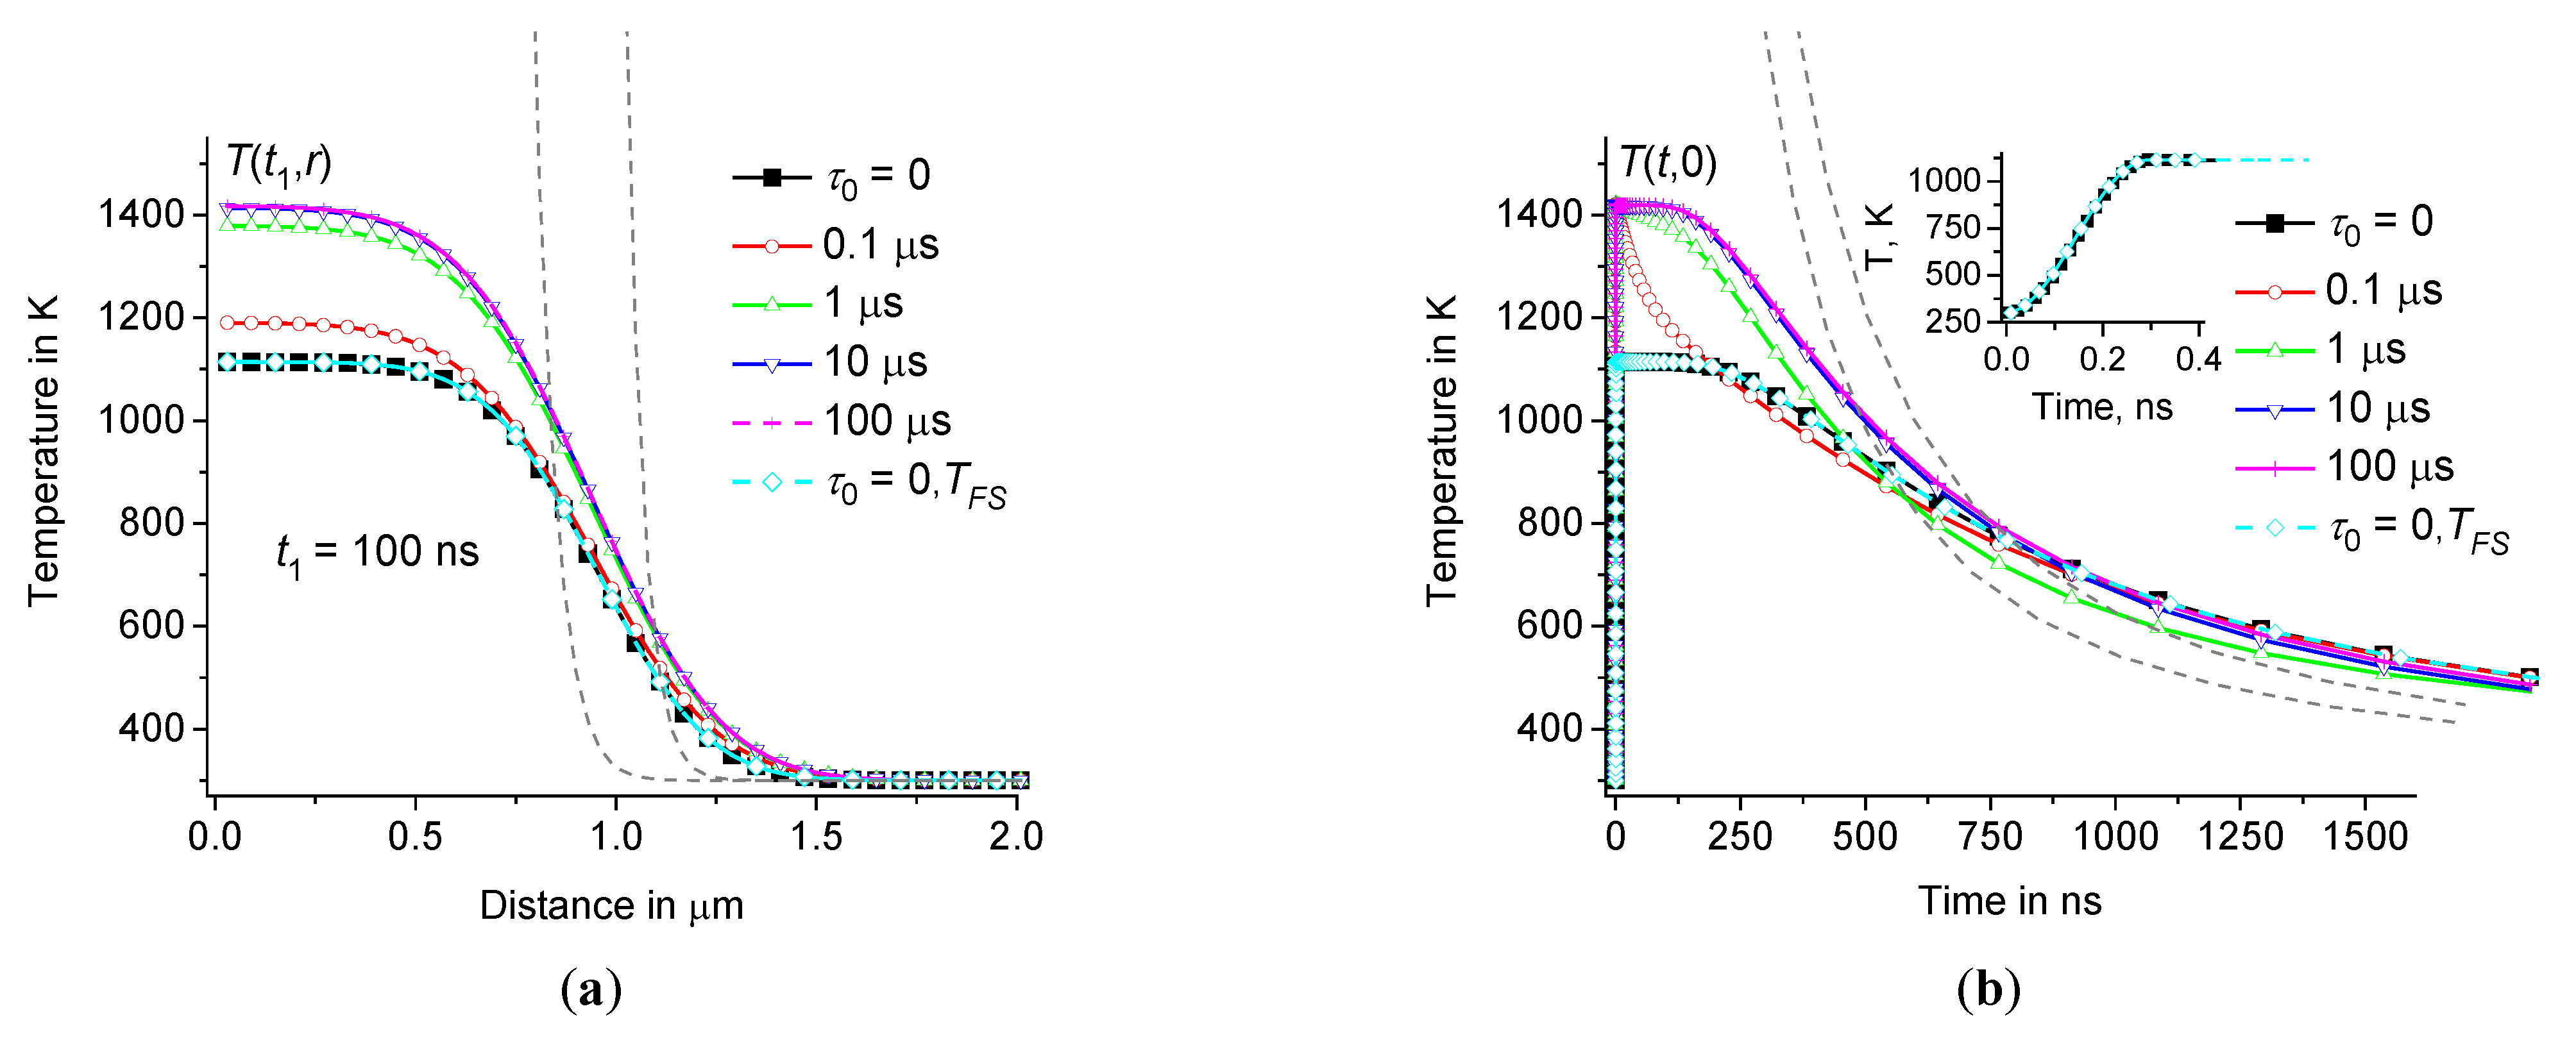
46]. As expected, the temperature perturbation
in the center of the heating zone relaxes in a time of the order of
. However,
remains near the maximum value
at
0.1 μs (see Figure6), and only then
relaxes over a time of the order of
. In contrast to the estimate based on the fundamental solution of the Fourier heat equation, the temperature perturbation
relaxes approximately as
, and not as
, see Figure6. In fact, to obtain the correct temperature distribution
using the fundamental solution, it is necessary to integrate the thermal response over the time interval
and the volume of the heating zone. Thus, for the heat source
considered above, distributed in a volume with radius
and acting on the time interval
, we obtain the temperature distribution
:
where
). As expected, the solution
completely coincides with the temperature distribution
, calculated using Eqs.(8) – (9) at
0, see Figure6. In contrast, the simplified estimate
is far from the correct
even for any correction factor
, see Figure6.
Figure 6.
depending on the distance at 100 ns (a) and time dependence of in the center of the hot zone (b) at the same parameters as in Figure3 ( 0, 0.1 μs, 1 μs, 10 μs, and 100 μs – squares, circles, triangles up, triangles down, and crosses, respectively, as well as for 0 – diamonds). Dotted lines show at = 1 and 100 (a), as well as at = 1/150 and 1/200 (b). Inset (b) shows the initial fragments of and at 0.
Thus, the correct calculation of the temperature distribution using the fundamental solution of the classical heat equation (without time dispersion) gives the same result as the calculation using Eqs.(8) – (9) at 0. However, using Eqs.(8) – (9) it is possible to calculate the temperature distribution for materials with dynamic heat capacity (at 0). It turns out that obtained at 0 increases with and tends to saturation at about 10 μs, see Figure6. For this reason, the shape of the distribution function has insignificant effect on . Next, we consider the influence of this distribution on , see Figures7 – 8.
3.3. Dependence of on the distribution of relaxation times
The influence of the time dispersion of the dynamic heat capacity is most pronounced at the beginning of the heating process on a nanosecond time scale, see Figure6(
b). This effect is significant already at
about 0.1 μs, increases with increasing
and reaches saturation at
above
, where
is about 4 μs at
1 μm and
2.6⸱10
-7 m
2/s for borosilicate glass. In fact, in glasses the relaxation times
are distributed over a wide range. The parameters of the VFTH relationship (see Eq.(5)) can be obtained from measurements of glass transition processes depending on the cooling rate. For example, we use these parameters for borosilicate glass [
64], sodium-lime-magnesium-silicate glass [
84], and sodium-silicate glass [
85]. The relaxation parameters of these silicate glasses used for model calculations are collected in
Table 2.
The dynamic heat capacity
can be modeled using Eq.(4), where
can be obtained from
(see Eq.(5)) using the relaxation parameters, see Table 2. Thus, we obtain the temperature distribution
averaged using the distribution function
, where
is obtained at several intermediate temperatures between
and
(
is the maximum value of the temperature
at the center of the hot zone). For example, set
700 K and 1000 K and consider the relaxation parameters for borosilicate glass [
64], sodium-lime-magnesium-silicate glass [
84], and sodium-silicate glass [
85], see
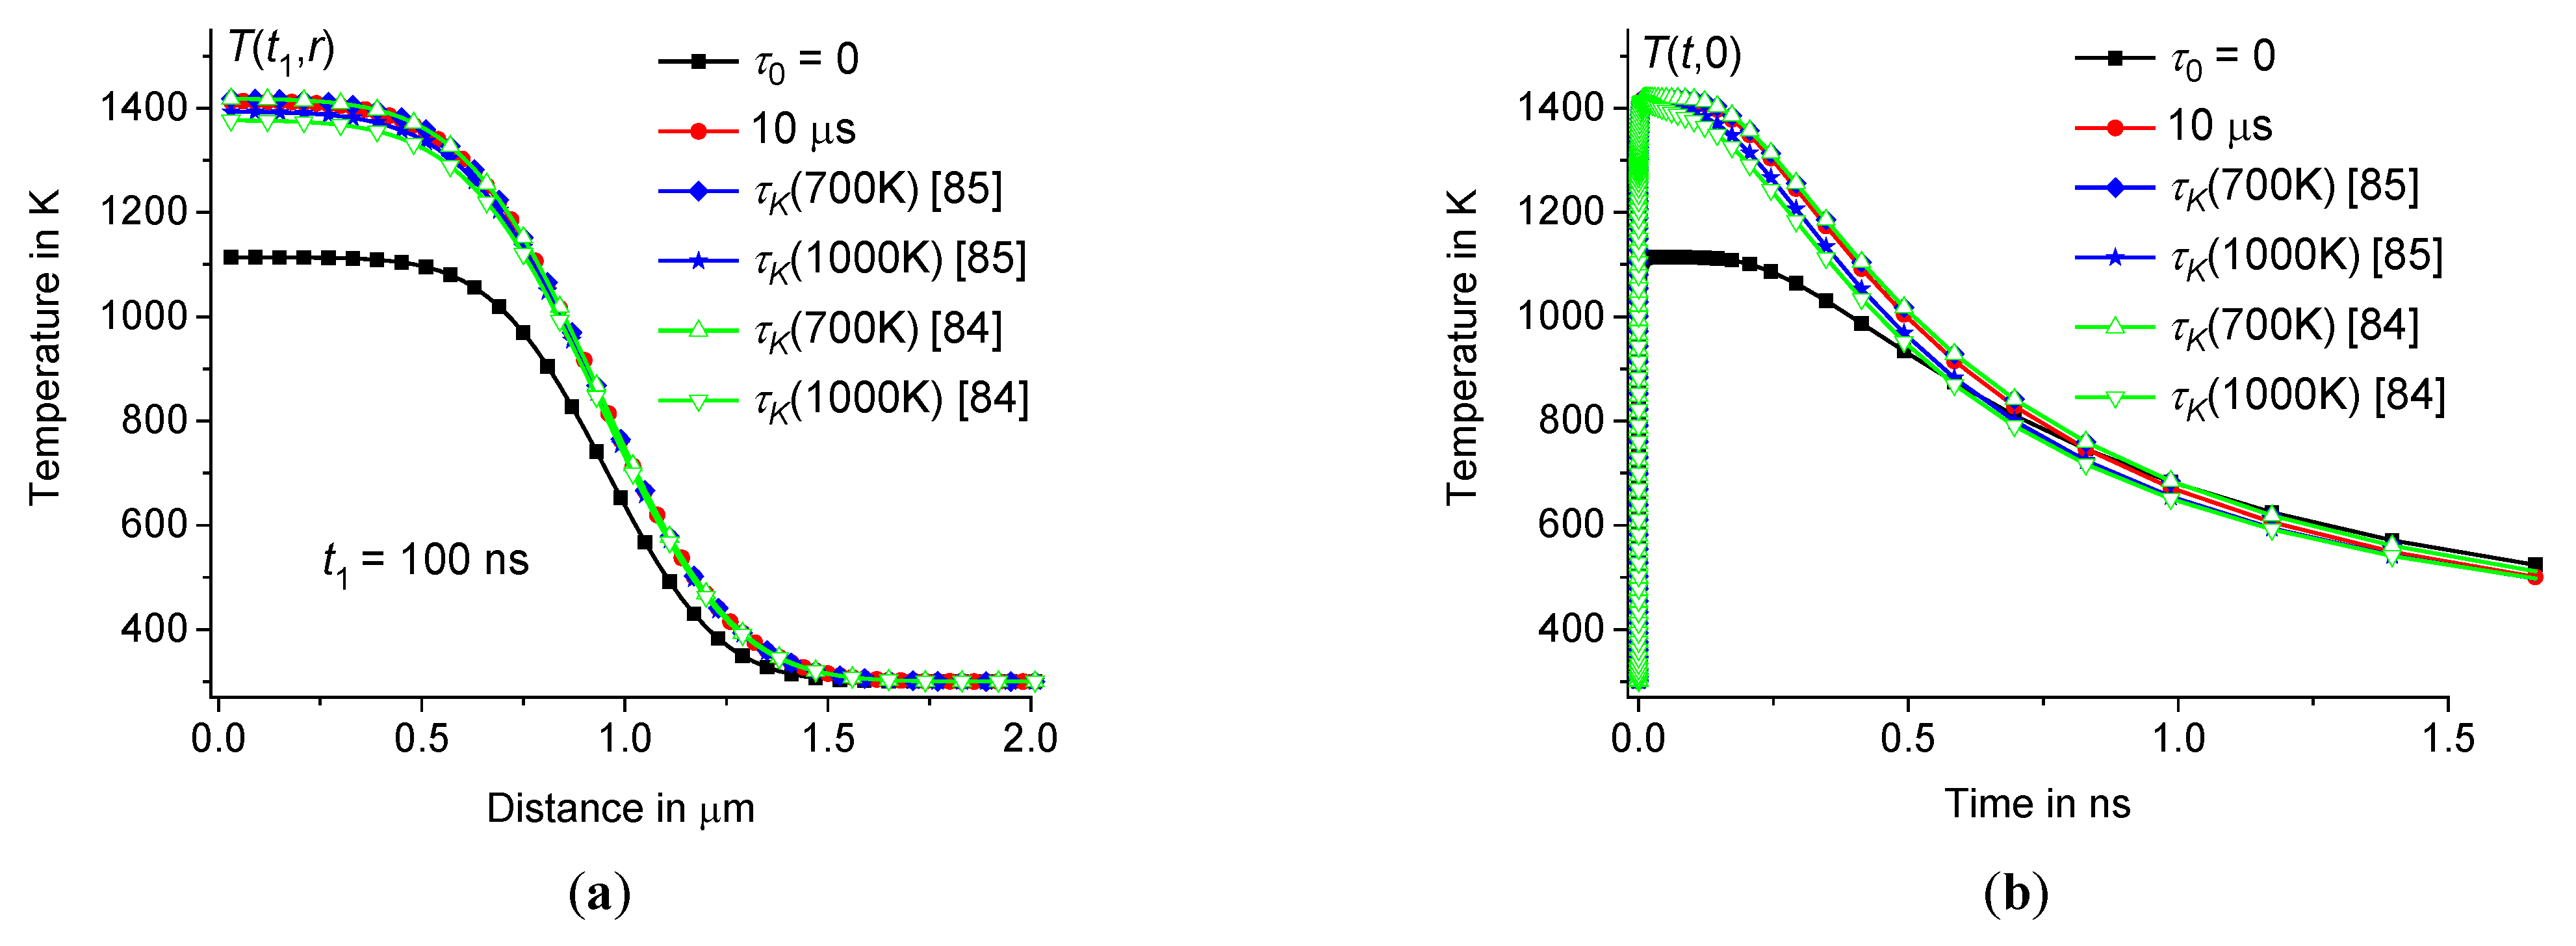
Table 2. The results are presented in Figures7 – 8. The difference between
, obtained for sufficiently large
10 μs, and
, obtained for
and
, is insignificant, see Figures 7 – 8. Since the influence of the time dispersion of the dynamic heat capacity reaches saturation at
about 10 μs, the shape of the distribution function
has little effect on the temperature distribution. Thus, the influence of the time dispersion of the dynamic heat capacity on the temperature distribution
can be calculated for a fixed, sufficiently large
.
Figure 7.
depending on the distance
at
100 ns (
a) and time dependence
in the center of the hot zone (
b) at the same parameters as in Figure3 (
0 and 10 μs – squares and circles). The temperature distribution
averaged using the distribution function
obtained from [
85] at
700 K and 1000
K – diamonds and stars
, as well as from [
84] at
700 K and 1000
K – triangles up and triangles down, respectively.
Figure 8.
depending on the distance
at
100 ns (
a) and time dependence
in the center of the hot zone (
b) for borosilicate glass at
1 μm,
10 ps, and
15 nJ
300 K (
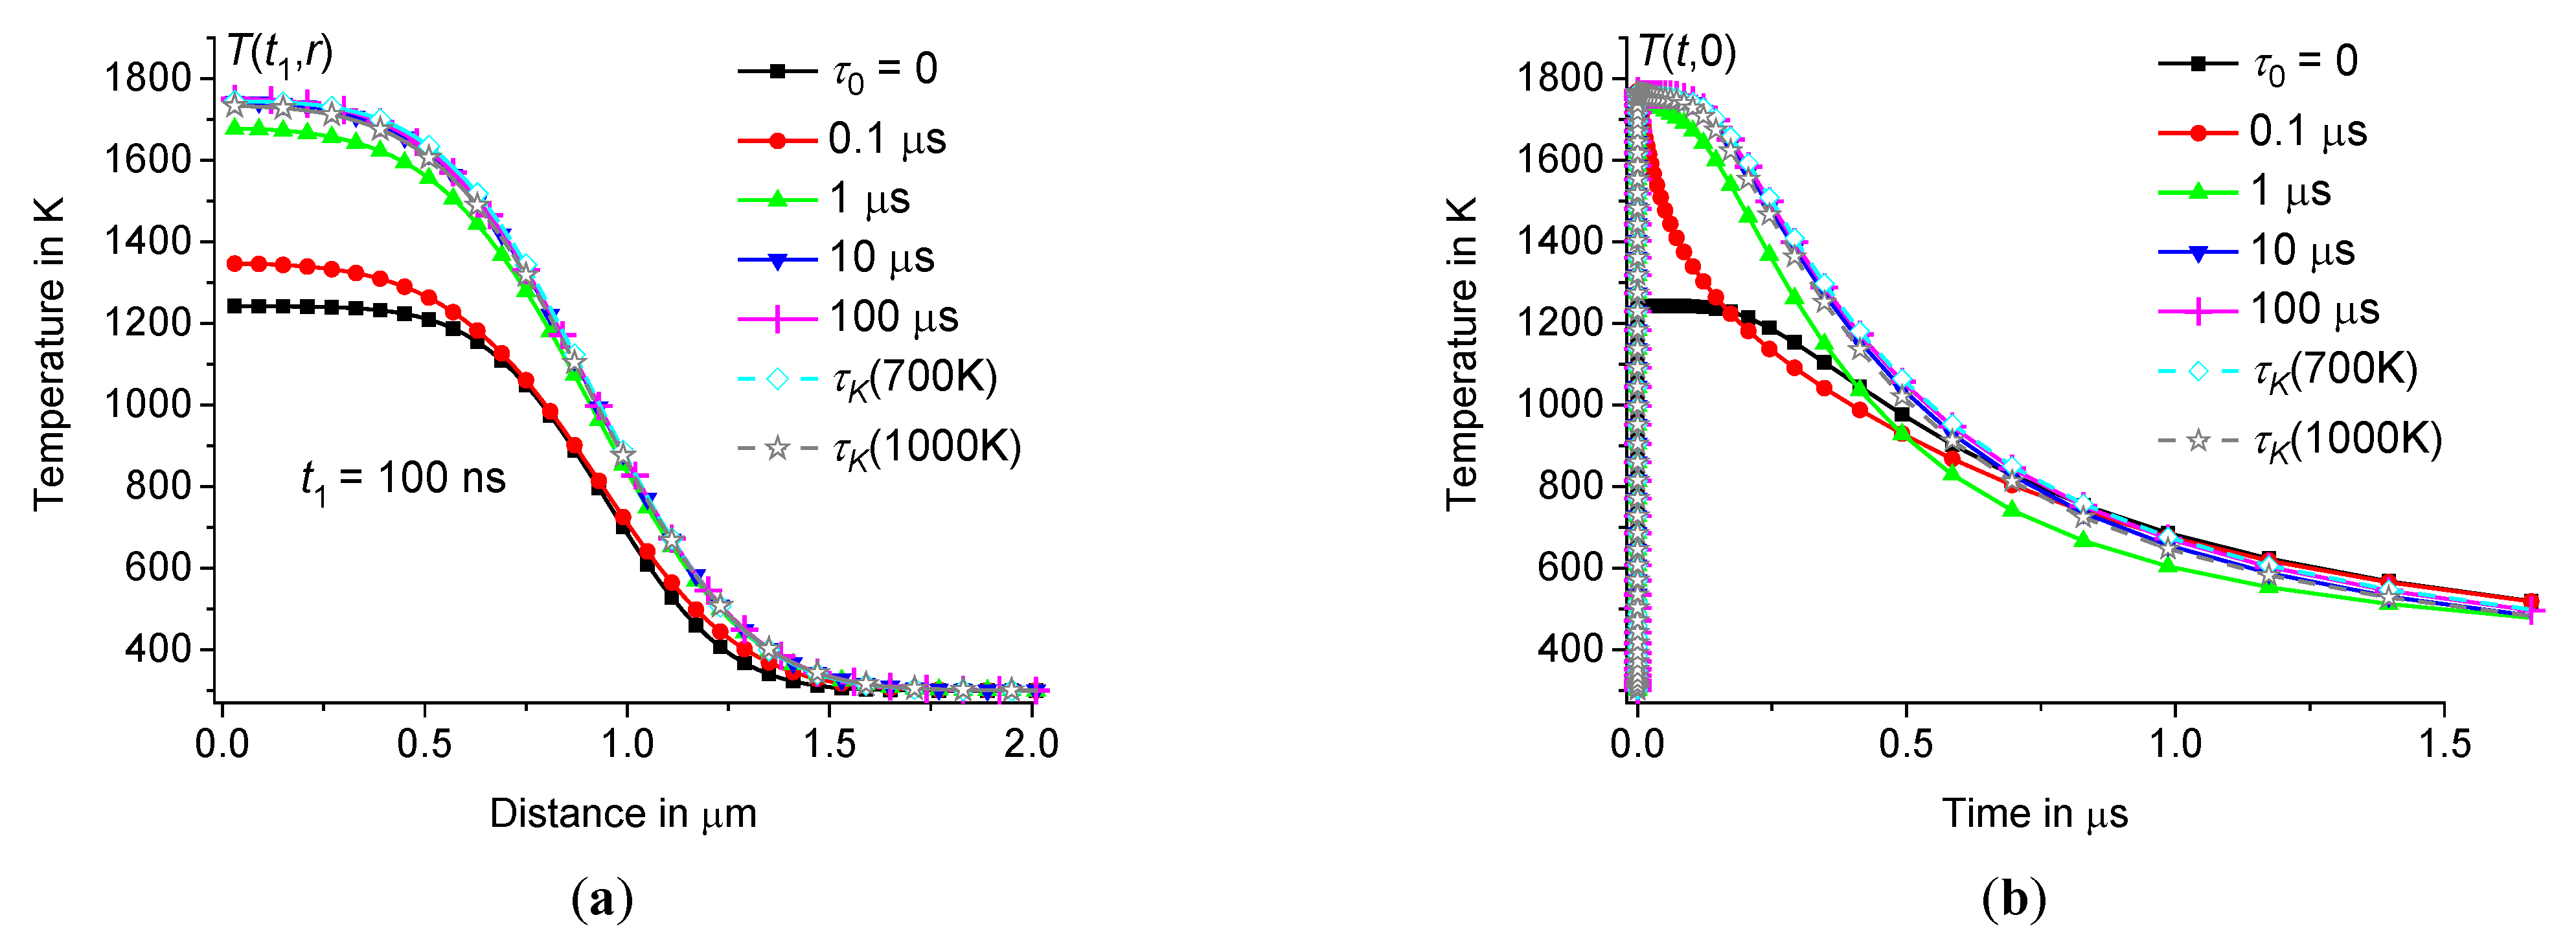
0, 0.1 μs, 1 μs, 10 μs, and 100 μs – squares, circles, triangles up, triangles down, and crosses). The solution
averaged using the distribution function
obtained from [
64] at
700 K and 1000
K – diamonds and stars.
The influence of time dispersion of dynamic heat capacity is significant in both borosilicate and sodium-silicate glasses. Now let us consider the influence of the size of the heating zone on the temperature distribution .
3.4. Dependence of on the size of the heating zone
For example, let us compare the temperature distributions
at
1 and
2 μm for borosilicate glass, see
Table 1. To obtain the same thermal response value, let us set
120 nJ at
2 μm, increasing the energy in proportion to the volume of the heating zone. Thus, in both cases we obtain the same amplitudes of the temperature response to heating pulses, see Figures8 – 9. As expected, the temperature
in the center of the heating zone relaxes in a time of the order of
, which for borosilicate glass is about 15 μs at
2 μm and
2.6⸱10
-7 m
2/s. For comparison,
relaxes four times faster at
1 μm than at
2 μm, see Figures8(
b) – 9(
b). As the size of the heating zone increases, the saturation of the influence of the time dispersion of the dynamic heat capacity on
shifts towards larger values of
. For example, compare
at
1 μs for
1 and
2 μm, see Figures8 – 9.
Figure 9.
depending on the distance at 300 ns (a) and time dependence of in the center of the hot zone (b) for borosilicate glass at 2 μm, 300 ps, 120 nJ, 300 K ( 0, 0.3 μs, 1 μs, 10 μs, and 100 μs – squares, circles, triangles up, triangles down, and diamonds).
Figure 9.
depending on the distance at 300 ns (a) and time dependence of in the center of the hot zone (b) for borosilicate glass at 2 μm, 300 ps, 120 nJ, 300 K ( 0, 0.3 μs, 1 μs, 10 μs, and 100 μs – squares, circles, triangles up, triangles down, and diamonds).
4. Cooling rate distribution and its influence on microstructuring processes of glasses
Now consider the spatial distribution of the rate of temperature change . Due to thermal expansion, the size of the heating zone changes with temperature by about 10 nm or less. We neglect these changes with respect to . Let us consider the rate of temperature change due to thermal diffusion. This temperature change affects the physical properties of the material. We will focus on very fast (about 109 K/s or more) local temperature changes that have the greatest impact on the microstructuring process, and will study the effect associated with the time dispersion of the dynamic heat capacity. It is worth noting that this effect is significant even well above the glass transition temperature .
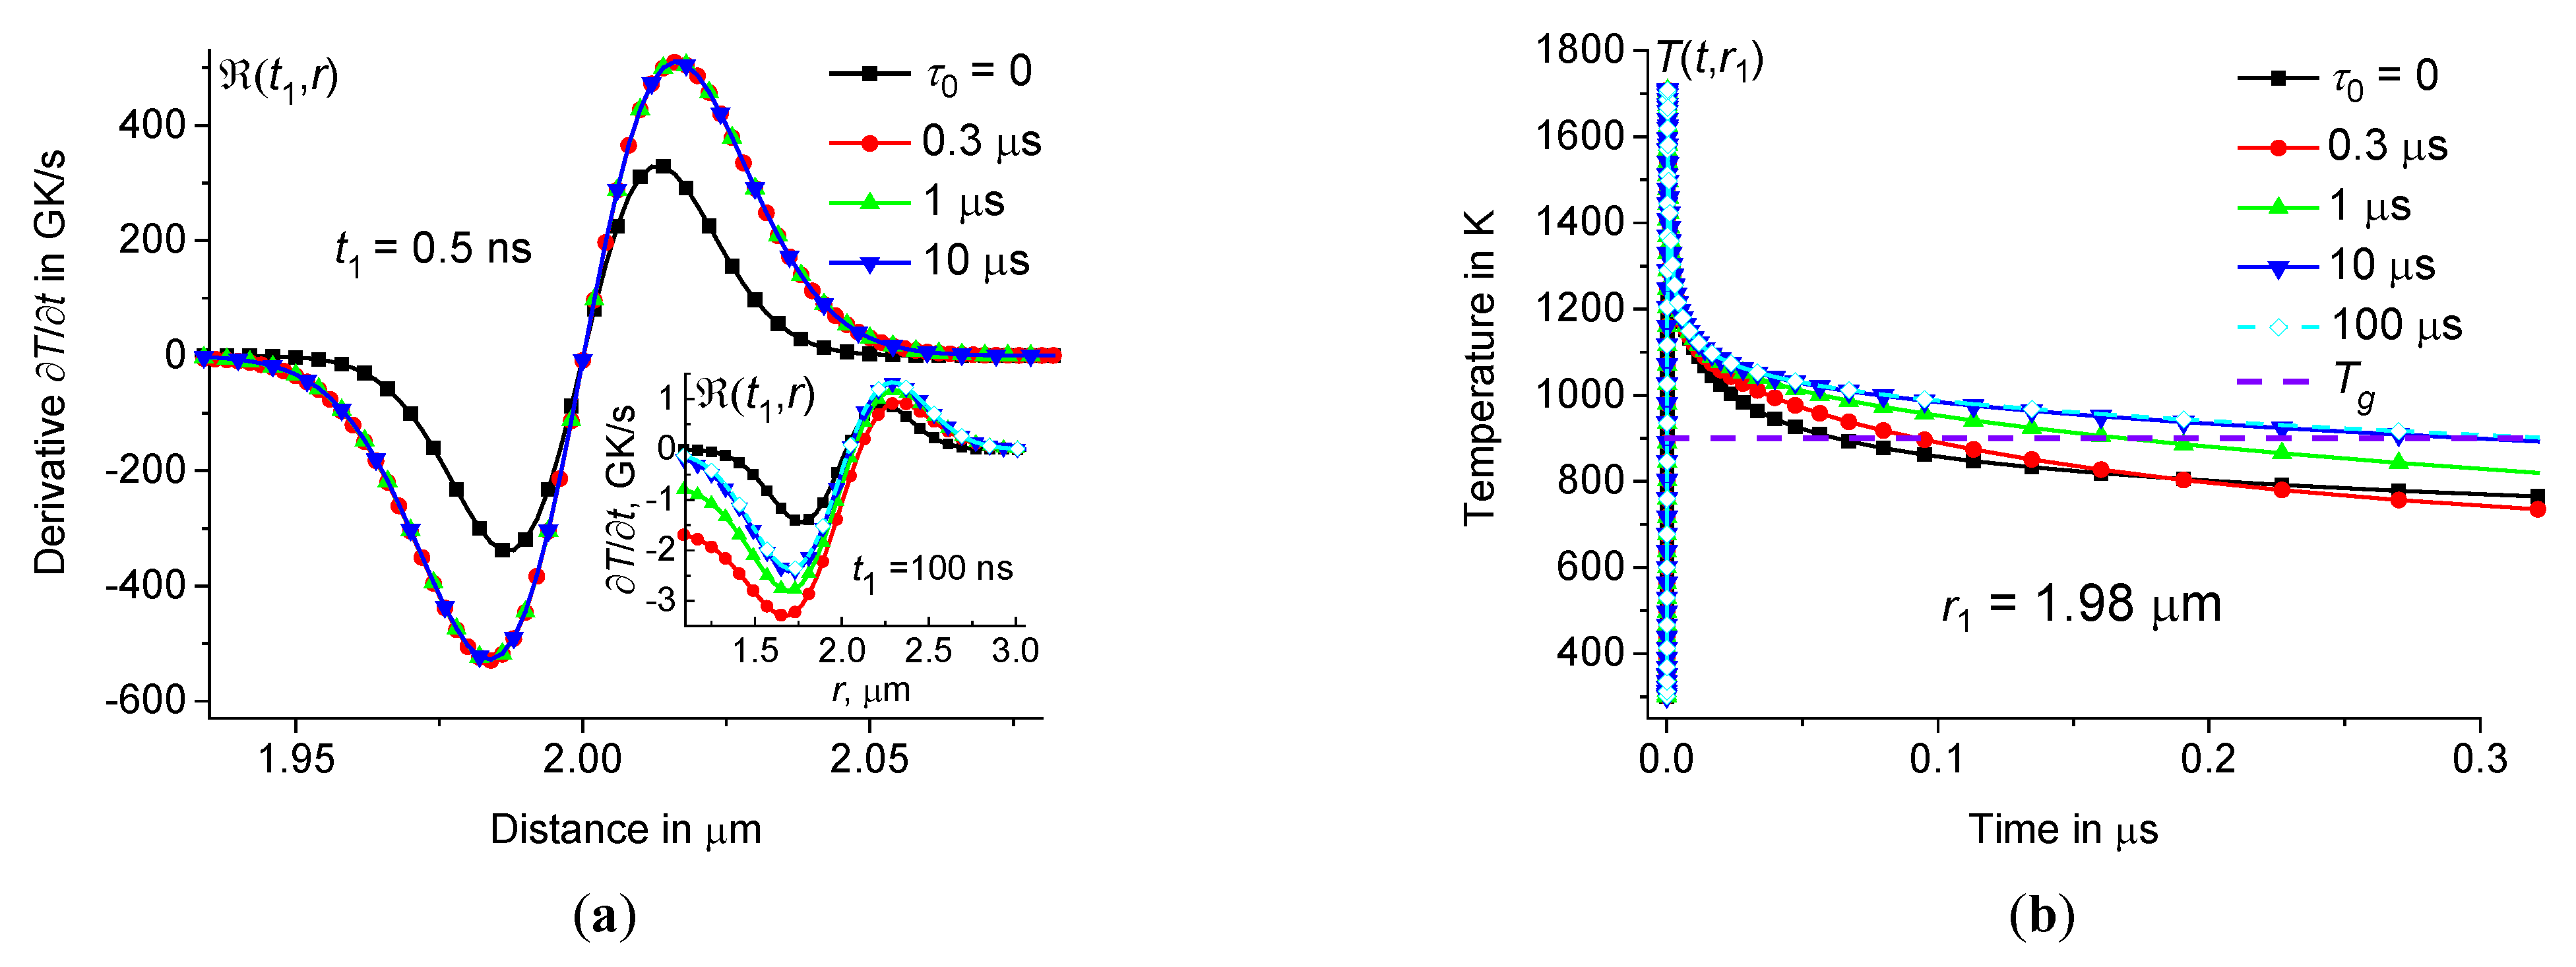
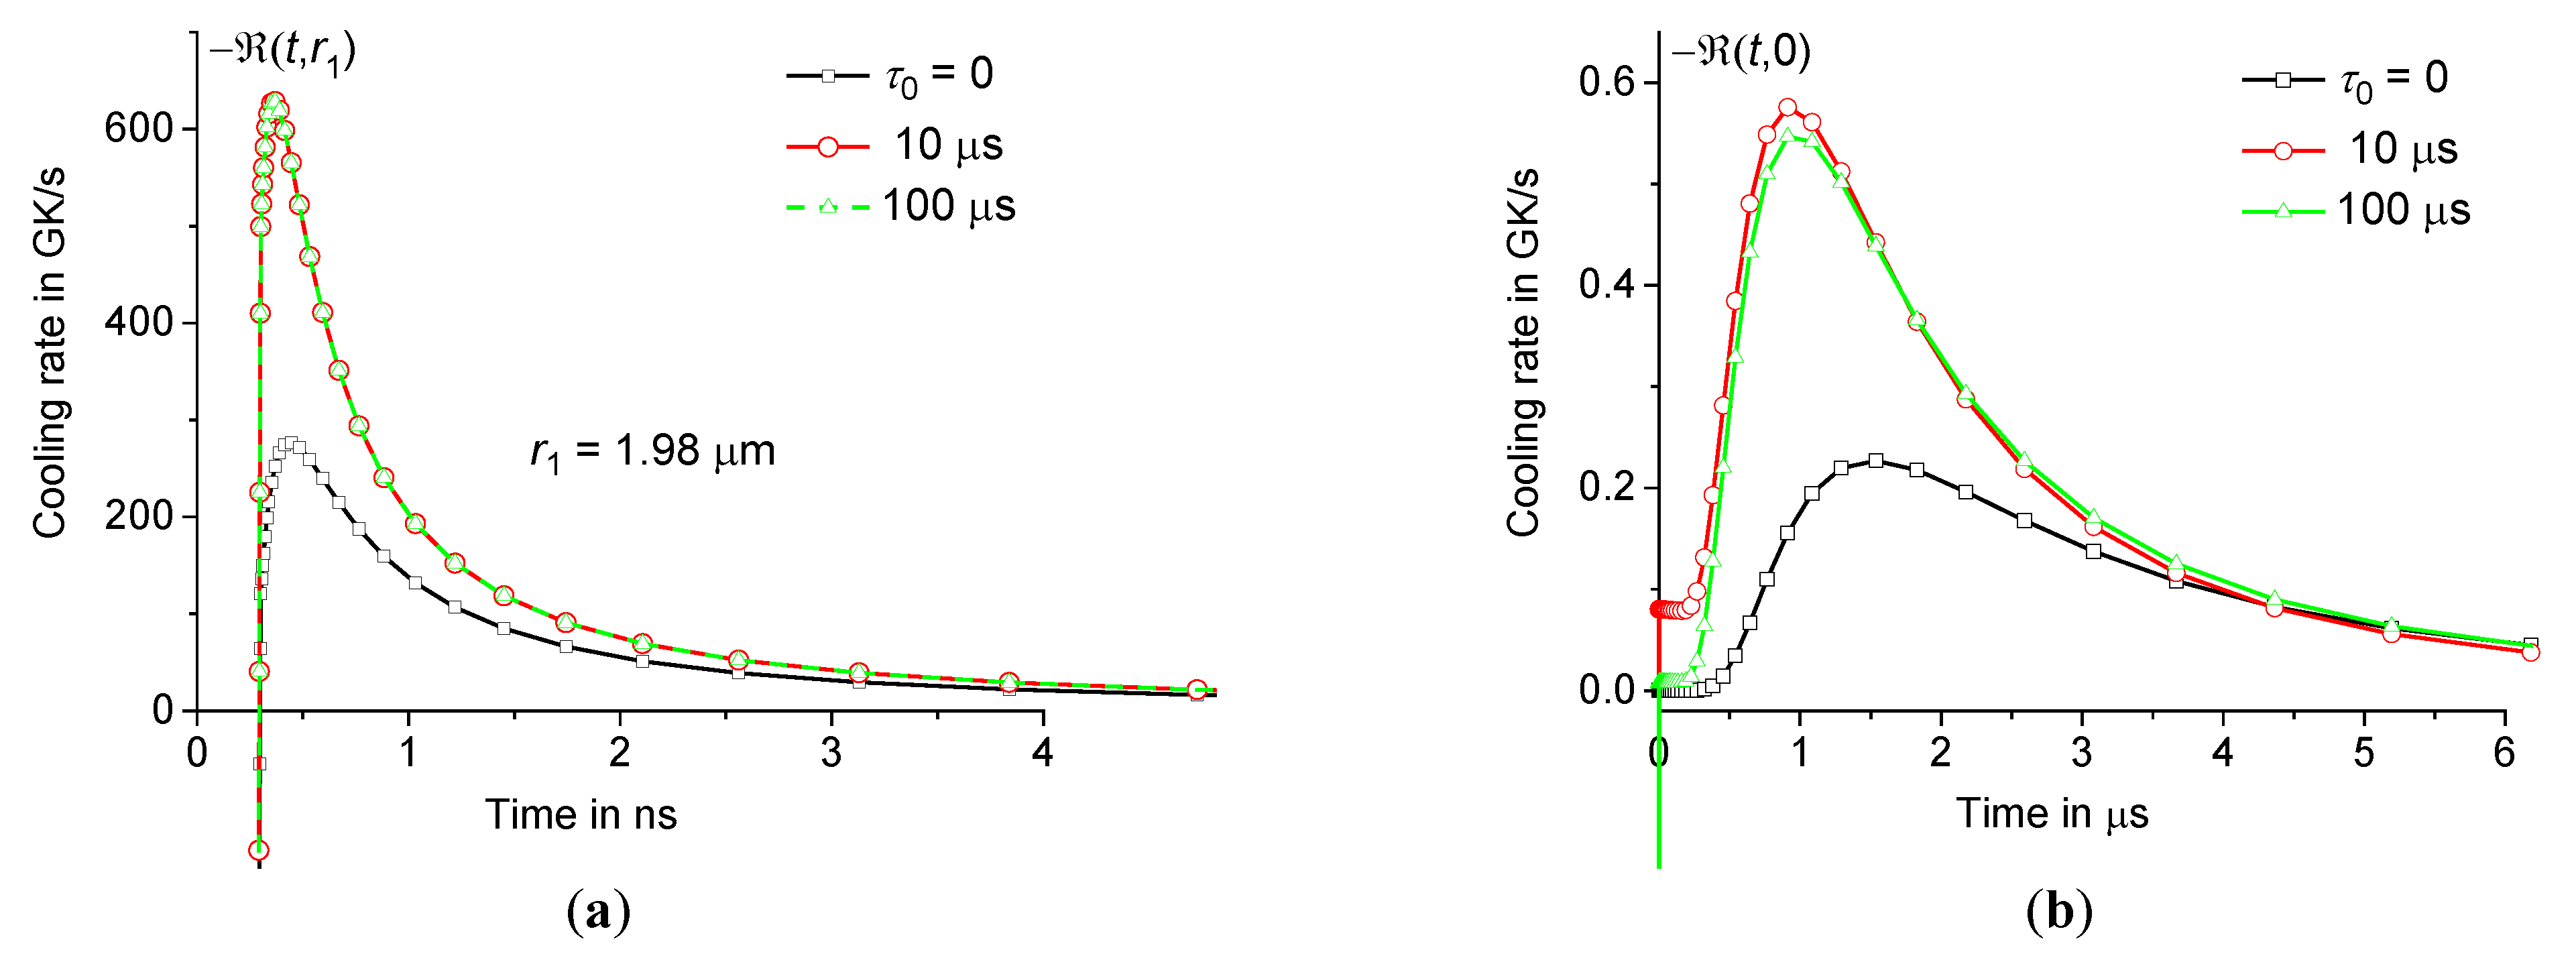
For example, the rate of temperature change
for borosilicate glass at
2 μm,
300 ps,
120 nJ and various
is presented in Figures10 – 11. Note that the rate of temperature change
is greatest near the periphery of the hot zone, see Figure10(
a). The cooling rate
is about 600 GK/s at
1.98 μm and
0.36 ns, see Figure11(
a). However, in the center of the heating zone, the cooling rate
does not exceed 0.6 GK/s, i.e.
is three orders of magnitude less than the cooling rate at the periphery, see Figure11. Therefore, the local structure of glass in the center of the hot zone should differ significantly from the structure at the periphery of the heating zone after laser modification. This conclusion is consistent with experiments [
19,
34,
36,
40,
46,
49,
50,
51,
52,
53]. However, the effect associated with dynamic heat capacity (at
0) is significant both in the center and at the periphery of the heating zone. Indeed, the maximum cooling rate is approximately 2.5 times greater at
0 than at
0 both at the periphery and in the center of the heating zone, see Figure11.
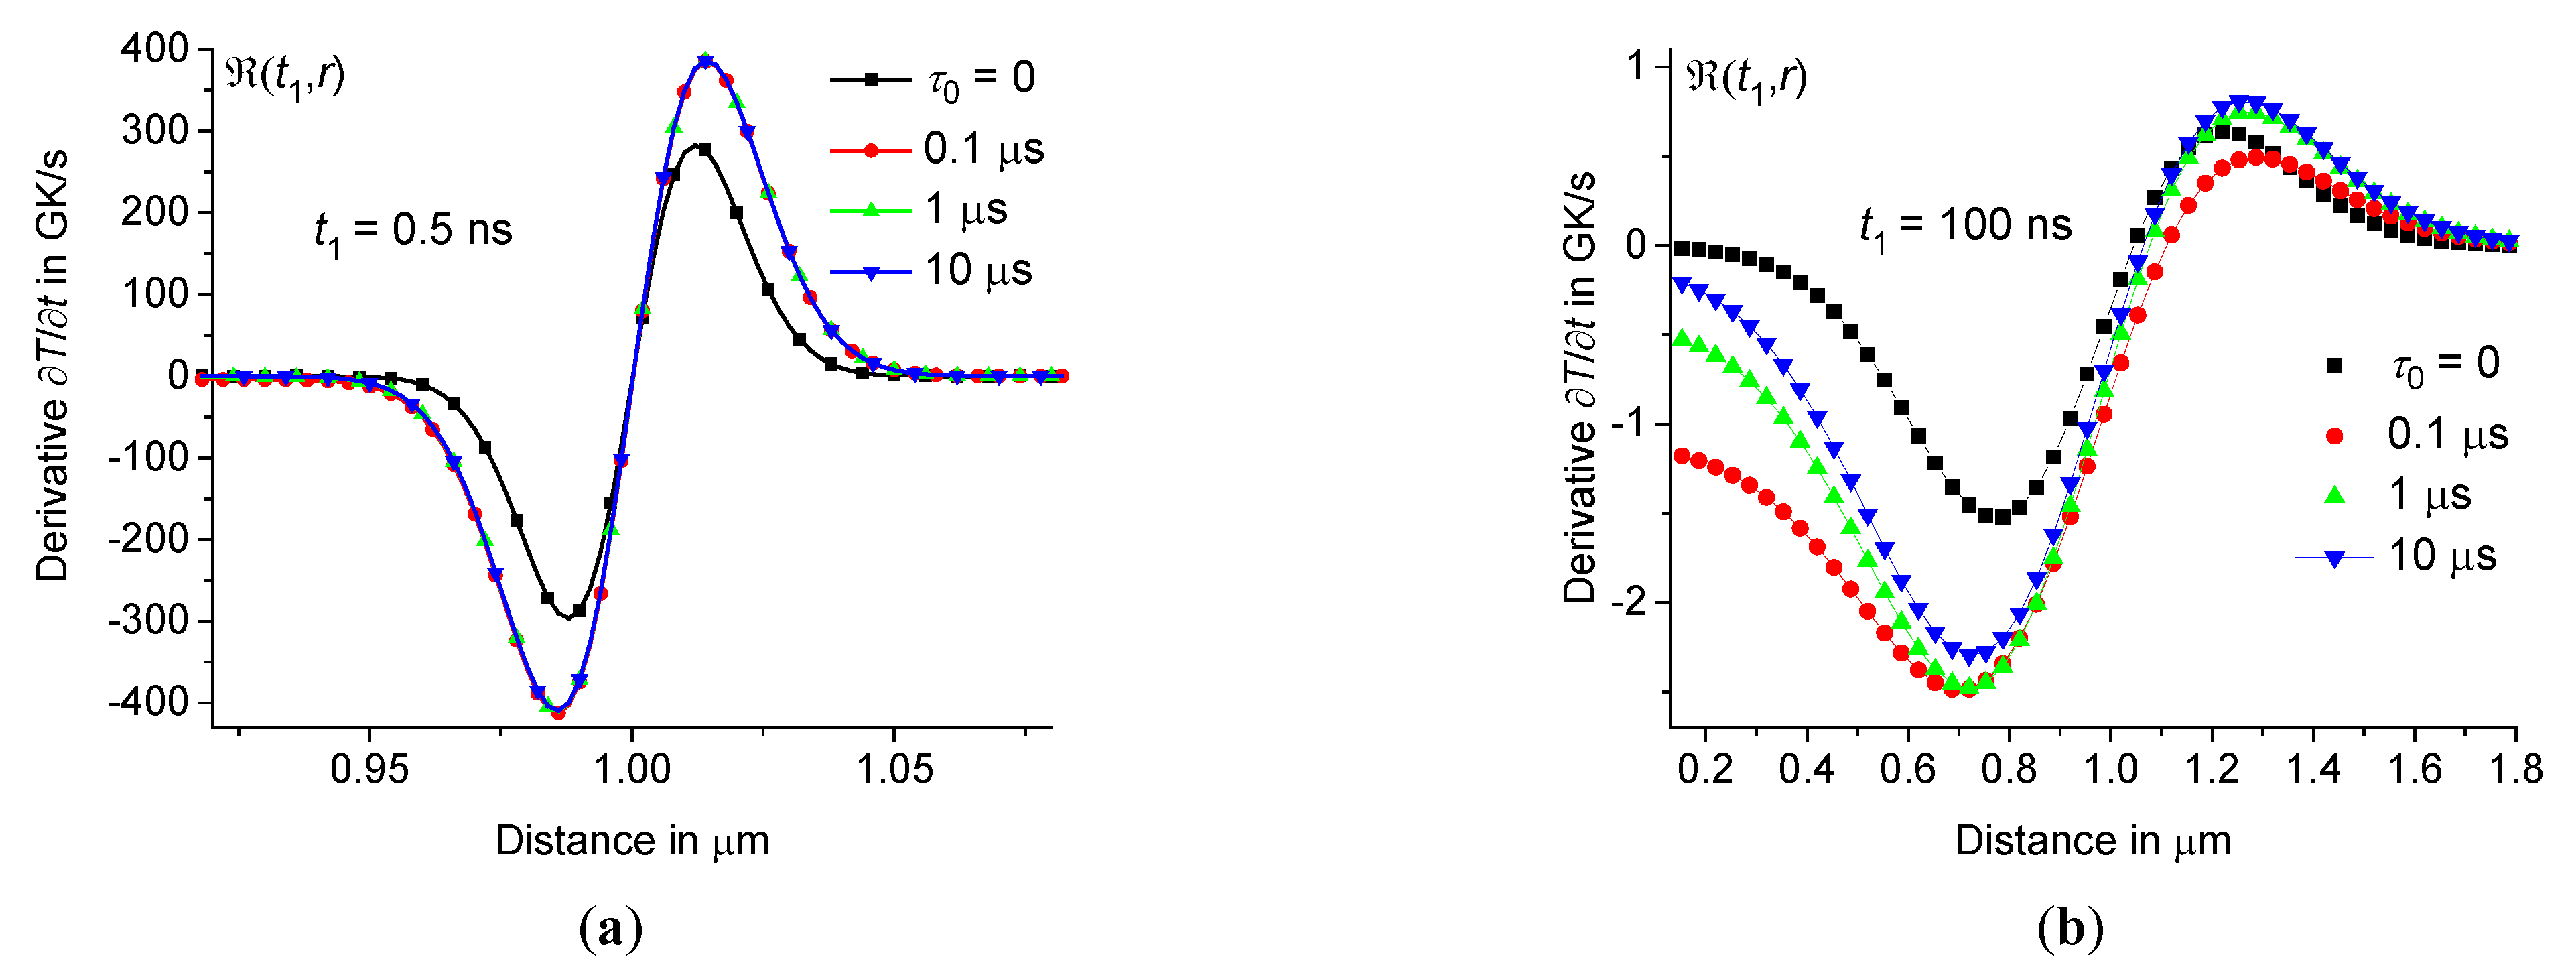
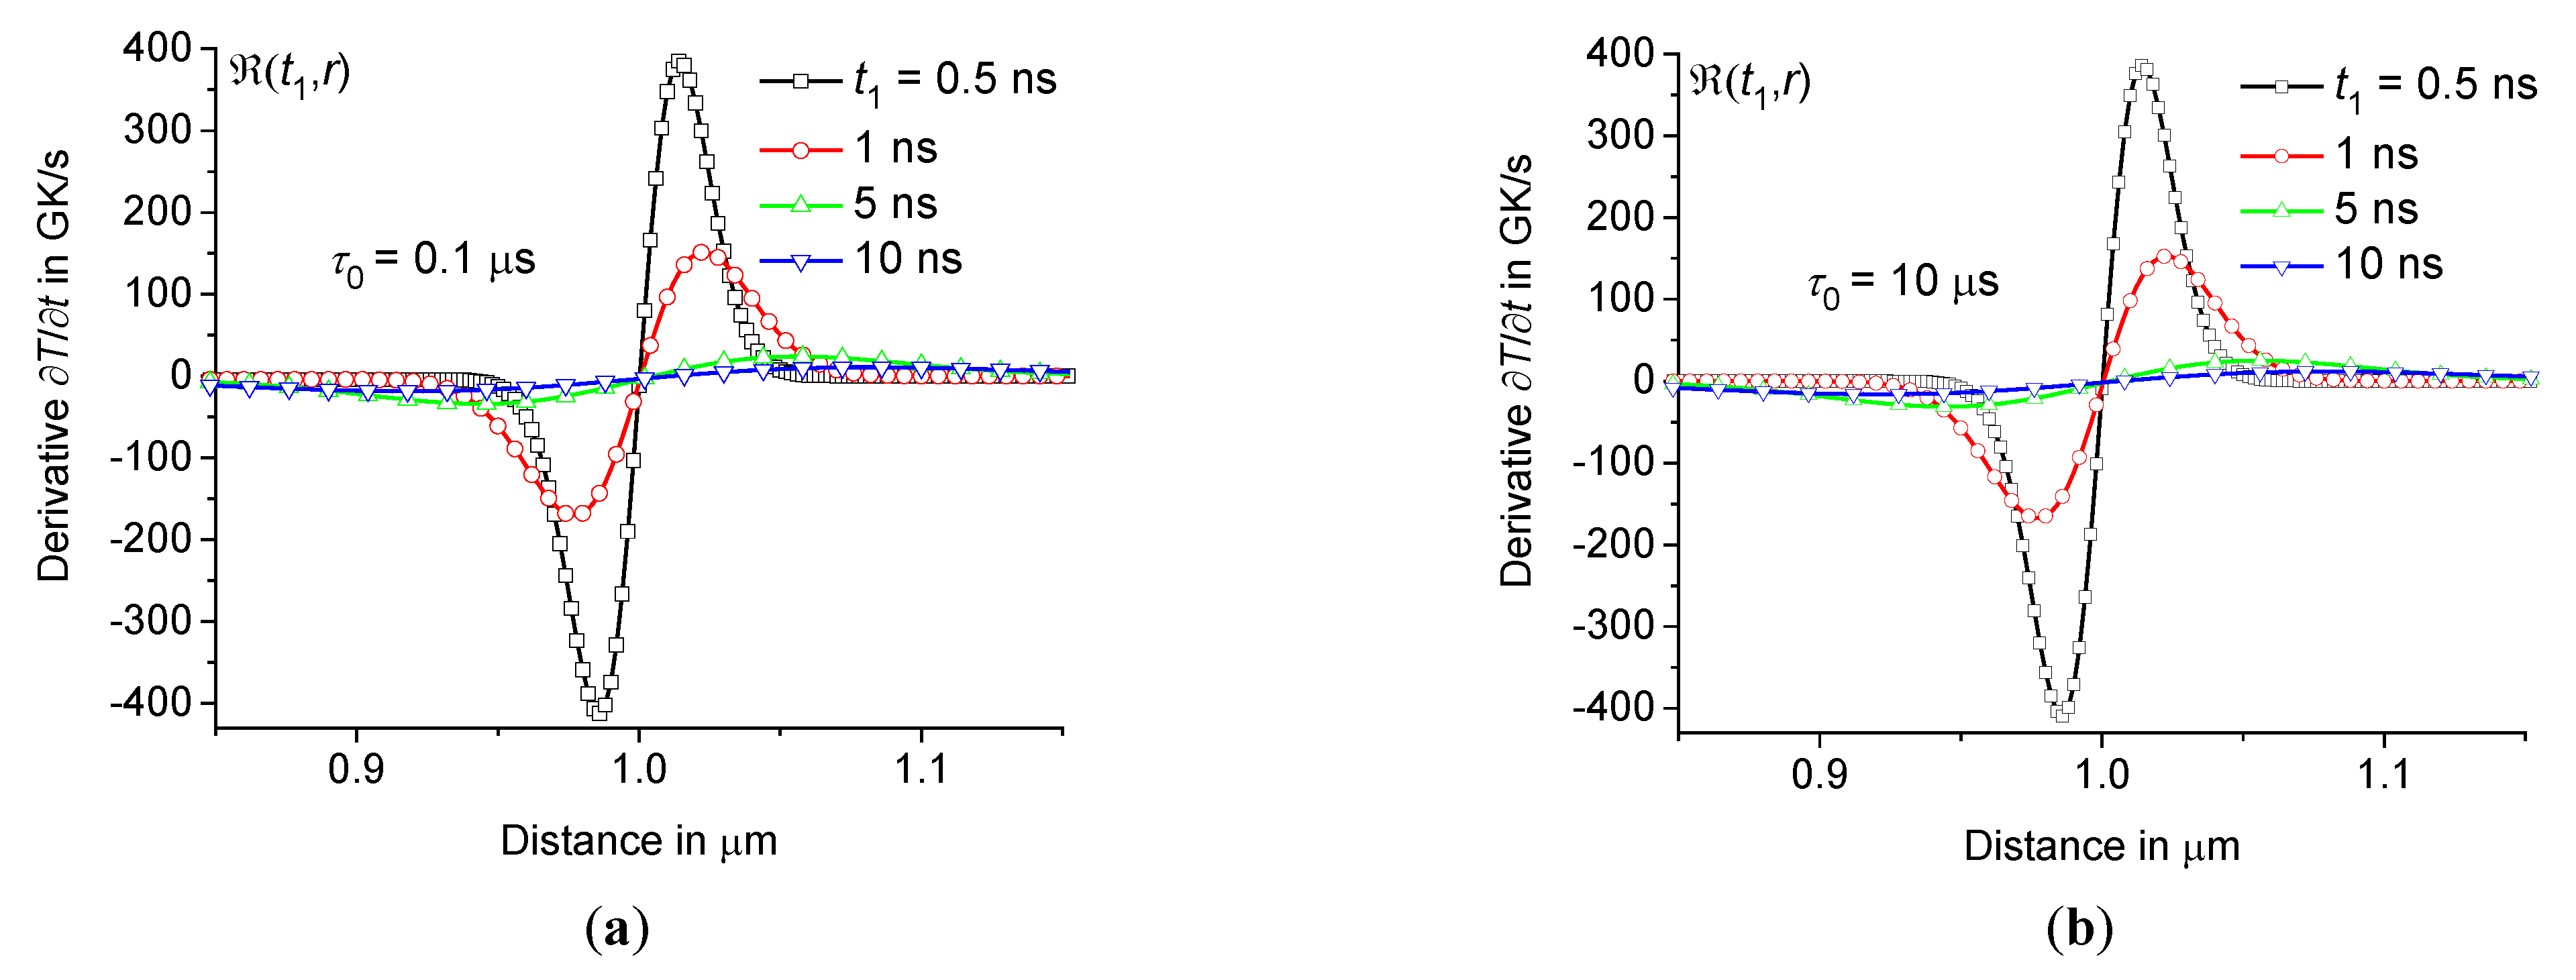
Let us consider the cooling rate in a thin shell in the region from 0.95 to 0.99. As we have established for borosilicate and sodium-lime-silicate glasses, ultra-fast cooling of the material occurs in this region at a rate of more than 1011 K/s, see Figures10 – 13. It is noteworthy that at the beginning of the cooling process (during the first few nanoseconds), the rate of temperature change is the same for small and large relaxation times , see Figures10(a) and 12(a). This means that at the beginning of the cooling process at the periphery of the hot zone, the shape of the distribution function does not affect the cooling rate . Therefore, in this case, even at very small relaxation times , the influence of the time dispersion of the dynamic heat capacity is significant.
Figure 10.
Rate of temperature change depending on the distance at the periphery of the hot zone at 0.5 ns (a) and time dependence of at 1.98 μm (b) at the same parameters as in Figure9 ( 0, 0.3 μs, 1 μs, 10 μs, and 100 μs – squares, circles, triangles up, triangles down, and diamonds). Inset (a) shows as a function of distance at 100 ns for different .
Figure 11.
Time dependence of cooling rate – at 1.98 μm (a) and 0 (b) at the same parameters as in Figures9 and 10 ( 0, 10 μs, and 100 μs – squares, circles, and triangles).
Figure 11.
Time dependence of cooling rate – at 1.98 μm (a) and 0 (b) at the same parameters as in Figures9 and 10 ( 0, 10 μs, and 100 μs – squares, circles, and triangles).
Figure 12.
depending on the distance at the periphery of the hot zone at 0.5 ns (a) and 100 ns (b) for sodium-lime-silicate glass at the same parameters as in Figure3 ( 0, 0.1 μs, 1 μs, and 10 μs – squares, circles, triangles up, and triangles down).
Figure 12.
depending on the distance at the periphery of the hot zone at 0.5 ns (a) and 100 ns (b) for sodium-lime-silicate glass at the same parameters as in Figure3 ( 0, 0.1 μs, 1 μs, and 10 μs – squares, circles, triangles up, and triangles down).
The cooling rate reaches a maximum at for a given , see Figures10 and 12. The rate decreases over time, and the distance , at which the rate is maximum, shifts slightly towards the center of the heating zone. However, still exceeds 2 – 3 GK/s at 100 ns, see Figures10(a) and 12(b). The change in cooling rate over time for sodium-lime-silicate glass at 1 μm, 10 μs and the same conditions as in Figure3 is presented in Table 3. The rate depending on the distance at the periphery of the hot zone for different is shown in Figure13.
Table 3.
Cooling rate for sodium-lime-silicate glass at 1 μm.
Table 3.
Cooling rate for sodium-lime-silicate glass at 1 μm.
Time
ns |
Distance
μm |
Cooling rate
GK/s |
| 0.5 |
0.985 |
410 |
| 1 |
0.98 |
170 |
| 5 |
0.94 |
31 |
| 10 |
0.92 |
16 |
| 50 |
0.80 |
4 |
| 100 |
0.70 |
2.3 |
Figure 13.
depending on the distance at the periphery of the hot zone at 0.1 μs (a) and 10 μs (b) at the same parameters as in Figure3 ( 0.5 ns, 1 ns, 5 ns, and 10 ns – squares, circles, triangles up, and triangles down).
Figure 13.
depending on the distance at the periphery of the hot zone at 0.1 μs (a) and 10 μs (b) at the same parameters as in Figure3 ( 0.5 ns, 1 ns, 5 ns, and 10 ns – squares, circles, triangles up, and triangles down).
Thus, since the local structure of the material strongly depends on the local cooling rate
, the local structure of the material at the periphery of the hot zone changes significantly relative to the original glass matrix. This modification of glass practically stops as soon as the local region is cooled below the glass transition temperature
. Thus, the modification process occurs until the temperature
in the local region at
drops below
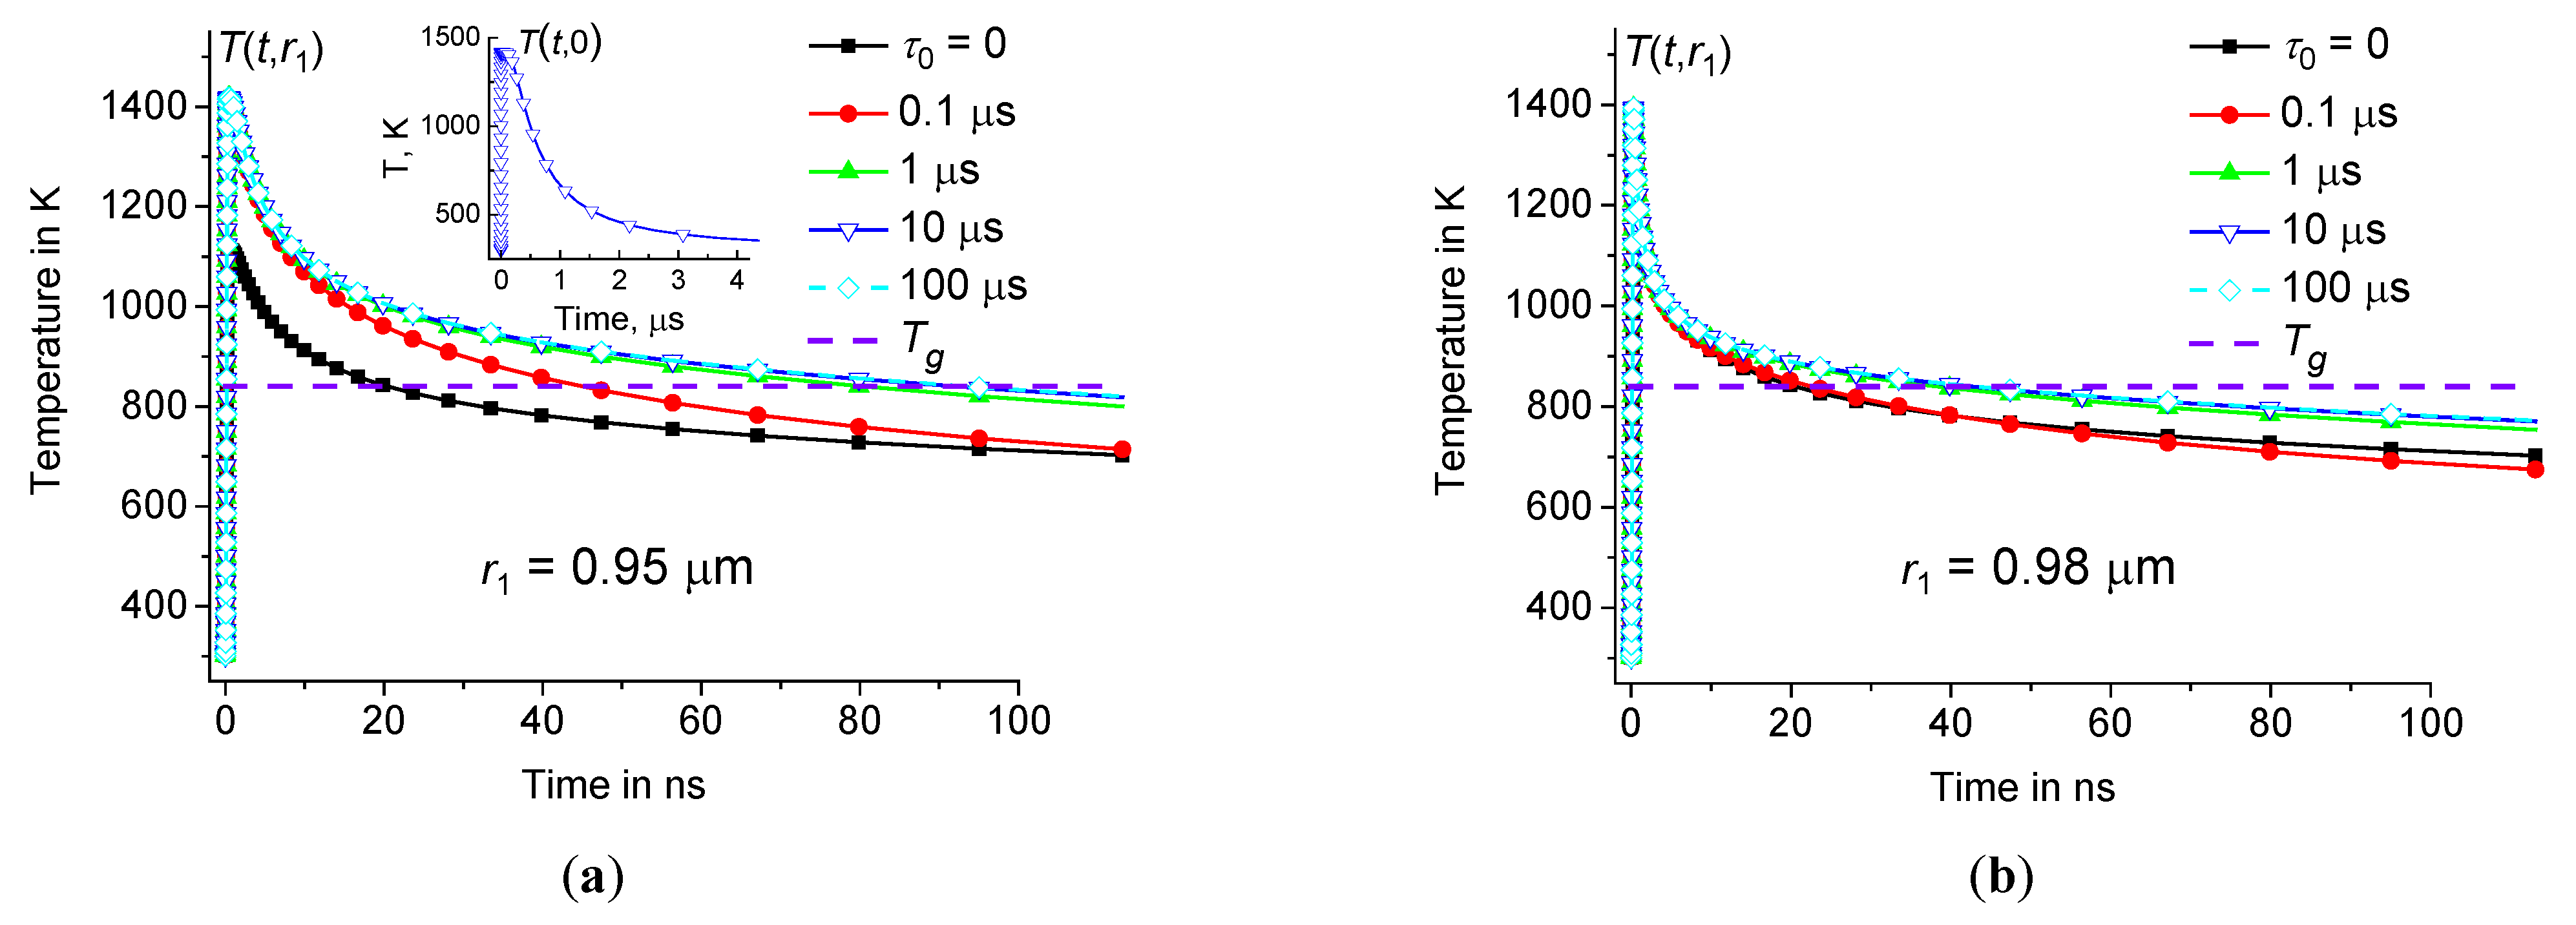
. For example, consider the cooling curves calculated at the periphery of the hot zone for borosilicate (
= 900 K [
63]) and sodium-lime-silicate glasses (
= 840 K [
57]), see Figure10(
b) and Figure14, respectively. It should be noted that the effect associated with the time dispersion of the dynamic heat capacity is significant well above the glass transition temperature
. Indeed, in the case of
1 μm, the modification process occurs within approximately 80 ns at
0.95 μm and
1 μs, see Figure14(
a). However, without taking into account the time dispersion of the dynamic heat capacity (at
0), this process occurs in less than 20 ns, see Figure14(
a). In the case of
2 μm, the modification process occurs during a longer period of about 300 ns at
1.98 μm and
1 μs, see Figure10(
b). However, without taking into account the time dispersion of the dynamic heat capacity (at
0), this process occurs in less than 50 ns, see Figure10(
b).
Figure 14.
Time dependence of at the periphery of the hot zone at 0.95 μm (a) and 0.98 μm (b) at the same parameters as in Figure3 ( 0, 0.1 μs, 1 μs, 10 μs, and 100 μs – squares, circles, triangles up, triangles down, and diamonds). Inset (a) shows time dependence of in the center of heating zone (at 10 μs).
To summarize, we can conclude that the maximum cooling rate exists in the outer regions of the heating zone, in the shell of about . The cooling rate reaches several hundred GK/s in the first nanosecond after the laser pulse. Then the cooling rate decreases. However, even 100 ns after the laser pulse, in the outer shell of the hot zone still exceeds 1 GK/s. It is noteworthy that in the center of the heating zone the cooling rate is three orders of magnitude less than at the periphery. Since regions quenched at different cooling rates have different physical properties, strong gradients of physical properties should exist in the material predominantly at a distance of about from the center of the heating zone. This effect is significantly enhanced by the time dispersion of the dynamic heat capacity.
In conclusion, let us briefly discuss laser micro-processing in the cumulative heating mode. Typically, cumulative heating is achieved at a laser pulse repetition rate more than hundreds of kHz. Usually, this mode operates at frequencies from 200 kHz to 10 MHz [
3]. Indeed, the temperature
in the center of the hot zone relaxes in a time of the order of
, which for the glasses under consideration is about 4 μs at
1 μm, see inset in Figure14(
a). Thus, in this case, the cumulative effect can be achieved at a frequency of about 250 kHz or more. Note that the cumulative effect leads to stable average heating of the material in the heating zone. Thus, the effect of laser pulse repetition can be approximately simulated by shifting upward the local temperature distribution
by a certain temperature difference
, which increases with increasing pulse repetition frequency. It is clear that with increasing
the modification process will occur over a longer time interval, see Figure14, where
should be shifted upward by the amount
. Then
in the local region at
will fall below
at a cooling rate lower than at zero repetition frequency (at
0). Consequently, local gradients in the physical properties of locally modified glass will be smoothed out due to cumulative heating. The effect of the repetition rate will be discussed in more detail in a separate article.
5. Discussion
The local temperature distribution and the local cooling rate determine the local structure of the glass matrix during laser-induced microstructuring. Thus, knowledge of the dynamics of the local temperature distribution is very important for applications associated with local laser heating, for example, for femtosecond laser microstructuring of glasses. However, as shown in this article, the dynamics of the local temperature distribution significantly depends on the time dispersion of the dynamic heat capacity of the glass matrix. This work proposes a method for analytical calculation of and for glass-forming materials under local fast laser excitations. It is shown that the dynamics of the local temperature distribution caused by a laser pulse can be described by the heat equation with dynamic heat capacity . This equation has an analytical solution to a spherically symmetric boundary value problem. Using this analytical solution, we obtained the temperature distribution and local cooling rate for the thermal parameters of borosilicate and sodium-lime-silicate glasses. In fact, this analytical solution depends on the following relaxation parameters of the dynamic heat capacity of the material: relaxation time and the distribution function , which can be obtained from broadband heat capacity spectroscopy. However, as shown in this article, the shape of the distribution function has little effect on and , since with increasing the influence of the time dispersion of the dynamic heat capacity reaches saturation. It should be noted that the influence of the time dispersion of the dynamic heat capacity is most pronounced at the beginning of the process, when changes on a nanosecond time scale. We found that this effect is significant already at about 0.1 μs, increases with increasing and reaches saturation at above . Thus, the influence of the time dispersion of dynamic heat capacity on the temperature distribution can be calculated for a fixed, sufficiently large (in fact, for of the order of ten or several tens of microseconds, depending on the radius of the heating zone ). As expected, the results obtained are very similar for different . However, as the size of the heating zone increases, the laser pulse energy must increase in proportion to the volume of the heating zone in order to obtain the same amplitude of the local thermal response.
It has been established that the temperature distribution and local cooling rate are not affected by the heating pulse duration and the shape of the heating pulse. It should be noted that the temperature perturbation in the center of the heating zone relaxes not as , in contrast to the often-used estimate based on the fundamental solution of the Fourier heat equation. In fact, the heating pulse cannot be considered as an instantaneous point source of heat. Thus, it is necessary to integrate the thermal response over the time interval and the volume of the heating zone, then the resulting correct solution completely coincides with the temperature distribution found in this article for 0. In addition, the solution found in this article can be used for materials with dynamic heat capacity at 0.
We found that the rate of temperature change
is greatest near the periphery of the hot zone. The cooling rate reaches a maximum
when
is slightly less than
. It turns out that ultra-fast cooling of the material occurs at a rate of more than 10
11 K/s in a thin shell in the region from 0.95
to 0.99
. However, in the center of the heating zone, the cooling rate is three orders of magnitude lower than at the periphery. Thus, the local structure of glass after laser modification in the center of the hot zone should differ significantly from the structure at the periphery, which is consistent with experiments [
19,
34,
36,
40,
46,
49,
50,
51,
52,
53]. It is noteworthy that the effect associated with the time dispersion of the dynamic heat capacity is very significant both in the center and at the periphery of the heating zone. In fact, the maximum cooling rate is approximately 2.5 times greater at
0 than at
0 both at the periphery and in the center of the heating zone, see Figure11.
It is worth noting that at the beginning of the cooling process at the periphery of the hot zone, the shape of the distribution function does not affect the cooling rate . In fact, even at a very short relaxation time , the influence of the time dispersion of the dynamic heat capacity is very significant at the beginning of the cooling process. The cooling rate decreases over time , however, in the outer regions of the heating zone, the cooling rate still exceeds 2 – 3 GK/s at about 100 ns. Regions quenched at different cooling rates have different physical properties. Thus, strong gradients of physical properties should exist in the material, mainly at a distance of about from the center of the heating zone. It is worth noting that the time dispersion of the dynamic heat capacity significantly enhances this effect. In addition, the effect associated with the time dispersion of the dynamic heat capacity is significant even well above the glass transition temperature . It turns out that the duration of the modification process strongly depends on the relaxation time of the dynamic heat capacity . Thus, the rate of local cooling and gradients of physical properties of locally modified glass strongly depend on the relaxation time of the dynamic heat capacity . Finally, it is worth noting that the gradients of physical properties in areas quenched at different cooling rates are smoothed out by cumulative heating when processed in the cumulative heating mode.
In this article, we solved a problem for spherical geometry, which is closely related to data storage technologies. There are a number of future directions that are worth developing. A future research direction could be the problem with cylindrical geometry, closely related to laser waveguide technologies. The cumulative heating mode at different laser pulse repetition rates and laser beam scanning speeds also deserves to be studied.
