1. Introduction
In recent years, the prevalence of metabolic syndromes, including cardiovascular disorders, obesity, and diabetes, has surged, becoming a pressing societal concern [
1]. Research indicates that, beyond genetic factors, this surge is associated with the increasing westernization of dietary patterns. Specifically, there has been a shift towards elevated consumption of meat and fats, encompassing red meat, eggs, soybeans, and other trimethylamine (TMA) substitute-rich foods [
2]. While traditional nutritional science implicates red meat, egg yolk, liver, and choline-rich soybeans in cardiovascular risk, recent publications in esteemed journals such as Nature [
3], Nature Medicine [
4], and the New England Journal of Medicine [
5] propose that dietary choline may significantly elevate the risk of cardiovascular disease. This connection is primarily attributed to the transformation of choline and its derivatives into TMA by gut bacteria during digestion and absorption, subsequently oxidizing into trimethylamine oxide (TMAO). Multiple studies confirm the detrimental impact of TMAO on cardiovascular cells, promoting atherosclerosis, a crucial factor in atherosclerosis development [3, 6, 7].
Individuals with atherosclerosis exhibit significantly higher TMAO levels in their blood samples compared to those without the condition [
4]. Notably, two dominant CutC species,
Lachnoclostridium (
p = 2.9e-05) and
Clostridium (
p = 5.8e-04), were found to be elevated in atherosclerotic patients compared to their healthy counterparts.
L. saccharolyticum, when exposed to choline as a substrate, converted it effectively to TMA, with a conversion rate of up to 98.7% [
8]. This underscores the role of gut microbiota disruption in TMAO formation and subsequent induction of atherosclerosis. Microbial TMA lyase activity, responsible for TMAO production, further supports the link between gut microbiota and atherosclerosis development [7, 9]. Jonsson et al.'s study [
9] indicated that the impact of gut microbiota on atherosclerosis is diet-dependent, and single choline supplementation does not influence plaque size and aortic lesions. The gut microbiota utilizes three TMA lyase complexes, CntA/B, YeaW/X, and CutC/D, to convert carnitine, betaine, and choline into TMA, with CntA, YeaW, and CutC being lyases, and CntB, YeaX, and CutD acting as their activators. The relative abundance of CutC significantly increased in atherosclerosis patients (
p = 0.033), suggesting its potential association with atherosclerosis formation [
8].
The citrus peel's unique polymethoxyflavones (PMFs), such as nobiletin and tangeretin [
10], exhibit the ability to inhibit TMAO generation
in vivo. Yang et al.'s study [
2] revealed that administration of nobiletin mitigated choline-induced oxidative damage in the proximal aorta of experimental rats. It suppresses MAPK/ERK activity, reduces the expression of NF-κB p65 and phosphorylated NF-κB p65, thereby diminishing inflammation. Nobiletin also demonstrated the ability to reduce TMAO-induced apoptosis of HUVEC cells and inhibit TMAO-induced proliferation of HUVEC cells. However, the study did not elucidate the regulatory mechanism of nobiletin on TMAO generation. Zhang et al. [11, 12] discovered that nobiletin actively modulates gut microbiota composition, particularly affecting
Allobaculum and
Roseburia. These findings suggest that PMFs, as major active components of citrus peel, possess the potential to shape gut microbiota structure and hinder the biological activity of TMA production.
Therefore, our study aims to investigate the targeted modulation of gut microbiota composition by tangeretin, another prominent PMF similar to nobiletin, with a focus on inhibiting TMA generation and preventing the biological activity of arterial tissue inflammation.
2. Materials and Methods
2.1. Materials and Reagents
Tangeretin, with a minimum purity of 98%, was procured from Kang Biotech (Changsha, Hunan, China). High-quality reagents, including TMA, 99% pure choline chloride, TMAO, and hematoxylin & eosin (HE), were sourced from Sigma-Aldrich (St. Louis, MO, USA). 3,3-Dimethylbutanol (DMB), 4% paraformaldehyde, and Oil Red O were obtained from Beyotime Biotechnology (Shanghai, China). Cholesterol package, superoxide dismutase activity colorimetric assay kit, and triglyceride package were acquired from Nanjing Jiancheng Bioengineering Institute Co., Ltd. (Nanjing, Jiangsu Province, China).
2.2. Experimental Animal Model
Fifty Sprague-Dawley (SD) male rats (ages 4-6 weeks) were obtained from the Hubei Research Center of Laboratory Animals (Wuhan, Hubei, China). Rats were provided unrestricted access to nourishment and water. After one week of acclimatization, the rats were randomly assigned to six groups, each containing 7-8 animals: normal group (NOR), TMA positive group (TMA), choline model group (CHO), low tangeretin exposure group (LTN), medium tangeretin exposure group (MTN), and high tangeretin exposure group (HTN). All groups, except for NOR and TMA, received drinking water enriched with 3% choline chloride. The exposure groups were subjected to intragastric administration of 50 (LTN), 100 (MTN), or 200 (HTN) mg/kg body weight (BW) of tangeretin suspended in a 1% sodium carboxymethyl cellulose aqueous solution (1 mL/dose, once daily). Experimental procedures strictly followed the ethical guidelines outlined in the European Parliament Directive on the Conservation of Animals Used for Scientific Studies (Directive 2010/63/EU) and the NIH Guide for the Care and Use of Laboratory Animals, under authorization No JHDXLL0-46 from the Experimental Animal Ethics Committee of Jianghan University.
After a 6-week period, nocturnal fasting rodents were sedated with 4% isoflurane, and blood samples were withdrawn from the left ventricle for quantitative assessment of total cholesterol (TC), triglycerides (TG), high-density lipoprotein cholesterol (HDL-C), low-density lipoprotein cholesterol (LDL-C), aspartate transaminase (AST), and alanine transaminase (ALT) using commercial kits (Jiancheng Biotechnology Co., Ltd.). Simultaneously, fecal matter was collected and stored at -80°C for subsequent analysis, while the ileum and aortic tissues were promptly excised, submerged in cold physiological saline, and either stored at -80°C or embedded in 4% paraformaldehyde for histopathological examination.
2.3. Histomorphological Staining
Specimens of the terminal ileum (proximal ileocecal valve) and proximal aortic arch were fixed in a 4% paraformaldehyde solution. Standard paraffin embedding, dewaxing, and sectioning protocols were followed by HE staining. Pathological examination was conducted using a BH2 optical microscope (200× magnification, Olympus, Hino, Tokyo, Japan).
2.4. Immunohistochemical Detection
Thin sections of paraffin-embedded tissue were transferred onto gelatine-coated microscope slides. After deparaffinization, rehydration, and inactivation, sections were incubated overnight with primary antibodies (Zonula Occludens-1, ZO-1, Catalogue # 21773-1-AP or Occludin, Catalogue # 13409-1-AP from Proteintech, Wuhan, Hubei, China). Following three washes with phosphate buffer, slices were exposed to HRP secondary antibody (Catalogue # ab205718, Abcam, Cambridge, MA, USA). Specimens were stained with the chromogenic reagent 3,3′-diaminobenzidine (DAB) (Sigma-Aldrich) and counterstained with hematoxylin. The proportion of positively stained cells at each intensity level was measured using the H-score method according to the following formula: H score = 1 × (% mild staining) + 2 × (% moderate staining) + 3 × (% strong staining).
2.5. RNA Isolation and Quantitative RT-qPCR
Aortic tissue was homogenized using liquid nitrogen, and total RNA was isolated with TransZol-Up reagent (TransGen Biotech Co., Ltd., Beijing, China). RNA quality, purity, and concentration were assessed using a Nanodrop 2000C ultra-micro spectrophotometer (BIO-RAD T100, Hercules, CA, USA). Reversely transcribed cDNA was synthesized from approximately 1 μg of total RNA using a HiScript™ Q RT SuperMix kit (Vazyme, Shanghai, China). Real-time quantitative polymerase chain reaction (RT-qPCR) was performed with a CFX96 real-time PCR system (ABI, Foster City, CA, USA) for Toll-like receptor 4 (TLR4), Myeloid differentiation primary response 88 (MyD88), and Nuclear factor kappa-light-chain-enhancer of activated B cells (NF-κB) target genes. GAPDH served as a control. The primer sequences are delineated in
Table 1, and the relative expressions of target genes were calculated using the 2
−ΔΔCt method.
2.6. Cytokine Analysis
Serum cytokine profiling, including TNF-α, IL-1β, IL-6, IL-10, and IL-17, was conducted on serum samples using ELISA (Bio-Swamp, Wuhan, Hubei, China) following the provided protocol. Optical density (OD) values at a wavelength of 450 nm were measured using a microtiter plate reader (LabSystems, Helsinki, Finland).
2.7. Intestinal Microbiota Sequencing Procedure
The exclusive DNeasy PowerSoil Kit (Qiagen, Dusseldorf, Germany) facilitated comprehensive DNA extraction from ileal content for microbiome characterization. This extraction involved crucial steps: DNA quantification using the sophisticated NanoDrop ND-1000 spectrophotometer (Plant & Life Science, Waltham, MA, USA), followed by electrophoresis examination via agarose gel imaging to determine purity. The bacterial taxa were amplified using fragments of the V3-V4 variable restriction fragment of the 16S RNA gene with primers 338F (5'- barcode+ ACTCCTACGGGAGGCAGCA -3') and 806R (5'- GGACTACHVGGGTWTCTAAT -3'). The purification of PCR products employed beads from Agencourt AMPure (Beckman Coulter, Brea, CA, USA). Post-extraction, quantification was assessed using a PicoGreen dsDNA Assay Kit (Invitrogen, Carlsbad, CA, USA). Depending on product yield, multiplexed 2×300 bp sequencing occurs on an Illumina MiSeq instrument using the latest MiSeq Reagent Kit v3, provided by Wuhan Servicebio Technology Co., Ltd. (Wuhan, Hubai, China).
For quality control, the Quantitative Insights into Microbial Ecology pipeline (version 1.8.0) managed raw FastQ files [
13]. Clustering sequence information at 97% sequence identity via UCLUST formed the basis for Operational Taxonomic Units (OTUs) [
14]. These OTUs, after being aligned to the respective barcode sequences, resulted in relative abundance ASVs (Feature) data. Subsequent steps catalyzed both α diversity analysis (Chao1 index & Shannon diversity index) and β diversity analysis (PCAs) [
15]. The visual representation of these analyses was achieved through principal coordinate analysis (PCoA) using MEGAN [
16] and GraPhlAn [
17], proprietary tools from BioGraph AG, for visualizing taxonomic compositions and abundance. Visualization of shared and unique OTUs in sample or group comparisons employed the R software package Venn Diagram [
18].
2.8. Bacterial Species and Habitats
To assess the in vitro efficiency of TMA-proliferating bacteria, L. saccharolyticum WM1 (ATCC 35040) was cultured under microaerophilic conditions in ATCC medium 1118 at 37°C. Analyzing the influence of tangeretin on choline transamination into TMA during L. saccharolyticum WM1 cultivation involved inoculating microbial populations with choline chloride in sterile vessels. These populations were incubated under microaerobic conditions (composed of 80% N2 and 20% CO2) at 37°C until cells attained an optical density at 600 nm (OD600) close to unity. Subsequently, cultures underwent centrifugation at approximately 15,294 ×g for 10 min at 4°C.
2.9. Molecular Docking
The amino acid sequence of CutC protein from
L. saccharolyticum WM1 was extracted from prior scientific literature [
8]. Protein topological modeling was pursued using Robetta (
https://robetta.bakerlab.org/submit.php), while structural refinement of the protein was performed using I-TASSER (
https://zhanglab.ccmb.med.umich.edu/I-TASSER/) online resources. After modeling, the protein constructs were optimized by using Discovery Studio 2.5 software. The protein models were reassessed using the SAVES v6.0 platform (
https://saves.mbi.ucla.edu/). Structural data for tangeretin were extracted from the PubChem database (
https://pubchem.ncbi.nlm.nih.gov/) and subsequently structurally refined. Computational docking was carried out with the help of Autodock Vina software, and the results were depicted using PyMOL software. Finally, pictorial renderings were formulated using PyMOL (Schrödinger, LLC. The PyMOL molecular graphics system, version 1.8, 2015.).
2.10. Measurement Quantification of TMA and TMAO
TMA in caecal contents and culture supernatant, and TMAO in plasma, were quantified using HPLC-MS/MS. Specifically, 200 mg of ileum content was precisely measured, stirred for 10 min using a solution of acetonitrile: methanol: water (V:V:V = 40:40:20), with 2.0 μM of D9-TMA incorporated into cecal samples as an internal standard. This mixture was agitated, then equilibrated at -80°C for 2 h, and subsequently centrifugated at 15,294 ×
g for 15 min at 4°C. The supernatant was extracted and filtered through a 0.22 μm membrane for TMA evaluation [
19].
For plasma samples, 20 μL of the sample was treated with 80 μL of acetonitrile for protein precipitation. 2.0 μM of D9-TMAO was incorporated into plasma samples as an internal standard. This formulated mixture was agitated, left static at -80°C for 2 h, and subsequently centrifuged at 15,294 ×
g for 15 min at 4°C. The supernatant was extracted and filtered through a 0.22 μm membrane for TMAO determination [
19].
HPLC-MS/MS analysis was performed on a TSQ Quantum Triple Quadrupole Mass Spectrometer (Thermo Fisher Scientific, Waltham, MA, USA) using a Welch Ultimate XB-C8 column (150×4.6 mm, 5 μm, Welch Materials, Inc, Shanghai, China) for separation. The injector temperature was 350°C, with an injection volume of 2.00 µL. High-purity nitrogen (99.999%) was utilized as the carrier gas at a flow rate of 0.8 mL/min. The mobile phase A was consisted of 0.1 mM ammonium formate (pH=3.5), and the mobile phase B was acetonitrile. The elution conditions were as follows: 0-0.15 min, 5% of phase A and 95% of phase B; 0.15-1.2 min, 15% of phase A and 85% of phase B; 1.2-3.0 min, 20% of phase A and 80% of phase B; 3.0-6.0 min, 30% of phase A and 70% of phase B; 6.0-7.0 min, 45% of phase A and 55% of phase B; 7.0-11.0 min, 45% of phase A and 55% of phase B; 11.0-12.0 min, 5% of phase A and 95% of phase B, and sustained at 5% of phase A and 95% of phase B until completion, with a total run time of 15 min.
2.11. Statistical Analysis
We assessed statistical differences between groups using the Wilcoxon rank sum procedure. For multi-group comparison, the Kruskal-Wallis test, supplemented by Holm-Bonferroni adjustment, was implemented. Distinctions between groups in animal experiments were examined through single-factor variance analysis using Tukey HSD. All statistical analyses were performed using the R 3.6.1 package, and values below 0.05 were considered statistically significant.
Figure 1.
Aortic sinus HE staining results (200×, Scale bar = 200 μm) (A) and serum content of TC (B), TG (C), LDL-C (D), HDL-C (E), MDA (F), SOD (G), and CAT (H) (n=3-5. *p<0.05, **p<0.01).
Figure 1.
Aortic sinus HE staining results (200×, Scale bar = 200 μm) (A) and serum content of TC (B), TG (C), LDL-C (D), HDL-C (E), MDA (F), SOD (G), and CAT (H) (n=3-5. *p<0.05, **p<0.01).
Figure 2.
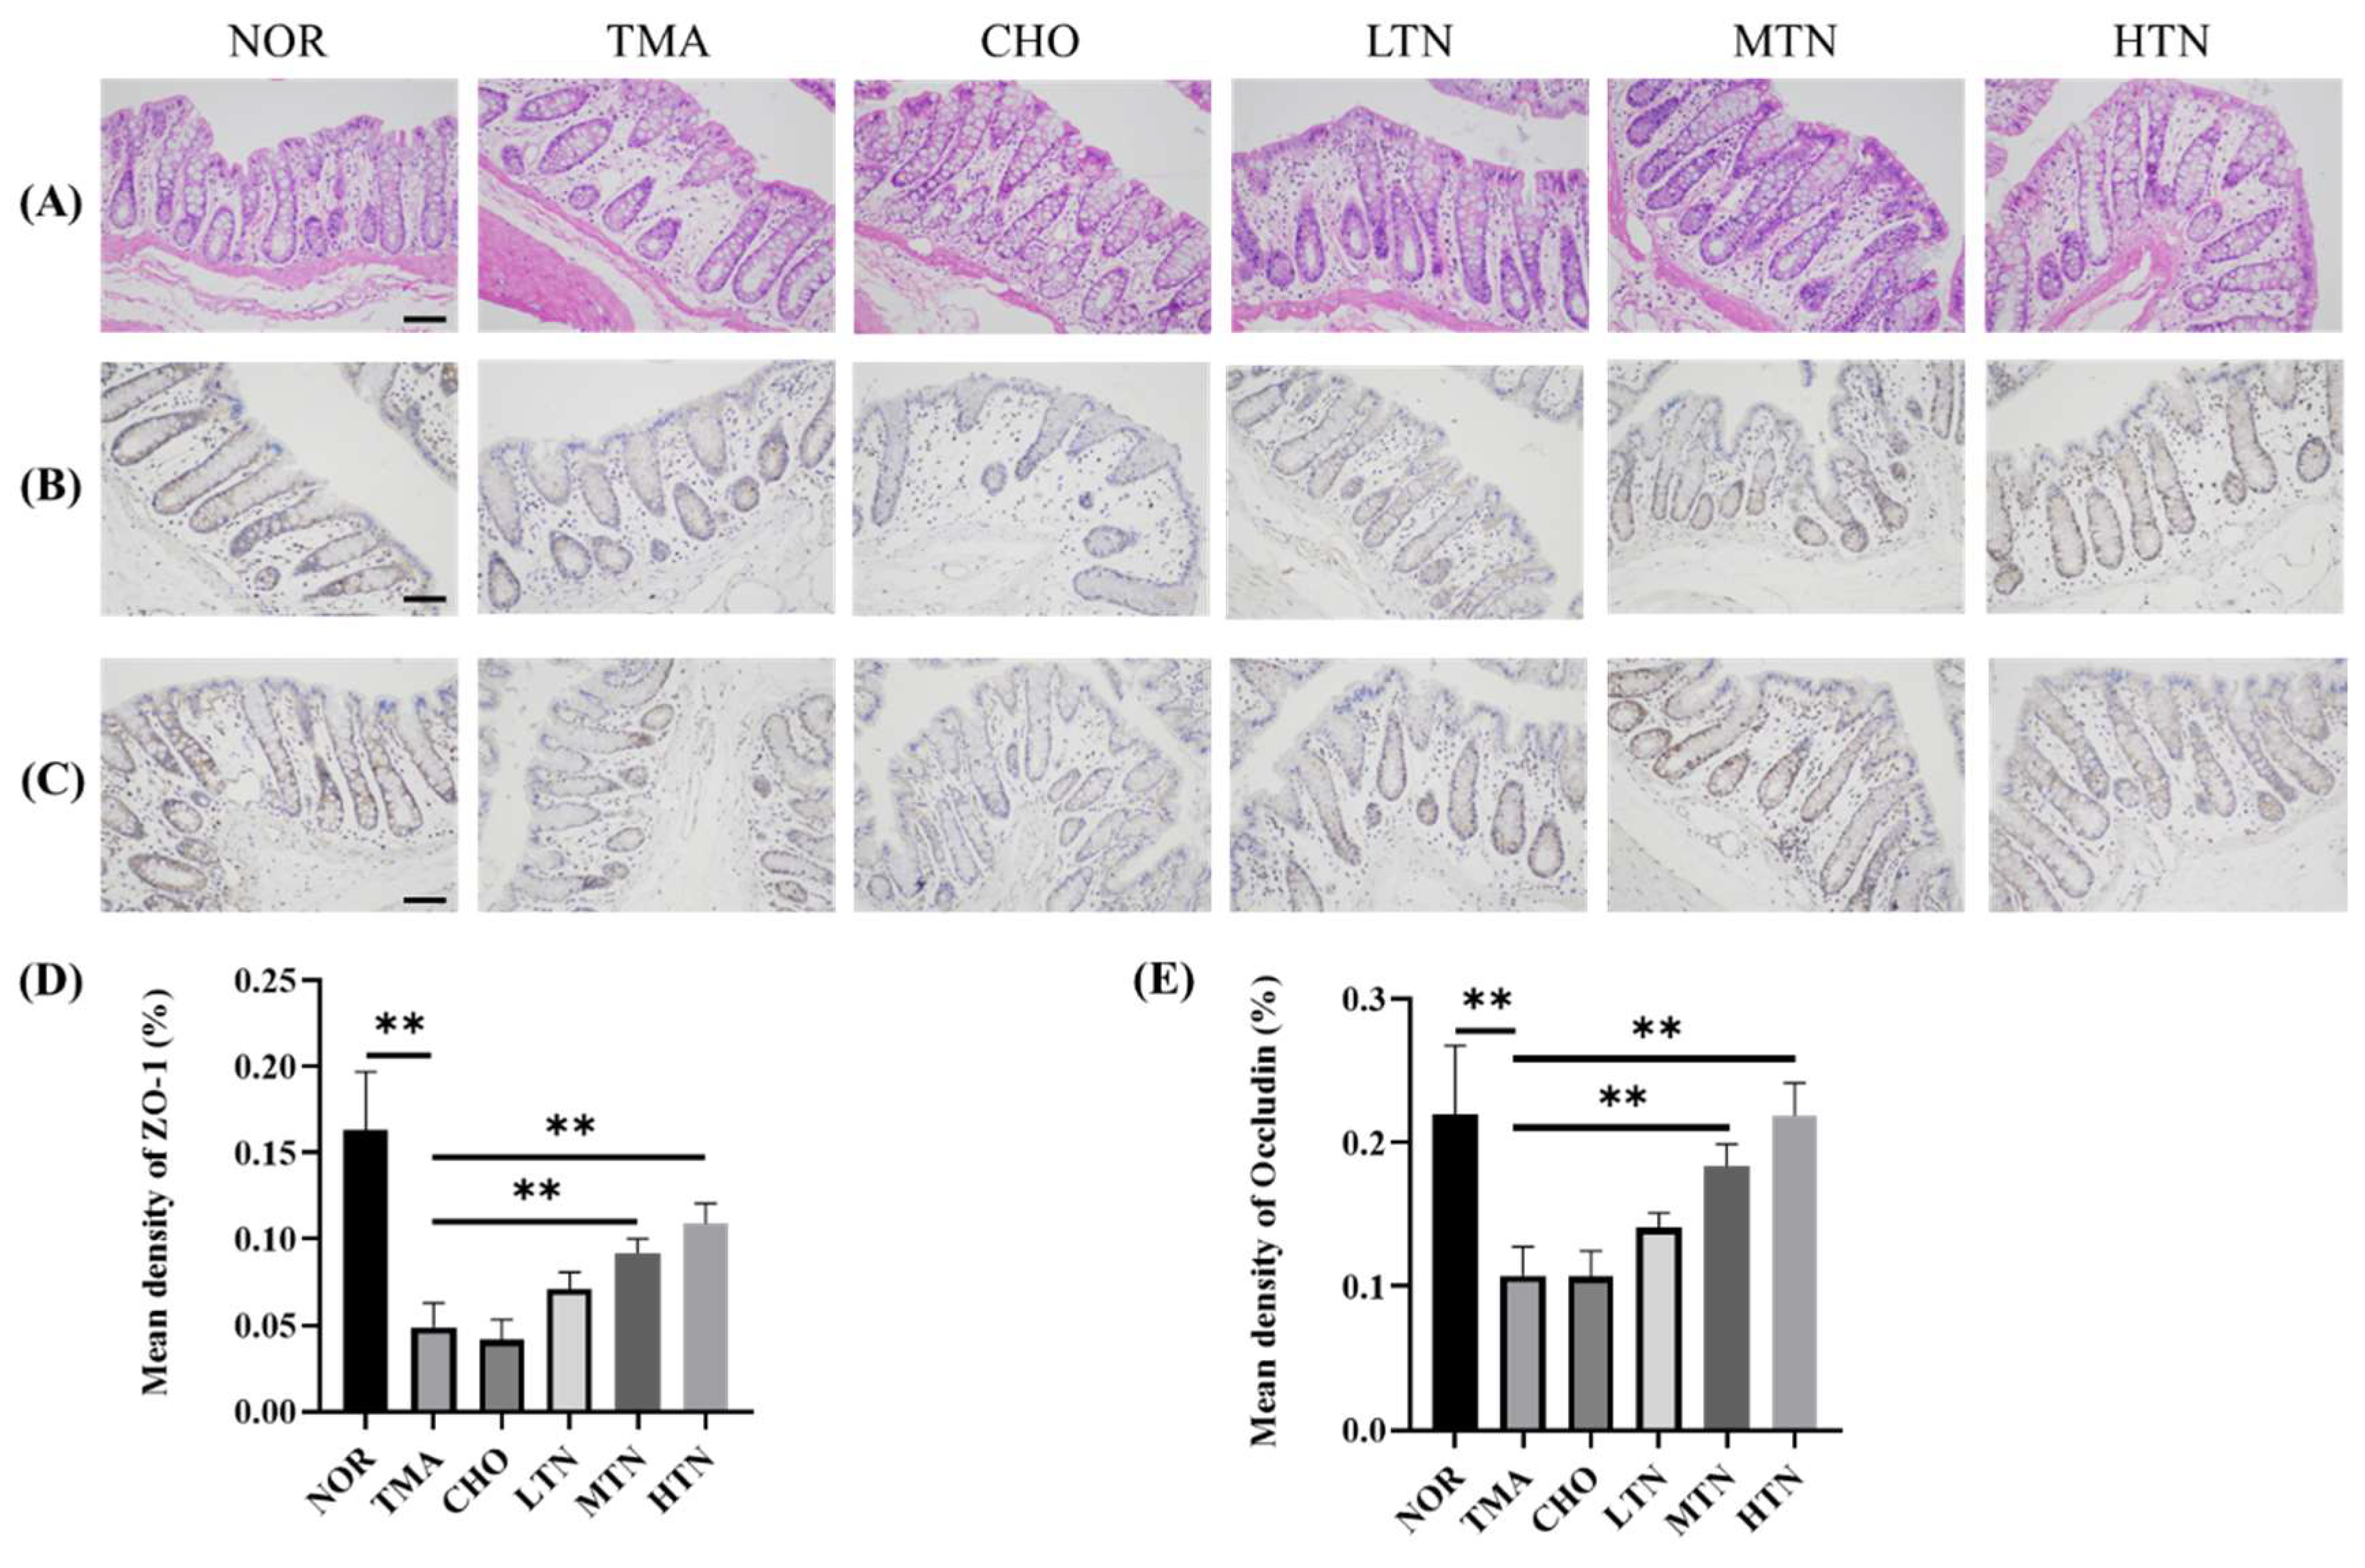
Ileal tissue HE and IHC results. (A) Examination of ileal tissue HE results. Immunohistochemistry (B) and quantification (D) of ZO-1. Immunohistochemistry (C) and quantification (E) of Occludin (200×). Scale bar = 200 μm, n=3-5. *p<0.05, **p<0.01.
Figure 2.
Ileal tissue HE and IHC results. (A) Examination of ileal tissue HE results. Immunohistochemistry (B) and quantification (D) of ZO-1. Immunohistochemistry (C) and quantification (E) of Occludin (200×). Scale bar = 200 μm, n=3-5. *p<0.05, **p<0.01.
Figure 3.
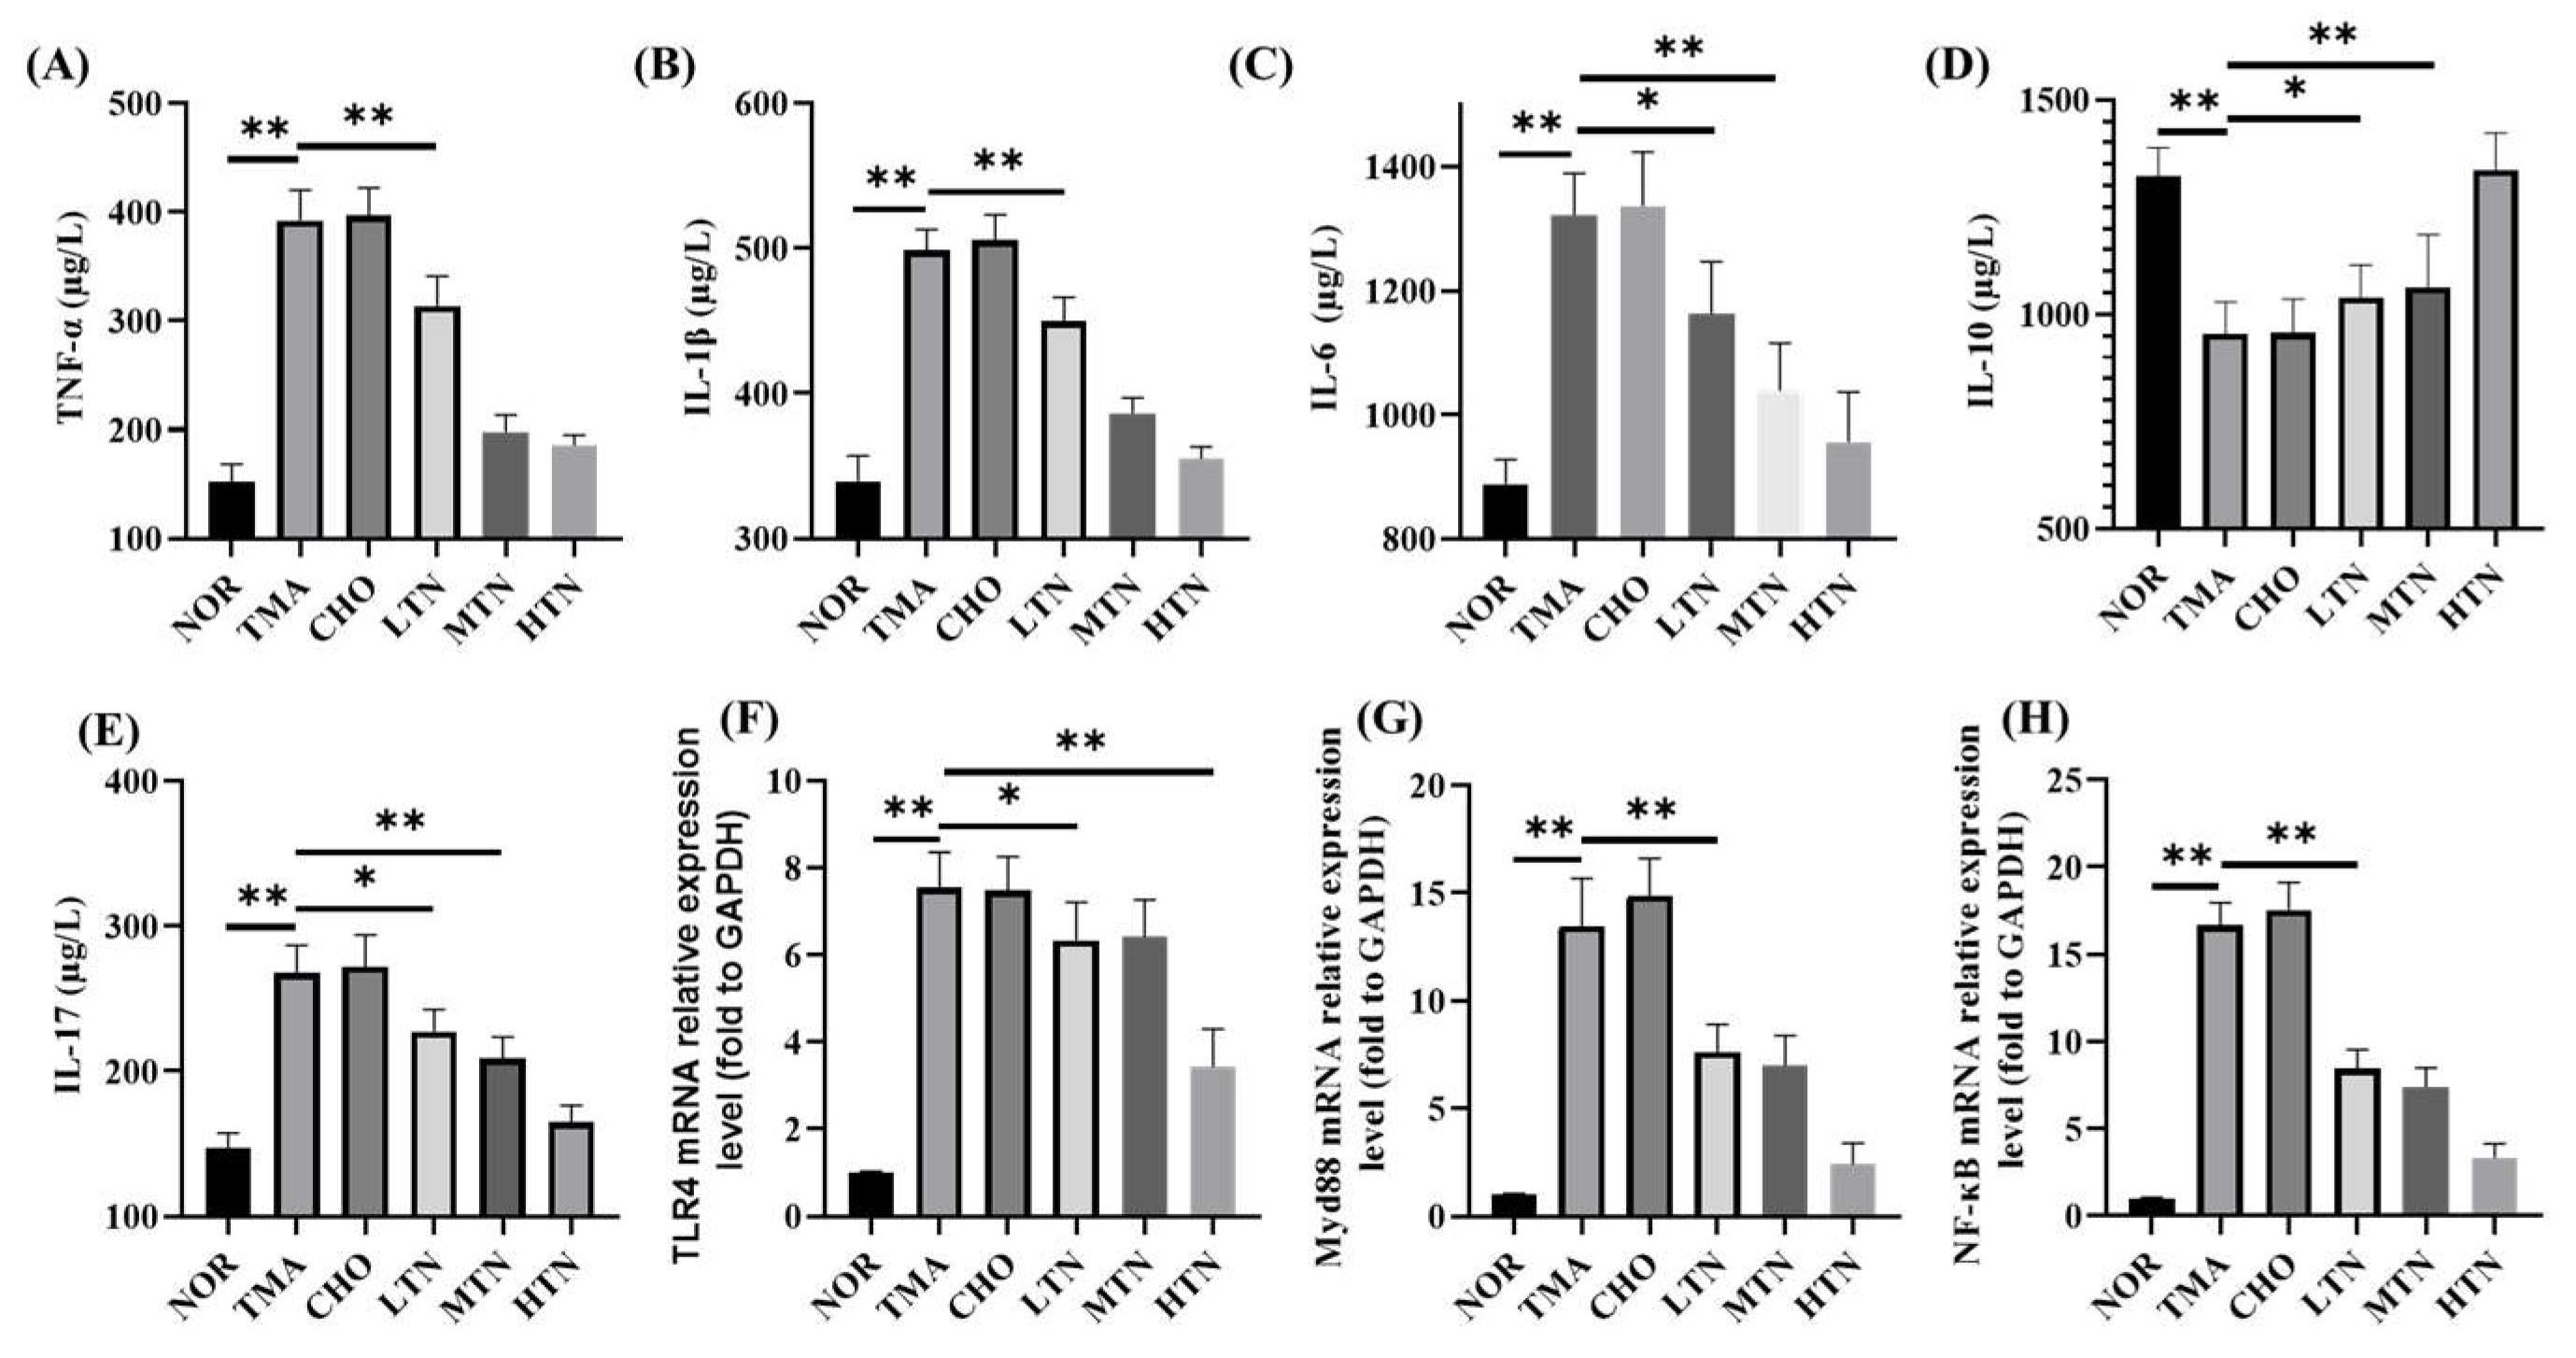
Plasma contents of TNF-α (A), IL-1β (B), IL-6 (C), IL-10 (D), IL-17 (E), and aortic TLR4 (F), MyD88 (G), NF-Κb (H) relative expression levels (n=3-5. *p<0.05, **p<0.01).
Figure 3.
Plasma contents of TNF-α (A), IL-1β (B), IL-6 (C), IL-10 (D), IL-17 (E), and aortic TLR4 (F), MyD88 (G), NF-Κb (H) relative expression levels (n=3-5. *p<0.05, **p<0.01).
Figure 4.
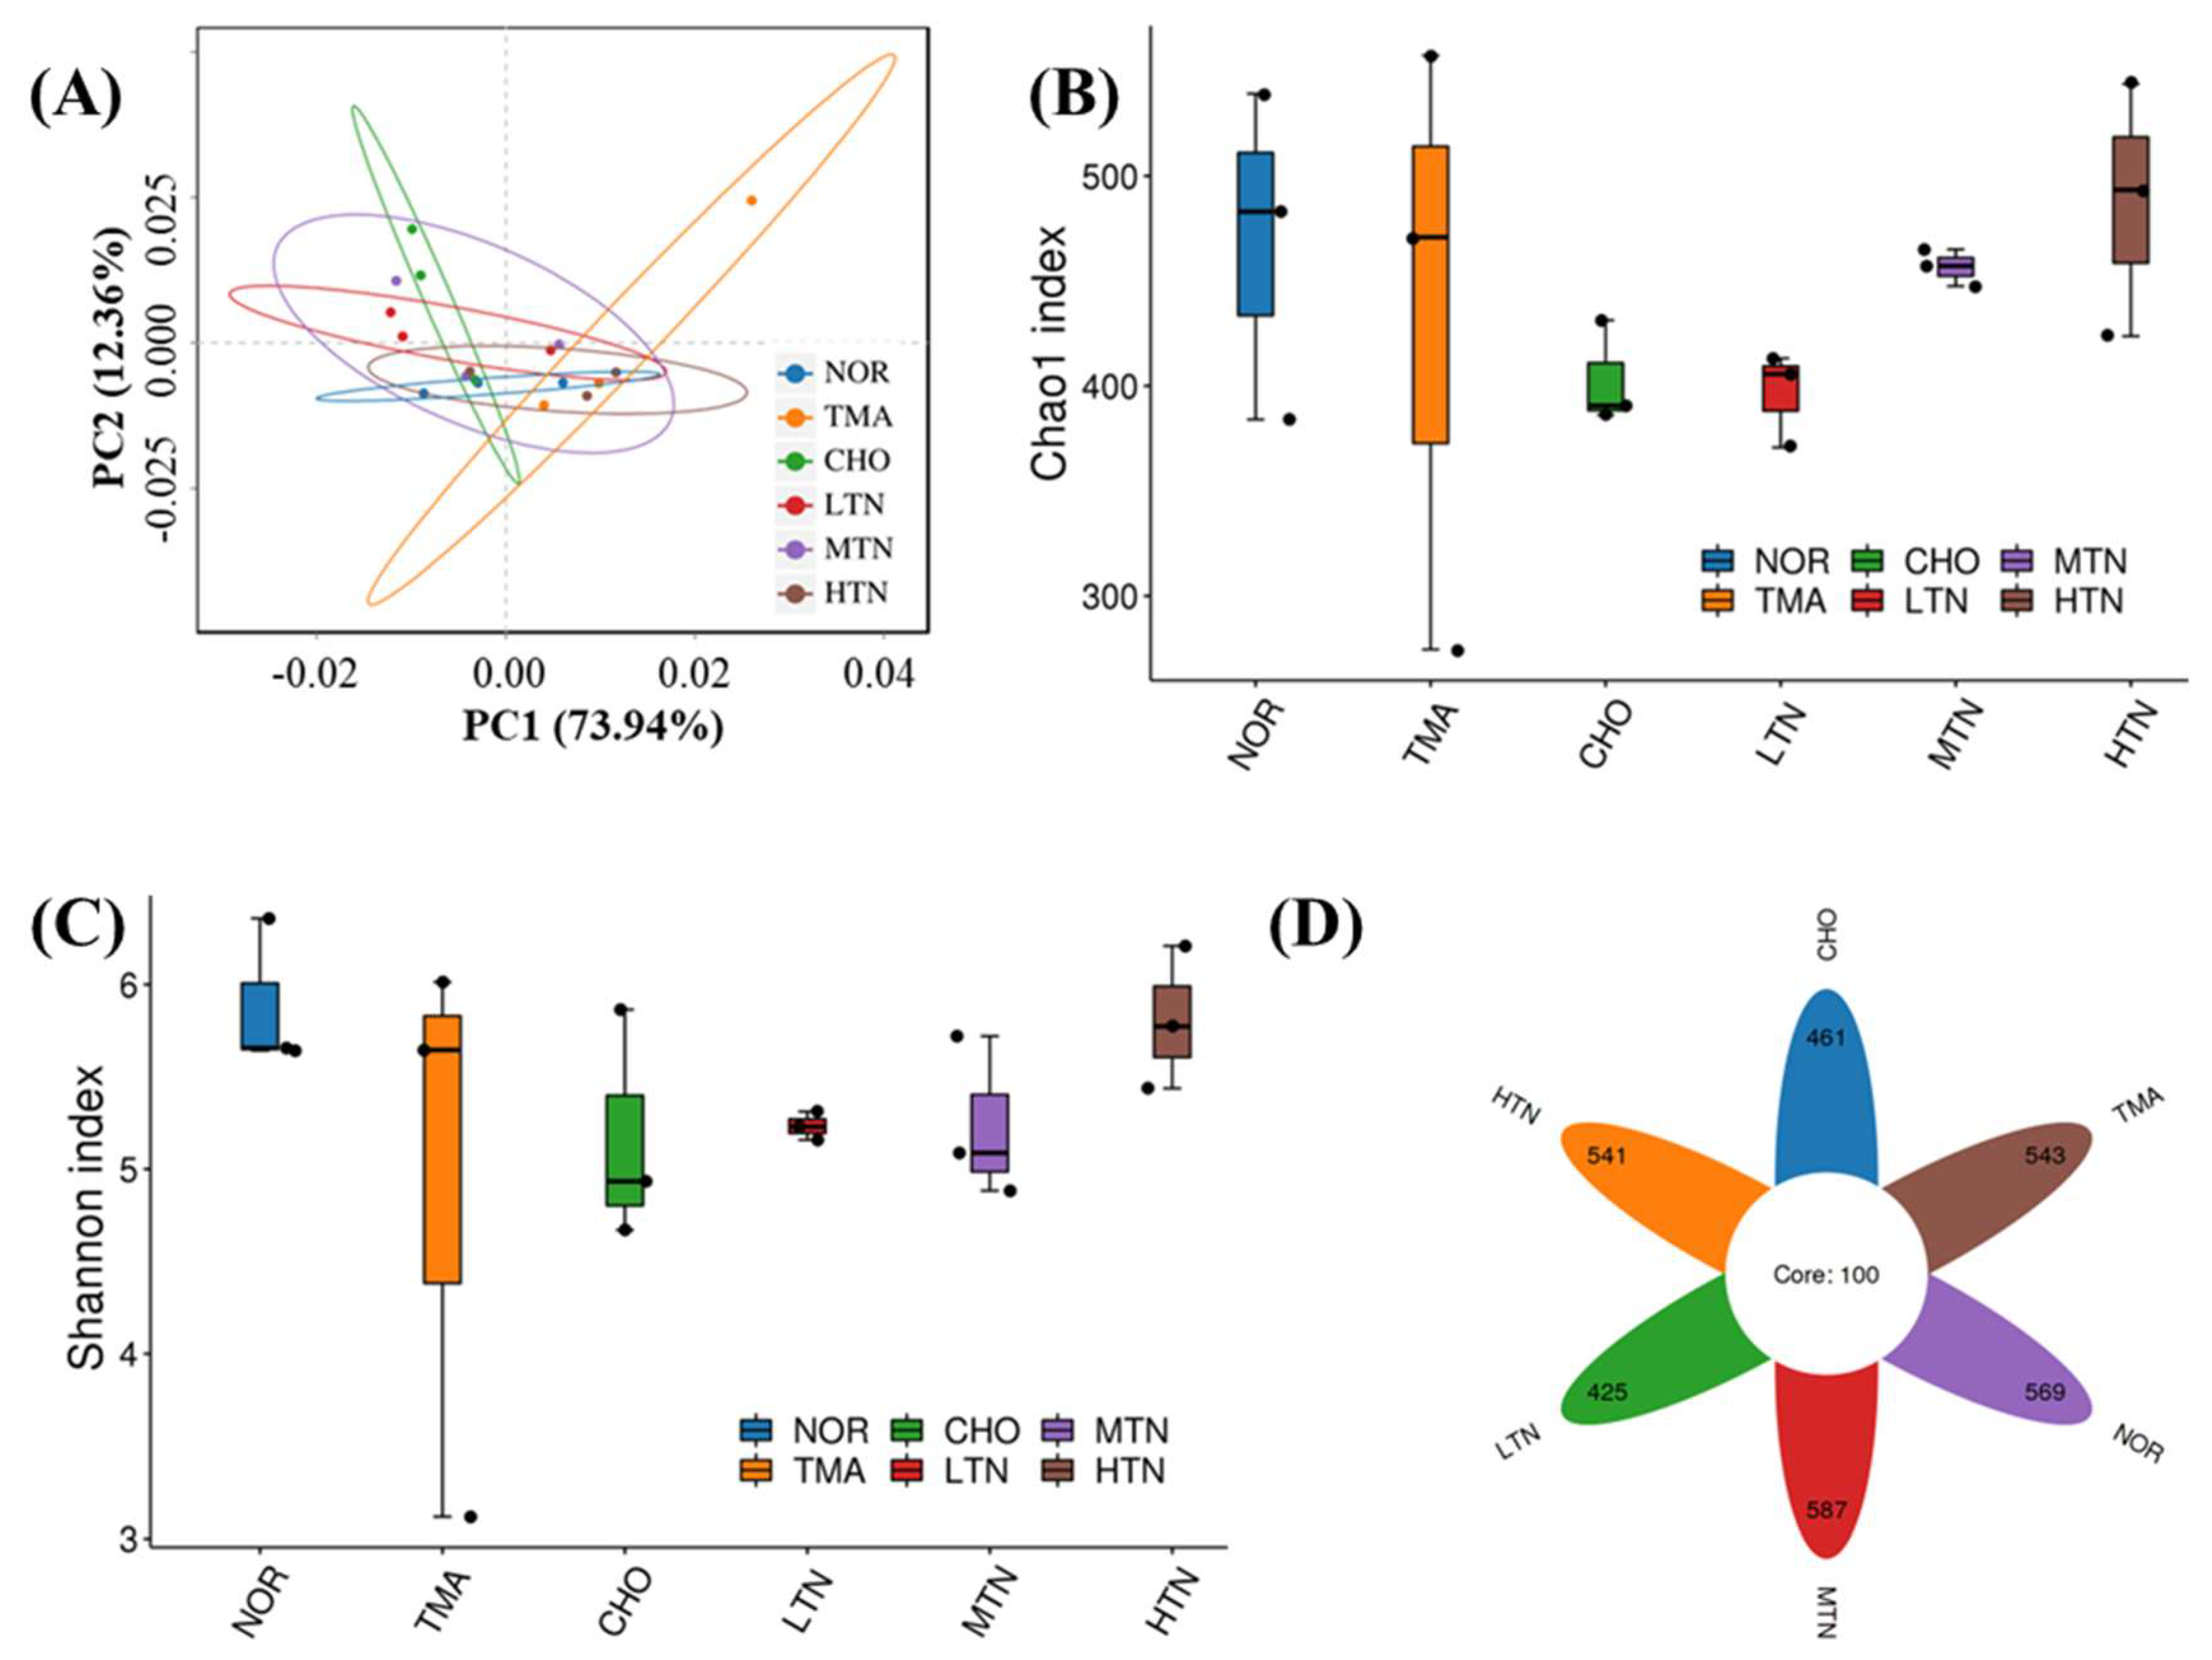
16S rDNA sequence analysis of gut microbes. (A) β diversity analysis of Principal Coordinate Analysis, (B) α diversity analysis of Chao1 index, (C) Shannon diversity index, and (D) ASV Venn diagram.
Figure 4.
16S rDNA sequence analysis of gut microbes. (A) β diversity analysis of Principal Coordinate Analysis, (B) α diversity analysis of Chao1 index, (C) Shannon diversity index, and (D) ASV Venn diagram.
Figure 5.
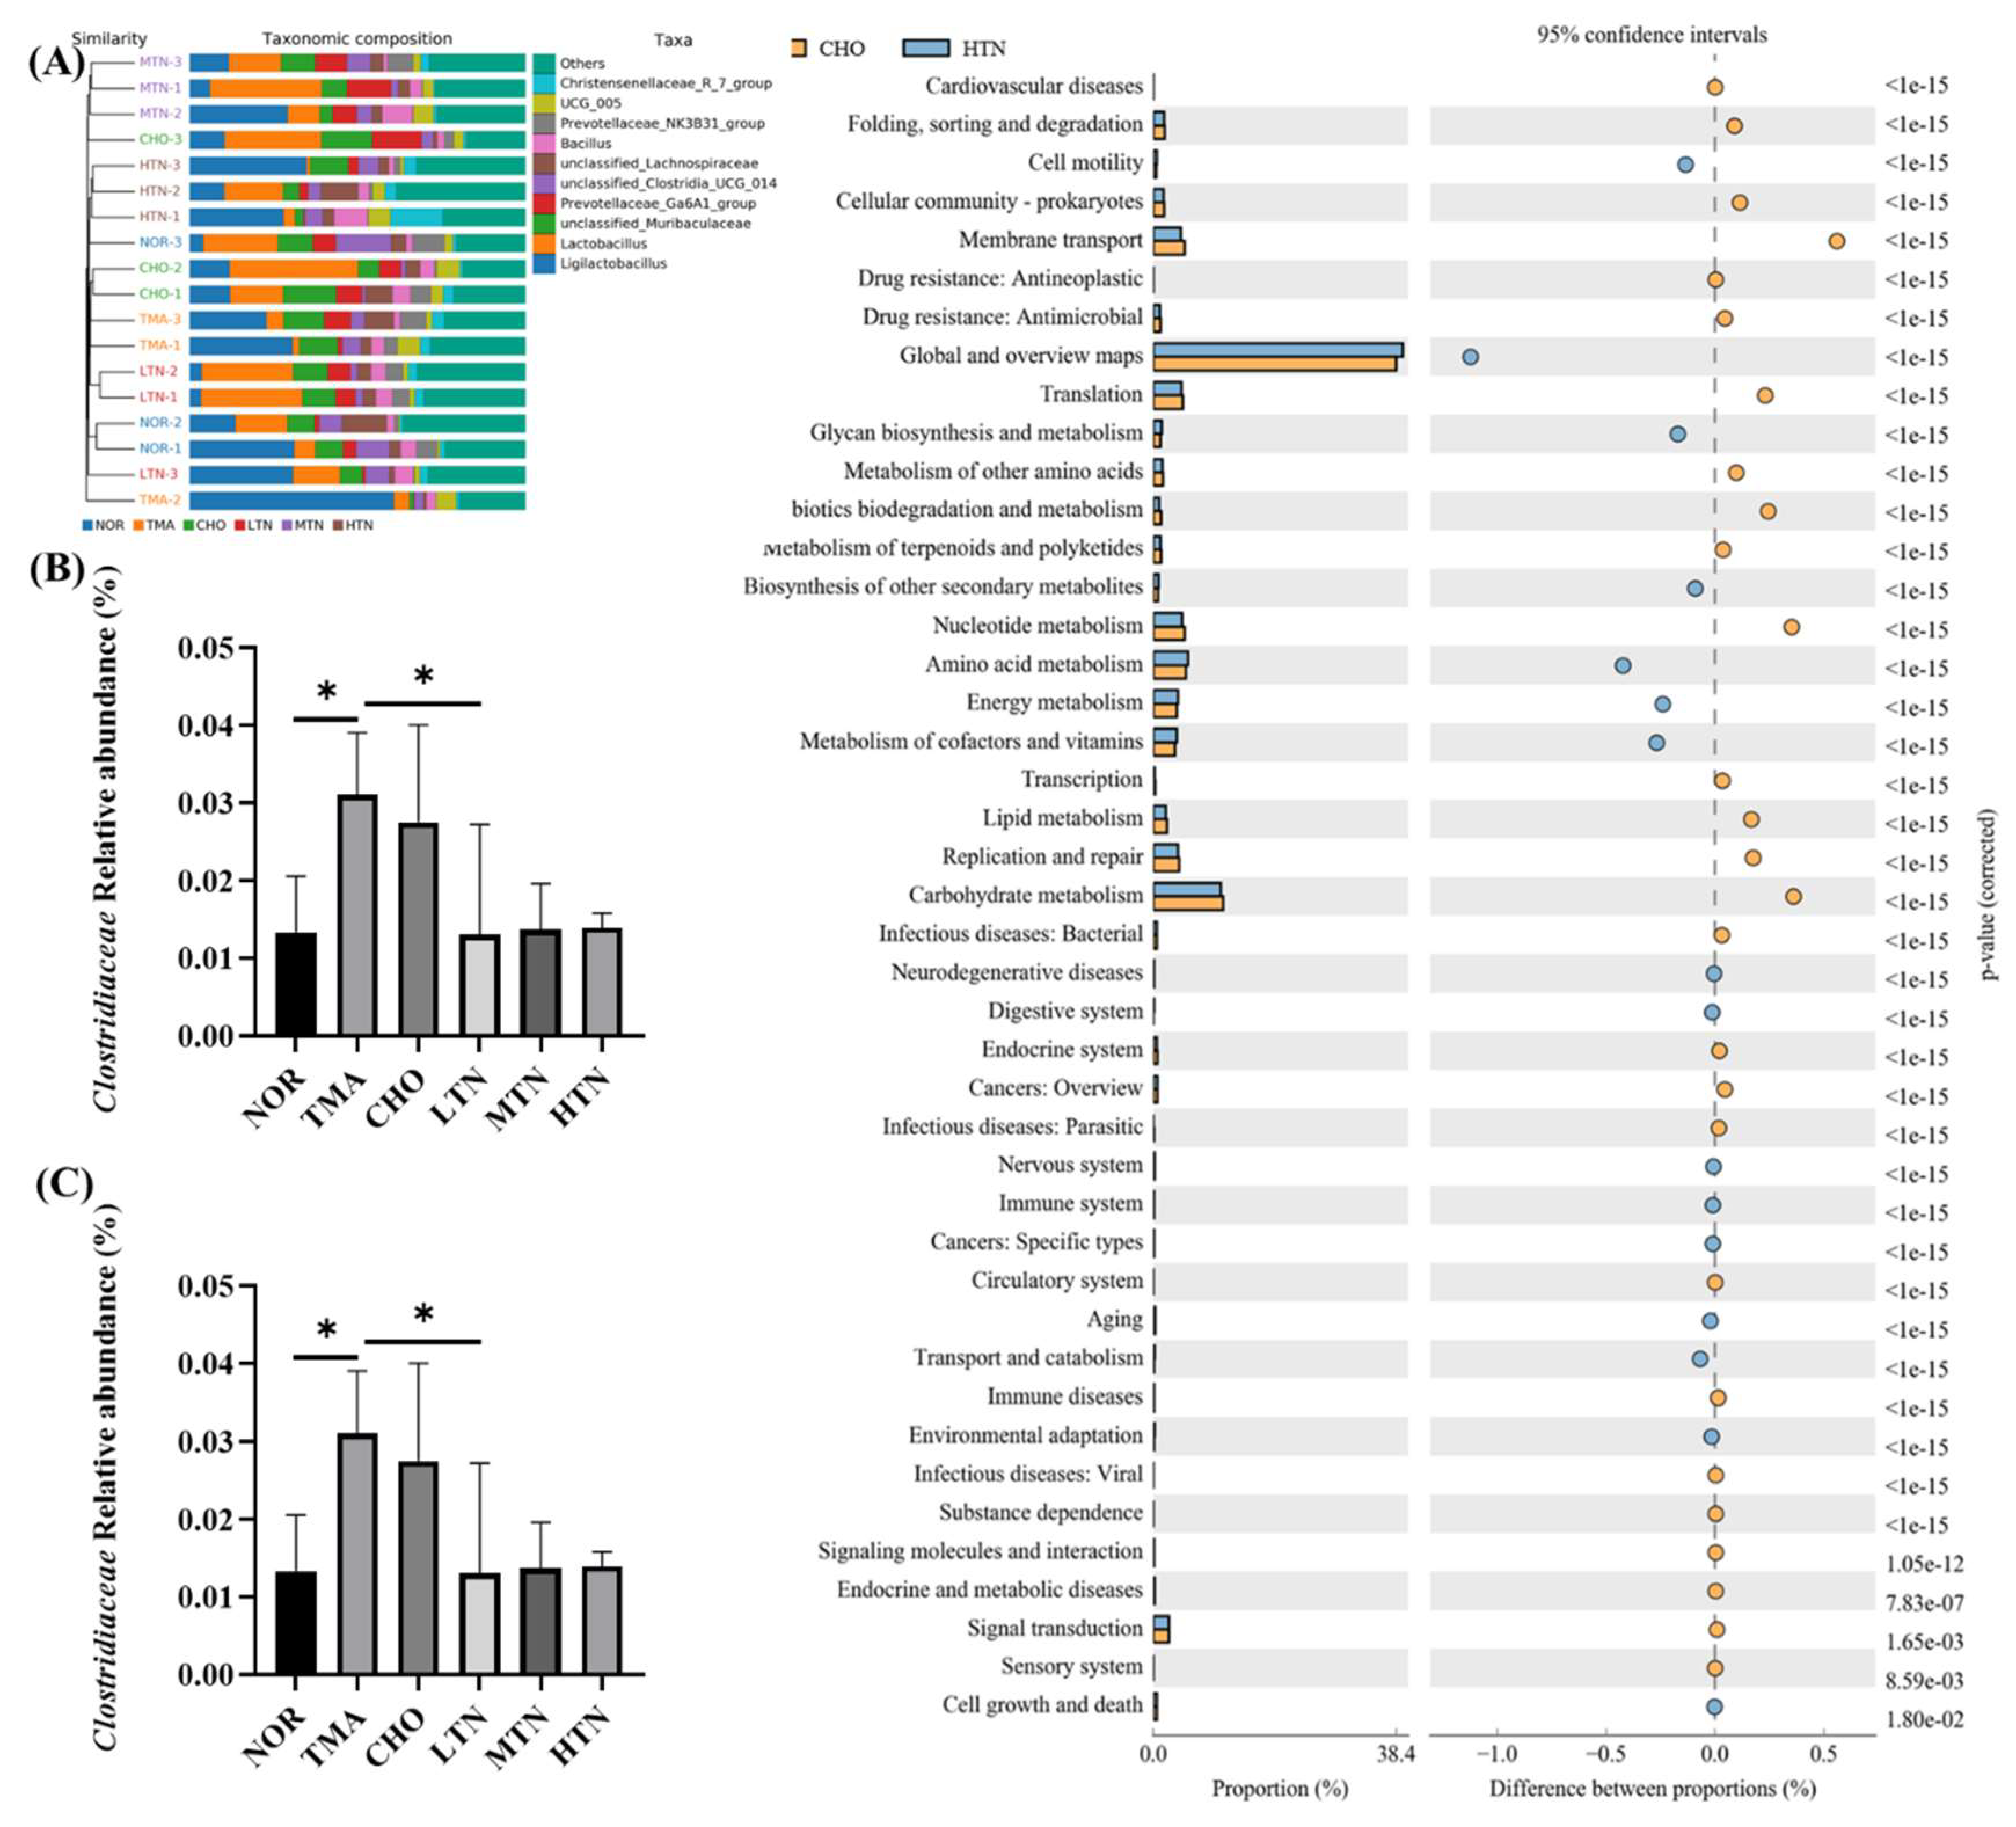
Tangeretin influenced the overall patterning and makeup of gut microbiota in rats treated with choline chloride. (A) Gut microbiota composition at the phylum level. (B) Relative abundance of Clostridiaceae. (C) Relative abundance of Lactobacillus. (D) Analysis of distinctions in metabolic pathways of KEGG. Data are illustrated as means ± SD, n=3-5. *p<0.05.
Figure 6.
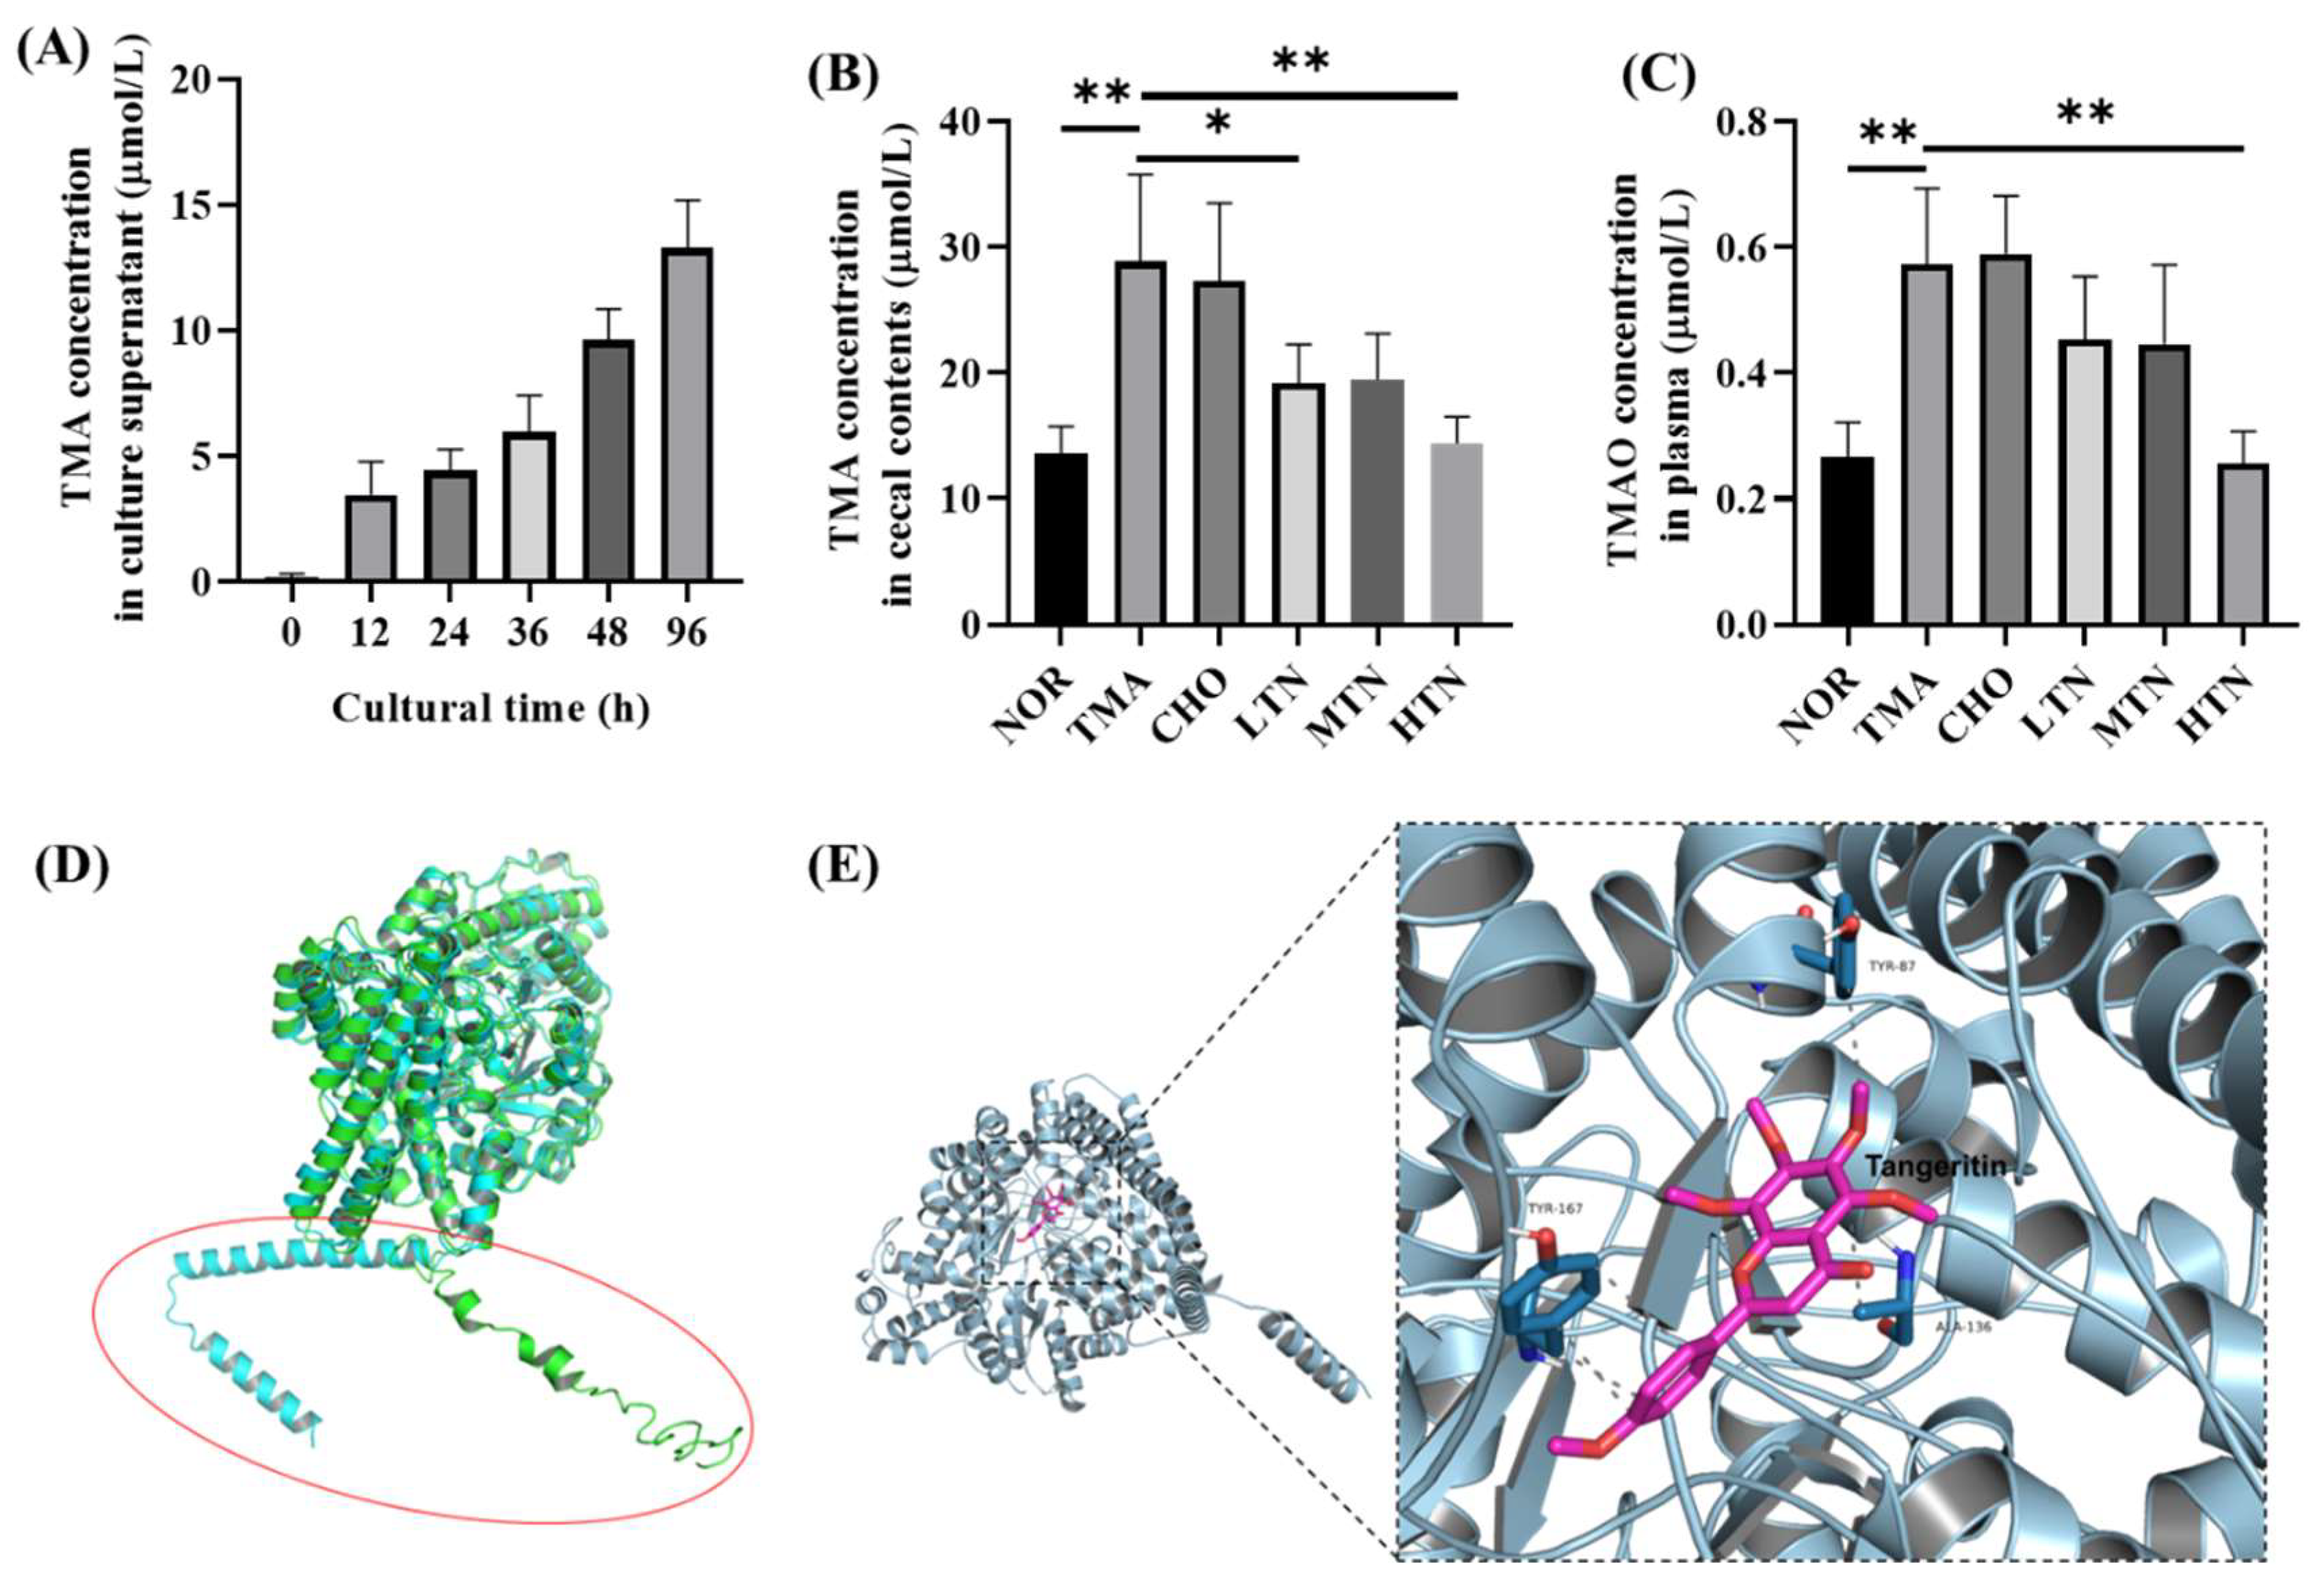
Detection of TMA and TMAO levels and molecular docking of tangeretin with CutC. (A) Plasma TMAO levels. (B) Cecal content TMA levels. (C) Cultural supernatant TMA level. (D) Computer generated structure of L. saccharolyticum WM1 CutC; (E) Interactions of tangeretin with important residues (n=3-5. *p<0.05, **p<0.01).
Table 1.
Primers used in the RT-qPCR.
Table 1.
Primers used in the RT-qPCR.
| Gene name |
Forward primer (5'-3') |
Reverse primer (5'-3') |
| TLR4 |
GAGGACTGGGTGAGAAACGA |
GCAATGGCTACACCAGGAAT |
| MyD88 |
TGTGTGTTTCCTTTGGGACA |
TGCCACTACCTCATGCAAAG |
| NF-κB |
GATGCAGTTAATGCCCCACT |
TGCTGCTGGTGATTCTCTTG |
| GAPDH |
ATGACTCTACCCACGGCAAG |
GATCTCGCTCCTGGAAGATG |

