1. Introduction
Planetary science, since its establishment, has made significant strides, focusing on the intricacies of planet formation, planetary system evolution, and the observation and classification of planets. One of the pioneering milestones in this domain was NASA’s “Kepler” probe, the first to hunt for Earth-like planets in the Milky Way. Its primary method involved observing “planetary transits” using state-of-the-art instrumentation, which in turn facilitated the interpretation and extraction of information about the planet and its corresponding star system. Following Kepler’s path, the TESS probe, launched in 2018, is heralded as its successor. TESS also employs the “transit method” to scout for extrasolar planets, nurturing hopes of discovering another potentially life-supporting Earth.
As of July 26, 2023, the NASA Exoplanet Archive registers a staggering total of 5,483 exoplanets, out of which the TESS probe accounts for 373. A noteworthy observation is that a majority of the host stars for these exoplanets possess masses below a certain threshold. The question that arises is whether this observation is a function of the employed methodology or if it is inherently tied to the nature of planetary formation and evolution. Specifically, is it the observational approach that biases discoveries towards low-mass stars, or is it an innate aspect of the protoplanetary disk’s evolution mechanism that predominantly favors planet formation around such stars?
Historically, researchers have delved deep into the realms of planetary system formation and evolution. For instance, Ida and Lin’s seminal work from 2004 onwards spans five articles detailing planetary system formation, laying the groundwork for protoplanetary disk evolution [
10,
11,
12,
13,
14]. Also, Reffert et al. have obtained precise radial velocities for a sample of 373 G and K type giants at Lick Observatory regularly over more than 12 years and find strong evidence for a planet-metallicity correlation among the secure planet hosts of our giant star sample, in agreement with the one for main-sequence stars[
17]. Furthermore, Alibert, Mordasini, and Benz have also presented foundational models for the evolution of planetary disks[
2], albeit through distinct methodologies and parameter settings. In addition, there are several theories about disc and planet interaction and gap formation. S. Inutsuka et. al discuss planet-disk interactions for different planet masses and disk parameters, in particular the level of turbulence, and progress in modeling observational signatures of embedded planets[
19]. K. D. Kanagawa et. al examine the gap formation by a planet with a new formulation of one dimensional viscous discs which takes into account the deviation from Keplerian disc rotation due to the steep gradient of the surface density[
20].
While current models have shed light on the dynamics of planetary disks, they have not reached a consensus regarding the intrinsic nature of protoplanetary disks or the genesis of exoplanets. Observing this ambiguity in exoplanet data sparked our curiosity. We believe it’s an avenue ripe for exploration and scrutiny. This paper, therefore, aims to analytically and simulatively investigate the evolution trajectory of the planetary disk, focusing on its structural attributes and parameters, in an endeavor to elucidate the relationship between planetary disk evolution and planet formation.
Top of Form
2. Methodology and calculations
2.1. Surface density of the protoplanetary disk
Surface density is a pivotal parameter in the study of protoplanetary disks. Various formulas elucidating its behavior and variation have been derived based on the foundational theories of protoplanetary disk evolution.
For instance, Mundy LG et al. proposed a pure power-law formula, anchored on a subarcsecond image of the disk surrounding the T Tauri star HL Tau 0[
2].
Upon assigning a value for the surface density at a given radius
, a precise equation characterizing the protoplanetary disk’s surface density can be formulated as:
where
is the surface density at
. By integrating from the disk’s inner edge
to its outer edge
and acknowledging the angular coordinate’s symmetry
, we can ascertain the relationship between the surface density
and the disk’s mass
:
However, a distinct methodology underscores the necessity for a more intricate model, especially when attempting to match the intensity profiles of Orion protoplanetary disk silhouettes. McCaughrean et al. contested the efficacy of a pure power law for surface density, highlighting the need for an exponential decay model at the disk’s outer confines[
4].
Here
symbolizes the disk’s characteristic radius, denoting the juncture at which the surface density exhibits a marked deviation from a conventional power law. Hughes et al. pinpointed this radius to lie between 30 to 200 AU[
5]. Concurrently, Andrews et al. identified a broader spectrum for
, ranging from 14 to 198 AU[
6,
7]. For our computational purposes, we have opted for a median value of 106 AU as the representative parameter for
2.2. The parameter
In assessing the initial surface density scenario presented in
Section 2.1, it becomes evident from Eq. 2.1.2 that we are dealing with a divergent function. To circumvent this issue, rather than stretching to infinity, it’s pragmatic to set a specific outer edge as the disk’s boundary.
Drawing upon the insights provided by Hughes et al. (2008), the parameter
is approximately twive the value of
. It’s worth noting that accurately gauging disk sizes can be challenging due to the cool nature of the disk’s outer segment and its subdued emission[
5]. Thus, by considering this condition, we determine that
as the boundary of the integration in Eq. 2.1.3. And we can figure out the surface density in
by following equation.
For the second case in Eq. 2.1.4, the surface density in 1AU is easy to derive.
2.3. Surface density gradient
The gradient , fundamental to the surface density function, not only shapes the structure of the protoplanetary disk but also steers its evolution. This parameter has been the focal point of several investigative methods.
Drawing from extensive millimeter studies and the submillimeter Array survey of the 345 GHz (870 μm) thermal continuum emission from the Ophiuchus star-forming region, Andrews et al. pinpointed a relatively constrained gradient range of 0.4~1.0 for
, centering around a median value of 0.9[
6]. Their findings culminated in the assertion that
, suggesting it remains relatively uniform and isn’t substantially influenced by either mass or millimeter luminosity[
7]. This conclusion, however, contrasts with other findings in the field. For instance, Andrea Isella et al. identified a broader and negative gradient range of −0.8~0.8 for
, with a central median value pegged at 0.1[
8].
Amid these diverse interpretations, various research groups have leaned on different gradient values for their analysis. A case in point is Hayashi, who anchored his work on the premise
, subsequently presenting the model of the minimum mass solar nebula (MMSN)[
9]. Similarly, Ida and Lin, in their foundational work, embraced
to illustrate the primary evolutionary trajectory of protoplanetary disks[
10,
11,
12]. However, in Ida and Lin’s other researches, they adopt
to describe the surface density of gas rather than 1.5 in previous researches[
13,
14].
Taking into account these varied approaches and findings, we have incorporated the equation:
to provide a boundary condition for our model.
2.4. The mass relation between protoplanetary disk and star
From the formation of primordial nebulae to their evolution into planetary systems to the final outcome of stars, star mass is always an important parameter that affects the evolution of stars, the formation of planetary disks and the evolution of planets. In some studies, the dependence of the mass of the planetary disk on the mass of the star has also been indicated. J. P. Williams and L. A. Cieza have collated the previous studies and given a direct proportional relationship in the annual reviews[
15], what is unsatisfactory, however, is that this relationship has a large degree of dispersion ~0.5dex (decimal exponent: 0.5dex~10
0.5~3.162).
But such a proportional relationship only holds in the disk of low-mass stars, and often does not hold in massive stars.
In the case of massive stars
, A very precise limits have been given based on surveys of the sensitive Orion protoplanetary disk by R. K. Mann and J. P. Williams [
15,
16].
However, the expression (Eq. 2.4.1) just holds in the low-mass stars, and we give a stipulation as a boundary between low-mass stars and median-mass stars—
. (The center of the star is less dense, and the helium core formed at the end of the hydrogen burning of the star is not electron degenerate, but the carbon-oxygen core formed at the end of the helium burning is electron degenerate.)
In order to satisfy the above two cases, we use the above two relations and the exponential fitting method to give the specific expression relationship between the protoplanetary disk mass and the stellar mass. The result is shown below.
Through the above equation, we can get a rough expression of the relation between the protoplanetary disk and the stellar mass.
2.5. The viscous parameters of the protoplanetary disk
The evolution of protoplanetary disk is driven by viscous transport. An important parameter, , is needed. And the viscous evolution model of the disk is closely related to the surface density and the radial characteristics of the disk viscosity--.
By defining the
--the kinetic viscosity at
, we can derive the expression of
in one radius.
3. Simulations
3.1. FARGO3D
FARGO3D is an integrated program based on hydrodynamic models to simulate the evolution of protoplanetary disks. It contains the parameters that need to be entered. Examples include surface density, surface density gradient, dust-gas ratio, flare index, and uniform kinetic viscosity. In addition, we can modify the source code to change the surface density expressions, such as power law distribution (Eq. 2.1.2) and power law plus exponential distribution (Eq. 2.1.4), that is, the formula given in Sect. 2.1. Second, we can also change the mass of the central host star. Third, we can also simulate the disturbance of mass to the planetary disk by giving a specific mass at a specific orbital position. For example, in our model, we give a Jupiter-mass sized planet in the orbit of Jupiter as a disturbance. In particular, we also know that this mass is large enough to be compared to the perturbation of a planetesimal. However, if we give a small mass perturbation at a particular orbit, the program needs to run for a long, long time to show the effect of the perturbation on the protoplanetary disk. So, again, we chose a more massive planet in order to shorten the time of the program. There is no other specific purpose, just to shorten the running time of the program, so that the specific nature of the planetary disk can be seen more quickly.
3.2. The simulation processes
We divide the protoplanetary disk into grids, with 512 grids in the radial direction and 384 grids in the angular direction. In addition, we specify that our simulation radius is 0.35~35AU. Thus, each radial grid corresponds to and each angular grid corresponds to .
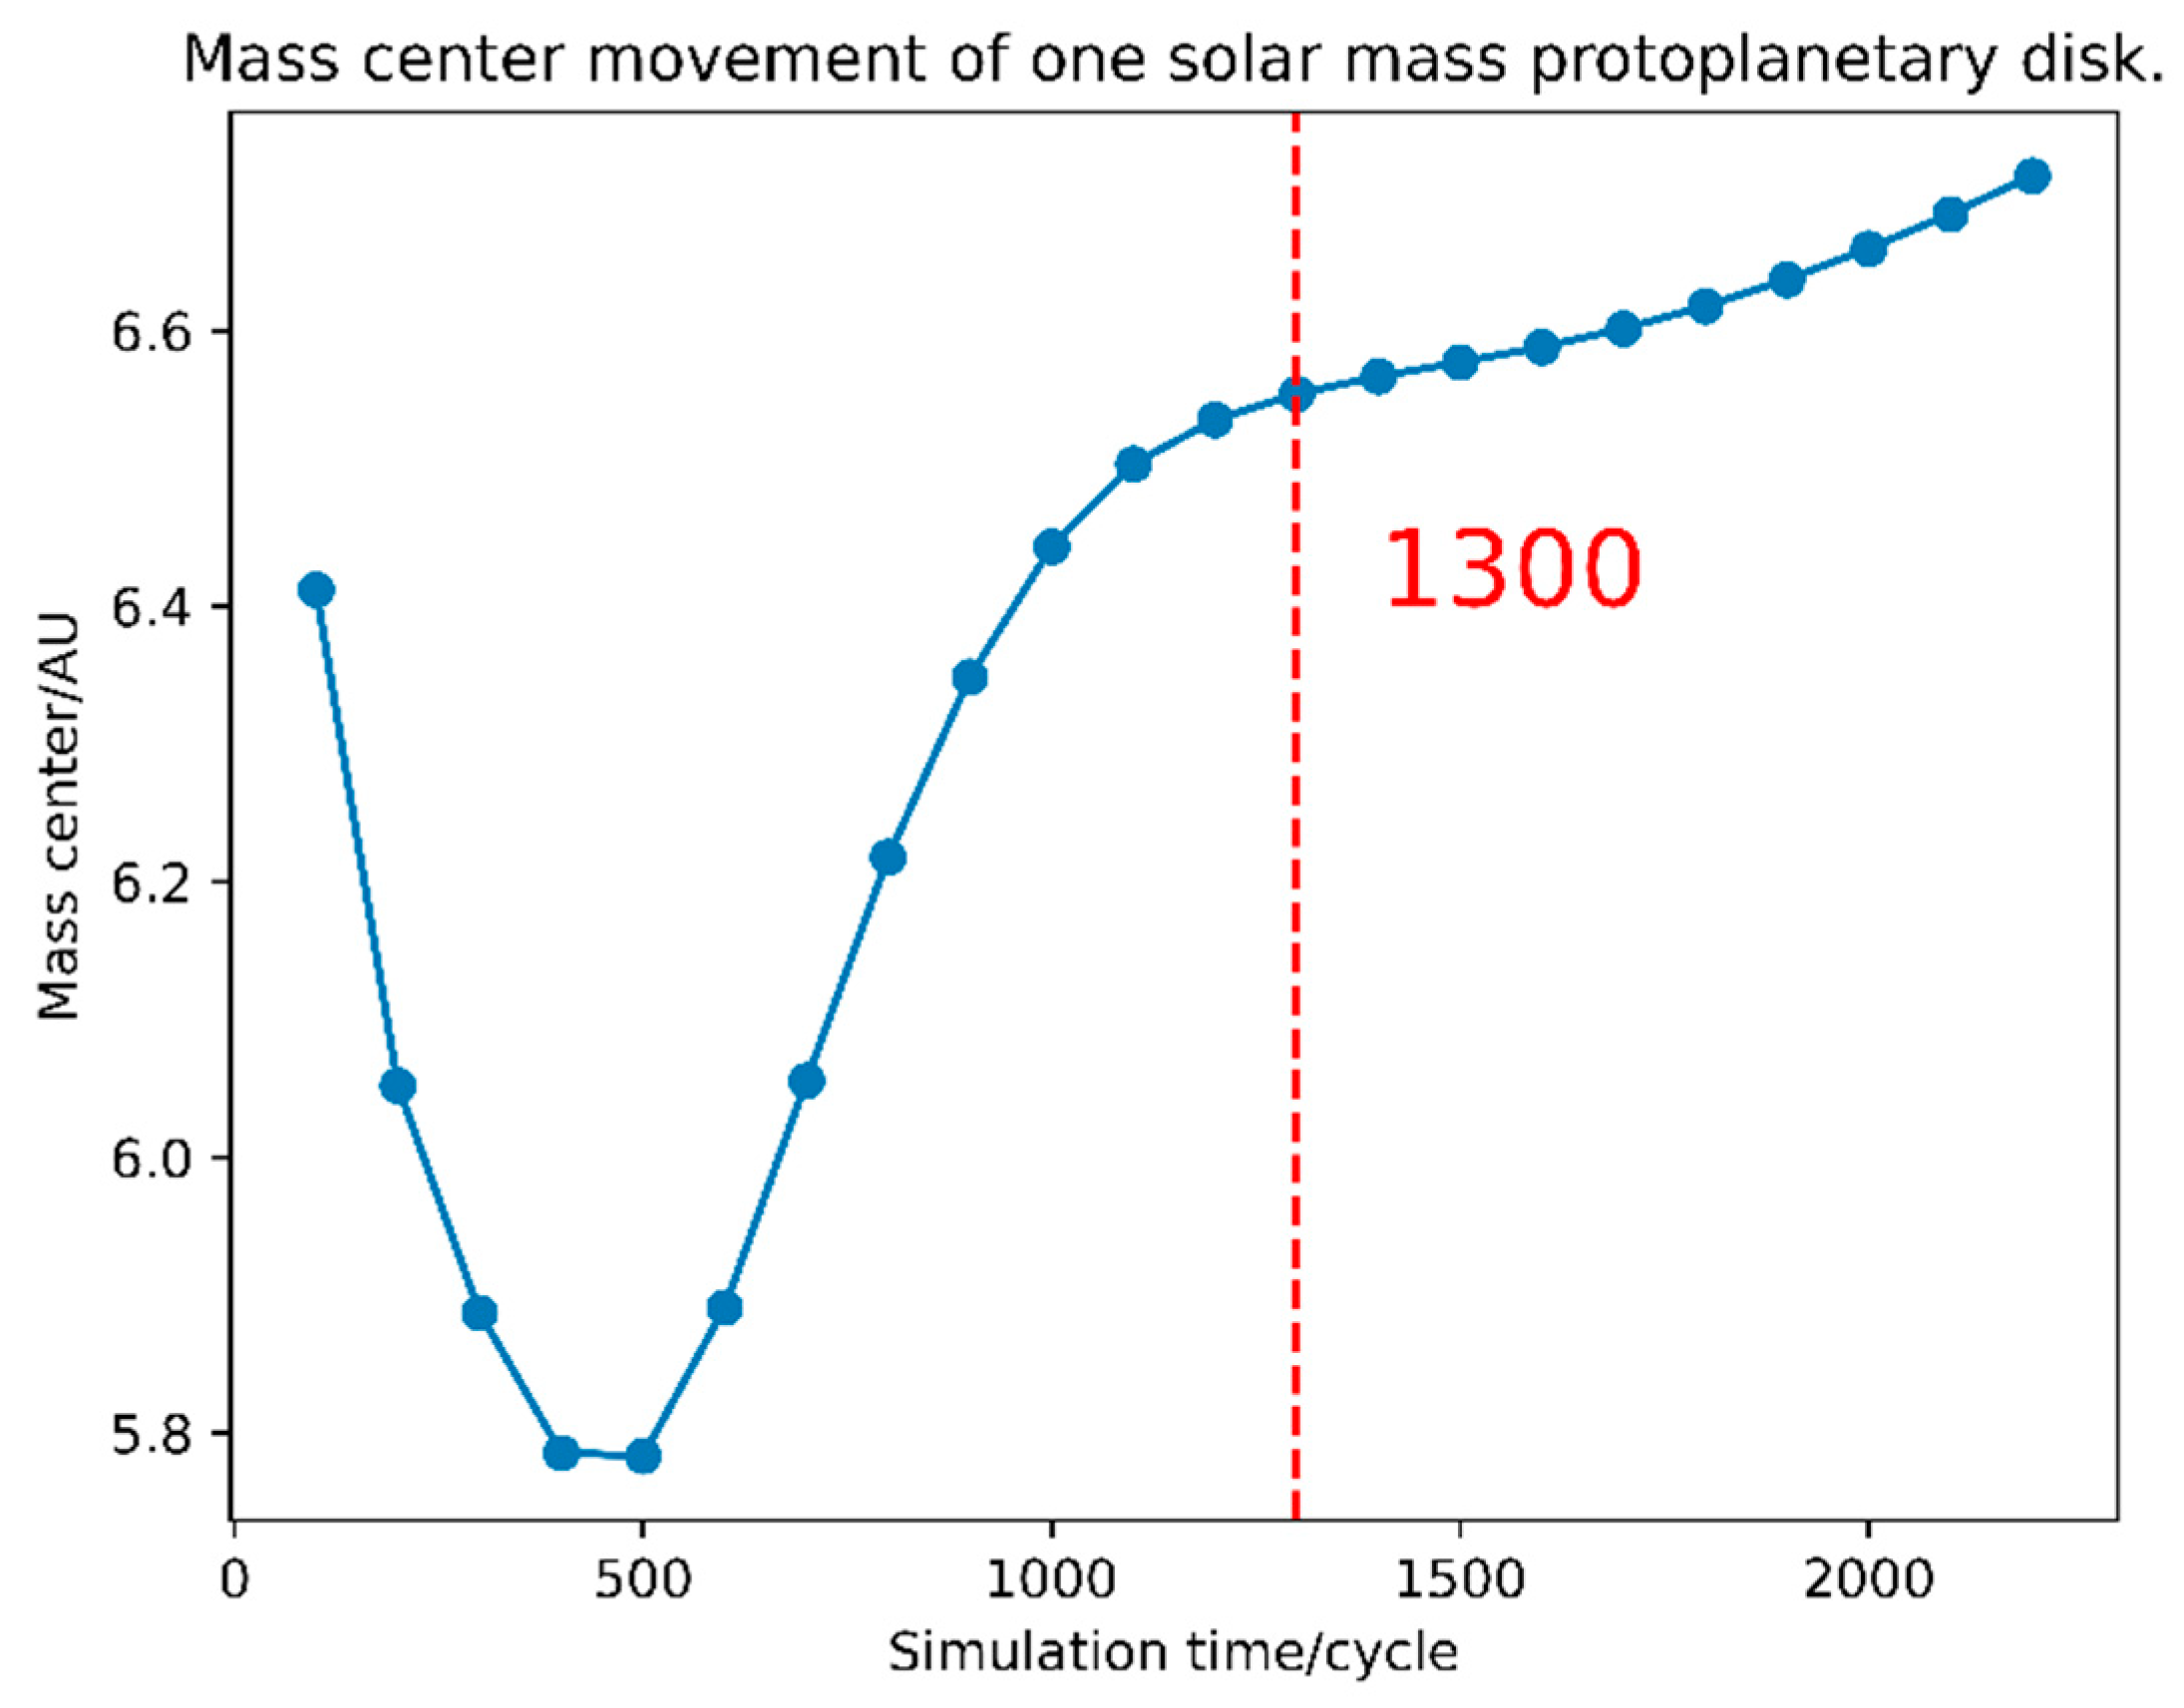
To explore the intrinsic properties of protoplanetary disks of different masses, namely the ability to form planets, we place a Jupiter-mass particle in Jupiter’s orbit. Moreover, we set the step size of the simulation to 0.1pi, and specify that the output is once every , that is, 100 cycles ( is one cycle). The following diagram shows the movement of the center of mass of a protoplanetary disk during the evolution of a solar mass disk.
As can be seen from the
Figure 1, after 1300 cycles, the protoplanetary disk’s center of mass motion is very slow, and we believe that the influence of the disturbance on the disk has ended at this point. It should be noted here that the evolution time in this example corresponds to 1300 cycles, and the result for one solar mass,
, is 14.3kyr. If it is the mass of another main star, the corresponding period should be calculated using the following method, because we know that the period of Kepler’s motion is
.
The continuous outward movement of the center of mass behind the disk is the result of the natural evolution of the planetary disk. According to this, we decided to take 1300 cycles as the upper limit of the program simulation time, and after 1300 cycles of the program, the simulation program ends.
Figure 1.
Mass center movement of one solar mass protoplanetary disk.
Figure 1.
Mass center movement of one solar mass protoplanetary disk.
3.3. Input of parameters
Through our model of the parameters defined in Sect. 2, all our parameters can be converted as a function of the mass of the central star, because we believe that the structure and evolution of the protoplanetary disk and the formation of the planetary system must be related to the mass of the host star.
For the two expression of the surface density we have defined in Sect. 2.2, the
expression (Eq. 2.2.1 and 2.2.2) differs from the program content entered in the simulation program. In FARGO3D, the input parameter is not the original expression, but the result after dividing by
, that is, the normalization of
. Moreover, the input values for the simulation parameters are given in the following table (
Table 1).
For kinetic viscosity, the input value in FARGO3D is the uniform kinetic viscosity. We take its average value in 0.35-35AU and calculate it by the following formula.
Further, we define the kinetic viscosity at
as
. Combined with the previous definition of
, we can calculate the uniform kinetic viscosity required for the program simulation, i.e.
. According to the relationship between
viscosity and kinetic viscosity,
, we calculate that
viscosity is 0.071.(
is one cycle, thus
) In addition, other parameters, such as the dust gas ratio, we specify it as 0.01, for the vertical distribution of the disk, we consider the classical horn shape of the disk, that is, flare index--
. To sum up, other parameters are set in the following table (
Table 2).
3.4. Simulation results
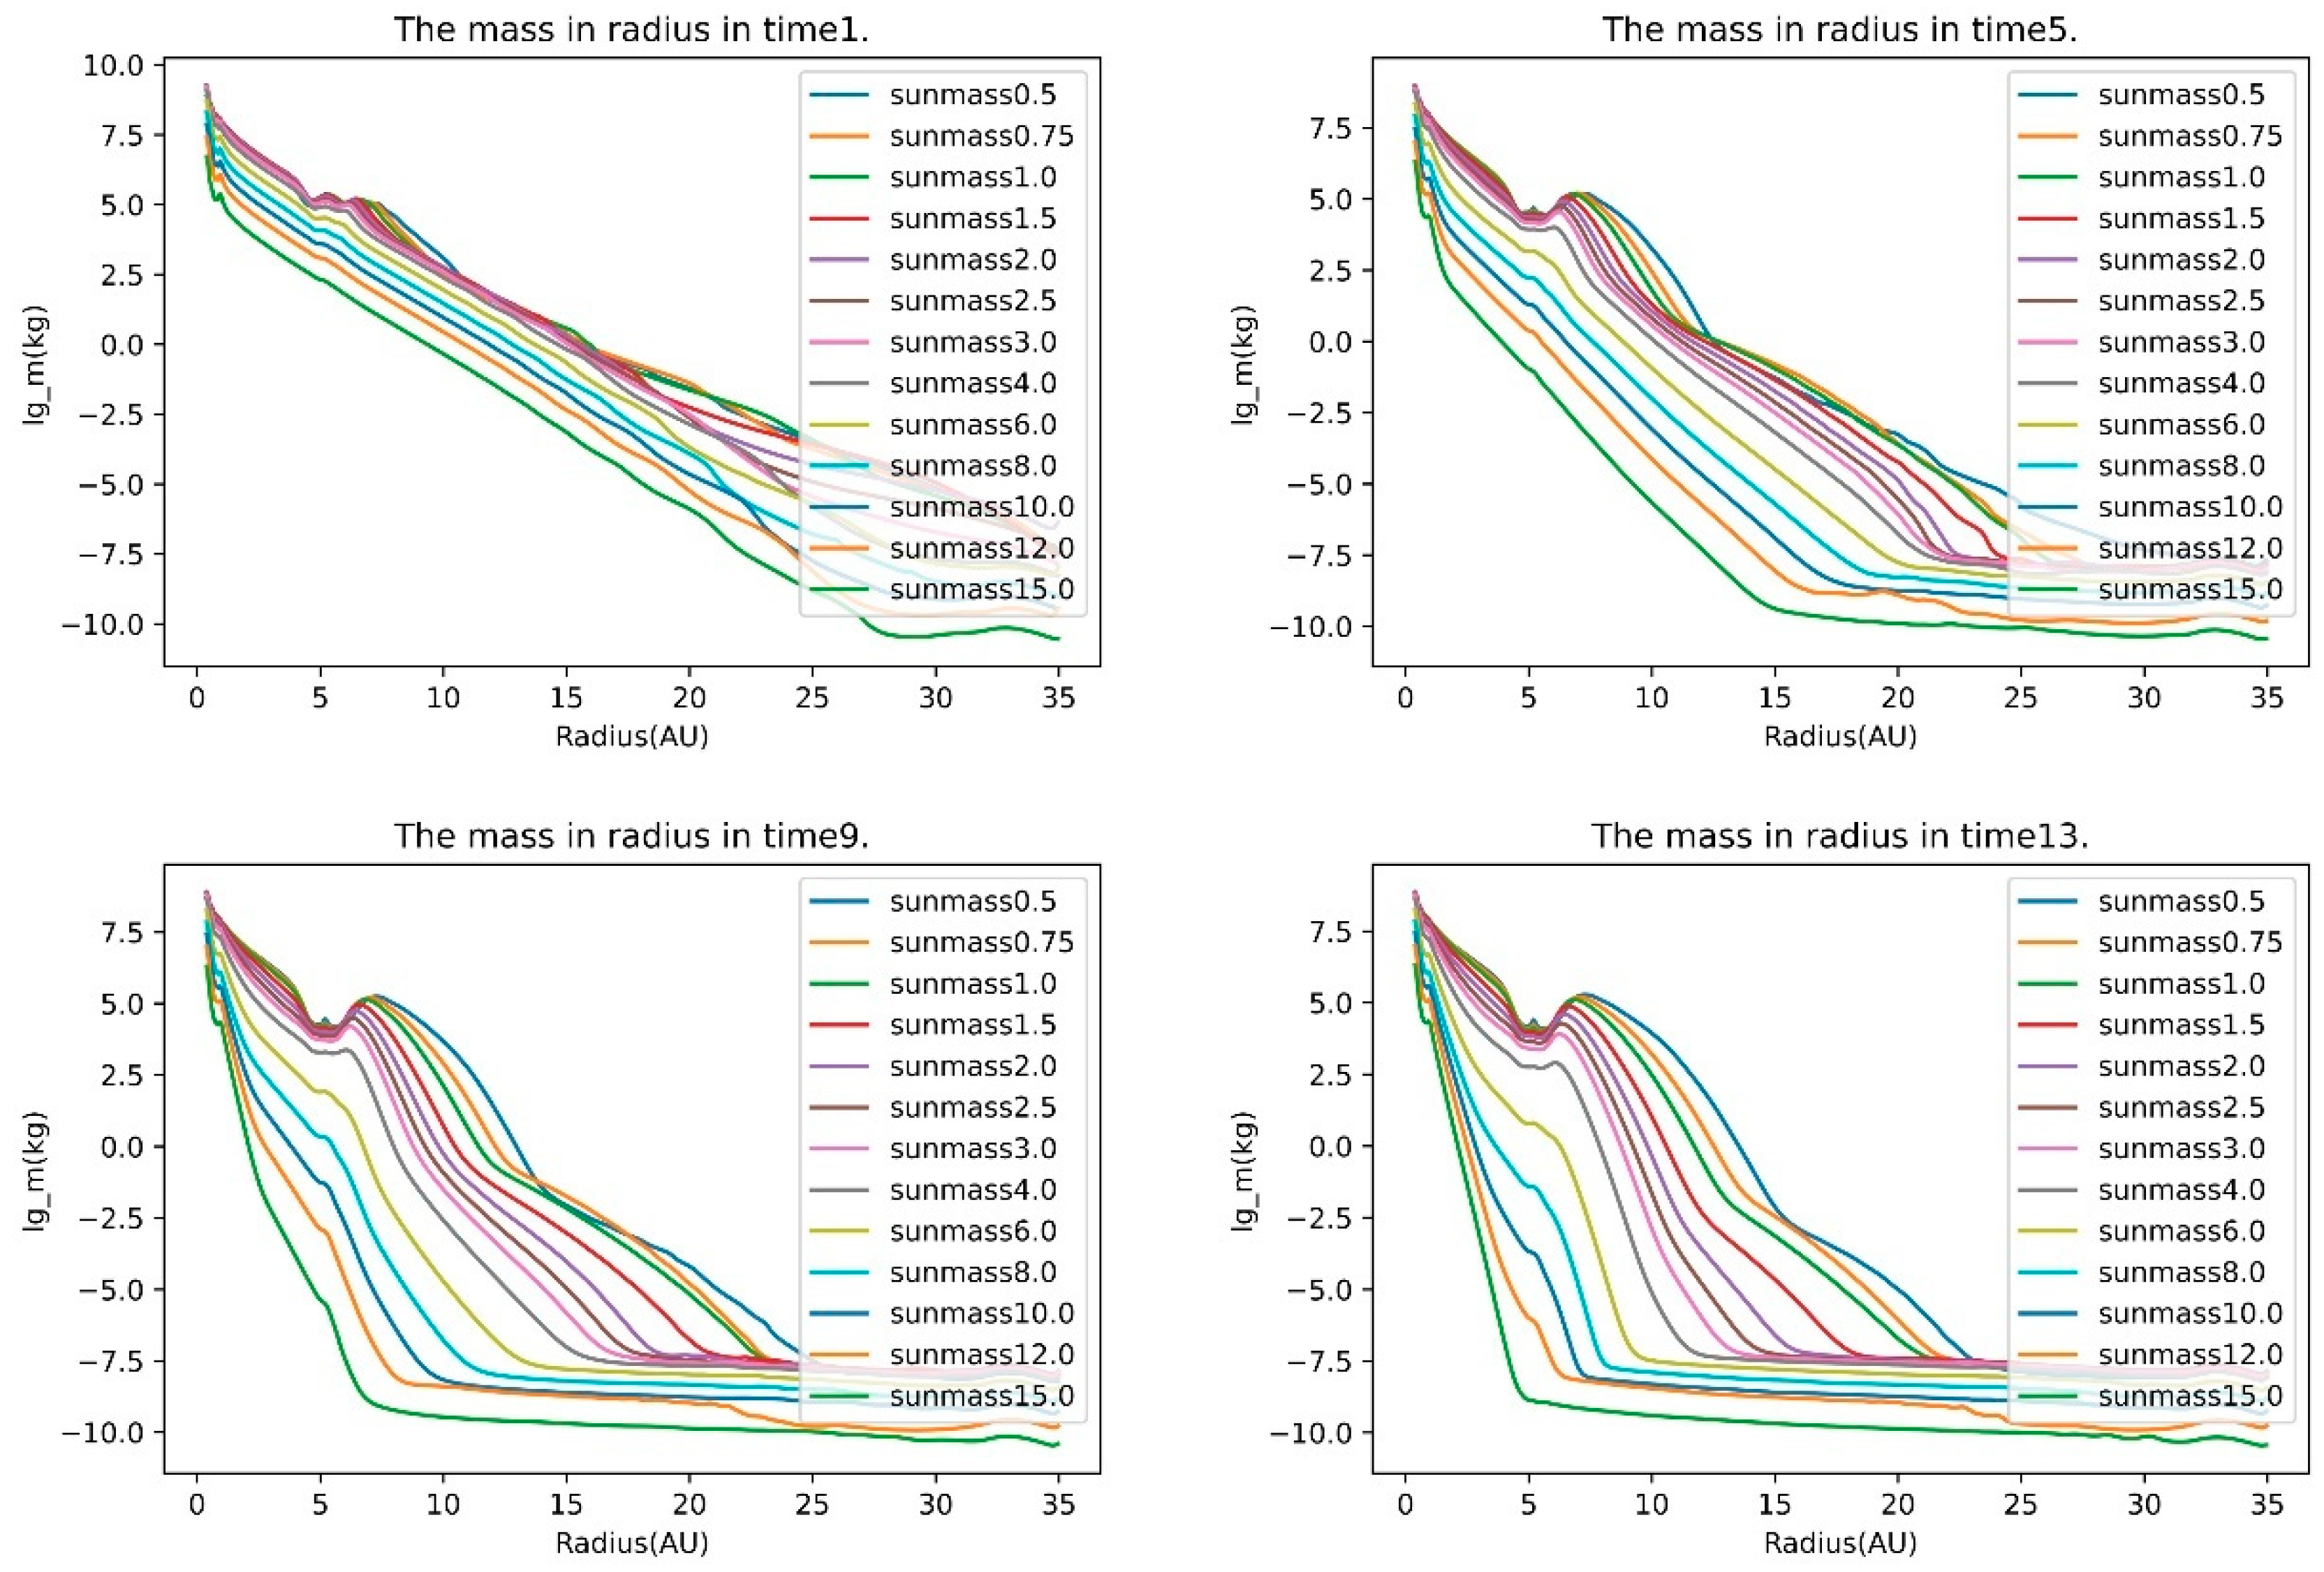
First, we map the evolution of protoplanetary disks with different host masses at the same time. From the
Figure 2, we can see that protoplanetary disks of different host masses are affected by the test particles placed in them. Moreover, it can be seen in the end that under the influence of the test particle, the protoplanetary disk will have the phenomenon of orbital clearing and grooving. And the reason is Type II migration corresponds to the case where the planet is so massive that it opens a clear groove in the disk; the migration then depends on the viscous evolution of the disk [
21,
22]. It will form a groove structure, and this structure is what we’re interested in. In addition, it can be seen that as the mass of the host star increases, the formation of the “groove structure” becomes more and more difficult and less clear. Especially when the host star has
, the shape of the gap becomes blurred from obvious. It is what we expected it steps into Type I migration when the planet is not massive enough to significantly alter the local density of the disk; the planet migrates inward with a speed proportional to its mass. This type of migration is more efficient and tends to move planets towards the star and which do not open a clear gap, but only form a dip around their orbits in the gas surface density profile [
23,
24]. Both surface density expressions have the same result that a gap is formed under the action of the test particles,
and
, as shown in
Figure 3.
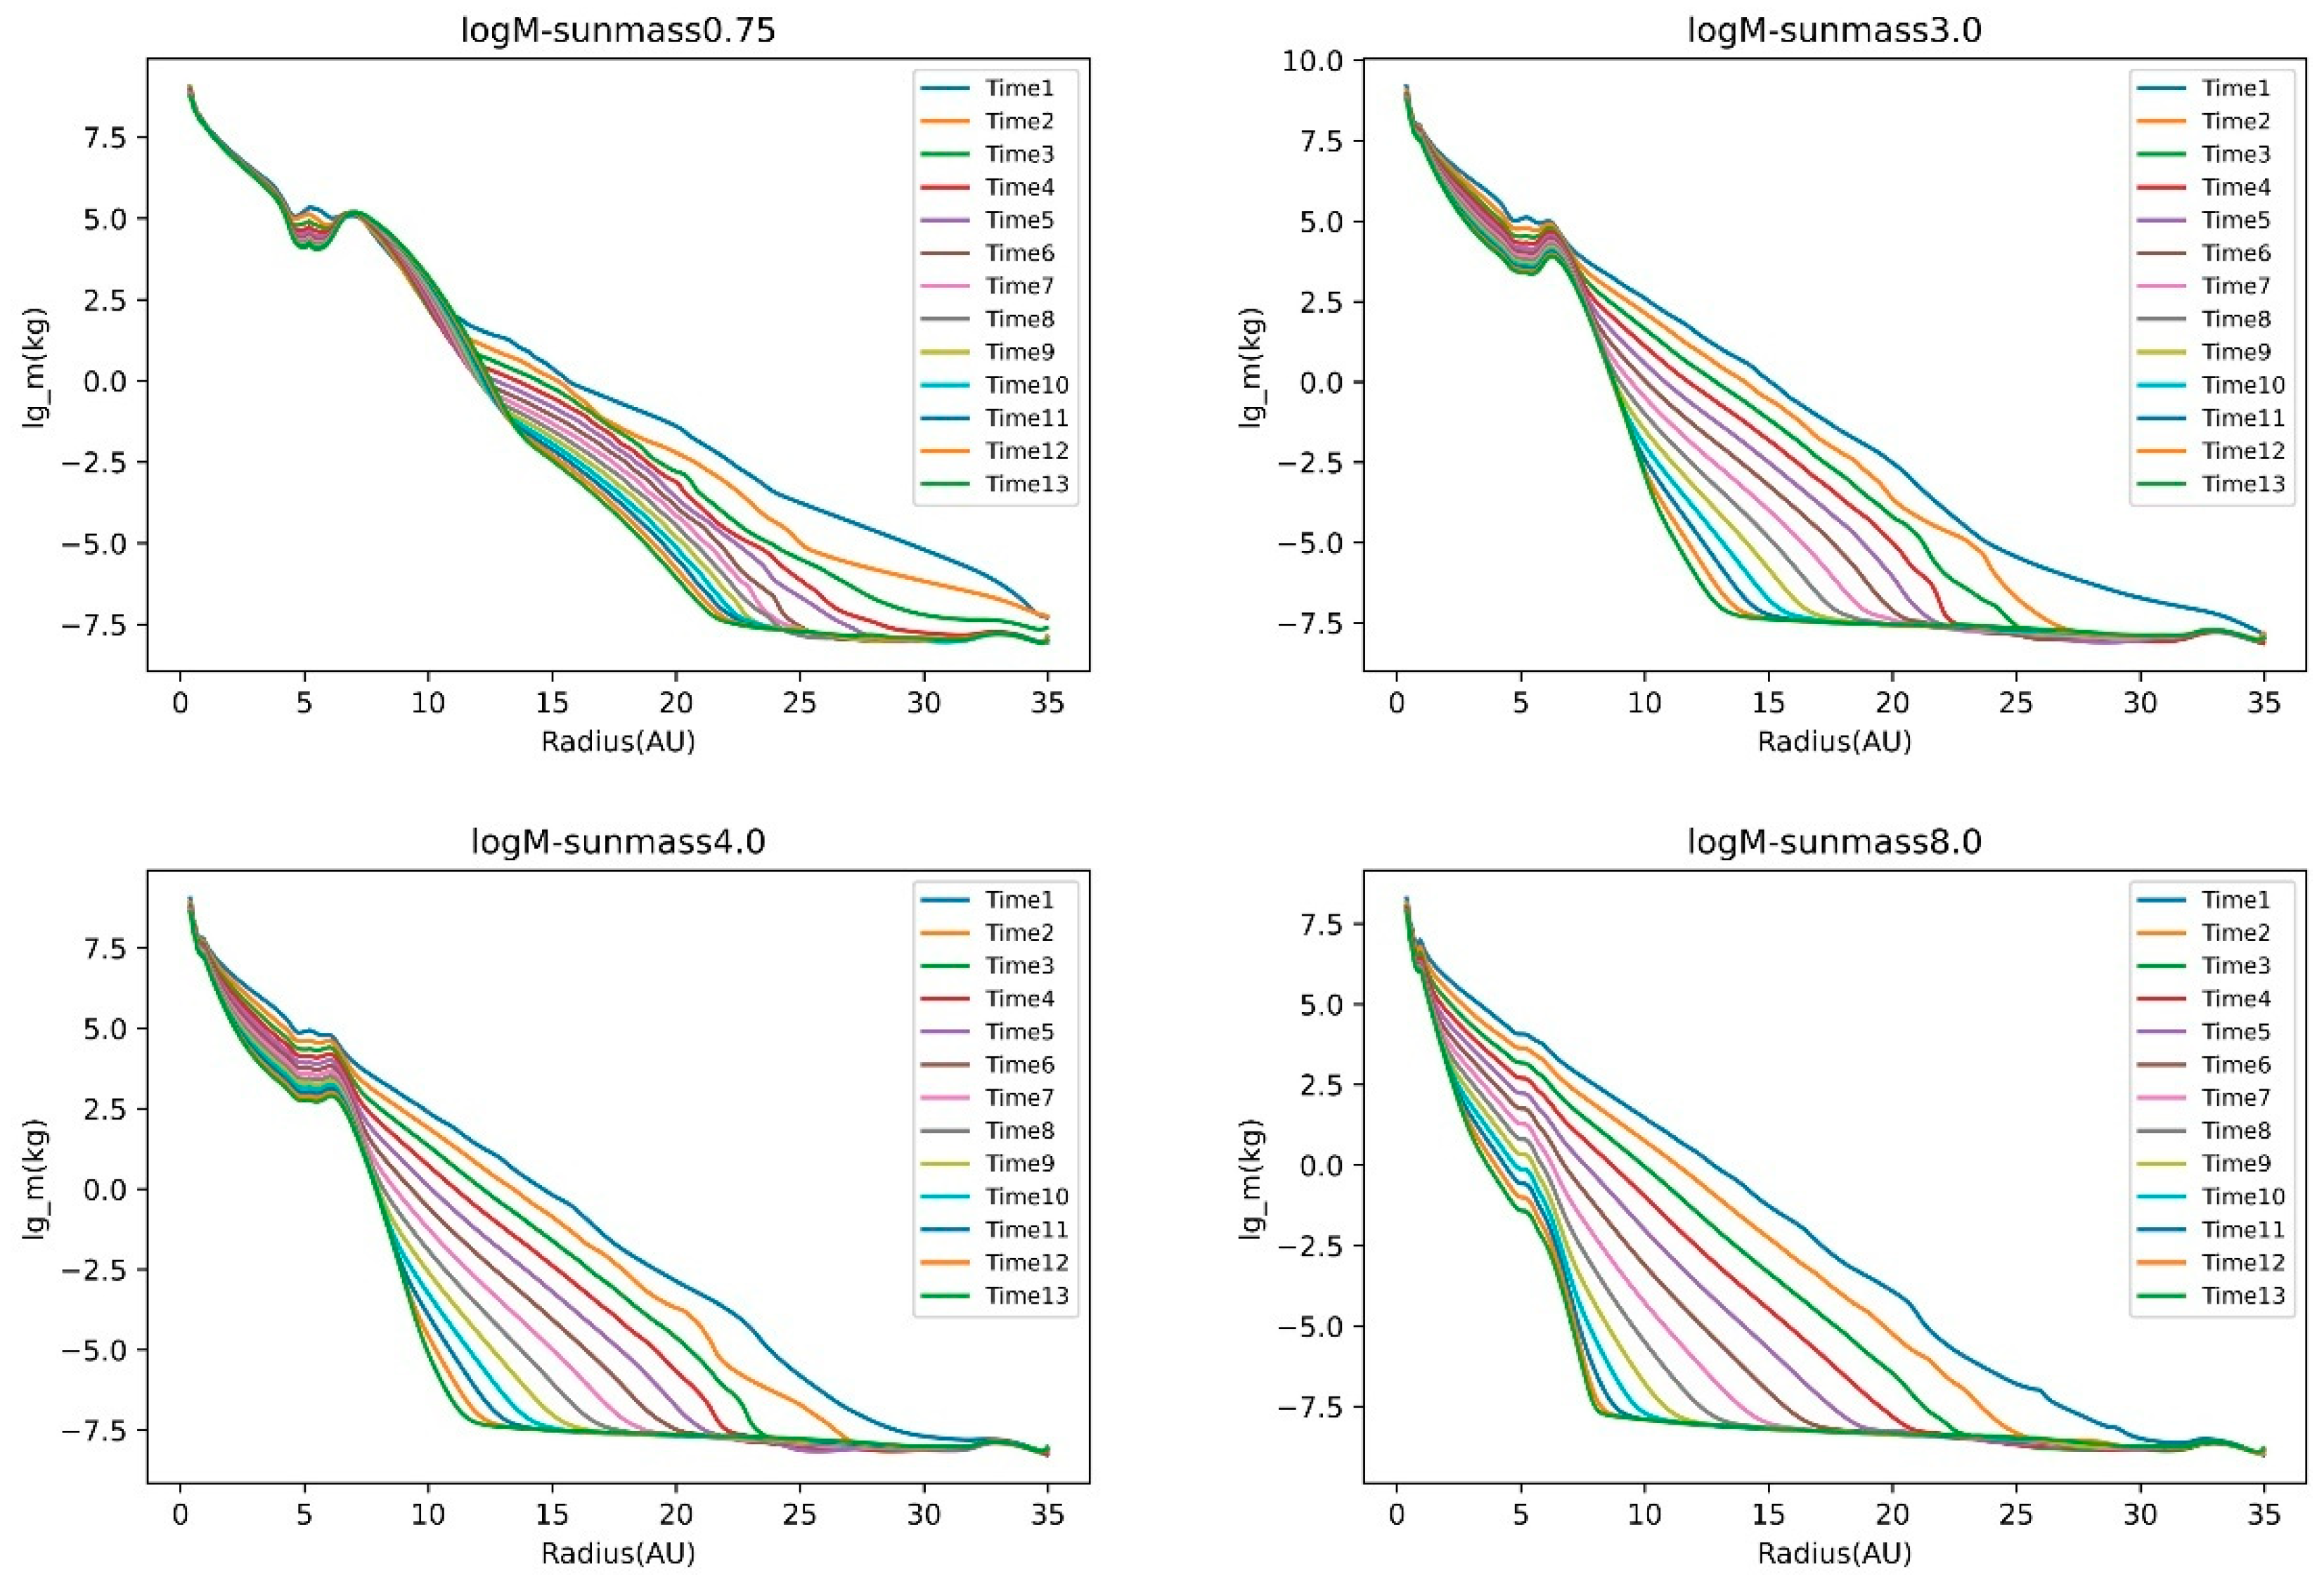
Second, we also map the evolution of protoplanetary disks at different times of the same host star mass. As shown in
Figure 3, during the evolution of the disk of a low-mass star, there are obvious gap formed. As the mass increases, the gap structure becomes more and more blurred. When the mass of the host star is greater than
, no gap forms from the beginning of the simulation to the end of the simulation.
Figure 4.
Simulation results in mass 0.75, 3, 4, 8. ().
Figure 4.
Simulation results in mass 0.75, 3, 4, 8. ().
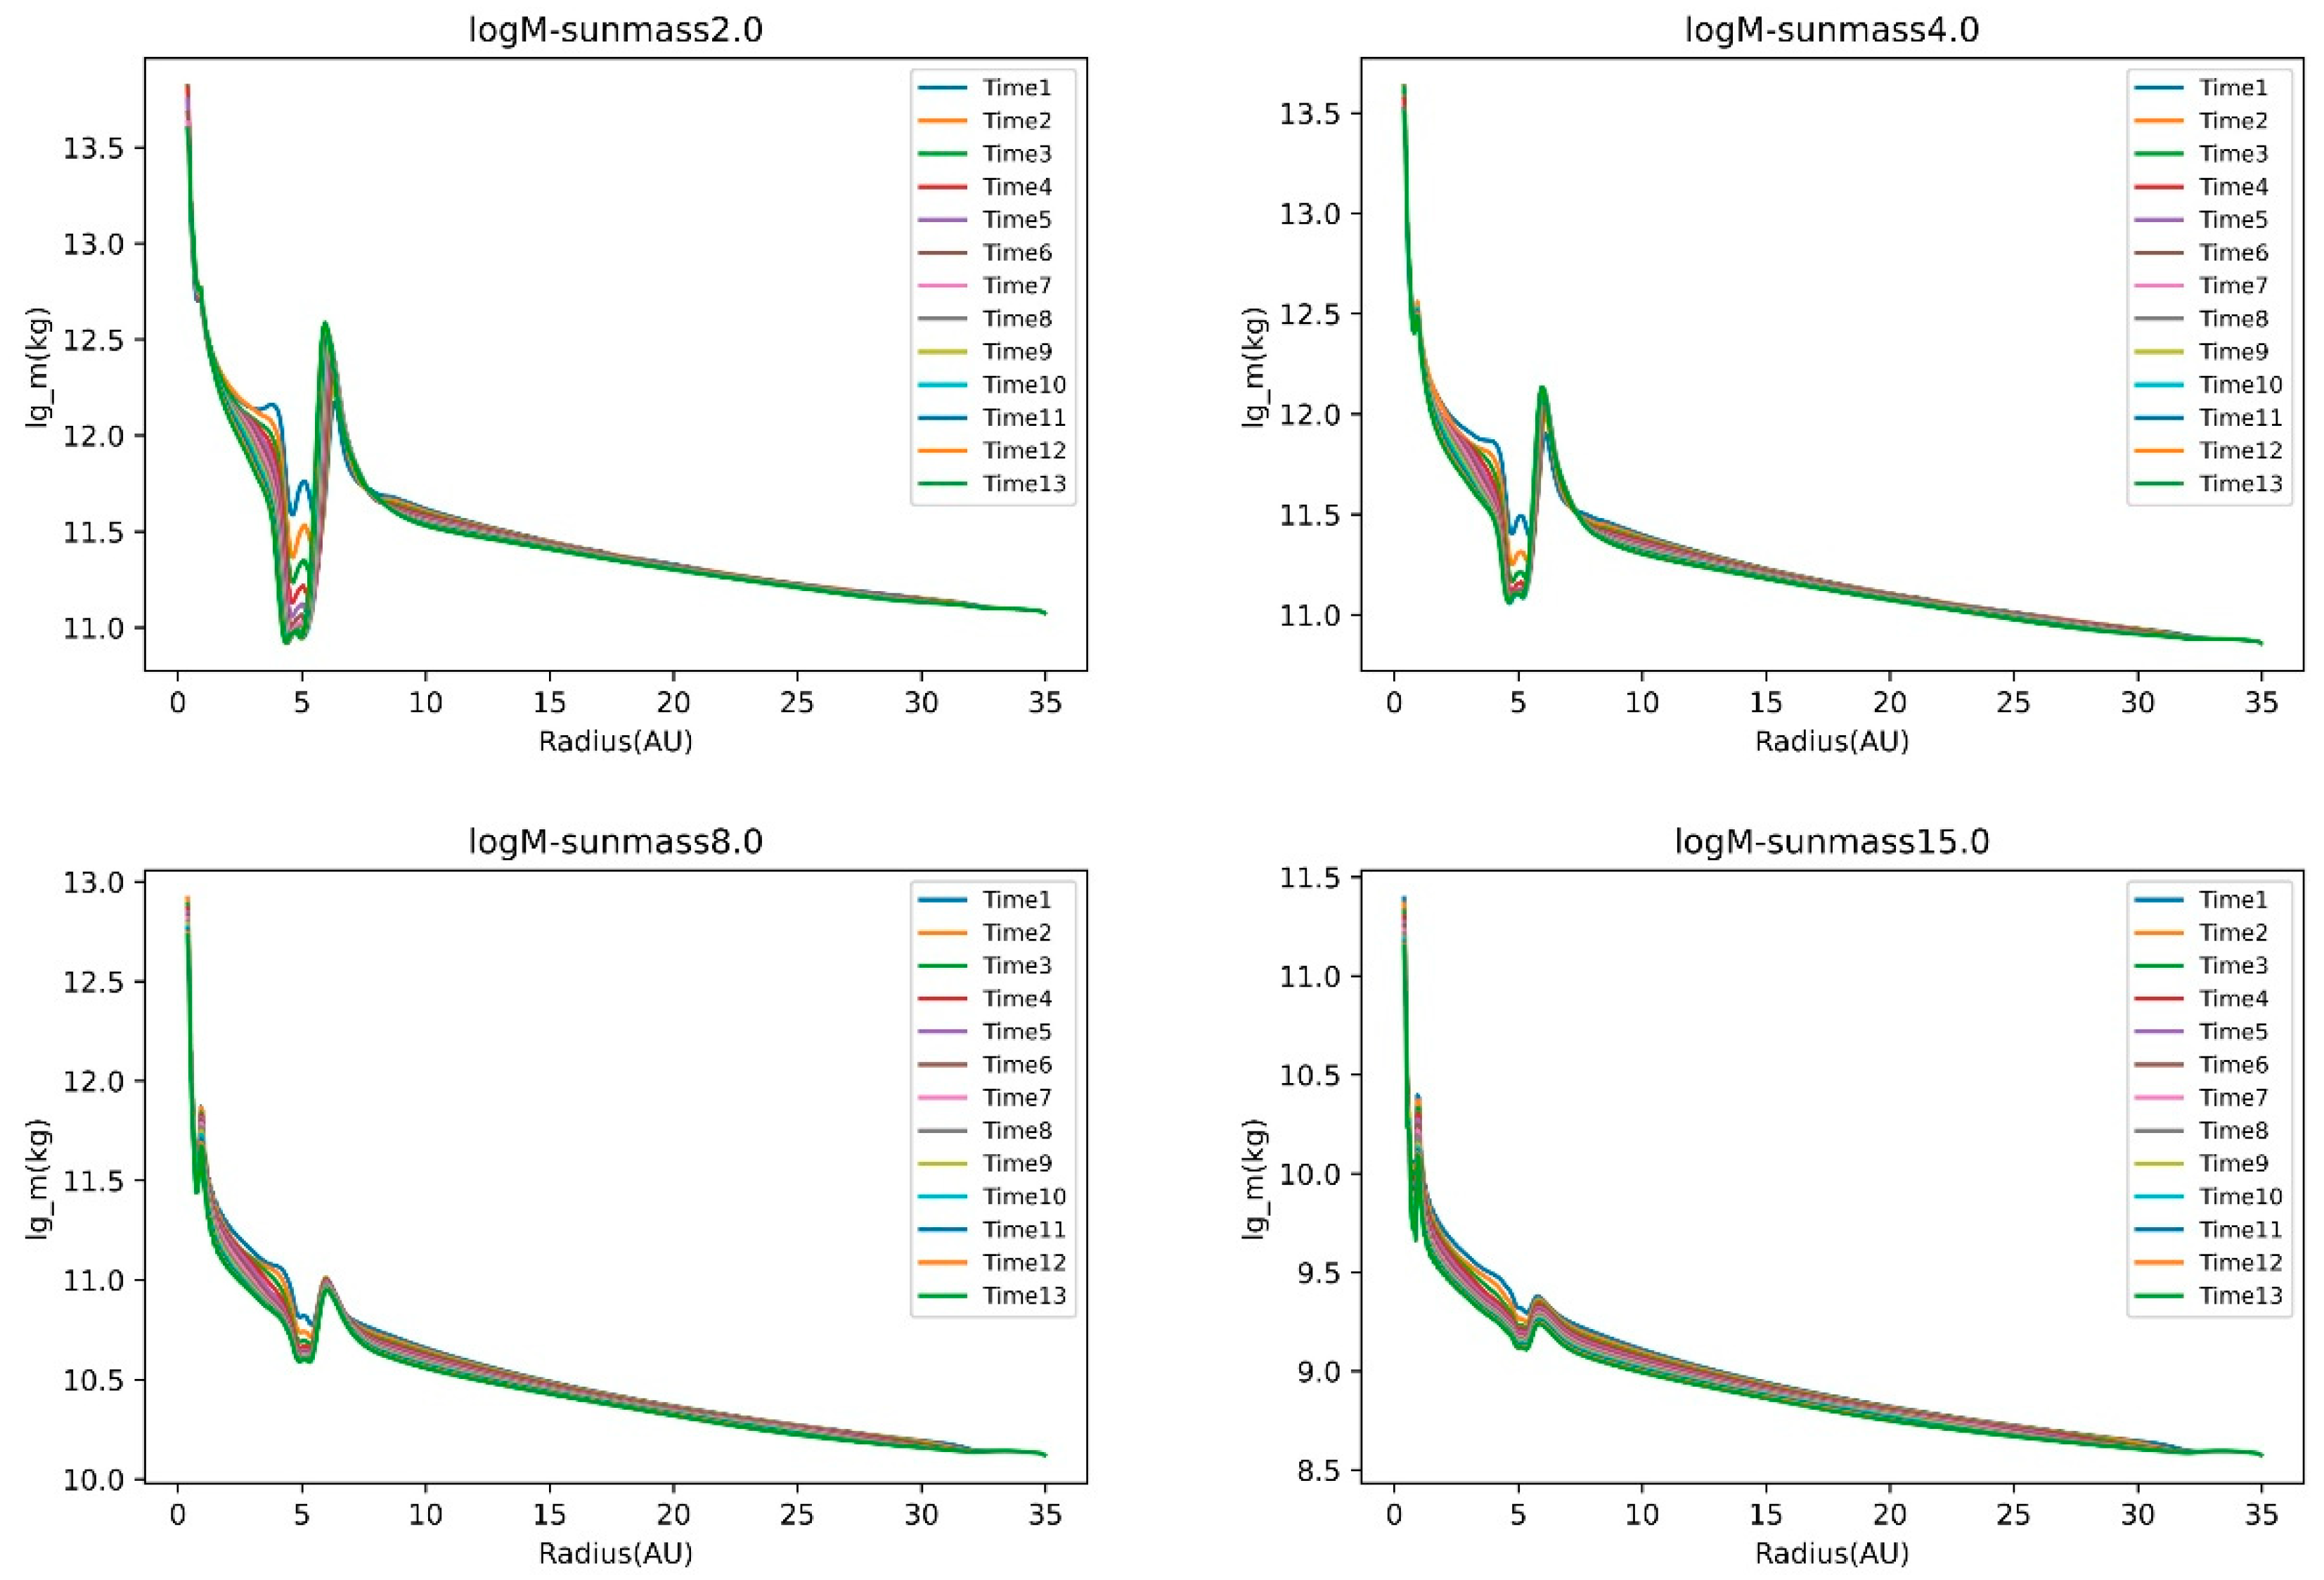
Figure 5.
Simulation results in mass 2, 4, 8, 15. ().
Figure 5.
Simulation results in mass 2, 4, 8, 15. ().
Gapping is an inevitable result of testing the influence of particles on the planetary disk, that is, orbital clearing. If there is planet formation in the planetary disk, then gaps must form in the planetary disk during the interaction. However, the formation of gaps is not necessarily due to planetary orbital clearing. But our simulations show that the protoplanetary disk of less than four solar mass will form a gap structure, and we think that the protoplanetary disk of less than
has the ability to form planets. In the process of simulated evolution, the disk of massive star, for example,
, does not have an obvious gap formation, so we think that it has no planetary ability, or the ability to form a planet is very weak. And the same results were found in both surface density distributions. Although, Ribas et. al has found robust statistical evidence of disk evolution dependence with stellar mass, and combined with previous studies on disk evolution, confirm that protoplanetary disks evolve faster and/or earlier around high-mass (>2 M) stars[
18]. We have also found that the planetary disks of massive stars evolve rapidly, however, for disks of massive stars in our step-size range, our simulations have not shown the presence of gap structures. This is consistent with the result of Ribas et al[
18].
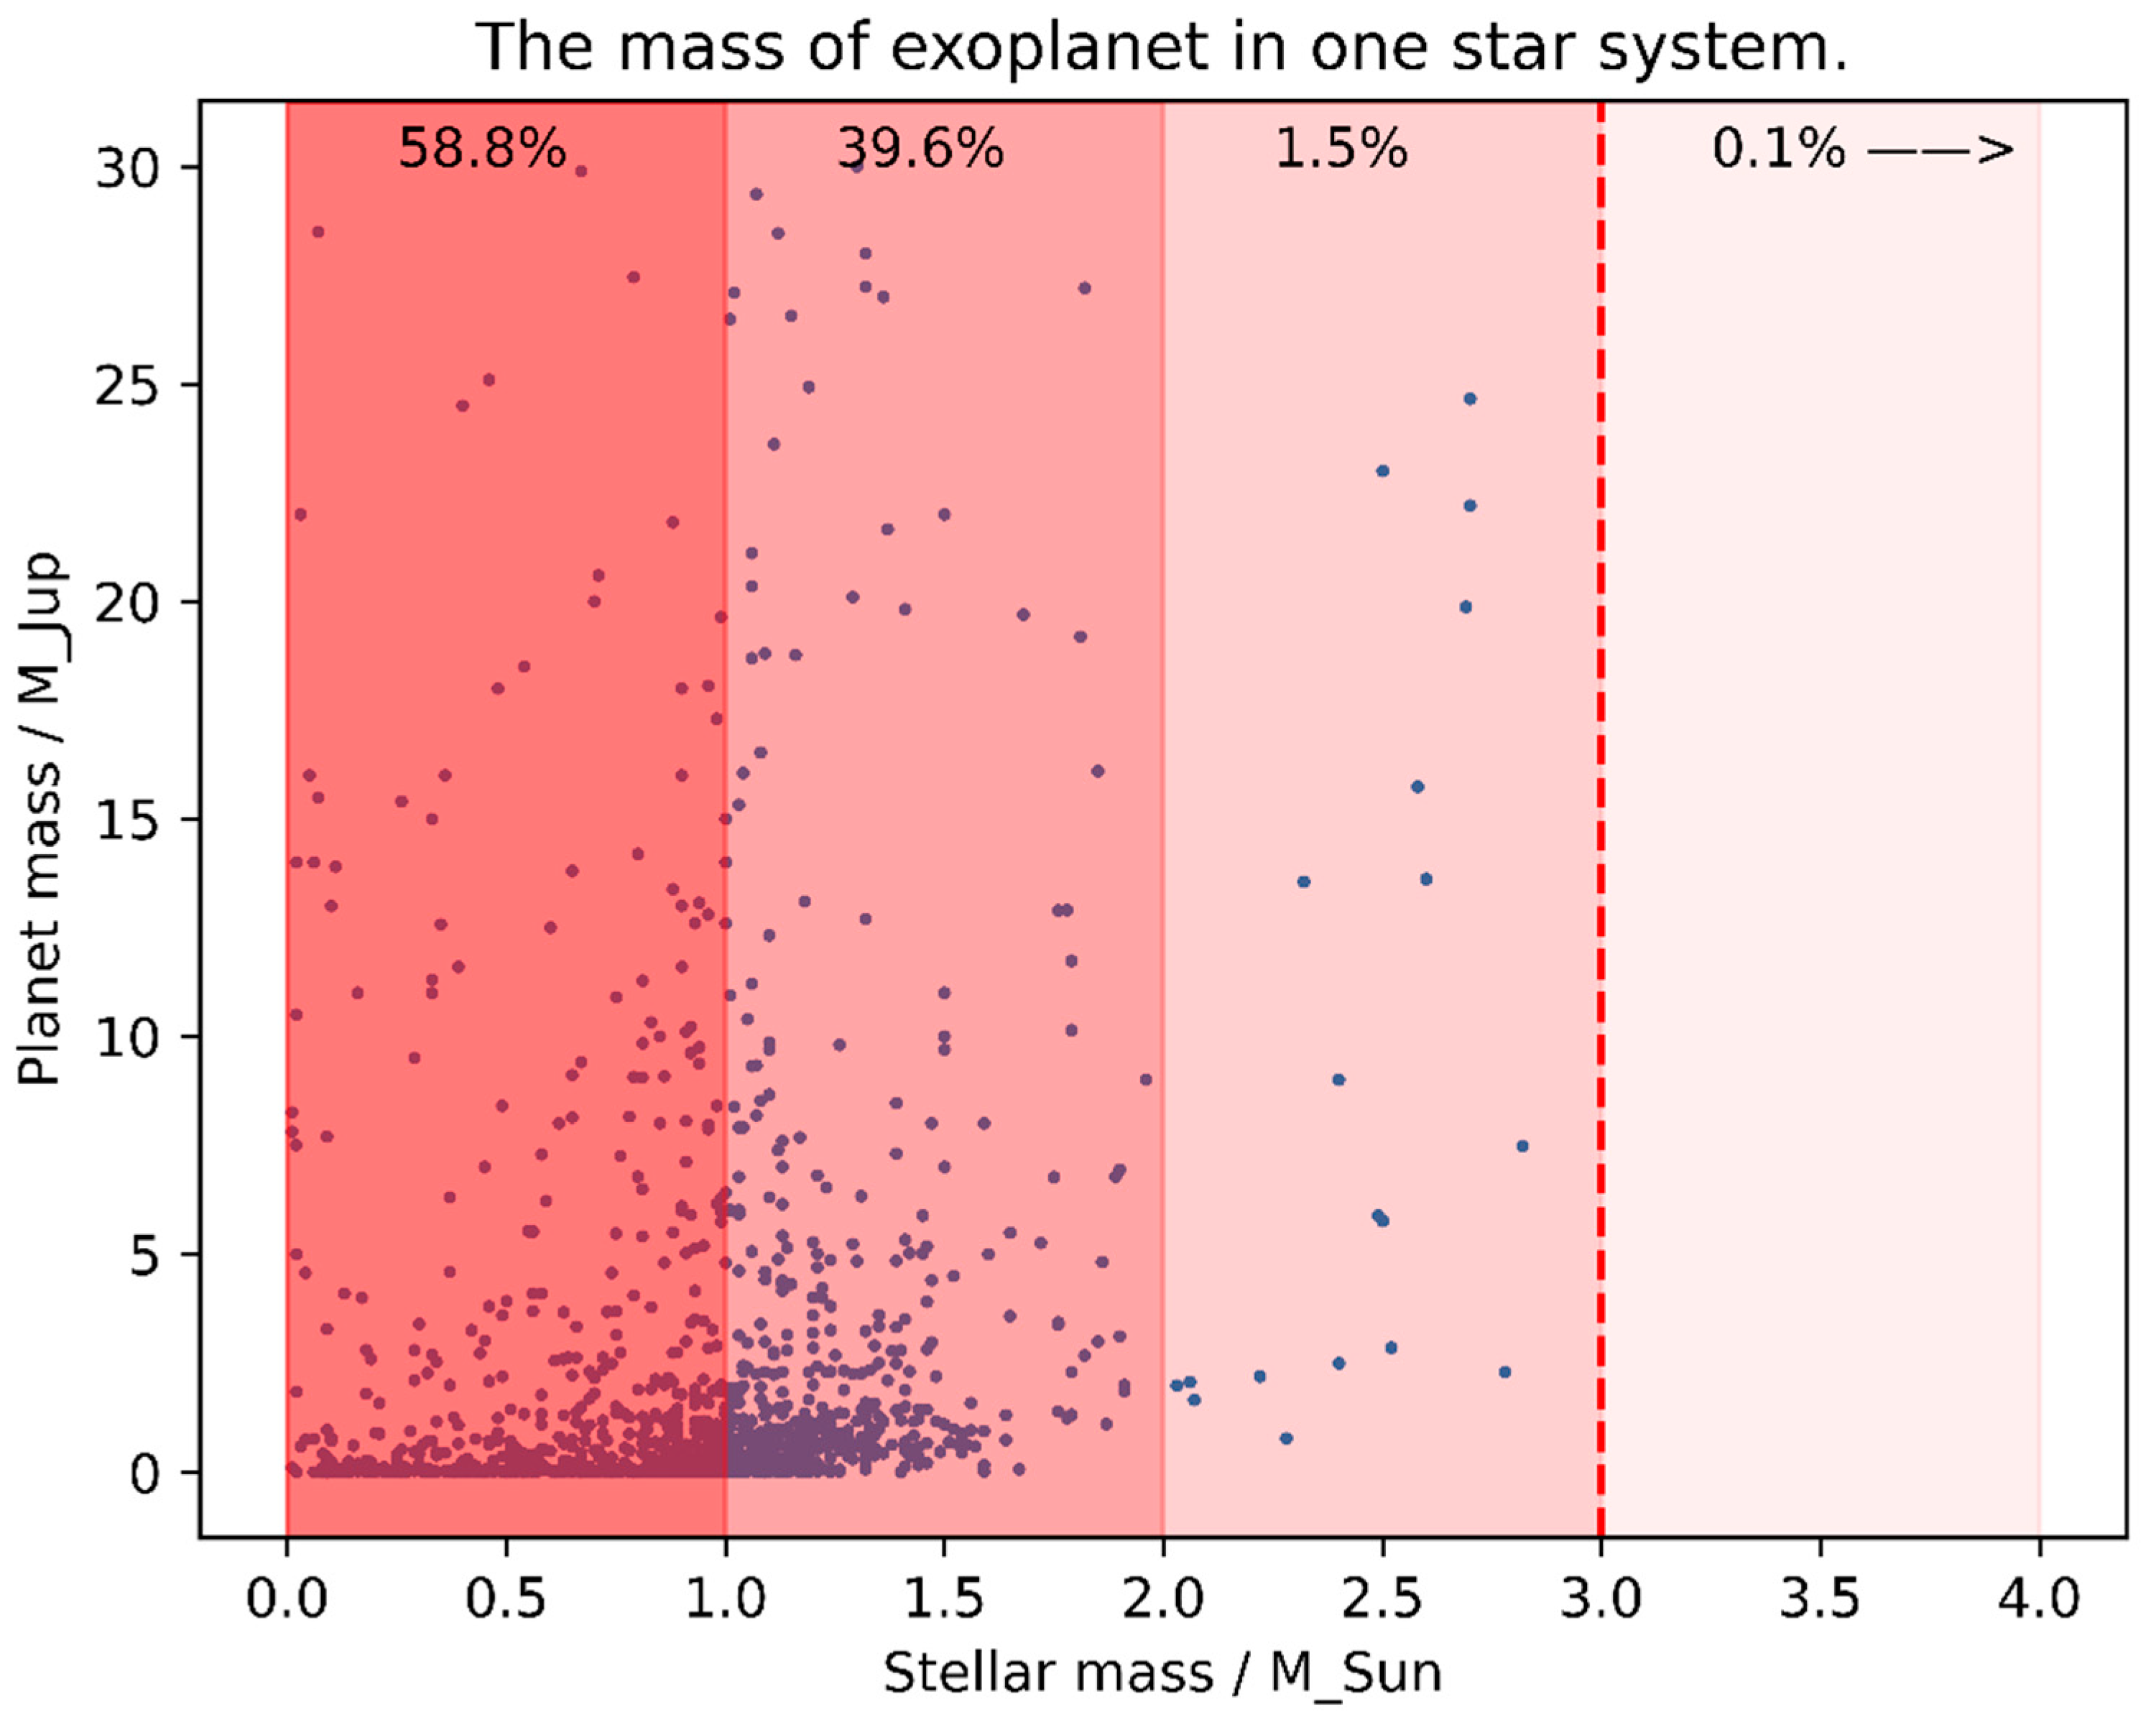
Using the exoplanet data, we counted all the single-star exoplanets in the NASA exoplanet archive. We then count them, according to their host star’s mass, as shown in
Table 3. As mentioned earlier, our data comes from
NASA Exoplanet Archive 2023.5.1[
1]. It should be noted that the number of single exoplanets is far more than the table, and the data in the
Table 3 are data with the mass of the host star and the mass of the planet.
As can be seen from the data in
Table 3, most of the exoplanets have host stars with masse
, and the number of exoplanets decreases significantly as the mass of the host stars increases.
We draw the star mass and planet mass of the exoplanet in the above table in
Figure 6, and fill the color in it. According to our previous simulation results, the darker the red, the easier it is to form an exoplanet. In addition, it can be seen from the exoplanet data that
58.8% of the planets have a stellar mass of .
39.6% of the planets have a stellar mass of .
1.5% of the planets have a stellar mass of .
Nearly 0.1% of the planets have a stellar mass of more than .
Figure 6.
Exoplanets in single-star system.
Figure 6.
Exoplanets in single-star system.
For the observation of exoplanets, there are mainly radial velocity method and transit method, and other observation methods, such as microlensing, eclipse timing variation and so on. Most of these exoplanets were discovered using the first two methods, the radial velocity method and the transit method. However, we processed the data from the NASA Exoplanet Archive without any specific restrictions or filters on the means of observation methods. So, we don’t think we have a particular limit or filter on observations, even though not enough exoplanets have been detected by methods other than radial velocity and transit methods.
So with this result, we conclude that the phenomenon that most exoplanets have host stars with masses less than 3 solar masses is not due to the influence of our observation methods, but due to the evolution of the protoplanetary disk, which is an intrinsic property determined by the mass of the protoplanetary disk host star. And this result is also confirmed in our simulation, our results have shown that for the planetary disk less than 3 to 4 solar masses, under the influence of the test particles, there is a significant gap structure formation, which is similar to the planet’s orbital clearing. In addition, through our simulation, it can also be seen that with the increase of the mass of its host star, the disk is not easy to form a gap structure, that is, the ability to form a gap structure gradually weakened until
, the loss of the ability to form a gap. And such a clear limit appears in
in our simulation, and the same limit also appears in
in the NASA Exoplanet Archive data, and the two phenomena are consistent. Secondly, in our simulation, the more massive the planetary disk of the host star, the more difficult it is to form a gap structure and the more difficult it is to form a planet. In the NASA Exoplanet Archive, the more massive the host star, the fewer exoplanets there are. Again, the clear boundary between the two appears at
. The two are also consistent (see
Figure 6).
Conclusion and discussion
In this study, we developed a foundational model of protoplanetary disk evolution, establishing that a significant portion of the model’s parameters is contingent on the host star’s mass. Utilizing FARGO3D for simulation, we explored the protoplanetary disk’s evolution across varying star masses. Introducing test particles to the disk elucidated certain characteristics: notably, disks with smaller masses are predisposed to forming gap structures, hence enhancing planet formation prospects. Contrastingly, as mass increases, this propensity diminishes, with a discernible threshold at .
In practical terms, when a planetary disk undergoes perturbations, host stars with lesser mass tend to efficiently clear their orbits, bolstering planet formation potential. Conversely, larger masses inhibit such outcomes.
Examining exoplanet data reveals a concentration of single exoplanets around host stars with mass , diminishing as mass amplifies. Our simulation outcomes resonate with these observations. Though transit and radial velocity methods dominate NASA’s Exoplanet Archive in terms of discovery techniques, our simulations, unrestricted by observational means, suggest that these patterns may fundamentally emanate from the inherent properties of the protoplanetary disks.
Interestingly, a review of the NASA Exoplanet Archive discloses diverse host star configurations: from singular to binary and even ternary systems. Statistically, these multi-star systems exhibit patterns reminiscent of their singular counterparts – majority of the exoplanets are associated with smaller host stars. The tables below detail these observations (
Table 4 and
Table 5):
While our simulations can be extended to encompass binary or ternary star systems, several critical parameters like the disk’s structural parameters or flare-index remain unaddressed. Limitations in FARGO3D also prevented us from accounting for factors like stellar spectrum, evolution, and age. Acknowledging that protoplanetary disk evolution is in the nascent phase of star development, external influences like stellar absorption or radiation significantly alter the disk’s composition. Clearly, disk evolution surpasses mere fluid simulations, demanding a more nuanced understanding of intricate internal dynamics.
The transition from protoplanetary disks to full-fledged planetary systems is intricate, encapsulating myriad mechanisms. Delving deeper into these mechanisms, exploring planetary distribution, classifications, and understanding the intrinsic factors, such as mass or angular momentum of the primordial nebula, that drive planet formation, warrant thorough investigation. Our endeavor here serves as a stepping stone, probing the intricate relationship between protoplanetary disk evolution and planetary genesis.
References
- NASA Exoplanet Archive. Available online: https://exoplanetarchive.ipac.caltech.edu/.
- Alibert, Y.; Carron, F.; Fortier, A.; Pfyffer, S.; Benz, W.; Mordasini, C.; Swoboda, D. Theoretical models of planetary system formation: mass vs. semi-major axis. Astron. Astrophys. 2013, 558, A109. [Google Scholar] [CrossRef]
- Mundy, L.G.; Looney, L.W.; Erickson, W.; Grossman, A.; Welch, W.J.; Forster, J.R.; Wright, M.C.H.; Plambeck, R.L.; Lugten, J.; Thornton, D.D. Imaging the HL Tauri Disk at λ = 2.7 Millimeters with the BIMA Array. The Astrophysical Journal 1996, 464, L169. [Google Scholar] [CrossRef]
- McCaughrean, M.J.; O'Dell, C.R. Direct Imaging of Circumstellar Disks in the Orion Nebula. Astron. J. 1996, 111, 1977. [Google Scholar] [CrossRef]
- Hughes, A.M.; Wilner, D.J.; Qi, C.; Hogerheijde, M.R. Gas and Dust Emission at the Outer Edge of Protoplanetary Disks. Astrophys. J. 2008, 678, 1119–1126. [Google Scholar] [CrossRef]
- Andrews, S.M.; Wilner, D.J.; Hughes, A.M.; Qi, C.; Dullemond, C.P. PROTOPLANETARY DISK STRUCTURES IN OPHIUCHUS. Astrophys. J. 2009, 700, 1502–1523. [Google Scholar] [CrossRef]
- Andrews, S.M.; Wilner, D.J.; Hughes, A.M.; Qi, C.; Dullemond, C.P. Protoplanetary disk structures in ophiuchus. ii. extension to fainter sources. The Astrophysical Journal 2010, 723, 1241. [Google Scholar] [CrossRef]
- Isella, A.; Carpenter, J.M.; Sargent, A.I. STRUCTURE AND EVOLUTION OF PRE-MAIN-SEQUENCE CIRCUMSTELLAR DISKS. Astrophys. J. 2009, 701, 260–282. [Google Scholar] [CrossRef]
- Hayashi, C. Structure of the Solar Nebula, Growth and Decay of Magnetic Fields and Effects of Magnetic and Turbulent Viscosities on the Nebula. Prog. Theor. Phys. Suppl. 1981, 70, 35–53. [Google Scholar] [CrossRef]
- Ida, S.; Lin, D.N.C. Toward a Deterministic Model of Planetary Formation. I. A Desert in the Mass and Semimajor Axis Distributions of Extrasolar Planets. Astrophys. J. 2004, 604, 388–413. [Google Scholar] [CrossRef]
- Ida, S.; Lin, D.N.C. Toward a Deterministic Model of Planetary Formation. II. The Formation and Retention of Gas Giant Planets around Stars with a Range of Metallicities. Astrophys. J. 2004, 616, 567–572. [Google Scholar] [CrossRef]
- S. Ida and D. N. C. Lin, Toward a Deterministic Model of Planetary Formation. III. Mass Distribution of Short-Period Planets around Stars of Various Masses. The Astrophysical Journal 2005, 626, 1045. [Google Scholar] [CrossRef]
- Ida, S.; Lin, D.N.C. Toward a Deterministic Model of Planetary Formation. IV. Effects of Type I Migration. Astrophys. J. 2008, 673, 487–501. [Google Scholar] [CrossRef]
- Ida, S.; Lin, D.N.C. Toward a Deterministic Model of Planetary Formation. V. Accumulation Near the Ice Line and Super-Earths. Astrophys. J. 2008, 685, 584–595. [Google Scholar] [CrossRef]
- Williams, J.P.; Cieza, L.A. Protoplanetary Disks and Their Evolution. Annu. Rev. Astron. Astrophys. 2011, 49, 67–117. [Google Scholar] [CrossRef]
- Mann, R.K.; Williams, J.P. The circumstellar disk mass distribution in the orion trapezium cluster. Astrophys. J. 2009, 694, L36–L40. [Google Scholar] [CrossRef]
- Reffert, S.; Bergmann, C.; Quirrenbach, A.; Trifonov, T.; Künstler, A. Precise Radial Velocities of Giant Stars: VII. Occurrence Rate of Giant Extrasolar Planets as a Function of Mass and Metallicity. Astronomy & Astrophysics 2015, 574, A116. [Google Scholar]
- Ribas; Bouy, H. ; Merín, B. Protoplanetary Disk Lifetimes vs. Stellar Mass and Possible Implications for Giant Planet Populations. Astronomy & Astrophysics 2015, 576, A52. [Google Scholar]
- 19. Inutsuka, S.; Tamura, M.; Aikawa, Y.; Muto, T.; Tomida, K. Planet-Disk Interactions and Orbital Evolution. Protostars and Planets 2023, VII 9, 685. [Google Scholar]
- Kanagawa, K.D.; Tanaka, H.; Muto, T.; Tanigawa, T.; Takeuchi, T. Formation of a disc gap induced by a planet: effect of the deviation from Keplerian disc rotation. Mon. Not. R. Astron. Soc. 2015, 448, 994–1006. [Google Scholar] [CrossRef]
- Lin, D.N.C.; Papaloizou, J. On the tidal interaction between protoplanets and the primordial solar nebula. II - Self-consistent nonlinear interaction. Astrophys. J. 1986, 307, 395–409. [Google Scholar] [CrossRef]
- Lin, D.N.C.; Papaloizou, J. On the tidal interaction between protoplanets and the protoplanetary disk. III - Orbital migration of protoplanets. Astrophys. J. 1986, 309, 846–857. [Google Scholar] [CrossRef]
- Masset, F.S.; Papaloizou, J.C.B. Runaway Migration and the Formation of Hot Jupiters. Astrophys. J. 2003, 588, 494–508. [Google Scholar] [CrossRef]
- Ward, W.R. Protoplanet Migration by Nebula Tides. Icarus 1997, 126, 261–281. [Google Scholar] [CrossRef]
|
Disclaimer/Publisher’s Note: The statements, opinions and data contained in all publications are solely those of the individual author(s) and contributor(s) and not of MDPI and/or the editor(s). MDPI and/or the editor(s) disclaim responsibility for any injury to people or property resulting from any ideas, methods, instructions or products referred to in the content. |
© 2024 by the authors. Licensee MDPI, Basel, Switzerland. This article is an open access article distributed under the terms and conditions of the Creative Commons Attribution (CC BY) license (http://creativecommons.org/licenses/by/4.0/).
