1. Introduction
As heightened awareness towards climate change permeates society, the imperative to address the reduction of greenhouse gas (GHG) emissions from both transportation processes and industrial activities becomes increasingly pronounced [
1]. Natural gas (NG), distinguished by its lower carbon content relative to petroleum fuels like diesel and gasoline, has been in use for an extended period [
2]. Conventional NG and shale gas collectively contribute 1.12% and 1.19% to total GHG emissions, respectively. The substitution of diesel with NG yields a consequential 4–5% reduction in GHG emissions over a centennial span [
3]. Recognized for its clean combustion attributes, NG emerges as a promising alternative fuel to diesel, manifesting in its utilization either as Compressed Natural Gas (CNG) or in the liquid state as Liquefied Natural Gas (LNG). The former finds applicability in light vehicles, while the latter suits heavy-duty vehicles [
4]. Comprising predominantly methane (83–99.7%), along with ethane, propane, butane, and nitrogen [
5], LNG stands as a cryogenic liquid characterized by its low-temperature storage at -162 °C. The evaporation of LNG, giving rise to boil-off gas (BOG) and subsequent pressure elevation, necessitates strategic heat management [
9]. LNG carriers adopt measures such as BOG release to the atmosphere, re-liquefaction, or utilization in their engines to maintain optimal LNG conditions [
10,
11]. The return of BOG from vehicles to the station poses an additional challenge, triggering sudden pressure spikes in LNG storage tanks, activating pressure relief valves [
12]. Powars [
13], in a rudimentary estimation, reported an average methane venting rate of about 1 vol% per delivery of unsaturated LNG to stations from LNG refueling stations. Despite the critical role of BOG management technologies in curbing excessive greenhouse gas emissions and ensuring the safety of LNG refueling stations, a notable 44% of LNG refueling station designs lack BOG management, while 28% rely on liquid nitrogen condensers or liquefiers, and another 28% employ compression for CNG production [
7]. In the realm of LNG terminals and refueling stations, cryogenic submerged pumps and storage tanks assume pivotal roles as transmission and reserve devices. The optimal design of pipelines connecting submersible pumps and storage tanks emerges as a critical facet of LNG refueling stations. Inadequate insulation, heightened fluid resistance, and imprudent height differentials in these pipelines may induce submersible pump cavitation and insufficient liquid flow from storage tanks, thereby jeopardizing the fulfillment of refueling gas demands and precipitating unwarranted BOG generation.
T-type tee junctions find common application in the design of pipelines connecting submersible pumps to storage tanks. Numerous researchers have delved into the investigation of pressure drops in these tee configurations, recognizing their profound impact on gas transmission efficiency. Firstly, employing experimental methodologies, Costa et al. [
14] scrutinized the pressure drop of 90° tee junctions with both sharp and rounded corners, utilizing a Newtonian fluid as the forcing medium. Rahmeyer et al. [
15,
16] determined pressure loss coefficients for forged steel weld pipe tees and PVC pipe tees. Hirota et al. [
17] conducted a comprehensive analysis of velocity and concentration fields in a counter-flow type T-junction through the amalgamation of Particle Image Velocimetry (PIV) and Planar Laser-Induced Fluorescence (PLIF) techniques. Pérez-García et al. [
18] characterized energy losses at 90-degree T-junctions. Secondly, leveraging Computational Fluid Dynamics (CFD) methods, Beneš et al. [
19] explored laminar and turbulent flows of Newtonian and non-Newtonian fluids in tee junctions through numerical simulations. Abdulwahid et al. [
20] predicted the pressure loss in turbulent incompressible flow through a 90° tee junction, revealing increased pressure and total energy losses with escalating flow rate ratios. Merzari et al. [
21] employed Large Eddy Simulations (LES) to calculate the flow field in a T-junction. Miranda et al. [
22] investigated laminar steady and unsteady flows in a two-dimensional T-junction via CFD analysis. Finally, some researchers integrated experimental and numerical simulation approaches to explore T-type tee. Li et al. [
23] probed the drag reduction effect influenced by T-junction close-coupled pipes using both experimental and numerical methods. Chen et al. [
24] analyzed the mechanism of pressure loss under various operating conditions through a combination of experiments and numerical simulations. Bluestein et al. [
25] conducted an experimental and computational comparison of the turbulent flow field for a sharp 90-degree elbow and a plugged tee junction.
In stark contrast, academic investigations into dovetail tee, which also serve to link submerged pumps with storage tanks, are notably scarce. Consequently, this study employs CFD methods to scrutinize both T-type and dovetail tee. The investigation encompasses the presentation of pressure and velocity distributions, pipeline head losses, and hydraulic calculations between LNG storage tanks and submersible pumps. By studying pressure and velocity distributions in distinct structural configurations of the tee junctions, analyzing head losses under different inlet flow conditions, and conducting hydraulic calculations before and after the transformation between the submersible pump and pipeline, the study aims to elucidate the elevation difference effects on LNG storage tank fittings and the hidden line elevation difference between the pump and the pipeline. In the pursuit of meeting pump cavitation conditions and augmenting the liquid volume, the study endeavors to minimize the pipeline elevation difference, thereby enhancing economic and environmental viability. The impact of pipeline height difference is examined through the strategic replacement of certain pipe fittings. Under the condition of averting pump cavitation, ensuring gas transmission volume satisfaction, and controlling pipeline height difference, the study seeks to optimize economic and environmental considerations. These enhancements bear instructive significance for practical project applications.
2. CFD simulation of tee in LNG pipeline
Despite the stipulation of coefficient of local resistances for various types of tee in specifications and manuals, the resistance of diverse local pipe fittings within the pipeline undergoes significant variation under disparate working conditions. Adherence solely to the prescribed coefficient of local resistances in manuals can lead to substantial result deviations. Consequently, this study undertakes a numerical and physical exploration of the flow characteristics of LNG within tee featuring distinct structures.
2.1. Modeling and meshing
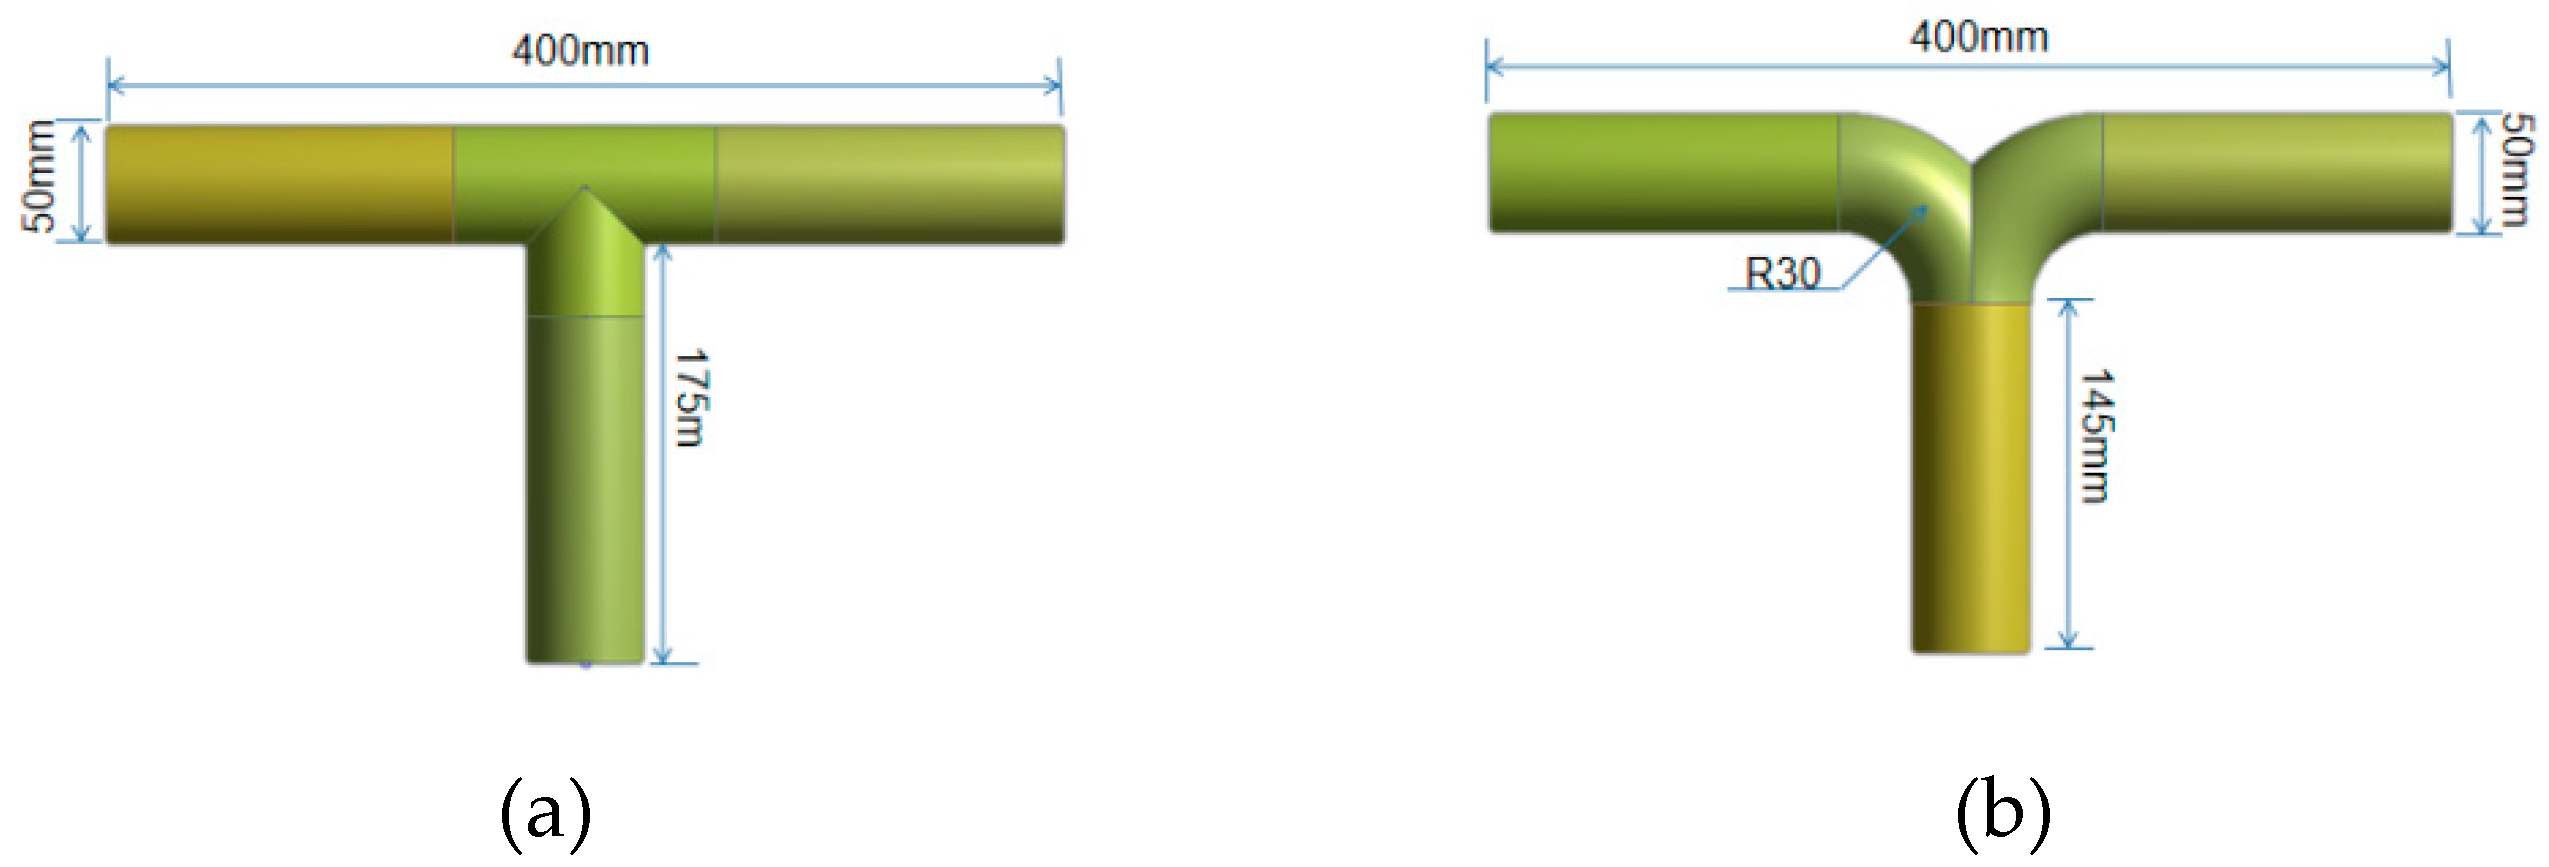
This study employs the Design Modeler within the geometry module of ANSYS Workbench to construct a 3D model, as illustrated in
Figure 1. Grid division is executed as depicted in
Figure 2. The model encompasses two distinct types of tees: T-type and dovetail tee. A hexahedral mesh, characterized by its ability to align with streamlines and reduce computational complexity, is applied to the pipe sections. In contrast, the tee utilize a tetrahedral mesh, which conforms to the pipe wall, ensuring superior adaptability.
Grid independence is rigorously examined through three iterations, employing mesh numbers of 841,760 and 805,976 for the T-type and dovetail tee, respectively.
2.2. Model setting
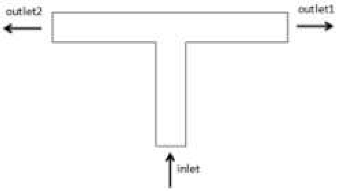
The turbulence model adopted in this study is the k-epsilon model. Two essential physical properties of LNG, namely density and dynamic viscosity, are incorporated into the material database as a new material, with values of 439 kg/s² and 9.36×10⁻⁵ Pa·s, respectively. For the boundary conditions pertaining to the two types of tees, the inlet condition is specified as a mass-flow-inlet at rates of 0.5 kg/s, 0.75 kg/s, 1 kg/s, and 1.5 kg/s. The outlet boundary condition is set as outflow. The pipe wall is designated as a no-sliding wall, with a default rough height corresponding to the stainless steel pipe wall, i.e., 0.0457 mm. The solution methodology is set to SIMPLEC. Convergence quality is monitored through standardized iterative residuals, with the residual threshold in the monitor set to 0.0001, while leaving other parameters unspecified, thereby retaining default values.
2.3. Calculation condition setting
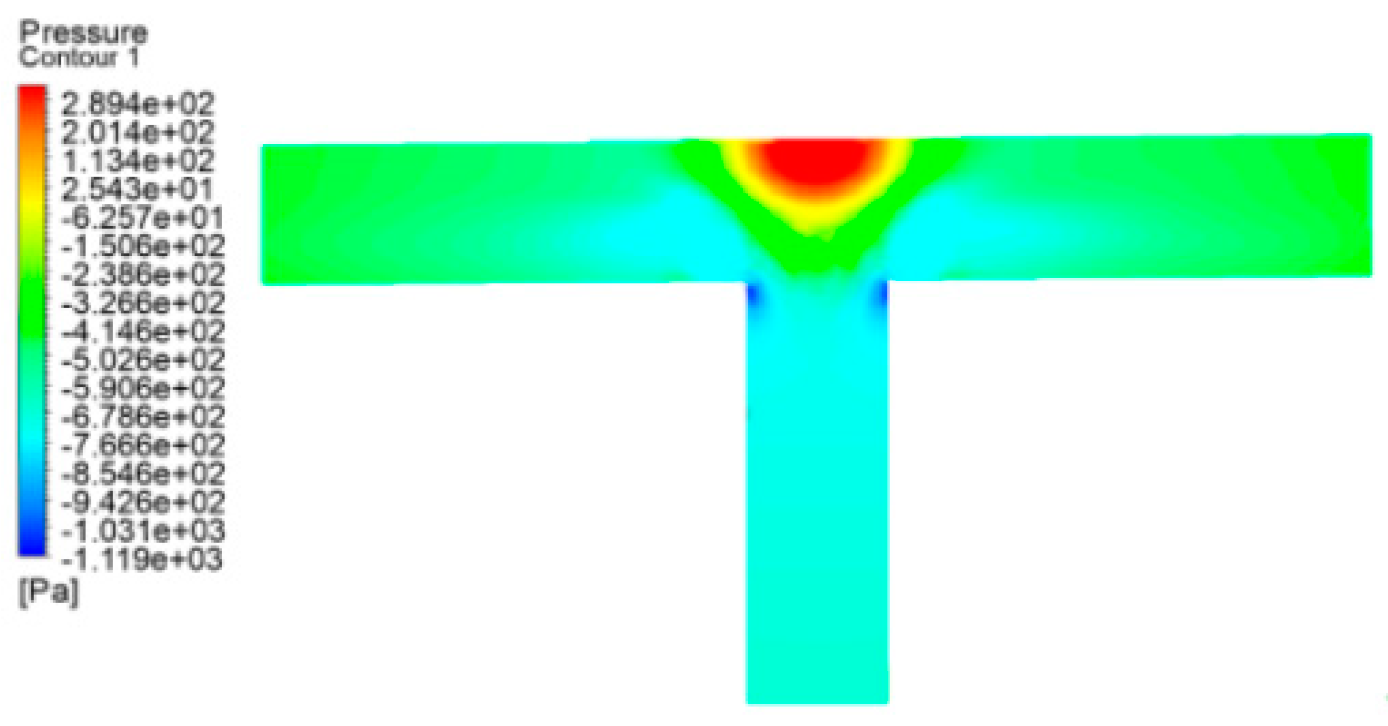
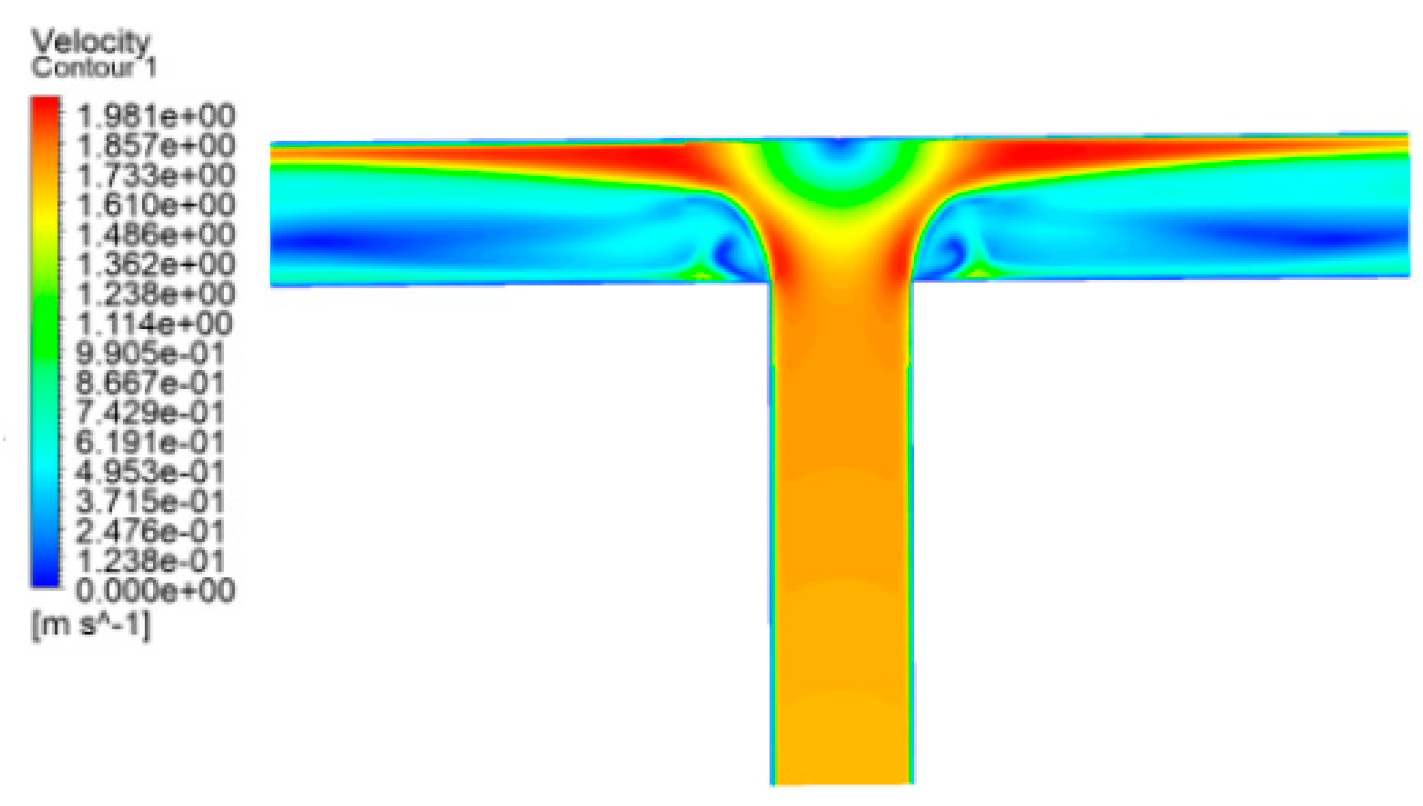
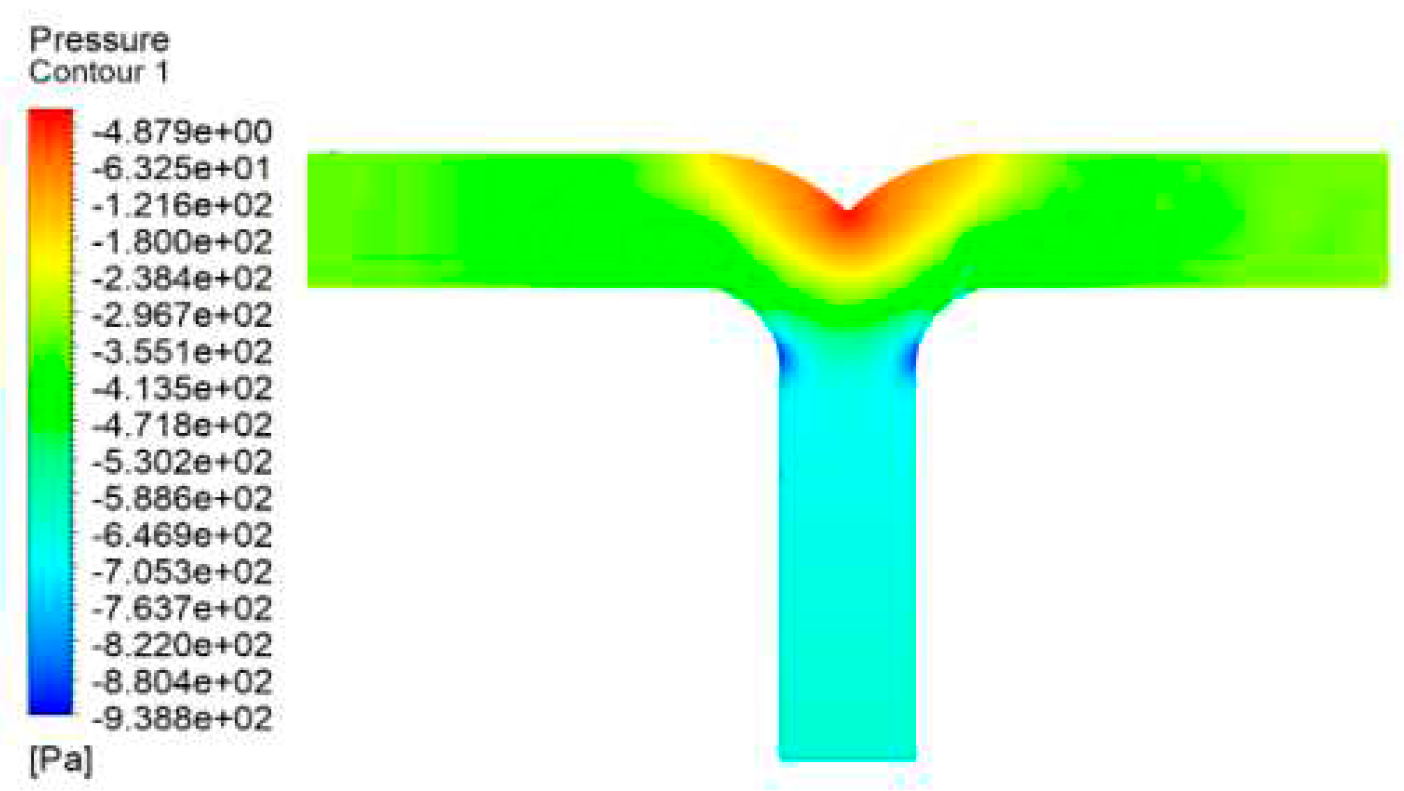
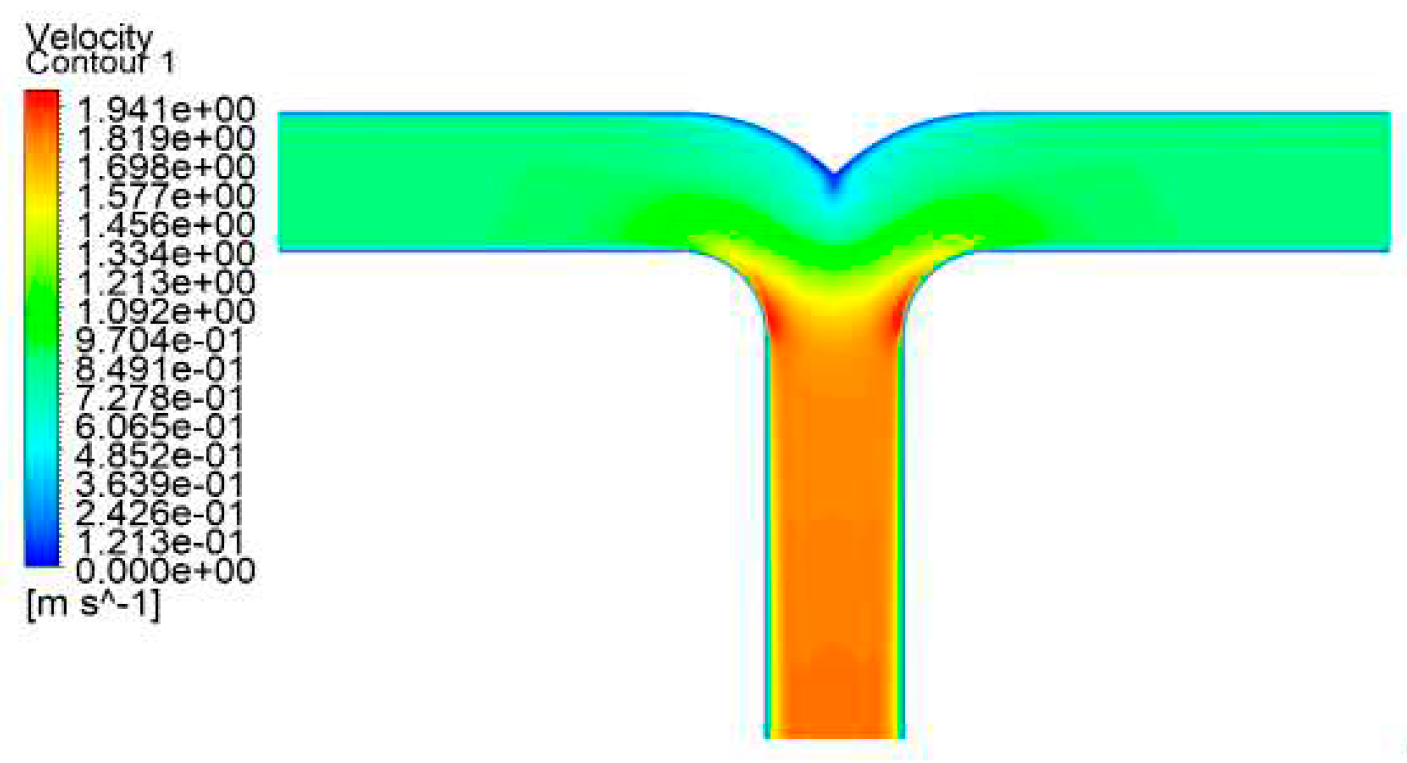
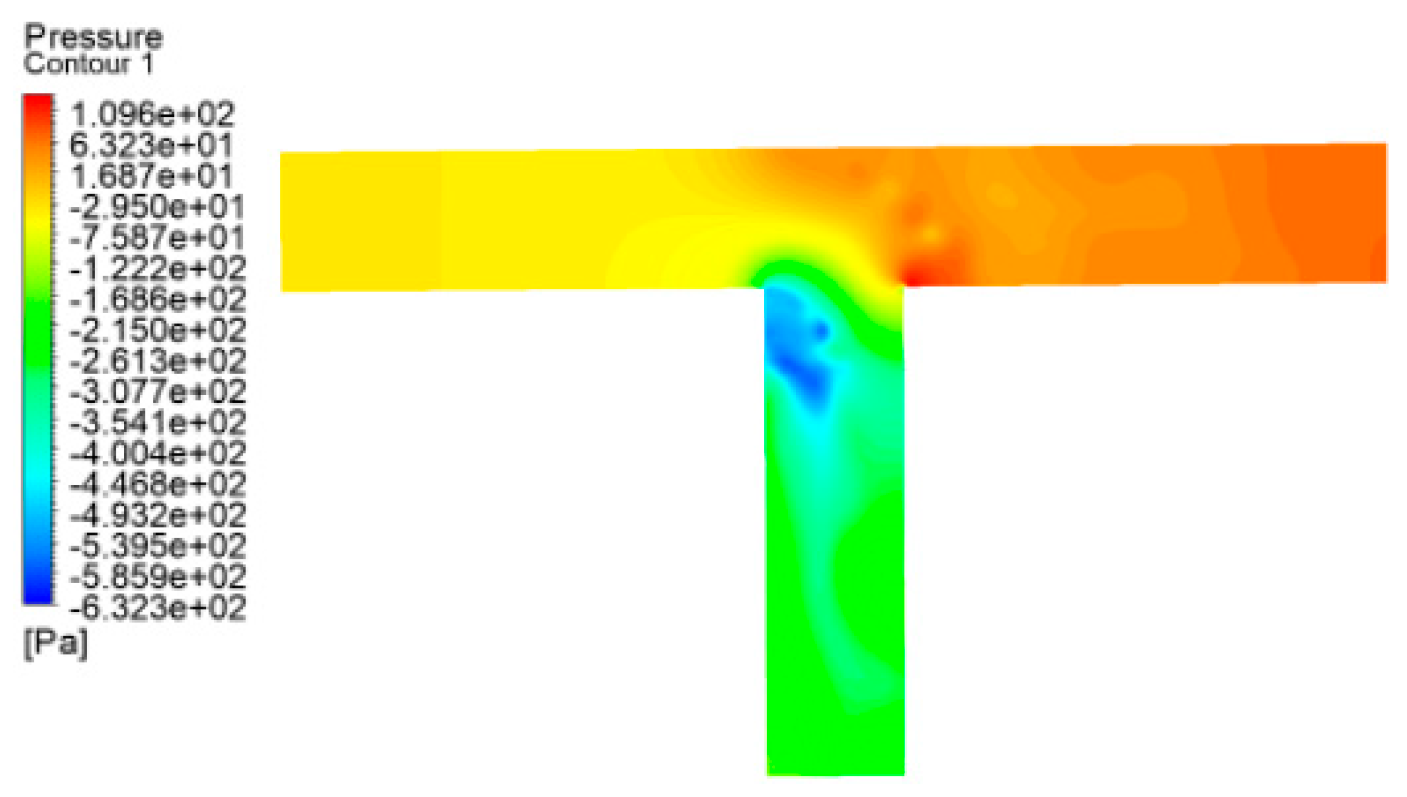
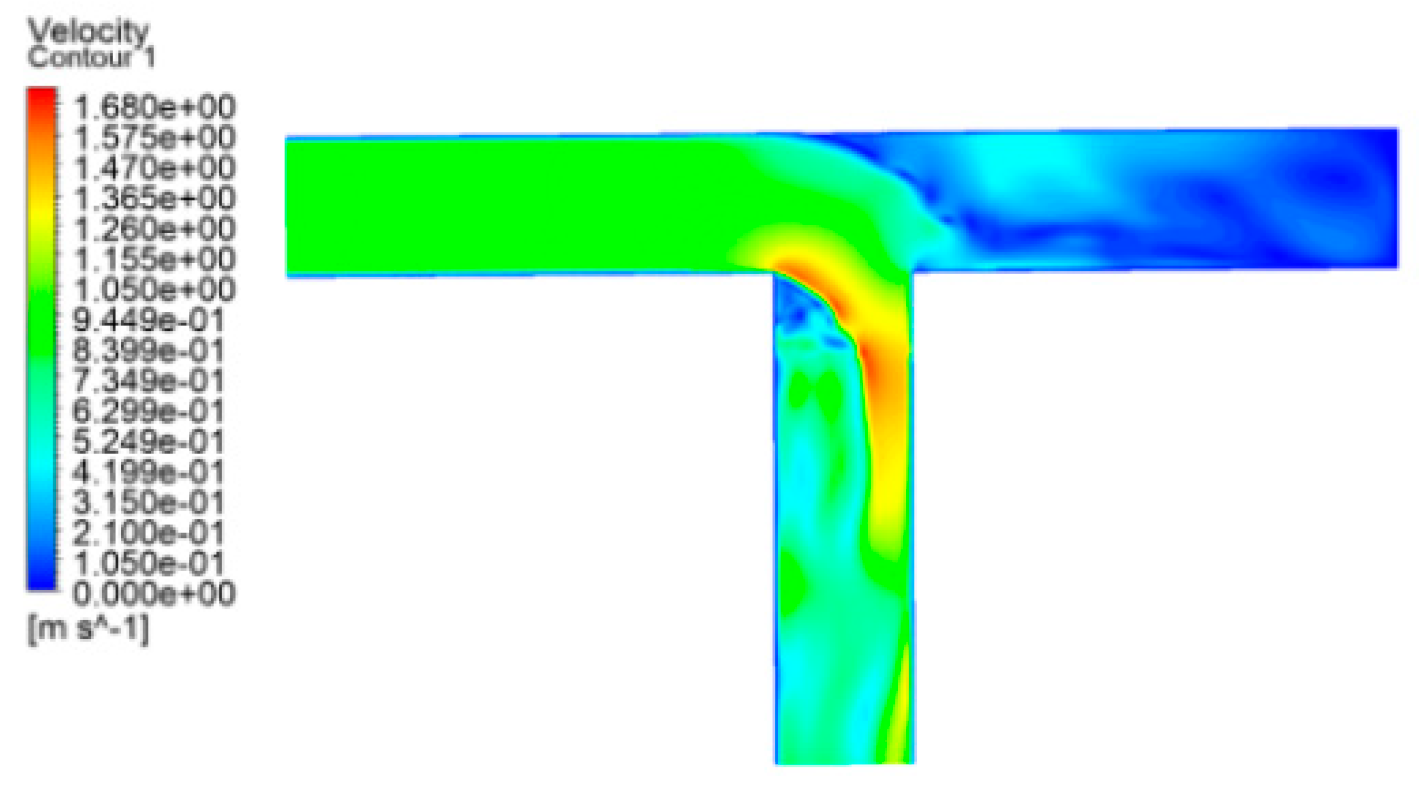
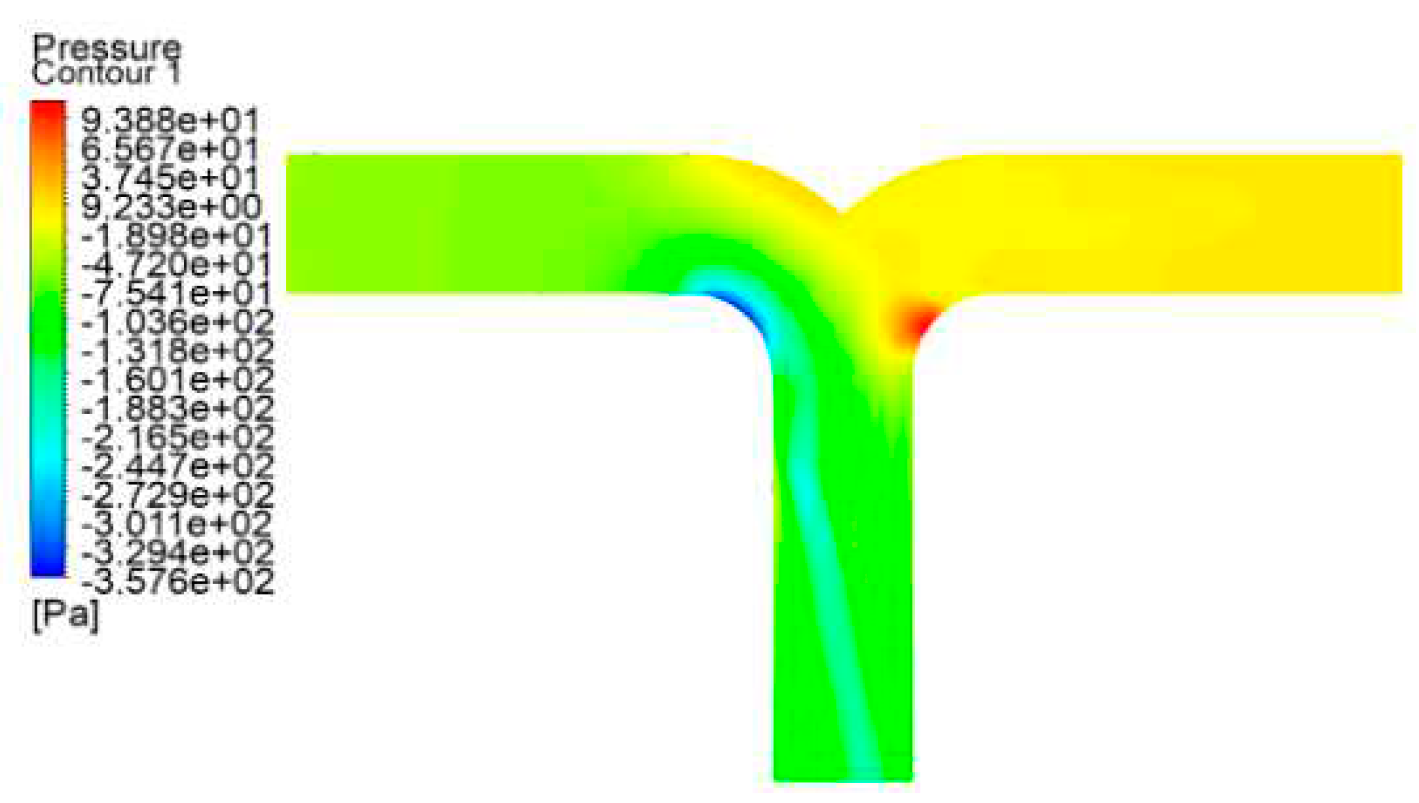
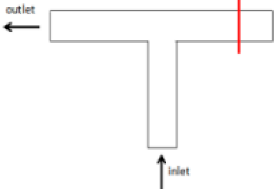
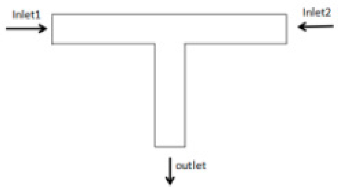
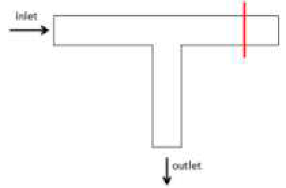
Now, the static pressure, flow velocity nephogram and vector diagram under the above four working conditions of T-type tee and dovetail tee are compared and analyzed.
As depicted in
Figure 14,
Figure 15,
Figure 16 and
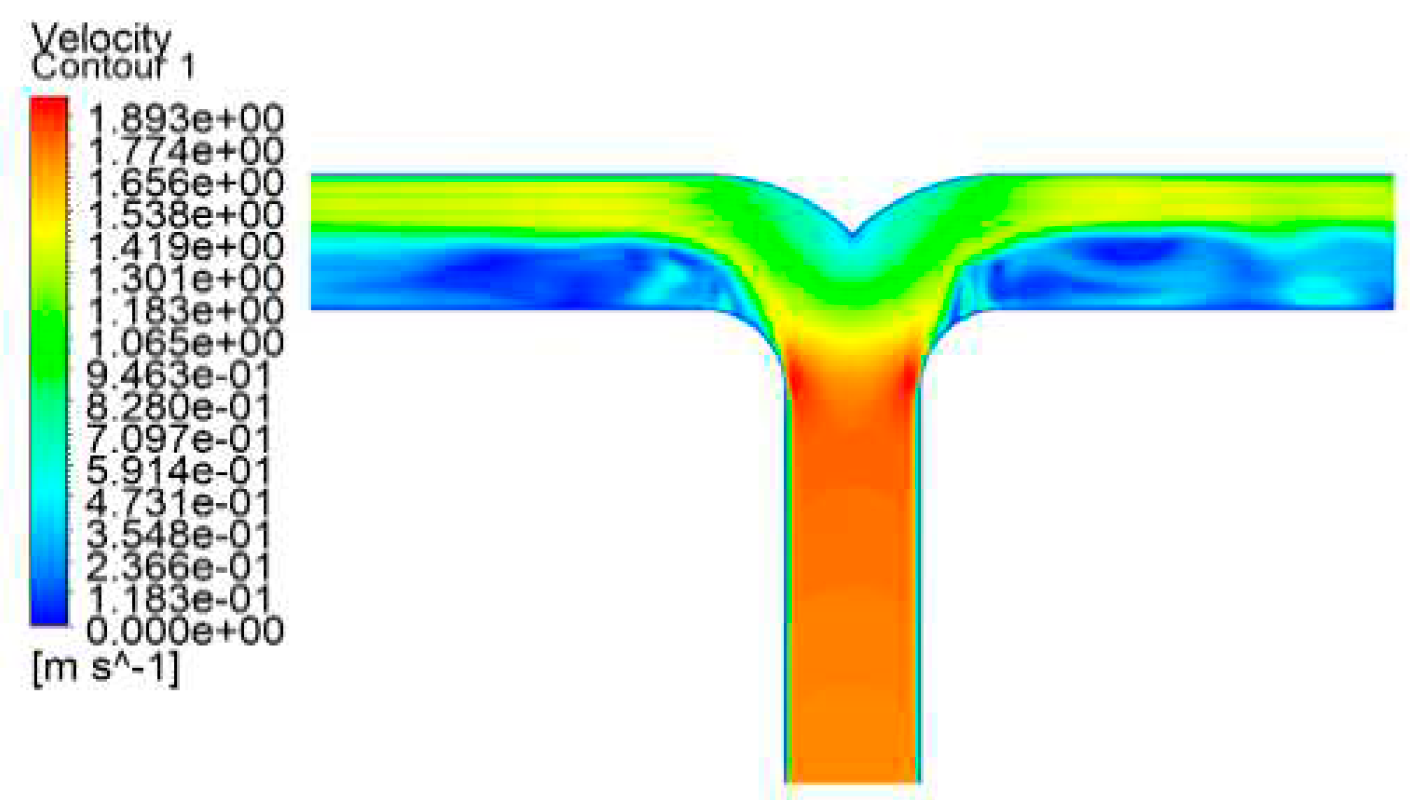
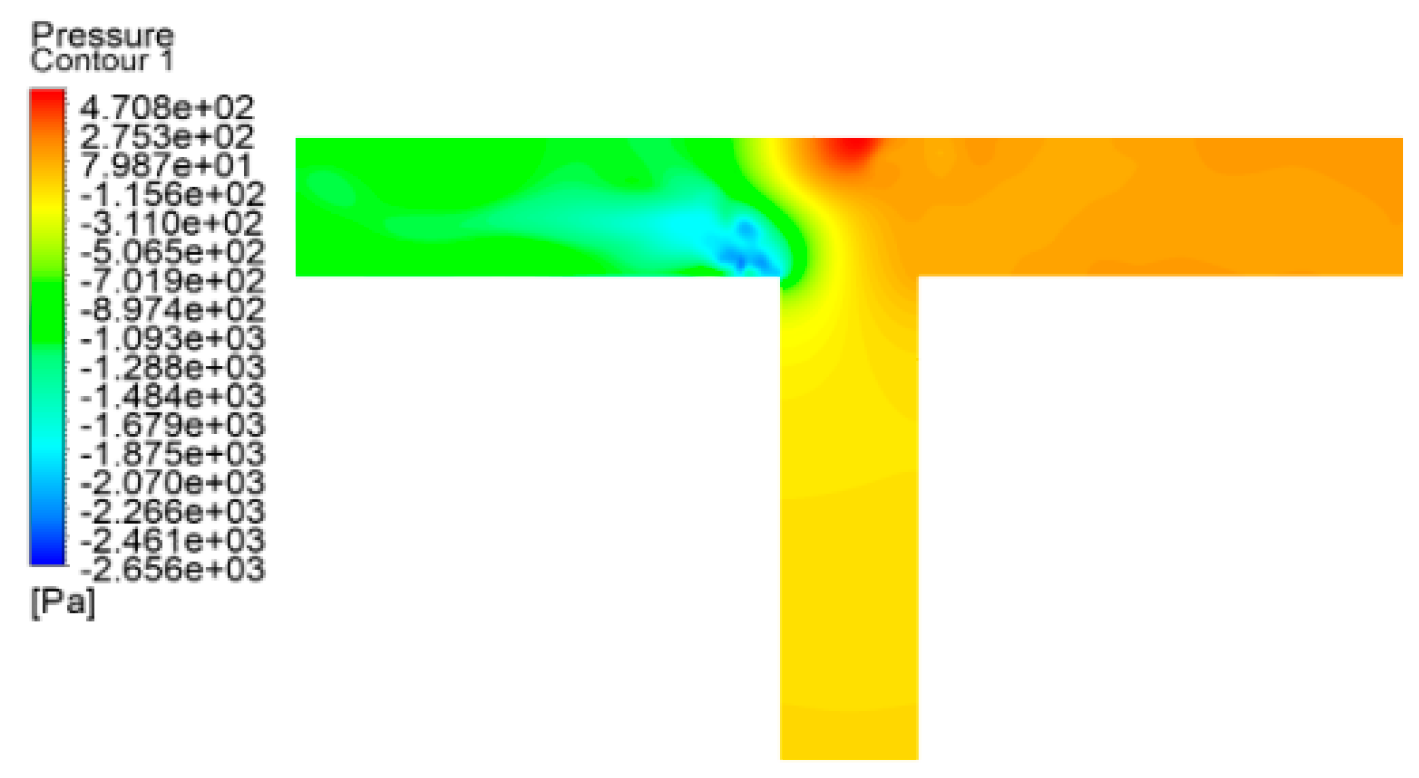
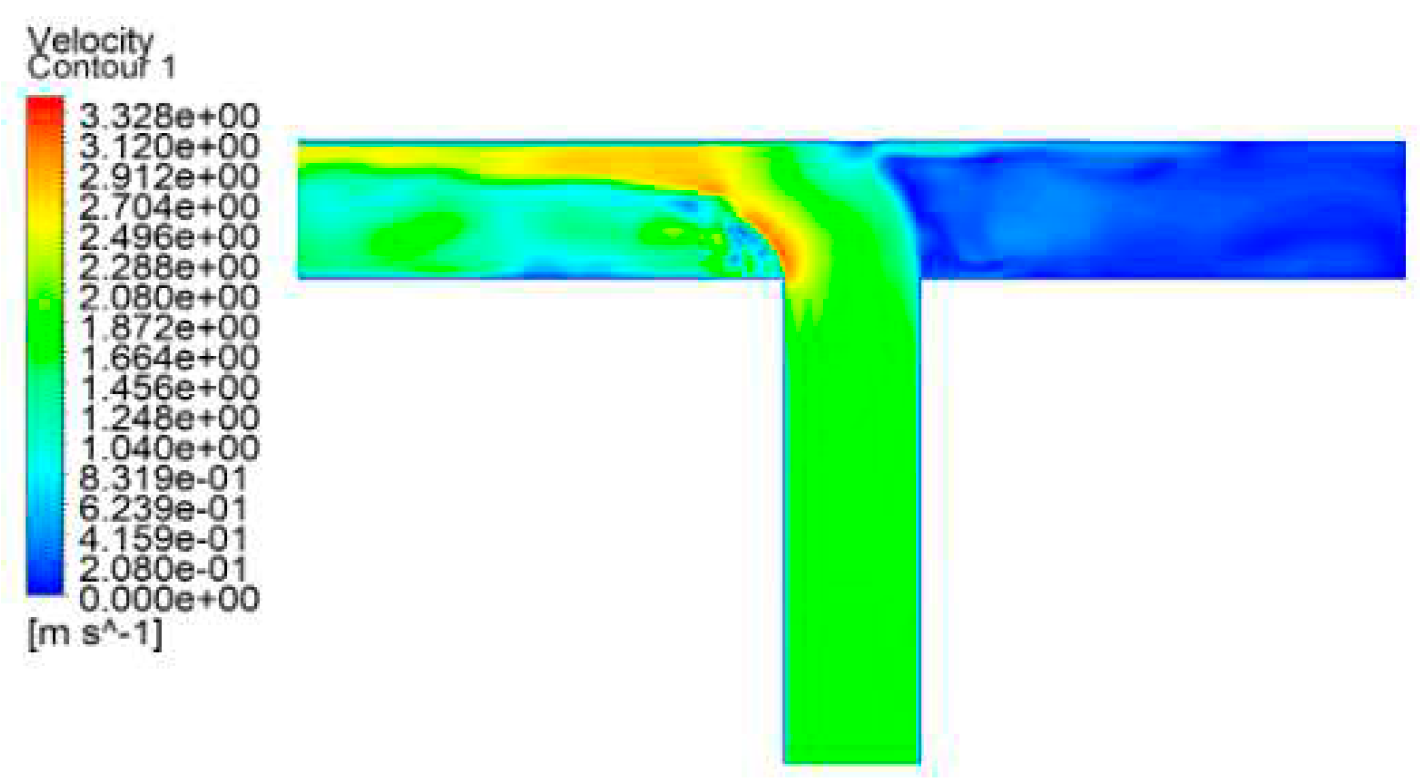
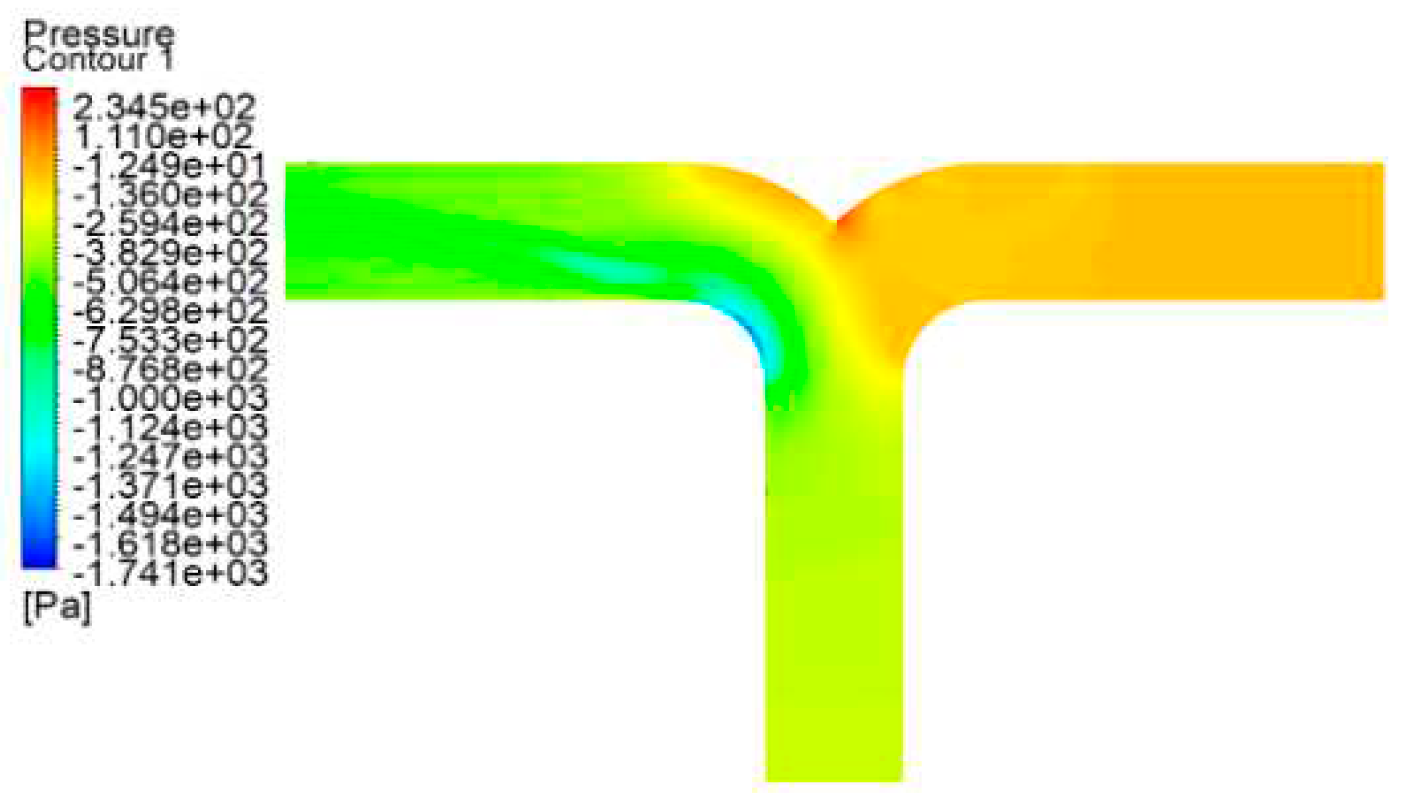
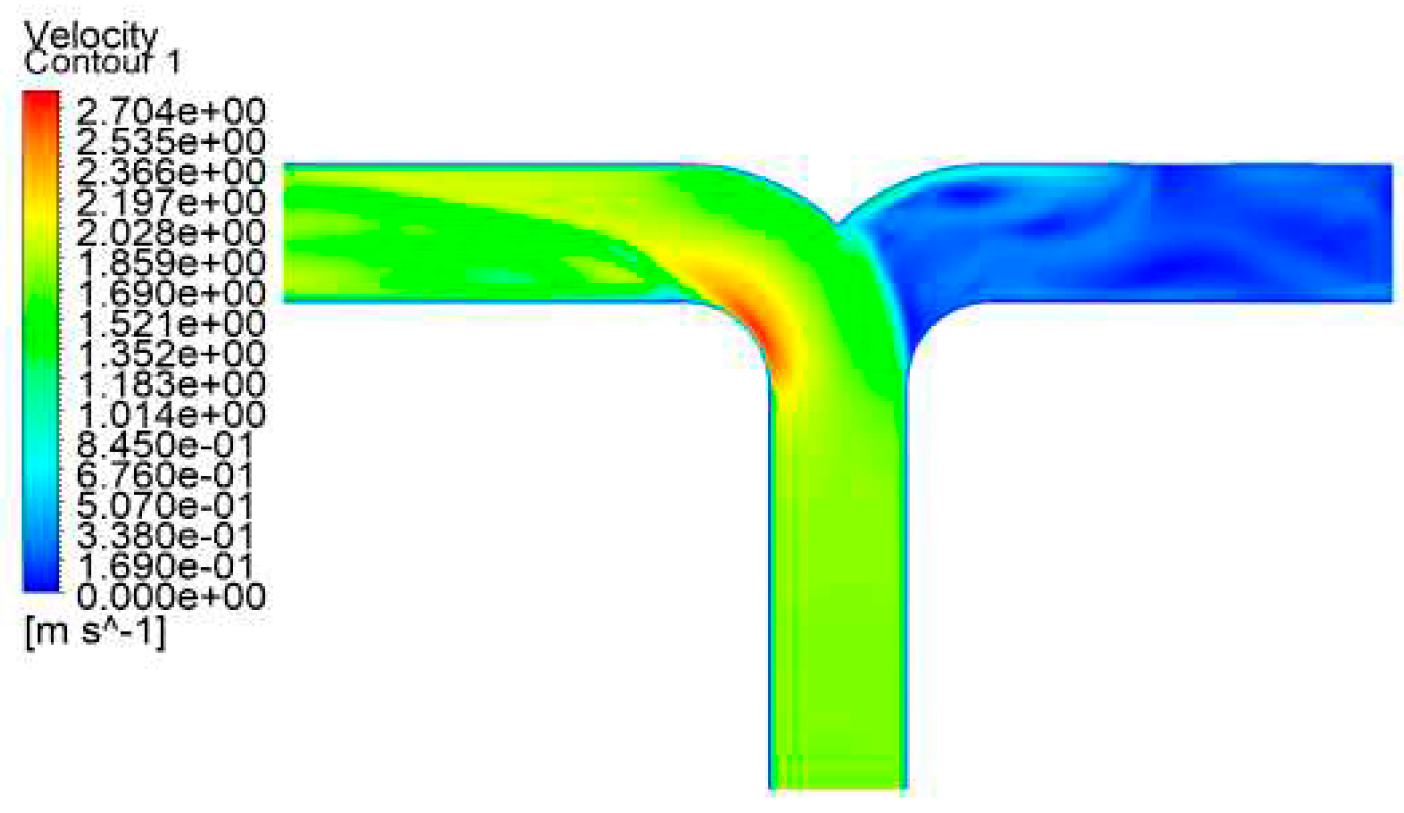
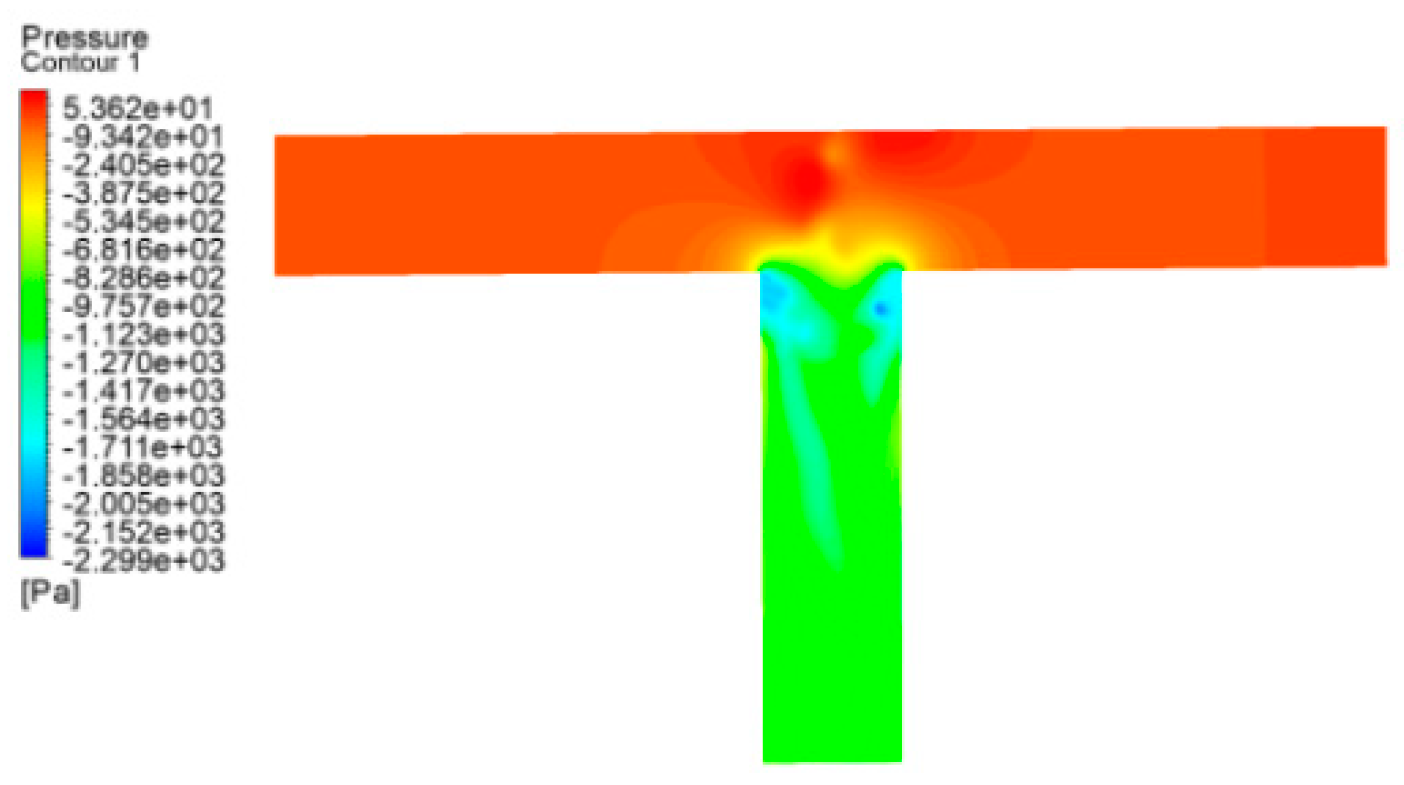
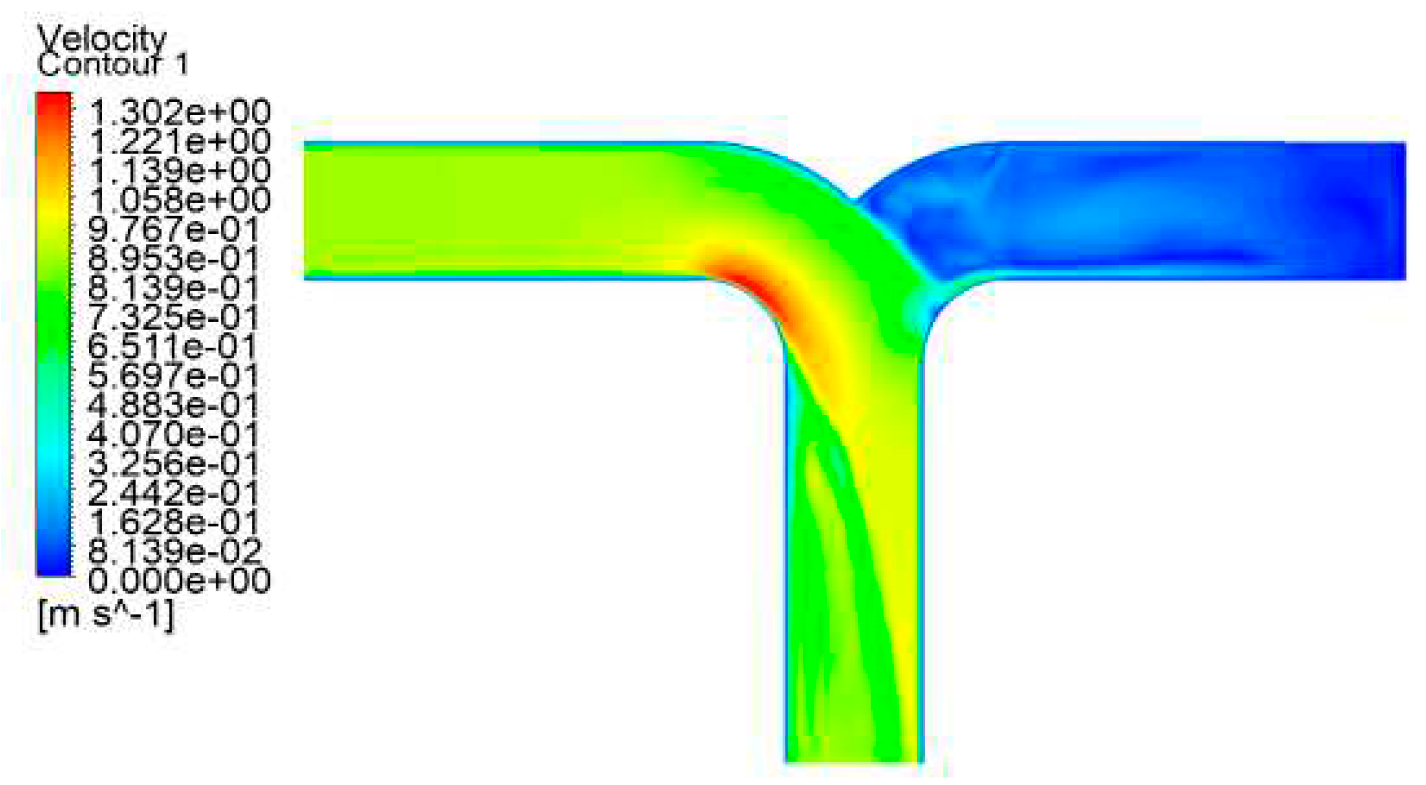
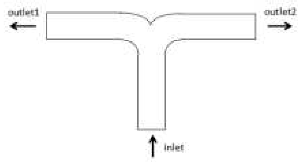
Figure 17, in the Conditions 1 and 5 , LNG enters through the lower side inlet and exits through the horizontal two outlets. Within the dovetail tee, LNG enters the bifurcation area, and owing to the guiding and transitional effects of the arc section, the majority of the fluid flow line uniformly changes direction along the arc, exhibiting a smaller gradient of change in flow direction compared to the T-type tee. The exit section also exhibits upper and lower partitions, with the flow rate of the upper layer notably surpassing that of the lower layer. The upper side of the flow line in the dovetailed tee is more uniform and straight in comparison to the T-type tee. The vortex generated in the outlet section of the dovetail tee is evidently weaker than that of the T-type tee, with a smaller separation zone. Moreover, the flow rate and pressure distribution in the dovetail tee are superior to those in the T-type tee, characterized by greater uniformity.
As depicted in
Figure 19,
Figure 20,
Figure 21 and
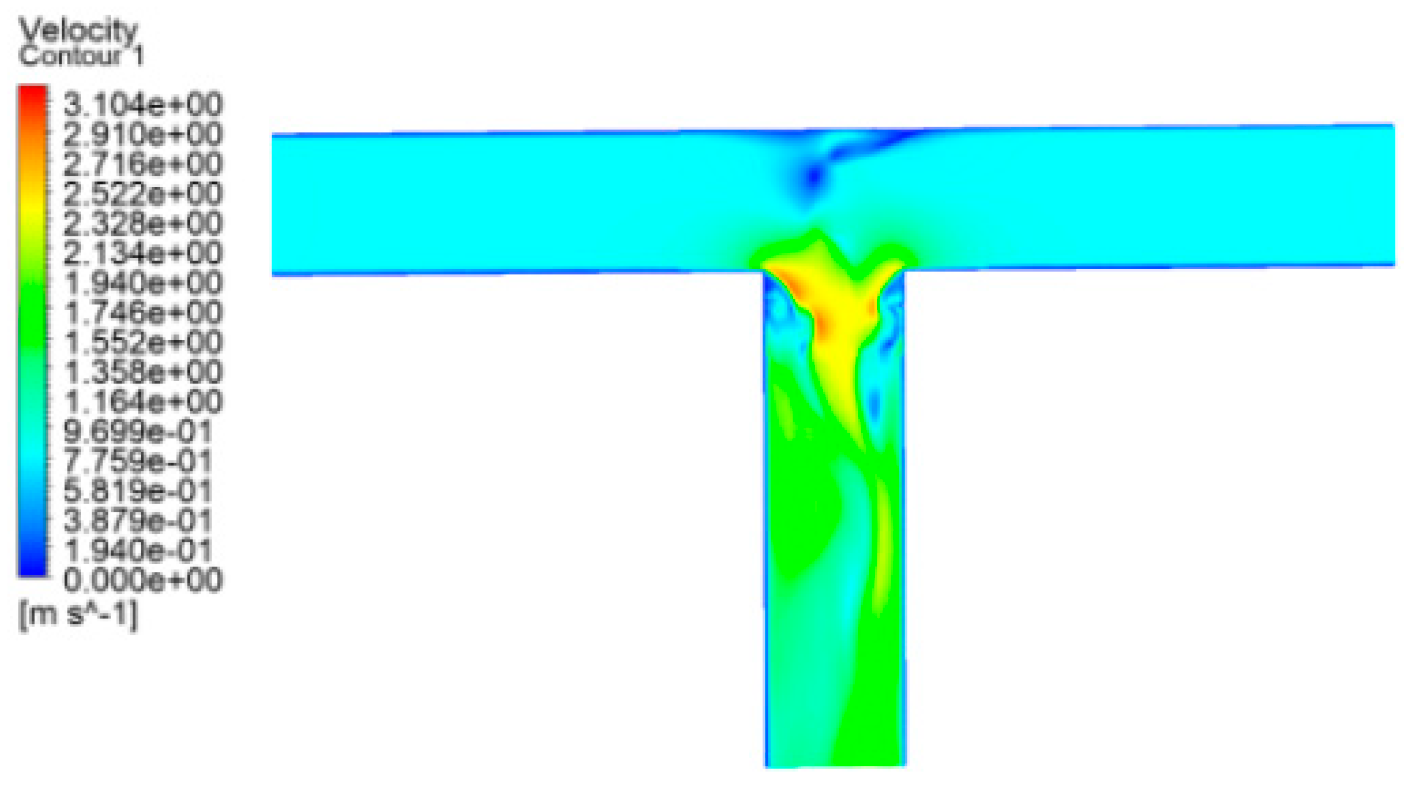
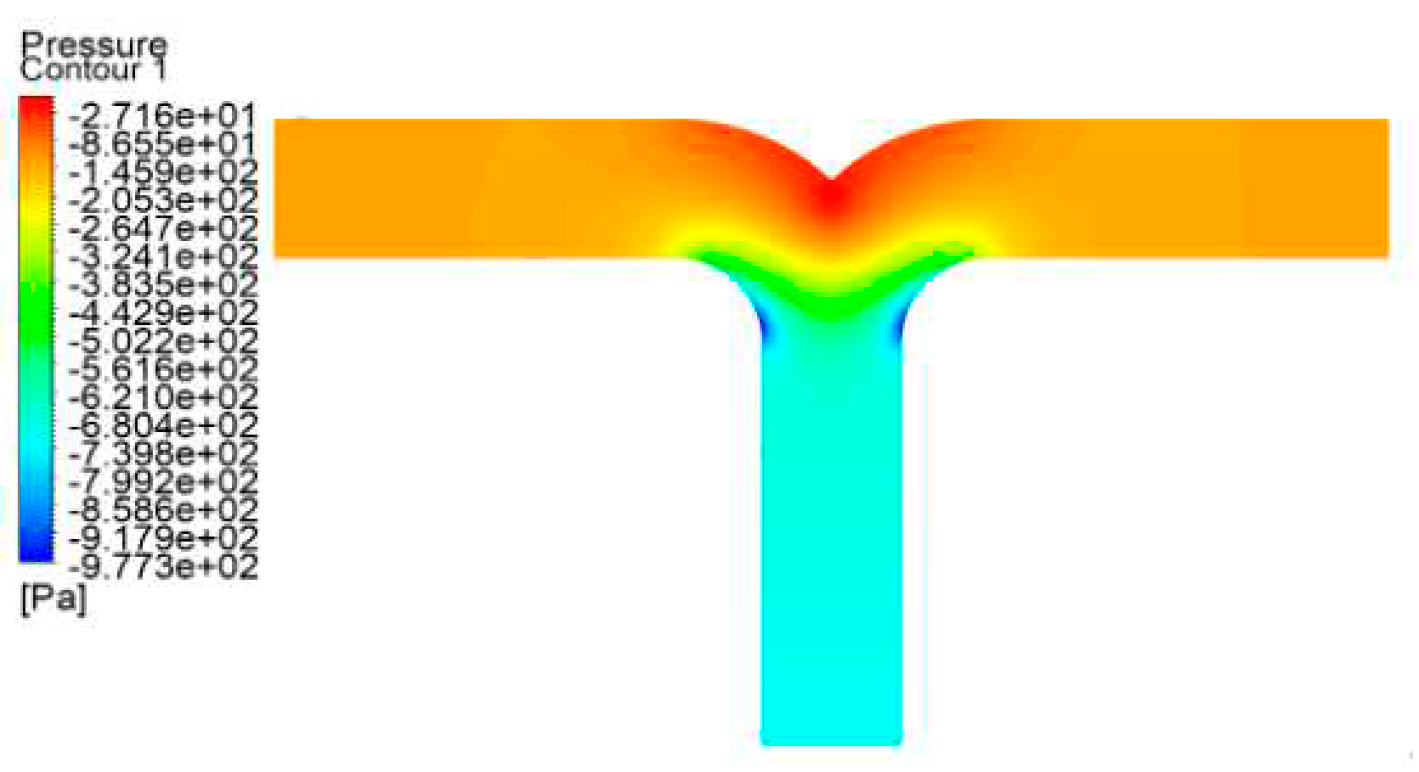
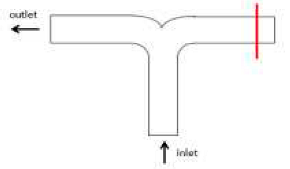
Figure 22, the direction of flow does not change for conditions 2 and 6, with the exception that the outlet on the right side is closed. The gradual curvature of the arc in the dovetail tee contributes to a more gradual change in flow rate and pressure compared to a T-type tee. Despite the slower turning of the flow line, the fluid near the left wall undergoes compression, resulting in lower static pressure and higher flow rate. Nevertheless, this effect is relatively minor in comparison to that of the T-type tee, and minimal to no vortexing is discernible. The disparity in flow velocity between the top and bottom of the outlet section is relatively slight. A minute quantity of fluid flows into the right-hand branch, inducing some backflow.
As depicted in
Figure 23,
Figure 24,
Figure 25 and
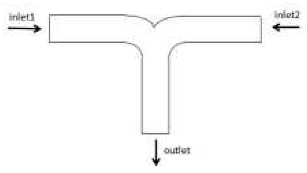
Figure 26, in the Conditions 3 and 7, the fluid flows from the inlets on both sides of the main pipe, converges at the tee, and then proceeds into the outlet section. Within the dovetail tee, the upper layer of fluid experiences a collision with the upper arc wall at the tee fork, inducing a change in flow direction, localized reduction in flow rate, and an increase in static pressure. Despite the occurrence of friction and collisions as fluid particles converge at the fork, the uniformity in the change of pressure and flow rate distribution is more pronounced than that observed in the T-type tee. Owing to the gradual flow of fluid, vortexing does not manifest in the outlet section.
As illustrated in
Figure 27,
Figure 28,
Figure 29 and
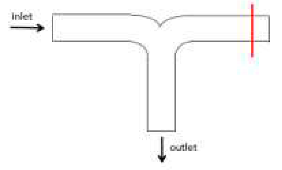
Figure 30, the Conditions 4 and 8 closely resembles Condition 3, with the distinction of the closure of the inlet side. Within a dovetail tee, the fluid flow rate adjacent to the left side wall attains a maximum, leading to a reduction in static pressure and a change in flow direction along the tangent of the arc. Simultaneously, the fluid at the right wall collides with the wall, resulting in a decrease in flow rate and an increase in pressure. However, the flow path is wider compared to the T-type tee, and no vortices are generated. Only a scant number of fluid particles enter the right inlet section, flowing back into the body.
In tee fittings, the inertia of fluid flow prevents it from changing direction with the pipe wall as it passes through the tee. This results in the main flow detaching from the wall, leading to the generation of a vortex. The vortex continuously extracts energy from the main flow, causing an increase in pressure, velocity gradient, pulsation, and exacerbating turbulence. The analysis indicates that, under the aforementioned four working conditions, the dovetail tee exhibit a pronounced transition effect compared to the vertical wall of T-type tee. This transition effect diminishes or even eliminates the head loss induced by the vortex, consequently reducing energy consumption. As shown in
Table 2, under the same working condition, the static pressure difference between the inlet and outlet of the dovetail tee is much lower than that of the T-type tee, and it is even reduced by 52.52% in Working Condition 3, and the velocity distribution of the fluid in the pipeline will be more uniform, and at the same time, the velocity of the fluid near the local components will be reduced, so as to reduce local frictional resistance.
2.4. Comparison of coefficient of local resistances of different tee
According to the results of inlet and outlet pressure difference and flow velocity obtained from the above CFD simulation process.The coefficient of local resistance of T-type tee and dovetail tee with different flow directions under different flow rates can be calculated.
The following equations can be listed due to the energy conservation of LNG during pipeline flow.
As the tee in the LNG pipeline is located in the horizontal plan,so
H1=
H2=0, Therefore, the formula of local resistance in LNG pipeline can be deduced. Then, the coefficient of local resistance can be obtained by applying its inverse deduction:
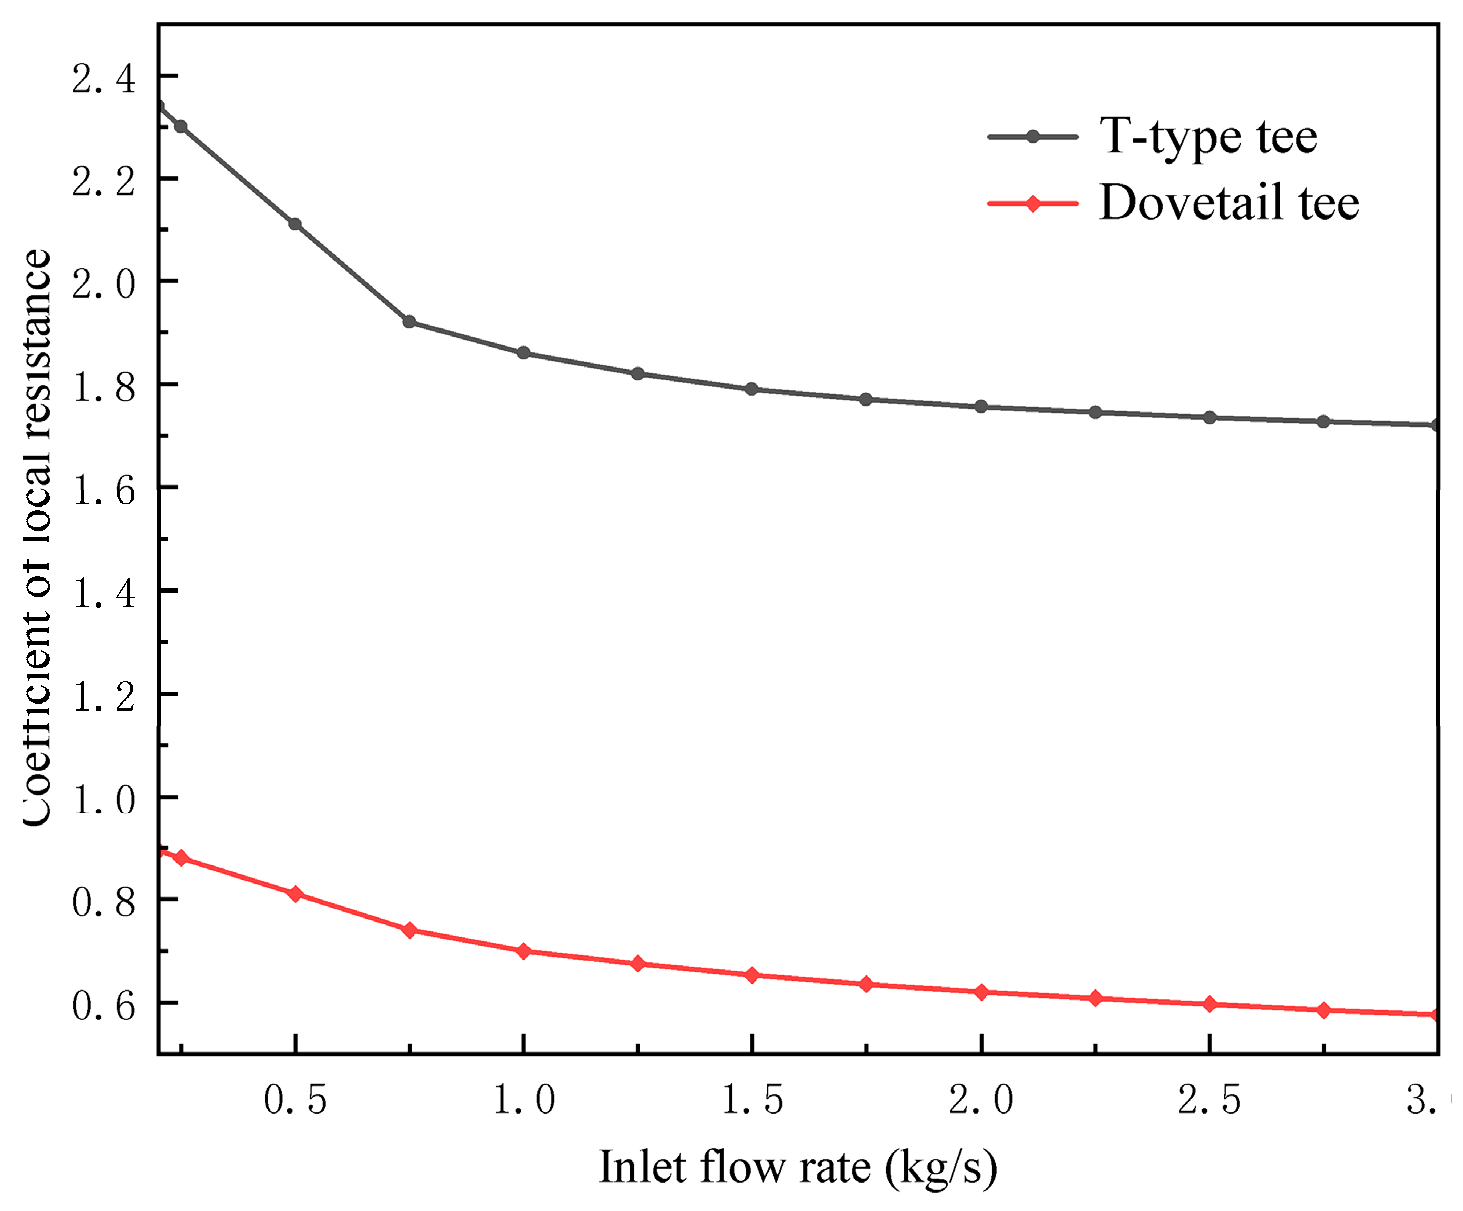
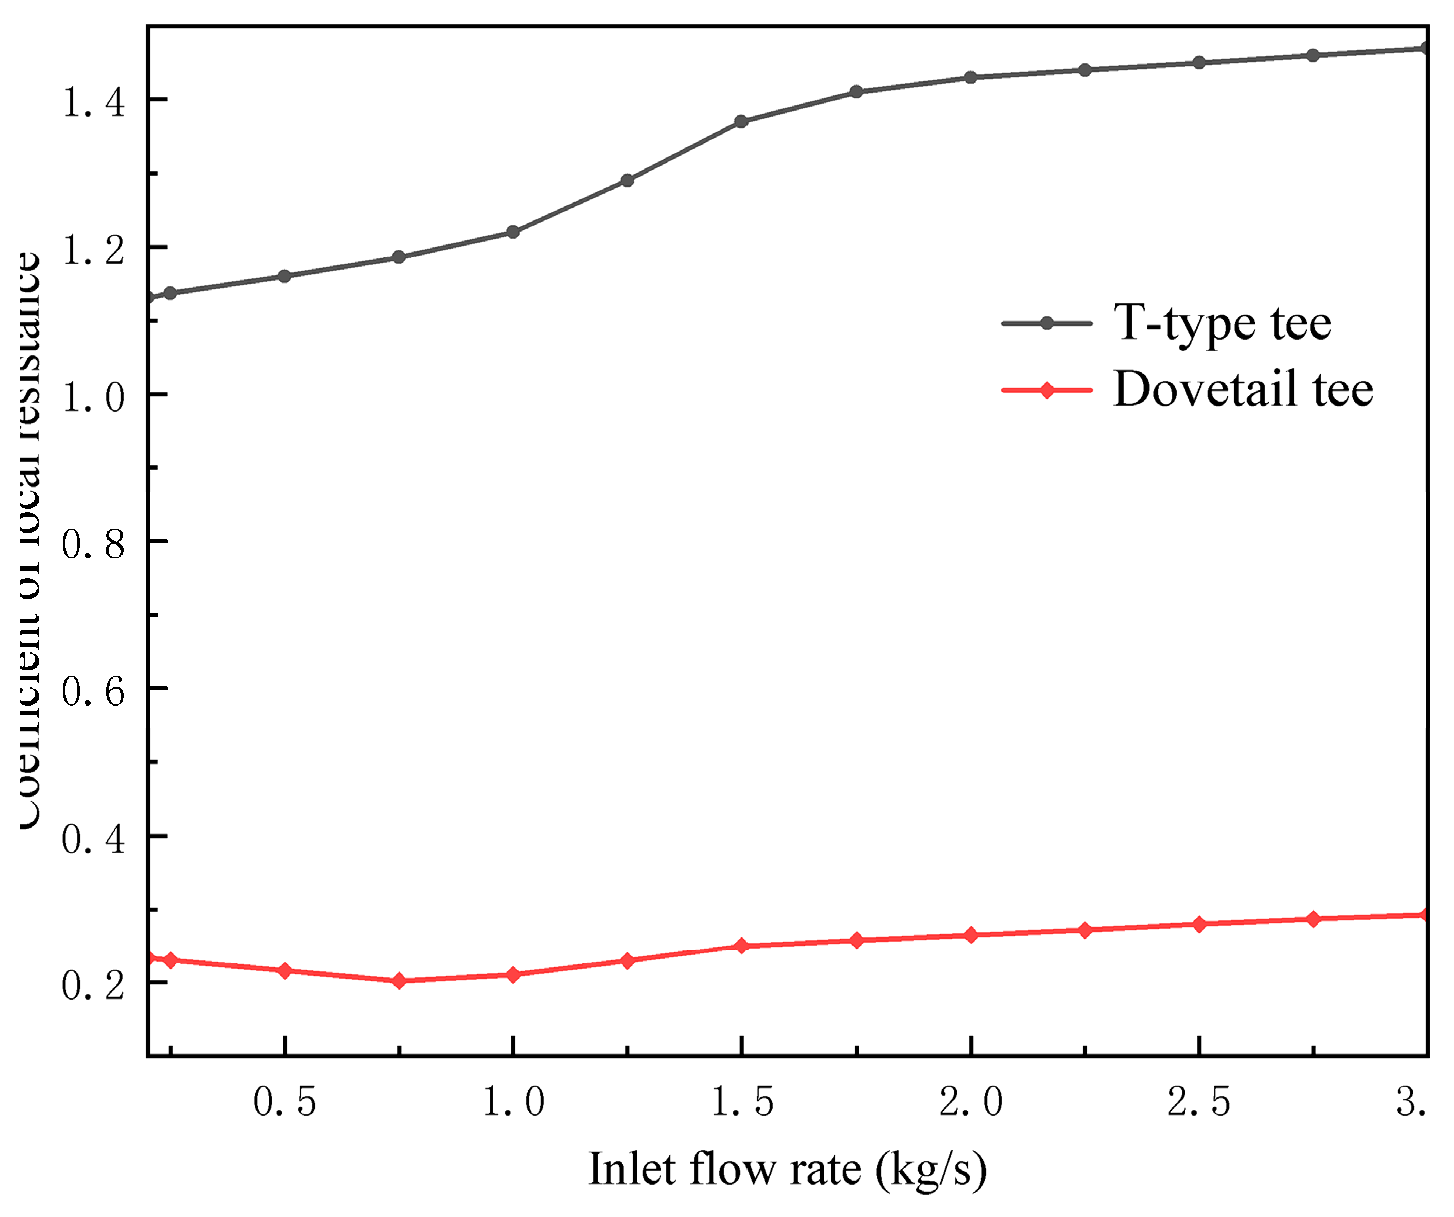
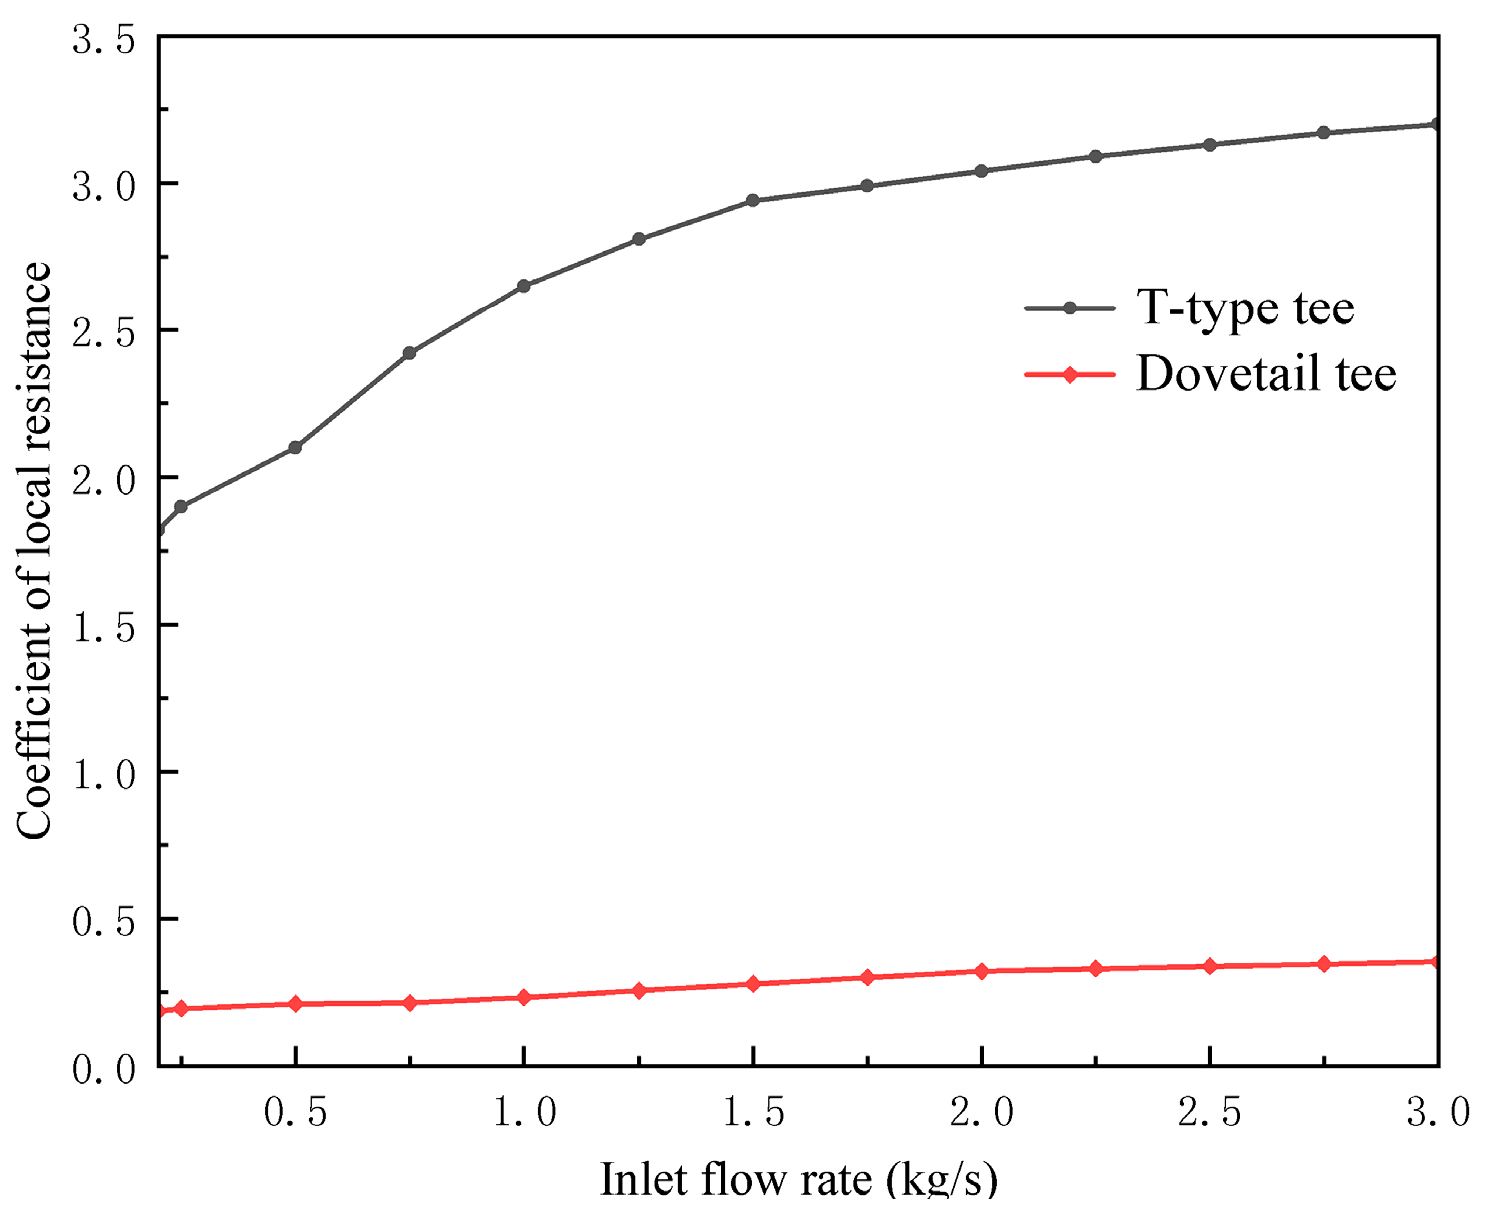
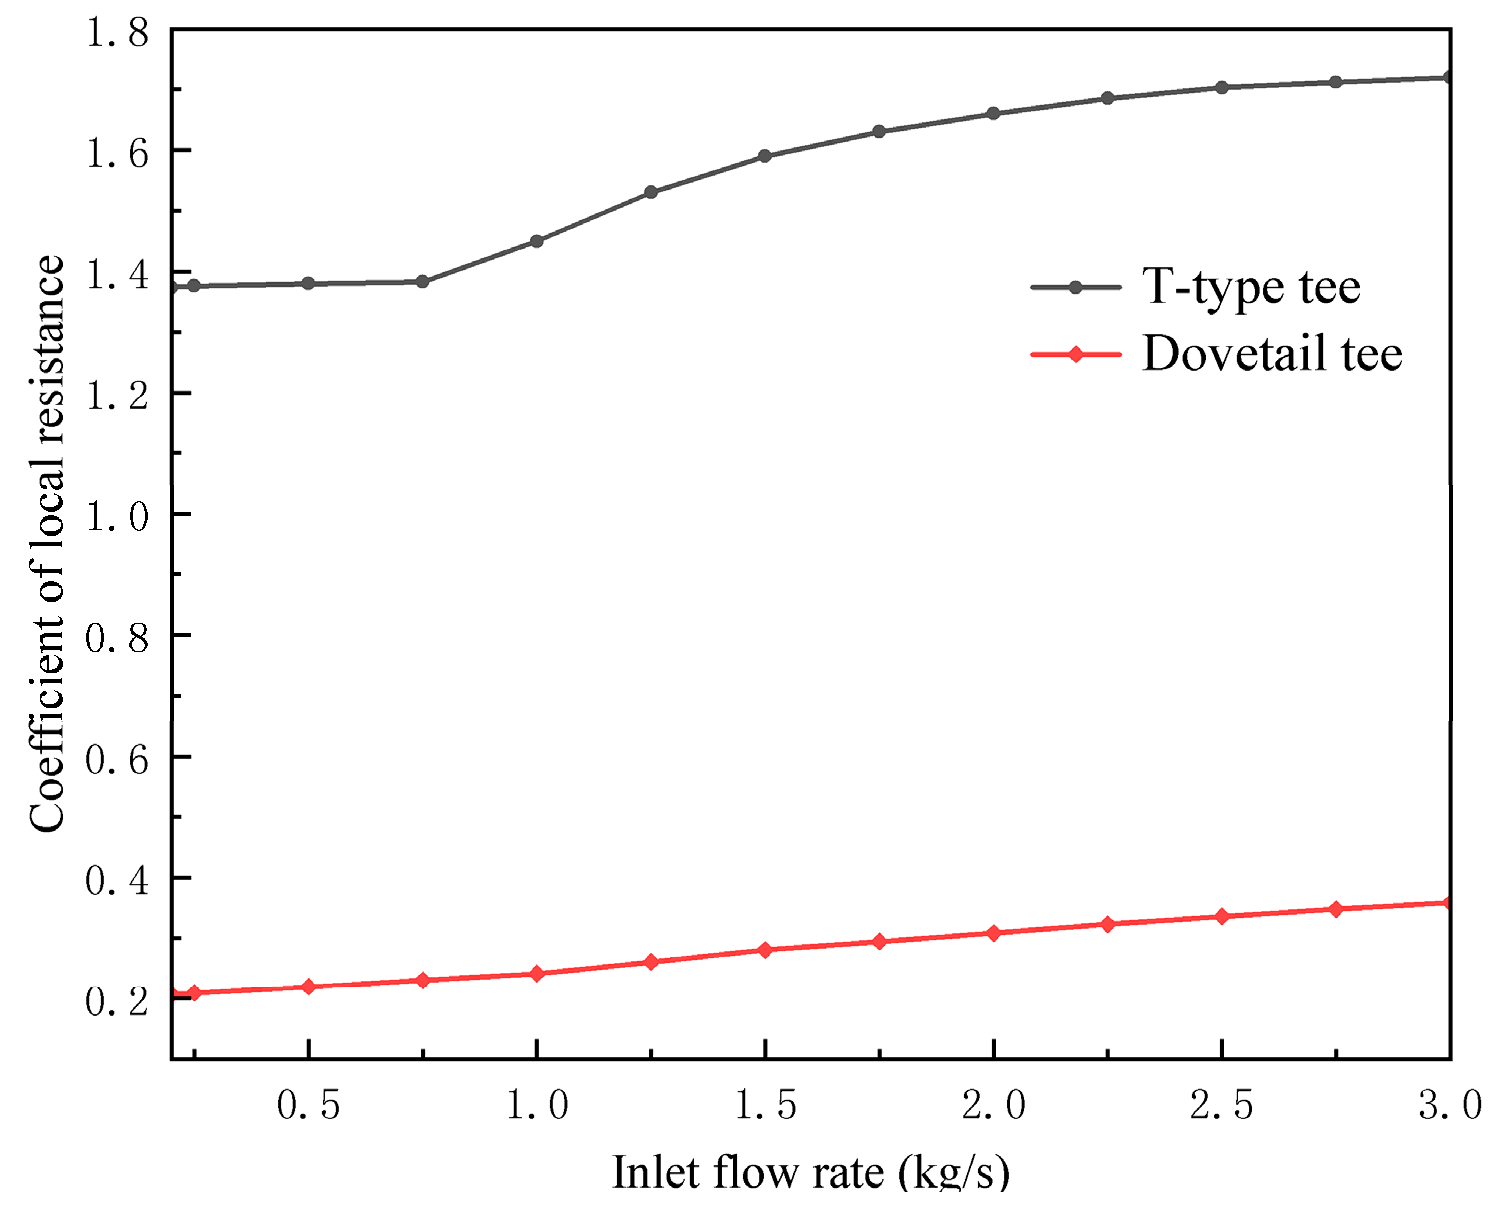
Now, the coefficient of local resistances of T-type tee and dovetail tee under various working conditions obtained by simulation calculation are compared as the
Figure 31,
Figure 32,
Figure 33 and
Figure 34.
Evident from the aforementioned quartet of comparative charts, the coefficient of local resistance of the dovetail tee exhibits a markedly superior performance in comparison to the T-type conduit across the four distinct operational scenarios characterizing the liquefied natural gas (LNG) pipeline. This discernible trend is notably accentuated, particularly at points of confluence. To elaborate, the coefficient of local resistance of the T-type tee surpasses that of the dovetailed tee by a factor of 2.79 ± 0.2 in Condition 1, approximately 5.36 ± 0.51 in Condition 2, around 10.22 ± 1.15 in Condition 3, and about 5.72 ± 0.92 in Condition 4. This phenomenon is more conspicuous in the T-type configuration, primarily attributed to the broader spectrum of coefficient of local resistances compared to the curved counterpart.
3. Hydraulic calculation of height difference of pipeline before and after reconstruction
This chapter exemplifies pipeline reconstruction, focusing on the pipeline configuration between the storage tank and the submersible pump within an LNG filling station situated in Qingdao city. It conducts a hydraulic calculation of the elevation disparity in the pipeline, subsequently scrutinizing the repercussions of altering local pipe fittings in the LNG pipeline on the said elevation difference. The findings of this analysis bear relevance and offer valuable insights for the prospective implementation of similar projects.
3.1. Theoretical calculation of height difference of liquid outlet
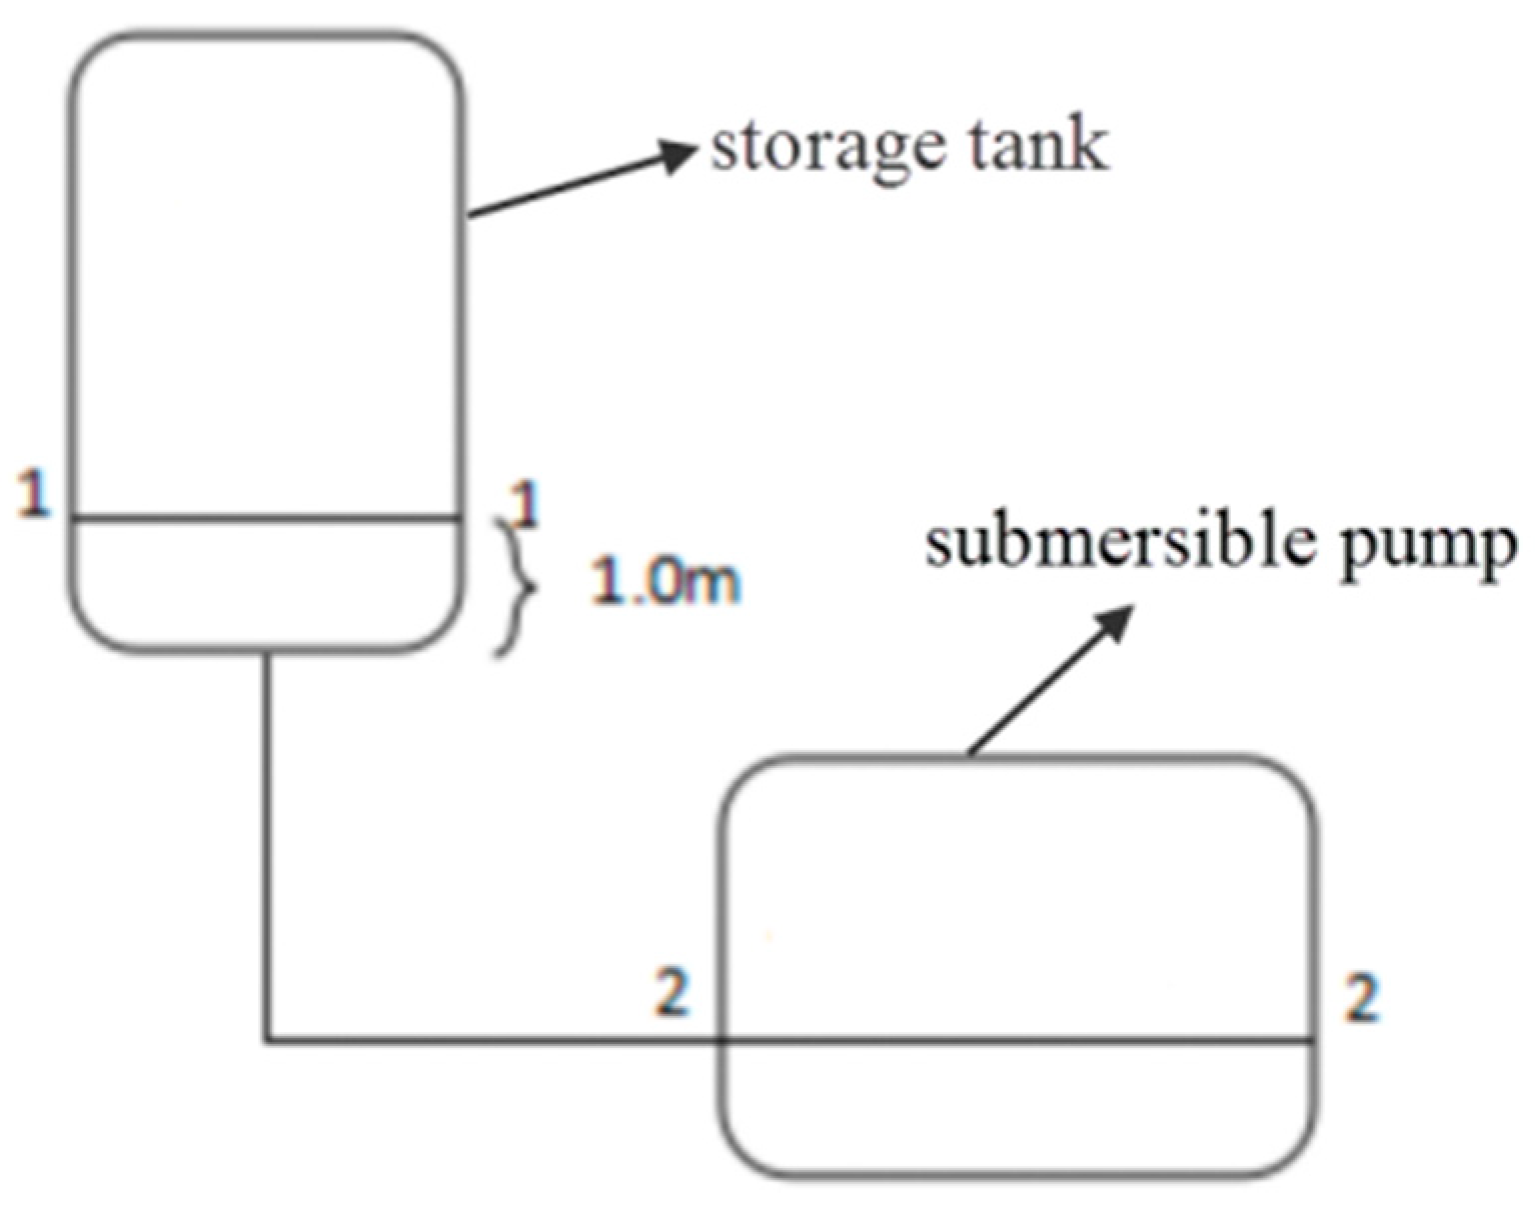
Initially, for the sake of computational simplification, we judiciously posit certain conditions based on the prevailing circumstances: Under the idealized assumption, we consider a scenario where the pipeline exhibits optimal cold insulation attributes, devoid of vapor generation within its confines. Moreover, we disregard the impact of gas flow resistance relative to the liquid. Grounded in empirical data, we ascertain the presumed LNG flow within the pipeline at a liquid filling rate typical of the majority of industry gas stations, set at 45 kg/min. The analysis further overlooks alterations in physical parameters throughout the course of LNG flow in the pipeline. Subsequently, we streamline and scrutinize the pipeline between the LNG storage tank and the submersible pump(e.g.
Figure 35), delineating pertinent hydraulic equations in accordance with the principles of energy conservation.
Presume the minimum liquid level requisite for the LNG storage tank as the 1-1 section, designating the midpoint of the liquid inlet conduit of the submersible pump as the liquid level within the pump, denoted as the 2-2 section. Under the assumption that the inflow into the submersible pump aligns with empirical specifications—specifically, L = 0.00171 m³/s, with the pipeline diameter set at DN50—the LNG flow rate in the pipeline can be determined using the relevant equation. The density of LNG is denoted as ρ = 439 kg/m³, the dynamic viscosity as μ = 9.36 × 10⁻⁵ Pa·s, and it is stipulated that there are no energy inputs or outputs within the pipeline spanning from the storage tank to the submersible pump.
In accordance with principles of fluid mechanics, the energy conservation law governing fluid flow in the 1-1 and 2-2 sections of the storage tank and submersible pump can be succinctly expressed as follows:
In this manuscript, the liquid level at the submersible pump (2-2 section) is designated as the reference level for hydraulic calculations. Upon careful analysis and simplification of the aforementioned parameters, it is established that H1 represents the elevation difference between the 1-1 section and the 2-2 section. As the 2-2 section serves as the reference, H2 is accordingly set to 0 m. A return pipe connects the storage tank to the gas space above the liquid level of the submersible pump, ensuring equal pressure in the regions above the liquid level in both entities. Additionally, in relation to the 1-1 section, the LNG storage tank outlet exhibits diminished size, signifying a comparatively restrained decrease in LNG speed within the 1-1 section, thereby warranting consideration. Analogously, the liquid level within the submersible pump significantly surpasses its liquid inlet.
Under these considerations, the aforementioned formula can be succinctly simplified as follows:
Darcy formula can be used to obtain the resistance along the pipeline, and the equation is as follows:
The drag coefficient along the path can be calculated by Alitsuri formula. The equation is as follows:
The formula of local resistance is as follows, and the coefficient of local resistance of LNG pipeline can generally be obtained from literature[
15].
Based on the aforementioned expression, the requisite elevation difference for the liquid level between the LNG storage tank and the submersible pump can be computed. Subsequently, the height disparity between the two pipelines can be derived by subtracting the lowest liquid level height within the storage tank.
3.2. The analysis of comparative with LNG filling station pipeline renovation
This chapter undertakes a comprehensive examination of the pipeline system within an LNG filling station situated in Qingdao city, utilizing it as an illustrative case. Early interactions with station personnel unveiled challenges impeding refueling continuity, notably including an abundance of elbows in the submersible pump pipeline, resulting in considerable local resistance. The storage tank's location lacks hydraulic calculation documentation, relying solely on experiential placement, and fails to adequately provision for the required liquid outlet elevation difference. Furthermore, the absence of slope control in the pipeline direction impedes the optimal progression of the two-phase flow process. Adding to the predicament, the pipeline's cold insulation measures are protracted, with certain sections left uninsulated. In summary, this station typifies an LNG filling station grappling with substantial refueling issues due to suboptimal pipeline configuration. Against this backdrop, the paper endeavors to address these challenges, aiming to alleviate local resistance, minimize the necessary liquid outlet height difference, and enhance the overall liquid outlet capacity of the LNG filling station.
3.2.1. Hydraulic calculation of the original pipeline
The Qingdao LNG filling station comprises one LNG storage tank and one submersible pump each in the north and south directions, totaling two tanks and two pumps. During actual operations, the north and south directions of the tank or submersible pump may not be concurrently active. Consequently, hydraulic calculations for the pipeline between the storage tank and submersible pump must be conducted under diverse operating scenarios. The reference liquid outlet height difference is selected based on the most unfavorable condition. The operational conditions of the filling station's storage tank and submersible pump are categorized into six distinct types, as delineated in the
Table 3.
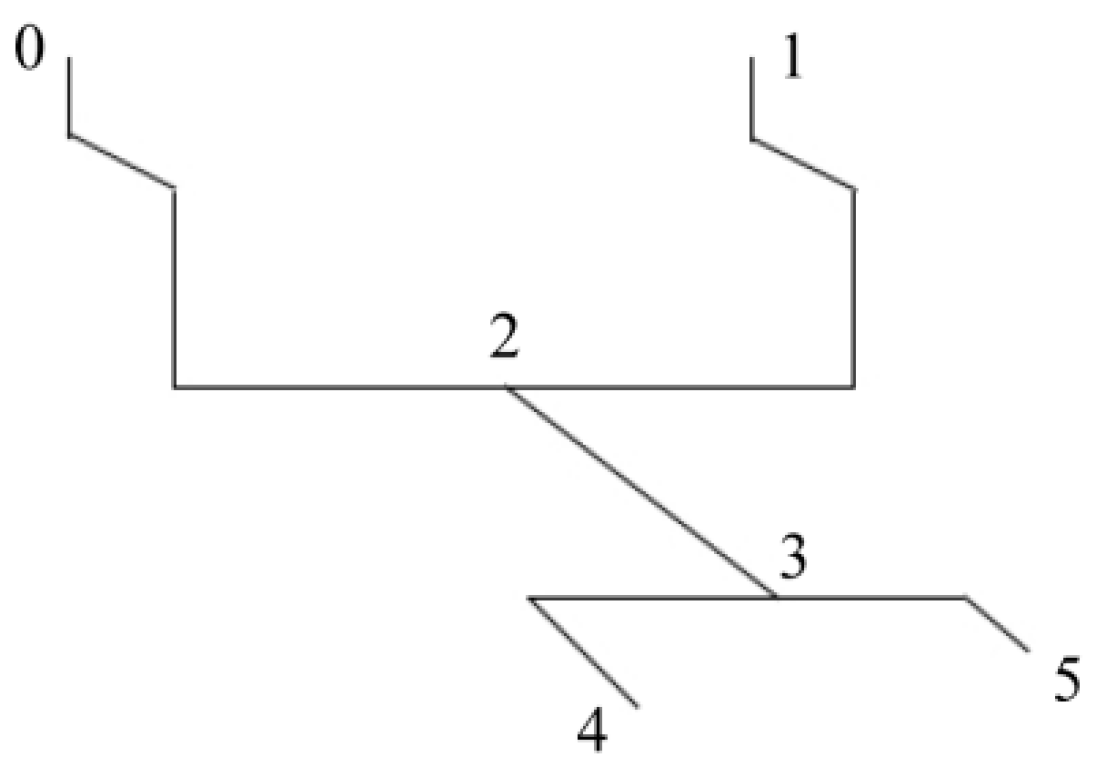
The schematic representation of the pipeline is segmented based on various operational conditions. The parameters for each section of the pipeline in the diagram are enumerated as the
Table 4.
Calculation of the total pipeline resistance is conducted under the assumption that the storage tank is at its minimum liquid level for each of the six specified operational conditions.
As evident from
Table 5, subsequent to determining the pipeline resistance between the LNG storage tank and the submersible pump under diverse operational conditions, the liquid level difference between them can be ascertained using the provided formula. Furthermore, specifications indicate that the volume corresponding to the lowest liquid level of the storage tank typically constitutes about 15% to 20% of its total volume, with the pump automatically halting downstream operation if this threshold is breached. Consequently, during such instances, the minimum liquid level in the LNG filling station tank is estimated to be approximately 1.0 meter. To ensure adequate liquid filling and prevent pump cavitation damage, the pipeline height difference between the storage tank and the submersible pump should be at least 1.58 meters. However, the design height difference between the storage tank and the submersible pump in the station, according to data from the LNG filling station, is 1.25 meters. This falls short of meeting the requirements under the most unfavorable working conditions (specifically, single tank double pump), thus deviating from the intended design expectations. Consequently, a judicious and necessary optimization and transformation of the inlet pipeline between the storage tank and submersible pump in the LNG filling station is imperative.
3.2.2. Hydraulic calculation of pipeline after modification
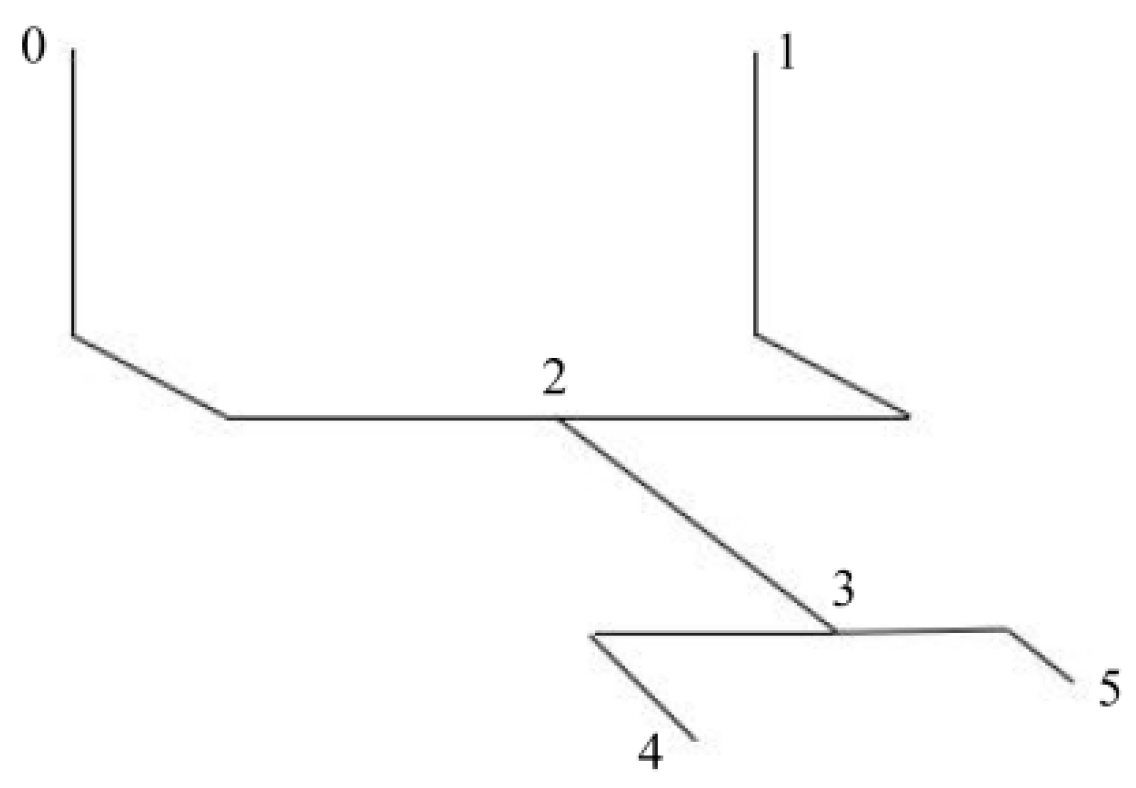
Following the analysis, it is evident that the elevation difference between the LNG tank and the submersible pump is intricately linked to the magnitude of resistance within the conduit. Therefore, without altering the positions of the LNG tank and submersible pump, the ensuing transformation program is proposed: a judicious reduction in the number of elbows to mitigate local resistance, an L-shaped arrangement of the LNG tank discharge pipeline section to further reduce resistance, and the substitution of T-type tees with dovetail tees to diminish local resistance. Consequently, post-transformation, the pipeline arrangement between the LNG tank and the submersible pump is configured as follows:
As evident from
Figure 37, in the modified pipeline arrangement, there is a reduction of two elbows, resulting in a decreased local resistance coefficient at two locations in the pipeline. Additionally, it is noteworthy that the post-modification working condition division of the pipeline between the storage tank and the submersible pump, as well as the calculation parameters of relevant pipe sections under each working condition, remain consistent with those predating the renovation and are hence omitted from further listing. The ensuing hydraulic calculation of the modified storage tank and submersible pump pipeline under various working conditions is presented below, with results detailed in the subsequent table:
As evident from the presented table, the requisite height difference for the pipeline between the LNG storage tank and the submersible pump after modification is 1.18 meters, marking a 25.32% reduction compared to the height difference required before the alteration. Notably, the alteration of the tee configuration contributes to a 17.58% decrease in the necessary height difference. Consequently, the pipeline height difference between the storage tank and the submersible pump in the station is calculated to be 1.25 meters, meeting the stipulated requirements.
4. Conclusion
In this study, ANSYS is employed to simulate the internal flow fields of various tee types and flow directions. The pressure and flow velocity maps of 50 mm T-type tee and dovetail tee are analyzed under different working conditions, specifically when conveying 1.5 kg/s of LNG. The local resistance coefficients of T-type and dovetail-type tees are compared through hydraulic calculations, considering different inlet flows and flow directions. The four working conditions investigated include the combined flow tee with horizontal two inlets and its single-pipe flow when one of the inlets is closed, as well as the split flow tee with horizontal two outlets and its single-pipe flow when one of the outlets is closed. Furthermore, the study delves into a practical case, analyzing and reforming the pipeline height difference issue in a LNG filling station in Qingdao. The refueling problem stemming from the inadequately arranged height difference between LNG tanks and submerged liquid pumps is addressed through analysis and reform. Comparative hydraulic calculations are conducted before and after the reform to assess the required pipeline height difference. The findings of this research are summarized as follows:
(1) Across all four conditions, the dovetail tee manifests a considerable transitional impact in contrast to the conventional vertical-walled tee. This transition effect holds the potential to mitigate or eradicate head loss attributed to eddy currents, thereby diminishing overall energy consumption. Under identical working conditions, the static pressure differential between the inlet and outlet of the dovetail tee is notably lower than that of the T-type tee, registering a reduction of 52.52% in the case of merging working conditions. Consequently, this yields a more uniform fluid velocity distribution within the pipeline, concurrently mitigating local friction resistance by diminishing fluid velocity in proximity to discrete components.
(2) In the diverse operational scenarios characterizing liquefied natural gas (LNG) pipelines, the dovetail tees exhibit a distinct advantage in terms of local drag coefficients compared to their T-type counterparts. Precisely, the local resistance coefficient of the T-type tee exceeds that of the dovetail tee by approximately 2.79 ± 0.2 times in the scenario of shunt flow. In the case of shunt single-pipe flow, the local resistance coefficient of the T-type tee is roughly 5.36 ± 0.51 times higher than that of the dovetail tee. For merge flow, the local resistance coefficient of the T-type tee is approximately 10.22 ± 1.15 times greater than that of the dovetail tee. In the context of merge single-pipe flow, the local resistance coefficient of the T-type tee is about 5.72 ± 0.92 times higher than that of the dovetail tee.
(3) Following the implemented alterations, the disparity in pipeline elevation between the LNG storage tank and the submersible pump was diminished to 1.18 meters, signifying a notable 25.32% reduction in comparison to the antecedent, pre-modification period. Specifically, the alteration in the tee geometry contributed to a noteworthy 17.58% decrease in the requisite height differential.
Acknowledgments
This work is finically supported by the Academic Degrees & Graduate Education Reform Project of Henan Province (No. 2023SJGLX121Y).
References
- Sharma, A.; Jakhete, A.; Sharma, A.; Joshi, J.B.; Pareek, V. Lowering greenhouse gas (GHG) emissions: techno-economic analysis of biomass conversion to biofuels and value-added chemicals. Greenhouse Gases: Science and Technology 2019, 9, 454–473. [Google Scholar] [CrossRef]
- Van Den Broek, M.; Berghout, N.; Rubin, E.S. The potential of renewables versus natural gas with CO2 capture and storage for power generation under CO2 constraints. Renewable and Sustainable Energy Reviews 2015, 49, 1296–1322. [Google Scholar] [CrossRef]
- Delgado, O.; Muncrief, R. Assessment of heavy-duty natural gas vehicle emissions: implications and policy recommendations. 2015.
- Smajla, I.; Karasalihović Sedlar, D.; Drljača, B.; Jukić, L. Fuel switch to LNG in heavy truck traffic. Energies 2019, 12, 515. [Google Scholar] [CrossRef]
- Dobrota, Đ.; Lalić, B.; Komar, I. Problem of boil-off in LNG supply chain. Transactions on maritime science 2013, 2, 91–100. [Google Scholar] [CrossRef]
- Thiaucourt, J.; Marty, P.; Hetet, J.-F. Impact of natural gas quality on engine performances during a voyage using a thermodynamic fuel system model. Energy 2020, 197, 117250. [Google Scholar] [CrossRef]
- Sharafian, A.; Talebian, H.; Blomerus, P.; Herrera, O.; Mérida, W. A review of liquefied natural gas refueling station designs. Renewable and Sustainable Energy Reviews 2017, 69, 503–513. [Google Scholar] [CrossRef]
- Bp, B. Statistical review of world energy 2022. 2023.
- Chen, Q.-S.; Wegrzyn, J.; Prasad, V. Analysis of temperature and pressure changes in liquefied natural gas (LNG) cryogenic tanks. Cryogenics 2004, 44, 701–709. [Google Scholar] [CrossRef]
- Miana, M.; Legorburo, R.; Díez, D.; Hwang, Y.H. Calculation of boil-off rate of liquefied natural gas in mark III tanks of ship carriers by numerical analysis. Applied Thermal Engineering 2016, 93, 279–296. [Google Scholar] [CrossRef]
- Holden, D. Liquefied natural gas (LNG) bunkering study; 2014.
- Hailer, J.T. LNG Station Analysis for the Prediction of Pressure Rise and Vented Emissions; West Virginia University: 2015.
- Powars, C. Best Practices to Avoid LNG Fueling Station Venting Losses. Brookhaven National Laboratory: San Jose, CA, USA 2010.
- Costa, N.; Maia, R.; Proenca, M.; Pinho, F. Edge effects on the flow characteristics in a 90 deg tee junction. 2006. [CrossRef]
- Rahmeyer, W.J. Pressure loss data for PVC pipe tees. ASHRAE Transactions 2003, 109, 252. [Google Scholar]
- Rahmeyer, W.J.; Dent, P. Pressure loss data for large pipe tees. ASHRAE Transactions 2002, 108, 376. [Google Scholar]
- Hirota, M.; Nakayama, H.; Koide, S.; Takeuchi, I. Experimental study on turbulent flow and mixing in counter-flow type T-junction. Journal of Thermal Science and Technology 2008, 3, 147–158. [Google Scholar] [CrossRef]
- García, J.P.; Rojas, E.S.; Viedma, A. IDENTIFICACIÓN DEL ORIGEN DE LAS PÉRDIDAS ENERGÉTICAS EN EL FLUJO COMPRESIBLE EN UNIONES DE CONDUCTOS MEDIANTE SIMULACIÓN NUMÉRICA. 2009.
- Beneš, L.; Louda, P.; Kozel, K.; Keslerová, R.; Štigler, J. Numerical simulations of flow through channels with T-junction. Applied Mathematics and Computation 2013, 219, 7225–7235. [Google Scholar] [CrossRef]
- Abdulwahhab, M.; Injeti, N.K.; Dakhil, S.F. Numerical prediction of pressure loss of fluid in a T-junction. International journal of energy and environment 2013, 4, 253–264. [Google Scholar]
- Merzari, E.; Pointer, W.; Fischer, P. Numerical simulation and proper orthogonal decomposition of the flow in a counter-flow t-junction. Journal of fluids engineering 2013, 135, 091304. [Google Scholar] [CrossRef]
- Miranda, A.I.; Oliveira, P.J.; Pinho, F. Steady and unsteady laminar flows of Newtonian and generalized Newtonian fluids in a planar T-junction. International journal for numerical methods in fluids 2008, 57, 295–328. [Google Scholar] [CrossRef]
- Li, A.; Chen, X.; Chen, L.; Gao, R. Study on local drag reduction effects of wedge-shaped components in elbow and T-junction close-coupled pipes. In Proceedings of the Building Simulation; 2014; pp. 175–184. [Google Scholar]
- Chen, J.; Lü, H.; Shi, X.; Zhu, D.; Wang, W. Numerical simulation and experimental study on hydrodynamic characteristics of T-type pipes. Transactions of the Chinese Society of Agricultural Engineering 2012, 28, 73–77. [Google Scholar]
- Bluestein, A.M.; Venters, R.; Bohl, D.; Helenbrook, B.T.; Ahmadi, G. Turbulent flow through a ducted elbow and plugged tee geometry: An experimental and numerical study. Journal of Fluids Engineering 2019, 141, 081101. [Google Scholar] [CrossRef]
Figure 1.
Model diagram of two types of tees:(a) T-type tee (b) dovetail tee.
Figure 1.
Model diagram of two types of tees:(a) T-type tee (b) dovetail tee.
Figure 2.
Meshes of two types of tees:(a) T-type tee (b) dovetail tee.
Figure 2.
Meshes of two types of tees:(a) T-type tee (b) dovetail tee.
Figure 14.
A static pressure cloud diagram of a T-type tee in operating condition 1.
Figure 14.
A static pressure cloud diagram of a T-type tee in operating condition 1.
Figure 15.
A speed cloud diagram of a T-type tee in operating condition 1.
Figure 15.
A speed cloud diagram of a T-type tee in operating condition 1.
Figure 16.
A static pressure cloud diagram of a dovetail tee in operating condition 5.
Figure 16.
A static pressure cloud diagram of a dovetail tee in operating condition 5.
Figure 17.
A speed cloud diagram of a dovetail tee in operating condition 5.
Figure 17.
A speed cloud diagram of a dovetail tee in operating condition 5.
Figure 19.
A static pressure cloud diagram of a tee in operating condition 2.
Figure 19.
A static pressure cloud diagram of a tee in operating condition 2.
Figure 20.
A speed cloud diagram of a T-type tee in operating condition 2.
Figure 20.
A speed cloud diagram of a T-type tee in operating condition 2.
Figure 21.
A static pressure cloud diagram of a dovetail tee in operating condition 6.
Figure 21.
A static pressure cloud diagram of a dovetail tee in operating condition 6.
Figure 22.
A speed cloud diagram of a dovetail tee in operating condition 6.
Figure 22.
A speed cloud diagram of a dovetail tee in operating condition 6.
Figure 23.
A static pressure cloud diagram of a T-type tee in operating condition 3.
Figure 23.
A static pressure cloud diagram of a T-type tee in operating condition 3.
Figure 24.
A speed cloud diagram of a T-type tee in operating condition 3.
Figure 24.
A speed cloud diagram of a T-type tee in operating condition 3.
Figure 25.
A static pressure cloud diagram of a dovetail tee in operating condition 7.
Figure 25.
A static pressure cloud diagram of a dovetail tee in operating condition 7.
Figure 26.
A speed cloud diagram of a dovetail tee in operating condition 7.
Figure 26.
A speed cloud diagram of a dovetail tee in operating condition 7.
Figure 27.
A static pressure cloud diagram of a T-type tee in operating condition 4.
Figure 27.
A static pressure cloud diagram of a T-type tee in operating condition 4.
Figure 28.
A speed cloud diagram of a T-type tee in operating condition 4.
Figure 28.
A speed cloud diagram of a T-type tee in operating condition 4.
Figure 29.
A static pressure cloud diagram of a dovetail tee in operating condition 8.
Figure 29.
A static pressure cloud diagram of a dovetail tee in operating condition 8.
Figure 30.
A speed cloud diagram of a dovetail tee in operating condition 8.
Figure 30.
A speed cloud diagram of a dovetail tee in operating condition 8.
Figure 31.
Comparison of Working Condition 1.
Figure 31.
Comparison of Working Condition 1.
Figure 32.
Comparison of Working Condition 2.
Figure 32.
Comparison of Working Condition 2.
Figure 33.
Comparison of Working Condition 3.
Figure 33.
Comparison of Working Condition 3.
Figure 34.
Comparison of Working Condition 4.
Figure 34.
Comparison of Working Condition 4.
Figure 35.
Simplified diagram of hydraulic analysis of the pipeline.
Figure 35.
Simplified diagram of hydraulic analysis of the pipeline.
Figure 36.
Routing diagram of the original pipeline.
Figure 36.
Routing diagram of the original pipeline.
Figure 37.
Routing diagram of the modified pipeline.
Figure 37.
Routing diagram of the modified pipeline.
Table 1.
Operating conditions distribution of T-type tee.
Table 2.
Differential static pressure between pipe inlet and outlet.
Table 2.
Differential static pressure between pipe inlet and outlet.
| Condition |
1 |
2 |
3 |
4 |
5 |
6 |
7 |
8 |
| Static pressure difference |
352 |
781.8 |
1176.62 |
185.5 |
233.5 |
370.4 |
593.9 |
112.89 |
Table 3.
Operating conditions distribution of original pipeline.
Table 4.
Resistance calculation before modification.
Table 4.
Resistance calculation before modification.
| Condition |
pipeline |
L(m) |
M(Kg/min) |
v (m/s) |
| Condition a |
0-2 |
6 |
45 |
0.87 |
| |
1-2 |
4.75 |
45 |
0.87 |
| |
2-3 |
3.6 |
90 |
1.74 |
| |
3-4 |
1.36 |
45 |
0.87 |
| |
3-5 |
0.8 |
45 |
0.87 |
| Condition b |
0-2 |
6 |
22.5 |
0.44 |
| |
1-2 |
4.75 |
22.5 |
0.44 |
| |
2-5 |
4.4 |
45 |
0.87 |
| Condition c |
0-2 |
6 |
22.5 |
0.44 |
| |
1-2 |
4.75 |
22.5 |
0.44 |
| |
2-4 |
4.96 |
45 |
0.87 |
| Condition d |
1-3 |
8.35 |
90 |
1.74 |
| |
3-4 |
1.36 |
45 |
0.87 |
| |
3-5 |
0.8 |
45 |
0.87 |
| Condition e |
1-5 |
9.15 |
45 |
0.87 |
| Condition f |
1-4 |
9.71 |
45 |
0.87 |
Table 5.
Resistance calculation before modification.
Table 5.
Resistance calculation before modification.
| Condition |
a |
b |
c |
d |
e |
f |
|
(m) |
1.17 |
0.56 |
0.57 |
2.58 |
0.91 |
0.92 |
Table 6.
Resistance calculation after modification.
Table 6.
Resistance calculation after modification.
| Condition |
a |
b |
c |
d |
e |
f |
|
(m) |
0.99 |
0.48 |
0.5 |
2.18 |
0.78 |
0.8 |
|
Disclaimer/Publisher’s Note: The statements, opinions and data contained in all publications are solely those of the individual author(s) and contributor(s) and not of MDPI and/or the editor(s). MDPI and/or the editor(s) disclaim responsibility for any injury to people or property resulting from any ideas, methods, instructions or products referred to in the content. |
© 2024 by the authors. Licensee MDPI, Basel, Switzerland. This article is an open access article distributed under the terms and conditions of the Creative Commons Attribution (CC BY) license (http://creativecommons.org/licenses/by/4.0/).
