Preprint
Article

Optimal Mesh Pore-Size Combined with a Periodic Air Mass Load for the Fouling Control in Self-Forming Dynamic Membrane BioReactor (SFD MBR) for a Sustainable Treatment of a Real Municipal Wastewater

Altmetrics

Downloads

87

Views

56

Comments

0

A peer-reviewed article of this preprint also exists.

Submitted:

11 January 2024

Posted:

12 January 2024

You are already at the latest version

Alerts
Abstract
The Self-Forming Dynamic Membrane BioReactor (SFD MBR) is a cost-effective alternative to conventional MBR, where the synthetic membrane is replaced by the “cake layer”, an accumulation of the biological suspension over a surface of inert low-cost support, caused by a suction force. Under optimized conditions, the cake layer reveals easy to remove and quick to form again, resulting a “dynamic membrane”. The permeate of SFD MBR has chemo-physical characteristics comparable to those of conventional MBR. In this paper, two nylon meshes with a pore-size of 20 and 50 µm respectively were tested in a bench scale SFD MBR where a periodic air mass load (AML) was supplied tangential to the filtration surface to maintain filtration effectiveness. The SFD MBR equipped with the 20 µm nylon mesh coupled to 5 min of AML every 4 hours showed the best performance both ensuring a permeate with turbidity values always below 3 NTU and revealing no critical fouling. A benchmark test, conducted in the same experimental time, with identical operating conditions, and the only difference of a suction break (relaxation) instead of the AML. This latter test produced a permeate of very good quality, but it needed frequent mesh cleanings, showing that a periodic AML coupled with the use of a 20 µm mesh can be a good strategy for long term operation of SFD MBR.
Keywords: 
Subject: Environmental and Earth Sciences  -   Water Science and Technology

1. Introduction

The Membrane BioReactor (MBR) is an established technology for the treatment and reuse of domestic and industrial wastewater [1]–[3]. They are based on solid/liquid activated sludge separation through synthetic membranes made of different materials and operated by positive or negative (suction) force. The membrane filtration range for MBR includes micro- and ultra-filtration [4]. In MBR, the role of membranes is to separate the supernatant from the suspended solids, and this may be obtained adopting mainly two possible configurations: i) membranes submerged in the bioreactor (submerged-MBR), ii) membranes immersed in the secondary clarifier or in another separate vessel (sidestream-MBR). The MBR technology offers different advantages with respect to the conventional activated sludge (CAS) systems, including a significantly reduced footprint. This is mostly due to the possibility of operating the system with higher concentrations of suspended solids of the mixed liquor (MLSS) and to the absence of a secondary clarifier. Submerged MBR allows the adsorption, biodegradation and membrane separation in the same biological tank [5]. Moreover, wastewater treatment plants (WWTP) based on the MBR technology usually produce permeates of excellent quality with very low levels of total suspended solids (TSS), turbidity, chemical oxygen demand (COD), biological oxygen demand (BOD) and pathogens [6]. In specific situations, MBR can be coupled or integrated to other technologies to ameliorate the wastewater treatment performance [7], [8].
Nevertheless, a limitation to the application of MBR is the occurrence of membrane fouling and pore clogging which deteriorate the system’s performance, require maintenance efforts, and may shorten service life. Both phenomena are detectable by monitoring the resistance to filtration opposed by the materials that tend to accumulate over the membrane surface or into the membrane structure, called transmembrane pressure (TMP) [9]: when the TMP (in absolute values) rapidly increases, the membrane is fouling/clogging, leading to a decrease in permeate flux. The mechanisms of fouling are: i) adsorption of soluble microbial products (SMP) and extracellular polymeric substances (EPS), colloids and other particles into/on the membranes; ii) deposition of sludge flocs on the membrane surface with consequent formation of a “cake” layer on the membrane surface; iii) changes in membrane and/or mixed liquor composition during long-term operation (e.g., change of bacterial community and biopolymer components in the cake layer, degradation of membrane composition) [10].
Periodic maintenance of MBR systems is often accomplished either by backwashing the membranes, i.e. reversing the permeate flow, or by relaxation from suction, which simply involves stopping permeate extraction for a defined time interval. These techniques do not influence the ordinary functionality of the bioreactor, they are conventionally incorporated into most MBR designs as standard operational strategies for fouling control, and normally do not require chemical reagents without any risk of membrane degradation/damage [11], [12].
When TMP thresholds determining significant and critical reductions of flux are passed despite the periodic maintenance, the membrane needs to be removed from the biological tank to be cleaned [13]–[15]. For MBR treating municipal wastewater, a water jet-rinsing is ordinarily enough to remove the pore clogging and excess sludge accumulation, and to recover the initial set flux. If the flux is not recovered due to a deep fouling of membrane pores, a chemical treatment is needed [16]. On the contrary, when the TMP does not tend to increase and the quality of permeate decreases, the integrity of membranes should be tested, with a possible (partial or complete) replacement of them [17]. This may imply a relevant burden in terms of investment cost.
In the last decade, the Self-Forming Dynamic Membrane BioReactors (SFD MBR) were developed as a cost-effective alternative to conventional UF-based MBR, and its applications in the wastewater treatment have been studied [18], [19]. The SFD MBR is a particular MBR where inert materials (meshes, nets) with a medium-large pore-size (in the range of 10-500 µm) are used as support for the formation of cake layers, these becoming the real biological membrane [20]. Different studies revealed that the main chemical and physical characteristics of the SFD MBR permeate can have similar values of those of conventional MBR, apart from the microbiological quality indicators, so still needing a post-disinfection step, especially in the case of effluent reuse. The main advantage of SFD MBR with respect to the classical MBR is that chemical or other deep cleaning procedures are rarely used, because the medium-large pore-size support media are less exposed to critical clogging than the UF membranes used in MBR, and a physical cleaning is usually enough to remove the cake layer from the support surface. In conventional MBR, the gel layers that may develop over the long term can clog the membrane pores [21]. To solve this, the modules are submitted to chemical treatment for the oxidation and removal of sticky and colloidal substances that pass inside the small pores. In SFD MBR, the control and limitation of the clogging gel layer is easier due to the larger pore-size, and often the physical methods, such as water jet-rinsing, surface air sparging, permeate backwash, flux relaxation, reveal efficient [22]. Afterwards, the filtration system can soon be restored, so that the biological membrane can form again. The easy removing and then reforming of the biological membrane explain the reason why it is also called “dynamic membrane” (DM) [23].
In a green economy context, the SFD MBR candidates as a lower pollutant and energy saving technology, because no chemicals are used for cleaning, and lower pressure is required for filtration (also achievable by gravity) with respect to conventional UF-based MBR.
In a previous paper, Salerno and co-authors showed the effectiveness of SFD MBR for the treatment of municipal wastewater and with limited maintenance needs, in tests with low sludge retention time (SRT) [22]. The purpose of the present paper is to evaluate the performance of a bench scale SFD MBR treating real municipal sewage with a medium-high SRT of 30 days and having supporting media with two different pore-sizes, and with a maintenance strategy based on periodic air mass load (AML, large bubbles causing turbulence at the filtration surface) [22]. In the first experiment, called test A, a 50 µm nylon mesh was used as support material for the development of SFDM with a periodic cleaning of the mesh with high air mass flowrate in short time. The second test, named test B, was identical to the first but using a 20 µm nylon mesh. The results of tests A and B were compared to those of a benchmark test, called test C, having the same conditions and mesh of test B, but a different maintenance strategy based on periodic relaxation from permeate suction. Finally, the best performance, both in terms of permeate quality and support cleaning requirements, was shown by test B (20 µm SFD MBR coupled to an AML of five minutes every four hours).

2. Materials and Methods

All SFD MBR bench scale plants, whose features are summarized in Table 1, were operated at room temperature, continuously aerated, and under the same operating conditions, except for the pore-size of the support mesh and the strategy of the periodic maintenance.
In the bench scale SFD MBR, two filtration modules were positioned vertically and face-to-face, distant about 3 cm from one another, and every single module had a 6 x 6 cm filtration surface, for a total surface of 72 cm2. Aeration was provided in the reactors by four external air pumps (M2K3, Schego, Germany), respectively connected to four fine-bubbles diffusers placed on the reactor bottom. The pumped air also ensured the necessary mixing of sludge to achieve a correct homogeneity of the suspended biomass. For every test, permeate suction was ensured by a peristaltic pump connected to the filtration modules with a set flowrate of 12.6 L d-1. The TMP was measured by an analogic manometer placed between the dynamic membrane and the suction pump and recorded at least every hour between 09 am and 5 pm from Monday to Friday. In the test A, a support nylon mesh with a pore size of 50 µm was used, while a 20 µm nylon mesh was employed in tests B and C. When the TMP overcame the threshold of -200 mbar the modules were temporarily removed from the bioreactor, washed by tap water jet-rinsing, and finally reassembled to restart. As summarized in Table 1, all systems had a periodic four hours cycle consisting in 229 min of suction and 11 min of no-suction. In tests A and B, the no-suction time was organized as follows: 3 min of simple suction break, 5 min of AML with an air flowrate of 42.0 Lair min-1 tangentially to the filtering surfaces (still without any permeate suction), and other 3 min of suction break, as described by Salerno and colleagues [22]. In Test C, the whole 11 min period was in simple no-suction mode, called relaxation. The bioreactor’s operating volume was maintained constant through a level control switch connected to the feed pump. The latter was turned on as the level control detected a decrease of reactor’s operating volume, and it was turned off when the volume had been restored. The general scheme for all plants is illustrated in Figure 1.
The real pre-settled municipal wastewater was collected twice per week from a local treatment plant, characterized, diluted to the target value of 460 mgCOD L-1, and finally given as feed to the SFDMBR. Table 2 shows the average characteristics of the feed.
Both the feeding wastewater and the produced permeates were characterized twice per week in terms of suspended solids (SS), chemical oxygen demand (COD), total nitrogen (TN), ammonium, nitrite, and nitrate according to Standard Methods [24]. Electrical conductivity and pH were measured with an InnoLab® Multi 9420 IDS (WTW, Weilheim, Germany), while permeate turbidity was determined by a 2100P turbidimeter (HACH, Loveland, CO, USA). The activated sludge was characterized in the same days of feed and permeate: The mixed liquor suspended solids (MLSS) and the sludge volume index at 30 minutes (SVI30) of the SFD MBR activated sludge were measured according to Standard Methods [24]. Conventionally, the SVI30 is an evaluation test of sludge settling capacity [25]. A phase contrast microscope BX50 (Olympus, Japan) was used to evaluate the morphological characteristics of the activated sludge.

3. Results

3.1. Activated sludge characteristics

The activated sludge features during the three tests are displayed in Table 3.
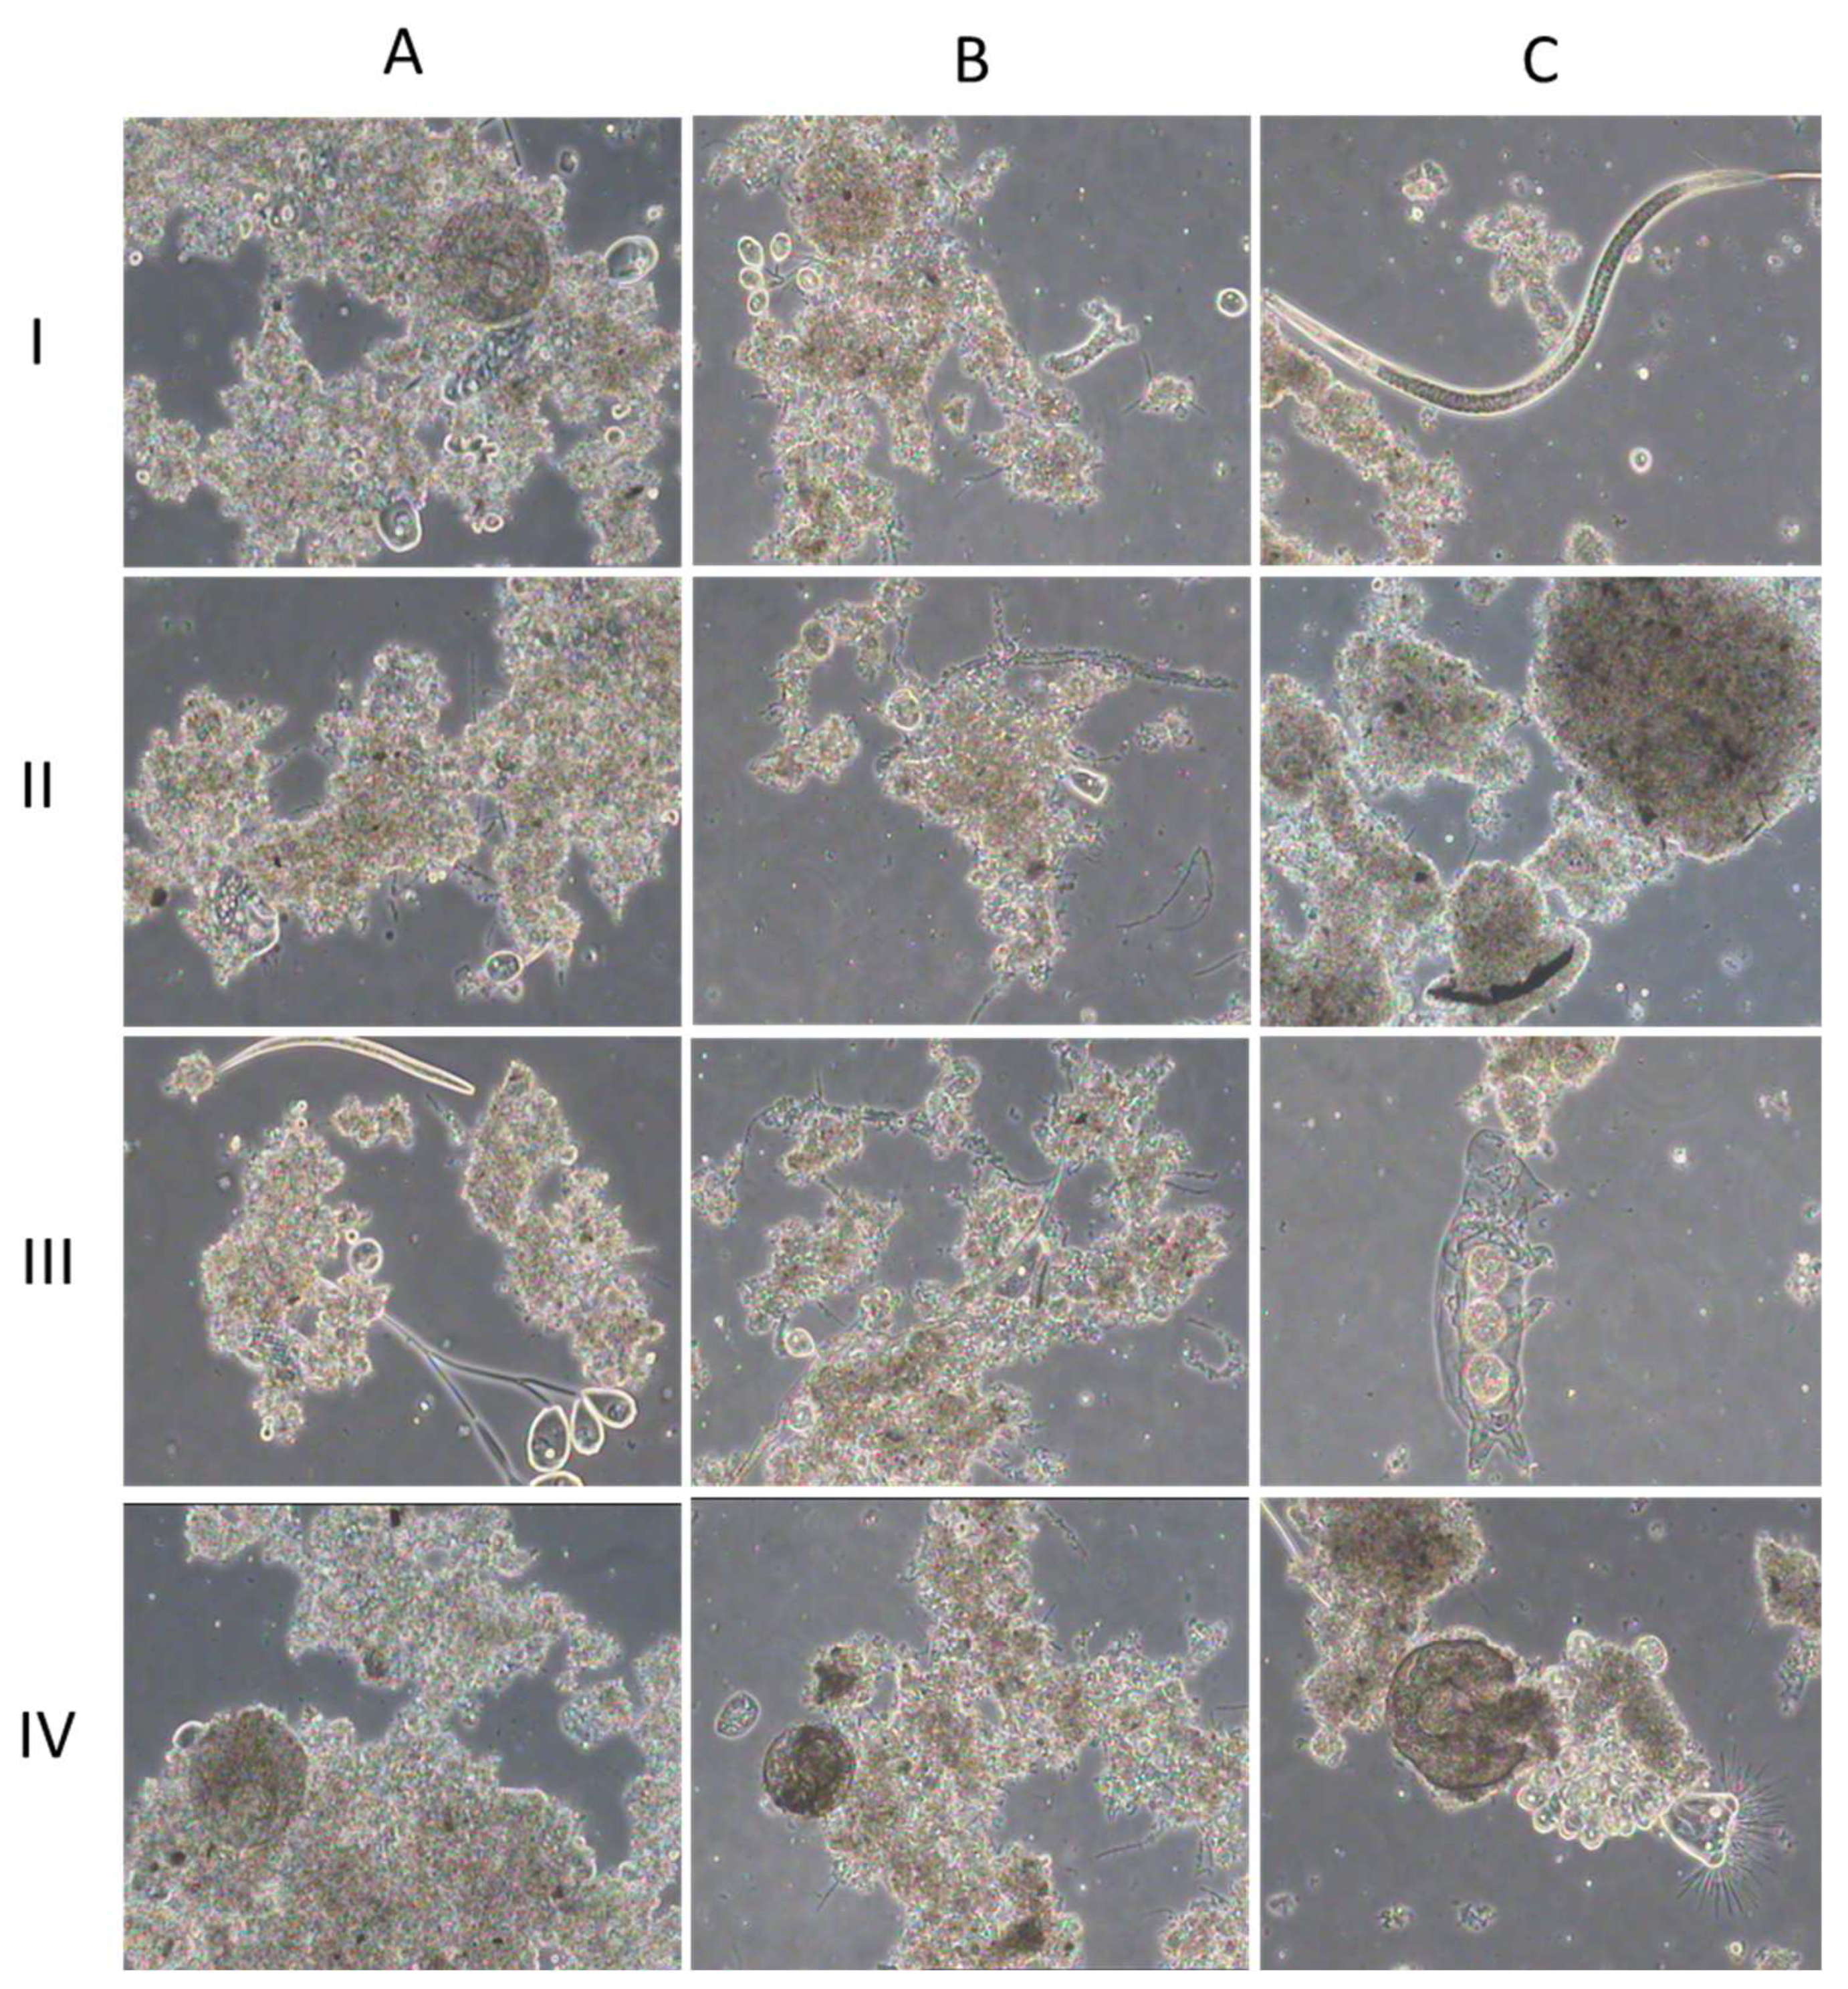
Generally, all the SFD MBR tests had an average concentration of mixed liquor suspended solids (MLSS) always between 3 and 4.5 g L-1 with about 90% volatile suspended solids (MLVSS). The SVI30 values of the tests never approached the threshold of 150 mL g-1, after which bulking generally occurs [26]. The pumped oxygen ensured aerobic conditions in all experiments achieving dissolved oxygen (DO) values always well above 3 mg L-1, and the redox potential (ORP) and pH average values were always around 300 mV and 7.0, respectively. Some pictures of fresh activated sludge taken by phase contrast microscope at 100x magnification and related to four different moments for each test are shown in Figure 2.

3.2. Performances of the SFD MBR tests

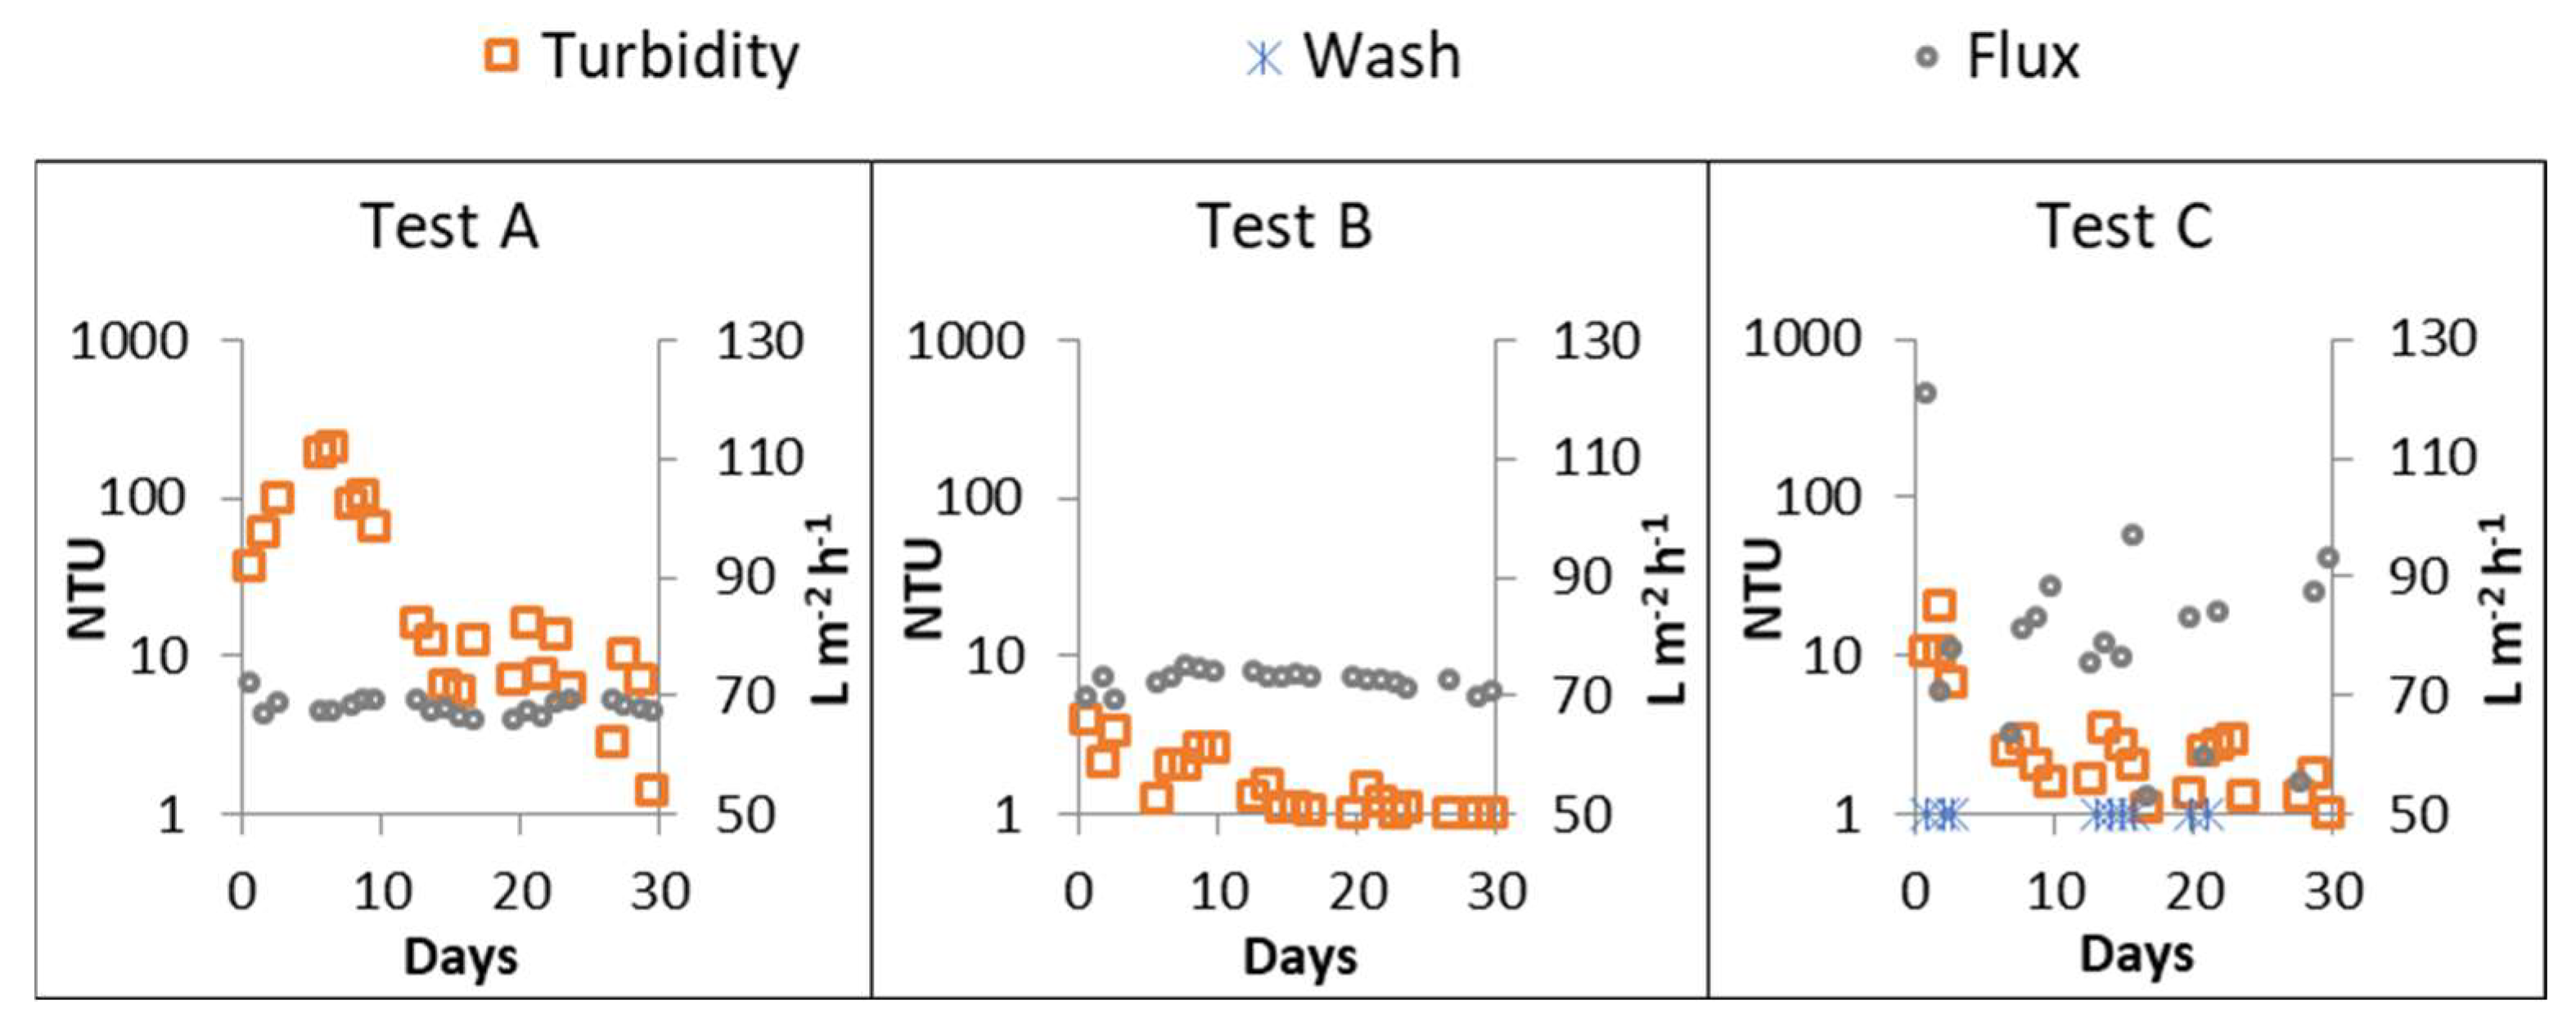
Figure 3 shows the permeate turbidity, the flux trends and the wash events for every test.
Tests A and B maintained the set flux over time, while test C revealed more problematic and the flux was more heavily affected by the filtration efficiency. Indeed, the higher frequency of TMP increase observed in test C caused a decrease of permeate flux and was only temporarily solved with module washing. On the contrary, in tests A and B the TMP did not tend to increase over time, and consequently no module washing was required. Moreover, test C showed some fluctuations of the permeate turbidity, but still with an average value of around 5 NTU. Test B always produced an effluent with turbidity values even below 3 NTU. Generally, when the mesh with 20 µm pore size was adopted (test B and C) the permeate turbidity was consistently under 10 NTU. On the contrary, in test A (equipped with a 50 µm mesh), the permeate turbidity was always higher than 50 NTU during the first 10 days (with a peak of 211 NTU), decreased to lower values around 10 NTU in the following 20 days, and reached values below 5 NTU towards the end of test. In Table 4 the main quality parameters of the three permeates are compared. The total coliforms and Escherichia coli contents in all permeates shows median, minimum and maximum values between 4 and 5 Log, and between 3 and 5 Log respectively.

4. Discussion

4.1. Activated sludge characteristics

The characteristics of activated sludges were evaluated applying the microscopy methods indicated by Jenkins and colleagues [27]. Generally, the phase contrast microscopy revealed very similar morphological features among the three activated sludges. Particularly, all three bioreactors had an average floc size in the range 150-500 µm. Moreover, in all cases the flocs appeared irregular but compact, with the presence of eukaryotic organisms typical of activated sludge (e.g., both swimming and stalked ciliates, nematodes, tardigrades, or rotifers). The ratio bacterial filaments/floc was monitored too, always resulting in the range 2-5, as normally expected. The whole of these observations indicated that all sludges had a general state of good health.
The relatively lower DO concentration of test B (still well above the normal threshold recommended for aerobic activated sludge bioreactors) with respect to the other two tests can be the result of the higher average MLSS concentration observed, considering that all three plants had the same air flowrates. The SVI30 revealed a higher settling capacity of the sludge of test C, followed by those of test A and test B. More, the SVI30 average value of test B was twice with respect to the one of test C, while the average value of test A was more or less at the halfway, highlighting some differences in the physical properties of the three sludges. Figure 3 showed that test C faced several stops for mesh cleaning with the removal from mesh, recovery and re-entry of the sludge cake in the suspended activated sludge. This may have affected the sludge settling ability. Similarly, in the same Figure 3, test A showed a loss of part of the suspended biomass in the permeate during the first weeks, maybe influencing the sludge settling. The SVI30 can also give indications about the possible bulking phenomenon due to the presence of filamentous bacteria, about the sludge density, and the about presence of sticky substances in the supernatant of mixed liquor [28]–[30]. Nevertheless, the bulking threshold was not exceeded in any test, and the physiological features of all three sludges appeared similar, as already described above. Therefore, some further functional investigations about the effects of activated sludge imbalances or disturbances on settling ability, such as those shown in the described tests, are suggested for future research.

4.2. Permeate quality in the different SFD MBR tests

The 20 µm SFD MBR tests produced permeates with very low turbidity values (Figure 3). Besides turbidity, the lower quality of the permeate of test A (50 µm) was confirmed also by other parameters: the lower solid retention was clearly revealed by the TSS average one order of magnitude higher with respect to tests B and C, but also by the COD and TN average values, three and two times higher than the other two tests, respectively. This suggests that under the applied operating conditions the 50 µm mesh had a lower efficiency in supporting the cake layer than the 20 µm mesh, as shown in the other two tests. The aerobic conditions ensured very good nitrification for all SFD MBR, considering the average values of ammonium, nitrite and nitrate in the permeates. The average ammonium value in the permeate of test A is affected by a high punctual value of 6.6 mgN L-1 on day 7, when also a peak of solids in the permeate was detected. In the rest of test A, the ammonium measured in the permeate was always less than 1 mgN L-1. In terms of nitrite content, the permeate of test C had an average value of nitrite equal to 1.6 mgN L-1, while in the applied aerobic conditions it was expected to be almost null (Table 3). This could be explained by the low MLVSS concentration, that represents an estimate of the active bacterial content [31], and the relatively high concentration of ammonium in the feeding wastewater (Table 2). These suggest that nitritation may have tended to its maximum rate, which is higher than the maximum nitrosation rate, leading to a slight residual nitrite accumulation [32].
The total coliforms and E.coli assays in the SFD MBR permeates showed the relative independence of these microbiological indicators from the physical determinations such as turbidity and TSS of permeates, confirming the need of further disinfection steps of the SFD MBR permeates in case of reuse. In this sense, the use of already tested on-demand UV disinfection systems could be recommended [3]. As a possible alternative, the direct exposition to solar light could represent an easy and green solution [33].

4.3. Effects of the mesh pore size and the AML on SFD MBR performances

The pore-size of the support material plays a relevant role during the initial formation phase of dynamic membranes and after cleaning of the support itself [34], and a larger pore-size of the support material can cause a significant loss of biomass in the early phase of cake formation [35]. Cai and colleagues [35] demonstrated that before the formation of the dynamic membrane (DM), the turbidity at 50 µm could be higher than 250 NTU, similarly to the turbidity peak of the test A (50 µm) described here. Adopting two other meshes of 25 and 10 µm pore-size, the same authors obtained turbidity values lower than 40 and 10 NTU, respectively. Nevertheless, once the SFDM is formed and stable operations are achieved, no correlation between the pore-size of the support material and the quality of the permeate is observed. Saleem and coworkers [36] reported that using the 50 µm pore-size support nets, although contributed to improving the SFDM effluent quality in terms of turbidity values with respect to the 200 µm, accelerated the mesh fouling resulting in a faster TMP increase, and therefore in more frequent cleanings. Another study from Sreeda and coworkers [37] reported that the pore-size of the support medium did not affect the formation of the SFDM, and that the bacterial composition of a SFDM grown on a support with pore-size of 2 mm was similar to the one observed on other much smaller pore-size nets. In a previous work from Chuang and colleagues [38], the use of a 14 µm support material lead to a supernatant with more than 95% of particles between 0.2 and 6.4 µm in size, and large particles (>10 µm) accounted for less than 1%. Nevertheless, some particles accumulated inside the pores and caused clogging.
There are different possible approaches to mesh cleaning, in order to resume the filtration performance. As previously described, the water jet-rinsing proved to be effective when the sludge is sufficiently dense and in “good health” (i.e. not subject to stress conditions due to feed or operation). Nevertheless, the physical mesh cleaning usually has temporary effects on the system’s filtration performance, with losses of suspended solids through the mesh and a decrease in overall effluent quality during the transient phase of new DM formation [23]. When the activated sludge faces stress, it could produce bioproducts such as soluble microbial products (SMP), extracellular polymeric substances (EPS), or other classes whose colloidal characteristics could reduce the pore-size, stick on the support surface, and make physical cleaning less effective. Under these conditions, water jet-rinsing should be integrated by chemical cleaning. Weak acids, bases and oxidants are typical cleaning reagents, while metal chelating chemicals, surfactants and formulated detergents are also used [38]. Guan and colleagues [39] compared the cleaning effects of sodium dodecylsulfate (SDS), NaOH and NaClO on three identical fouled membrane modules. Their results showed that the main fouling of SFD MBR was a complex mixture of bacteria flocs and EPS, and that NaClO was the best performing reagent for SFD MBR chemical cleaning in terms of TMP, flux recovery and total resistance reduction, successfully oxidizing both EPS and bacteria flocs. The authors also found that SDS and NaOH were effective in removing EPS, but they were not effective in removing mixed fouling, as well as β-polysaccharides.
The use of air sparging for the mesh cleaning is well known in the literature [20]. However, a quick, intense and periodic air mass load for mesh cleaning coupled to the more appropriate pore-size to achieve a combination for a very performant SFDMBR has not been deeply investigated yet. The results of the present research have shown that the SFD MBR having mesh supports with 50 µm and 20 µm pore-size operated under the same operating conditions, including a stable working flux of more than 70 L m-2 h-1, had different permeate quality trends since the first days. This can be attributed to the speed of sludge cake formation and DM development. In particular, the 20 µm mesh demonstrated more efficient in rapid DM build-up, with consequent production of permeates with turbidity always lower than 3 NTU. A second important finding was the demonstration that a periodic air mass load with a flowrate of 42.0 Lair min-1 for 5 minutes every 4 hours allowed to achieve and keep the stability of the system with no need of washing on-site the mesh support. Test B was compared to the benchmark (test C) and confirmed the effectiveness of the combination 20 µm/AML with respect to conventional maintenance strategy based on simple periodic interruption of filtration (relaxation). Other studies are required to investigate the optimal air mass load flowrate and duration to achieve the best cleaning efficiency and most sustainable operation for meshes of different pore-size, in order to optimize the overall system performance.

5. Conclusions

Three SFD MBR parallel tests for the treatment of a real municipal wastewater and equipped with two different nylon meshes with 20 and 50 µm pore-sizes respectively as support for the development of a biological dynamic membrane were setup and operated. In two tests the nylon meshes had different pore-size, but both were periodically cleaned through an AML (Air Mass Load, i.e. large bubbles causing turbulence) with a flowrate of 42.0 Lair min-1 for 5 minutes every 4 hours. The third test was equipped with the 20 µm pore-size and operated with periodic interruption of filtration for mesh relaxation. The SFD MBR with the 20 µm nylon mesh revealed more efficient in the production of a high quality permeate in comparison with the larger 50 µm pores. The maintenance strategy based on an intense AML of 5 minutes every 4 hours was effective in controlling the excessive build-up of the cake layer and maintaining a relatively stable DM. On the other hand, relaxation during the maintenance breaks was not very efficient in controlling the excessive DM growth, under the experimental conditions tested. Optimization of the AML in terms of flowrate and time will require further investigation, also depending on the mesh pore-size adopted, the sludge characteristics, and the operating conditions. Nevertheless, the present results confirm the sustainability and effectiveness of the approach proposed for long term operation of SFD MBR for municipal wastewater treatment.

Author Contributions

Conceptualization, C.S.; methodology, C.S., F.C. and A.P.; software, M.T.; validation, A.D., B.H. and A.B.; formal analysis, G.B., F.C.; investigation, S.B., G.B; resources, A.P.; data curation G.B., F.C., M.T.; writing—original draft preparation, S.B. and C.S.; writing—review and editing, S.B., C.S. and A.P.; visualization, A.D., B.H., A.B.; supervision, A.P.; project administration, A.P.; funding acquisition, A.P. All authors have read and agreed to the published version of the manuscript.

Funding

This research was partially supported by the EU-India project “Pavitra Ganga”, funded by the EC with contract n. 821051, call H2020 SC5-12-2018.

Data Availability Statement

The data presented in this study are available upon request from the corresponding author.

Conflicts of Interest

The authors declare no conflict of interest.

References

  1. Friha, F. Karray, F. Feki, L. Jlaiel, e S. Sayadi, «Treatment of cosmetic industry wastewater by submerged membrane bioreactor with consideration of microbial community dynamics», Int. Biodeterior. Biodegrad., vol. 88, pp. 125–133, mar. 2014. [CrossRef]
  2. J. Hoinkis et al., «Membrane Bioreactor (MBR) Treated Domestic Wastewater for Reuse in a Recirculating Aquaculture System (RAS)», in Water-Energy-Nexus in the Ecological Transition: Natural-Based Solutions, Advanced Technologies and Best Practices for Environmental Sustainability, V. Naddeo, K.-H. Choo, e M. Ksibi, A c. di, in Advances in Science, Technology & Innovation. , Cham: Springer International Publishing, 2022, pp. 153–155. [CrossRef]
  3. P. Vergine, S. Amalfitano, C. Salerno, G. Berardi, e A. Pollice, «Reuse of ultrafiltered effluents for crop irrigation: On-site flow cytometry unveiled microbial removal patterns across a full-scale tertiary treatment», Sci. Total Environ., vol. 718, p. 137298, mag. 2020. [CrossRef]
  4. M. B. Asif et al., «Membrane Bioreactor for Wastewater Treatment: Current Status, Novel Configurations and Cost Analysis», in Cost-efficient Wastewater Treatment Technologies: Engineered Systems, M. Nasr e A. M. Negm, A c. di, in The Handbook of Environmental Chemistry. , Cham: Springer International Publishing, 2023, pp. 147–167. [CrossRef]
  5. S. J. Judd, P. Le-Clech, T. Taha, e Z. F. Cui, «Theoretical and experimental representation of a submerged membrane bio-reactor system», Membr. Technol., vol. 2001, fasc. 135, pp. 4–9, lug. 2001. [CrossRef]
  6. Y. Wu, X. Huang, X. Wen, e F. Chen, «Function of dynamic membrane in self-forming dynamic membrane coupled bioreactor», Water Sci. Technol., vol. 51, fasc. 6–7, pp. 107–114, mar. 2005. [CrossRef]
  7. L. Borea, F. Castrogiovanni, G. Ferro, S. W. Hasan, V. Belgiorno, e V. Naddeo, «Hydrogen Production in Electro Membrane Bioreactors», in Frontiers in Water-Energy-Nexus—Nature-Based Solutions, Advanced Technologies and Best Practices for Environmental Sustainability, V. Naddeo, M. Balakrishnan, e K.-H. Choo, A c. di, in Advances in Science, Technology & Innovation. Cham: Springer International Publishing, 2020, pp. 85–87. [CrossRef]
  8. Pollice et al., «Removal of nalidixic acid and its degradation products by an integrated MBR-ozonation system», J. Hazard. Mater., vol. 203–204, pp. 46–52, feb. 2012. [CrossRef]
  9. S. W. Hasan, M. Elektorowicz, e J. A. Oleszkiewicz, «Correlations between trans-membrane pressure (TMP) and sludge properties in submerged membrane electro-bioreactor (SMEBR) and conventional membrane bioreactor (MBR)», Bioresour. Technol., vol. 120, pp. 199–205, set. 2012. [CrossRef]
  10. F. Meng, S.-R. Chae, A. Drews, M. Kraume, H.-S. Shin, e F. Yang, «Recent advances in membrane bioreactors (MBRs): Membrane fouling and membrane material», Water Res., vol. 43, fasc. 6, pp. 1489–1512, apr. 2009. [CrossRef]
  11. P. Le-Clech, V. Chen, e T. A. G. Fane, «Fouling in membrane bioreactors used in wastewater treatment», J. Membr. Sci., vol. 284, fasc. 1, pp. 17–53, nov. 2006. [CrossRef]
  12. S. Judd e C. Judd, A c. di, The MBR Book (Second Edition), 2nd ed. Oxford: Butterworth-Heinemann, 2011. [CrossRef]
  13. R. W. Field e G. K. Pearce, «Critical, sustainable and threshold fluxes for membrane filtration with water industry applications», Adv. Colloid Interface Sci., vol. 164, fasc. 1, pp. 38–44, mag. 2011. [CrossRef]
  14. M. Stoller, M. Bravi, e A. Chianese, «Threshold flux measurements of a nanofiltration membrane module by critical flux data conversion», Desalination, vol. 315, pp. 142–148, apr. 2013. [CrossRef]
  15. W. Xie, J. Li, F. Sun, W. Dong, e Z. Dong, «Strategy study of critical flux/threshold flux on alleviating protein fouling of PVDF-TiO2 modified membrane», J. Environ. Chem. Eng., vol. 9, fasc. 5, p. 106148, ott. 2021. [CrossRef]
  16. C.-H. Wei, X. Huang, R. Ben Aim, K. Yamamoto, e G. Amy, «Critical flux and chemical cleaning-in-place during the long-term operation of a pilot-scale submerged membrane bioreactor for municipal wastewater treatment», Water Res., vol. 45, fasc. 2, pp. 863–871, gen. 2011. [CrossRef]
  17. R. M. Moattari, T. Mohammadi, S. Rajabzadeh, H. Dabiryan, e H. Matsuyama, «Reinforced hollow fiber membranes: A comprehensive review», J. Taiwan Inst. Chem. Eng., vol. 122, pp. 284–310, mag. 2021. [CrossRef]
  18. C. Salerno, P. Vergine, G. Berardi, e A. Pollice, «Influence of air scouring on the performance of a Self Forming Dynamic Membrane BioReactor (SFD MBR) for municipal wastewater treatment», Bioresour. Technol., vol. 223, pp. 301–306, gen. 2017. [CrossRef]
  19. P. Vergine, C. Salerno, G. Berardi, e A. Pollice, «Sludge cake and biofilm formation as valuable tools in wastewater treatment by coupling Integrated Fixed-film Activated Sludge (IFAS) with Self Forming Dynamic Membrane BioReactors (SFD-MBR)», Bioresour. Technol., vol. 268, pp. 121–127, nov. 2018. [CrossRef]
  20. M. E. Ersahin, H. Ozgun, R. K. Dereli, I. Ozturk, K. Roest, e J. B. van Lier, «A review on dynamic membrane filtration: Materials, applications and future perspectives», Bioresour. Technol., vol. 122, pp. 196–206, ott. 2012. [CrossRef]
  21. S. M. Mohan e S. Nagalakshmi, «A review on aerobic self-forming dynamic membrane bioreactor: Formation, performance, fouling and cleaning», J. Water Process Eng., vol. 37, p. 101541, ott. 2020. [CrossRef]
  22. C. Salerno, G. Berardi, B. Casale, e A. Pollice, «Comparison of fine bubble scouring, backwash, and mass air load supply for dynamic membrane maintenance and steady operation in SFD MBR for wastewater treatment», J. Water Process Eng., vol. 53, p. 103846, lug. 2023. [CrossRef]
  23. Pollice e P. Vergine, «10 - Self-forming dynamic membrane bioreactors (SFD MBR) for wastewater treatment: Principles and applications», in Current Developments in Biotechnology and Bioengineering, G. Mannina, A. Pandey, C. Larroche, H. Y. Ng, e H. H. Ngo, A c. di, Elsevier, 2020, pp. 235–258. [CrossRef]
  24. American Public Health Association (APHA), American Water Works Association (AWWA), e Water Environment Federation (WEF), Standard Methods for the Examination of Water and Wastewater, 24th ed. Washington DC: APHA Press, 2023. Consultato: 16 novembre 2023. [Online]. Disponibile su: https://www.standardmethods.org/.
  25. Y. Kim, H. Yeom, S. Choi, H. Bae, e C. Kim, «Sludge settleability detection using automated SV30 measurement and comparisons of feature extraction methods», Korean J. Chem. Eng., vol. 27, fasc. 3, pp. 886–892, mag. 2010. [CrossRef]
  26. H. Han, X. Wu, L. Ge, e J. Qiao, «A sludge volume index (SVI) model based on the multivariate local quadratic polynomial regression method», Chin. J. Chem. Eng., vol. 26, fasc. 5, pp. 1071–1077, mag. 2018. [CrossRef]
  27. D. Jenkins, M. G. Richard, e G. T. Daigger, Manual on the Causes and Control of Activated Sludge Bulking, Foaming, and Other Solids Separation Problems, 3a ed. Boca Raton: CRC Press, 2003. [CrossRef]
  28. X. Chen, F. Kong, Y. Fu, C. Si, e P. Fatehi, «Improvements on activated sludge settling and flocculation using biomass-based fly ash as activator», Sci. Rep., vol. 9, fasc. 1, Art. fasc. 1, ott. 2019. [CrossRef]
  29. R. A. Maltos, R. W. Holloway, e T. Y. Cath, «Enhancement of activated sludge wastewater treatment with hydraulic selection», Sep. Purif. Technol., vol. 250, p. 117214, nov. 2020. [CrossRef]
  30. T. Nittami e S. Batinovic, «Recent advances in understanding the ecology of the filamentous bacteria responsible for activated sludge bulking», Lett. Appl. Microbiol., vol. 75, fasc. 4, pp. 759–775, 2022. [CrossRef]
  31. M. H. Gerardi, «Appendix I: F/M, HRT, MCRT, MLVSS, Sludge Age, SVI», in Settleability Problems and Loss of Solids in the Activated Sludge Process, John Wiley & Sons, Ltd, 2002, pp. 153–156. [CrossRef]
  32. W. Zhao, X. Bi, M. Bai, e Y. Wang, «Research advances of ammonia oxidation microorganisms in wastewater: metabolic characteristics, microbial community, influencing factors and process applications», Bioprocess Biosyst. Eng., vol. 46, fasc. 5, pp. 621–633, mag. 2023. [CrossRef]
  33. M. Vivar, M. Fuentes, J. Torres, e M. J. Rodrigo, «Solar disinfection as a direct tertiary treatment of a wastewater plant using a photochemical-photovoltaic hybrid system», J. Water Process Eng., vol. 42, p. 102196, ago. 2021. [CrossRef]
  34. P. Vergine, C. Salerno, B. Casale, G. Berardi, e A. Pollice, «Role of Mesh Pore Size in Dynamic Membrane Bioreactors», Int. J. Environ. Res. Public. Health, vol. 18, fasc. 4, Art. fasc. 4, gen. 2021. [CrossRef]
  35. D. Cai, J. Huang, G. Liu, M. Li, Y. Yu, e F. Meng, «Effect of support material pore size on the filtration behavior of dynamic membrane bioreactor», Bioresour. Technol., vol. 255, pp. 359–363, mag. 2018. [CrossRef]
  36. M. Saleem, E. Masut, A. Spagni, e M. C. Lavagnolo, «Exploring dynamic membrane as an alternative for conventional membrane for the treatment of old landfill leachate», J. Environ. Manage., vol. 246, pp. 658–667, set. 2019. [CrossRef]
  37. P. Sreeda, A. B. Sathya, e V. Sivasubramanian, «Novel application of high-density polyethylene mesh as self-forming dynamic membrane integrated into a bioreactor for wastewater treatment», Environ. Technol., vol. 39, fasc. 1, pp. 51–58, gen. 2018. [CrossRef]
  38. Z. Wang, J. Ma, C. Y. Tang, K. Kimura, Q. Wang, e X. Han, «Membrane cleaning in membrane bioreactors: A review», Membr. Clean. Membr. Bioreact. Rev., vol. 468, pp. 276–307, ott. 2014. [CrossRef]
  39. D. Guan, J. Dai, M. Ahmar Siddiqui, e G. Chen, «Comparison of different chemical cleaning reagents on fouling recovery in a Self-Forming dynamic membrane bioreactor (SFDMBR)», Sep. Purif. Technol., vol. 206, pp. 158–165, nov. 2018. [CrossRef]
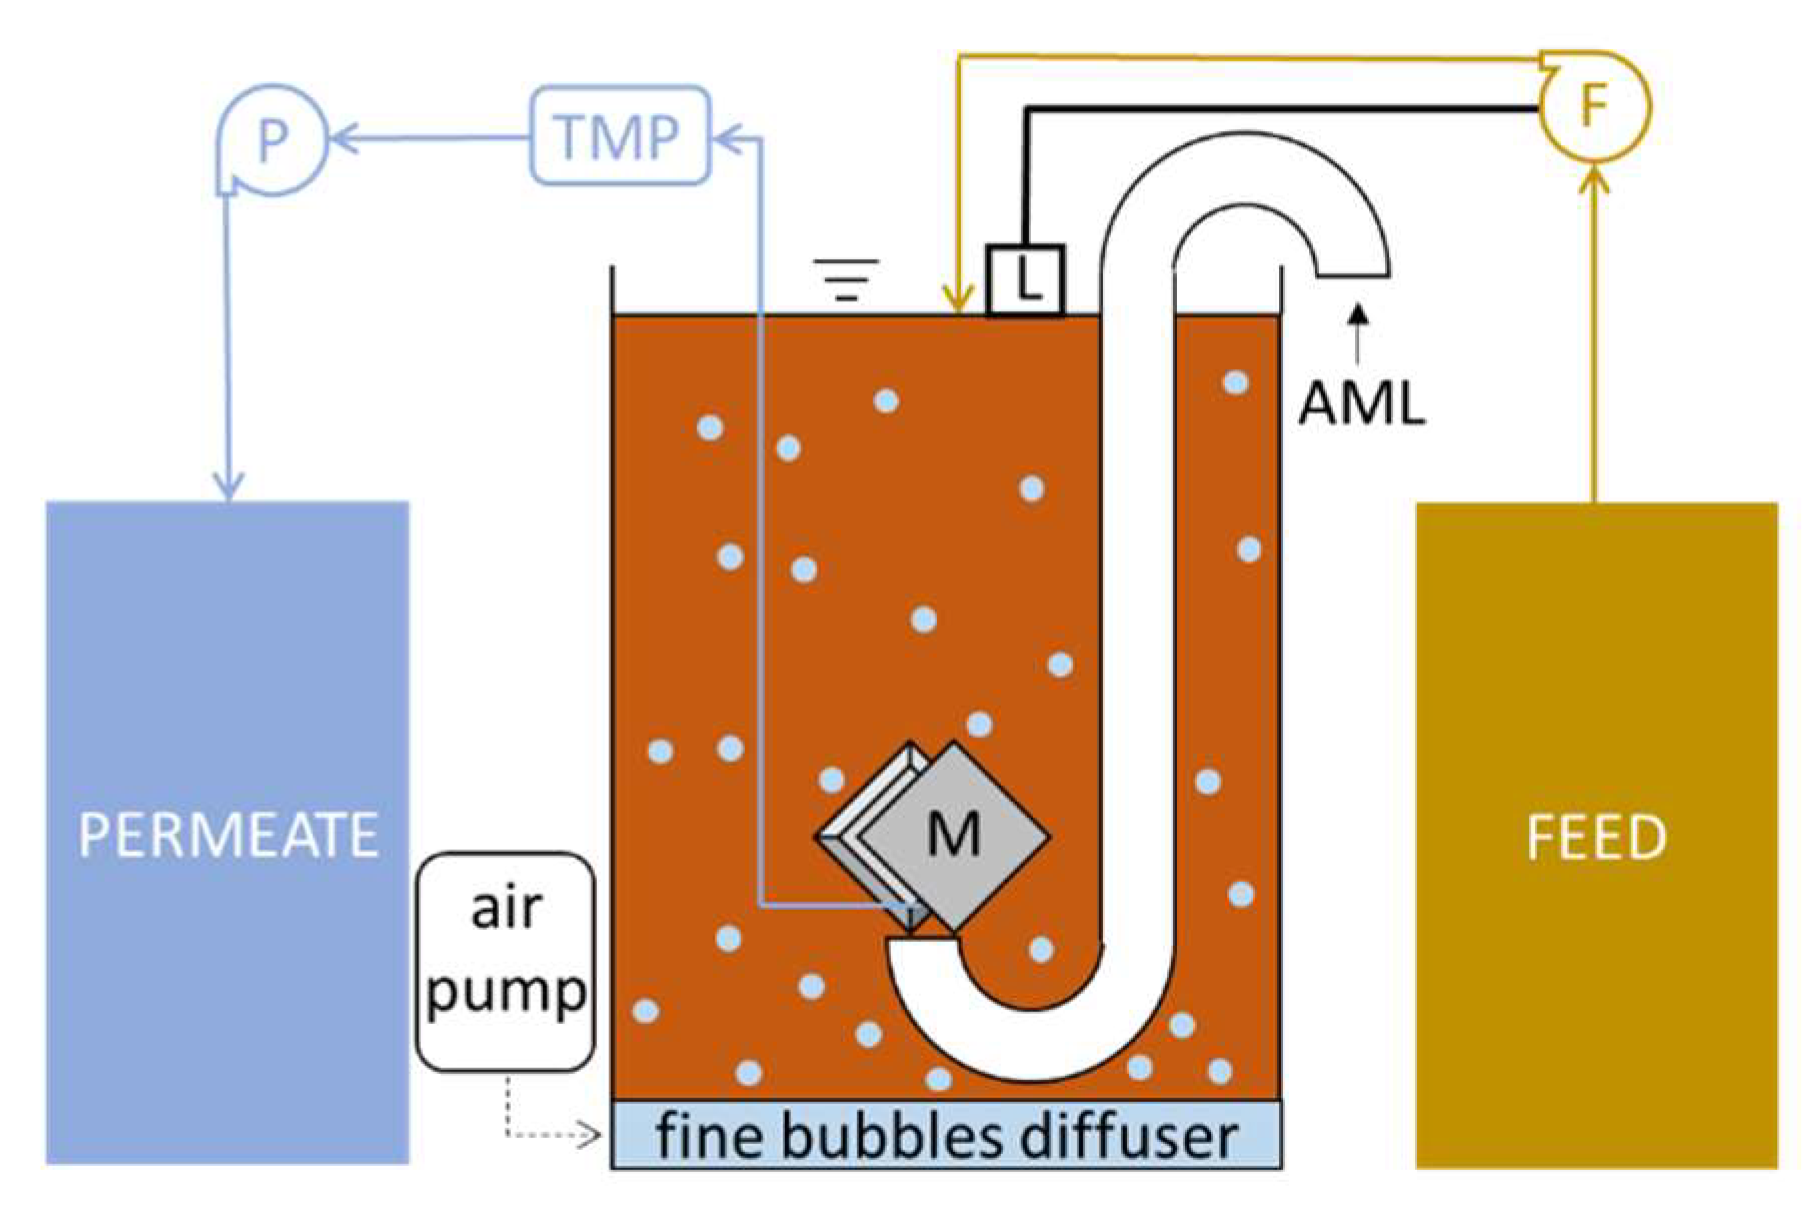
Figure 1. Plant scheme common to all tests. F is the feed pump; L is the level control that activates F; M is the couple of filtration modules; TMP is the manometer measuring transmembrane pressure; P is the permeate suction pump; AML is the periodic air mass load pipeline (not present in test C).
Preprints 96135 g001
Figure 2. Activated sludge samples at phase contrast microscopy at 100x magnification. The three tests are reported in columns (A, B, C) each one represented by four pictures in each column (I, II, III, IV).
Preprints 96135 g002
Figure 3. Trends of permeate turbidity, flux and wash events of Test A, B and C respectively.
Preprints 96135 g003
Table 1. Main characteristics and operating conditions of the bench scale SFD MBR plants.
Parameter Test A Test B Test C
SRT 30 days 30 days 30 days
Volume 16.0 L 16.0 L 16.0 L
Filtering area 0.0072 m2 0.0072 m2 0.0072 m2
Target flux 73 L m-2 h-1 73 L m-2 h-1 73 L m-2 h-1
Mesh pore-size 50 µm 20 µm 20 µm
Periodic maintenance* AML AML relaxation
No-suction time distribution 3’break + 5’AML + 3’break 3’break + 5’AML + 3’break 11’break
* every 229 minutes.
Table 2. Main conventional parameters of the wastewater feeding the SFD MBR.
Parameter unit Average ± st.dev.
TSS mg L-1 248.8 ± 103.6
VSS mg L-1 243.2 ± 95.9
COD mg L-1 460.0 ± 22.6
soluble COD mg L-1 112.3 ± 49.0
TN mg L-1 65.5 ± 17.3
N-NH4+ mg L-1 42.0 ± 11.1
N-NO2- mg L-1 0.1 ± 0.0
N-NO3- mg L-1 0.2 ± 0.2
pH - 7.4 ± 0.2
Electr. conductivity mS cm-1 1.3 ± 0.5
Tot. coliforms MPN 100 mL-1 2.5E+07 (median); 2.0E+06 (min); 7.9E+07 (max)
E. coli MPN 100 mL-1 7.9E+06 (median); 3.0E+05 (min); 2.9E+07 (max)
Table 3. Activated sludge characteristics during the different tests.
Parameter Unit Test A Test B Test C
MLSS g L-1 3.4 ± 1.2 4.4 ± 1.3 2.9 ± 1.6
MLVSS g L-1 3.0 ± 1.0 3.8 ± 1.1 2.6 ± 1.4
SVI30 mL g-1 64.3 ± 14.1 92.1 ± 8.6 43.9 ± 9.9
Temperature °C 20.0 ± 0.6 20.2 ± 0.2 22.5 ± 0.8
DO mg L-1 6.3 ± 1.1 4.1 ± 1.2 6.2 ± 1.8
ORP mV 305.5 ± 39.1 294.6 ± 6.2 314.8 ± 9.7
pH - 6.8 ± 0.5 7.1 ± 0.5 7.0 ± 0.8
Table 4. Comparison of the produced permeates from every SFDMBR.
Parameter unit Test A Test B Test C
TSS mg L-1 366.7 ± 78.5 4.7 ± 1.9 6.4 ± 6.2
COD mg L-1 103.0 ± 86.7 30.4 ± 5.0 32.8 ± 6.2
TN mg L-1 98.7 ± 52.1 55.1 ± 5.3 41.3 ± 8.8
N-NH4+ mg L-1 1.0 ± 2.3 0.1 ± 0.1 0.3 ± 0.3
N-NO2- mg L-1 0.0 ± 0.0 0.0 ± 0.0 1.6 ± 0.9
N-NO3- mg L-1 24.7 ± 5.1 35.7 ± 6.7 27.1 ± 7.3
Electr. conductivity mS cm-1 1.0 ± 0.1 0.8 ± 0.0 1.1 ± 0.0
pH - 7.1 ± 0.8 7.4 ± 0.3 7.3 ± 0.3
Tot. coliforms MPN 100 mL-1 1.6E+05 (median) 4.4E+05 (median) 1.6E+04 (median)
1.3E+05 (min) 5.0E+04 (min) 1.0E+04 (min)
1.9E+05 (max) 4.6E+05 (max) 2.2E+04 (max
E. coli MPN 100 mL-1 6.0E+04 (median) 1.0E+05 (median) 8.2E+03 (median)
5.8E+04 (min) 2.0E+04 (min) 6.3E+03 (min)
6.3E+04 (max) 2.2E+05 (max) 1.0E+04 (max)
Disclaimer/Publisher’s Note: The statements, opinions and data contained in all publications are solely those of the individual author(s) and contributor(s) and not of MDPI and/or the editor(s). MDPI and/or the editor(s) disclaim responsibility for any injury to people or property resulting from any ideas, methods, instructions or products referred to in the content.
Copyright: This open access article is published under a Creative Commons CC BY 4.0 license, which permit the free download, distribution, and reuse, provided that the author and preprint are cited in any reuse.
Prerpints.org logo

Preprints.org is a free preprint server supported by MDPI in Basel, Switzerland.

Subscribe

© 2024 MDPI (Basel, Switzerland) unless otherwise stated