1. Introduction
Hepatocellular carcinoma is a type of malignant tumor that is commonly seen in the clinic. The latest cancer statistics report shows that in 2022, new cases of hepatocellular carcinoma accounted for 4.7% and 8.3% of total cancer cases and total cancer deaths worldwide, respectively, ranking it 6th in incidence rate and 3rd in cause of cancer deaths [
1,
2,
3]. The incidence of hepatocellular carcinoma in China and its mortality rate in that country is approximately twice the world average, and China remains one of the countries with the heaviest burden of hepatocellular carcinoma [
4]. Hepatocellular carcinoma has a hidden onset and high rates of malignancy and progression, and patients in the early stage of the disease often experience no obvious discomfort. Diagnosis of this cancer usually occurs at the middle and late stages of the disease, and the prognosis is often poor [
5]. Conventional chemotherapy and immunotherapy are increasingly ineffective due to drug resistance and adverse drug reactions [
6]. Therefore, it is necessary to find new targets for the treatment of hepatocellular carcinoma. The expression of ALDH2 in immune tissues and cells has not been reported, but ALDH2 is highly expressed in macrophage-like cells in hepatocellular carcinoma tissues [
7].
In this study, the expression of ALDH2 protein in human hepatoma tissue and in macrophages in corresponding paracancer tissues was detected by immunofluorescence double-staining. The results showed that ALDH2 is expressed by some CD68+ macrophages [
8]. Further statistical analysis showed that the proportion of ALDH2+CD68+ macrophages in hepatocellular carcinoma tissues was significantly higher than that in paracarcinoma tissues, and the proportion of ALDH2+CD68+ macrophages showed a significant negative correlation with patient survival. The proportion of ALDH2+CD68+ macrophages in nodular tumors was higher than that in giant tumors, but there was no significant correlation with tumor size [
9].
To explore the mechanism of ALDH2 involvement in tumorigenesis through macrophages and considering that M2 macrophages are dominant among tumor-related macrophages, the biological role of ALDH2 in the activation and differentiation of macrophages was investigated in this study. Mouse peritoneal macrophage (PMs) were induced by injection of 6% starch and isolated, and M1 and M2 macrophages were induced by injection of LPS and IL-4, respectively [
10,
11,
12]. The results showed that LPS stimulated the expression of iNOS in PMs, while Arg-1 expression was absent. In contrast, PM stimulated by IL-4 expressed high levels of Arg-1, and M2-type macrophages stimulated by IL-4 expressed high levels of ALDH2 mRNA and protein; these levels were significantly higher than those in M1-type macrophages induced by LPS [
13]. On this basis, RNAi was used to interfere with the expression of ALDH2 in macrophage PMs and bone marrow-derived macrophage BMDMs. Flow cytometry was used to detect the expression of the surface marker CD206 and intracellular IL-10 production in M2-type macrophages [
14].
The effect of ALDH2 on the activation of macrophage polarization signaling pathways was further examined [
15]. ALDH2 interference was found to significantly downregulate the expression of STING in IL-4-stimulated macrophages. In related literature, it was reported that the transcription factor cGAS-STING mediates macrophage polarization toward the M1/M2 type by regulating the expression of related downstream target genes. This suggests that ALDH2 is likely involved in the regulation of macrophage polarization through the cGAS-STING signaling pathway. Mononuclear macrophages are major antigen-presenting cells that play a key role in the induction and regulation of specific immune responses [
16]. Activated liver tissue macrophages produce and release a variety of cytotoxic compounds, interferons and interleukins and participate in the body’s defense mechanisms. In areas of inflammation and in tumors, macrophages divide and engulf foreign bodies. The surface antigen CD68 is a specific surface marker for monocyte macrophages, including Kupffer cells. Flow cytometry and immunohistochemistry are used to detect the number and distribution of macrophages, which can reveal Hao2 hepatocellular carcinoma and the distribution pattern of HCC [
17,
18,
19,
20].
No studies of the expression pattern or the molecular biological function of ALDH2 in hepatocellular carcinoma or of its relationship to prognosis, immune infiltration or macrophage activation have been conducted to date. In this study, differentially expressed genes in HCC patients were screened using single-cell sequencing technology, and a series of genes, including ALDH2, were found to be valuable for further research. In addition, the expression of ALDH2 in hepatocellular carcinoma and its correlation with prognosis were analyzed using deep database mining, providing a new theoretical basis for the diagnosis and treatment of hepatocellular carcinoma.
2. Materials and Methods
2.1. Data downloading and collation
miRNA-seq data from 371 HCC samples with survival data and 50 paracancerous liver tissue samples (including 50 pairs of paired HCC and paracancerous liver tissue) and 367 HCC samples with survival data and 50 paracancerous liver tissue samples (including 50 pairs of paired HCC and paracancerous liver tissue) were downloaded from the TCGA database. We downloaded the set of macrophage activation-related genes, including 65 M0 macrophage activation genes, 29 M1 macrophage activation genes, and 43 M2 macrophage activation genes, and transformed the expression data of all genes. When a gene corresponded to multiple probes, the average probe expression value was taken as the expression value of the gene.
2.2. Screening and identification of differentially expressed genes
The edgeR package was used to identify differentially expressed lncRNAs (DE lncRNAs), differentially expressed mRNAs (DE mRNAs) and differentially expressed miRNAs (DE miRNAs). The thresholds were set to the corrected values of P < 0.01 and the difference multiple (FC)>2.
2.3. Analysis of the survival of hepatocellular carcinoma patients
The overall survival time of HCC patients was combined with their gene expression profiles in the TCGA database, and the survival package in R was used to conduct a survival analysis of HCC tissue samples with information on DE lncRNAs, DE miRNAs and DE mRNAs to identify prognostic genes. The HCC patients were divided into two groups (high risk and low risk) using the optimal cutoff values determined by the survminer R package.
2.4. Gene function enrichment analysis
Tissue samples from the TCGA-HCC cohort were classified into low-expression and high-expression groups based on the median expression of each candidate gene. To determine the potential functions of candidate genes, gene set enrichment analysis (GSEA) of the two groups was performed, and the results were compared.
2.5. Analysis of immune cell infiltration
The TIMER (
https://cistrome.shinyapps.io/timer/) database is an analysis site that reviews immune cell infiltration and its impact on disease. The TIMER database was used to predict and evaluate the correlation between differentially expressed macrophage activation-related genes and immune microcellular infiltration in patients with hepatocellular carcinoma.
2.6. Prognosis assessment model of macrophage activation-related genes in hepatoma
Univariate survival analysis was performed for 137 macrophage activation-related genes in the TCGA liver cancer database. The results showed that 81 of the genes were significantly correlated with prognosis in patients with liver cancer. The top 15 genes were further selected for multivariate Cox regression analysis. The multifactor Cox regression coefficient was used as a weight to construct a prognosis evaluation model of liver cancer associated with macrophage activation-related genes based on the expression levels of the genes. Liver cancer patients were divided into a high-risk group and a low-risk group according to the median risk score.
2.7. Detection and analysis of macrophage polarization induction
2.7.1. Quantitative Real-time PCR
Real-Time PCR
Table 1.
Reaction system.
Table 1.
Reaction system.
| Reagent |
Dose |
| SYBR High-Sensitivity |
10 μl |
| PCR Forward Primer (10 μM) |
0.4 μl |
| PCR Reverse Primer (10 μM) |
0.4 μl |
| ROX II |
0.4 μl |
| cDNA |
2μl |
| ddH2O |
6.8μl |
| Total |
20 μl |
2.7.2. Western Blotting
During cell protein extraction, cells should be washed with PBS 2-3 times, 1mL of PBS should be added to scrape and collect cells, centrifuge at 4°C 400g for 5min, then PBS should be discarded, and appropriate lysate (RIPA lysate: PMSF: Protease Inhibitor Cocktail= 100:1:1); The collected cells were split on ice for 30min, and shook every 10min to fully split the cells, centrifuged at 4°C at 16000g for 5min, and supernatant was taken into a new Ep tube, which was the total protein.
The protein concentration of the sample was determined using the BCA protein concentration assay kit. 5× protein loading buffer was added and placed on a metal bath at 100℃ for 10min. The denatured protein was stored at -20°C.
Add appropriate volume of protein sample, protein marker and 5μL/ well, cut appropriate size of PVDF membrane according to the number of samples and the size of target protein, and soak in methanol for about 5min. The various materials in the membrane transfer device are soaked in the electric transfer solution, and placed in order from the negative electrode to the positive electrode: sponge pad - filter paper -PAGE gel -PVDF membrane - filter paper - sponge pad, after cleaning the bubbles, 300mA constant flow membrane, the membrane transfer time is determined by the molecular weight of the target protein strip. Preparation of ECL luminescent liquid (A and B liquid 1:1 mix, ready for use), drop on the front of PVDF film, the automatic film development machine in the dark room fixed.
2.7.3. The apoptosis of macrophages was detected by flow cytometry
Table 2.
Cell processing mode.
Table 2.
Cell processing mode.
| Cell |
Group |
| THP-1 |
THP-1+LPS+INF-γ |
| THP-1 |
THP-1+IL-4 |
Table 3.
Principal experimental reagent.
Table 3.
Principal experimental reagent.
| Reagent |
Brand |
NO |
District |
| DMEM |
Pricella |
PM150220 |
China |
| FBS |
Opcell |
BS-1105 |
China |
| 1×PBS |
Biosharp |
BL302A |
China |
| 4%PFA |
Sinopharm |
80096618 |
China |
| Triton X-100 |
Sinopharm |
30188928 |
China |
| FITC Anti-Human CD206(15-2) |
proteintech |
FITC-65155 |
America |
| FITC Plus Anti-Mous CD11b (M1/70) |
proteintech |
FITC-65055 |
America |
| APC Anti-Mouse CD86 (GL1) |
proteintech |
APC-65068 |
America |
| F4/80 Rabbit mAb |
ABclonal |
A24415 |
China |
Macrophages cells were collected, washed twice with PBS, fixed with 4% paraformaldehyde for 10min, washed with PBS for 3 times, incubated with 0.2% Triton X-100 for 10min to break the membrane, washed with PBS for 3 times, and then closed with 10% goat serum at 37℃ for 30 min.
The antibody was diluted according to the instructions for flow cytometry, the cells were incubated away from light for 30min, and the cells were washed with PBS for 3 times. Finally, flow cytometry was performed.
2.7. Statistical analysis
An independent sample t test was used to analyze differences in ALDH2 expression between liver cancer and normal tissues. Kaplan‒Meier analysis was used to analyze the correlation between macrophage subtypes and the prognosis of patients with liver cancer. P < 0.05 indicated that the difference was statistically significant.
3. Results
3.1. Differential gene screening and Ven map analysis of hepatocellular carcinoma
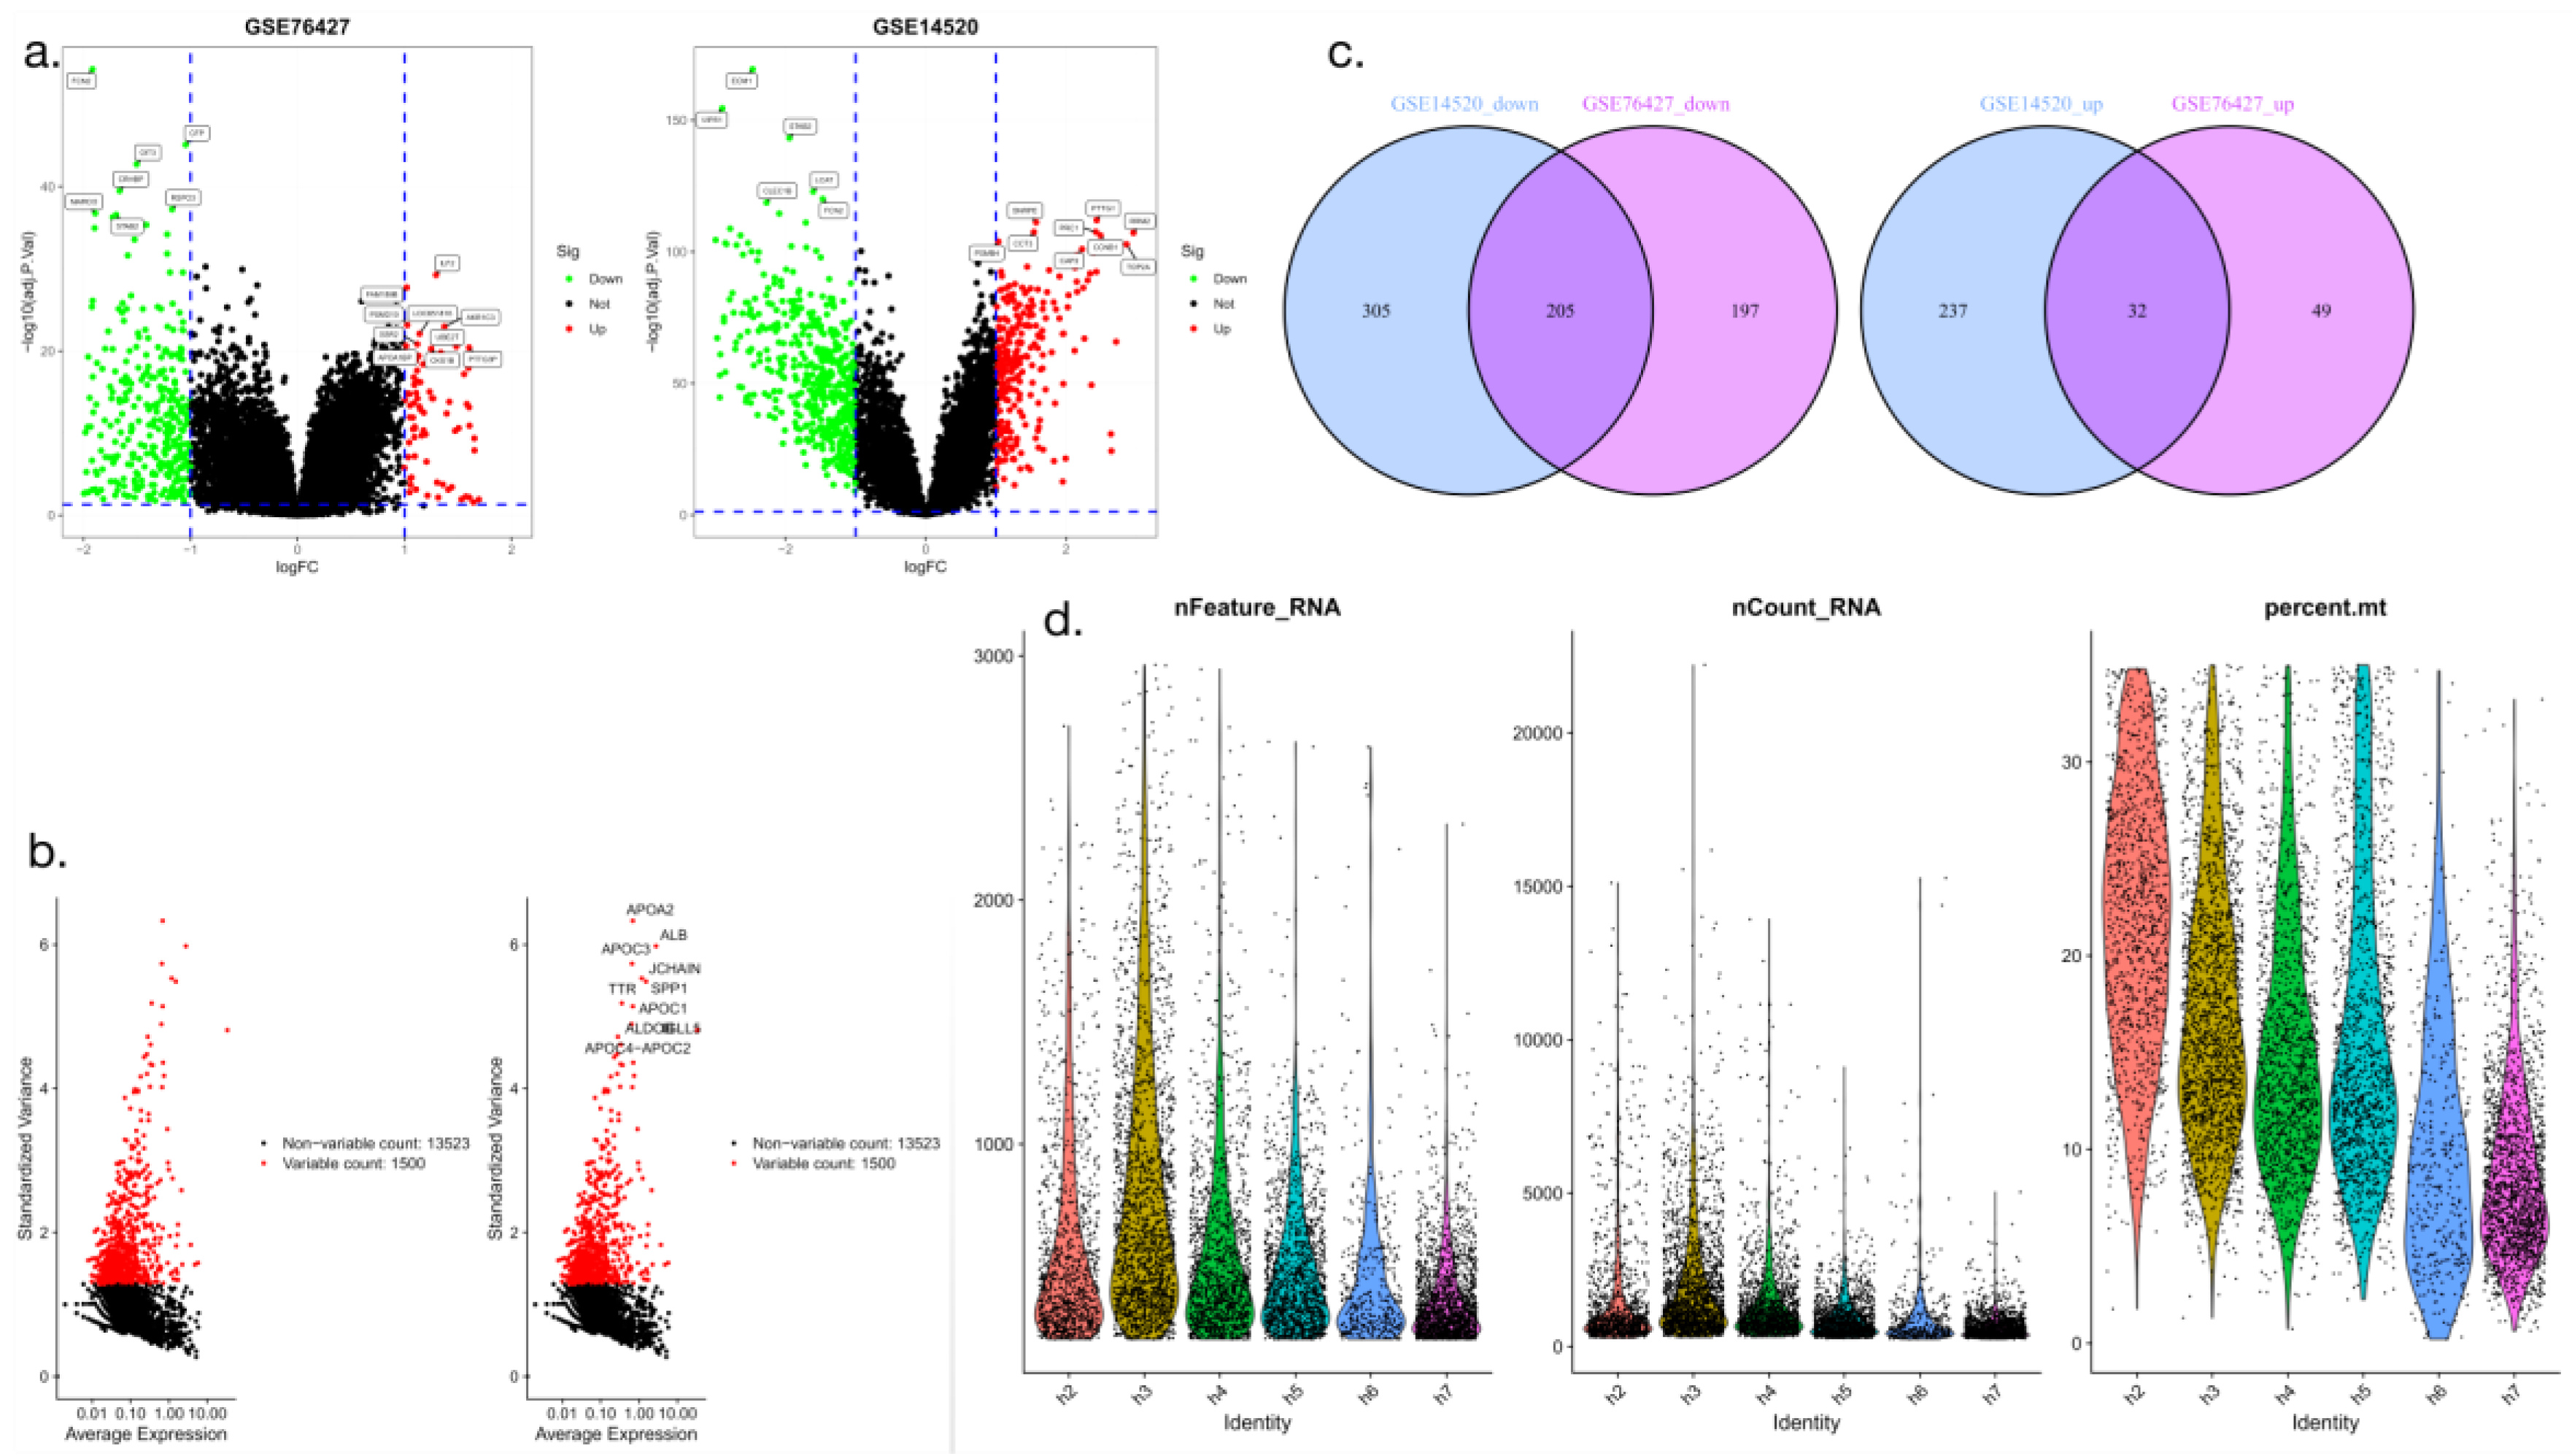
We performed a cluster analysis of the identified differentially expressed genes in which we compared 50 HCC samples with 50 paired paracancer liver tissue samples, using log2 FC>2 and a corrected P<0.01 as thresholds. The transcriptome data of GSE76427 and GSE14520 hepatocellular carcinoma were mapped as volcano maps (only the most significant differentially expressed genes were extracted). GSE76427 had 7 downregulated genes and 10 upregulated genes, and GSE14520 had 6 downregulated genes and 9 upregulated genes (
Figure 1a-b). The intersection genes were further extracted, yielding two gene sets (one for GSE76427 and one for GSE14520) that were upregulated and downregulated. The results showed that the number of upregulated intersecting genes was 32 and the number of downregulated intersecting genes was 205 (
Figure 1c). Quantitative screening and identification of differentially expressed gene-associated RNAs were performed (
Figure 1d).
3.2. Infiltration of hepatocellular carcinoma by macrophages of different subtypes
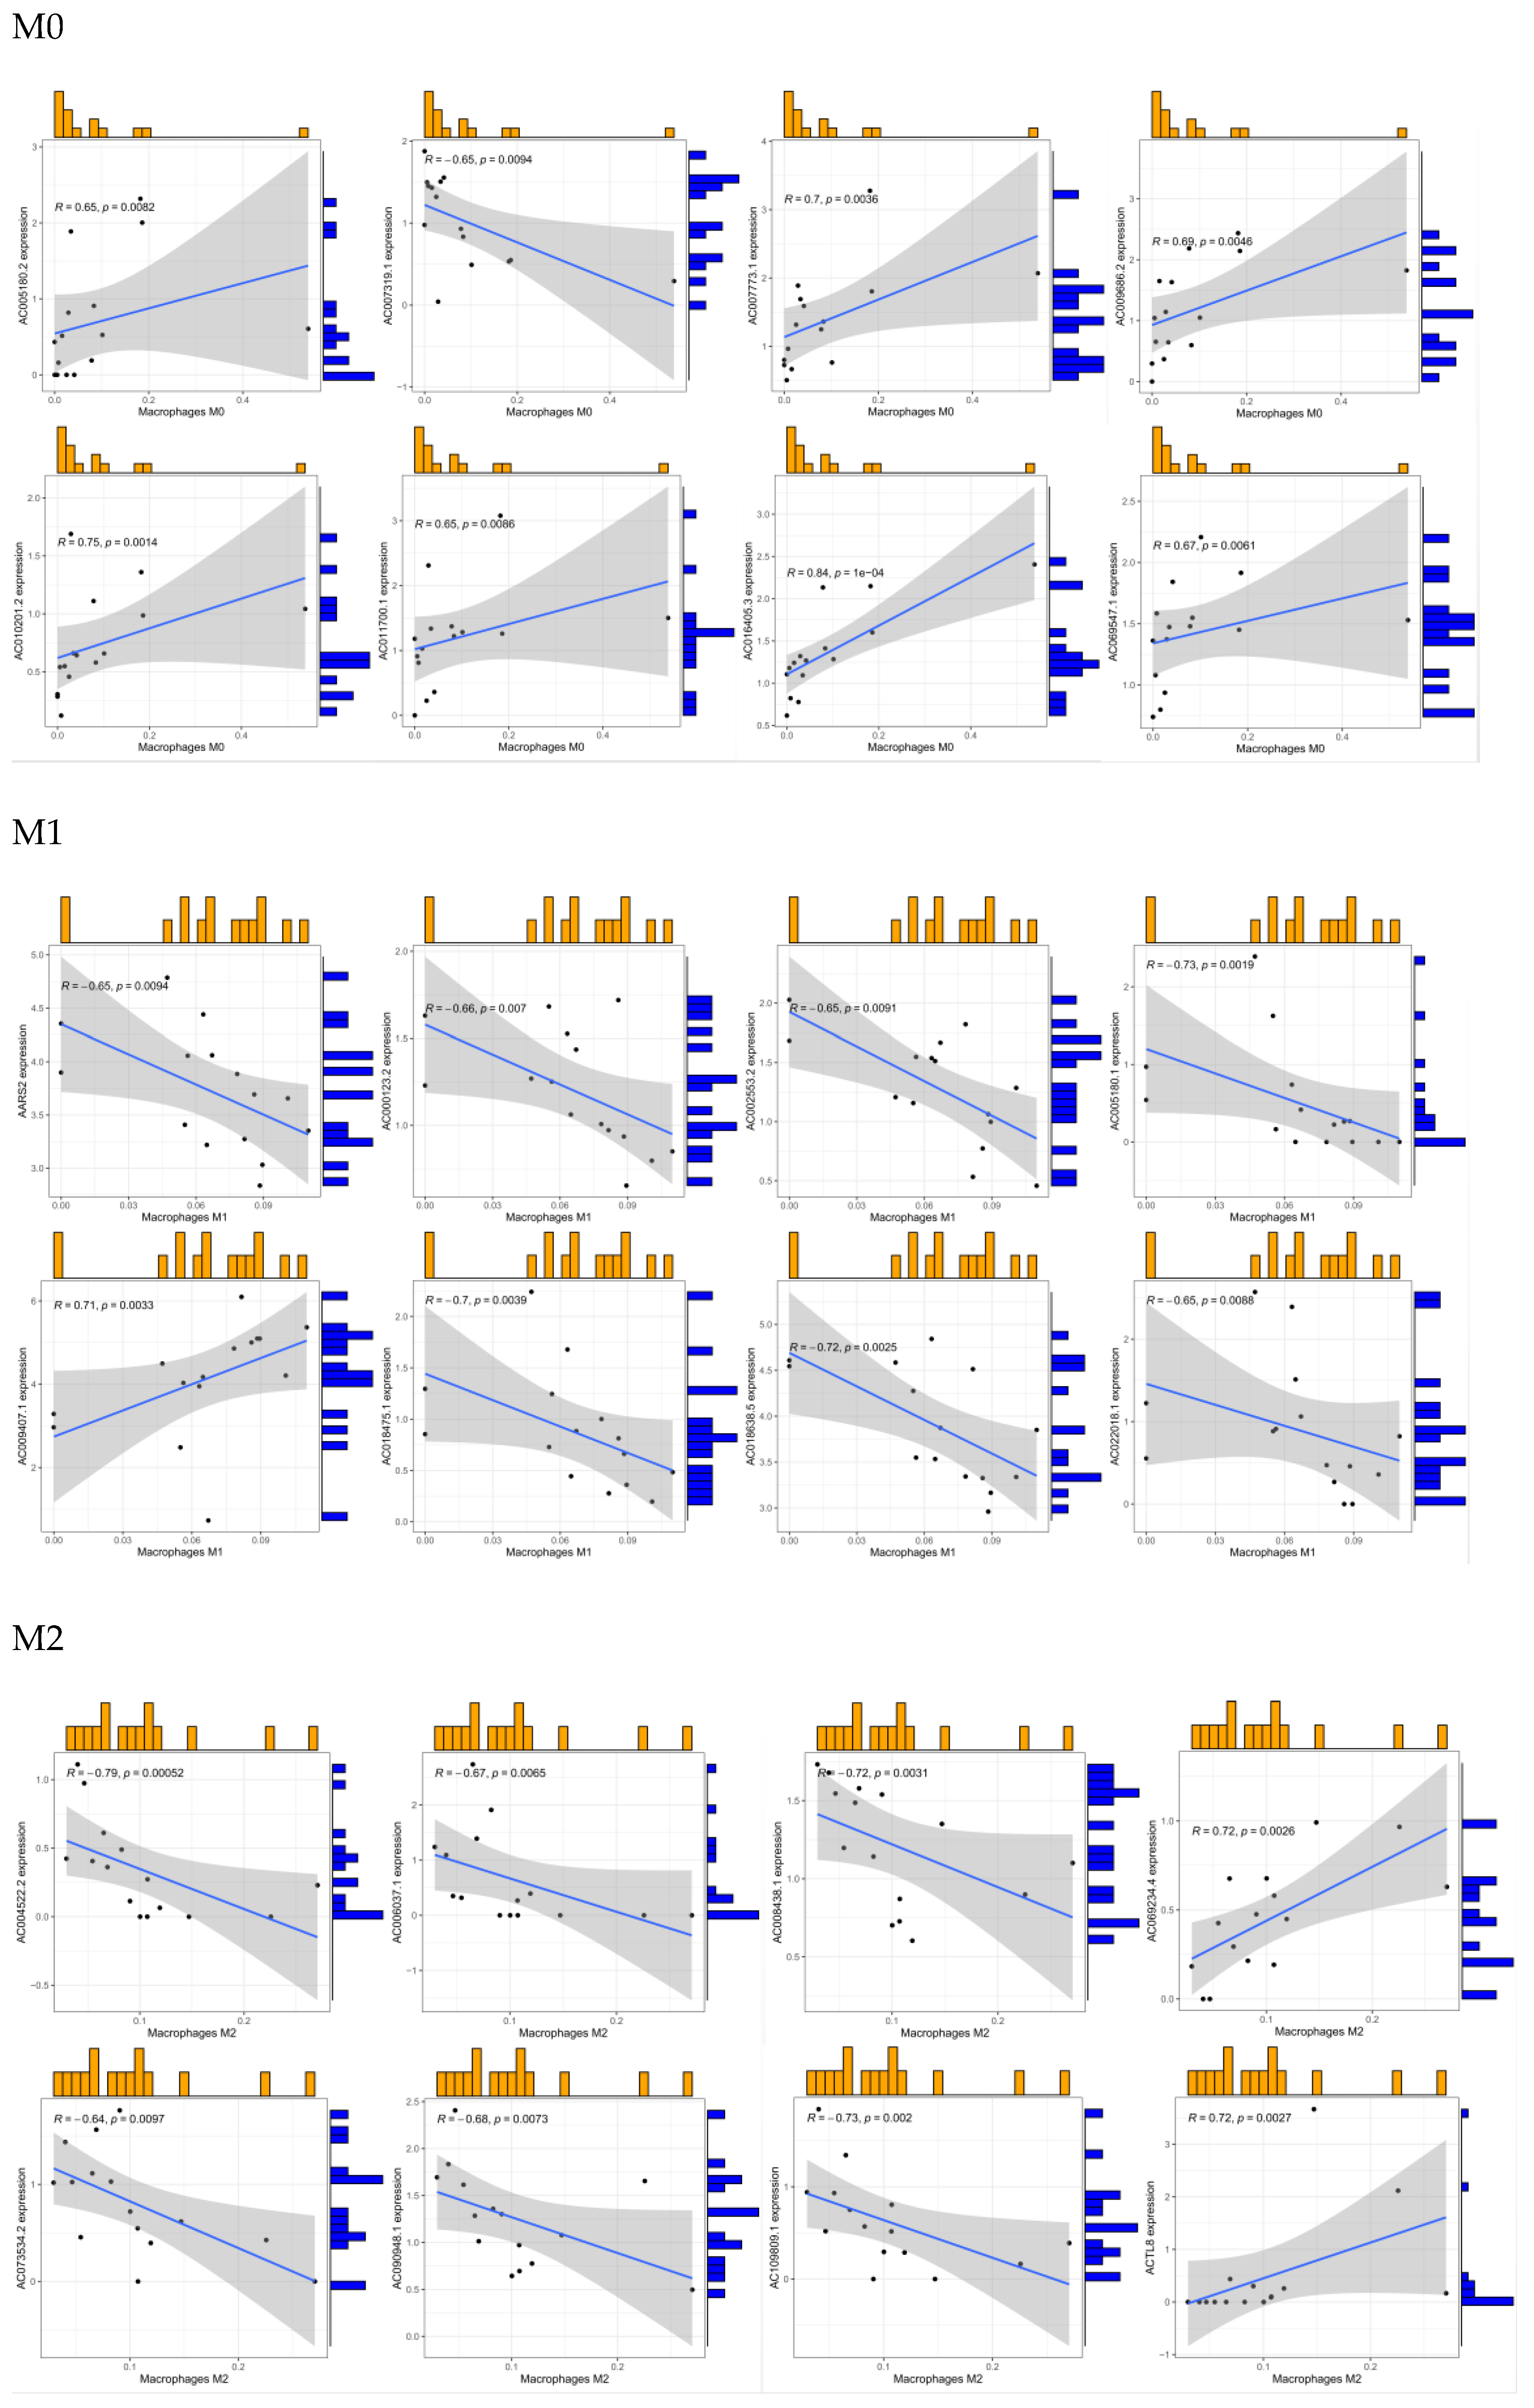
Data on the content of immune cells in each sample were extracted. We mainly explored the content of macrophages, including M0, M1 and M2 macrophages, in the hepatocellular carcinoma samples. The threshold was set, and the algorithm was used to screen and extract the levels of expression of macrophage-related genes in macrophages of different subtypes. A trend map was further drawn for analysis (
Figure 2).
3.3. Coexpression predicts macrophage-related genes
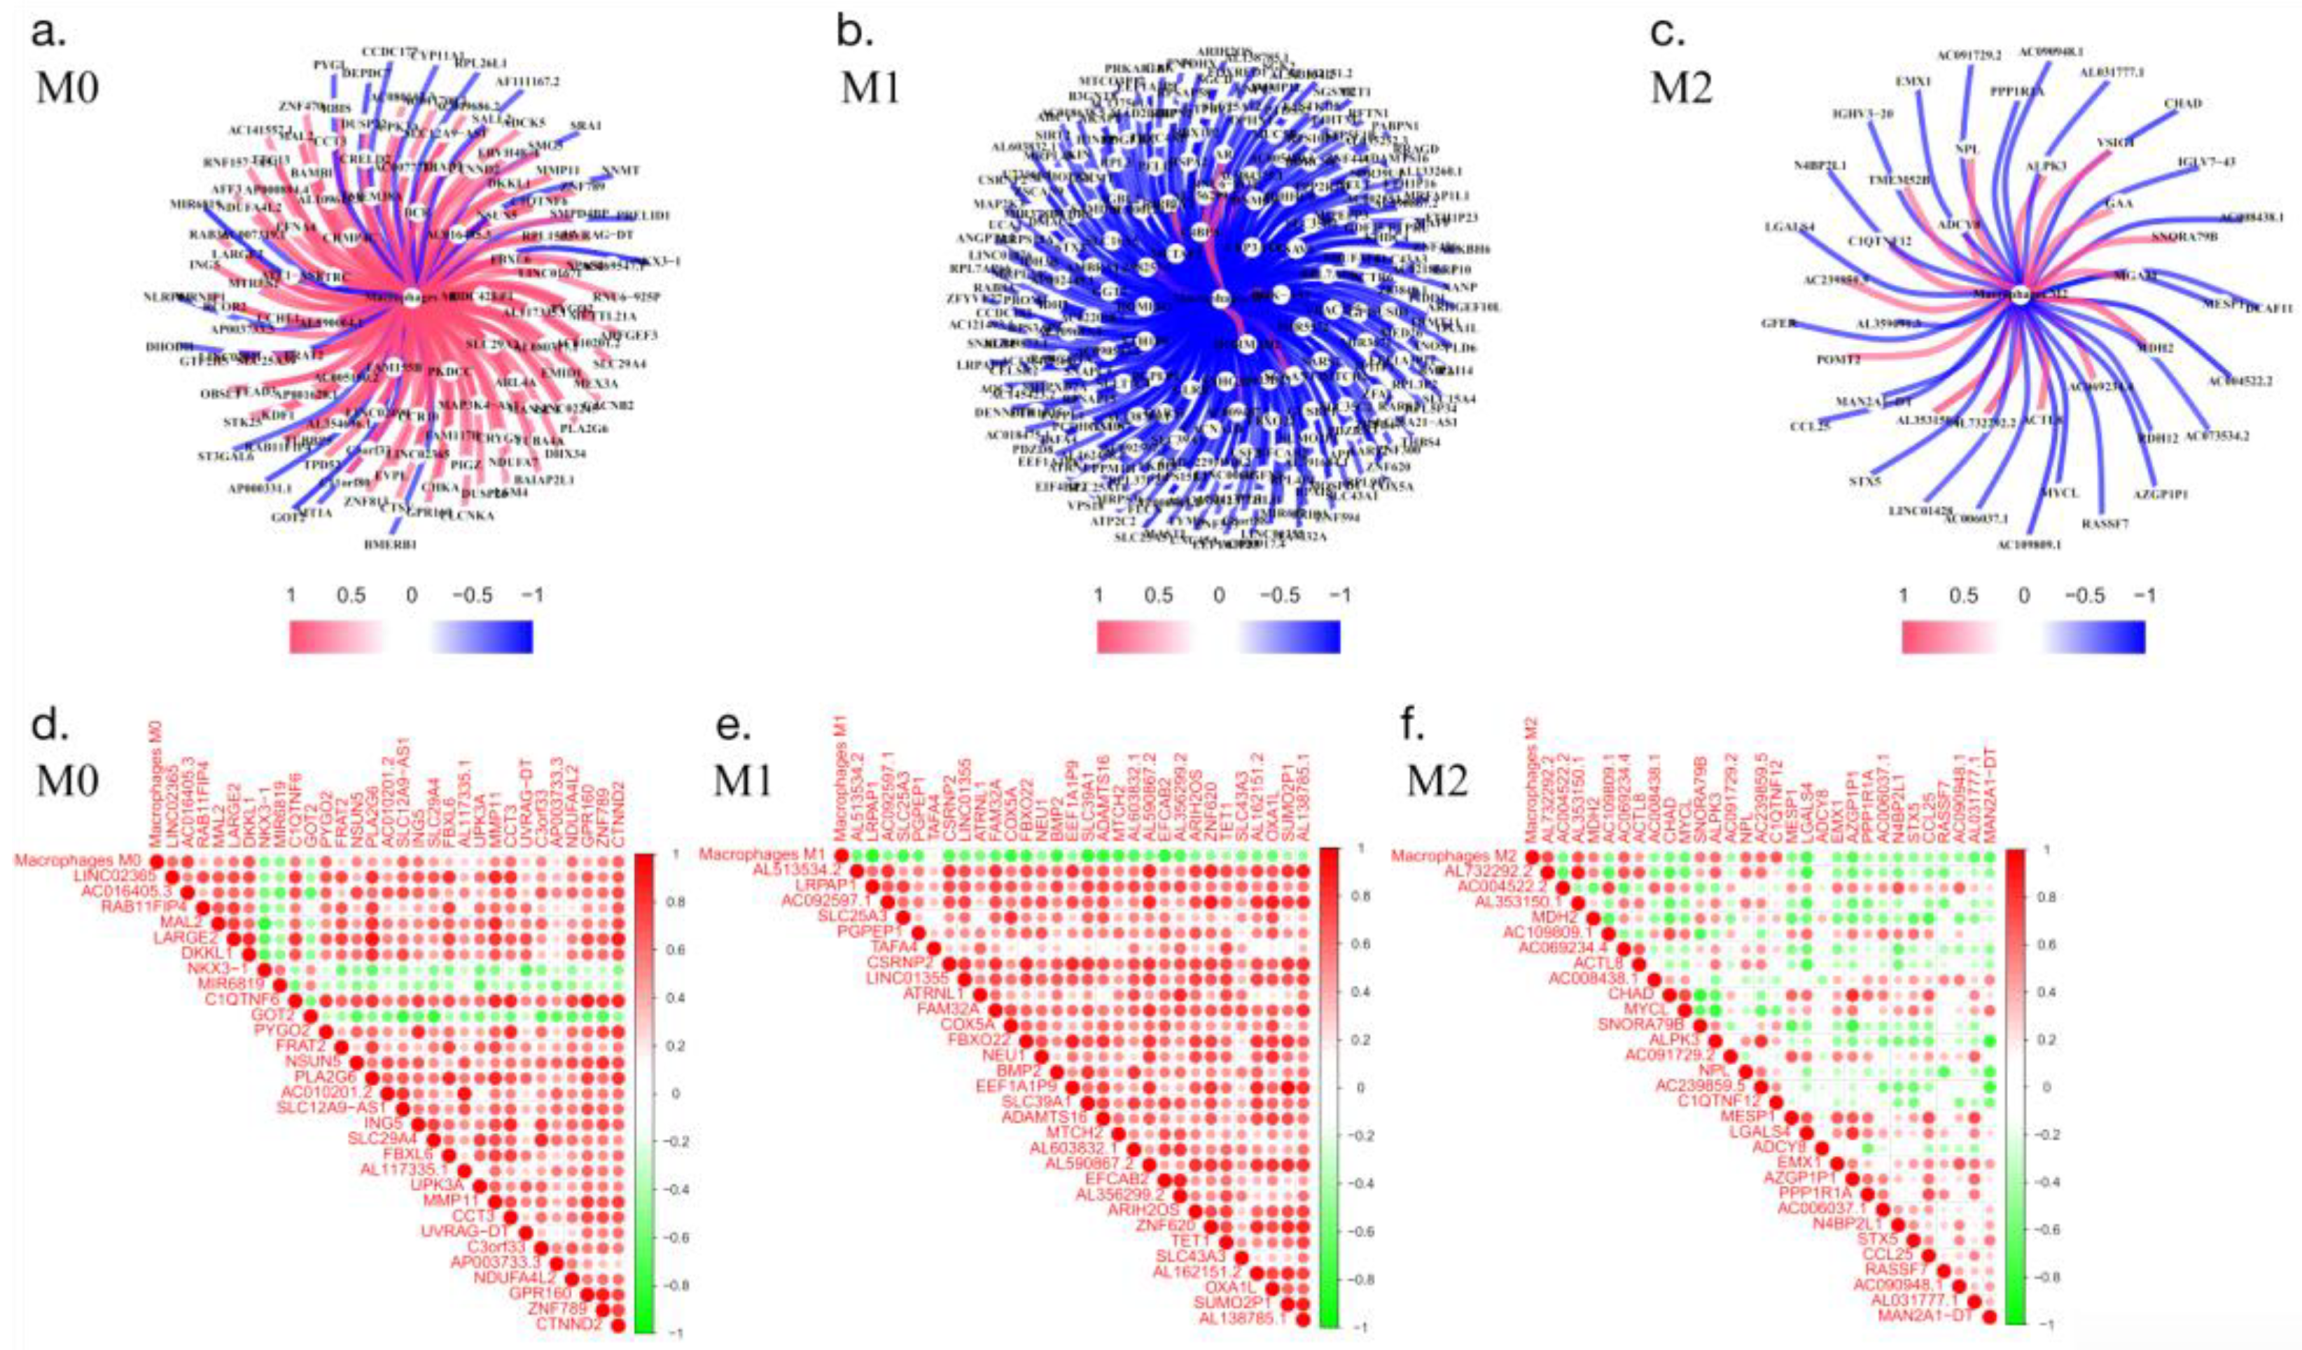
By screening for coexpressed genes, we identified the genes that comanifest with macrophages and thereby obtained the activation-related genes of different subtypes of macrophages. In this analysis, a coefficient greater than 1 indicates that the obtained genes have a positive regulatory relationship with macrophages. In contrast, a coefficient is less than 1 indicates that the gene has a negative regulatory relationship with macrophages (
Figure 3).
3.4. Functional enrichment analysis of macrophage-related genes
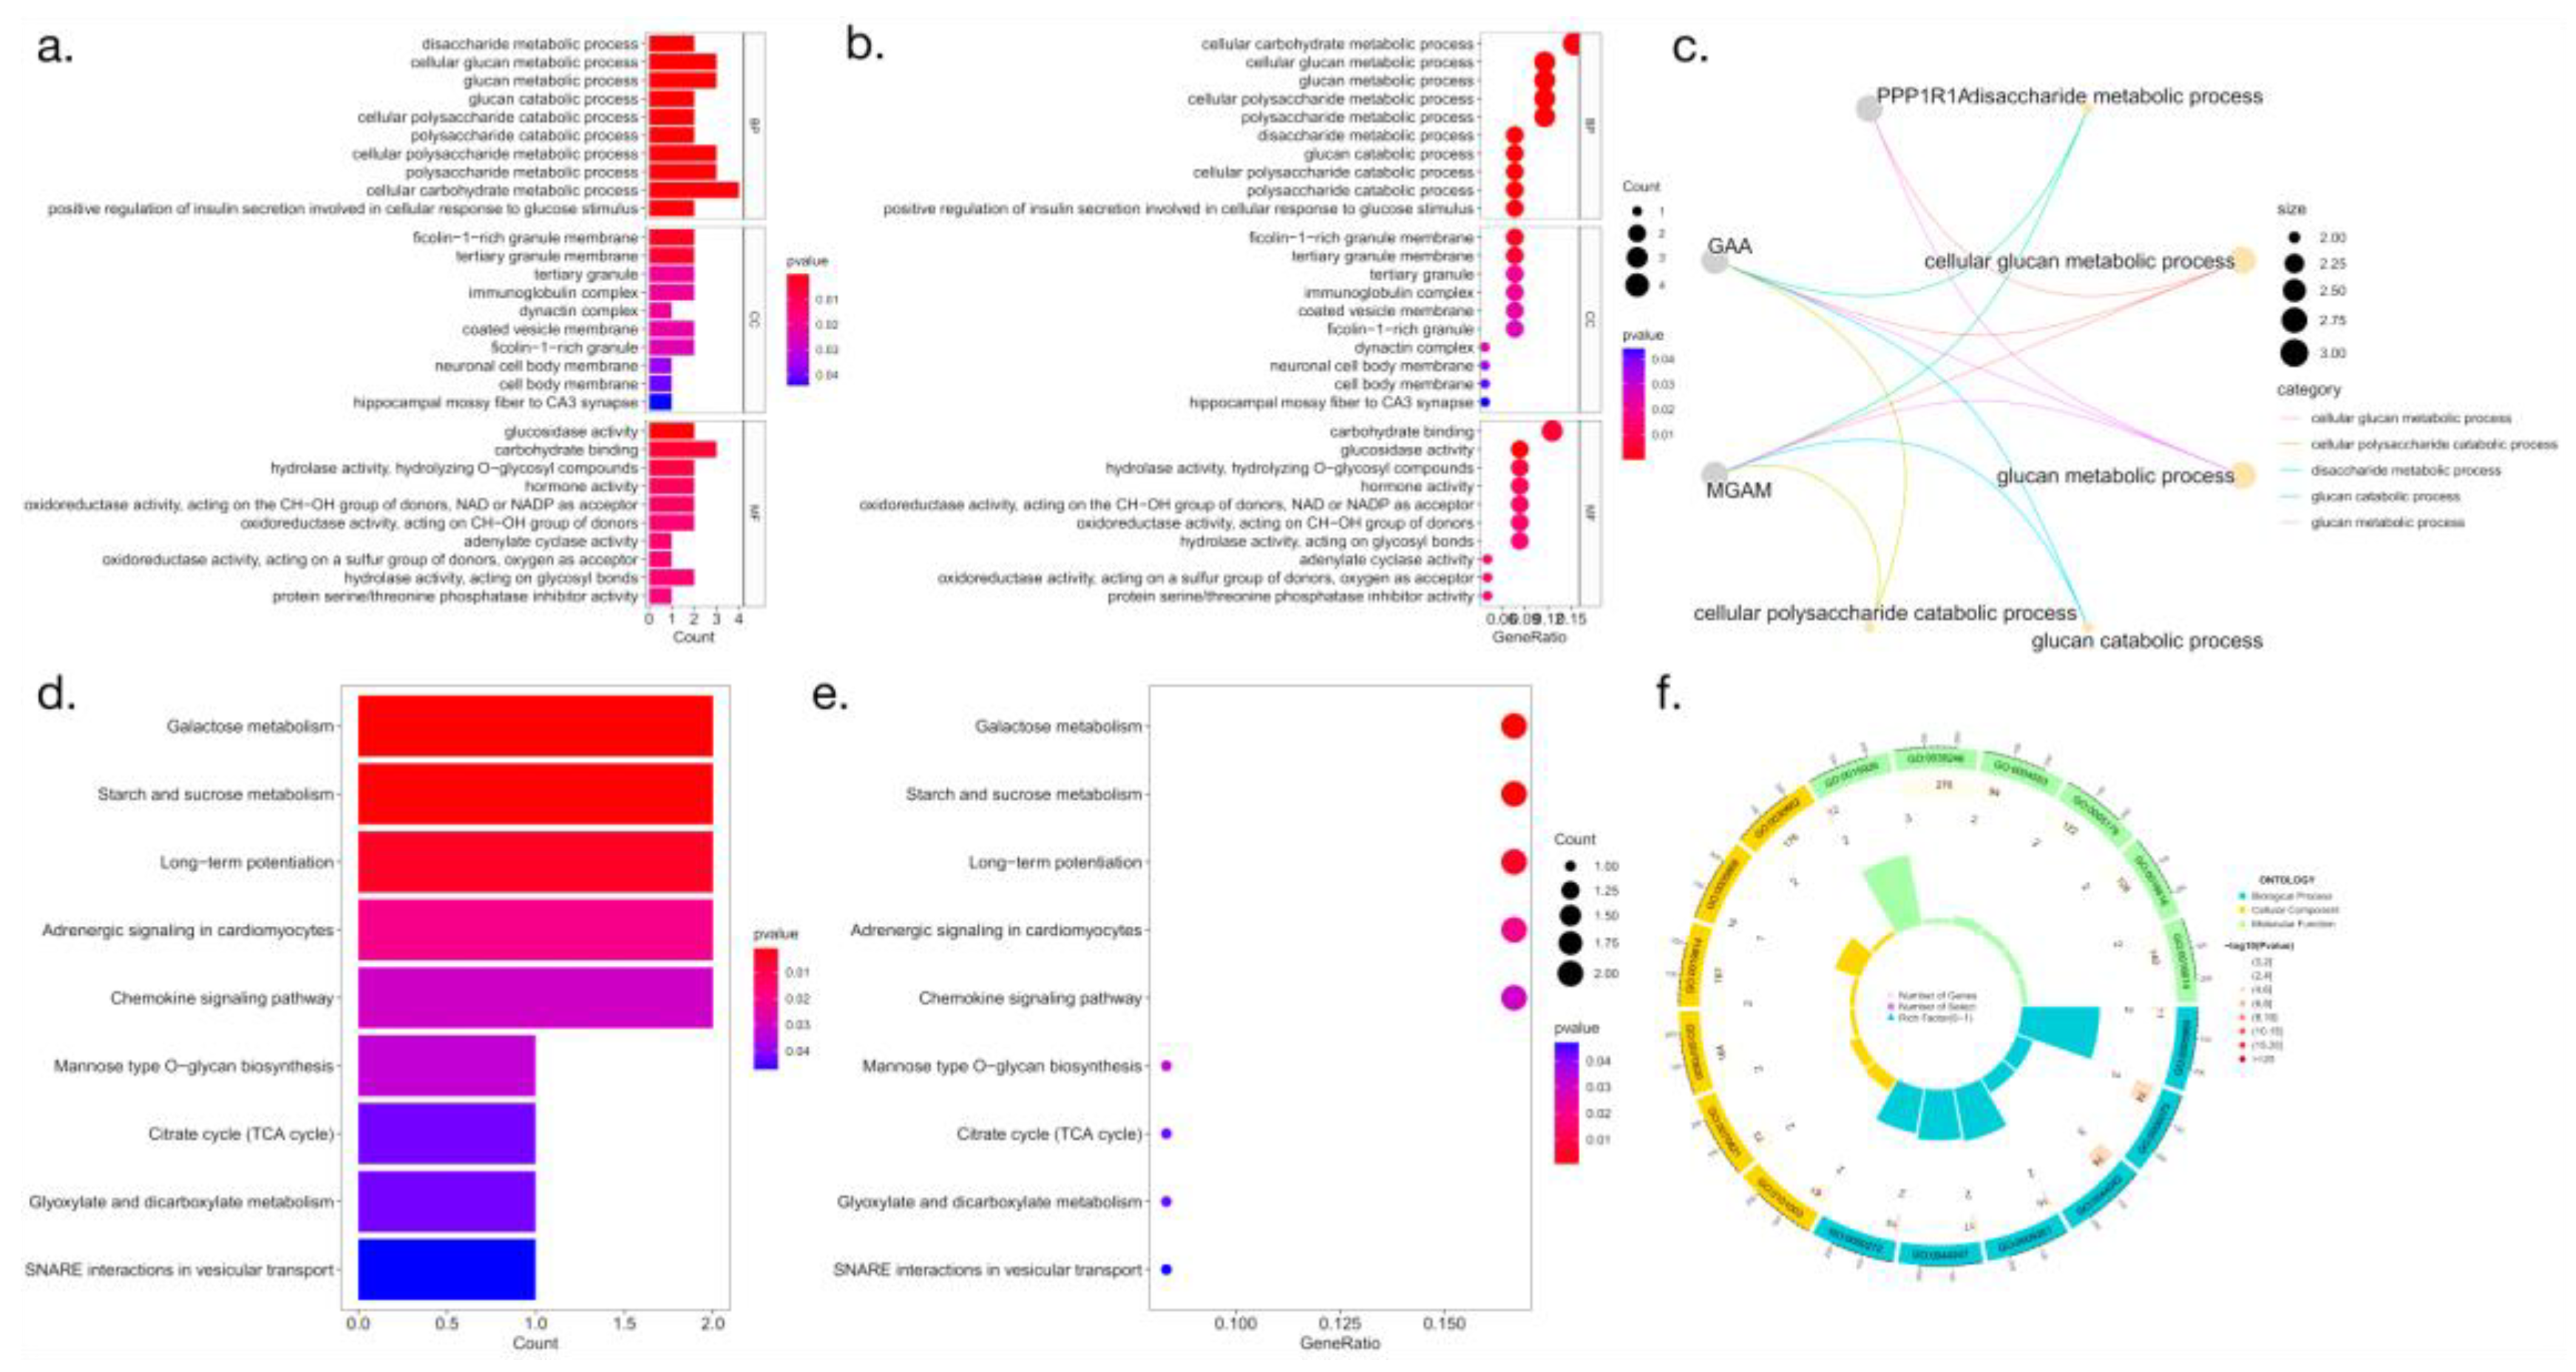
To identify biological pathways associated with macrophage-related genes that are highly expressed in HCC, we performed gene enrichment analysis of HCC samples from the TCGA-HCC cohort (
Figure 4).
3.5. Prognostic model construction and independent prognostic analysis
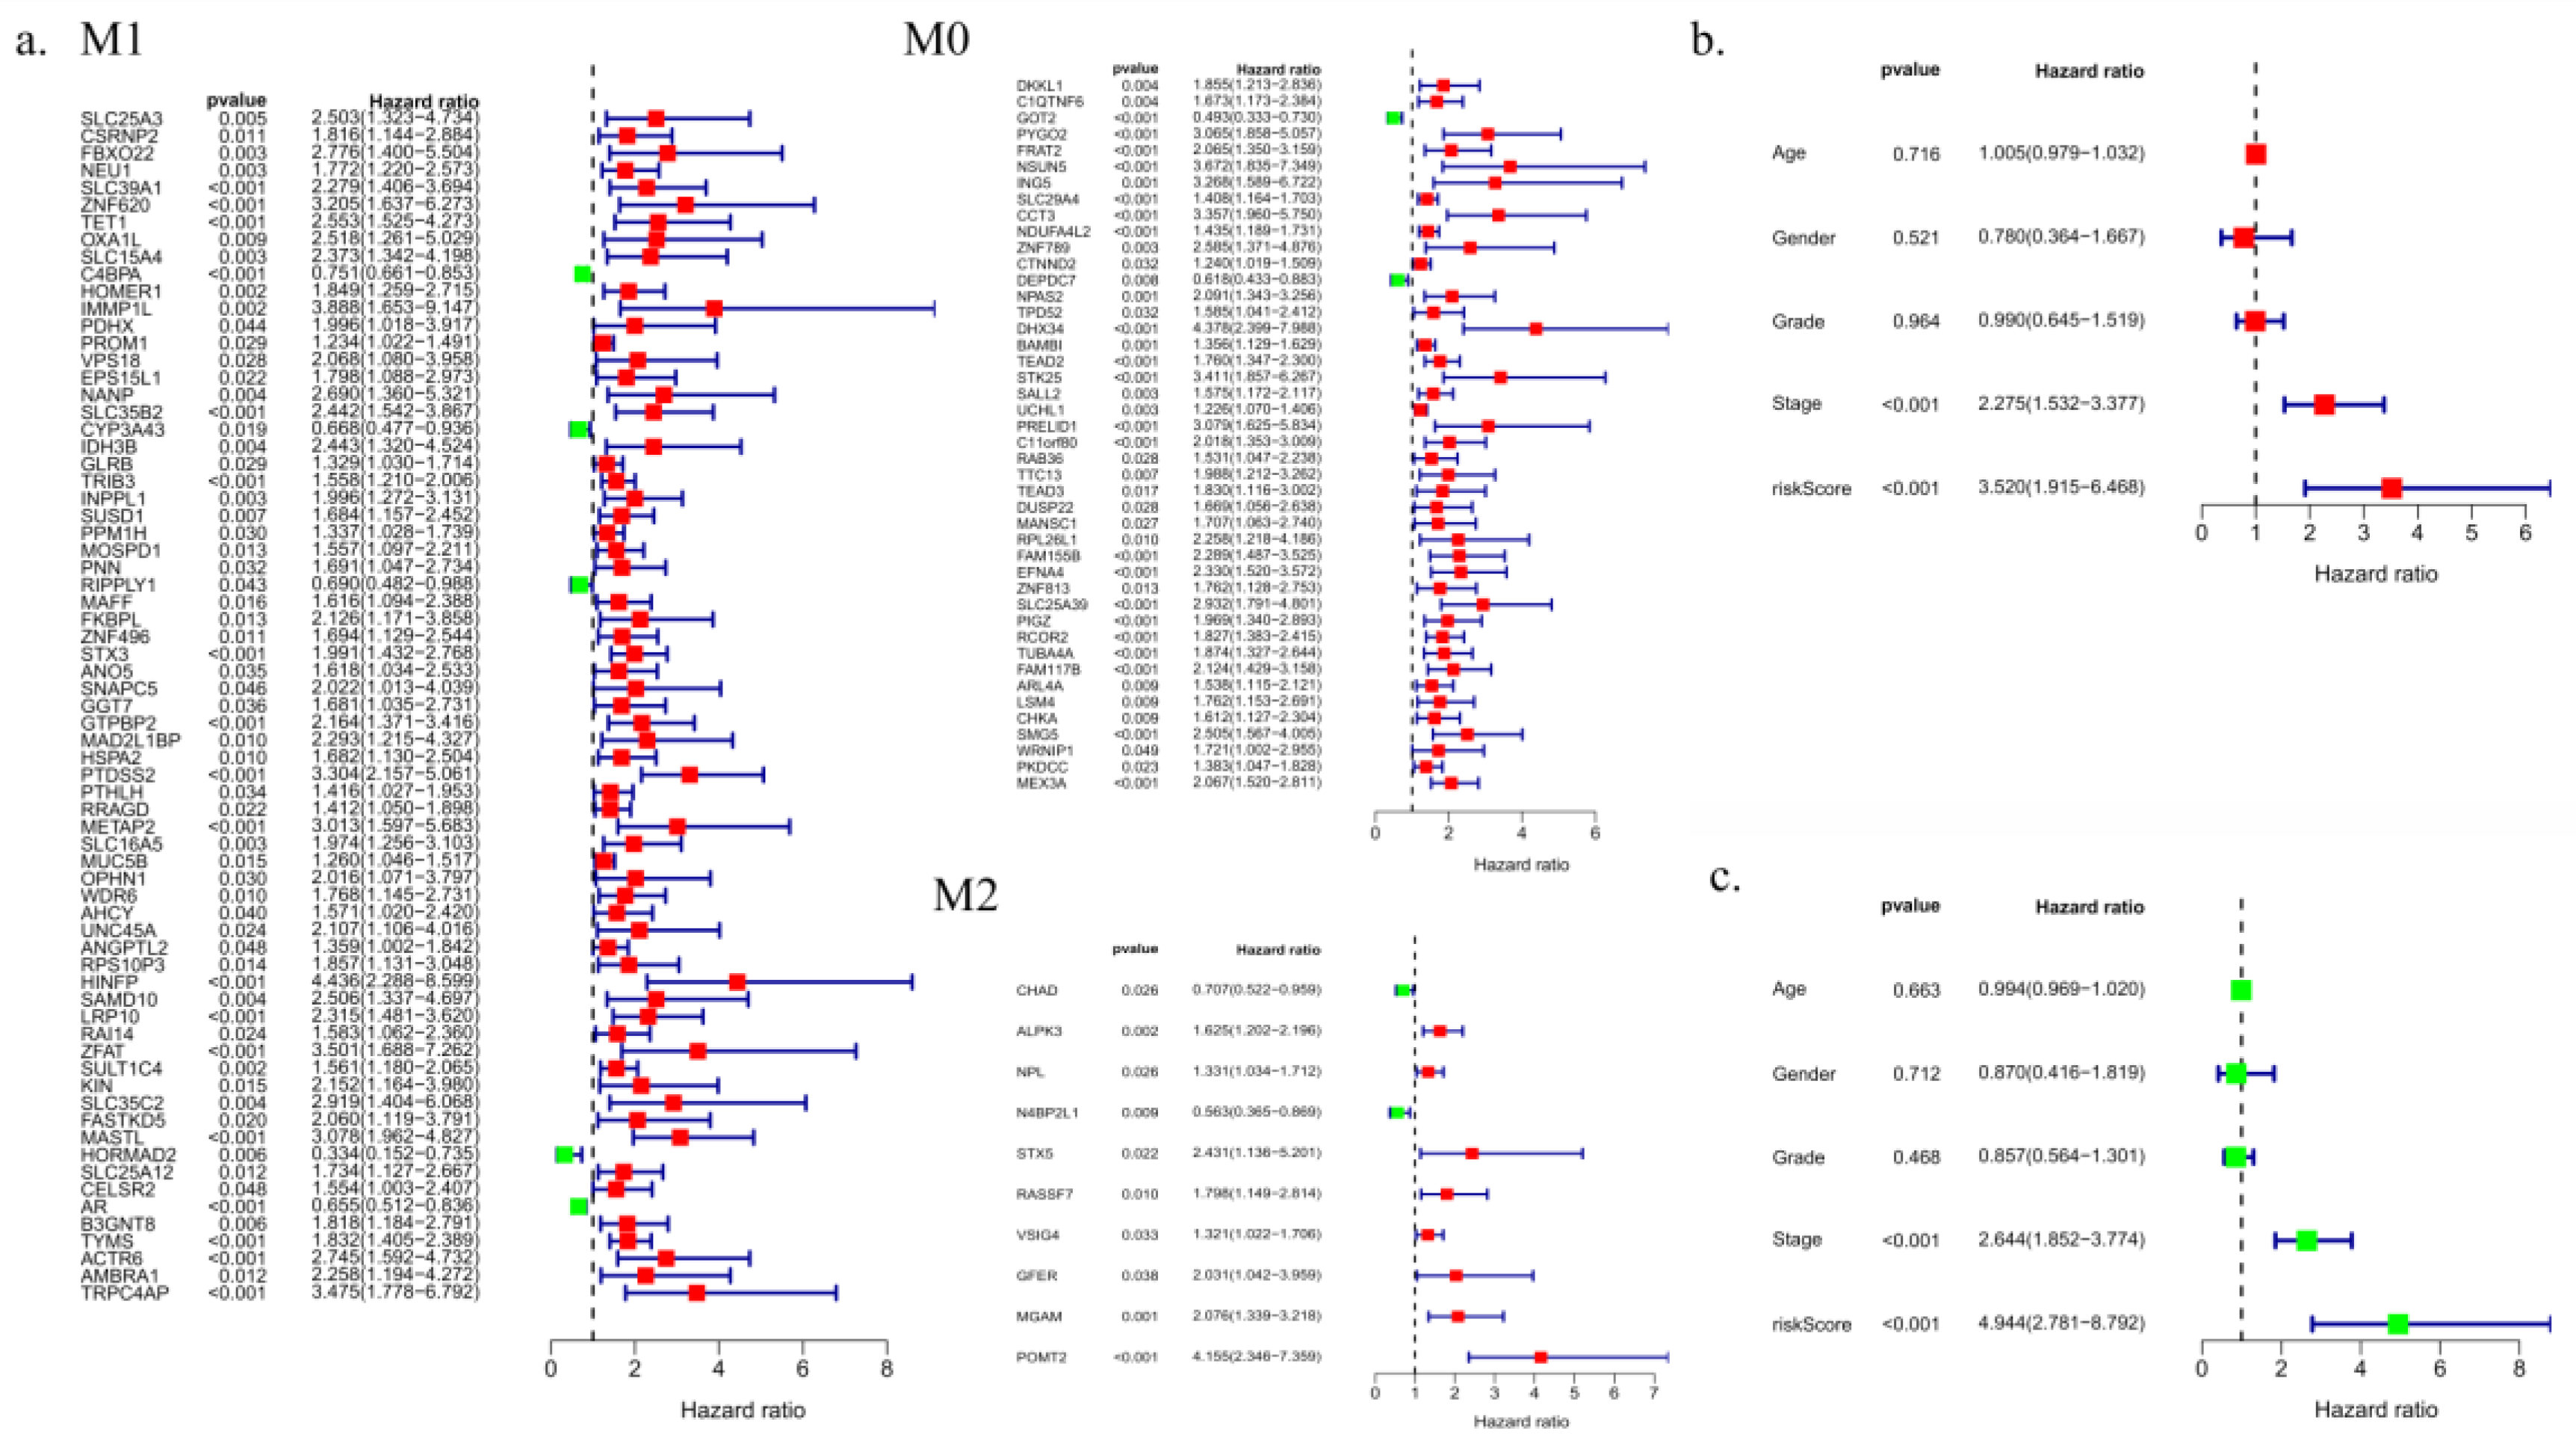
Univariate survival analysis was performed for 137 macrophage-related genes in the TCGA liver cancer database. Eighty-one genes were found to be significantly correlated with prognosis in individuals with liver cancer (
Figure 5).
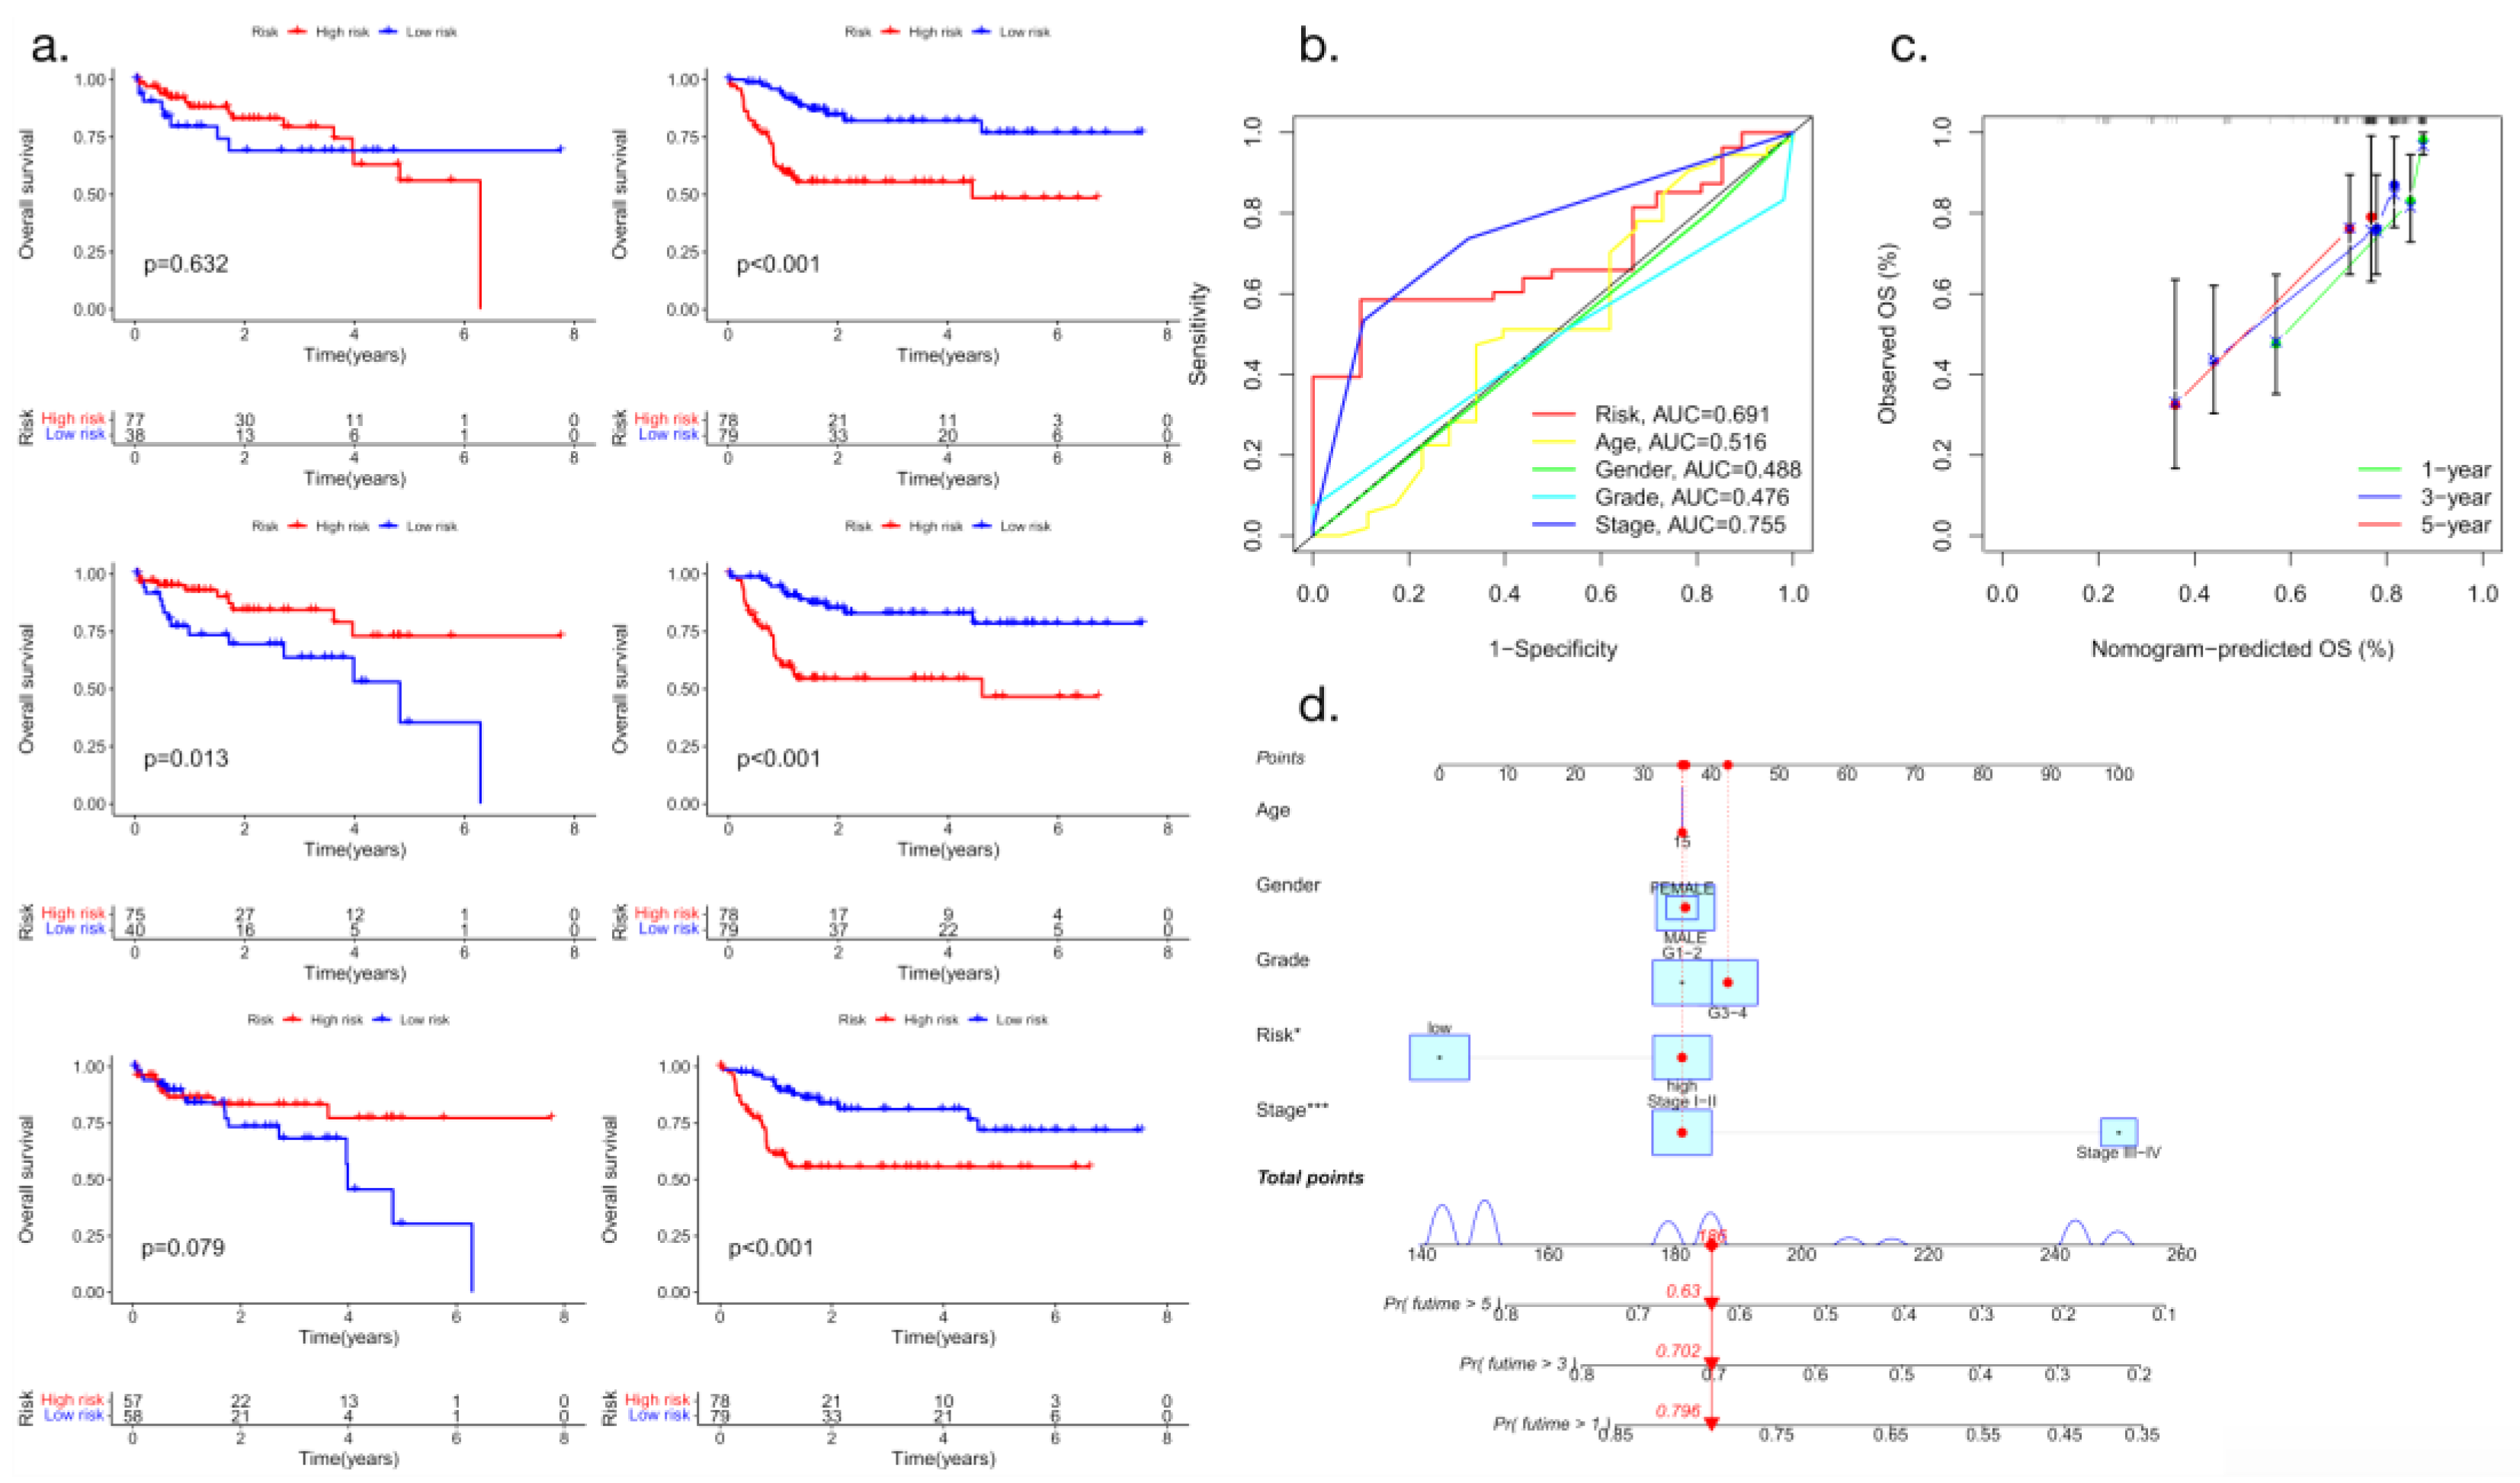
The macrophage activation-related genes ALDH2, CCNB2, CYP2C9, CYP3A4, F9 and KLKB1 were found to be significantly correlated with OS in patients with liver cancer. The multifactor Cox regression coefficient was used as a weight to construct a prognosis evaluation model of hepatocellular carcinoma associated with macrophage gene expression based on gene expression values. Patients with liver cancer were divided into a high-risk group and a low-risk group according to the median risk score. Compared with the low-risk group, patients in the high-risk group had significantly shorter OS (P< 0.05) (
Figure 6).
3.6. Analysis of clinical progression-free survival and immune cell infiltration
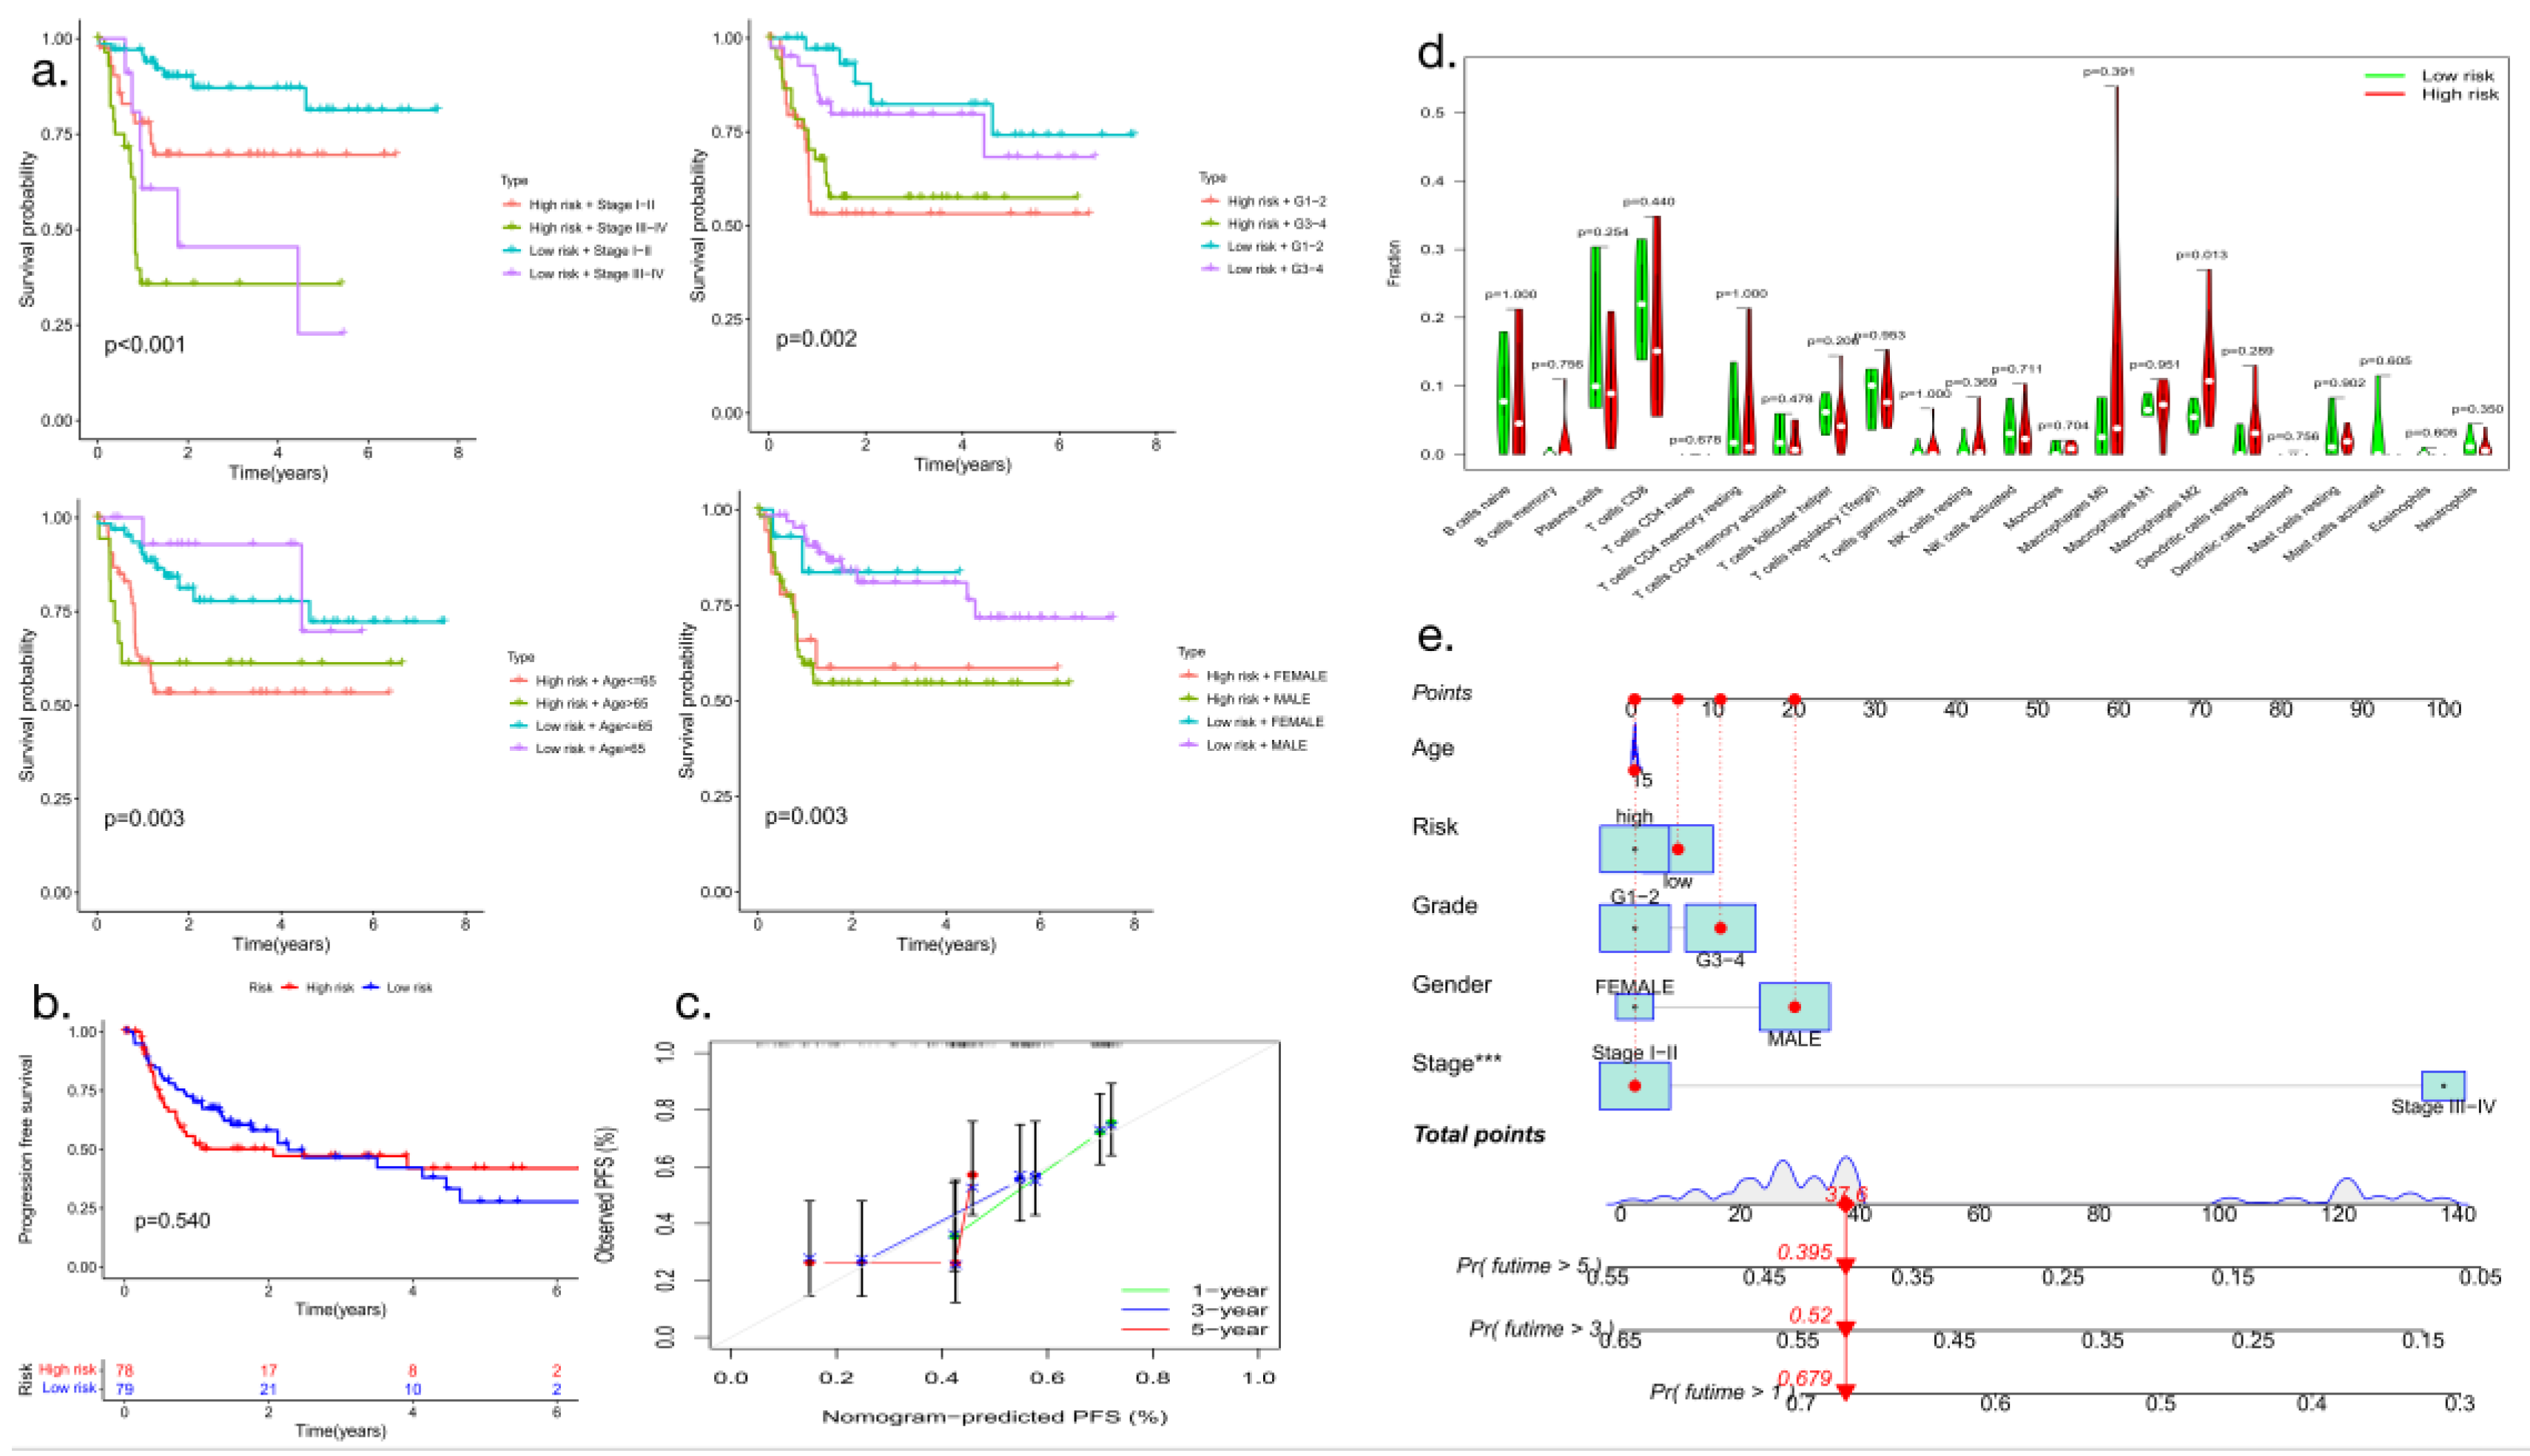
Patients who differed in the expression of macrophage-related genes had significant differences in HCC clinical stage, age, sex and tumor stage (P<0.05) (
Figure 7a), and their progression-free survival also showed statistically significant differences (
Figure 7b). Analysis of the recruitment of immune cells in hepatocellular carcinoma showed that the expression of prognostic genes related to hepatocellular carcinoma correlated with tumor invasion by various types of immune cells and that the numbers of M0- and M2-type macrophages differed significantly in high- and low-risk patients (P<0.05) (
Figure 7d). Nomogram-predicted PFS is shown below (
Figure 7c and
Figure 7e).
3.7. GSEA and calculation of the tumor mutation risk score
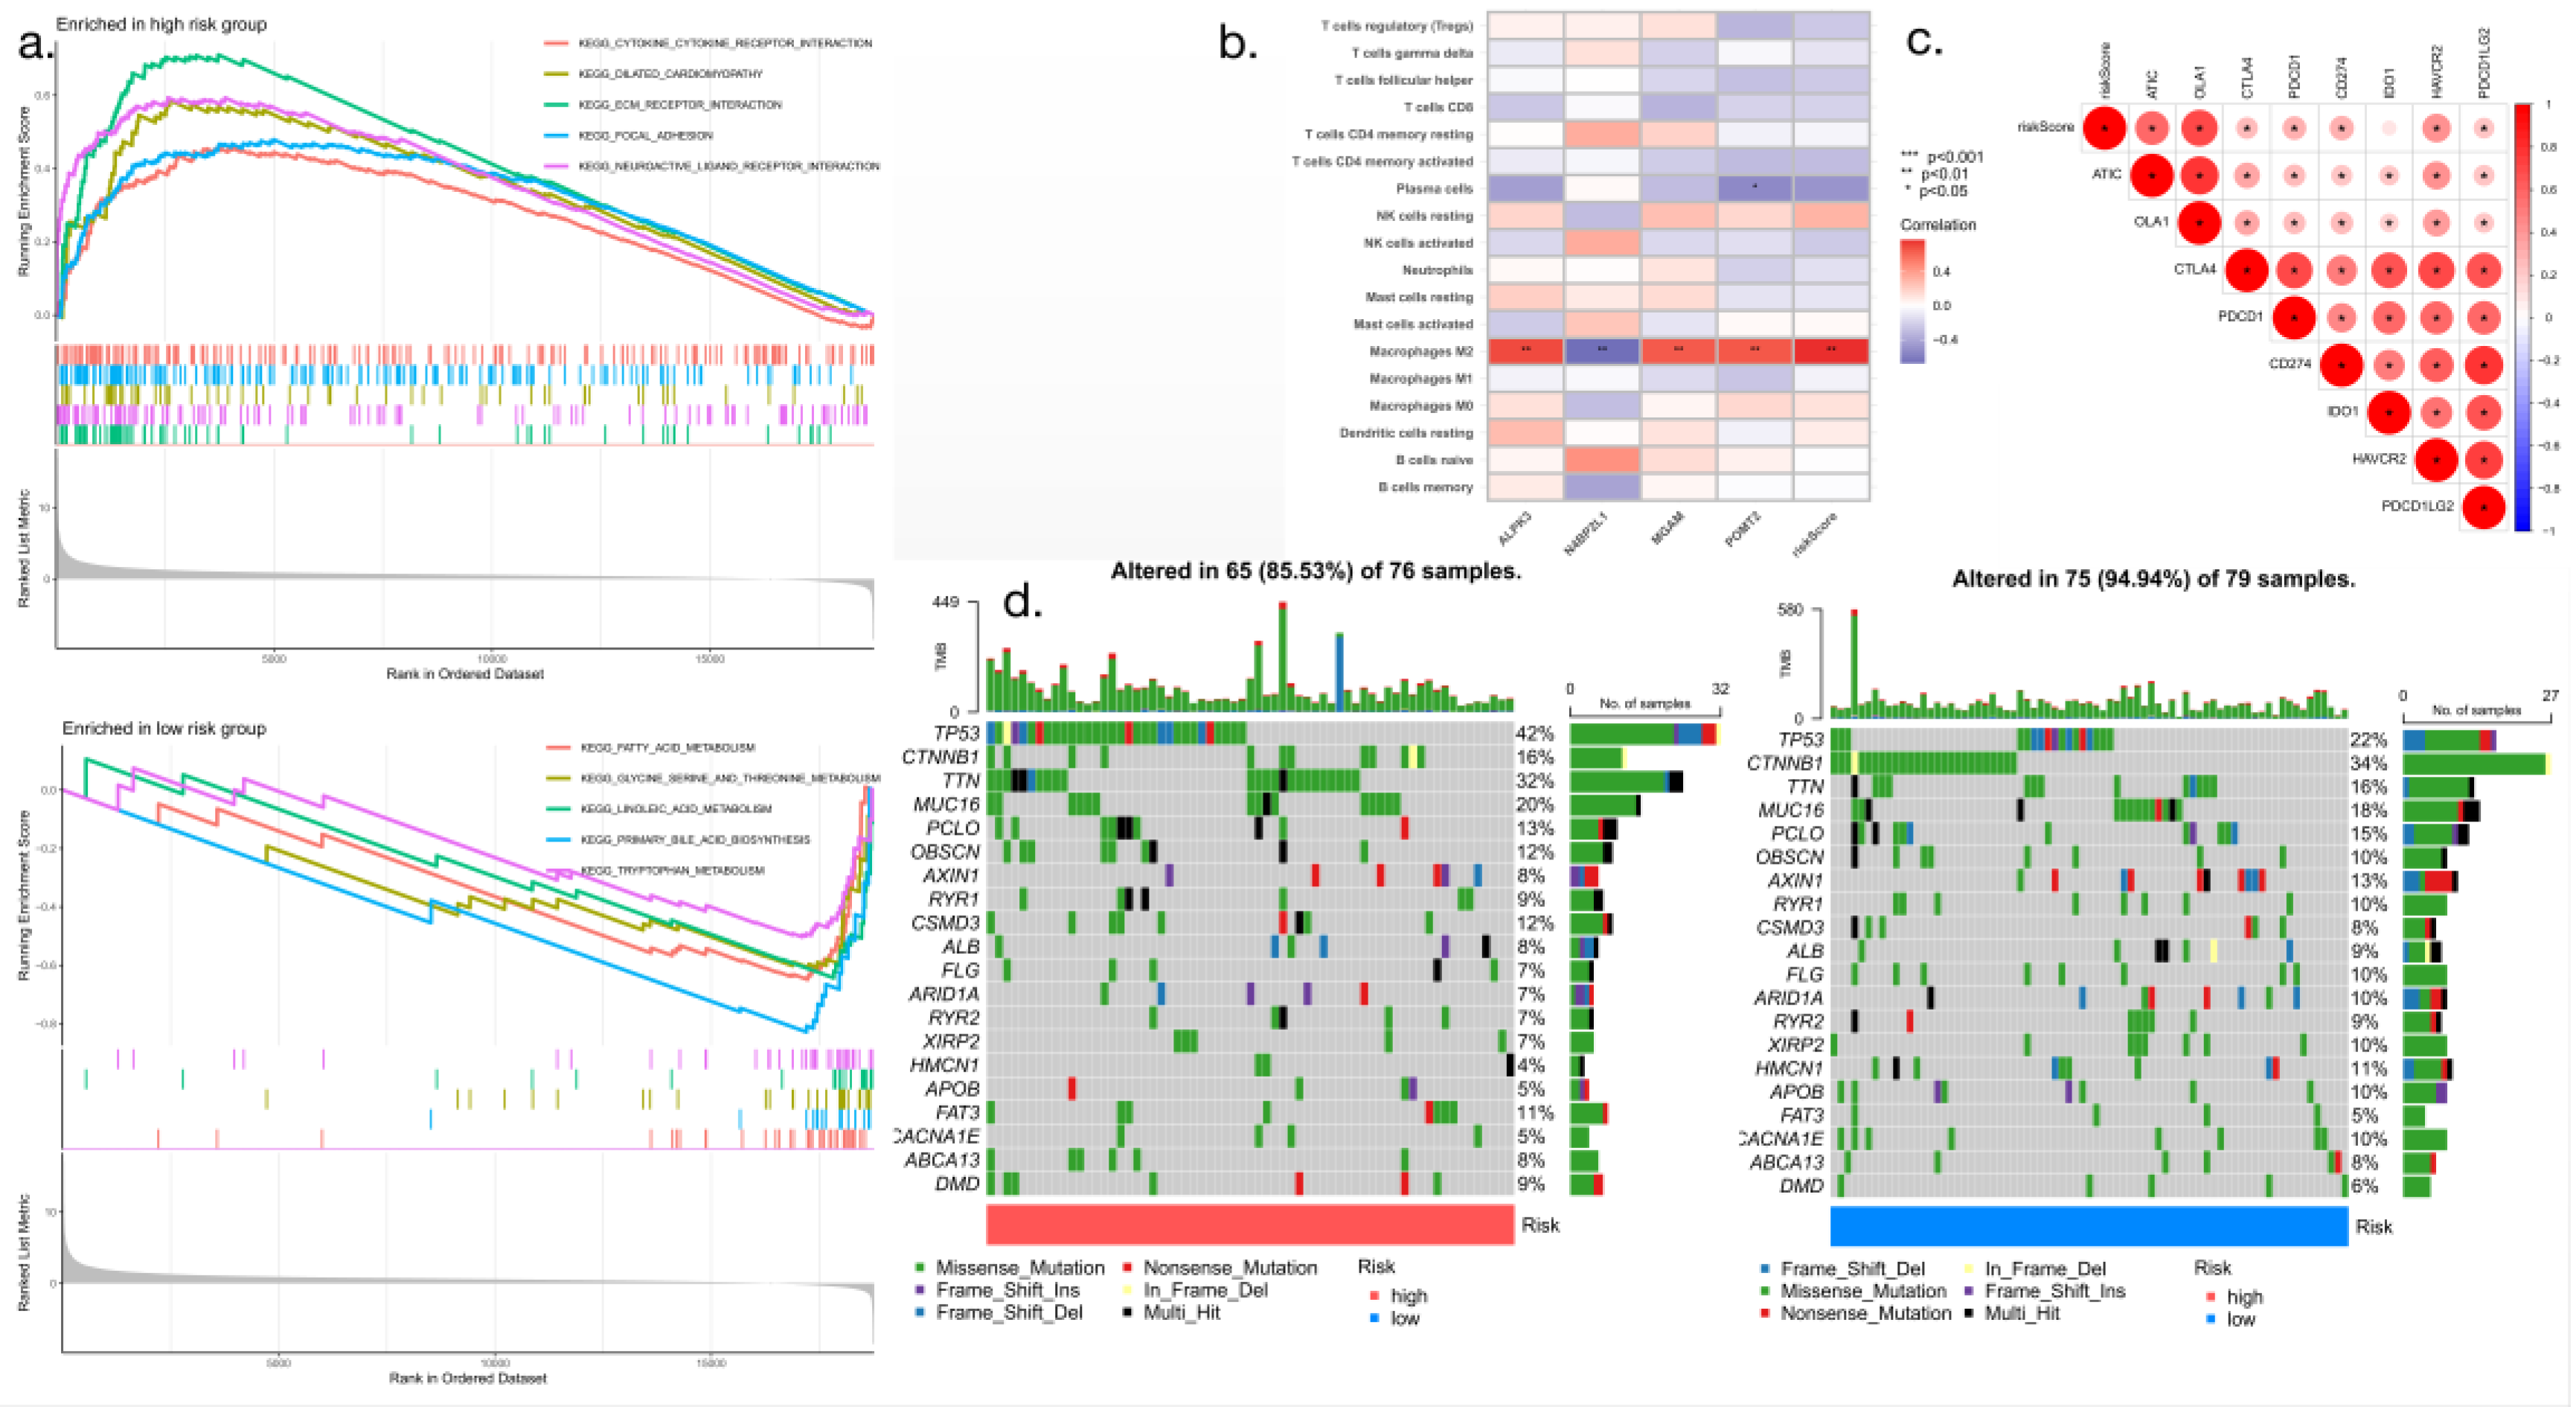
The results of GSEA showed the enriched signaling pathways and biological functions associated with the high-risk and low-risk groups (
Figure 8a), and the correlation analysis of immune cells showed the relationship between the risk scores of patients with hepatocellular carcinoma and the presence of different types of immune cells. Three prognostic model genes of hepatocellular carcinoma were evaluated, using the risk score as the horizontal coordinate and the type of immune cell as the vertical coordinate. As shown in the
Figure 7, M2-type macrophages were the most prevalent type of immune cell in the microenvironment of hepatocellular carcinoma (P<0.001) (
Figure 8b). Immune checkpoint correlation analysis showed that the levels of expression of ATIC, OLA1, CTLA4, PDCD1, CD264, IDO1, HAVCR2 and PDCD1LG2 correlated with higher risk scores (
Figure 8c). The use of a waterfall diagram makes it possible to obtain specific information on mutations for each sample and to comprehensively understand the overall situation for each group of samples; this can well show the mutation situation. Waterfall charts were constructed for the high-risk and low-risk groups. The waterfall charts of the 76 patients in the high-risk group indicated a tumor mutation rate of 85.53%, while the waterfall charts of the 79 patients in the low-risk group indicated a tumor mutation rate of 94.94%; the two groups of genes were consistent, and no statistically significant difference was observed (
Figure 8d).
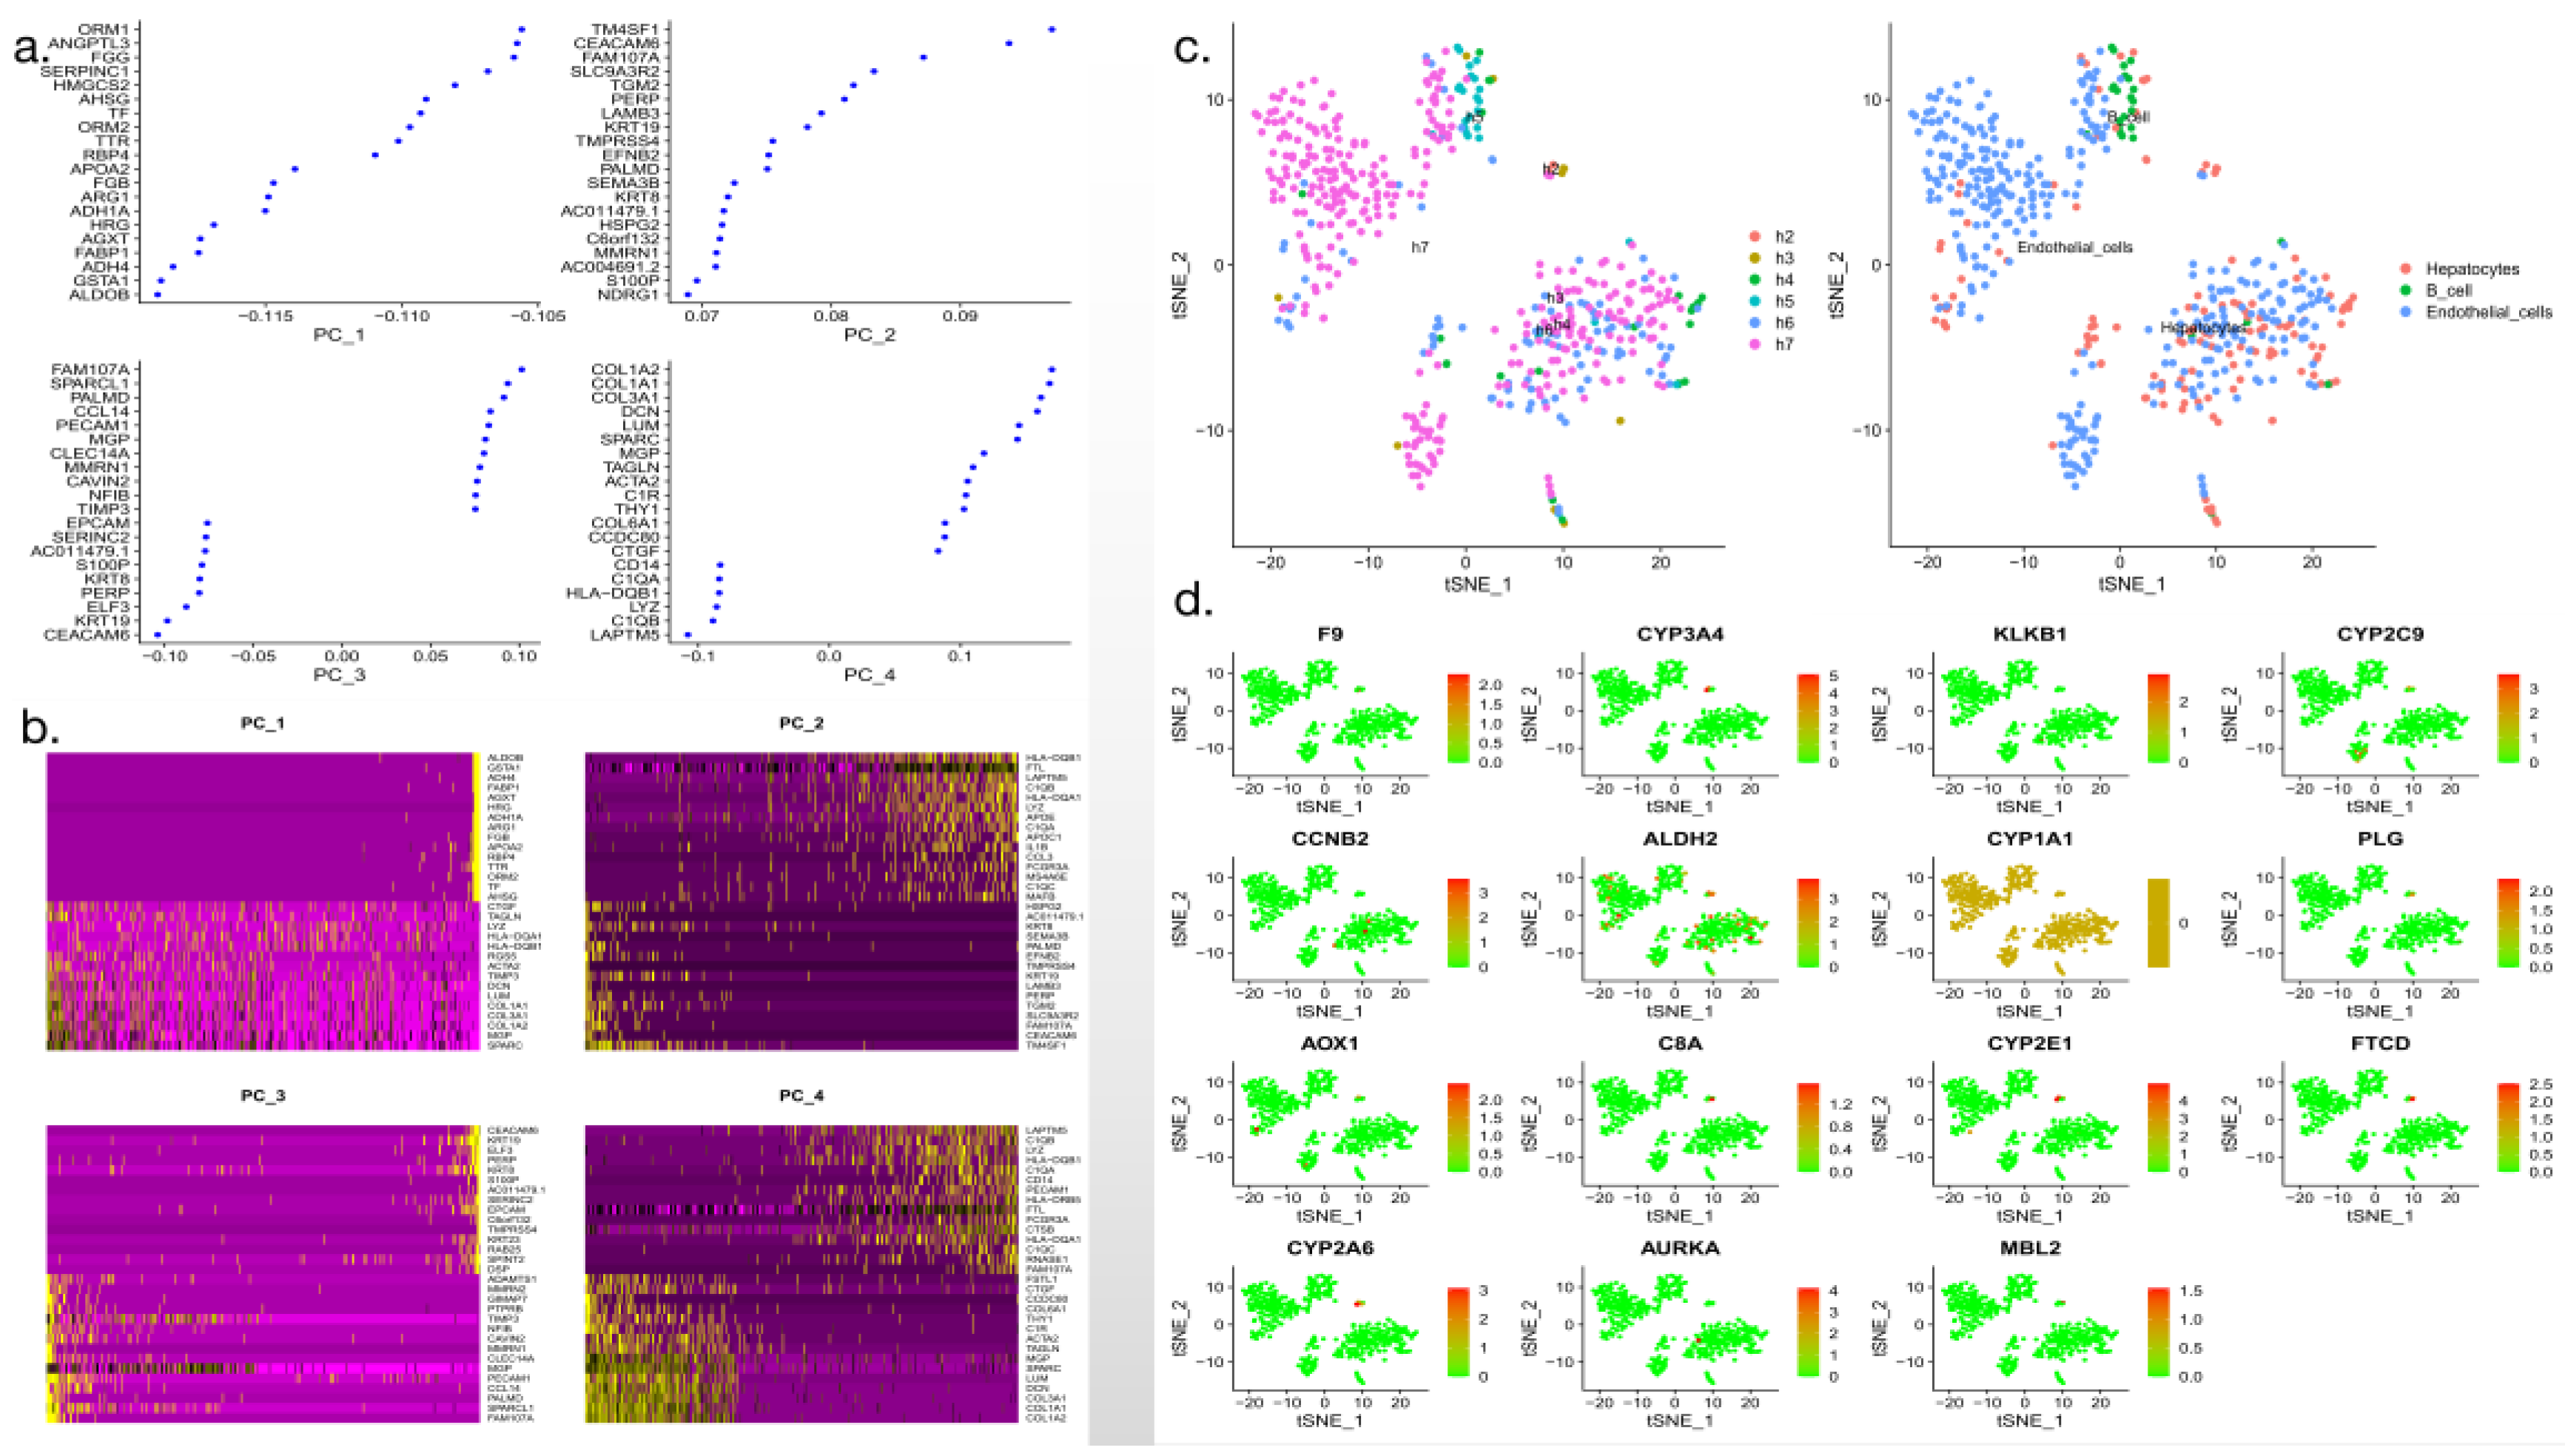
3.8. Single-cell cluster analysis
Cluster analysis was performed using single-cell data. The data were divided into subgroups, and cell types and categories were marked according to cell annotations. In the figure, cells belonging to different subgroups are shown in different colors to facilitate cell communication analysis. The specific transformation is shown in
Figure 9.
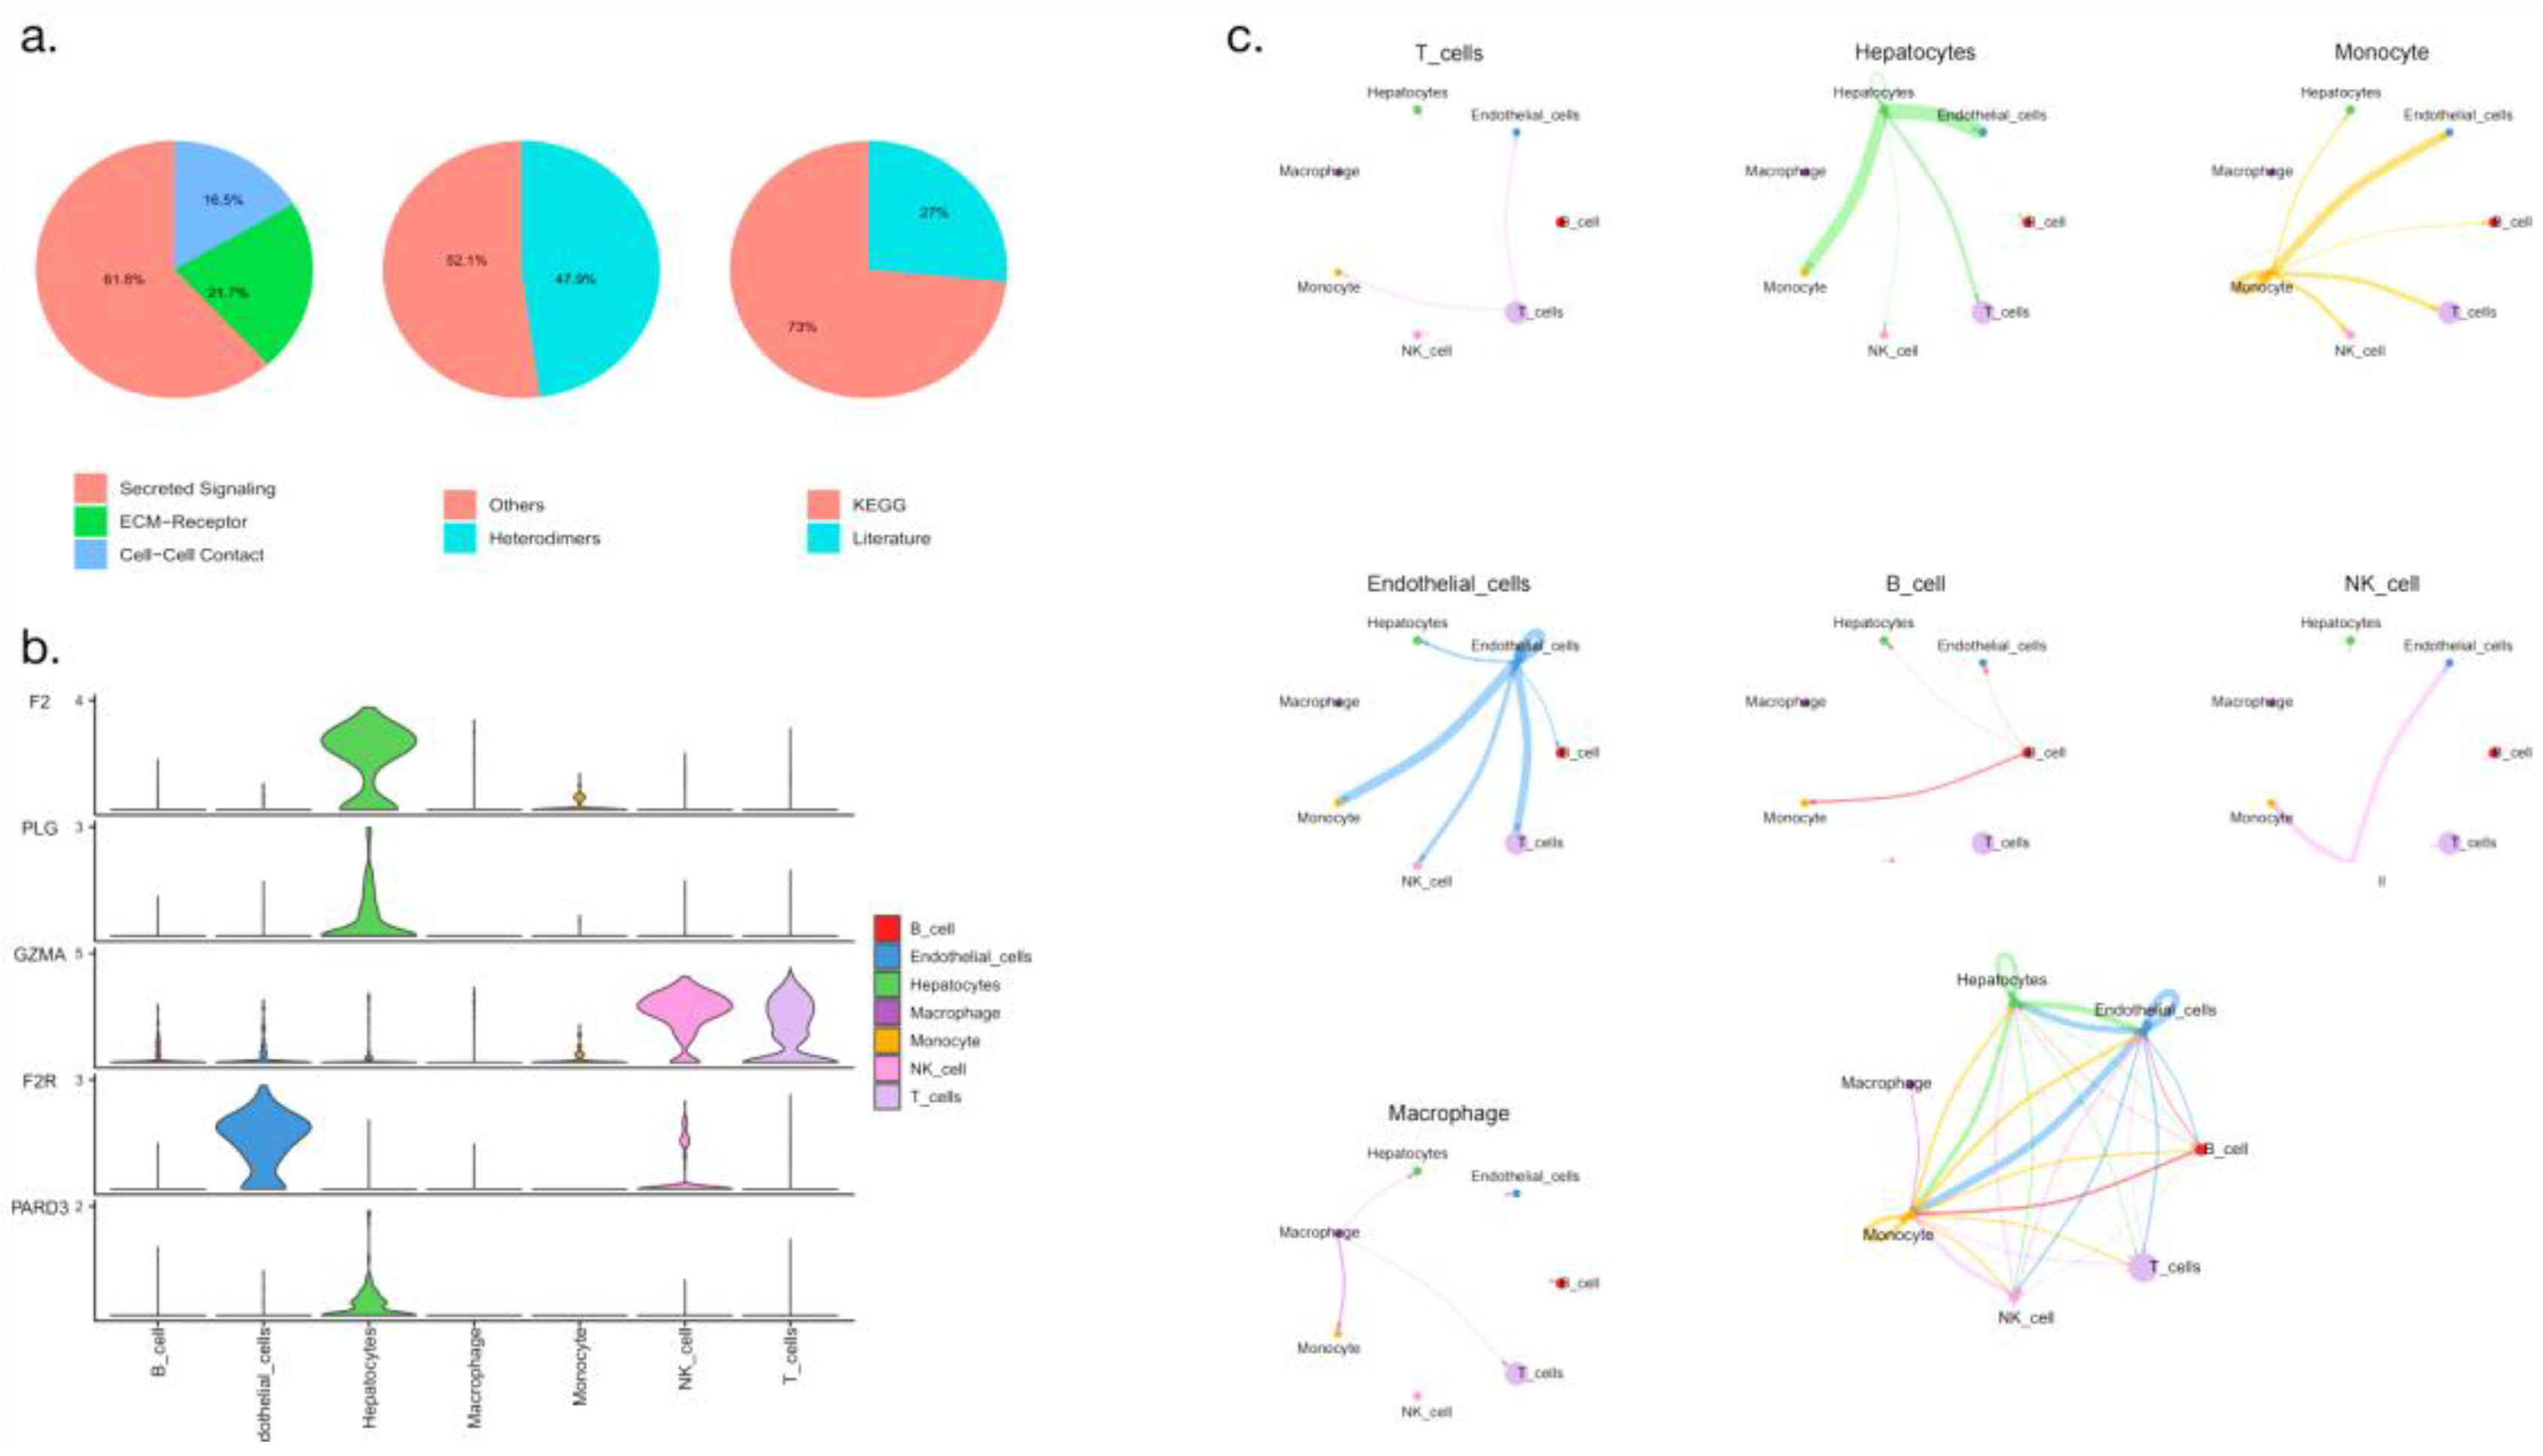
3.9. Difference analysis of cell communication
Cell communication analysis is based on the relationship between ligands and receptors through which cells form information communication transmission networks; in the analysis, nodes represent cell types. The intercellular relationship between receptors and ligands is shown in
Figure 10a. Cell communication-related differentially expressed genes were also associated with hepatocellular carcinoma cell populations, among which NK cells, T cells, hepatocytes and endothelial cells were the most significant (
Figure 10b). We also found that macrophages, NK cells, B cells and T cells were closely connected (
Figure 10c).
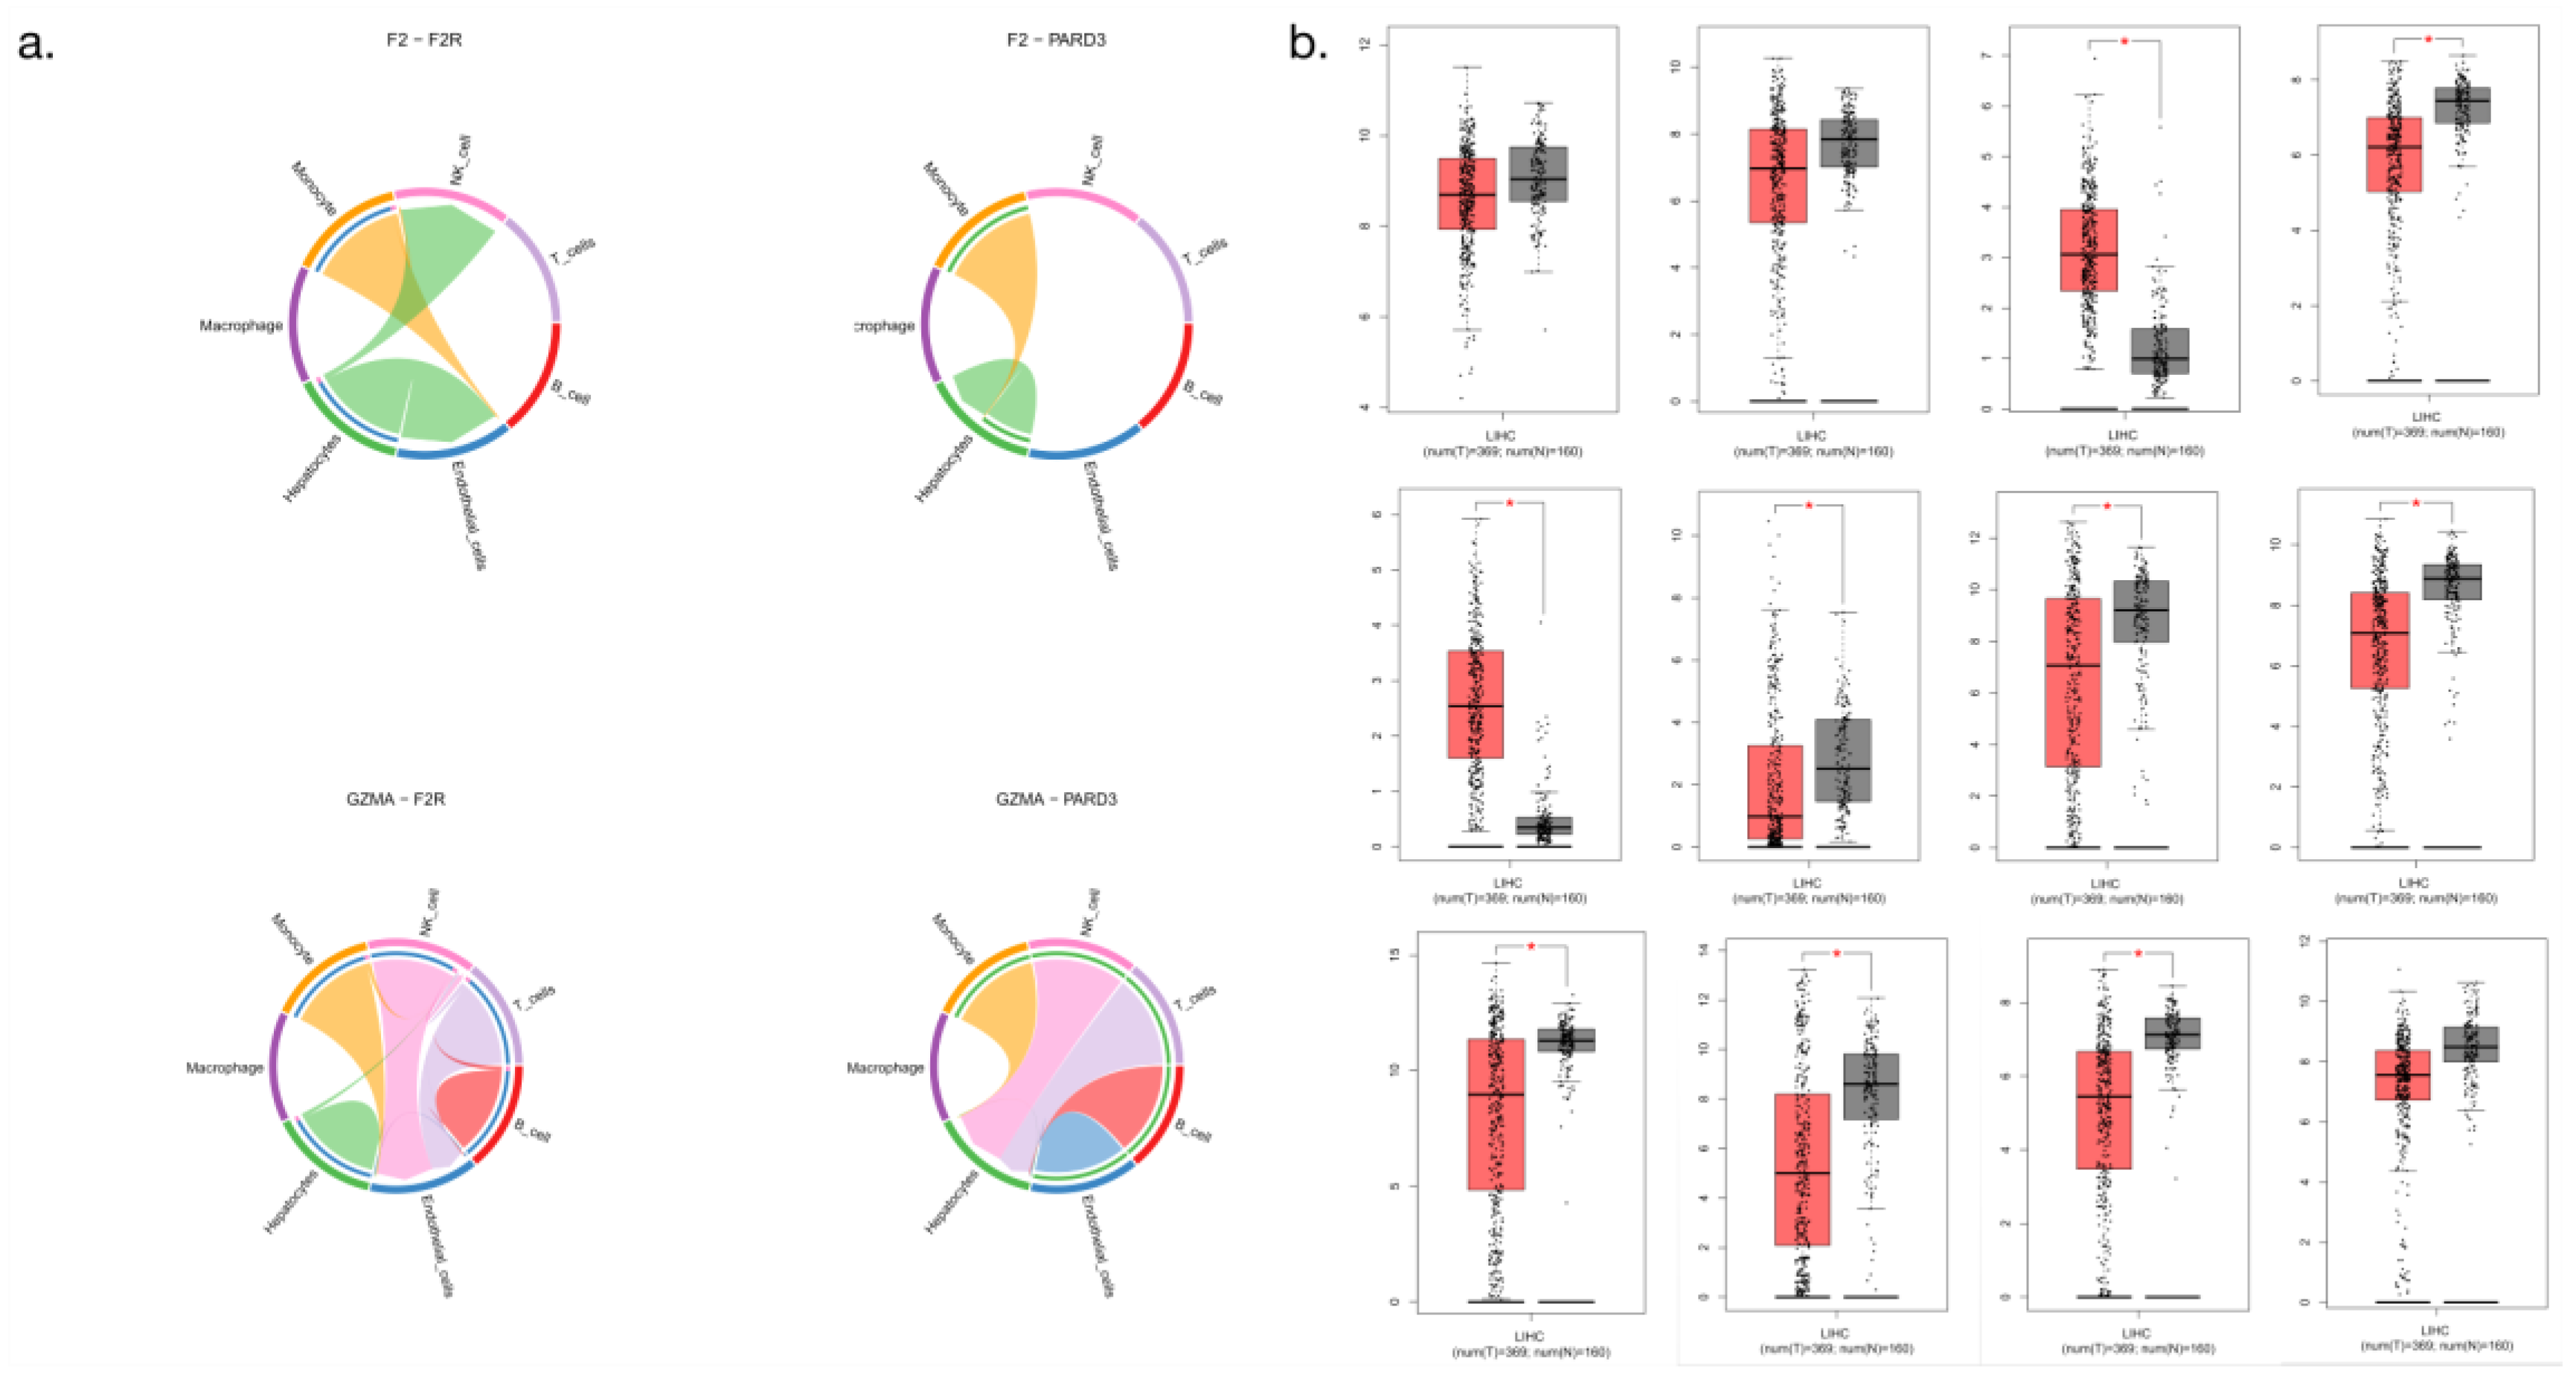
3.10. Differential analysis of cell communication core genes
We divided the hepatocellular carcinoma tissue and the paracancerous tissue into two groups. The expression levels of the core genes of cell communication between the two groups were calculated. The results of the circle analysis showed infiltration of the recruited immune cells around hepatocellular carcinoma, and the data for different experimental groups showed significant differences in LIHC (
Figure 11).
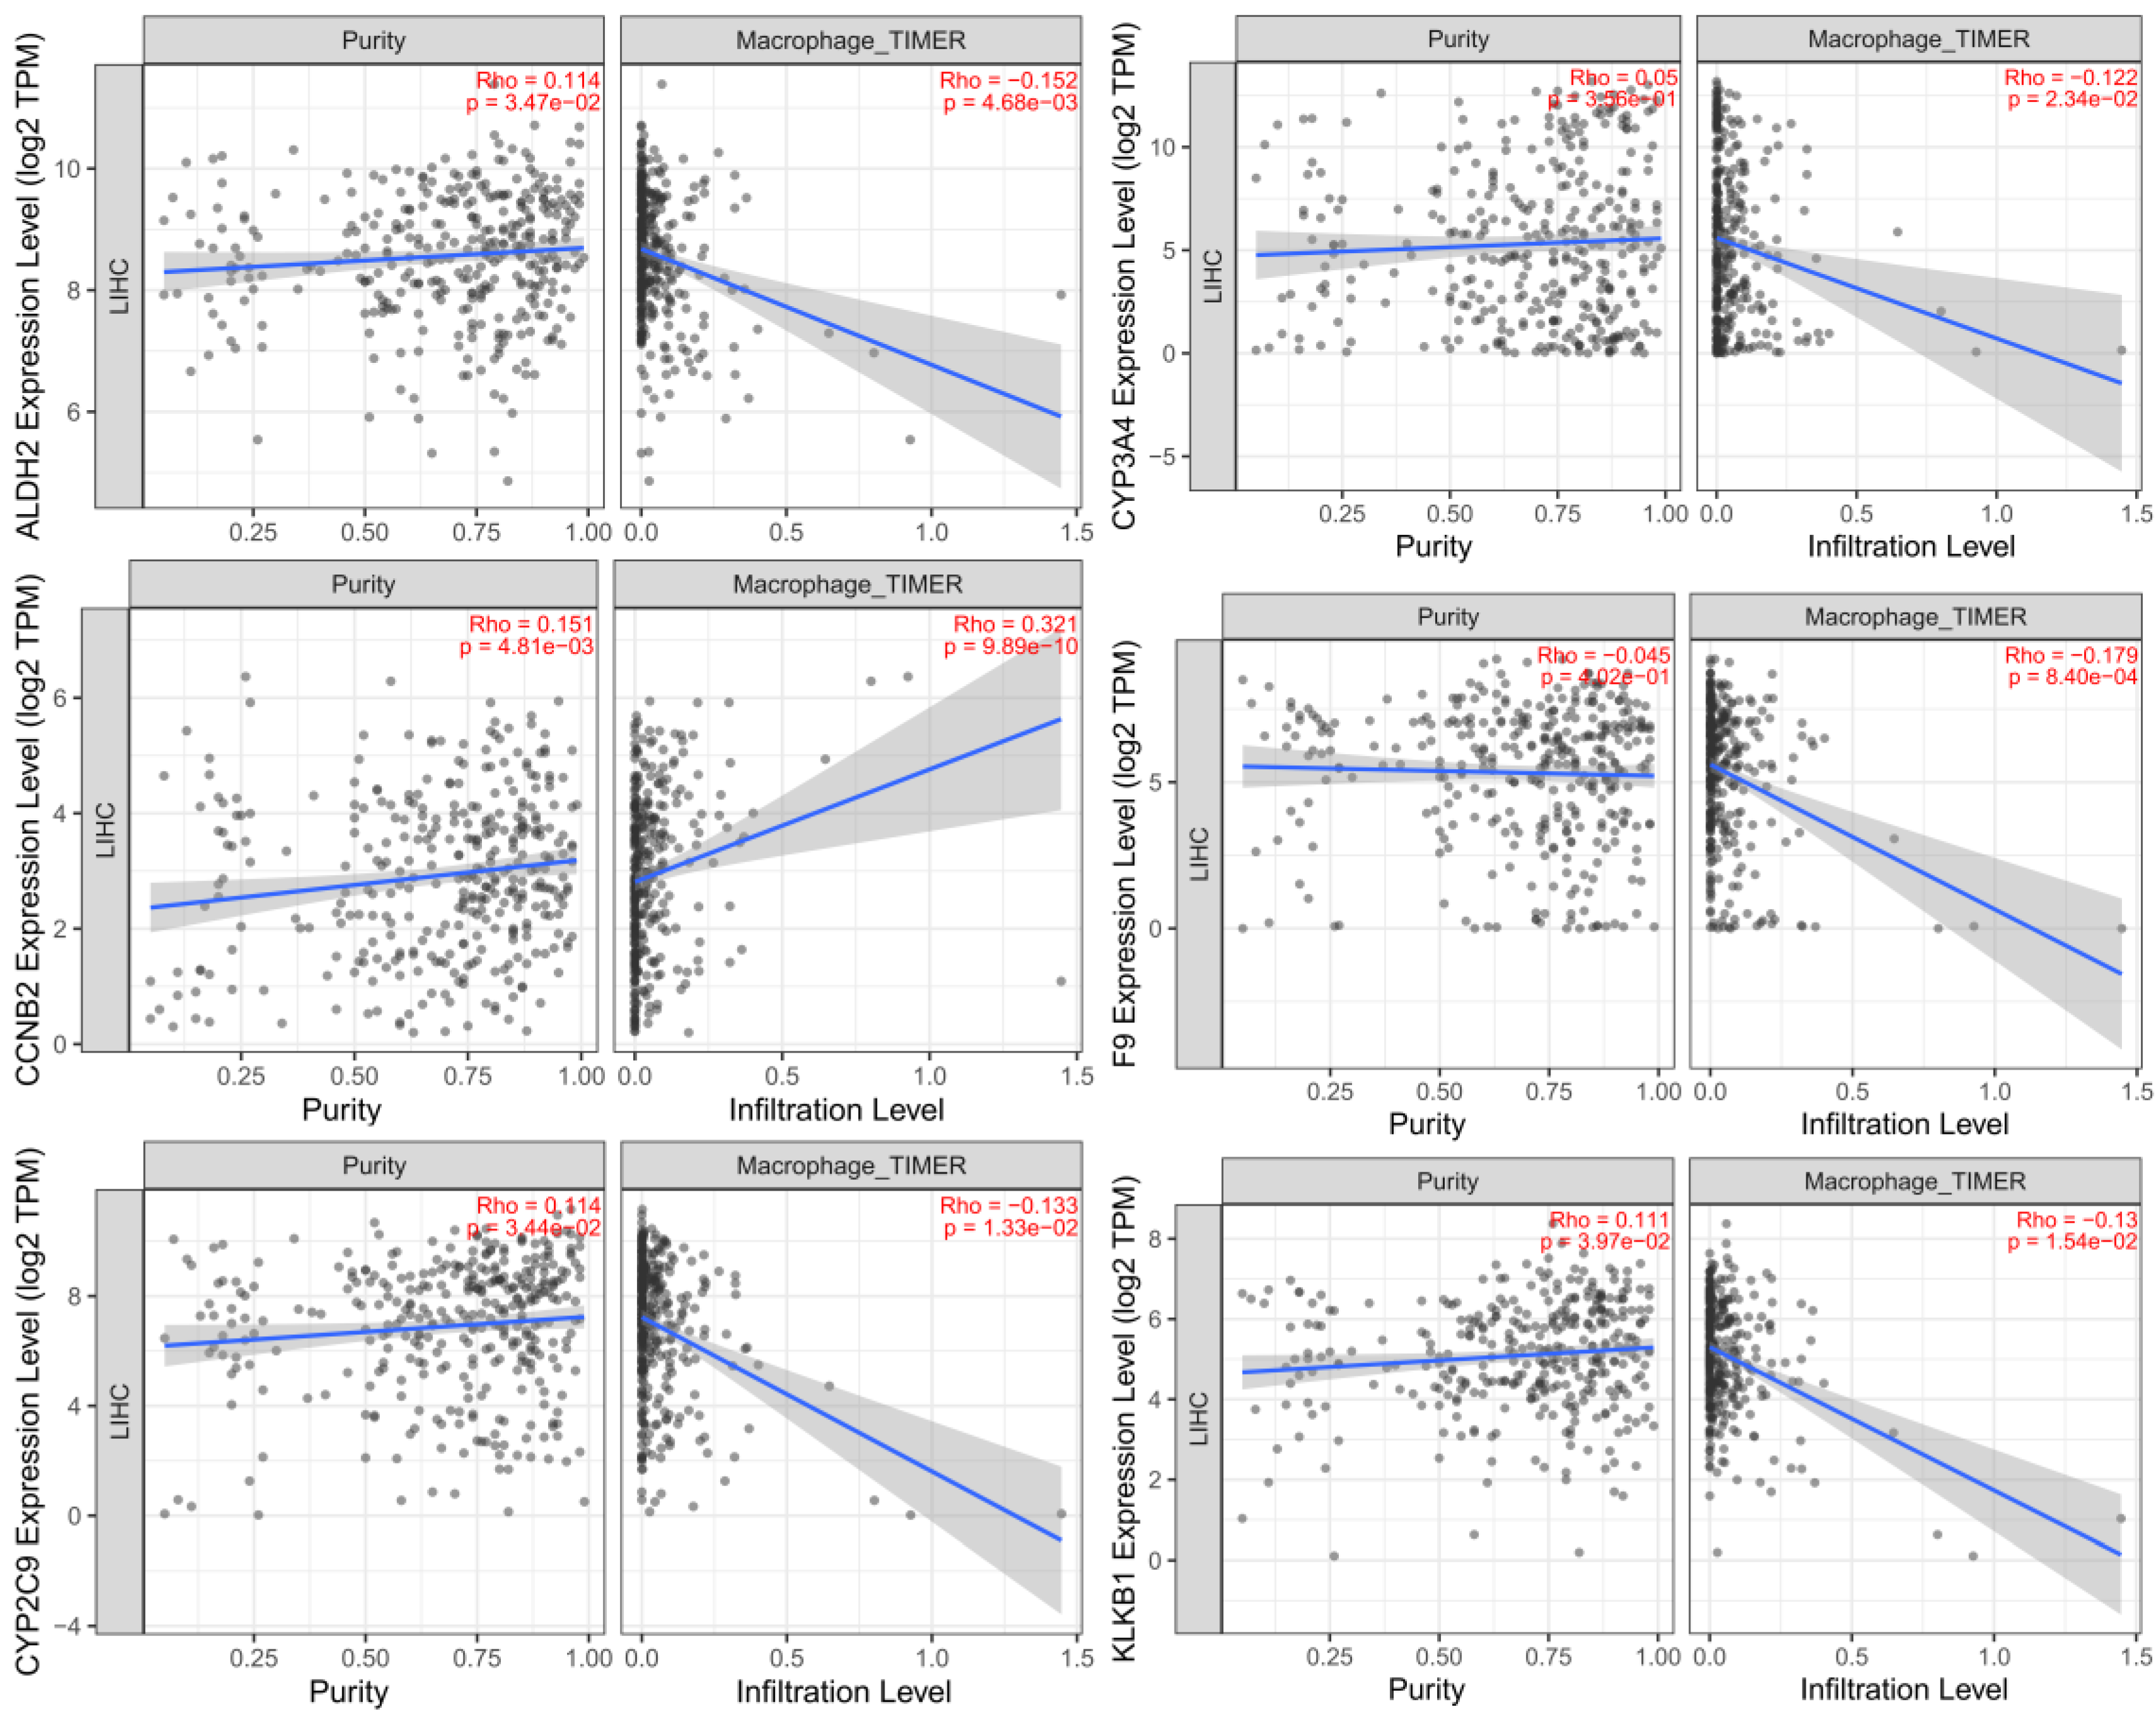
3.11. Analysis of the relationship between M2-type macrophages and cell communication
The results of immune cell correlation analysis showed that there was a correlation between M2-type macrophages and cell communication and that these factors jointly affected the expression of genes related to the prognosis of hepatocellular carcinoma. We included tumor purity in the calculation as a means of correcting the correlation coefficients between the two parameters and plotted numerous coefficient values into trend line charts. The macrophage activation-related genes ALDH2, CCNB2, CYP2C9, CYP3A4, F9 and KLKB1 showed the most significant correlations (
Figure 12).
3.12. Detect polarization of macrophages by PCR and Western blot
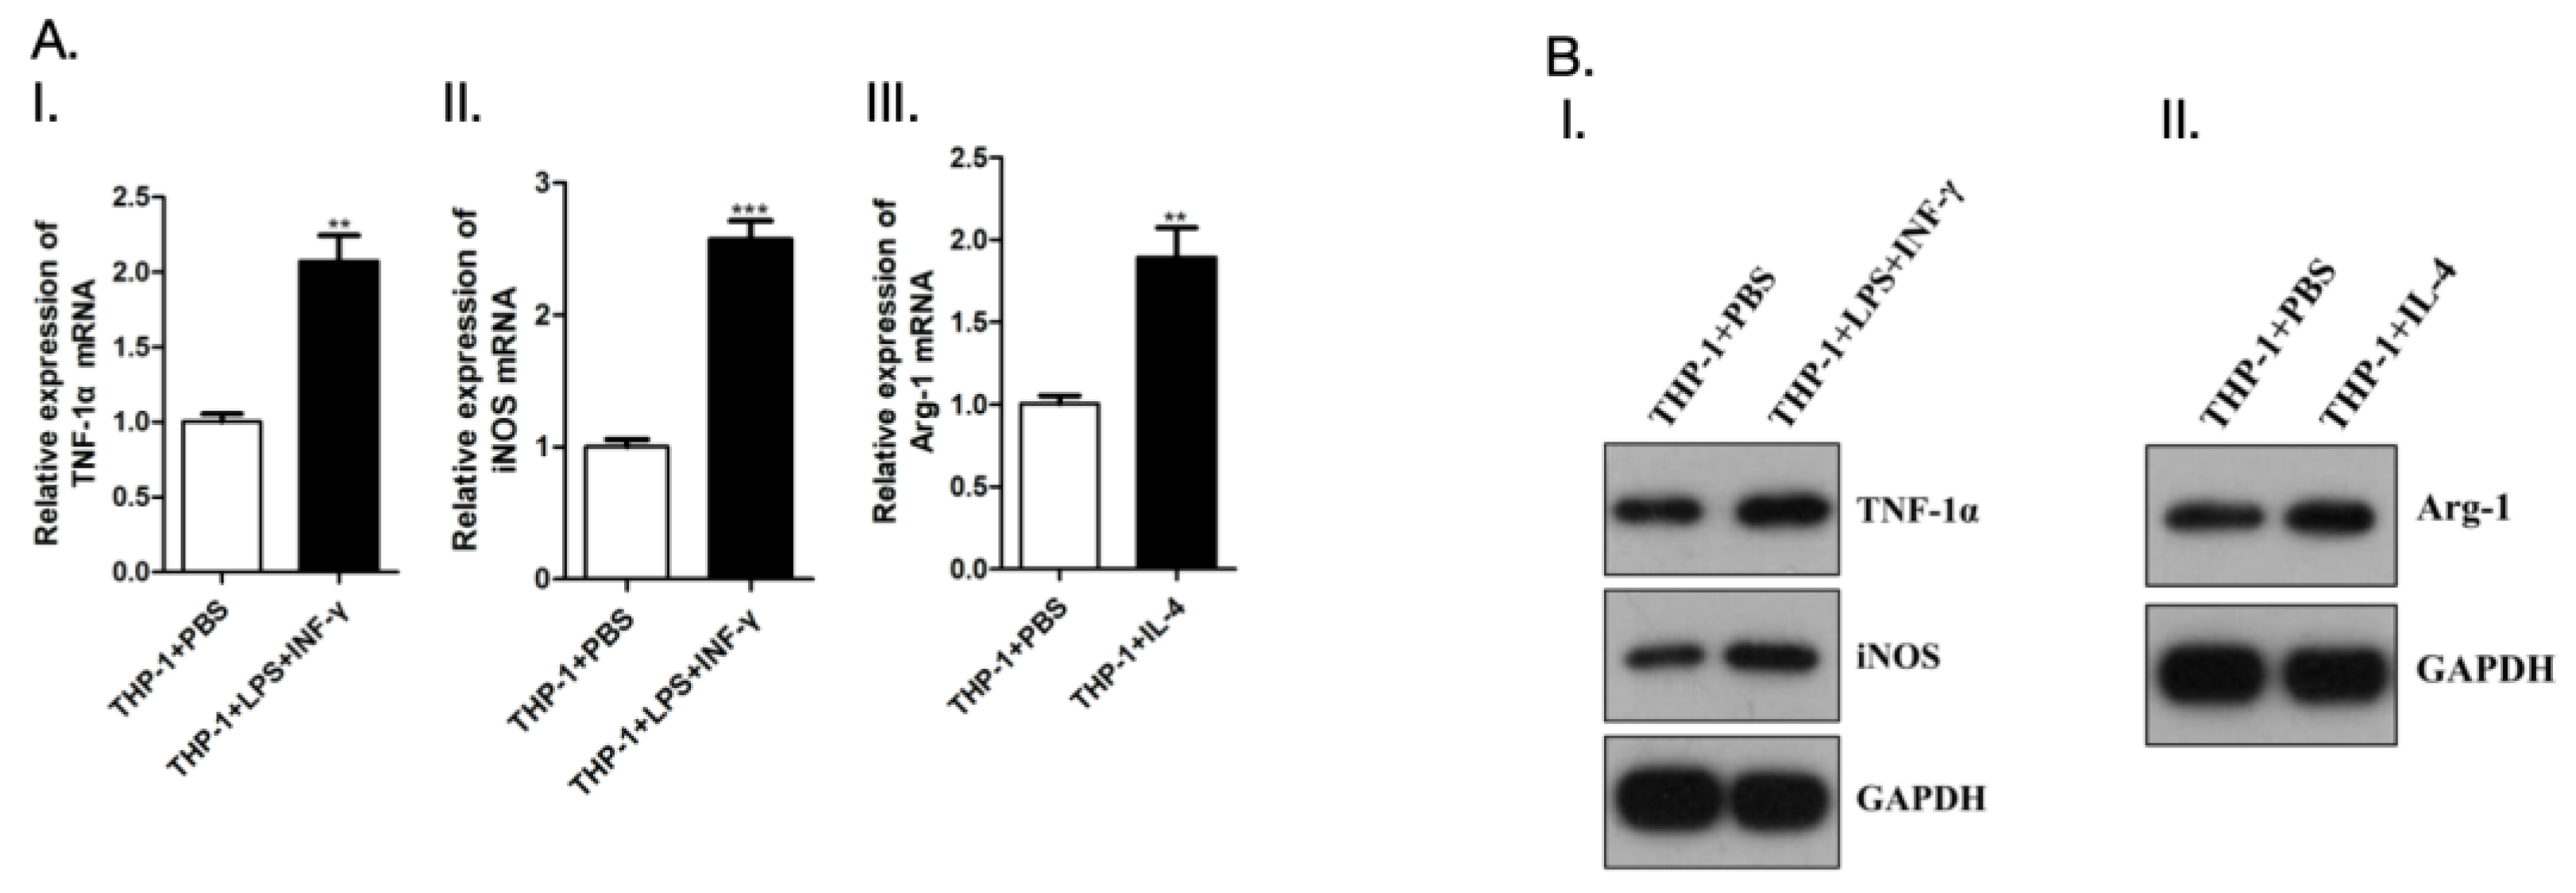
Compared with PBS group, LPS+INF-γ treated THP-1 cells showed increased mRNA expression levels of TNF-1α and iNOS. In addition, mRNA expression level of Arg-1 increased after IL-4 treatment of THP-1 cells compared with PBS group (
Figure 13), The purity was determined on the nucleic acid protein detector, and the concentration and OD value were recorded(
Table 4).
3.13. The apoptosis of macrophages induced detected by flow cytometry
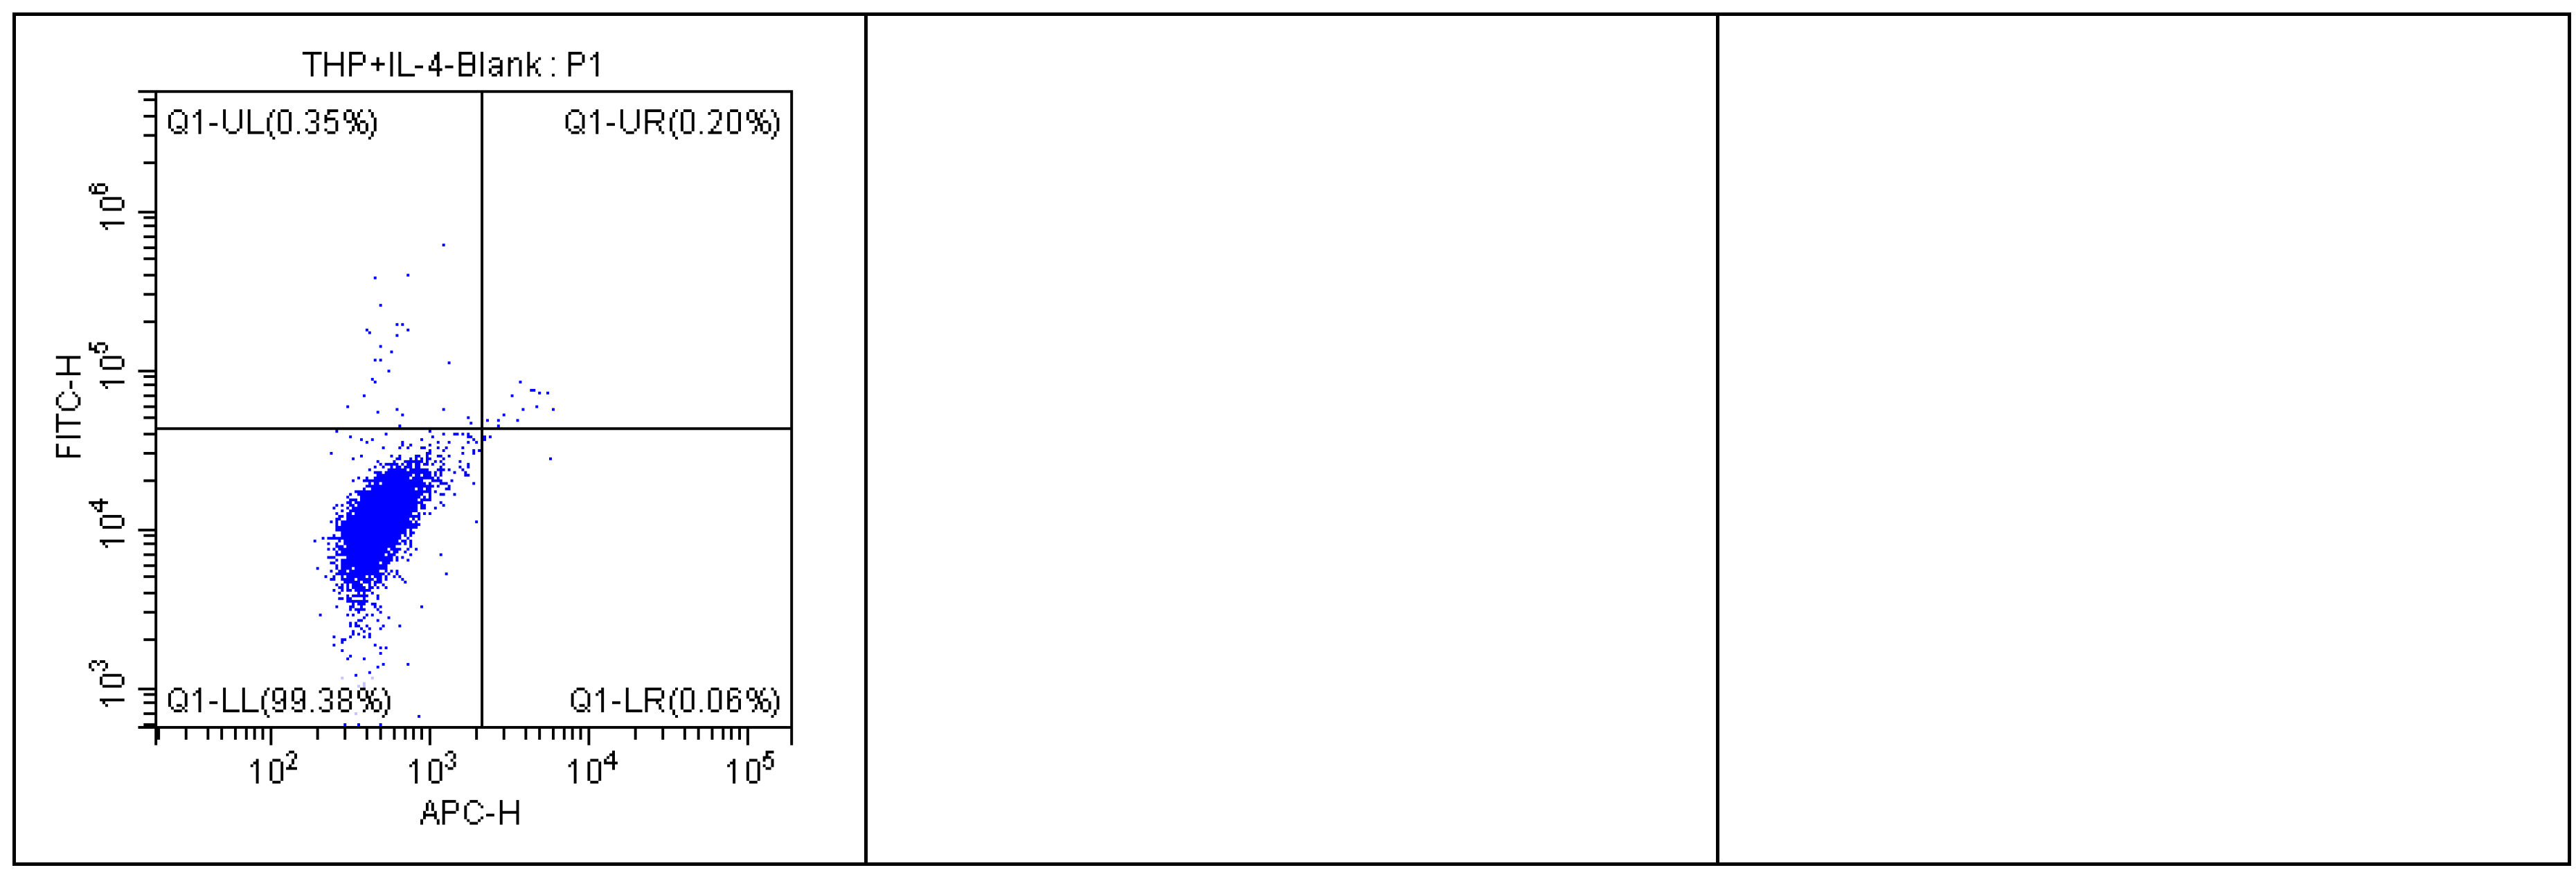
The polarization of tumor-associated macrophages (TAM) in liver cancer cells was investigated by flow cytometry. In the experiment, we used THP-1 cell model to induce macrophages and paid attention to their apoptosis. The results showed that THP-1 macrophages showed a significant apoptosis trend after induction. This trend suggests that TAM may play an anti-tumor role in the microenvironment of liver cancer cells through the apoptotic pathway. The experiments also revealed that apoptotic macrophages undergo significant changes at the level of gene expression, involving multiple immunoregulatory and anti-tumor pathways. Overall, our study provides a new understanding of the polarization of TAM in the liver cancer microenvironment and provides important clues for further analysis of its mechanism of action (
Figure 14 and
Table 5).
4. Discussion
Research on liver cancer has been intensively pursued in the medical field for a long time [
21]. The use of bioinformatics to search for potential therapeutic targets that can be used in the treatment of liver cancer is of great significance. Liver cancer is one of the most common malignancies in China, ranking 4th among new cancer cases and second among cancer deaths according to data on malignancies released by the National Cancer Center [
22,
23,
24]. Cancer has become a serious threat to human health, and there are varying degrees of morbidity due to cancer around the world [
25]. Among cancers, hepatocellular carcinoma is one of the most common malignant tumors, and annual morbidity and mortality due to hepatocellular carcinoma are high, seriously threatening human life and health. Analysis of the existing data shows that liver cancer rates and deaths are highest among men under 60 years of age. Etiological analysis shows that a variety of factors are closely related to the occurrence of liver cancer; these include alcoholism, obesity and chronic hepatitis caused by viral infection, a condition that then develops into cirrhosis and eventually leads to the occurrence of liver cancer [
26].
The occurrence of hepatocellular carcinoma is a complex process in which the tumor microenvironment, in addition to the conditions encountered by hepatocellular parenchymal cells, plays an important role [
27]. The tumor microenvironment has several main components. First, stromal cell fibroblasts, liver astrocytes, endothelial cells, immune cells, and tumor-associated fibrocytes (CAFs) are key components that are capable of producing EGF, FGF, HGF, IL-6, chemokines and metalloproteinases that promote tumor development [
28]. Hepatic astrocytes are mainly responsible for liver collagen synthesis and promote tumor growth through the ERK signaling pathway [
29]. Second, growth factors and inflammatory cytokines, including TGF-B, PDGF, IL-1, IL-6, TNF-a, and other cytokines, are found in the tumor microenvironment. IL-6 is highly expressed in the sera of HCC patients and is closely related to poor prognosis. Studies have found that IL-6 inhibits apoptosis of cancer cells and promotes their proliferation by activating the STAT3 signaling pathway [
30]. TNF is mainly secreted by Kupfer cells and some immune cells; it can promote tumor immune escape, inhibit the antitumor immune response of CD8+ T lymphocytes, promote fatty liver and steatohepatitis, and promote the occurrence and development of liver cancer [
31].
The main mitochondrial enzyme that protects cells from acetaldehyde toxicity is acetaldehyde dehydrogenase 2 (ALDH2) [
32]. An association of ALDH2 dysfunction with tumor occurrence, growth, and metastasis has been widely reported. Both low and high expression of ALDH2 contribute to tumor progression, and ALDH2 expression varies in different tumor types. ALDH2 belongs to the acetaldehyde dehydrogenase family; it contains 517 amino acid residues and consists of 4 identical subunits that form a homologous tetramer that stabilizes the protein structure. Each subunit has three domains, a catalytic domain, a coenzyme (nicotinamide adenine dinucleotide, NAD) domain and an oligomerization domain. ALDH2 is therefore an important participant in the redox reaction of ethanol with endogenous aldehyde products released by lipid peroxidation [
33]. Inactive ALDH2 rs671 or low expression of ALDH2 leads to accumulation of aldehydes, 4-hydroxy-2-nonenal (4-HNE), and malondialdehyde (MDA), all of which are associated with increased incidence of cancer. This study revealed that ALDH2 is not only involved in aldehyde metabolism but also plays a key role in tumor growth. ALDH2 is mainly located in the mitochondria and cytoplasm. However, exosomes from the urine of normal people have been found to contain large amounts of ALDH2 [
34]. This suggests that ALDH2 may have functions in addition to those discussed in this study. Heterozygous or homozygous deficiency of ALDH2 is associated with a higher risk of cancer of the upper digestive tract in people who consume alcohol and smoke. Hepatocellular carcinoma patients with high expression of ALDH2 tend to have a good prognosis. Interestingly, ALDH2 is a biomarker of cancer stem cells (CSCs) and is associated with tumor proliferation and metastasis and with multidrug resistance (MDR) to cancer cell chemotherapy agents [
35].
Macrophages, most of which are derived from bone marrow monocytes, are very important immune cells in the human body. As an important part of innate immunity, they directly engulf and kill foreign bacteria, fungi, parasites and other pathogens [
36]. In addition, they release a variety of immune factors, stimulate other adaptive immune cells to present foreign antigens to T cells and participate in stimulating adaptive immune function through antigen presentation. Macrophages can be polarized in different directions under the influence of different microenvironments and stimulating factors [
37]. According to their activation states, functions and cytokine secretion profiles, macrophages can be divided into classically activated M1 macrophages, which are proinflammatory, and selectively activated M2 macrophages, which are anti-inflammatory [
38]. M1-type macrophages can be induced by IFN-γ, LPS, and GM-CSF. By releasing inflammatory mediators such as IL-1, M1-type macrophages promote the inflammatory response, kill intracellular infectious pathogens, and exert antitumor effects [
39]. M2-type macrophages are induced by IL-4 and IL-13 and show high expression of CD206; they enhance endocytosis, secrete IL-10, TGF-β and other anti-inflammatory cytokines, promote Th2 cell differentiation, participate in immune regulation, tissue repair, wound healing, and angiogenesis, and promote tumor progression [
40].
It has been reported in the literature that M2-type macrophages participate in the tumor process by promoting the migration, invasion and growth of tumor cells and that tumor-related M2-type macrophages are involved in the occurrence of liver cancer. This study found that low expression of ALDH2 in hepatocellular carcinoma patients is associated with higher mortality and that it is closely related to clinical indicators.
5. Conclusions
The macrophage-associated activation gene ALDH2 induces the activation of molecules involved in the macrophage polarization signaling pathway and negatively regulates the differentiation of macrophages into M2-type macrophages.
Author Contributions
Jun Yan contributes to the conception or design of the work; Liusheng Wu analyzed the data and wrote the paper; Xinye Qian, Wang Hu and Shuang Wang contributes to the acquisition, analysis, or interpretation of data for the work; Xiaoqiang Li revised it critically for important intellectual content; All the authors revised it critically for important intellectual content, gave final approval of the version to be published and agreed to be accountable for all aspects of the work.
Funding
This work was supported by Scientific Research Project of Education Department of Anhui Province(YJS20210324), the National Natural Science Foundation of China (81972829), the Scientific Research Foundation of PEKING UNIVERSITY SHENZHEN HOSPITAL (KYQD2021096), Research and development of intelligent surgical navigation and operating system for precise liver resection(2022ZLA006), Start-up Fund for Talent Researchers of Tsinghua University (10001020507) and National Science and Technology Major Project of China (2017ZX100203205).
Institutional Review Board Statement
Our study does not contain data from any individual person or any animals.
Acknowledgments
The authors would like to express their gratitude to AJE for the expert linguistic services provided.
Conflicts of Interest
The authors declare no conflicts of interest.
References
- Yang F, Wei Y, Han D, et al. Interaction with CD68 and Regulation of GAS6 Expression by Endosialin in Fibroblasts Drives Recruitment and Polarization of Macrophages in Hepatocellular Carcinoma. Cancer Res. 2020 Sep 15;80(18):3892-3905.
- Wang MD, Xiang H, Zhang L, et al. Integration of OV6 expression and CD68+ tumor-associated macrophages with clinical features better predicts the prognosis of patients with hepatocellular carcinoma. Transl Oncol. 2022 Nov;25:101509.
- Zhang W, Gong C, Peng X, et al. Serum Concentration of CD137 and Tumor Infiltration by M1 Macrophages Predict the Response to Sintilimab plus Bevacizumab Biosimilar in Advanced Hepatocellular Carcinoma Patients. Clin Cancer Res. 2022 Aug 15;28(16):3499-3508.
- Ren CX, Leng RX, Fan YG, et al. Intratumoral and peritumoral expression of CD68 and CD206 in hepatocellular carcinoma and their prognostic value. Oncol Rep. 2017 Aug;38(2):886-898.
- Ye YC, Zhao JL, Lu YT, et al. NOTCH Signaling via WNT Regulates the Proliferation of Alternative, CCR2-Independent Tumor-Associated Macrophages in Hepatocellular Carcinoma. Cancer Res. 2019 Aug 15;79(16):4160-4172.
- Zhang QB, Jia QA, Wang H, et al. High-mobility group protein box1 expression correlates with peritumoral macrophage infiltration and unfavorable prognosis in patients with hepatocellular carcinoma and cirrhosis. BMC Cancer. 2016 Nov 11;16(1):880.
- Zhang H, Sheng D, Han Z, et al. Doxorubicin-liposome combined with clodronate-liposome inhibits hepatocellular carcinoma through the depletion of macrophages and tumor cells. Int J Pharm. 2022 Dec 15;629:122346.
- Zhang J, Chang L, Zhang X, et al. Meta-Analysis of the Prognostic and Clinical Value of Tumor-Associated Macrophages in Hepatocellular Carcinoma. J Invest Surg. 2021 Mar;34(3):297-306.
- Zhang Y, Li JQ, Jiang ZZ, et al. CD169 identifies an anti-tumour macrophage subpopulation in human hepatocellular carcinoma. J Pathol. 2016 Jun;239(2):231-41.
- Li JQ, Yu XJ, Wang YC, et al. Distinct patterns and prognostic values of tumor-infiltrating macrophages in hepatocellular carcinoma and gastric cancer. J Transl Med. 2017 Feb 15;15(1):37.
- Sun H, Song J, Weng C, et al. Association of decreased expression of the macrophage scavenger receptor MARCO with tumor progression and poor prognosis in human hepatocellular carcinoma. J Gastroenterol Hepatol. 2017 May;32(5):1107-1114.
- Kim YJ, Rhee H, Yoo JE, et al. Tumour epithelial and stromal characteristics of hepatocellular carcinomas with abundant fibrous stroma: fibrolamellar versus scirrhous hepatocellular carcinoma. Histopathology. 2017 Aug;71(2):217-226.
- Luo HL, Chen J, Luo T, et al. Downregulation of Macrophage-Derived T-UCR uc.306 Associates with Poor Prognosis in Hepatocellular Carcinoma. Cell Physiol Biochem. 2017;42(4):1526-1539.
- Liao R, Jiang N, Tang ZW, et al. Systemic and intratumoral balances between monocytes/macrophages and lymphocytes predict prognosis in hepatocellular carcinoma patients after surgery. Oncotarget. 2016 May 24;7(21):30951-61.
- Xiao P, Long X, Zhang L, et al. Neurotensin/IL-8 pathway orchestrates local inflammatory response and tumor invasion by inducing M2 polarization of Tumor-Associated macrophages and epithelial-mesenchymal transition of hepatocellular carcinoma cells. Oncoimmunology. 2018 Mar 13;7(7):e1440166.
- Ding W, Tan Y, Qian Y, et al. Clinicopathologic and prognostic significance of tumor-associated macrophages in patients with hepatocellular carcinoma: A meta-analysis. PLoS One. 2019 Oct 16;14(10):e0223971.
- Park DJ, Sung PS, Lee GW, et al. Preferential Expression of Programmed Death Ligand 1 Protein in Tumor-Associated Macrophages and Its Potential Role in Immunotherapy for Hepatocellular Carcinoma. Int J Mol Sci. 2021 Apr 29;22(9):4710.
- Ye Y, Guo J, Xiao P, et al. Macrophages-induced long noncoding RNA H19 up-regulation triggers and activates the miR-193b/MAPK1 axis and promotes cell aggressiveness in hepatocellular carcinoma. Cancer Lett. 2020 Jan 28;469:310-322.
- Chen W, Hu M, Wei T, et al. IL-1 receptor-associated kinase 1 participates in the modulation of the NLRP3 inflammasome by tumor-associated macrophages in hepatocellular carcinoma. J Gastrointest Oncol. 2022 Jun;13(3):1317-1329.
- Dong P, Ma L, Liu L, et al. Diametrically Polarized Tumor-Associated Macrophages, Predict Hepatocellular Carcinoma Patient Prognosis. Int J Mol Sci. 2016 Mar 1;17(3):320.
- Lam JH, Ng HHM, Lim CJ, et al. Expression of CD38 on Macrophages Predicts Improved Prognosis in Hepatocellular Carcinoma. Front Immunol. 2019 Sep 4;10:2093.
- Kenjo A, Sato T, Marubashi S, et al. Role of intratumoral infiltrating macrophages after transarterial immunoembolization for hepatocellular carcinoma. J Hepatobiliary Pancreat Sci. 2016 May;23(5):298-304.
- Shu QH, Ge YS, Ma HX, et al. Prognostic value of polarized macrophages in patients with hepatocellular carcinoma after curative resection. J Cell Mol Med. 2016 Jun;20(6):1024-35.
- Fei Y, Wang Z, Huang M, et al. MiR-155 regulates M2 polarization of hepatitis B virus-infected tumour-associated macrophages which in turn regulates the malignant progression of hepatocellular carcinoma. J Viral Hepat. 2023 Jan 26.
- Zong Z, Zou J, Mao R, et al. M1 Macrophages Induce PD-L1 Expression in Hepatocellular Carcinoma Cells Through IL-1 Signaling. Front Immunol. 2019 Jul 16;10:1643.
- Hectors SJ, Lewis S, Besa C, et al. MRI radiomics features predict immuno-oncological characteristics of hepatocellular carcinoma. Eur Radiol. 2020 Jul;30(7):3759-3769.
- Yang Y, Ye YC, Chen Y, et al. Crosstalk between hepatic tumor cells and macrophages via Wnt-catenin signaling promotes M2-like macrophage polarization and reinforces tumor malignant behaviors. Cell Death Dis. 2018 Jul 18;9(8):793.
- Tao P, Hong L, Tang W, et al. Comprehensive Characterization of Immunological Profiles and Clinical Significance in Hepatocellular Carcinoma. Front Oncol. 2021 Jan 22;10:574778.
- Itoh S, Yoshizumi T, Kitamura Y, et al. Impact of Metabolic Activity in Hepatocellular Carcinoma: Association With Immune Status and Vascular Formation. Hepatol Commun. 2021 Mar 26;5(7):1278-1289.
- Liu K, Ding Y, Wang Y, et al. Combination of IL-34 and AFP improves the diagnostic value during the development of HBV related hepatocellular carcinoma. Clin Exp Med. 2022 Mar 28.
- Chen DP, Ning WR, Jiang ZZ, et al. Glycolytic activation of peritumoral monocytes fosters immune privilege via the PFKFB3-PD-L1 axis in human hepatocellular carcinoma. J Hepatol. 2019 Aug;71(2):333-343.
- Xie K, Xu L, Wu H, et al. OX40 expression in hepatocellular carcinoma is associated with a distinct immune microenvironment, specific mutation signature, and poor prognosis. Oncoimmunology. 2018 Mar 6;7(4):e1404214.
- Xin H, Liang D, Zhang M, et al. The CD68+ macrophages to CD8+ T-cell ratio is associated with clinical outcomes in hepatitis B virus (HBV)-related hepatocellular carcinoma. HPB (Oxford). 2021 Jul;23(7):1061-1071.
- Ma XL, Qu XD, Yang WJ, et al. Elevated soluble programmed death-ligand 1 levels indicate immunosuppression and poor prognosis in hepatocellular carcinoma patients undergoing transcatheter arterial chemoembolization. Clin Chim Acta. 2020 Dec;511:67-74.
- Lin XH, Liu ZY, Zhang DY, et al. circRanGAP1/miR-27b-3p/NRAS Axis may promote the progression of hepatocellular Carcinoma. Exp Hematol Oncol. 2022 Nov 8;11(1):92.
- Tu JF, Pan HY, Ying XH, et al. Mast Cells Comprise the Major of Interleukin 17-Producing Cells and Predict a Poor Prognosis in Hepatocellular Carcinoma. Medicine (Baltimore). 2016 Mar;95(13):e3220.
- Iseda N, Itoh S, Yoshizumi T, et al. ARID1A Deficiency Is Associated With High Programmed Death Ligand 1 Expression in Hepatocellular Carcinoma. Hepatol Commun. 2020 Dec 30;5(4):675-688.
- Atanasov G, Dino K, Schierle K, et al. Immunologic cellular characteristics of the tumour microenvironment of hepatocellular carcinoma drive patient outcomes. World J Surg Oncol. 2019 Jun 6;17(1):97.
- Tu JF, Ding YH, Ying XH, et al. Regulatory T cells, especially ICOS+ FOXP3+ regulatory T cells, are increased in the hepatocellular carcinoma microenvironment and predict reduced survival. Sci Rep. 2016 Oct 11;6:35056.
- Wang Y, Li Z, Huang Z, et al. C-Reactive Protein Is an Indicator of the Immunosuppressive Microenvironment Fostered by Myeloid Cells in Hepatocellular Carcinoma. Front Oncol. 2022 Jan 6;11:774823.
Figure 1.
Identification and intersection analysis of differentially expressed genes in hepatocellular carcinoma (a-b: Volcano map analysis; c: Ven map analysis; d: RNA identification through violin plot analysis).
Figure 1.
Identification and intersection analysis of differentially expressed genes in hepatocellular carcinoma (a-b: Volcano map analysis; c: Ven map analysis; d: RNA identification through violin plot analysis).
Figure 2.
Expression levels of macrophage activation-related genes in different macrophage subtypes.
Figure 2.
Expression levels of macrophage activation-related genes in different macrophage subtypes.
Figure 3.
Analysis of coexpression-related genes in macrophages. a-c: core presentation network diagram; d-f: correlation analysis between coexpressed genes and macrophages ( red indicates a positive correlation, and green indicates a negative correlation).
Figure 3.
Analysis of coexpression-related genes in macrophages. a-c: core presentation network diagram; d-f: correlation analysis between coexpressed genes and macrophages ( red indicates a positive correlation, and green indicates a negative correlation).
Figure 4.
Functional enrichment analysis. (a-c and f: GO enrichment analysis; d-e: KEGG enrichment analysis ).
Figure 4.
Functional enrichment analysis. (a-c and f: GO enrichment analysis; d-e: KEGG enrichment analysis ).
Figure 5.
Independent prognostic analysis (a: Correlation analysis of the association of clinical prognosis with the presence of macrophages of various subtypes; b: Clinical univariate analysis of macrophages; c: Clinical multifactor analysis of macrophages).
Figure 5.
Independent prognostic analysis (a: Correlation analysis of the association of clinical prognosis with the presence of macrophages of various subtypes; b: Clinical univariate analysis of macrophages; c: Clinical multifactor analysis of macrophages).
Figure 6.
Survival curve analysis and nomogram model evaluation (a: Relationship between the expression of macrophage-related genes and the survival time of patients with hepatocellular carcinoma; b: ROC curve analysis; c: Nomogram-predicted OS; d: Nomogram OS model analysis).
Figure 6.
Survival curve analysis and nomogram model evaluation (a: Relationship between the expression of macrophage-related genes and the survival time of patients with hepatocellular carcinoma; b: ROC curve analysis; c: Nomogram-predicted OS; d: Nomogram OS model analysis).
Figure 7.
Clinical progression-free survival analysis (a: Analysis of clinically relevant prognostic factors; b: PFS analysis; c: Nomogram-predicted PFS; d: Quantitative and comparative analysis of immune cell infiltration; e: Nomogram PFS model analysis).
Figure 7.
Clinical progression-free survival analysis (a: Analysis of clinically relevant prognostic factors; b: PFS analysis; c: Nomogram-predicted PFS; d: Quantitative and comparative analysis of immune cell infiltration; e: Nomogram PFS model analysis).
Figure 8.
Correlation analysis of risk score with immune cells and immune checkpoint (a: GSEA; b: Immune cell correlation analysis; c: Immune checkpoint correlation analysis; d: Analysis of the correlation between gene mutation frequency and risk score in hepatocellular carcinoma).
Figure 8.
Correlation analysis of risk score with immune cells and immune checkpoint (a: GSEA; b: Immune cell correlation analysis; c: Immune checkpoint correlation analysis; d: Analysis of the correlation between gene mutation frequency and risk score in hepatocellular carcinoma).
Figure 9.
Single -cell cluster analysis and cell annotation (a-b: Single cell data collation and screening; c-d: Single cell clustering).
Figure 9.
Single -cell cluster analysis and cell annotation (a-b: Single cell data collation and screening; c-d: Single cell clustering).
Figure 10.
Cell communication analysis (a: Pie chart showing receptor-ligand relationships between cells; b: Comparative analysis of differentially expressed genes in cell communication; c: Pathway level cell communication analysis).
Figure 10.
Cell communication analysis (a: Pie chart showing receptor-ligand relationships between cells; b: Comparative analysis of differentially expressed genes in cell communication; c: Pathway level cell communication analysis).
Figure 11.
Analysis of cell communication core gene expression (a: Circle analysis; b: Analysis of core gene expression levels).
Figure 11.
Analysis of cell communication core gene expression (a: Circle analysis; b: Analysis of core gene expression levels).
Figure 12.
Analysis of the relationship between infiltration by M2-type macrophages and cell communication.
Figure 12.
Analysis of the relationship between infiltration by M2-type macrophages and cell communication.
Figure 13.
Detect polarization of macrophages. A. Quantitative Real-time PCR; B. Western blot.
Figure 13.
Detect polarization of macrophages. A. Quantitative Real-time PCR; B. Western blot.
Figure 14.
Apoptosis of macrophages induced detected by flow cytometry. A. THP-1+LPS+INF-γ; B. THP-1+IL-4.
Figure 14.
Apoptosis of macrophages induced detected by flow cytometry. A. THP-1+LPS+INF-γ; B. THP-1+IL-4.
Table 4.
RNA concentration determination.
Table 4.
RNA concentration determination.
| Cell |
Concentration (μg/ml) |
260/280 |
| THP-1+PBS |
418.09 |
2.017 |
| THP-1+LPS+INF-γ |
386.94 |
2.095 |
| THP-1+IL-4 |
490.67 |
2.043 |
Table 5.
Statistical analysis of macrophage apoptosis data.
Table 5.
Statistical analysis of macrophage apoptosis data.
| Group 1 |
CD11b+(FITC) |
CD86+(APC) |
CD11b+CD86+ |
| THP-1+LPS+INF-γ |
THP-1+LPS+INF-γ 1 |
20.24% |
2.54% |
0.84% |
| THP-1+LPS+INF-γ 2 |
21.63% |
2.15% |
0.68% |
| THP-1+LPS+INF-γ 3 |
19.02% |
2.87% |
0.83% |
| Group 2 |
CD206+(FITC) |
F4-80+(APC) |
F4-80+CD206+ |
| THP-1+IL-4 |
THP-1+IL-4 1 |
0.57% |
0.09% |
0.08% |
| THP-1+IL-4 2 |
0.40% |
0.09% |
0.07% |
| THP-1+IL-4 3 |
0.29% |
0.15% |
0.11% |
|
Disclaimer/Publisher’s Note: The statements, opinions and data contained in all publications are solely those of the individual author(s) and contributor(s) and not of MDPI and/or the editor(s). MDPI and/or the editor(s) disclaim responsibility for any injury to people or property resulting from any ideas, methods, instructions or products referred to in the content. |
© 2024 by the authors. Licensee MDPI, Basel, Switzerland. This article is an open access article distributed under the terms and conditions of the Creative Commons Attribution (CC BY) license (http://creativecommons.org/licenses/by/4.0/).
