3.1. Analysis of the Water Supply Area
In the subsequent sections of this study, the analysis is focused on the district metering area (DMA) of the water supply system in Vojkovići, which is managed by the Communal Company "Vodovod i Kanalizacija" a.d. in East Sarajevo. DMA Vojkovići, as informed by data obtained from the municipality of East Ilidza, supplies with water approximately 4,300 inhabitants. This region is predominantly composed of individual residential buildings and is situated in the rural part of the city of East Sarajevo. The precise number of connections to the water supply network is 1257.
Water supply companies, to varying degrees, utilize free software such as EPANET 2.0 or EPANET 2.2 for hydraulic analysis and optimization of their water supply networks [
33,
34,
35,
36]. For the purpose of creating the hydraulic model of the Vojkovići water supply system within the EPANET 2.2 software, data concerning the existing types and materials of pipelines were gathered. It was determined that the water supply network in the Vojkovići DMA spans 25 kilometers, featuring pipe diameters ranging from DN 50 to DN 400 mm. Various pipeline materials are in use, including polyethylene, cast iron, and asbestos cement pipelines. Upon analyzing the materials in use, it can be inferred that the water supply network includes pipelines that are over 40 years old, installed using the technology and knowledge available at that time. The expansion of the pipeline network occurred without a comprehensive planning approach and a holistic assessment of the system’s deficiencies.
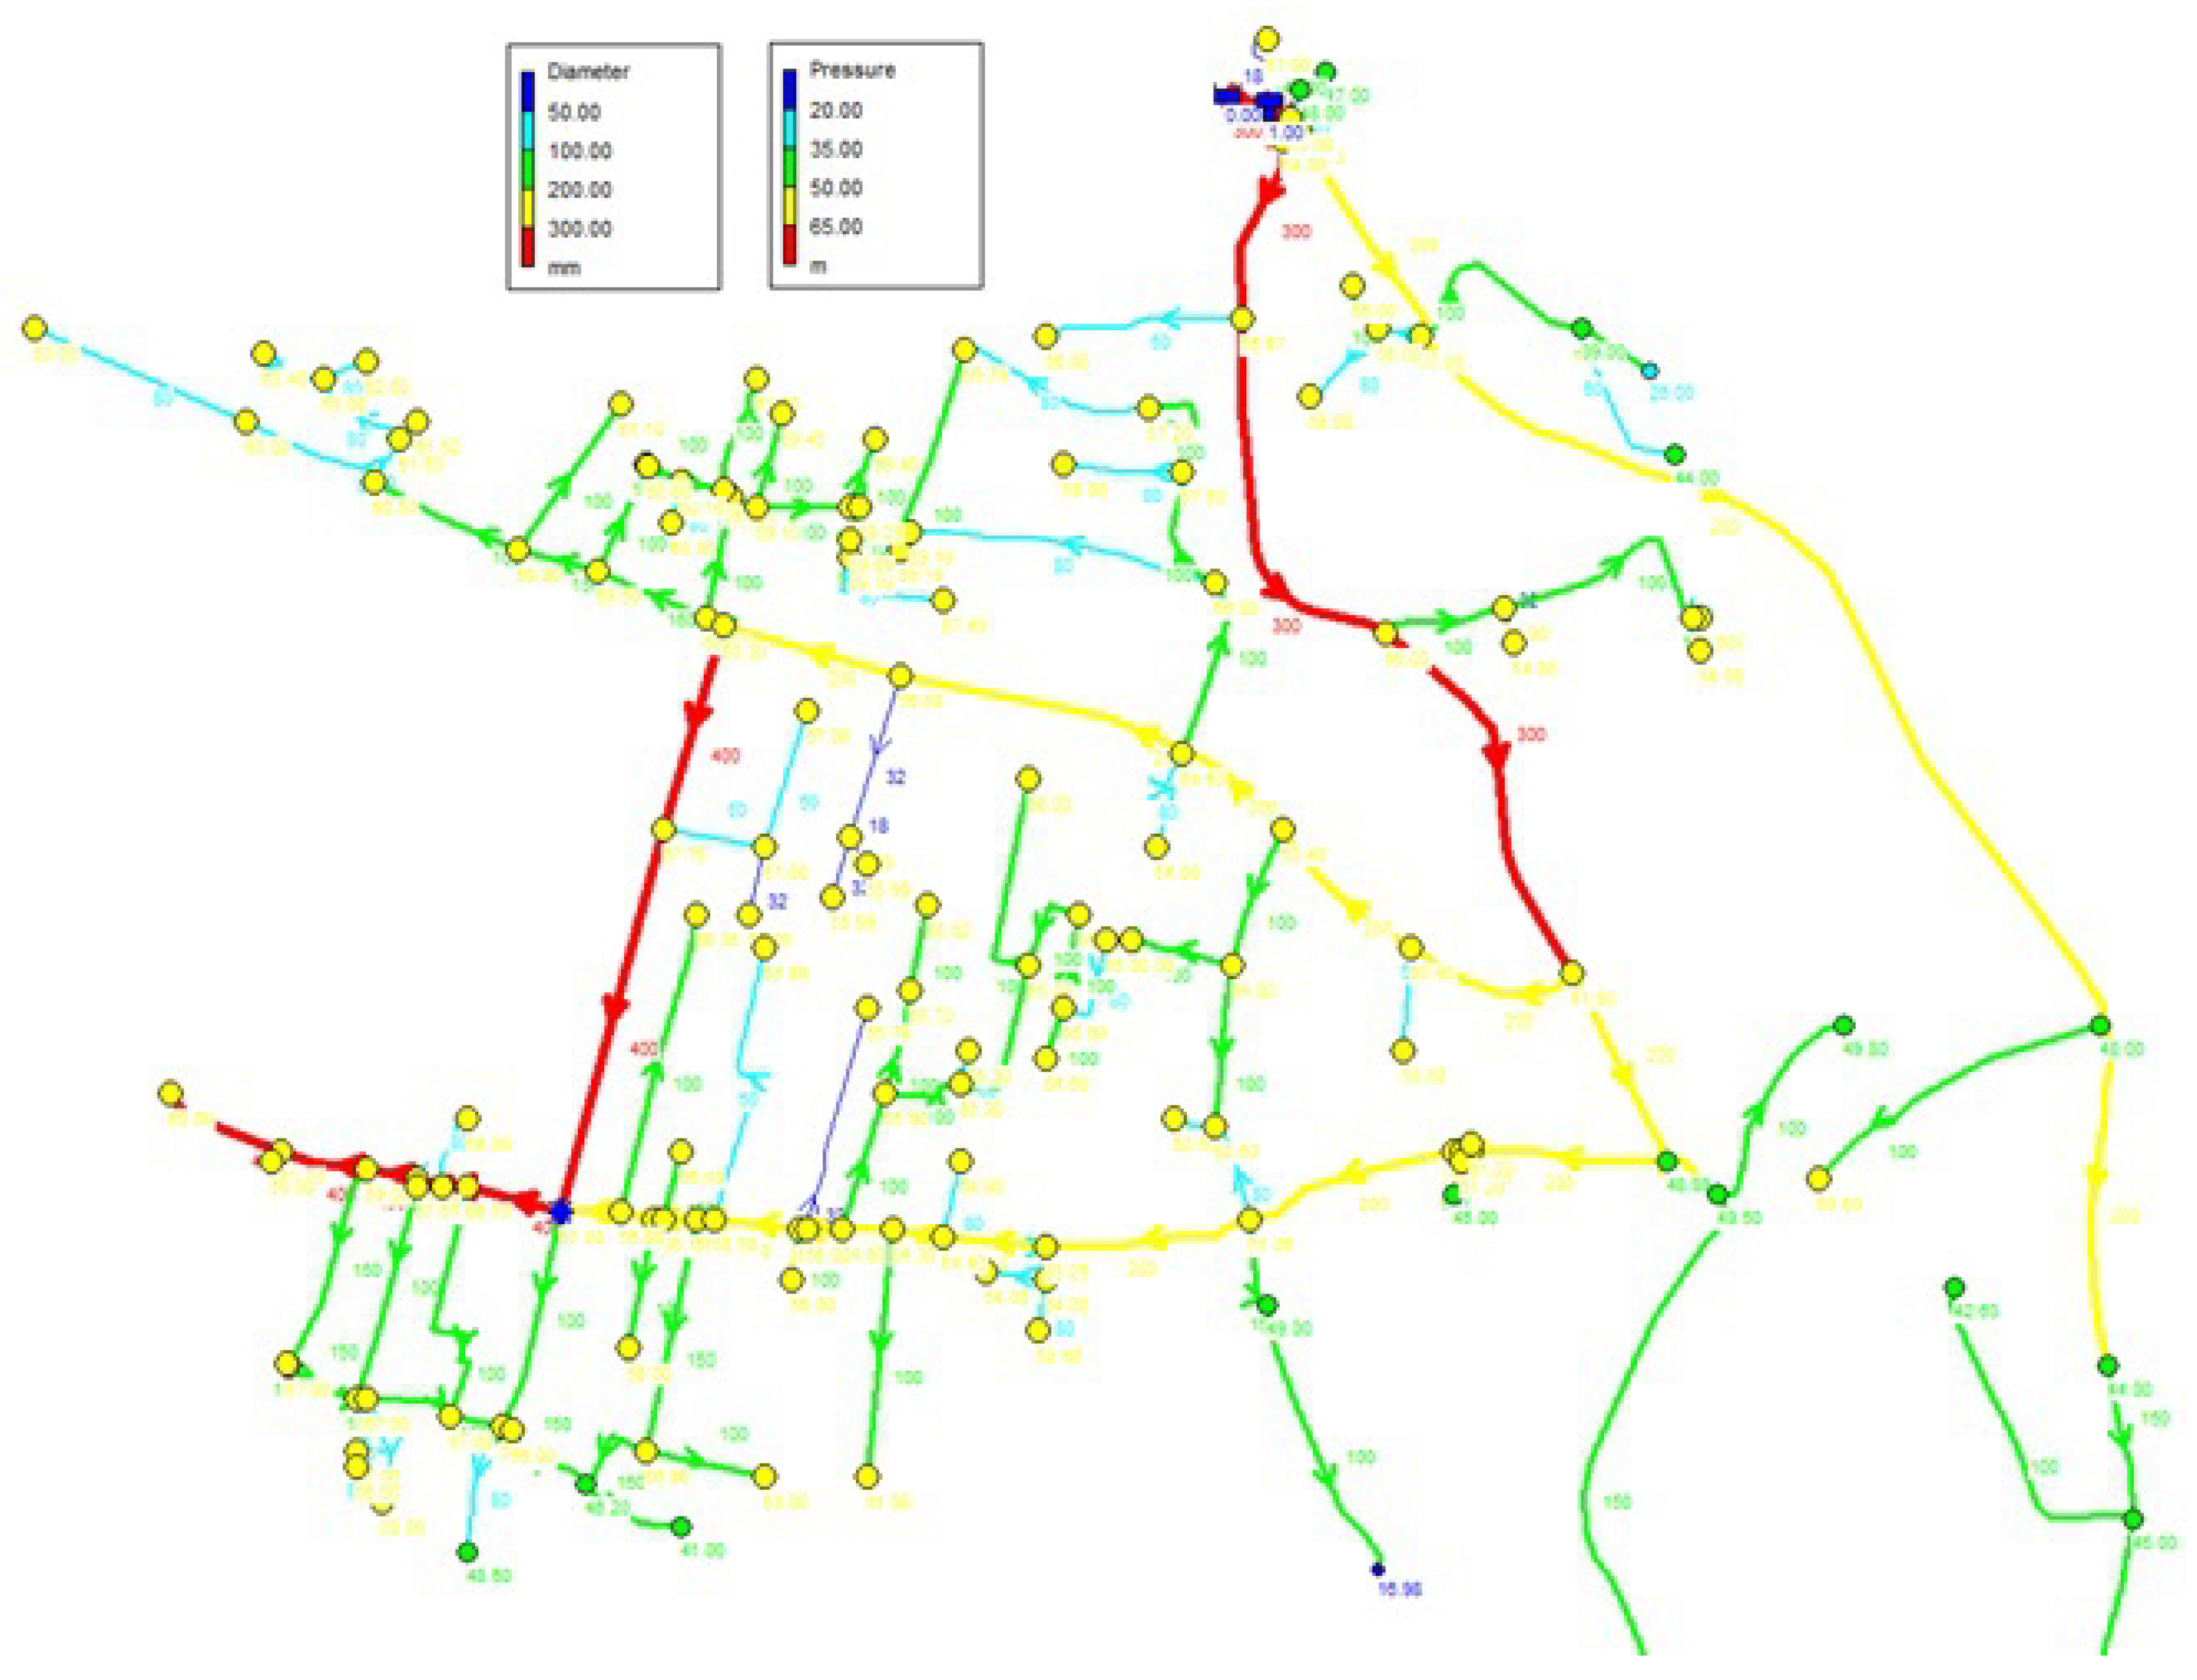
By developing a hydraulic model for the water supply network illustrated in
Figure 1, presuming no leaks in the water supply network, it was determined that certain sections of the pipeline have exceptionally low water flow rates and flows, indicating that these segments are oversized for the current and future water demands of the local population. The red line shows pipelines having a diameter higher than 300 mm, and the yellow line shows pipeline diameters from 200 to 300 mm. The age of these pipelines is over 40 years. The pressures in the junctions are largely satisfactory from the point of view of the hydraulic model, however, for the purposes of applying the pipeline replacement methodology, they were checked in the field. It was found that in some places pressure is significantly lower compared to the calculated pressures within the hydraulic model. This observation suggests the presence of leaks or losses within the water supply network. Also, it was established that the need for water in DMA is on average about 14 l/s, and at the inflow to the system this amount is significantly higher and ranges to 35 l/s. Measured high water input amounts indicate water losses in the pipes. The flow rate in the pipeline, according to the hydraulic model without losses, is low even at the time of maximum consumption, which indicates that the pipeline, in addition to its age, is oversized and that it is necessary to replace it with pipelines of the appropriate diameter.
An assessment of the failures that occurred over the past 5 years was conducted, revealing a total of 507 work orders issued for interventions on the water supply network within the Vojkovići measuring area. Following a comprehensive analysis and optimization of the water supply network using the hydraulic model developed in the EPANET software, 8 projects for the replacement of the primary pipelines were identified. These project selections also took into account plans for the construction of new residences and potential commercial entities.
Table 3 highlights that the chosen projects consist of substantially oversized pipelines designed to meet both current and anticipated future water demands within the studied region.
3.2. Results and Discussion
The aim of the paper is to present and test the methodology for choosing the optimal solution for the restoration of the water supply network. As outlined in the paper, a list of pertinent criteria has been established as the basis for the analysis and evaluation of all planned projects, with each project being assessed against these criteria. The criteria are classified into categories (
Table 1) and the data required for their evaluation are provided as follows:
Hydraulic criteria, for instance, are assessed quantitatively. The mean pressure within the pipeline (C1) was computed using the average values derived from the known pressure at various nodes within the hydraulic model. Furthermore, a comparison between the pressures obtained from the hydraulic model and the actual field pressures was conducted to determine any disparities. The pipeline (C2) water flow velocity was determined through the hydraulic model. Additionally, a query was conducted regarding flow rate velocity, and the flow rate velocity for each segment of the water system was shown. Furthermore, utilizing EPANET software, the water flow through the pipeline (C3) was ascertained based on the flow query conducted. It is necessary to emphasize that the values of the criteria were considered during the time of the highest consumption.
The mechanical criteria category is evaluated quantitatively and is taken from the EPANET software. In order to make the hydraulic model correctly, data on the age of the pipe (C4), length (C5), and diameter of the pipe (C6) are entered into the software.
The category operational criteria, number of connections (C7), and number of fixed connections (C8) are information that is available in the billing service of the water company. The operational criterion of the failure rate (C9) can also be classified in the environmental category because network failures cause water loss in the water supply system. Data on the rate of failures were taken from the maintenance service based on work orders, that is, repairs of failures on certain sections of the water supply system. Criteria that fall into the category of operational criteria are determined quantitatively.
The category of physical criterion - ease of soil excavation (10) implies the method of carrying out the works depending on the configuration of the terrain (the impossibility of carrying out the works with machines or the possibility of using modern technologies for the execution of the works), the type and installation of materials (the complexity of the terrain for material installation, excavation, or under-drilling of roads, as well as the presence of other structures along the route, all contribute to the challenges faced during construction) and the same was assessed by the maintenance department of the water company. It is necessary to emphasize that potential obstacles in soil excavation contribute to a higher investment price. The physical criterion is determined qualitatively.
Water quality (C11), which is part of the qualitative criteria, implies the quality of water for consumers. Depending on the retention of water in the tank, pipeline, or at the ends of the network, the quality of the water changes. Data on water quality was taken from the drinking water control department.
The total cost of the investment (C12) belongs to the group of the economic category, so the data on the investment for the individual alternative is provided by the development department of the water company. In addition to the cost of the investment, attention is also focused on the value of the pipeline that is being changed (eg steel, cast iron, etc.). Criteria from the economic category are determined quantitatively.
The social category of criteria includes population density (C13) and this is the data that was analyzed in the development department of the water company. The social category of criteria is determined qualitatively.
Table 4 illustrates the evaluations of criteria for each of the individual projects.
Table 4. show that there isn’t a single project that excels in all criteria values. Furthermore, it’s evident that criteria C2, C11, and C12 should be minimized, while criteria C1, C3, C4, C5, C6, C7, C8, C9, C10, and C13 should be maximized. To achieve this consistency, a simple transformation of the criteria that need minimization (by multiplying by -1) is applied, resulting in all criterion functions being reformulated to maximize them. Since, depending on the criteria category, there are different units of measure, and also no project is the best according to all criteria, the values of the criteria are normalized. The normalization of criteria values is presented in
Table 5.
After normalizing the values, weight coefficients must be assigned to all criteria. Determining the weight of each criterion is one of the key problems that occurs in multi-criteria optimization models. There is no unique way of determining the weights of the criteria and they are usually determined subjectively. Since the weights of the criteria can significantly affect the result, it is necessary to pay attention to the objectivity of the weights of the criteria. For problems that involve a set of criteria with a mixed structure, including both quantitative and qualitative aspects, the authors have opted for the Analytical Hierarchical Process (AHP) method. This method, initially formulated by Saaty and further detailed in works such as [
37,
38,
39,
40,
41], facilitates the systematic evaluation of criteria one by one.
The application of the AHP method for determining the weights of the criteria can be observed through four basic steps [
38]:
Step 1: Develop a hierarchical model with the objective at the top, the criteria at a lower level, and the alternatives at the bottom of the model for precise comparison.
Step 2: Using Saaty’s scale (scoring 1, 3, 5, 7, and 9 or Equally Important, Moderate Dominance, Strong Dominance, Demonstrated Dominance, and Absolute Dominance respectively) the criteria are compared in pairs.
Step 3: Based on the assessment of the relative importance of the comparative criteria, the weights of the criteria are calculated.
Step 4: An analysis of the degree of (in)consistency is carried out - the tolerance limit is 0.1.
In the process of comparing the ratio of the criteria, a significant problem arose, which is reflected in the high range of values obtained. Namely, the following participated in the analysis of criteria evaluation: technicians from the water supply company, directors of utility companies, employee of the Ministry of Foreign Trade and Economic Relations of BiH (belongs to the Department for water resources and Environmental Protection), and several consumers, i.e. users who do not belong to any of the listed categories. The rating range for the relationship between the two criteria ranged from 1/3 to 7, which means that the relationships are not consistent and that this type of decision-making is new in Bosnia and Herzegovina. Therefore, it lead to the conclusion that professional help is necessary to draw usable conclusions from the answers offered. In this regard, the authors, based on their experience, proposed consistent criterion ratios and again discussed the proposed ratios with the participants. Based on the proposed evaluation of the ratio of the criteria, consistent ratios were established (degree of consistency is 0.1). The criteria comparison matrix is shown in
Table 6.
Through pairwise comparisons of criteria and assessing the consistency of the results obtained,
Table 7 displays the weight values assigned to each criterion.
After evaluating the projects according to the criteria and determining the weight coefficients, the values of S, R and Q are calculated, which are shown in the steps of the VIKOR method. A ranking list of projects is obtained for the weight of the strategy, which is v=0.5. The ranking of the projects is shown in
Table 8.
The ranking list indicates that the top-ranked project for pipeline replacement is Project P6, followed by Project P5 in the second position. Once the ranking of projects has been determined, it is essential to establish the criteria for acceptable advantage and acceptable stability.
The difference between the rankings of the first and second projects is 0.163, while the DQ (DQ is often used to denote the difference between the maximum and minimum values in VIKOR) is 0.143, indicating that the condition of acceptable advantage has been met. Additionally, Project P6 ranks highest in the R ranking, satisfying the condition of acceptable stability.
As the VIKOR method typically considers the best alternative to be the one with the lowest value, which is not always welcome by real decision makers, alternative is to normalize the values within the range of 0 to 100 so that the best alternative receives the highest value, and the worst receives the lowest. The normalization of the ranked alternatives is achieved using the following expression:
where is
the value of the individual project rank shown in the
Table 8.,
– the minimal value of the projects rank shown in
Table 8,
– maximal value of the projects rank shown in
Table 8. By following this approach, the best alternative will be assigned a value of 100, while the worst alternative will have a value of 0. The final ranking list is depicted in
Table 9.
Through an analysis of the obtained results, it is evident that, considering the actual conditions in the water supply system, both Project 5 and Project 6 are top priorities for replacement. These pipelines are characterized by being oversized, resulting in water stagnation and very low flow rates, which in turn lead to frequent consumer complaints about water quality and the need for frequent pipeline desalting. While there may be some pressure drop in these pipelines, it is not significantly pronounced compared to other projects, and the number of flat-rate connections is also relatively low.


