Preprint
Article

Gradual Emergence of East African Cassava Mosaic Cameroon Virus in Cassava Farms in Côte d’Ivoire

Altmetrics

Downloads

115

Views

97

Comments

0

A peer-reviewed article of this preprint also exists.

Submitted:

12 January 2024

Posted:

15 January 2024

You are already at the latest version

Alerts
Abstract
Cassava mosaic disease (CMD) and cassava brown streak disease (CBSD) are endemic threats to cassava production. To fill the existing gaps in the understanding of the epidemiology of these diseases in Côte d’Ivoire, nationwide field surveys were conducted in 2016, 2017 and 2020. The leaf samples collected were analysed by PCR. CBSD was not detected in all fields visited. However, an increase of CMD incidence was observed from 45.95% in 2016 to 51.37% in 2020 while CMD severity remained moderate over the years with a mean value of 2.29. Low whiteflies number was observed in field and decreasing over the years. Molecular analysis allowed detection of East African cassava mosaic Cameroon virus (EACMCMV) in single as well as in mixed infection with African cassava mosaic virus (ACMV). Single EACMCMV infection, which was detected only in three agroecological zones of the eastern Côte d’Ivoire in 2016, spread throughout the country in 2017 and became more widespread in 2020 with a preponderance in the central and southern zones, whereas the ACMV+EACMCMV coinfection has spread to the entire zones studied. Knowing the dynamics of the evolution of these viruses across the country, better disease management strategies could be adopted to control the disease.
Keywords: 
Subject: Biology and Life Sciences  -   Agricultural Science and Agronomy

1. Introduction

Cassava (Manihot esculenta Crantz) is an important starchy root crop grown globally in tropical and subtropical regions [1]. It is now considered a potential solution to the impending food crisis in Africa because it offers the greatest resilience to climate change [2]. Africa contributes approximately 64.7% of the world's cassava production of 314.8 million tons/year [3]. In West Africa, cassava production is estimated at 96.2 million tons/year and contributes to 33% of African production [3]. Côte d'Ivoire is the third highest cassava-producing country in West Africa after Nigeria and Ghana [3], and cassava is the second most consumed food crop in Côte d’Ivoire after yam. With a production of over 6.5 million tons of fresh cassava tubers in 2020 according to the Food and Agriculture Organization of the United Nations [3], cassava is of immense economic importance in Côte d’Ivoire.
Cassava is important in human nutrition as food (Attiéké, tapioca, cookies, pasta, gari, etc.) and for industrial products (starch, biofuel glues, glucose, etc.). and a feed base for livestock. The production of this important root crop is seriously threatened by two viral diseases, Cassava mosaic disease (CMD) and Cassava brown streak disease (CBSD), which are considered the major disease constraints in Sub-Saharan Africa [4]. While CMD is widespread across Africa, CBSD is found in Eastern and Central Africa [5]. CMD is caused by begomoviruses with yield losses between 50% and 70% [6], whereas CBSD is caused by ipomoviruses and results in total crop loss of up to 100% in susceptible cultivars [7,8]. Both diseases are propagated either by whitefly vectors (Bemisia tabaci) or by the use of diseased planting materials [9]. CMD symptoms are observed only on the leaves of infected plants, causing patchy leaf chlorosis with little or no mottling in cases of mild infection and severe chlorosis, smaller leaves, and stunting when infection is severe [10]. CBSD symptoms, on the other hand, occur on all parts of the plant (leaves, stem, and tuberous roots). These diseases can spread very rapidly and escalate to serious pandemics. Thus, in the 1990s, an epidemic of unusually severe CMD emerged in Uganda and subsequently spread to affect several countries and large areas in East and Central Africa [11]. A novel recombinant begomovirus, East African cassava mosaic virus–Uganda (EACMV-UG), was shown to be associated with this epidemic [12,13]. Almost 30 years after the first reports of severe CMD from Uganda, the implicated EACMV-UG continues to spread, currently advancing southward through the eastern Democratic Republic of Congo and westward through central Cameroon [14]. According to the International Committee on Taxonomy of Viruses (ICTV), eleven cassava mosaic begomoviruses have been described, of which nine occur in Africa, either alone or in combination, i.e., African cassava mosaic virus (ACMV), African cassava mosaic Burkina Faso virus (ACMBFV), East African cassava mosaic virus (EACMV), East African cassava mosaic Cameroon virus (EACMCMV), East African cassava mosaic Kenya virus (EACMKV), East African cassava mosaic Malawi virus (EACMMV), East African cassava mosaic Zanzibar virus (EACMZV), cassava mosaic Madagascar virus (CMMGV), and South African cassava mosaic virus (SACMV). The two other viruses that occur in Asia are Indian cassava mosaic virus (ICMV) and Sri Lankan cassava mosaic virus (SLCMV) [15,16]. Dual or multiple members of the cassava begomovirus group can be involved in mixed infections, which are usually characterized by severe symptoms [17]. In Côte d’Ivoire, EACMCMV was first reported in 2001 [13], and it was always found to be associated with ACMV. The presence of these viruses was also documented later on cassava in Côte d’Ivoire by [18,19]. Despite these studies, knowledge on the epidemiology of cassava mosaic viruses in Côte d’Ivoire remains scarce. Additionally, the most devastating cassava viral disease, cassava brown streak disease (CBSD), which has been moving westward over the years, has already been reported in the Democratic Republic of Congo (DRC) [20]. In addition, the recombinant virus from Uganda, EACMV-UG, is spreading to neighbouring countries [21] and has been detected in DRC, eastern Gabon [22] and Burkina Faso [23], which is near Côte d’Ivoire.
This study was carried out to fill the gaps in quality scientific data and scientific evidence necessary for policy-driven anticipation, preparedness and rapid response against cassava viral outbreaks and epidemics in Côte d’Ivoire.

2. Materials and Methods

2.1. Study area

Surveys were conducted in 2016, 2017 and 2020 across six of the seven agroecological zones of Côte d’Ivoire, located between the latitudes 4°30' and 10°30' N. These zones were described by [24] in Figure 1. The agroecological zones I, II, IV and V are characterized by two dry seasons (from July to august and December to march) and two rainy seasons (from September to November and April to July). Agroecological zone III is characterized by a short dry season (from November to December) and a long rainy season (from March to October) while the agroecological zone VI is characterized by a long dry and a short rainy season, from November to April and from May to October, respectively. The seventh zone was not surveyed because of the very rare presence of cassava fields in this area.

2.2. CMD epidemiological assessment

2.2.1. Survey data collection

Surveys were conducted in 854 localities throughout the six agroecological zones surveyed following the Central and West African Virus Epidemiology Program (WAVE) harmonized protocol described by [25]. Cassava fields, aged from 3 to 6 months, were surveyed approximately every 10 kms along the main roads. In each site surveyed, information such as the age of the field, the source of the planting material, the names of cassava varieties were recorded. A Cassava Survey App (iForm) co-developed by WAVE and the University of Cambridge (UK) was used to collect epidemiological data. In each field, 30 cassava plants were assessed randomly along two diagonals to form an “X” pattern (15 x 2 = 30 plants per field). Individual plants were assessed visually for the presence or absence of CMD symptoms, severity of the symptoms was scored, number of whiteflies on the top five leaves of each plant were counted and the mode of CMD infection was assessed. For each field, CMD incidence mean, severity mean and mean whitefly population were calculated.
Cassava leaves collected from symptomatic an asymptomatic plants were kept in plant press form as previously described by [26,27].
The CMD incidence (I) per field was determined by calculating the ratio of diseased plants to the total number of plants assessed according to the following formula [10]:
I (%) = 100 X (Number of diseased plants / Total number of plants observed)
CMD incidence in the field was then classified based on in-field visual assessment as Healthy (0%); Low incidence (0-25%); Medium incidence (25-50%); High incidence (50-75%); and Very High incidence (75-100%).
For each cassava plant, CMD symptom severity was assessed based on a published scale in which disease severity levels were scored from 1 (no symptoms) to 5 (most severe symptoms) based on visual assessment [25,28,29,30]. Mean CMD severity per field were then calculated according to the formula below [10,29]:
Sm = Total score of diseased plants / Total number of diseased plants

2.2.2. Statistical analysis

Epidemiological data were recorded using a tablet and the WAVE mobile survey application (built in the iForm software). Data were uploaded from the tablet into iForm’s cloud-based database and then integrated into the WAVE Cube, a novel, multidimensional database that was developed to hold centrally all the field survey data collected in the different countries of the WAVE network. These data were then imported into R software (Version 3.5.1, R Development Core Team, 2010). The effect of agroecological zones was tested on CMD incidence, severity and whitefly abundance using a Generalized Linear Model (glm) with likelihood ratio test (Chi-square test or Fisher test in case of overdispersion), and Tukey's pairwise mean comparison test (α = 0.05).

2.3. PCR diagnostic of cassava mosaic begomoviruses

Total DNA was extracted from cassava leaves using the CTAB protocol previously described by [31]. The DNA concentration of each sample was determined using a spectrophotometer (Eppendorf) and adjusted to 50 ng/µl for PCR. The DNA amplification was performed by PCR using virus-specific primers pairs for detection of ACMV, EACMV and EACMCMV (Table 1). The PCR was conducted in a total volume of 25 μl containing 1 X Reaction Buffer, 0.5 mM of dNTP (NEB), 0.2 mM MgCl2, 0.5 µM each primer (Eurogentec), 0.625 U of Taq polymerase and 5 µl of DNA template (about 150 ng). Amplification conditions included a first step of denaturation at 94 °C for 5 min. This initial denaturation step was followed by 35 cycles of 1 min at 94 °C, 1 min at 52 °C and 3 min at 72 °C; then a final elongation step at 72 °C for 10 min. The PCR products were separated on a 1% agarose gel electrophoresis, stained in ethidium bromide and viewed under a UV gel imager.

2.4. Sequencing and phylogenetic analysis

PCR products were sequenced by GENEWIZ (Germany). Contigs were assembled and edited using Geneious Prime® 2022.2.1. (Biomatters Ltd) software. Consensus sequences obtained were subjected to BLASTn Search in NCBI for the virus identity. The representative sequences of the various cassava begomoviruses were retrieved from the Genbank for phylogenetic analyses. Sequence alignments were performed with the MUSCLE and CLUSTAL W algorithms in MEGA X software [35]. Phylogenetic tree was generated using the maximum likelihood (ML) methods with general time reversible (GTR) model as the best fit model for substitution pattern description. Robustness of individual branches was tested by bootstrap analysis [36] performed using 1,000 replicates.

3. Results

3.1. CMD incidence in 2016, 2017 and 2020

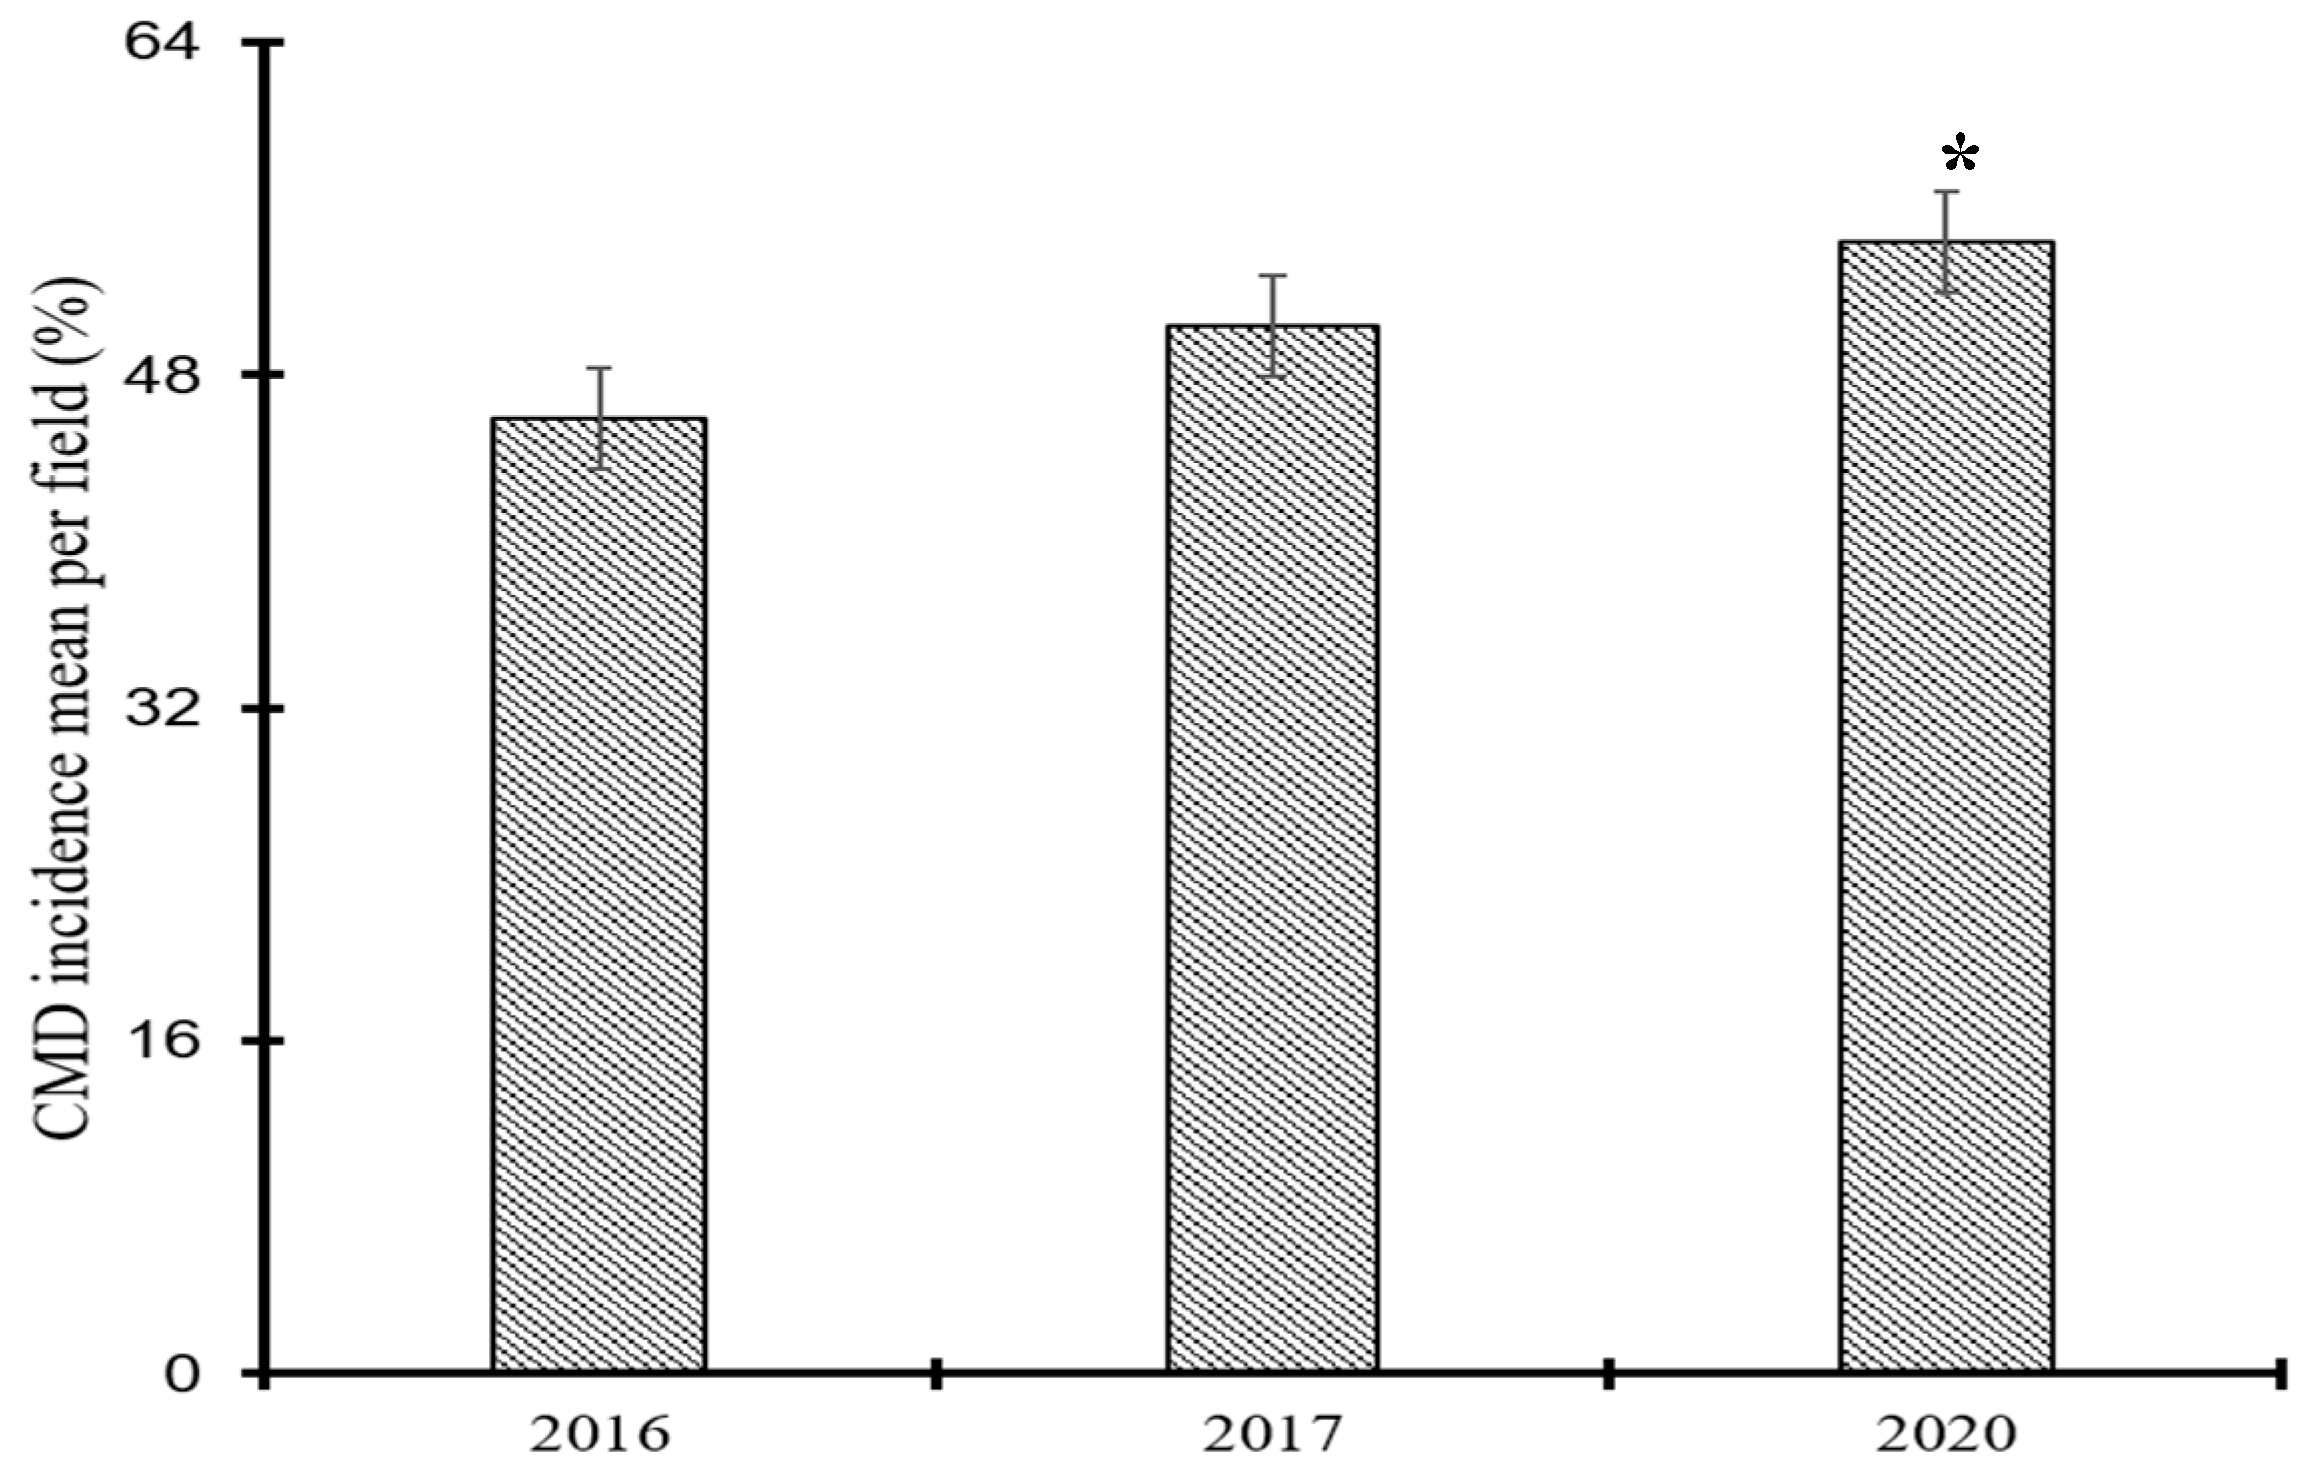
During the period of this study, CMD characteristic symptoms were observed in almost all cassava fields assessed with only 3.28% (28/854) of the fields surveyed without mosaic disease. CMD symptoms were observed in 96% (154/160), 97% (334/344) and 96.6% (338/350) of the fields assessed in 2016, 2017 and 2020, respectively. The mean incidence of CMD was 45.95 ± 0.27% (SE) in 2016, 50.32 ± 0.28% in the 2017 and 51.37 ± 0.25% (SE) in 2020 (Figure 2).
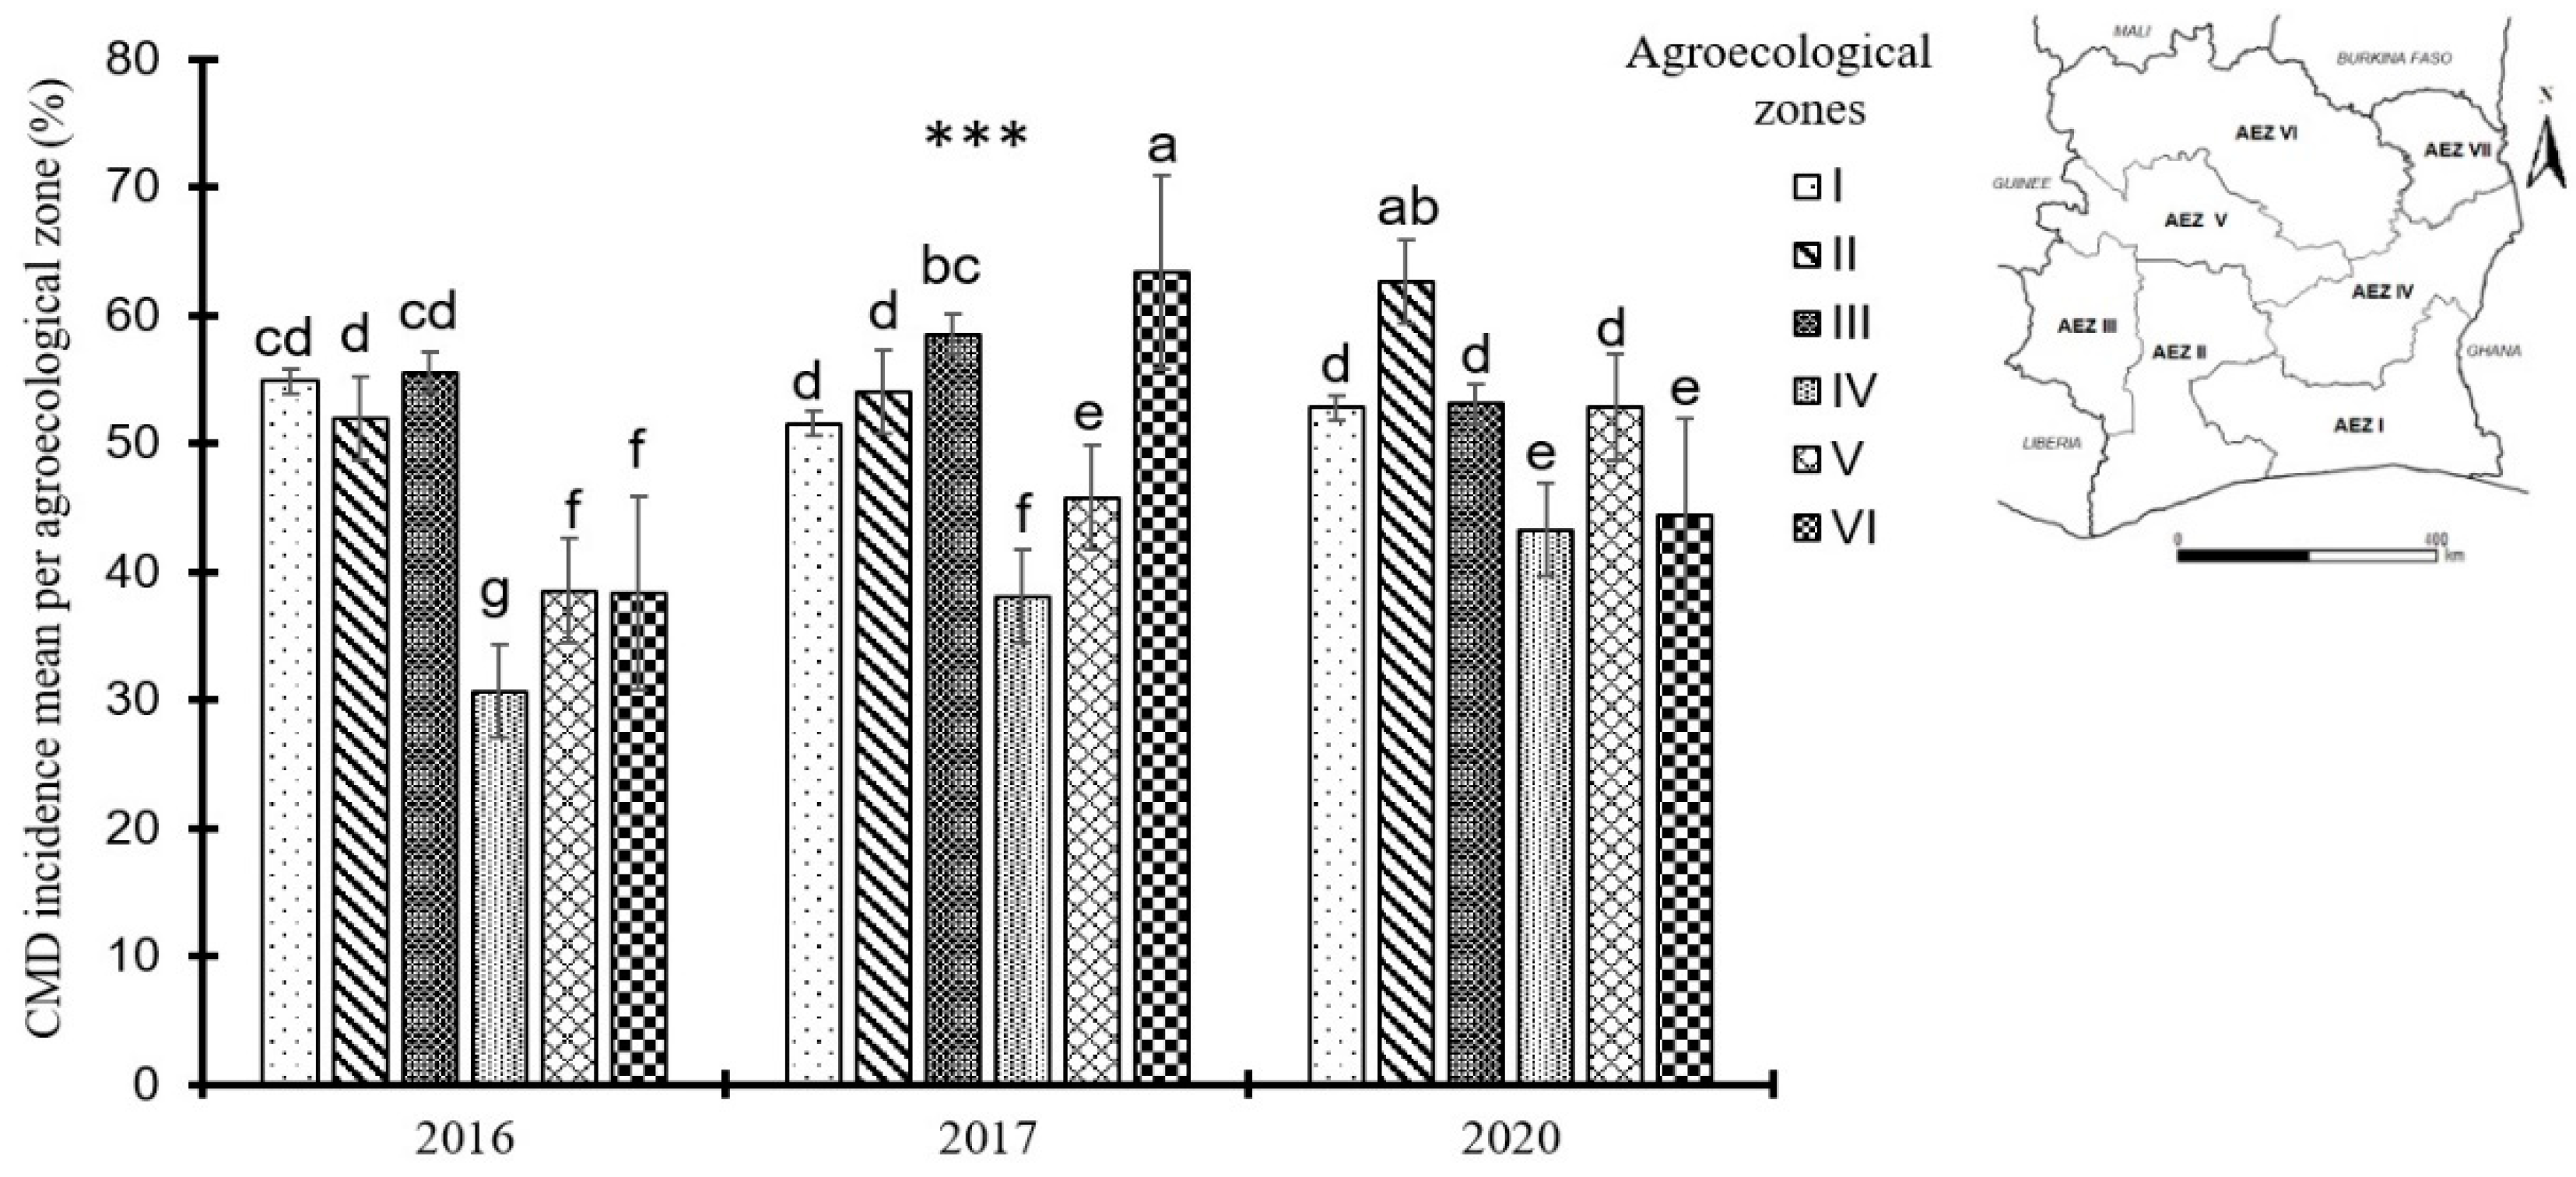
CMD incidence varied greatly between the six agroecological zones and this difference was highly significant each year (p=1.16e-07). The highest average incidence of CMD was recorded in agroecological zones I and III, in southern and western Côte d’Ivoire, in agroecological zone VI in northern Côte d’Ivoire and in agroecological zone II in south-western in 2016, 2017, and 2020, respectively. It is worth noting that the lowest incidence was reported in agroecological zone IV in the far eastern part of the country for all three years (Figure 3).
Out of the fields surveyed across Côte d’Ivoire during the four-year span of the study, 18.5% (158/854) had a low CMD incidence (0-25%), 30.21% (258/854) had a medium CMD incidence (25-50%), 26.58% (227/854) had a high CMD incidence (50-75%) and 21.43% (183/854) had a very high CMD incidence (75-100%).

3.2. CMD severity and mode of infection

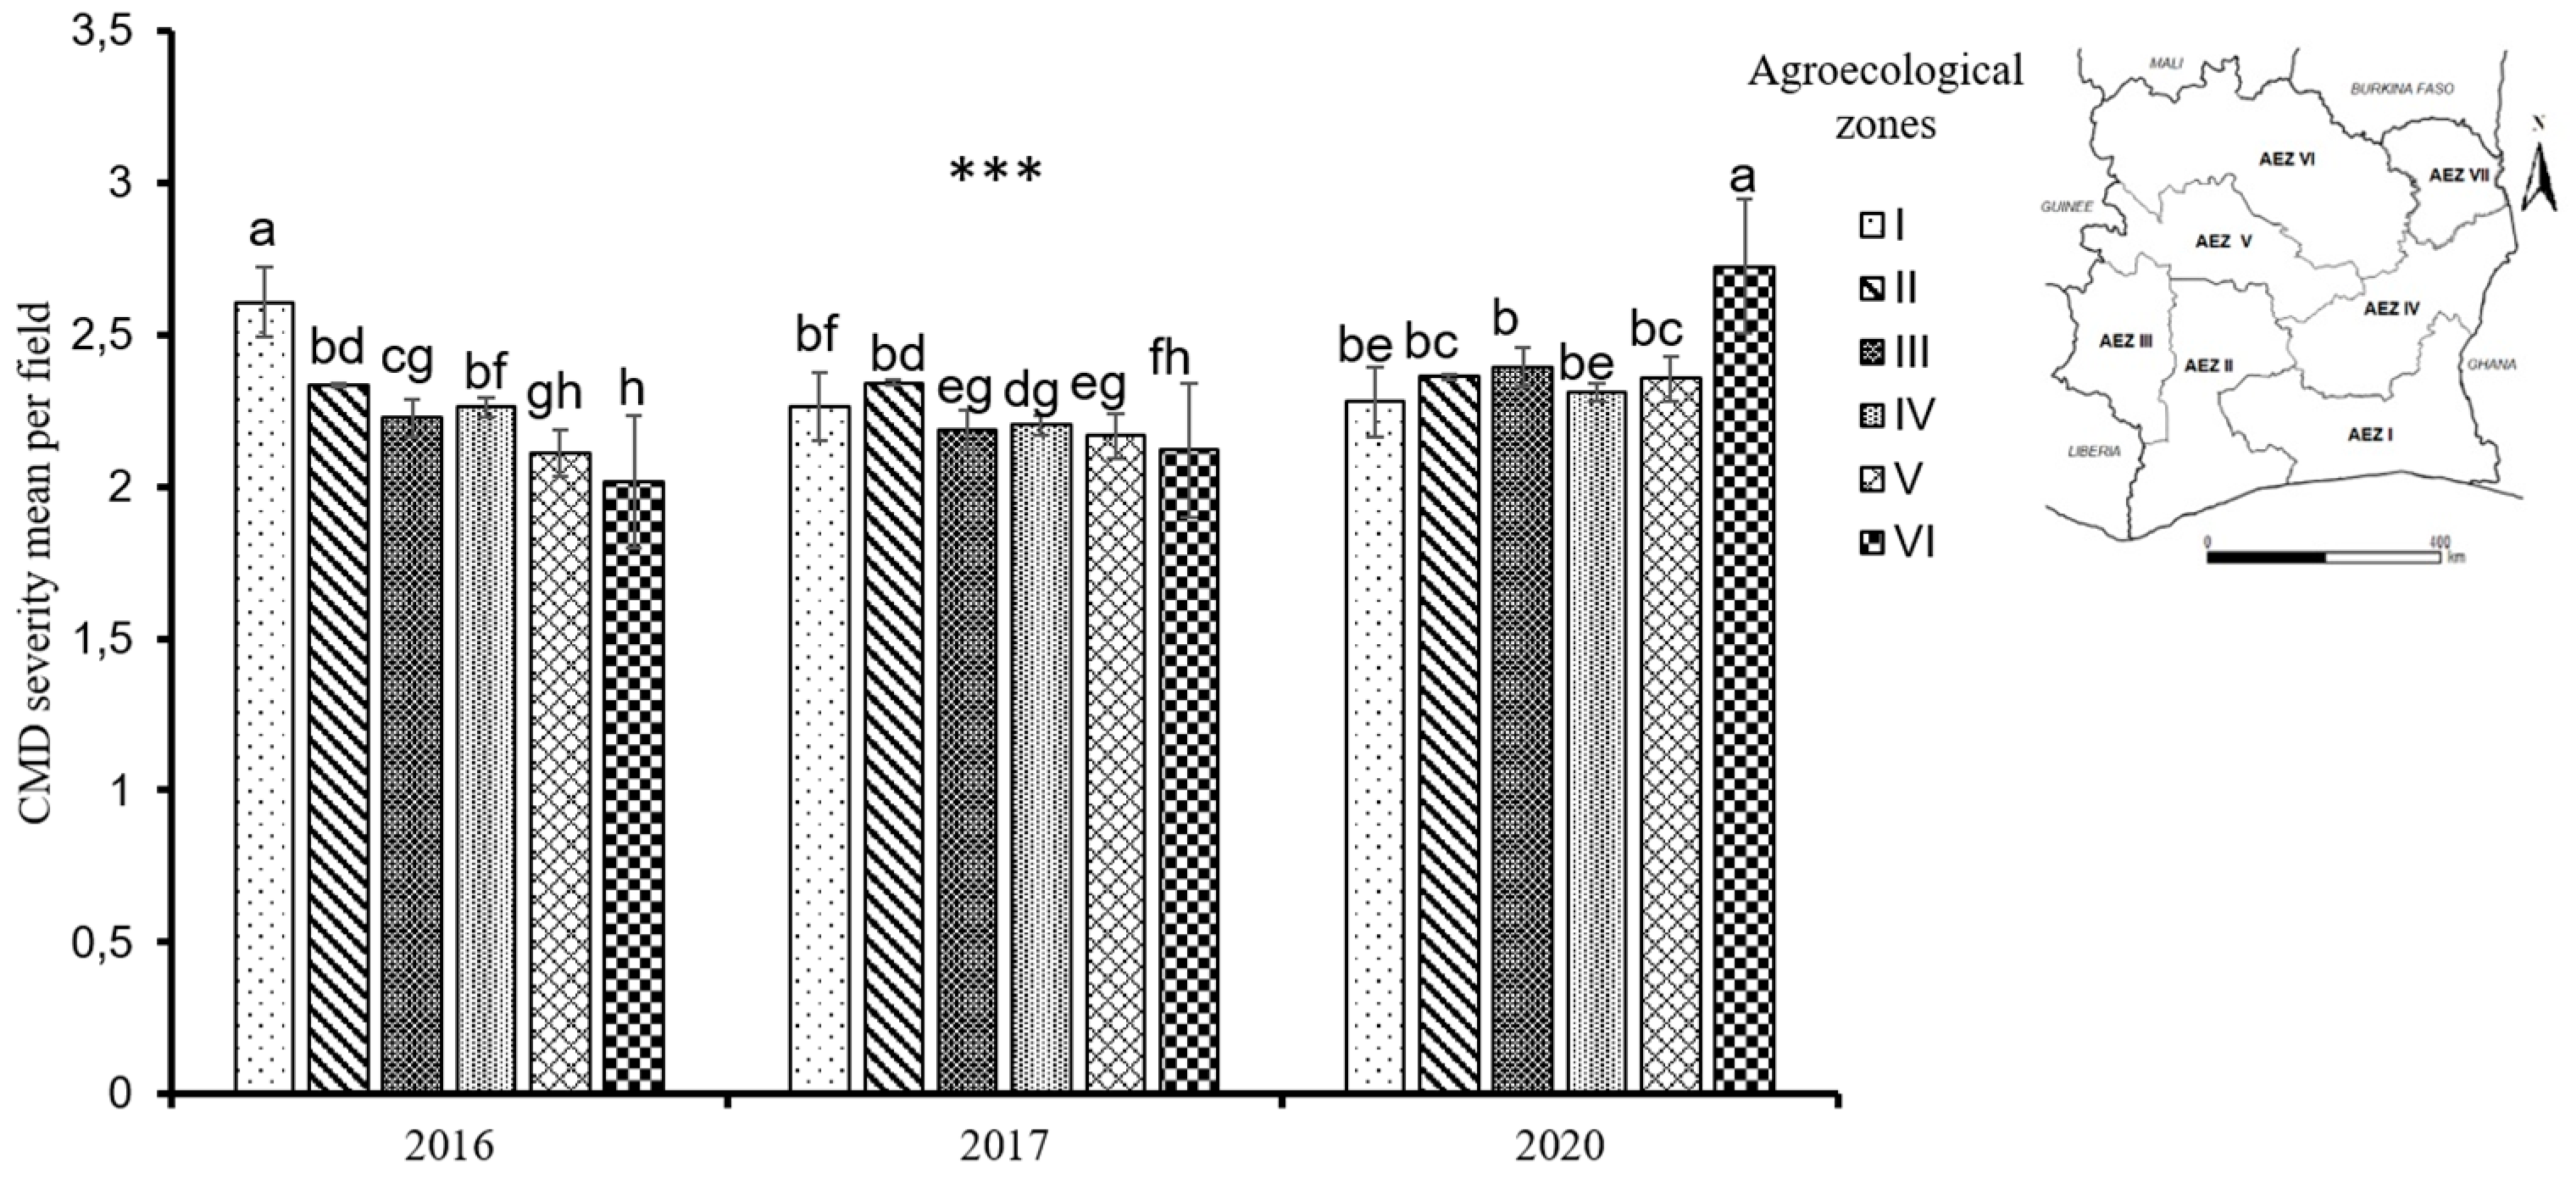
The severity of CMD symptoms observed in the field were generally moderate, with an average severity score of 3 over the four years. However, significant differences were noted between the agroecological zones with a p-value of 0.000607. Indeed, during the 2016 surveys, agroecological zone I recorded the highest mean CMD severity score (2.61) and zone VI recorded the lowest (2.01). This trend was reversed in 2020 with zone VI recording the highest average severity (2.72) and zones I and IV having the lowest average severity score (2.27). In 2017, all zones recorded almost the same average severity (Figure 4).
Assessment of CMD infection mode observed during this study showed that cutting-borne infection was more prevalent than whitefly-borne infection during each of the three years. Over the three years, whitefly transmitted infections ranged from 2 to 10% of the total infections observed while cutting transmitted infections ranged from 90 to 98%. The rate of cutting transmitted infection remained statistically identical (p=0.211) during each of the three years, whereas the rate of whiteflies transmitted infections showed a significant difference between years with p=0.0151.

3.3. Abundance of whitefly in cassava fields surveyed

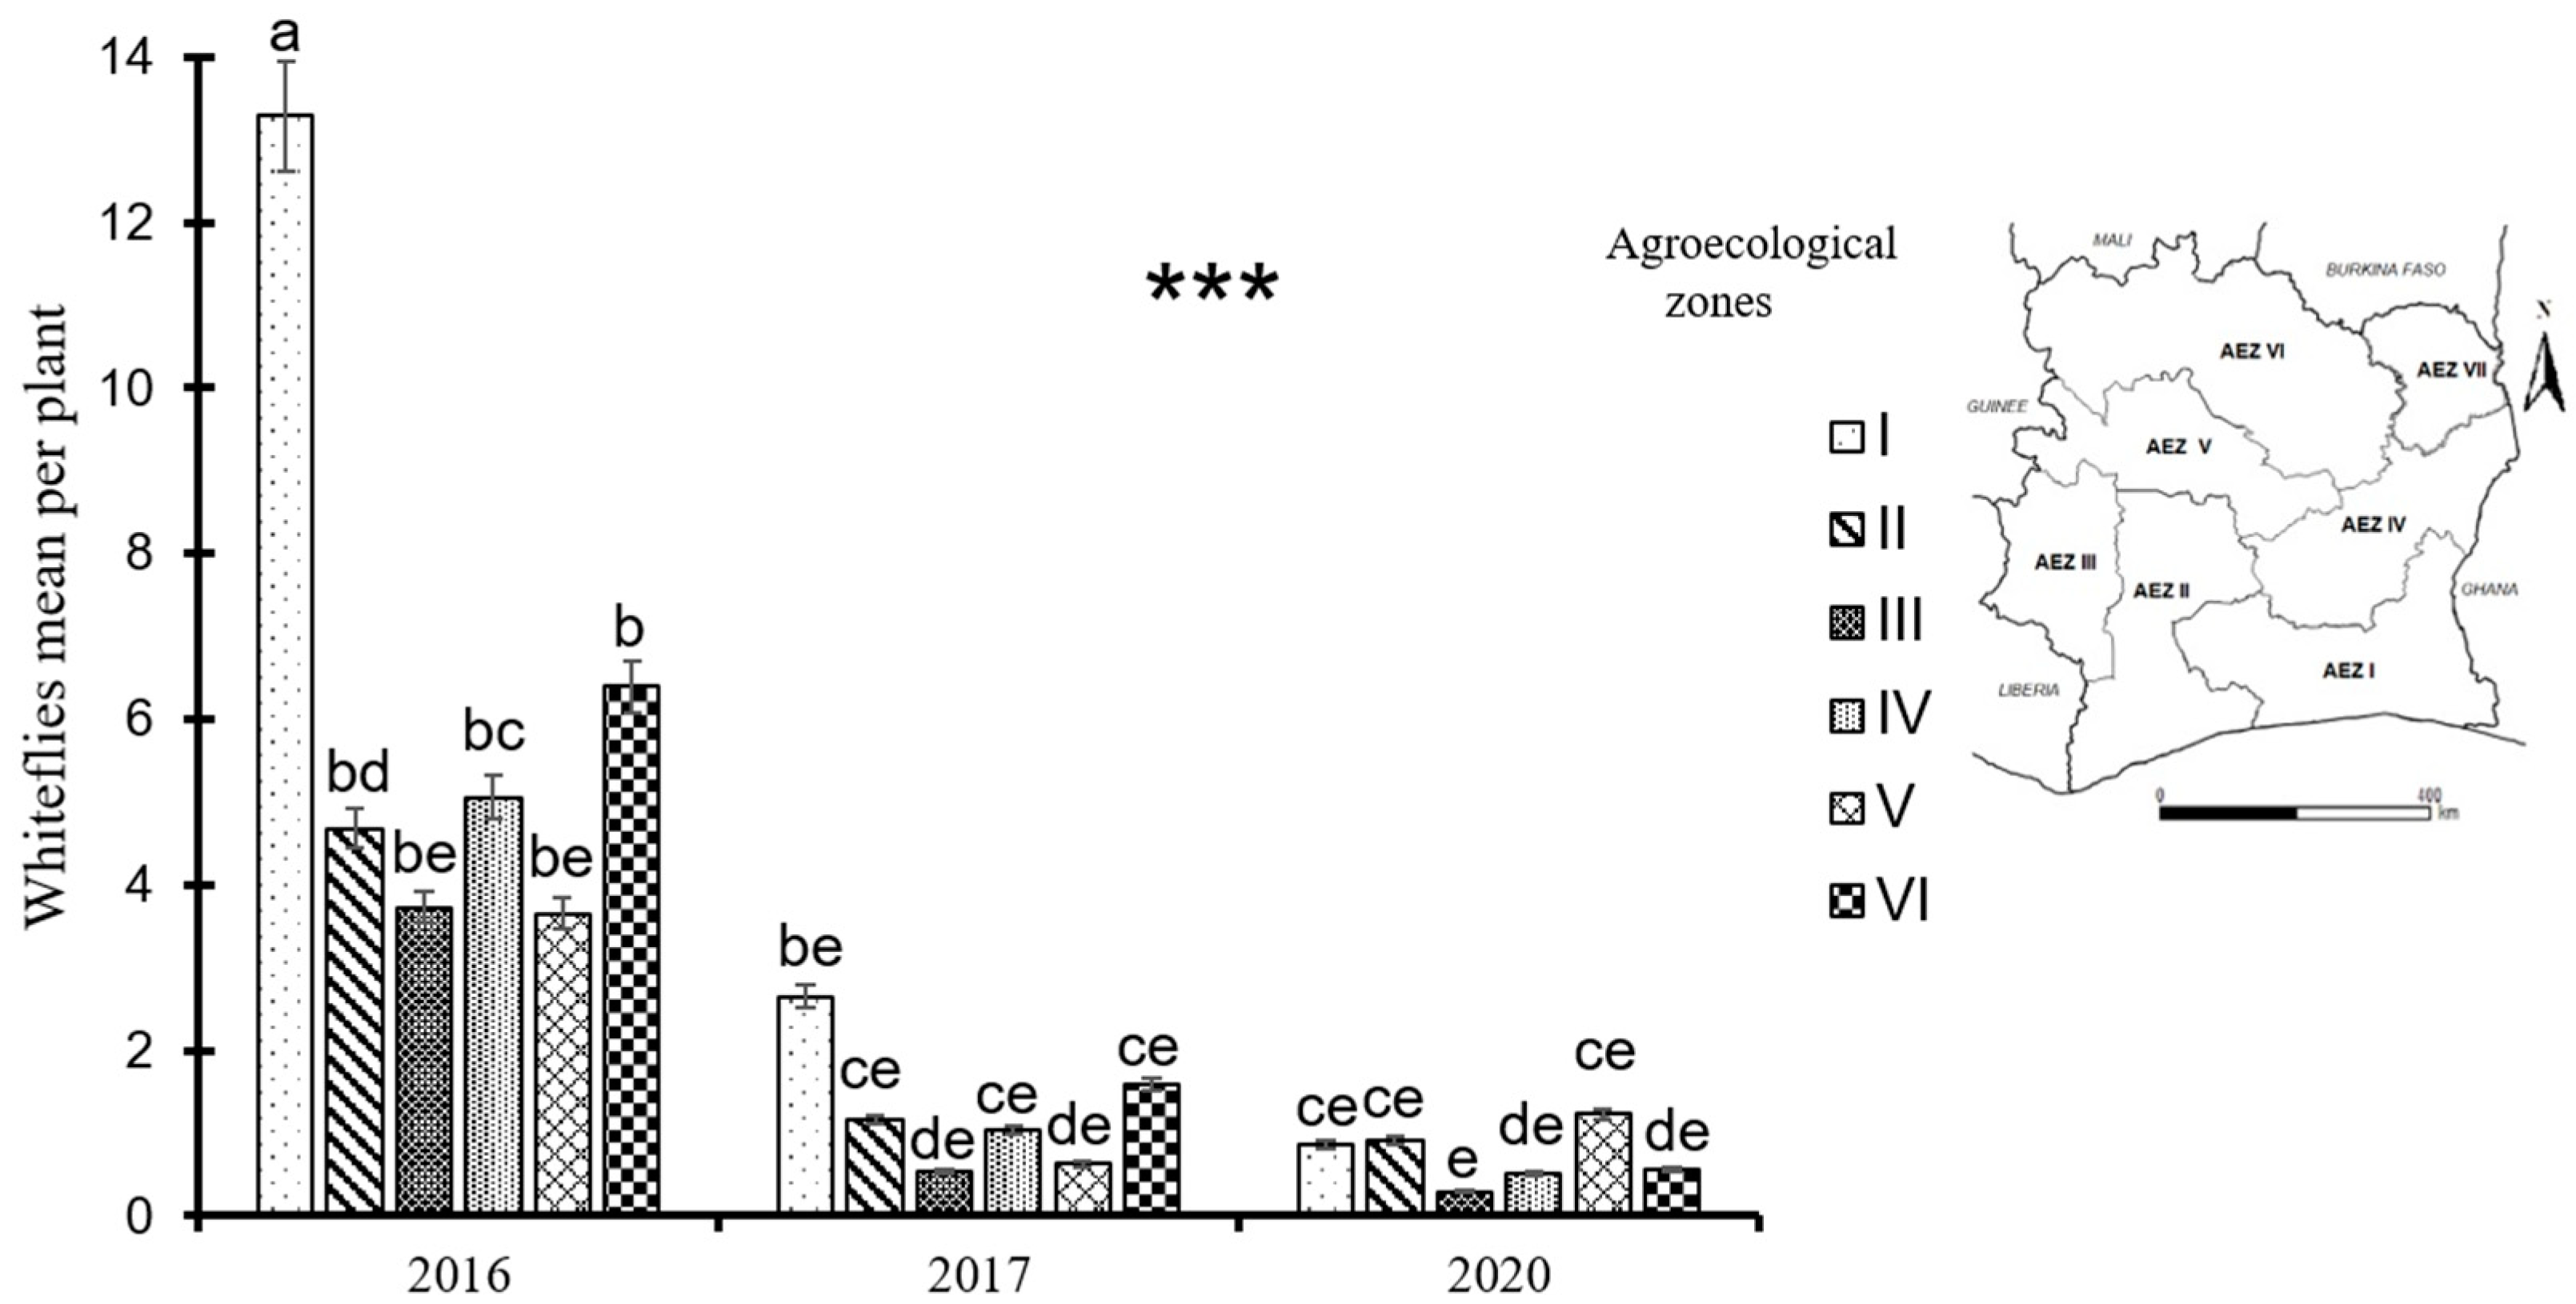
There was a very significant difference between mean whitefly counts per plant in 2016, 2017 and 2020 (p=2e-16). These differences were also very significant between agroecological zones (p=2.43e-12). Whitefly mean decreased from about 6 whiteflies per plant in 2016 to less than 2 whiteflies per plant in 2020. The highest values were observed in agroecological zone I in 2016 and 2017 and in agroecological zones I, II and V in 2020. Moreover, the lowest mean whitefly count per plant was recorded in agroecological zones III and V during 2016 and 2017 surveys and only agroecological zone III in 2020 (Figure 5).

3.4. Evolution and distribution of cassava mosaic begomoviruses

All EACMV identified in this study were EACMCMV using VNF031/032 primers. Out of 438 cassava leaf samples collected in 2016, 73.52% (322/438) were infected by cassava mosaic begomoviruses. Out of these, 35.8% were infected by ACMV alone, 5.9% were infected by EACMCMV alone and 31.7% were coinfected by ACMV and EACMCMV. In 2017, the rate of virus infection in the field decreased from 73.52 % in 2016 to 61.8% (498/806). Of these, around 33.9% of samples were infected by ACMV alone, 3.6% of samples were infected by EACMCMV alone and around 24.3% were coinfected with ACMV and EACMCMV. A similar trend was observed in 2020 with an infection rate decreased to 59.2% (500/844) with 16.9% of samples being infected by ACMV alone, 9.2% infected by EACMCMV alone and 33.1% coinfected by both ACMV and EACMCMV (Table 2).
The single ACMV infection rate decreased from 2016 (35.8%) to 2020 (16.9%). Similar trends were observed for single EACMCMV infection and coinfection ACMV+ EACMCMV between 2016 and 2017. However, between 2017 and 2020, both single EACMCMV infection and coinfection ACMV+ EACMCMV rates increased (Table 2).
The three years CMBs distribution maps showed different infection trends from one year to another according to their repartition in each agroecological zone. Our study revealed that ACMV was the dominant virus found in all regions of cassava cultivation in 2016. But between 2017 and 2020, we observed a regression of the rate of ACMV single infection whereas EACMCMV single infection occurrence increased in all agroecological zones. Also, we noticed that ACMV single infections were gradually replaced by mixed infection ACMV+EACMCMV indicating that EACMCMV is getting ground over ACMV. Mixed infections ACMV+EACMCMV were more prevalent in southern and central Côte d’Ivoire (Figure 6).

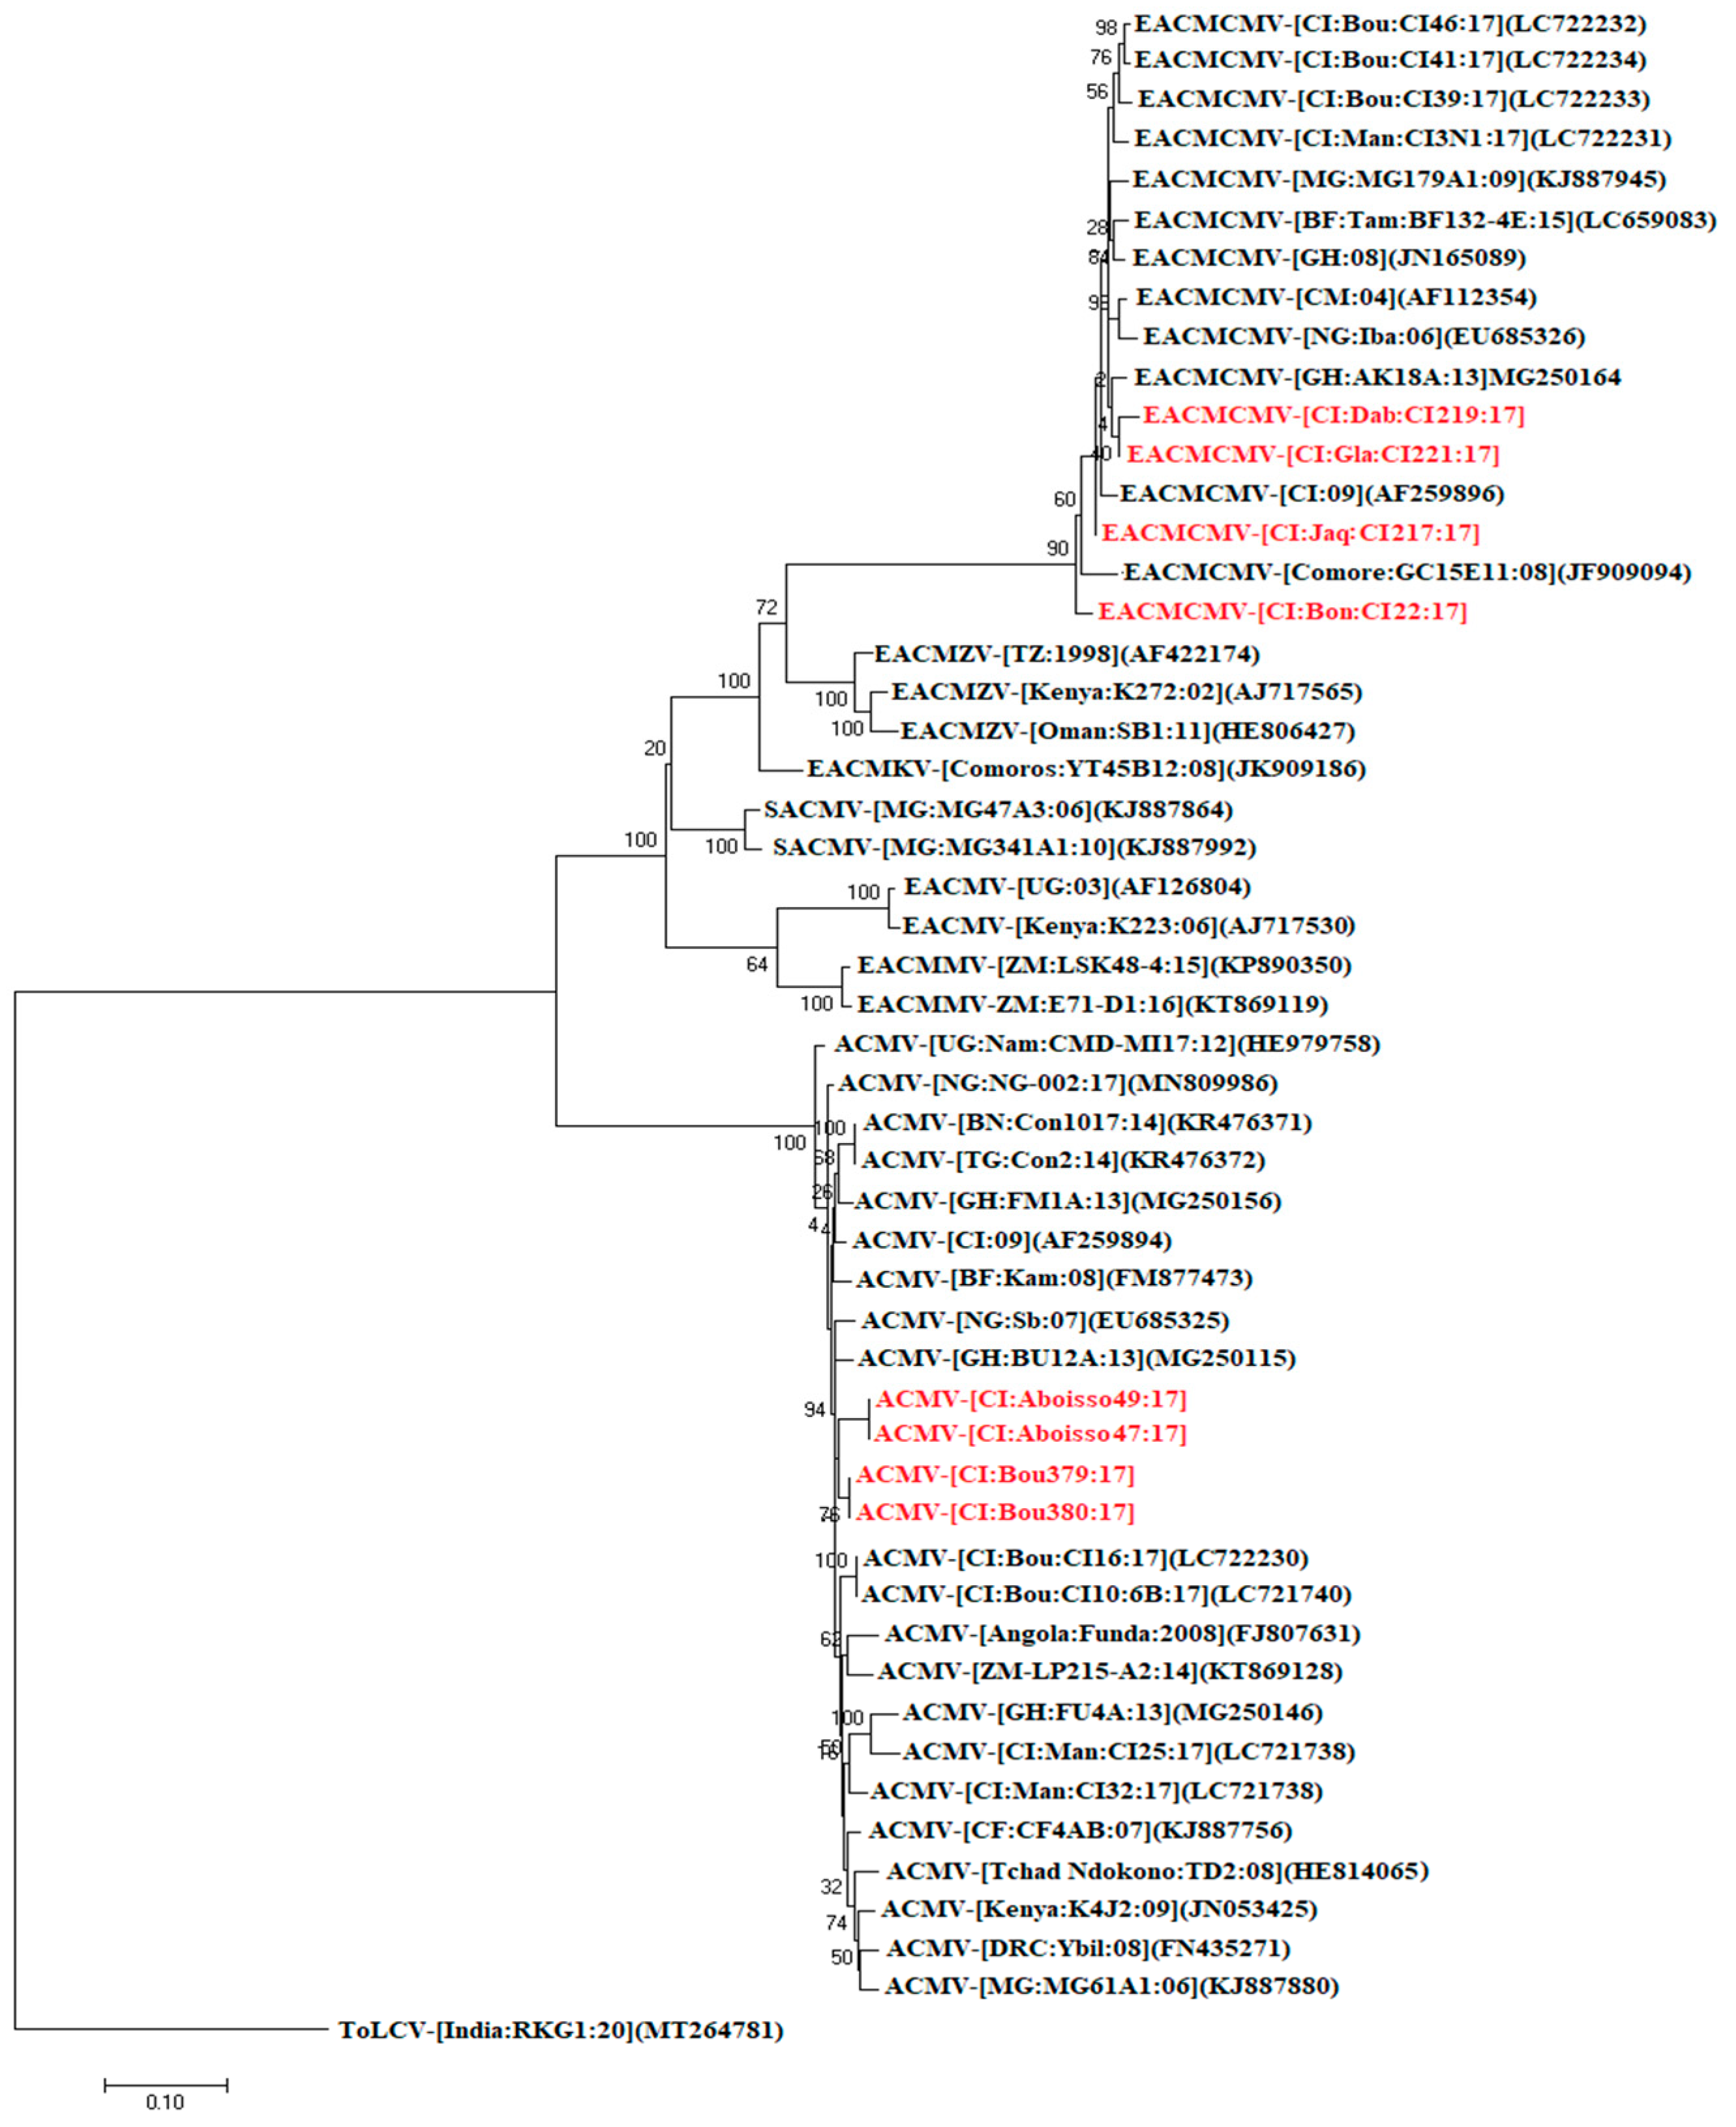
3.5. Phylogenetic analysis of ACMV and EACMCMV Coat Protein genes

Phylogenetic analysis of CP sequences obtained from PCR products with specific primers confirmed that the viruses circulating in Côte d'Ivoire are ACMV and EACMCMV.
Indeed, our ACMV isolates shared the highest nucleotide identity (97%–99%) with ACMV isolates from Ghana (MG250164), Côte d’Ivoire (AF259894), Burkina Faso (LC659083, LC658964) and Benin (KR476371). The EACMCMV isolates from this study were most closely related to the EACMCMV isolates from Ghana (MG250164, JN165089), Côte d’Ivoire (AF259896), Nigeria (EU685326), Madagascar (KJ887944) and Burkina Faso (LC659083) with nucleotide identities between 97%–99% (Figure 7).

4. Discussion

This study provide important informations on the frequency with which CMD spreads in Côte d'Ivoire over the years and also the viruses involved in this evolutionary dynamic. The three years field surveys data obtained revealed that CMD is widespread across the six agroecological zones of Côte d’Ivoire surveyed, with incidences ranging from 46% to 51%. The disease was increasing through the three years due mainly to the use of infected planting material to establish new fields. ACMV and EACMCMV were detected in single infections and in coinfections with the EACMCMV becoming more and more widespread in the country. These viruses were unequally distributed countrywide and the most infected areas were those with high cassava production.
Our data indicated that the incidence of CMD in the cassava fields increased during the study period. The same observation was made by [37] in Zambia and they concluded that this was a result of a continued use of susceptible local cultivars. Our results showed that this increase in CMD incidence was associated to cuttings-borne spread instead of whitefly transmission. These findings are consistent with what was reported in Ghana [38]. This result could be explained by the fact that many of the farmers interviewed during the surveys, are exchanging and planting cassava cuttings without knowledge about CMD symptoms and how the disease is spread. Similar report was made by [39] in Benin. Also, we found out that CMD incidence was especially high in the south (AEZ I, AEZ II and AEZ III) and center part of the country (AEZ V). Indeed, AEZ I and II are traditional zones of high production and high consummation of cassava. AEZ III is also an area of high cultivation of cassava, while AEZ V represents the new belt of intensive cassava cultivation with fields of higher surfaces than what we were accustomed to in Côte d’Ivoire. The high CMD incidence observed in these zones could be linked to the use of local varieties that are in general more susceptible to CMD according to the study of [40,41].
The CMD incidence distribution maps established for the targeted zones over a 4-year period (2016-2020) revealed a differential spread of the disease according to the agroecological zones with the far East of the country less impacted by the disease. This observation could be linked to the diversity of cassava genotypes used in the farming environment. Some farmers prefer local varieties known to be more susceptible to the disease than improved ones which are tolerant to the disease [42]. It is possible that more varieties used in the far East of the country may be improved one that have capacity to resist to CMD.
Although disease incidence increased over the years, our data could not establish a correlation between incidence and the severity of CMD symptoms. Similar observations were made in Ghana by [43]. The moderate symptom severity observed in cassava fields in Côte d’Ivoire during the surveys was similar to the trend observed in Burkina Faso [25]. This moderate symptom severity could be attributed to the fact that the disease has been present in the country for several years and has become endemic, since it is known that in endemic areas the incidence of CMD can be high without severe symptoms [44].
Our data also indicated that the main driver of CMD spread in Côte d’Ivoire is the use of infected cassava cuttings. Indeed, farmers generally use planting materials provided by their neighbours or from their own field regardless of the phytosanitary status of these planting materials and therefore contribute to spreading the disease within their own fields and to nearby fields. This is corroborated by the study of [33]. A relatively low abundance of whitefly was recorded during the surveys confirming that whiteflies are unlikely to be a key factor in the spread of CMD in Côte d’Ivoire. Additionally, we noticed that mean whitefly counts decreased over the study period. Simililar observation as made recently in Burkina Faso [25].
PCR analysis of cassava leaf samples collected from the fields in 2016, 2017 and 2020 confirmed the presence of ACMV and EACMCMV in Côte d’Ivoire as previously reported [17,18]. Analysis of the CP sequences using specific primers pairs indicated that these isolates are very close to ACMV and EACMCMV species circulating in other West African countries.
ACMV was detected countrywide and was the most prevalent virus [19]. However, the rate of occurrence of single ACMV infections dropped from 2017 to 2020 and seems to progressively be replaced by the coinfection of ACMV+EACMCMV. Thus, the high prevalence of ACMV+EACMCMV coinfection increasing with time could be determinant of cassava yield reduction. Also, we are reporting that the rate of single EACMCMV infection is increasing with time and is spreading within Côte d’Ivoire. These findings are very alarming because the situation here presents high similarities with the explosive combination of factors that triggered the devastative CMD epidemic in Uganda in the 90s [13]. The Ugandan CMD epidemic was correlated with the occurrence of a recombinant virus EACMV-UG that spread 20 kilometers southward every year from the center of the country. Here also, we have a recombinant virus EACMCMV with increasing proportion in the cassava viral population. This recombinant was always found in mixed infection with ACMV [4,17,34,45,46] but is now found in increasing proportion of single infection suggesting it may have acquired additional function(s) enabling the virus to infect cassava plants alone. The synergistic interaction between ACMV and EACMV-UG was also a key factor of the Ugandan epidemic. Here also, coinfection ACMV+EACMCMV is becoming prevalent. Fortunately, the third key driver of the Ugandan epidemic, the surge of whitefly population is not a significant factor in Côte d’Ivoire because of the low abundance of whitefly recorded through the four years duration of the study. Henceforth, we highlight here the need to monitor the evolution of the key epidemiological drivers listed above to avoid an outbreak of a CMD epidemic in Côte d’Ivoire.

Author Contributions

Conceptualization, J.S.P., N.K.K. and F.S.; methodology, J.S.P.; software, D.H.O and B.S.M.K.; validation, J.S.P.; formal analysis, D.H.O and B.S.M.K.; investigation, B.S.M.K., A.A.N.Y., C.N., N.K.K. and F.S.; resources, J.S.P.; data curation, B.S.M.K.; writing—original draft preparation, B.S.M.K.; writing—review and editing, J.S.P., N.K.K., J.M.M., L.P.L.V.-L., K.M.K., C.N., M.Z. and F.S.; visualization, J.S.P.; supervision, J.S.P., F.S. and N.K.K.; project administration, J.S.P.; funding acquisition, J.S.P. All authors have read and agreed to the published version of the manuscript.

Funding

This research was funded by the Central and West African Virus Epidemiology (WAVE) program for root and tuber crops, grant number INV-002969 (formerly OPP1212988).

Data Availability Statement

The data presented in this study are available on request from the authors.

Acknowledgments

The authors also want to thank the WAVE team for helping with the data collection and laboratory analysis, Doctor Fidèle Tiendrébéogo and Professor Angela Eni for improving the manuscript.

Conflicts of Interest

The authors declare no conflicts of interest.

References

  1. Amelework, A.B.; Bairu, M.W.; Marx, R.; Owoeye, L.; Laing, M.; Venter, S.L. On-Farm Multi-Environment Evaluation of Selected Cassava. Plants 2022, 11, 1–13. [Google Scholar] [CrossRef]
  2. Jarvis, A.; Ramirez-Villegas, J.; Campo, B.V.H.; Navarro-Racines, C. Is Cassava the Answer to African Climate Change Adaptation? Trop. Plant Biol. 2012, 5, 9–29. [Google Scholar] [CrossRef]
  3. FAOSTAT. Food and Agriculture Organization of the United Nations Statistics. 2021, Available online:. Available online: https://www.fao.org/faostat/fr/#data/QCL (accessed on 15 February 2023).
  4. Ogbe, F.O.; Thottappilly, G.; Dixon, A.G.O.; Atiri, G.I.; Mignouna, H.D. Variants of East African Cassava Mosaic Virus and Its Distribution in Double Infections with African Cassava Mosaic Virus in Nigeria. Plant Dis. 2003, 87, 229–232. [Google Scholar] [CrossRef] [PubMed]
  5. Legg, J.; Ndalahwa, M.; Yabeja, J.; Ndyetabula, I.; Bouwmeester, H.; Shirima, R.; Mtunda, K. Community Phytosanitation to Manage Cassava Brown Streak Disease. Virus Res. 2017, 241, 236–253. [Google Scholar] [CrossRef] [PubMed]
  6. Chikoti, P.C.; Mulenga, R.M.; Tembo, M.; Sseruwagi, P. Cassava Mosaic Disease: A Review of a Threat to Cassava Production in Zambia. J. Plant Pathol. 2019, 101, 467–477. [Google Scholar] [CrossRef] [PubMed]
  7. Mbanzibwa, D.R.; Tian, Y.P.; Tugume, A.K.; Patil, B.L.; Yadav, J.S.; Bagewadi, B.; Abarshi, M.M.; Alicai, T.; Changadeya, W.; Mkumbira, J.; et al. Evolution of Cassava Brown Streak Disease- Associated Viruses. 2011, 974–987. [CrossRef]
  8. Munguti, F.M.; Nyaboga, E.N.; Kilalo, D.C.; Yegon, H.K.; Macharia, I.; Mwango’mbe, A.W. Survey of Cassava Brown Streak Disease and Association of Factors Influencing Its Epidemics in Smallholder Cassava Cropping Systems of Coastal Kenya. Front. Sustain. Food Syst. 2023, 6. [Google Scholar] [CrossRef]
  9. Legg, J.P.; Kumar, P.L.; Makeshkumar, T.; Cuellar, W.J.; Tripathi, L.; Ferguson, M.; Kanju, E.; Ntawuruhunga, P. Cassava Virus Diseases: Biology, Epidemiology, and Management Cassava Virus Diseases : Biology, Epidemiology, and Management. Control Plant Virus Dis. 2015, 85–142. [Google Scholar]
  10. Sseruwagi, P.; Rey, M.E.C.; Brown, J.K.; Legg, J.P. The Cassava Mosaic Geminiviruses Occurring in Uganda Following the 1990s Epidemic of Severe Cassava Mosaic Disease. Ann. Appl. Biol. 2004, 145, 113–121. [Google Scholar] [CrossRef]
  11. Thresh, J.M.; Otim-Nape, G.W.; Thankappan, M.; Muniyappa, V. The Mosaic Diseases of Cassava in Africa and India Caused by Whitefly-Borne Geminiviruses. Rev. Plant Pathol. 1998, 77, 935–945. [Google Scholar]
  12. Zhou, X.; Liu, Y.; Calvert, L.; Munoz, C.; Otim-Nape, G.W.; Robinson, D.J.; Harrison, B.D. Evidence That DNA-A of a Geminivirus Associated with Severe Cassava Mosaic Disease in Uganda Has Arisen by Interspecific Recombination. J. Gen. Virol. 1997, 78, 2101–2111. [Google Scholar] [CrossRef] [PubMed]
  13. Pita, J.S.; Fondong, V.N.; Sangaré, A.; Kokora, R.N.N.; Fauquet, C.M. Genomic and Biological Diversity of the African Cassava Geminiviruses. Euphytica 2001, 120, 115–125. [Google Scholar] [CrossRef]
  14. Szyniszewska, A.M.; Busungu, C.; Boni, S.B.; Shirima, R.; Bouwmeester, H.; Legg, J.P. Spatial Analysis of Temporal Changes in the Pandemic of Severe Cassava Mosaic Disease in Northwestern Tanzania. Phytopathology 2017, 107, 1229–1242. [Google Scholar] [CrossRef] [PubMed]
  15. Saunders, K.; Salim, N.; Malathi, V.G.; Briddon, R.W.; Markham, P.G.; Stanley, J. Characterisation of Sri Lankan Cassava Mosaic Virus and Indian Cassava Mosaic Virus: Evidence for Acquisition of a DNA B Component by a Monopartite Begomovirus. Virology 2002, 293, 63–74. [Google Scholar] [CrossRef] [PubMed]
  16. Hong, Y.G.; Robinson, D.J.; Harrison, B.D. Nucleotide Sequence Evidence for the Occurrence of Three Distinct Whitefly-Transmitted Geminiviruses in Cassava. J. Gen. Virol. 1993, 74, 2437–2443. [Google Scholar] [CrossRef] [PubMed]
  17. Pita, J.S.; Fondong, V.N.; Sangaré, A.; Otim-Nape, G.W.; Ogwal, S.; Fauquet, C.M. Recombination, Pseudorecombination and Synergism of Geminiviruses Are Determinant Keys to the Epidemic of Severe Cassava Mosaic Disease in Uganda. J. Gen. Virol. 2001, 82, 655–665. [Google Scholar] [CrossRef] [PubMed]
  18. Toualy, M.N.Y.; Akinbade, S.A.; Koutoua, S.; Diallo, H.A.; Lava, P. Incidence and Distribution of Cassava Mosaic Begomoviruses in Côte d’Ivoire International Institute of Tropical Agriculture (IITA), PMB 5320, Ibadan, Nigeria. 2014, 4, 131–139.
  19. Yao, F.; Koffi, M.; Abe, I.; Djetchi, M.N.; Konan, T.; Sanogo, T.A. Characterization of Cassava Mosaic Viruses and Current Mosaic Disease Concern in Three Major Cassava Production Areas in Côte D ’ Ivoire. Int. J. Plant Pathol. Mol. 2021, 12, 12–20. [Google Scholar] [CrossRef]
  20. Legg, J.P.; Jeremiah, S.C.; Obiero, H.M.; Maruthi, M.N.; Ndyetabula, I.; Okao-Okuja, G.; Bouwmeester, H.; Bigirimana, S.; Tata-Hangy, W.; Gashaka, G.; et al. Comparing the Regional Epidemiology of the Cassava Mosaic and Cassava Brown Streak Virus Pandemics in Africa. Virus Res. 2011, 159, 161–170. [Google Scholar] [CrossRef] [PubMed]
  21. Legg, J.P.; Ogwal, S. Changes in the Incidence of African Cassava Mosaic Virus Disease and the Abundance of Its Whitefly Vector along South–North Transects in Uganda. J. Appl. Entomol. 1998, 122, 169–178. [Google Scholar] [CrossRef]
  22. Neuenschwander, P.; Hughes, J.D.A.; Ogbe, F.; Ngatse, J.M.; Legg, J.P. Occurrence of the Uganda Variant of East African Cassava Mosaic Virus (EACMV-Ug) in Western Democratic Republic of Congo and the Congo Republic Defines the Westernmost Extent of the CMD Pandemic in East/Central Africa. Plant Pathol. 2002, 51, 385. [Google Scholar] [CrossRef]
  23. Tiendrébéogo, F.; Lefeuvre, P.; Hoareau, M.; Traoré, V.S.E.; Barro, N.; Reynaud, B.; Traoré, A.S.; Konaté, G.; Traoré, O.; Lett, J.M. Occurrence of East African Cassava Mosaic Virus-Uganda (EACMV-UG) in Burkina Faso. Plant Pathol. 2009, 58, 783. [Google Scholar] [CrossRef]
  24. Halle, B.; Bruzon, V. Commission Europeenne Offre de Service Dans le Secteur de la Cooperation Relatif au: Profil Environnemental de La Côte d ’ Ivoire; 2006.
  25. Soro, M.; Tiendrébéogo, F.; Pita, J.S.; Traoré, E.T.; Somé, K.; Tibiri, E.B.; Néya, J.B.; Mutuku, J.M.; Simporé, J.; Koné, D. Epidemiological Assessment of Cassava Mosaic Disease in Burkina Faso. Plant Pathol. 2021, 70, 2207–2216. [Google Scholar] [CrossRef] [PubMed]
  26. Drobnik, J. Modern Techniques of Herbarium Protection. Environ. Chang. Biol. Assess. 2008, 243–246. [Google Scholar]
  27. Eni, A.O.; Efekemo, O.P.; Onile-ere, O.A.; Pita, J.S. South West and North Central Nigeria: Assessment of Cassava Mosaic Disease and Field Status of African Cassava Mosaic Virus and East African Cassava Mosaic Virus Survey Area. 2020, 178, 466–479. [CrossRef]
  28. Hahn, S.K.; Terry, E.R.; Leuschner, K. Cassava for cassava resistance disease. Euphytica 1980, 29, 673–683. [Google Scholar] [CrossRef]
  29. Mouketou, A.; Koumba, A.A.; Gnacadja, C.; Zinga-koumba, C.R.; ABESSOLO MEYE, C. Cassava mosaic disease incidence and severity and whitefly. Afr. Crop Sci. J. 2022, 30, 167–183. [Google Scholar] [CrossRef]
  30. Amoakon, W.J.-L.; Naté, Y.A.A.; Pita, J.S.; Mutuku, J.M.; N’Zué, B.; Combala, M.; Otron, D.H.; Koné, M.; Kouassi, N.K.; Sié, R. Occurrence of Cassava Mosaic Begomoviruses in National Cassava Germplasm Preserved in Two Agroecological Zones of Côte d’Ivoire. Plant Pathol. 2023, 1–11. [Google Scholar] [CrossRef]
  31. Doyle, J.J.; Doyle, J.L. A rapid DNA isolation procedure for small quantities of fresh leaf tissue. Phytochem. Bull. 1987, 19, 11–15. [Google Scholar]
  32. Matic, S.; Pais da Cunha, A.T.; Thompson, J.R.; Tepfer, M. Short Communication an Analysis of Viruses Associated with Cassava Mosaic Disease in Three Angolan Provinces. J. Plant Pathol. 2012, 94, 443–450. [Google Scholar]
  33. Alabi, O.J.; Ogbe, F.O.; Bandyopadhyay, R.; Lava Kumar, P.; Dixon, A.G.O.; D’A. Hughes, J.; Naidu, R.A. Alternate Hosts of African Cassava Mosaic Virus and East African Cassava Mosaic Cameroon Virus in Nigeria. Arch. Virol. 2008, 153, 1743–1747. [Google Scholar] [CrossRef] [PubMed]
  34. Fondong, V.N.; Pita, J.S.; Rey, M.E.C.; De Kochko, A.; Beachy, R.N.; Fauquet, C.M. Evidence of Synergism between African Cassava Mosaic Virus and a New Double-Recombinant Geminivirus Infecting Cassava in Cameroon. J. Gen. Virol. 2000, 81, 287–297. [Google Scholar] [CrossRef] [PubMed]
  35. Kumar, S.; Stecher, G.; Li, M.; Knyaz, C.; Tamura, K. MEGA X: Molecular Evolutionary Genetics Analysis across Computing Platforms. Mol. Biol. Evol. 2018, 35, 1547–1549. [Google Scholar] [CrossRef] [PubMed]
  36. Felsenstein, J. Phylogenies and the comparative method. Am. Nat. 1985, 125, 1–15. [Google Scholar] [CrossRef]
  37. Chikoti, P.C.; Mulenga, R.M.; Tembo, M.; Sseruwagi, P. Cassava Mosaic Disease: A Review of a Threat to Cassava Production in Zambia. J. Plant Pathol. 2019, 101, 467–477. [Google Scholar] [CrossRef] [PubMed]
  38. Torkpo, S.K.; Gafni, Y.; Danquah, E.Y.; Offei, S.K. Incidence and Severity of Cassava Mosaic Disease in Farmer’s Fields in Ghana. Ghana J. Agric. Sci. 2018, 53, 61. [Google Scholar] [CrossRef]
  39. Houngue, J.A.; Pita, J.S.; Cacaï, G.H.T.; Zandjanakou-Tachin, M.; Abidjo, E.A.E.; Ahanhanzo, C. Survey of Farmers’ Knowledge of Cassava Mosaic Disease and Their Preferences for Cassava Cultivars in Three Agro-Ecological Zones in Benin. J. Ethnobiol. Ethnomed. 2018, 14, 29. [Google Scholar] [CrossRef] [PubMed]
  40. Modeste, K.K.; Adolphe, M.; Boni, N.; Edmond, K.; Camille, K. Status of Cassava (Manihot Esculenta Crantz) in Côte d’Ivoire: From Production to Consumption and Evaluation of Technology Adoption. Eur. Sci. J. ESJ 2018, 14, 285. [Google Scholar] [CrossRef]
  41. Assiri, K.P.; Djaratche, B.; Seka, K.; Yao, K.F.; Toualy, M.N.; Kra, K.D.; Fofana, F.; Atta, D.H. Incidence of Viral Diseases on the Yield of Six Varieties of Cassava (Manihot Esculenta Crantz) Grown in the Localities of Adzope and Yamoussoukro (Côte d’Ivoire). 2017, 6, 502–508.
  42. N’zue, B.; Zohouri, P.; Sangare, A. Performances agronomiques de quelques varietes de manioc ( manihot esculenta crantz ) dans trois zones agroclimatiques de la cote d ’ ivoire. Agron. Afr. 2004, 16, 1–7. [Google Scholar] [CrossRef]
  43. Torkpo, S.K.; Offei, K.; Danquah, E.Y.; Gafni, Y. Status of Cassava Mosaic Begomoviruses in Farmers’ Fields in Ghana. AIMS Agric. Food 2017, 2, 279–289. [Google Scholar] [CrossRef]
  44. Thresh, J.M.; Cooter, R.J. Strategies for Controlling Cassava Mosaic Virus Disease in Africa. Plant Pathol. 2005, 54, 587–614. [Google Scholar] [CrossRef]
  45. Ariyo, O.A.; Koerbler, M.; Dixon, A.G.O.; Atiri, G.I.; Winter, S. Molecular Variability and Distribution of Cassava Mosaic Begomoviruses in Nigeria. 2005, 231, 226–231.
  46. Harimalala, M.; Chiroleu, F.; Giraud-carrier, C.; Hoareau, M.; Zinga, I. Molecular Epidemiology of Cassava Mosaic Disease in Madagascar. 2014, 1–7. [CrossRef]
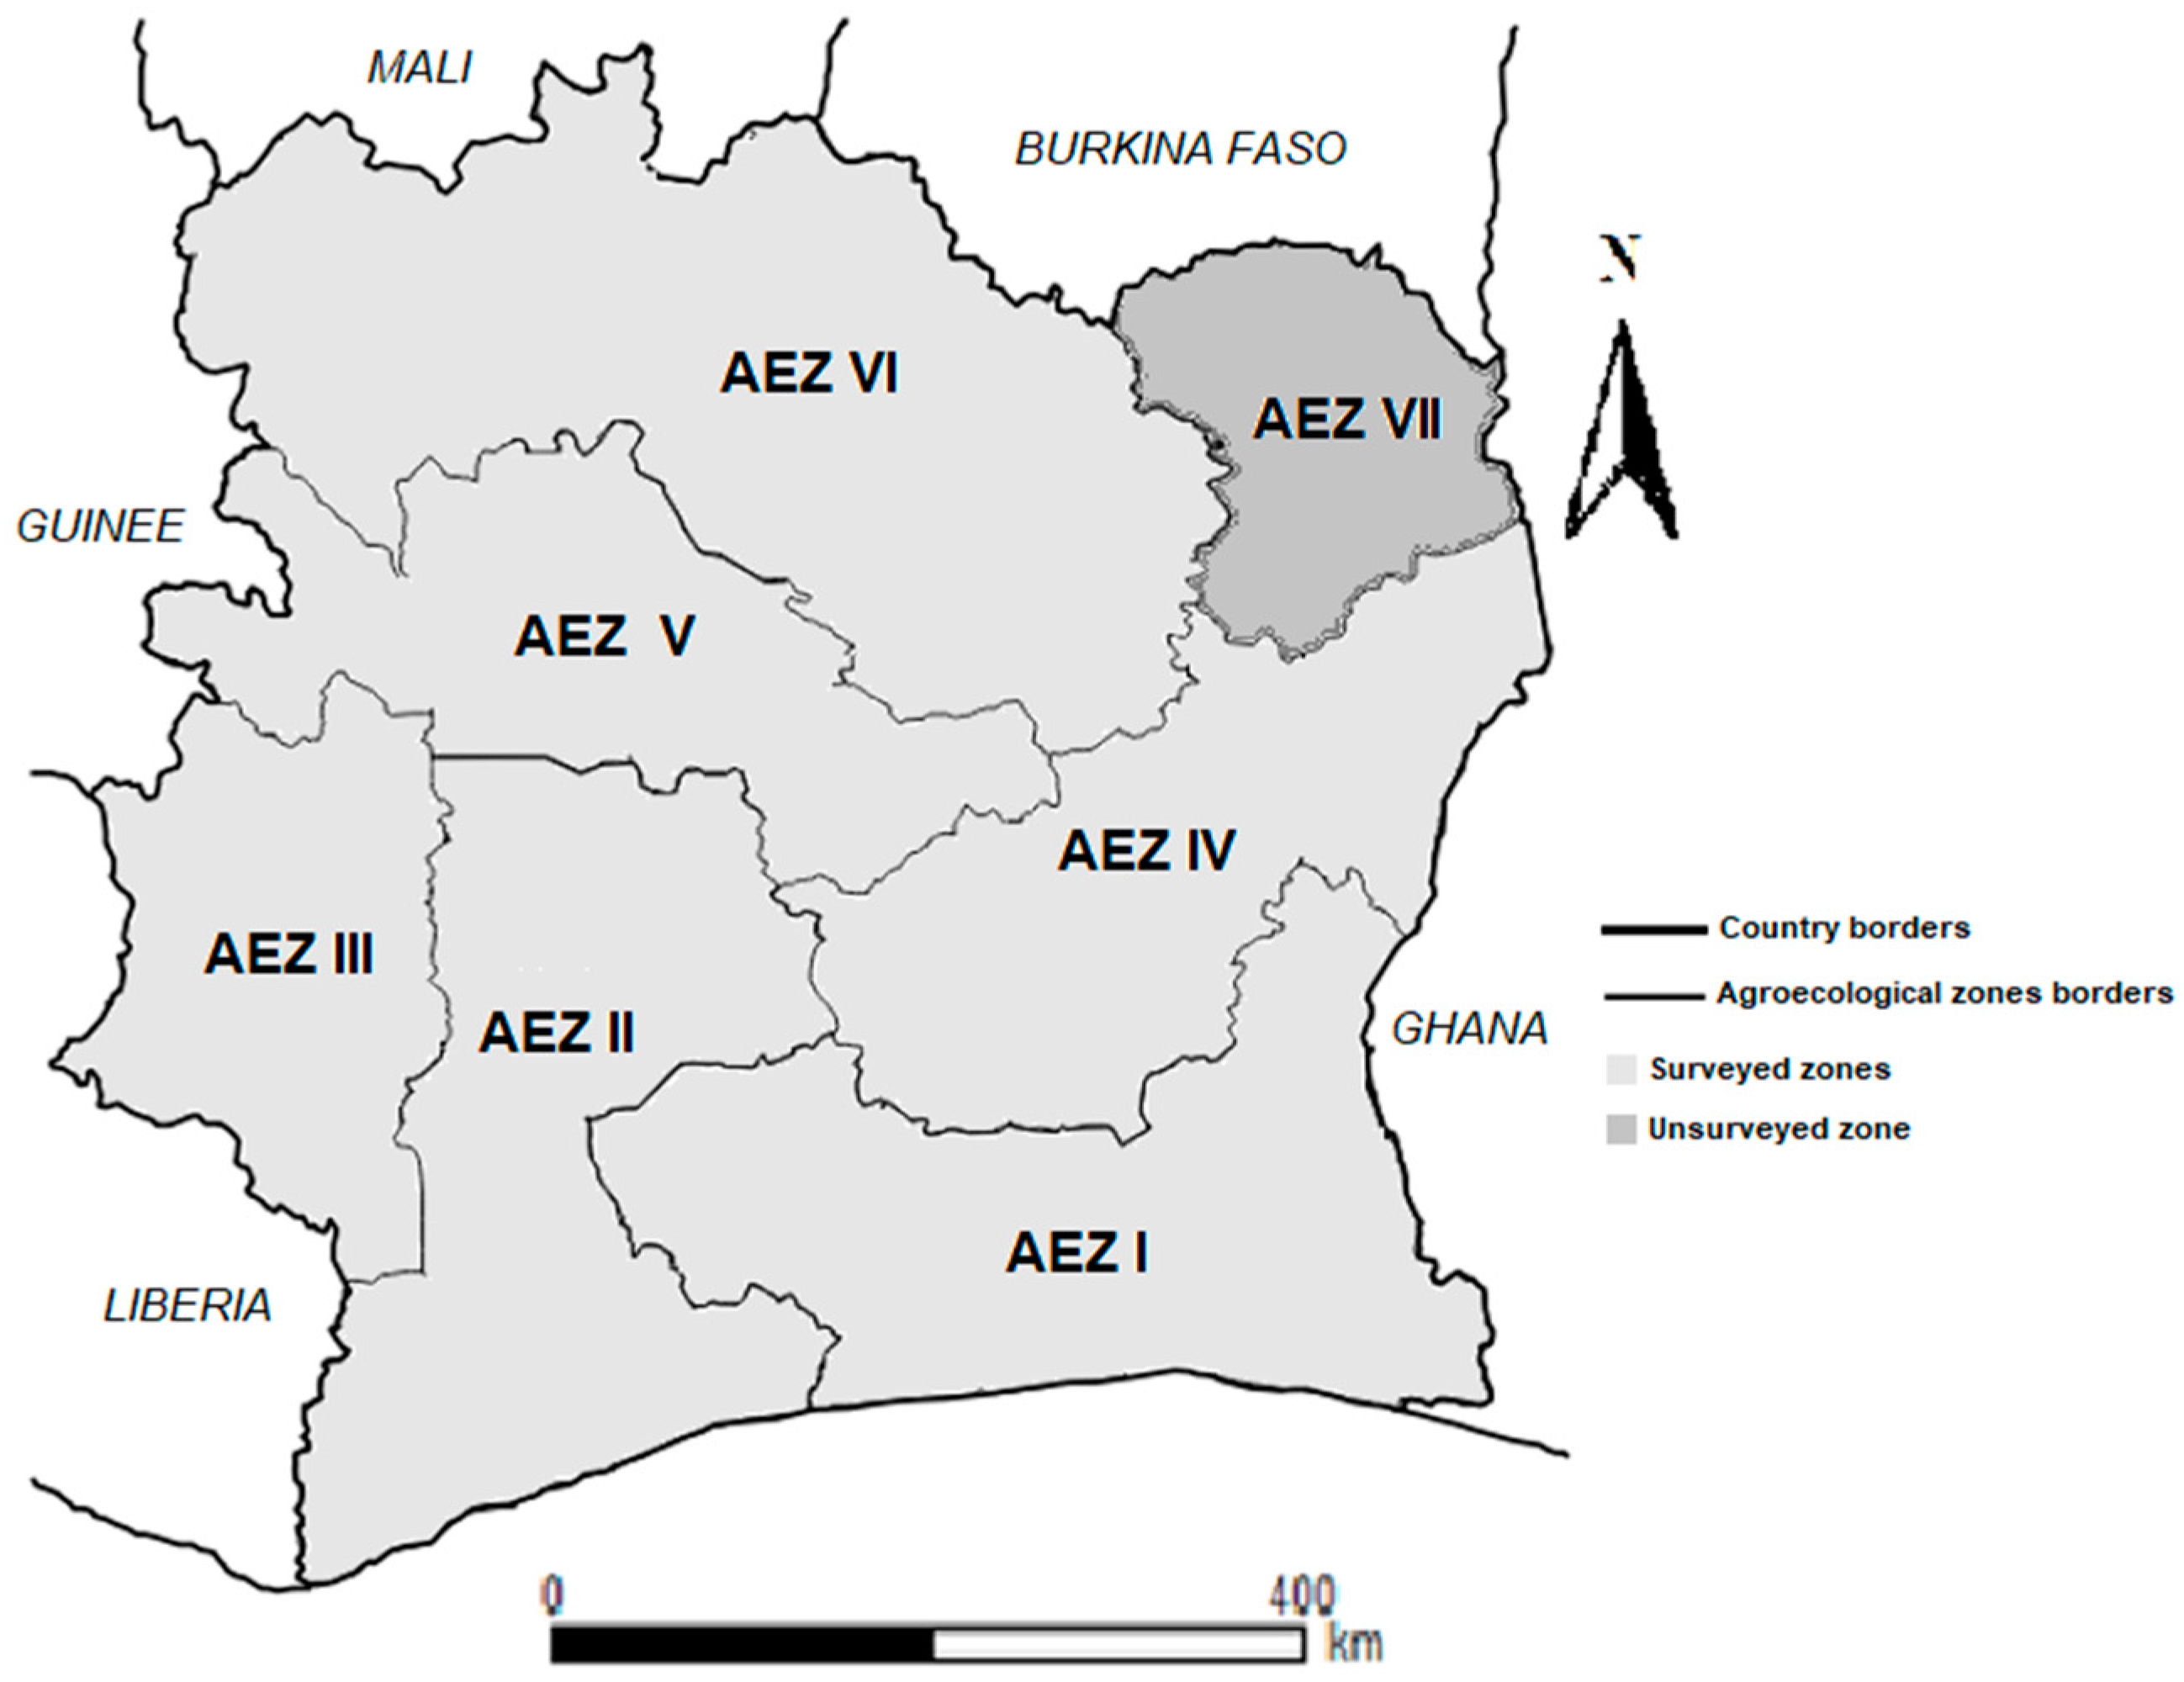
Figure 1. Locations of the six agroecological zones surveyed.
Preprints 96268 g001
Figure 2. Cassava mosaic disease incidence over three years of survey conducted in Côte d’Ivoire. Data are means ± SE. * represent significant difference at p≤0.05.
Preprints 96268 g002
Figure 3. Cassava mosaic disease incidence by agroecological zones during the years 2016, 2017 and 2020 in Côte d’Ivoire. Data are means ± SE. *** represent very highly significant difference at p≤0.001. The bars represent the standard error. Bars sharing the same letters are not significantly different between years and between agroecological zones.
Preprints 96268 g003
Figure 4. Cassava mosaic disease severity by agroecological zones during the years 2016, 2017 and 2020 in Côte d’Ivoire. Data are means ± SE. *** represent very highly significant difference at p≤0.001. The bars represent the standard error. Bars sharing the same letters are not significantly different between years and between agroecological zones.
Preprints 96268 g004
Figure 5. Whitefly mean per plant by survey year and by agroecological zone in Côte d’Ivoire. Data are means ± SE. *** represent very highly significant difference at p≤0.001. The bars represent the standard error. Bars sharing the same letters are not significantly different between years and between agroecological zones.
Preprints 96268 g005
Figure 6. Distribution of African cassava mosaic virus and East African cassava mosaic Cameroon virus in single and mixed infections in different agroecological zones of Côte d’Ivoire (A) 2016, (B) 2017, (C) 2020.
Preprints 96268 g006
Figure 7. Maximum-likelihood phylogenetic tree obtained from alignment of nucleotide sequences of coat protein (CP) gene of African cassava mosaic virus (ACMV) and East African cassava mosaic Cameroon virus (EACMCMV). The names of the sequences characterized in this study are in red. The horizontal scale indicates the genetic distance. The tree is rooted using Tomato leaf curl virus DNA-A (GenBanK accession n° MT264781) as an outgroup.
Preprints 96268 g007
Table 1. Primers used for ACMV, EACMV and EACMCMV detection.
Primers names Sequences (5’-3') Target region Size References
JSP 001 ATGTCGAAGCGACCAGGAGAT ACMV DNA-A (CP)1 783 bp [17]
JSP 002 TGTTTATTAATTGCCAATACT
ACMVBF TCGGGAGTGATACATGCGAAGGC ACMV DNA-B (BV1/BC1) 628bp [32]
ACMVBR GGCTACACCAGCTACCTGAAGCT
JSP 001 ATGTCGAAGCGACCAGGAGAT EACMV DNA-A (CP) 780bp [17]
JSP 003 CCTTTATTAATTTGTCACTGC
CMBRepF CRT CAA TGA CGT TGT ACC A EACMV DNA-A (AC1) 650 bp [33]
EACMVRepR GGT TTG CAG AGA ACT ACA TC
VNF031F GGATACAGATAGGGTTCCCAC EACMV-CM DNA-A (AC2/AC3) ≈ 560bp [34]
VNF032R GACGAGGACAAGAATTCCAAT
1 CP= Capsid Protein.
Table 2. PCR results obtained from samples collected during 2016, 2017 and 2020 surveys in Côte d’Ivoire.
Survey years Viruses detected
Number of samples tested ACMV EACMCMV ACMV/EACMCMV Negative
2016 438 (100%) 157 (35.84%) 26 (5.94%) 139 (31.74%) 116 (26.48%)
2017 806 (100%) 273 (33.87%) 29 (3.60%) 196(24.32%) 308 (38.21%)
2020 844 (100%) 143 (16.94%) 78 (9.24%) 279 (33.06%) 344 (40.76%)
Disclaimer/Publisher’s Note: The statements, opinions and data contained in all publications are solely those of the individual author(s) and contributor(s) and not of MDPI and/or the editor(s). MDPI and/or the editor(s) disclaim responsibility for any injury to people or property resulting from any ideas, methods, instructions or products referred to in the content.
Copyright: This open access article is published under a Creative Commons CC BY 4.0 license, which permit the free download, distribution, and reuse, provided that the author and preprint are cited in any reuse.
Prerpints.org logo

Preprints.org is a free preprint server supported by MDPI in Basel, Switzerland.

Subscribe

© 2024 MDPI (Basel, Switzerland) unless otherwise stated