1. Introduction
The fast increase in global temperatures that has resulted in the urgent need to invest in renewables require a comprehensive study of specific aspects and prospects of renewable energy sources. Previous studies have established low-carbon and cost-effective renewable energy sources that have promising potential to replace climate-threatening fossil fuel-based energy production (Perez & Perez, 2022; Hugo & Soares, 2020; Lovins, 2022; Brockway et al., 2019).
The global energy demand is expected to exceed 1000 EJ by the year 2050 (Moriarty & Honnery, 2012). The most effective and efficient way to meet this future demand for energy is through the dominance of renewable energy. These sources of energy can provide the best mitigation for reducing global warming and stratospheric ozone depletion (Panwar et al., 2011; Dincer, 2000). Examples of the most popular sources of energy include water, wind, hydrogen, geothermal, and biomass. Renewable energy sources, especially hydropower and biomass, contribute to 10% of the energy consumed across the United States (Bull 2001). Harjanne & Korhonen (2019) believe that avoiding the general term “renewable energy and capitalizing on the carbon reduction capability of that energy source is the best strategy to enhance climate change mitigation. Moriarty & Honnery (2016) classified wind and solar as “intermittent” renewable energy sources that we can use as we continue to explore other potential clean energy sources. Aside from climate change mitigation, renewable energy has the capacity to enhance energy security, green growth, poverty alleviation, and green jobs (Edenhofer et al., 2013).
The quest to understand the best source of renewable energy can be tackled from the perspectives of environmental, legal, and social. For instance, Sovacool & Dworkin's (2015) framework on energy justice considers everyone as the end of the decision for a specific form of energy. Energy justice education, cost-decision, and economic policy making are some of the important issues to consider in choosing a specific energy type (Heffron & McCauley, 2017). Sovacool et al.'s (2019) framework considers vital areas in choosing the energy type that serves everyone equally in society. Their framework includes distributive justice, cosmopolitan justice, procedural justice, and recognition justice in the phase of transitioning to low-carbon energy. These social frameworks are very important metrics for overcoming vulnerabilities that come into play when policymakers choose energy types for their community.
The increasing population and industrialization have caused world water demand to increase at a rate of 1% per year (United Nations Water, 2018). As a result, Boretti & Rosa (2019) reported a projected 20% and 85% increase in water demand for energy production in 2035 and 2050, respectively. Again, water consumption in the energy industry is expected to see an 85% increase in 2035 (United Nations Department of Economic and Social Affairs, 2015). Caretta et al. (2022) reported with high confidence that thermoelectric power capacities are projected to decrease due to declining water levels. Zhang et al. (2017) stated that coal-powered plants account for 11% of total water consumption in China. Interestingly, China has been smart enough to lead the world in the production of renewable power. It is worth mentioning that 15% of global water withdrawals are used for power production in the present world, where 2.8 billion individuals are in dire need of water for survival (United Nations Department of Economic and Social Affairs, 2015). The increasing demand for water for energy production warrants the need to consider renewables that have lower water consumption rates. It is important to streamline the comprehensive operational water requirements of energy sources in transitioning from fossil fuels to clean energy.
The impacts of climate change have resulted in a competitive demand for water for industrial and domestic uses. For instance, assessing predictions from different models, Vincent-Serrano et al. (2022) found an increasing trend in the severity of the global drought. Also, Lotka et al. (2020) reported a record-breaking drought severity since the late 19th century for 2015–2018 in central Europe. Further, Madarres et al. (2016) found monotonic changes in drought severity across different climate zones in Iran. It is interesting to know that 27% and 46% of power plants in the United States were not in operation in February and August 2015 due to challenges related to availability (Lee et al., 2020). Vliet et al. (2016) (a) reported that global drought caused a 5.2% reduction in hydropower from 1981 to 2010. This evidence requires the need to improve on the understanding of how much water will be required to keep power plants or hydro dams in operation for current and future.
Different energy sources require varying amount of water to reach their full potential. The link between water and energy has been explored by many different water-energy frameworks (Hamiche et., 2016). These frameworks include technical solutions, micro-national systems, urban growth, water availability, water-energy dynamics, and analysis of government authorities (Dai et al., 2018; Ding et al., 2020). These water-energy nexuses are vital to the implementation of energy policies that favors environmental and human implications of energy systems. The present study falls within the nexus of water-energy and seeks to review the current and future water needs of different energy systems in these challenging times where energy competes with humans for water usage.
We hypothesize that renewables have the potential to decrease the amount of water required to generate one kilowatt of power. The question is, which of the emerging energy sources can save us enough water in the present and future scenarios? In this study, we assessed previous studies, and analyzed data from trusted sources to provide a clearer view of how much water will be required to keep different energy systems working in the present and future scenarios.
2. Methods
We reviewed studies on water requirements by different energy types for current and future scenarios and analyzed data from papers to illustrate our review. First, we used the International Energy Agency's (IEA's) water consumption and withdrawal data to calculate the additional water that will be required to keep power plants in operation in 2030. The IEA made these estimations for the sustainable development scenario (2016–2030) and the net zero scenarios (2021–2030) (IEA, 2022; IEA, 2023). We did our analysis by subtracting the projected volume of water from the original volume required to produce each energy type. Second, using data extracted from the US Energy Information Administration website, we made time series plots to assess trends of total water withdrawal for thermometric plants in the United States (EIA, December 17, 2021). We used Food & Water Watch fact sheet (2022) water withdrawal and consumption in cubic meters per megawatt hour for once-through and recirculation cooling stages of different energy to illustrate the negligible water reduction potential of solar and wind. We made plots of the water requirements of water-intensive solar technologies using model projections in Frisvold & Marquez (2013). We used the used calculations of water consumption presented in Scherer & Pfister (2016) to illustrate water scarcity stress and requirements for nine leading groups of hydropower plants. We reviewed studies that assessed the potential of hydropower in drought and water scarcity.
3. Results and Discussion
3.1. Operational Water Requirements by Different Energy Sources
The intrusion of photovoltaic (PV) and wind will potentially cause water usage by fossil fuels to decline. It is interesting to know that engineers are continuously developing highly efficient and cost-effective PV technologies, with most of them deployed in Spain and the United States (Pazeri et al. 2014). Macknick & Cohen (2015) reported that water consumption by coal, nuclear, and natural gas plants is expected to drop from 1.7 trillion gallons per year in 2020 to 1.6 trillion gallons in 2030, with a further decline to 1.1 trillion gallons in 2050. They further mentioned that water withdrawals will decline from 42 trillion gallons per year in 2010 to 33 trillion gallons in 2030 and further decline to 8 trillion gallons per year in 2050. Looking at the world’s direction towards renewables, the use of water for energy could reduce even further than the above stated 1.1 trillion gallons in 2050. The European Wind Energy Association (2014) reported that wind energy was able to save the European Union 387 million cubic meters of water in 2012, at a cost of about 743 million euros. Again, wind power will save 1.22 to 1.57 billion cubic meters per year, costing between 3.34 and 4.30 billion euros by the year 2030 (European Commission, 2012). Should wind be employed in many countries in the world, water demand for energy could be approaching zero. Bellini, 2019 mentioned that solar PV and wind consume only 2–15% and 0.1–14% of the water required by coal and nuclear plants to generate 1 MWh. They mentioned that by 2050, water consumption and withdrawals will decrease by 97.7% and 95.1%, respectively.
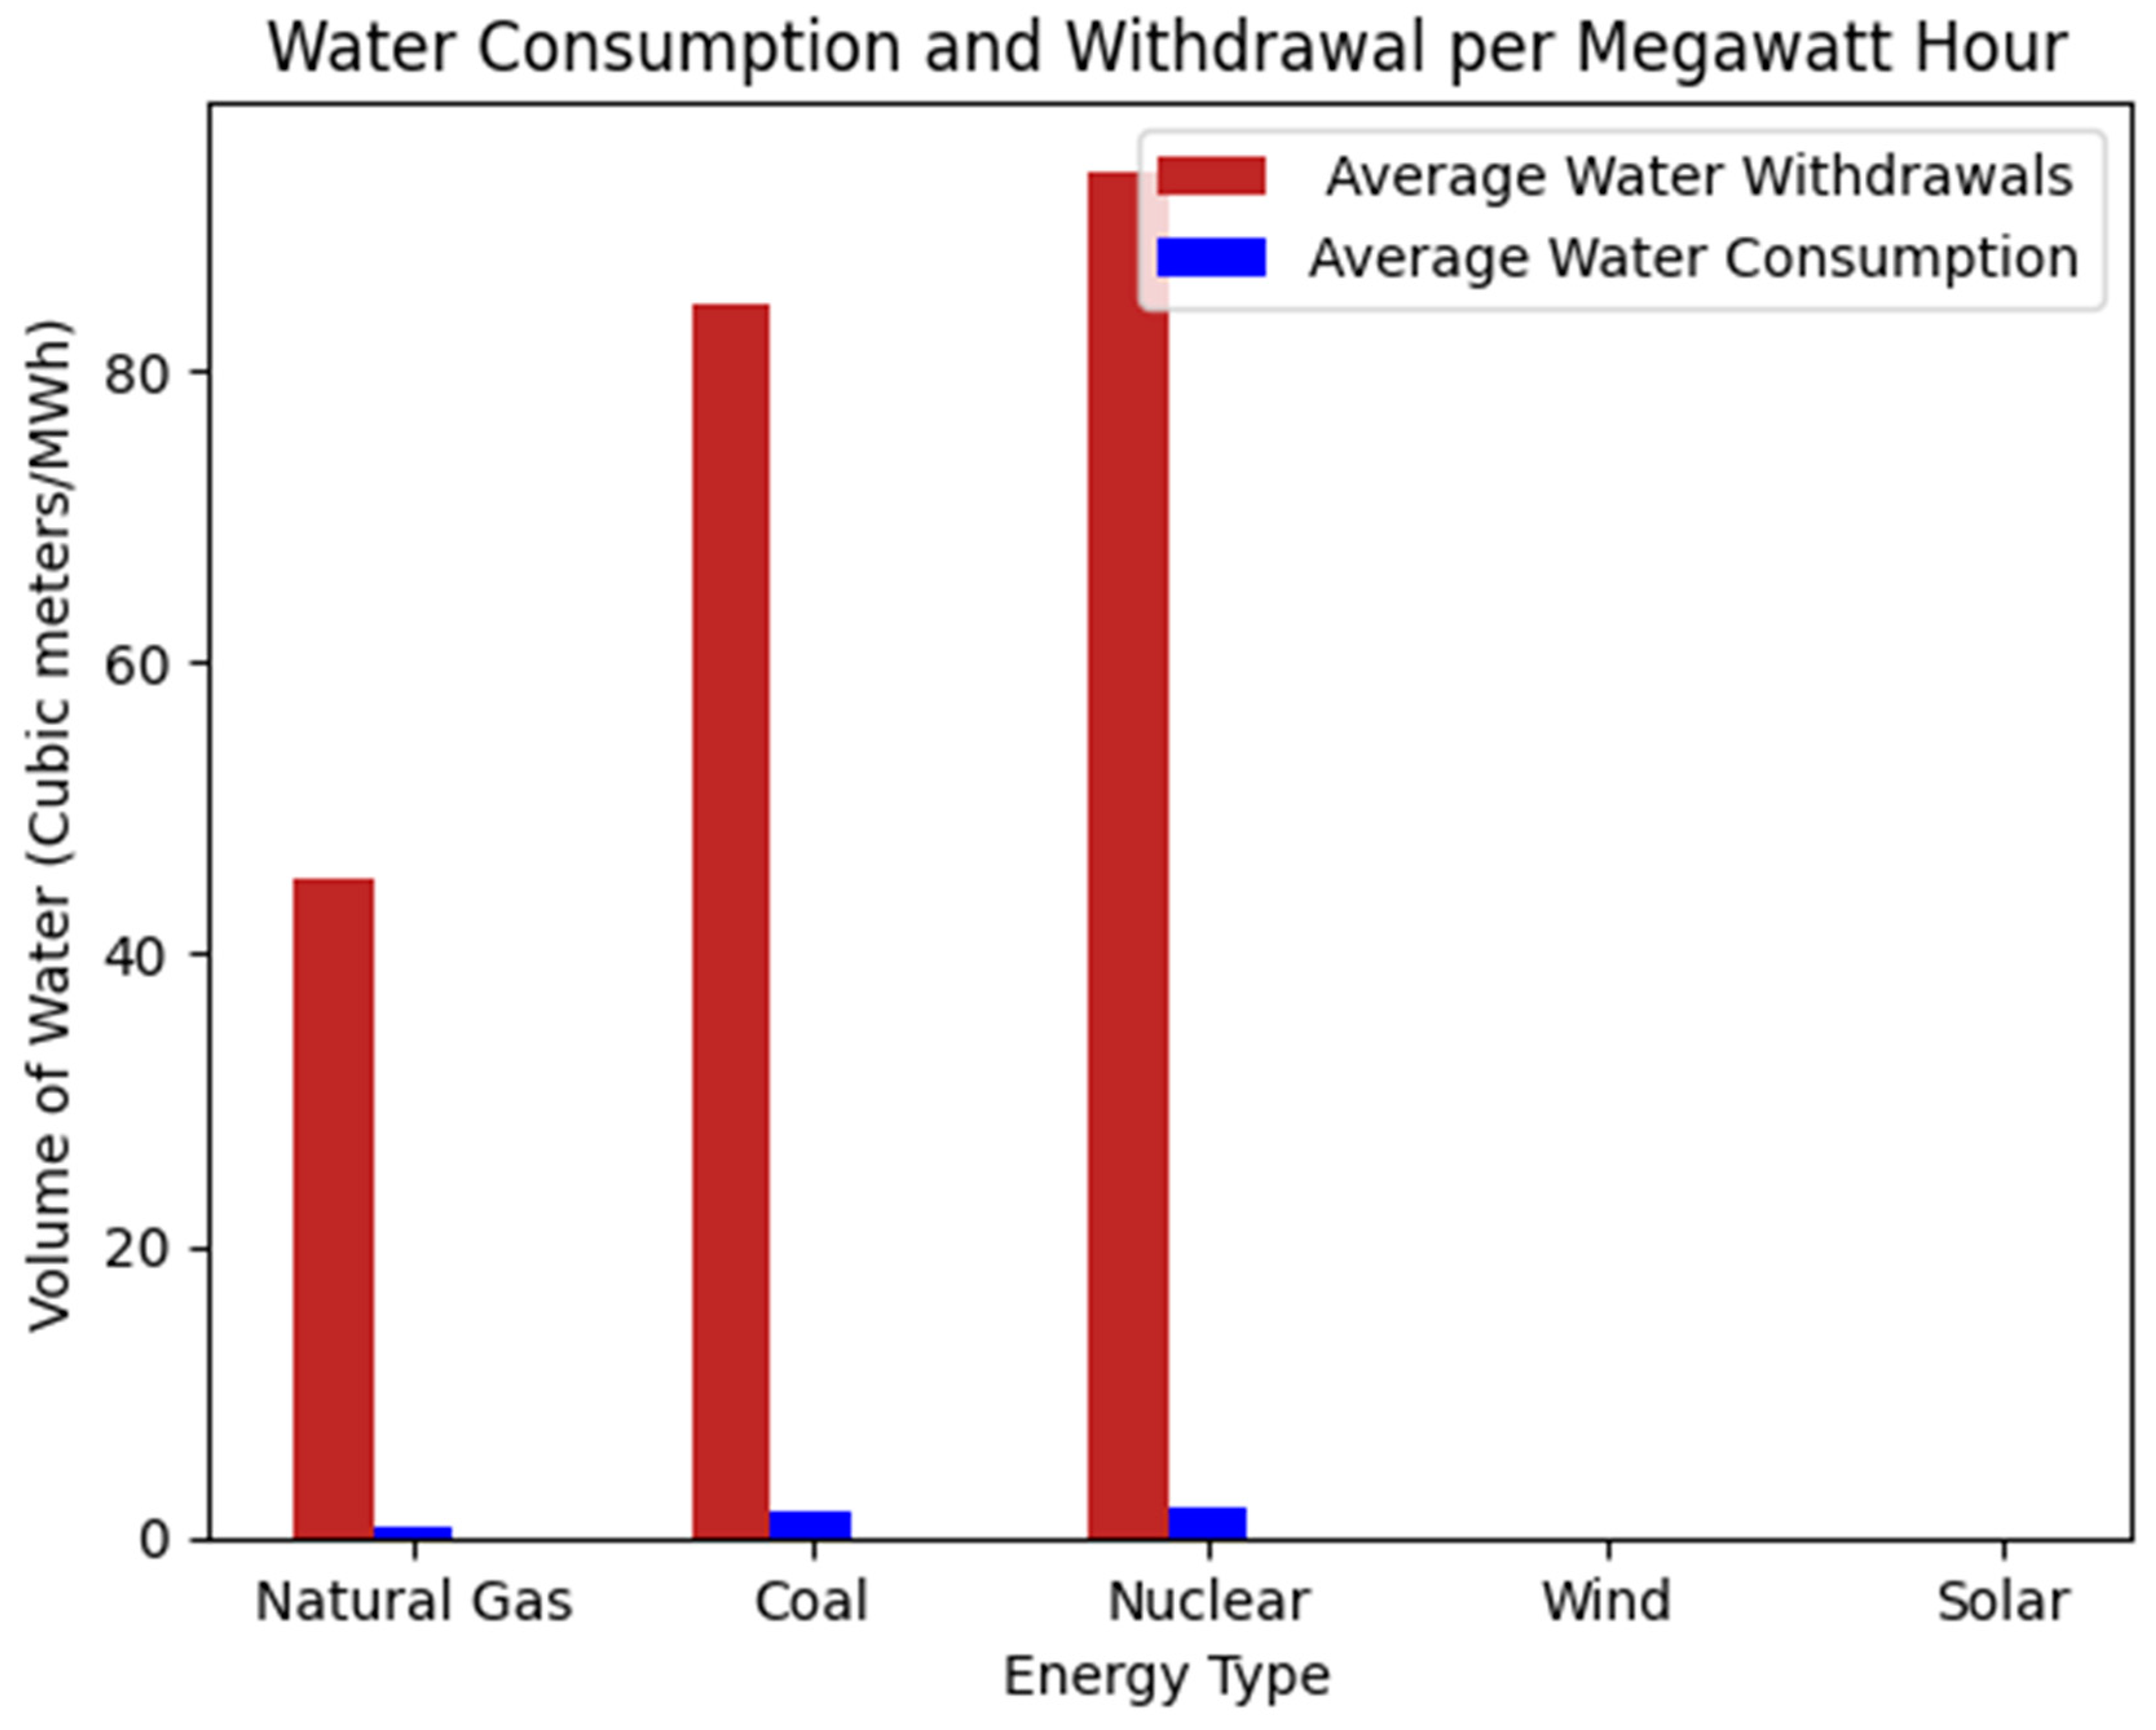
We illustrated the capacity of solar and wind to reduce water requirements by replotting the Food & Water Watch Fact Sheet’s (2022) water withdrawal and consumption in cubic meters per megawatt hour for once-through and recirculation cooling stages. As shown in
Figure 1, their data shows that nuclear power withdraws 93.6 m³ for one megawatt of electricity produced, followed by coal with about 84.4 m³/MWh, and then natural gas with about 45.1 m³/MWh. Again, water consumption is far less than water withdrawals in each of the energy types, with nuclear being the highest with 2.0 m³/MWh. Coal has 1.7 m³/MWh of water consumption, followed by natural gas with about 0.6 m³/MWh. Solar and wind are on top of the chart in terms of less water usage in the once-through and recirculation cooling stages (
Figure 1). Their data show that solar withdraws 0.04 m³/MWh and consumes 0.02 m³/MWh. Wind withdraws and consumes 0.04 m³/MWh. The presented water requirements from the Food & Water Watch Fact Sheet (2022) are consistent with the estimation of 0–33 gal/MWh for utility-scale solar PV reported in Macknick et al. (2011). The evidence presented above, is consistent with the report that solar PV consumes 2–15% and wind consumes 0.1–14% of the water required to generate coal-powered energy (Bellini, 2019). Although wind power requires virtually no water consumption, Li et al.'s (2012) analysis of the water consumption of wind power estimated 0.64 l/kWh of water consumption over the life cycle of wind power. They mentioned that the primary industries that indirectly relate to the water consumption of wind power are agriculture (25%), agricultural services (11%), forestry (8%), livestock (5%), and fisheries (2%).
Contrary to the above-mentioned studies, some solar technologies require large volumes of water to operate. For instance, wet-cooled parabolic trough and power tower solar plants consume 500 - 800 gal/MWh (Solar Energy Industries Association, 2023). Macknick et al. (2011) estimated that solar thermal systems with cooling towers use 725–1057 gal/MWh, hybrid concentrated solar power (CSP) uses 90–345 gal/MWh, dry-cooled CSP consumes 26–79 gal/MWh, and utility-scale solar PV uses 0–33 gal/MWh. Bucknall (2013) estimated the water requirements of CSP plants at 3500 liters per MWh. Again, Bucknall (2013) estimates that the water requirements of CSP plants are higher than those of natural gas combined cycle (1000 liters/MWh) and coal-fired power plants (2000 liters/MWh). The good news is that manufacturers of concentrated solar technologies are doing all they can to make new technologies that cut 90% of CSP water requirements.
The advantages of CSP over other types of solar technologies include economical operating costs, good scale-up potential, and high energy efficiency. Goyal et al. (2022) mentioned desert areas as potential warehouses for CSP applications because of the absence of vegetation and cloud cover that could block the reception of solar irradiance. However, in a state of water insecurity where humans need the water to drink, CSP could find it difficult to operate.
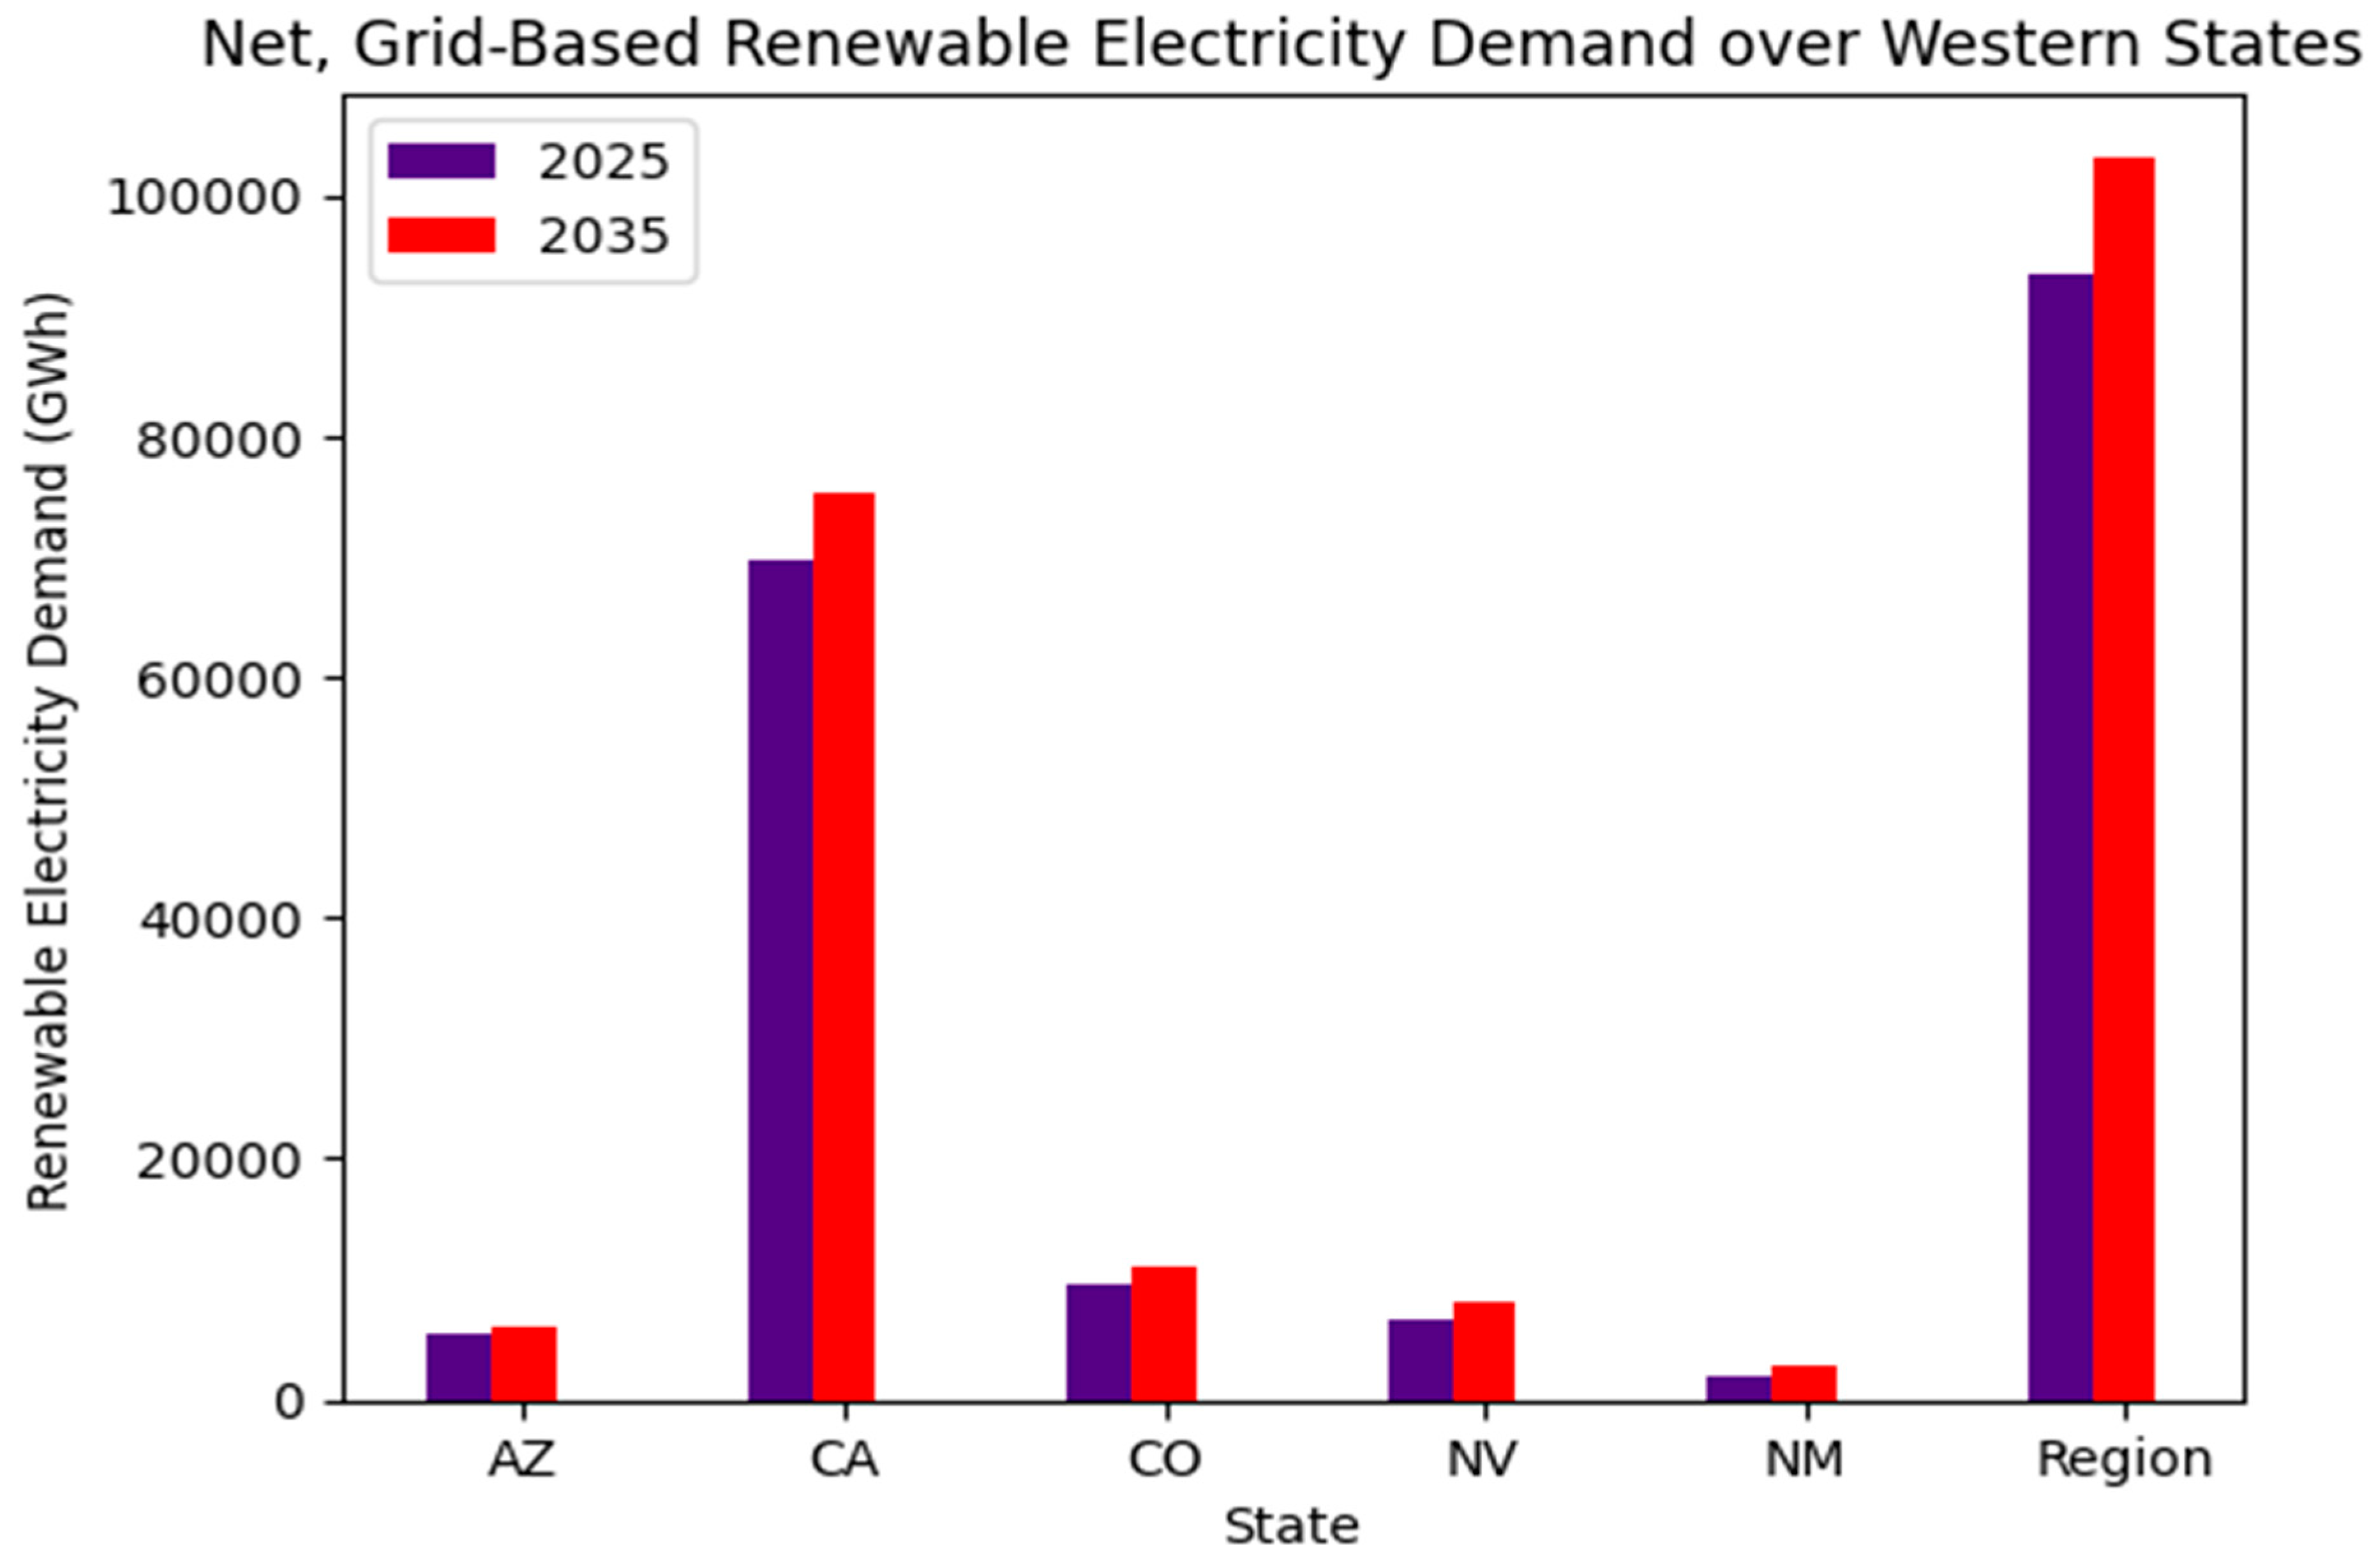
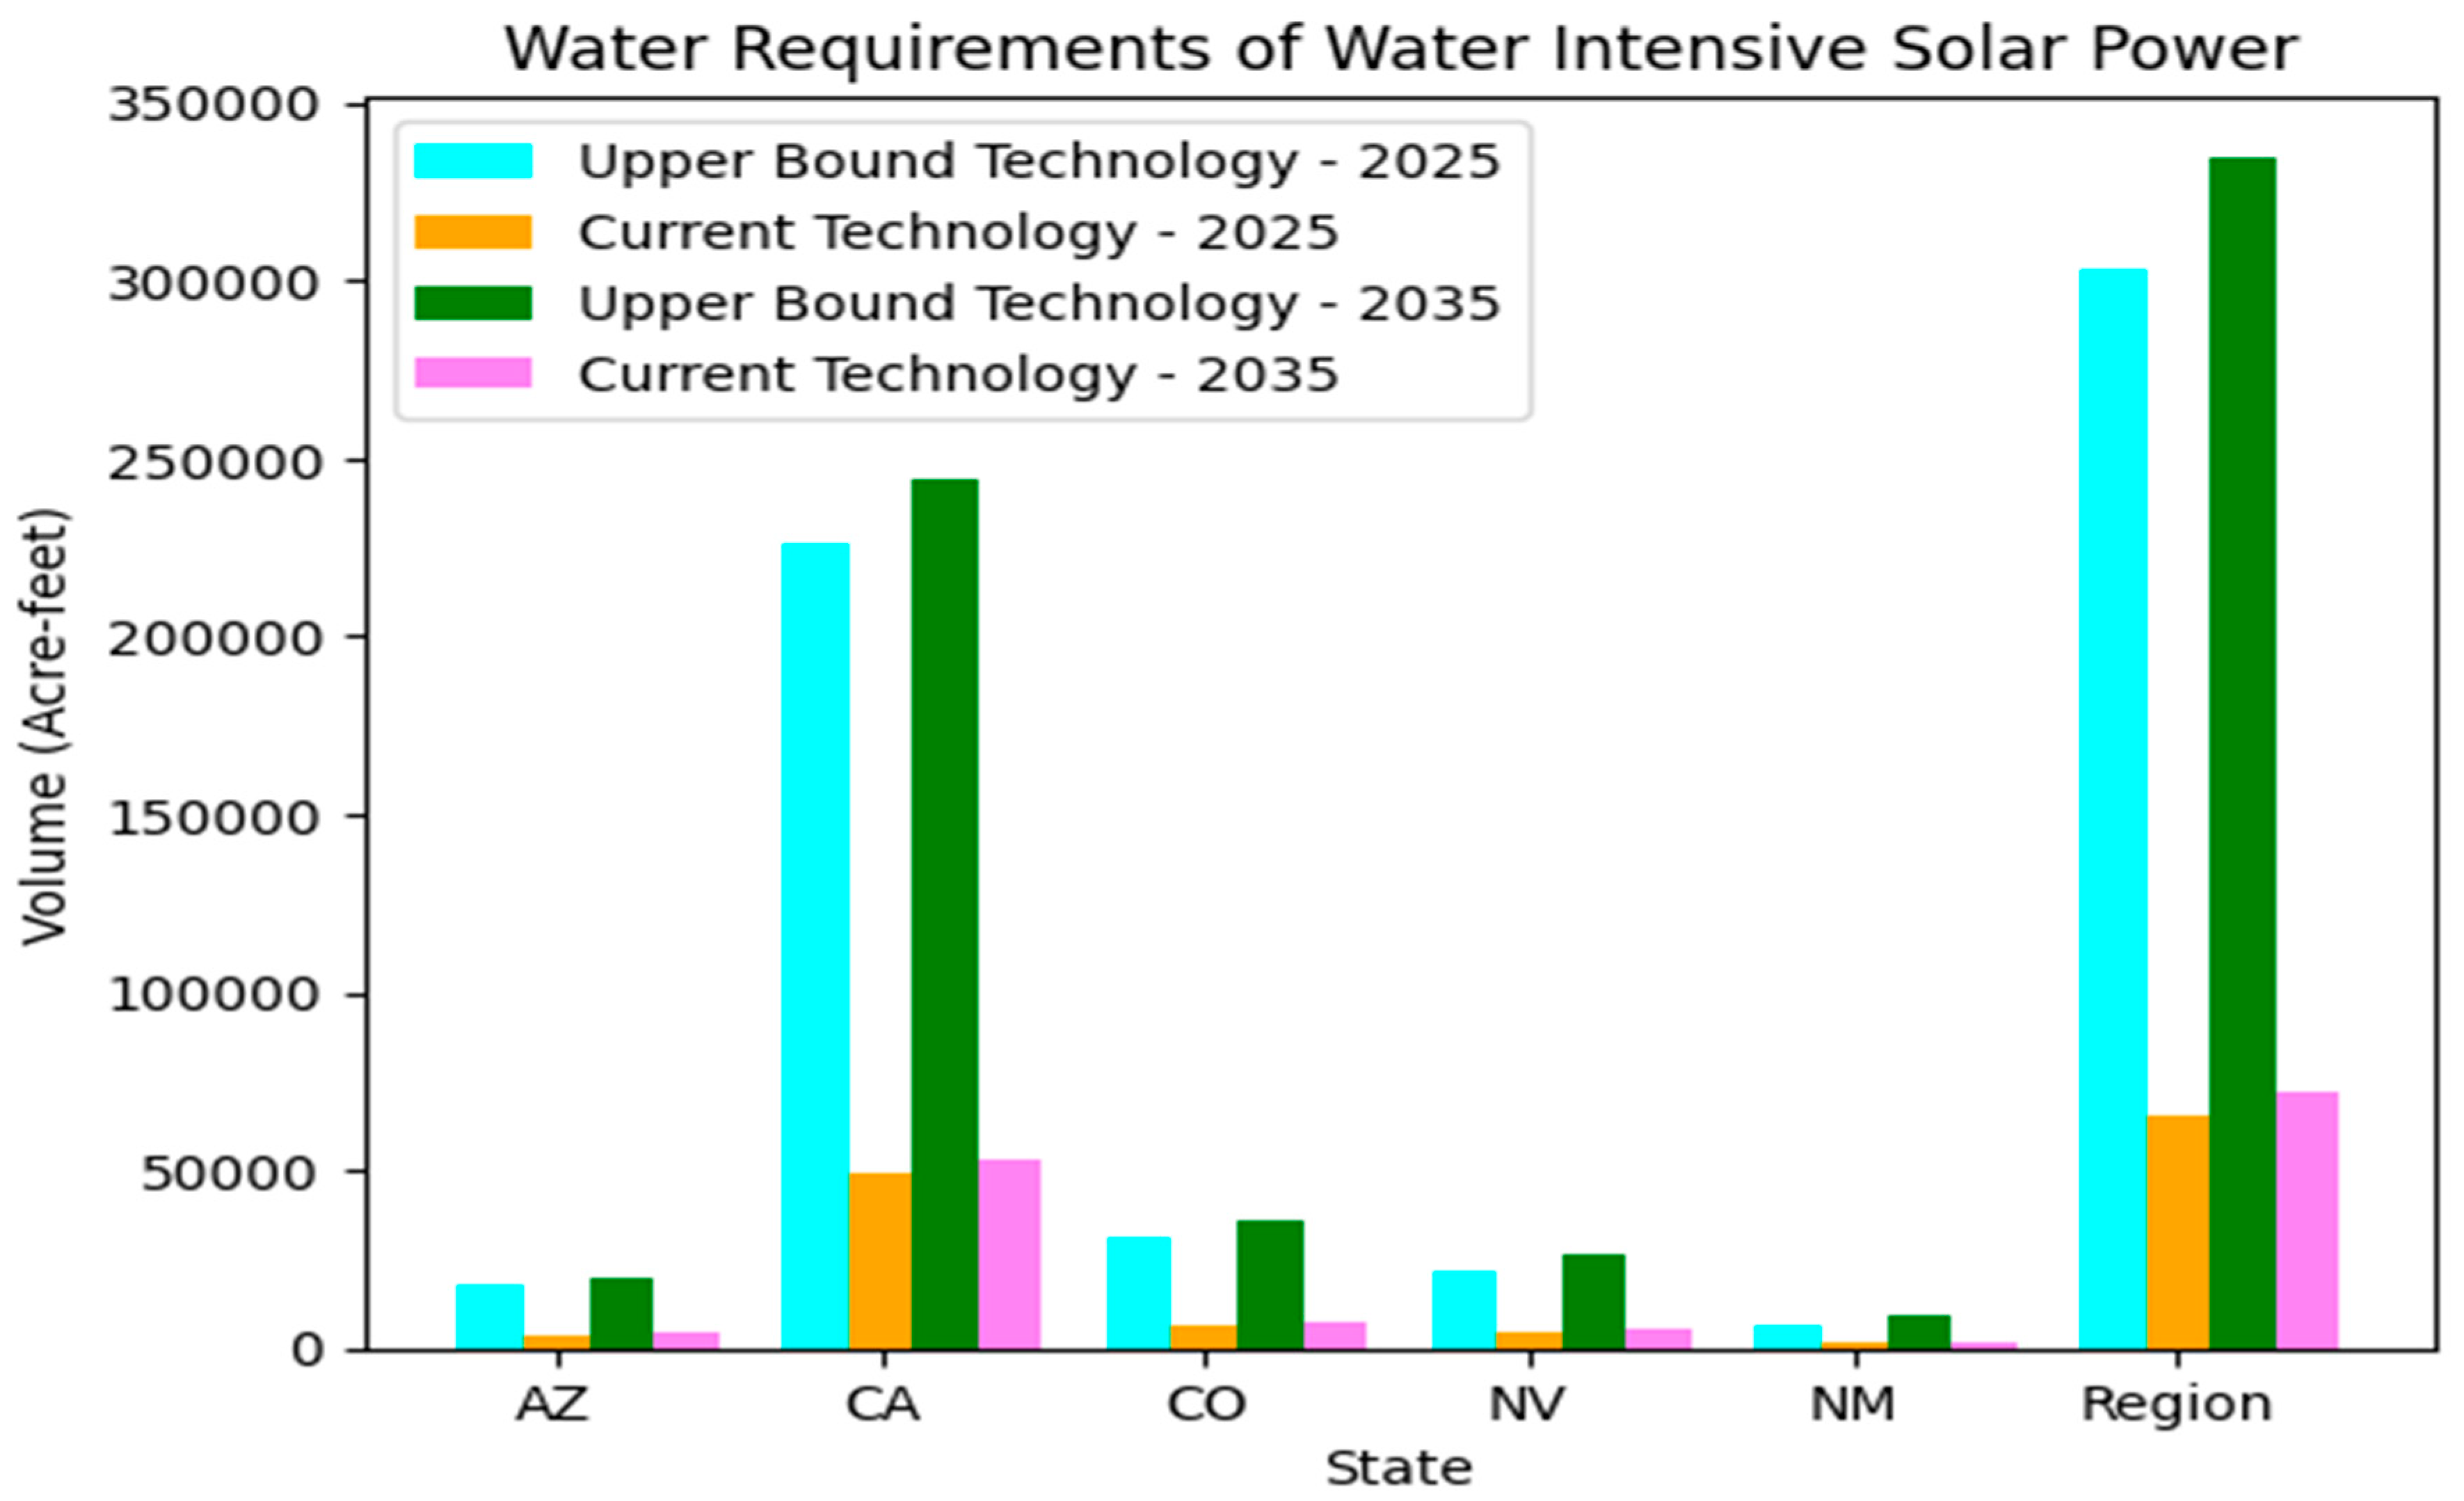
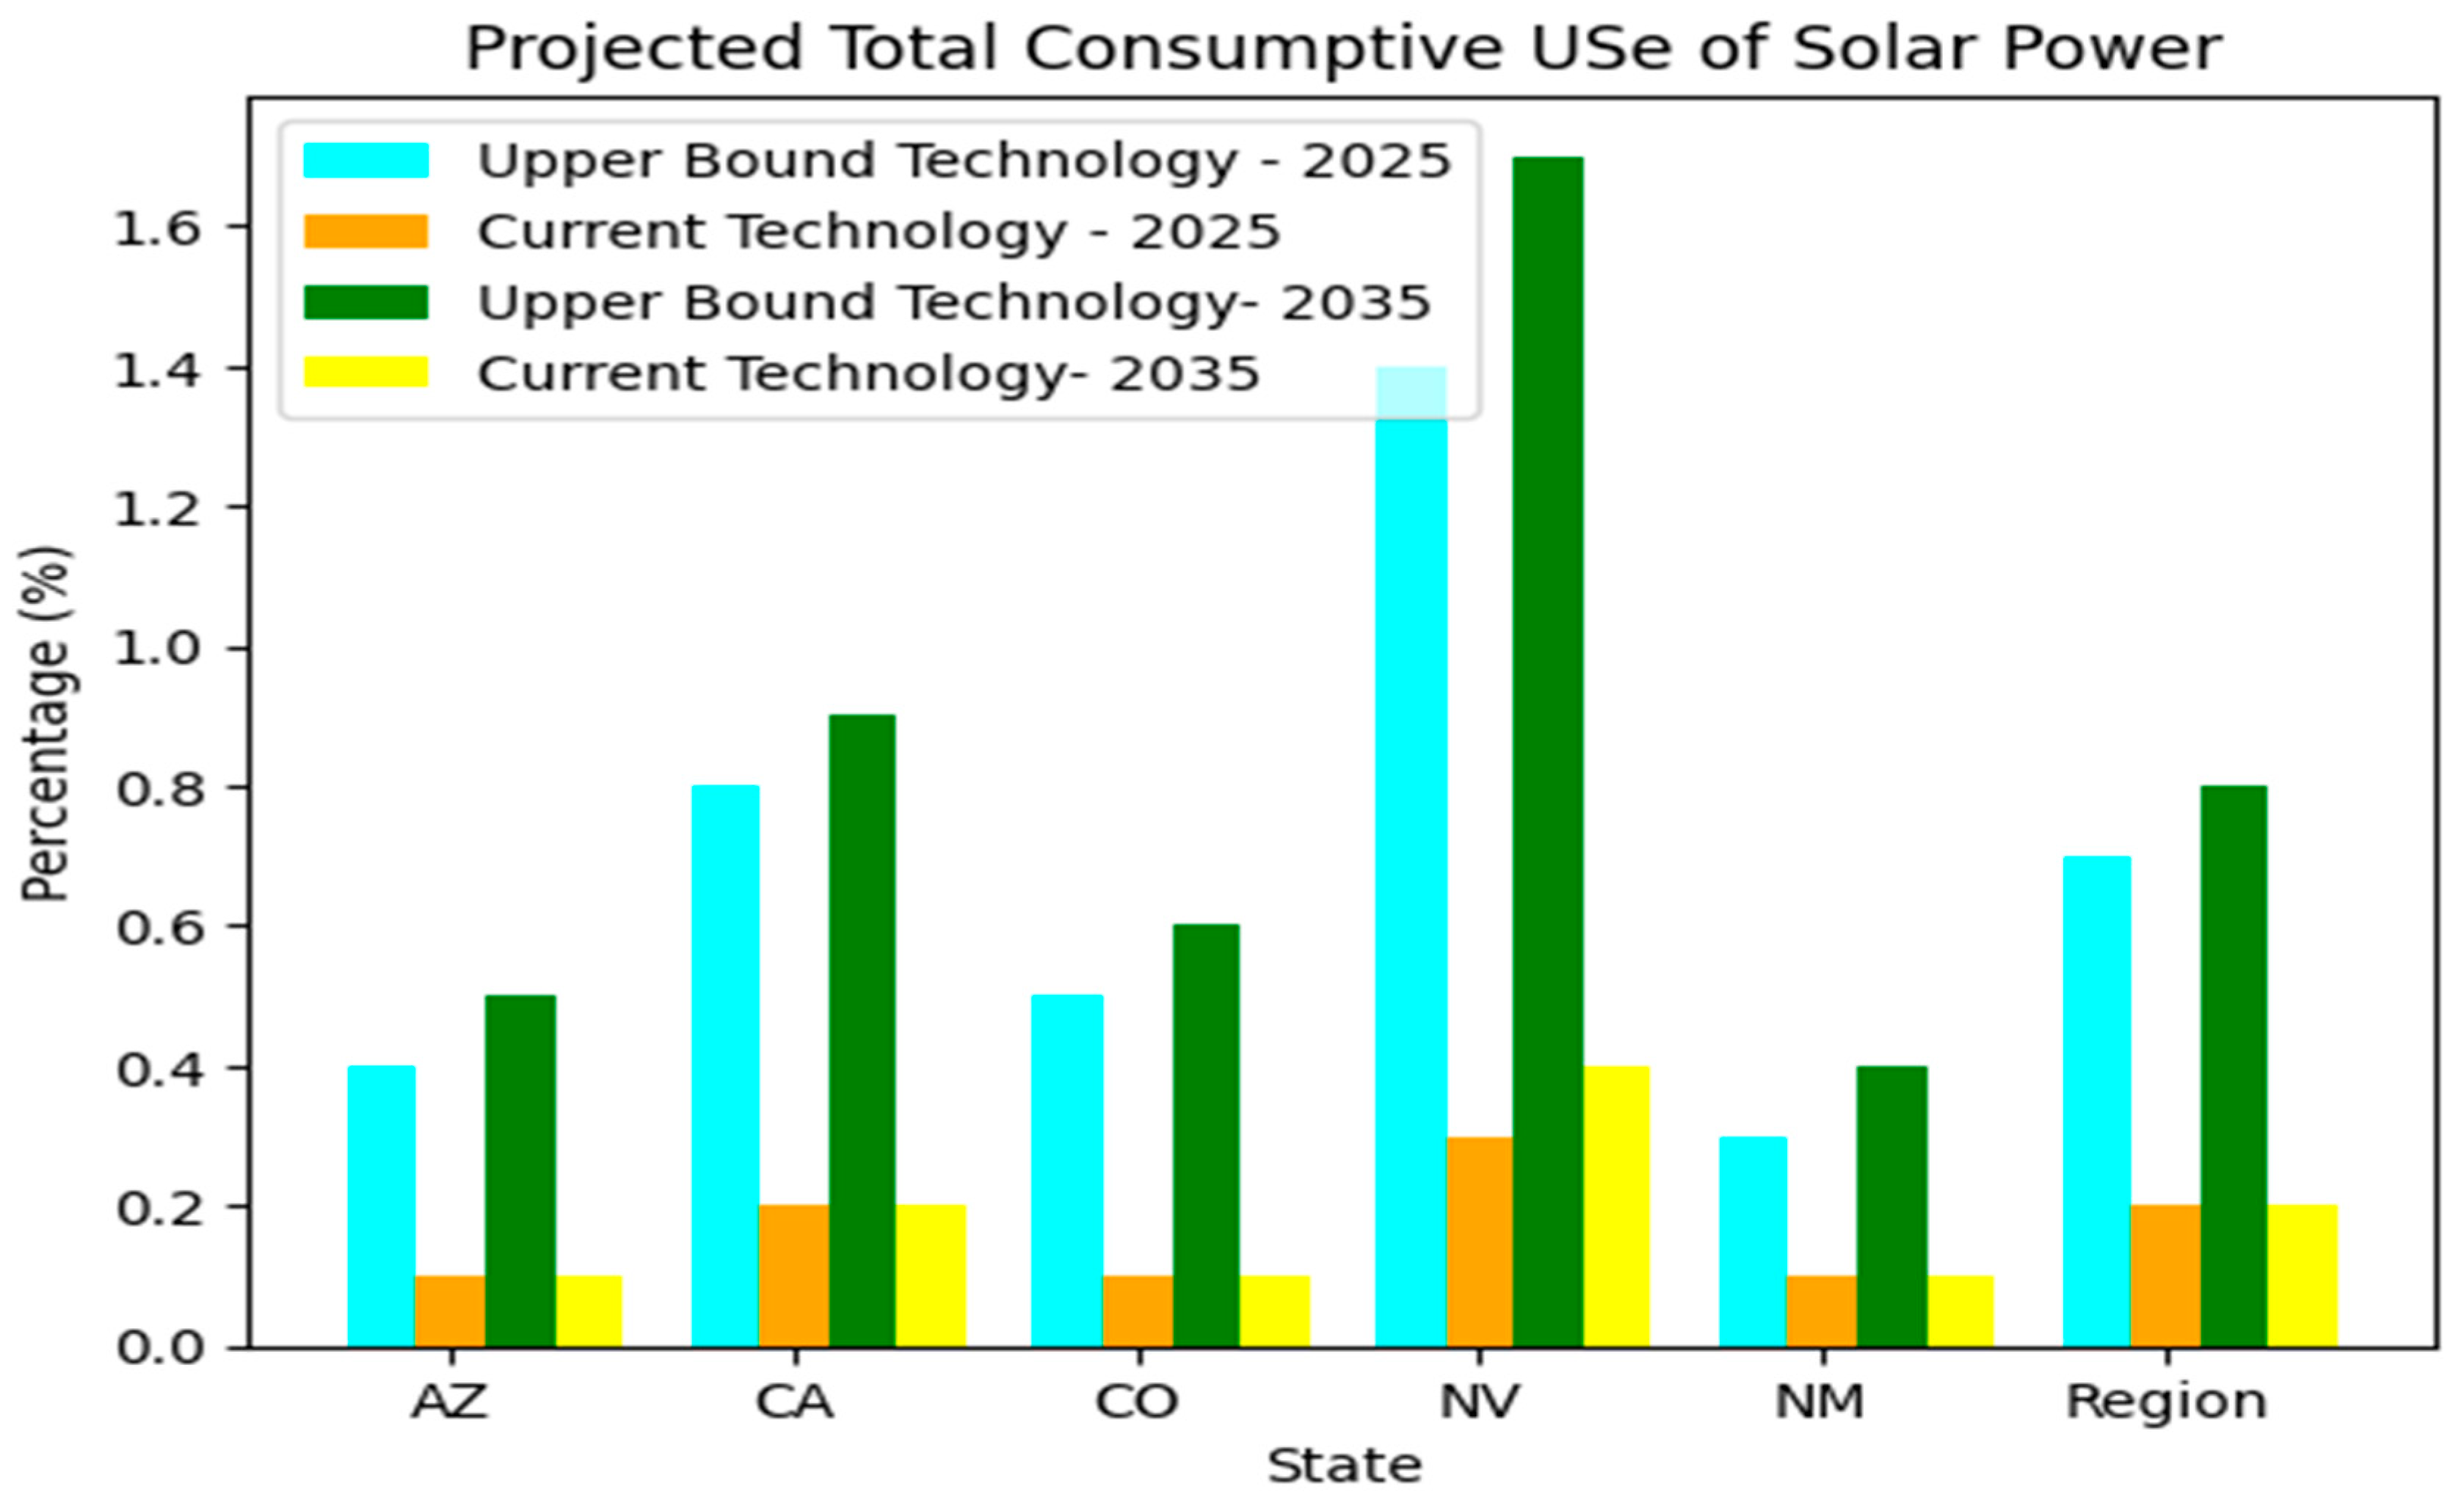
Using data in Frisvold & Marquez (2013), we made bar plots of the future water requirements of different solar technologies. Their results as plotted in
Figure 2,
Figure 3 and
Figure 4 provides a clearer explanation of how currently deployed technologies have a greater potential to survive in a water-scarce future than do upper-bound technologies. They made these estimates on the assumption that 100% of the renewable energy demands in five western states of the U.S. would be supplied by solar power. According to their study, the upper bound technology scenario assumes that 100% of renewable energy demand is supplied by water-intensive thermal technologies. Also, the current technology scenario assumes that water intensity in the future were compared to the average amount of water required by the present thermal technologies. Their results as plotted in
Figure 2 show that across the southern United States, renewable electricity demand will increase from 2025 to 2035 and by 2035, electricity grid demand is expected to exceed 100,000 GWh in United States. Again, their results show that California is expected to dominate the demand for renewable electricity in the region with more than 70000 GWh in 2025 and 2035. Their results show further that over the western states of the United States, generally, the upper-bound technologies are expected to have a higher water requirement than the current technologies. Pazeri et al. (2014) expected that CSP will have a 7% and 25% share in global electricity demand in 2030 and 20250 respectively across the globe. Also, the International Energy Agency (IEA) predicts that CSP will make up about 11% of global electricity production by 2050.
3.2. Hydropower and Climate Change
Water requirements for a unit of electricity produced by hydropower vary in different climates. Aside from the water consumed by hydropower plants, hydropower plants are known to cause food prints of water scarcity and environmental water stress. Seasonal pumped hydropower storage is used as drought control technology to store energy and water. Hunt et al. (2021) reported that the Indus basin in South Asia alone has the potential to provide a global long-term energy storage hub with seasonal pumped hydropower storage (SPHS) at 2 MWh and a water storage capacity of 0.015 US$/cubic meter. Hunt et al. (2020) found that one SPHS project can provide short-term energy storage at 600 US$/h and long-term storage at 30 US$/h. Also, the US Department of Energy reported in 2021 that the 43 SPHS plants in the United States account for 93% of all utility-scale energy storage in the country. The energy storage potential of SPHS is more competitive than natural gas. However, SPHS plants use natural gas as fuel, which is an indication of the higher emissions of carbon dioxide. The good news is that green hydrogen is in the pipeline, which will eliminate the use of natural gas as fuel. The international panel on climate change (IPCC) report mentioned with high confidence that global freshwater demand for hydropower is projected to rise and trigger fierce competition for freshwater for hydropower (Caretta et al., 2022).
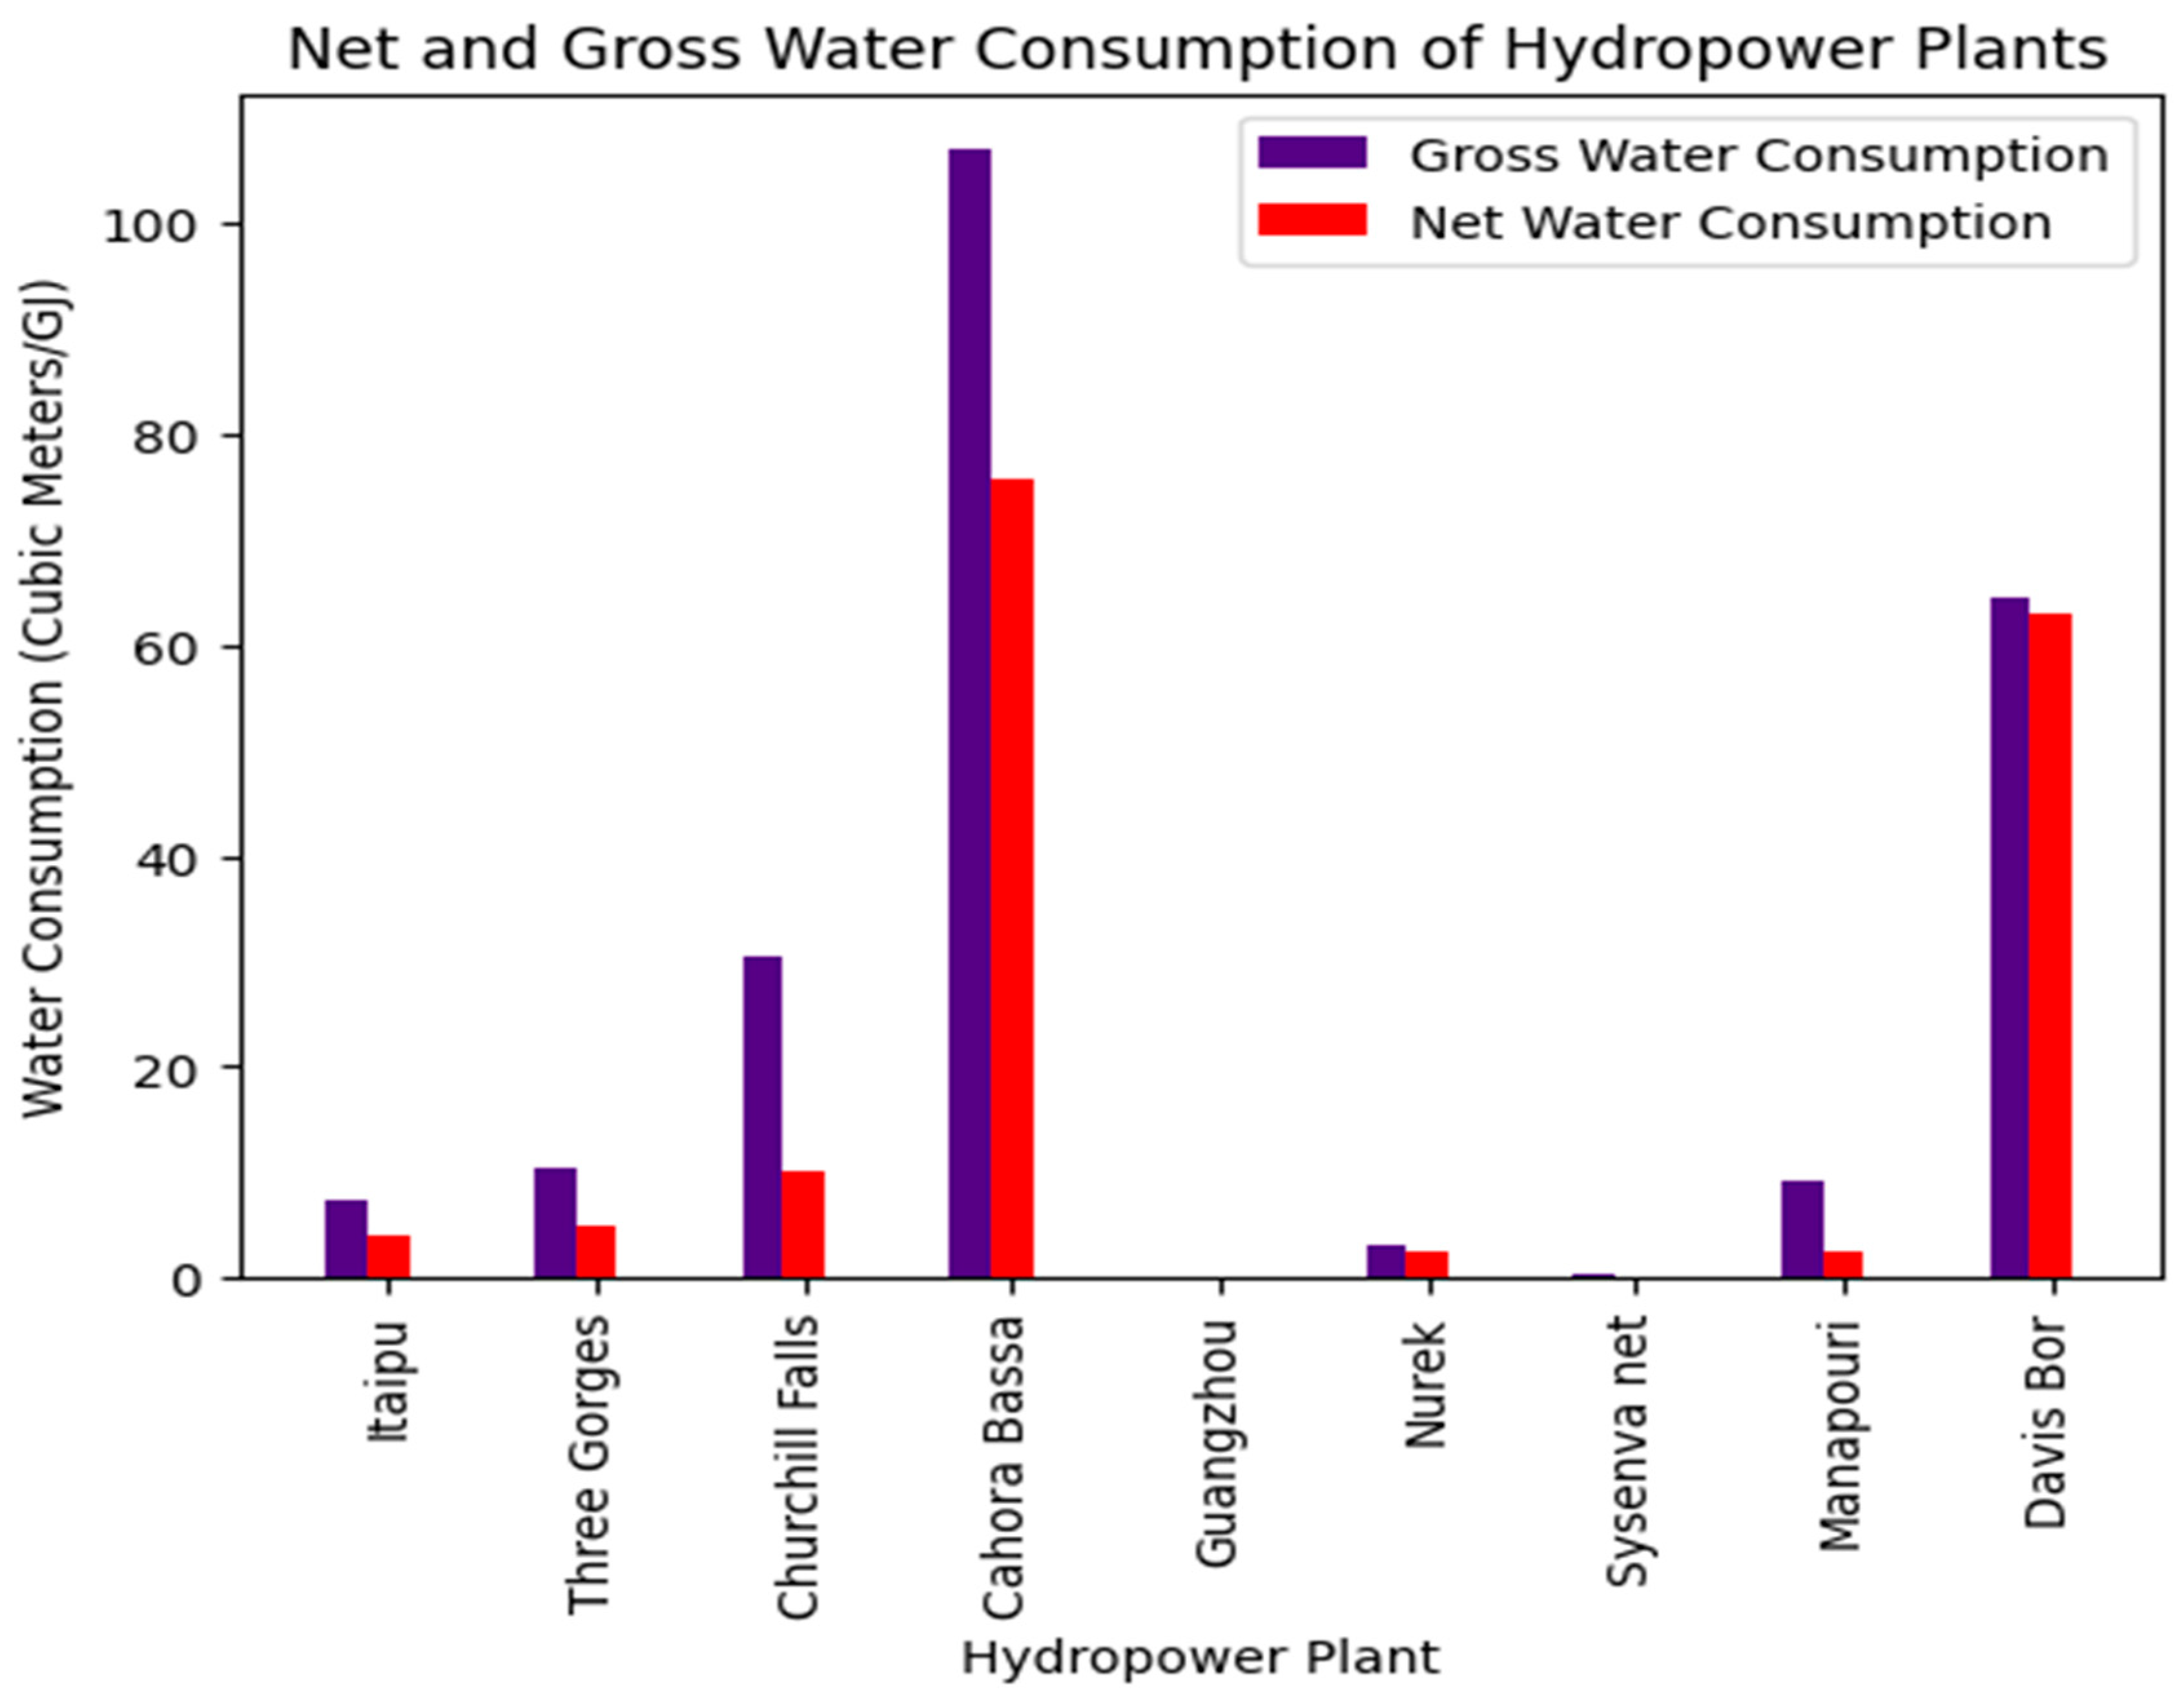
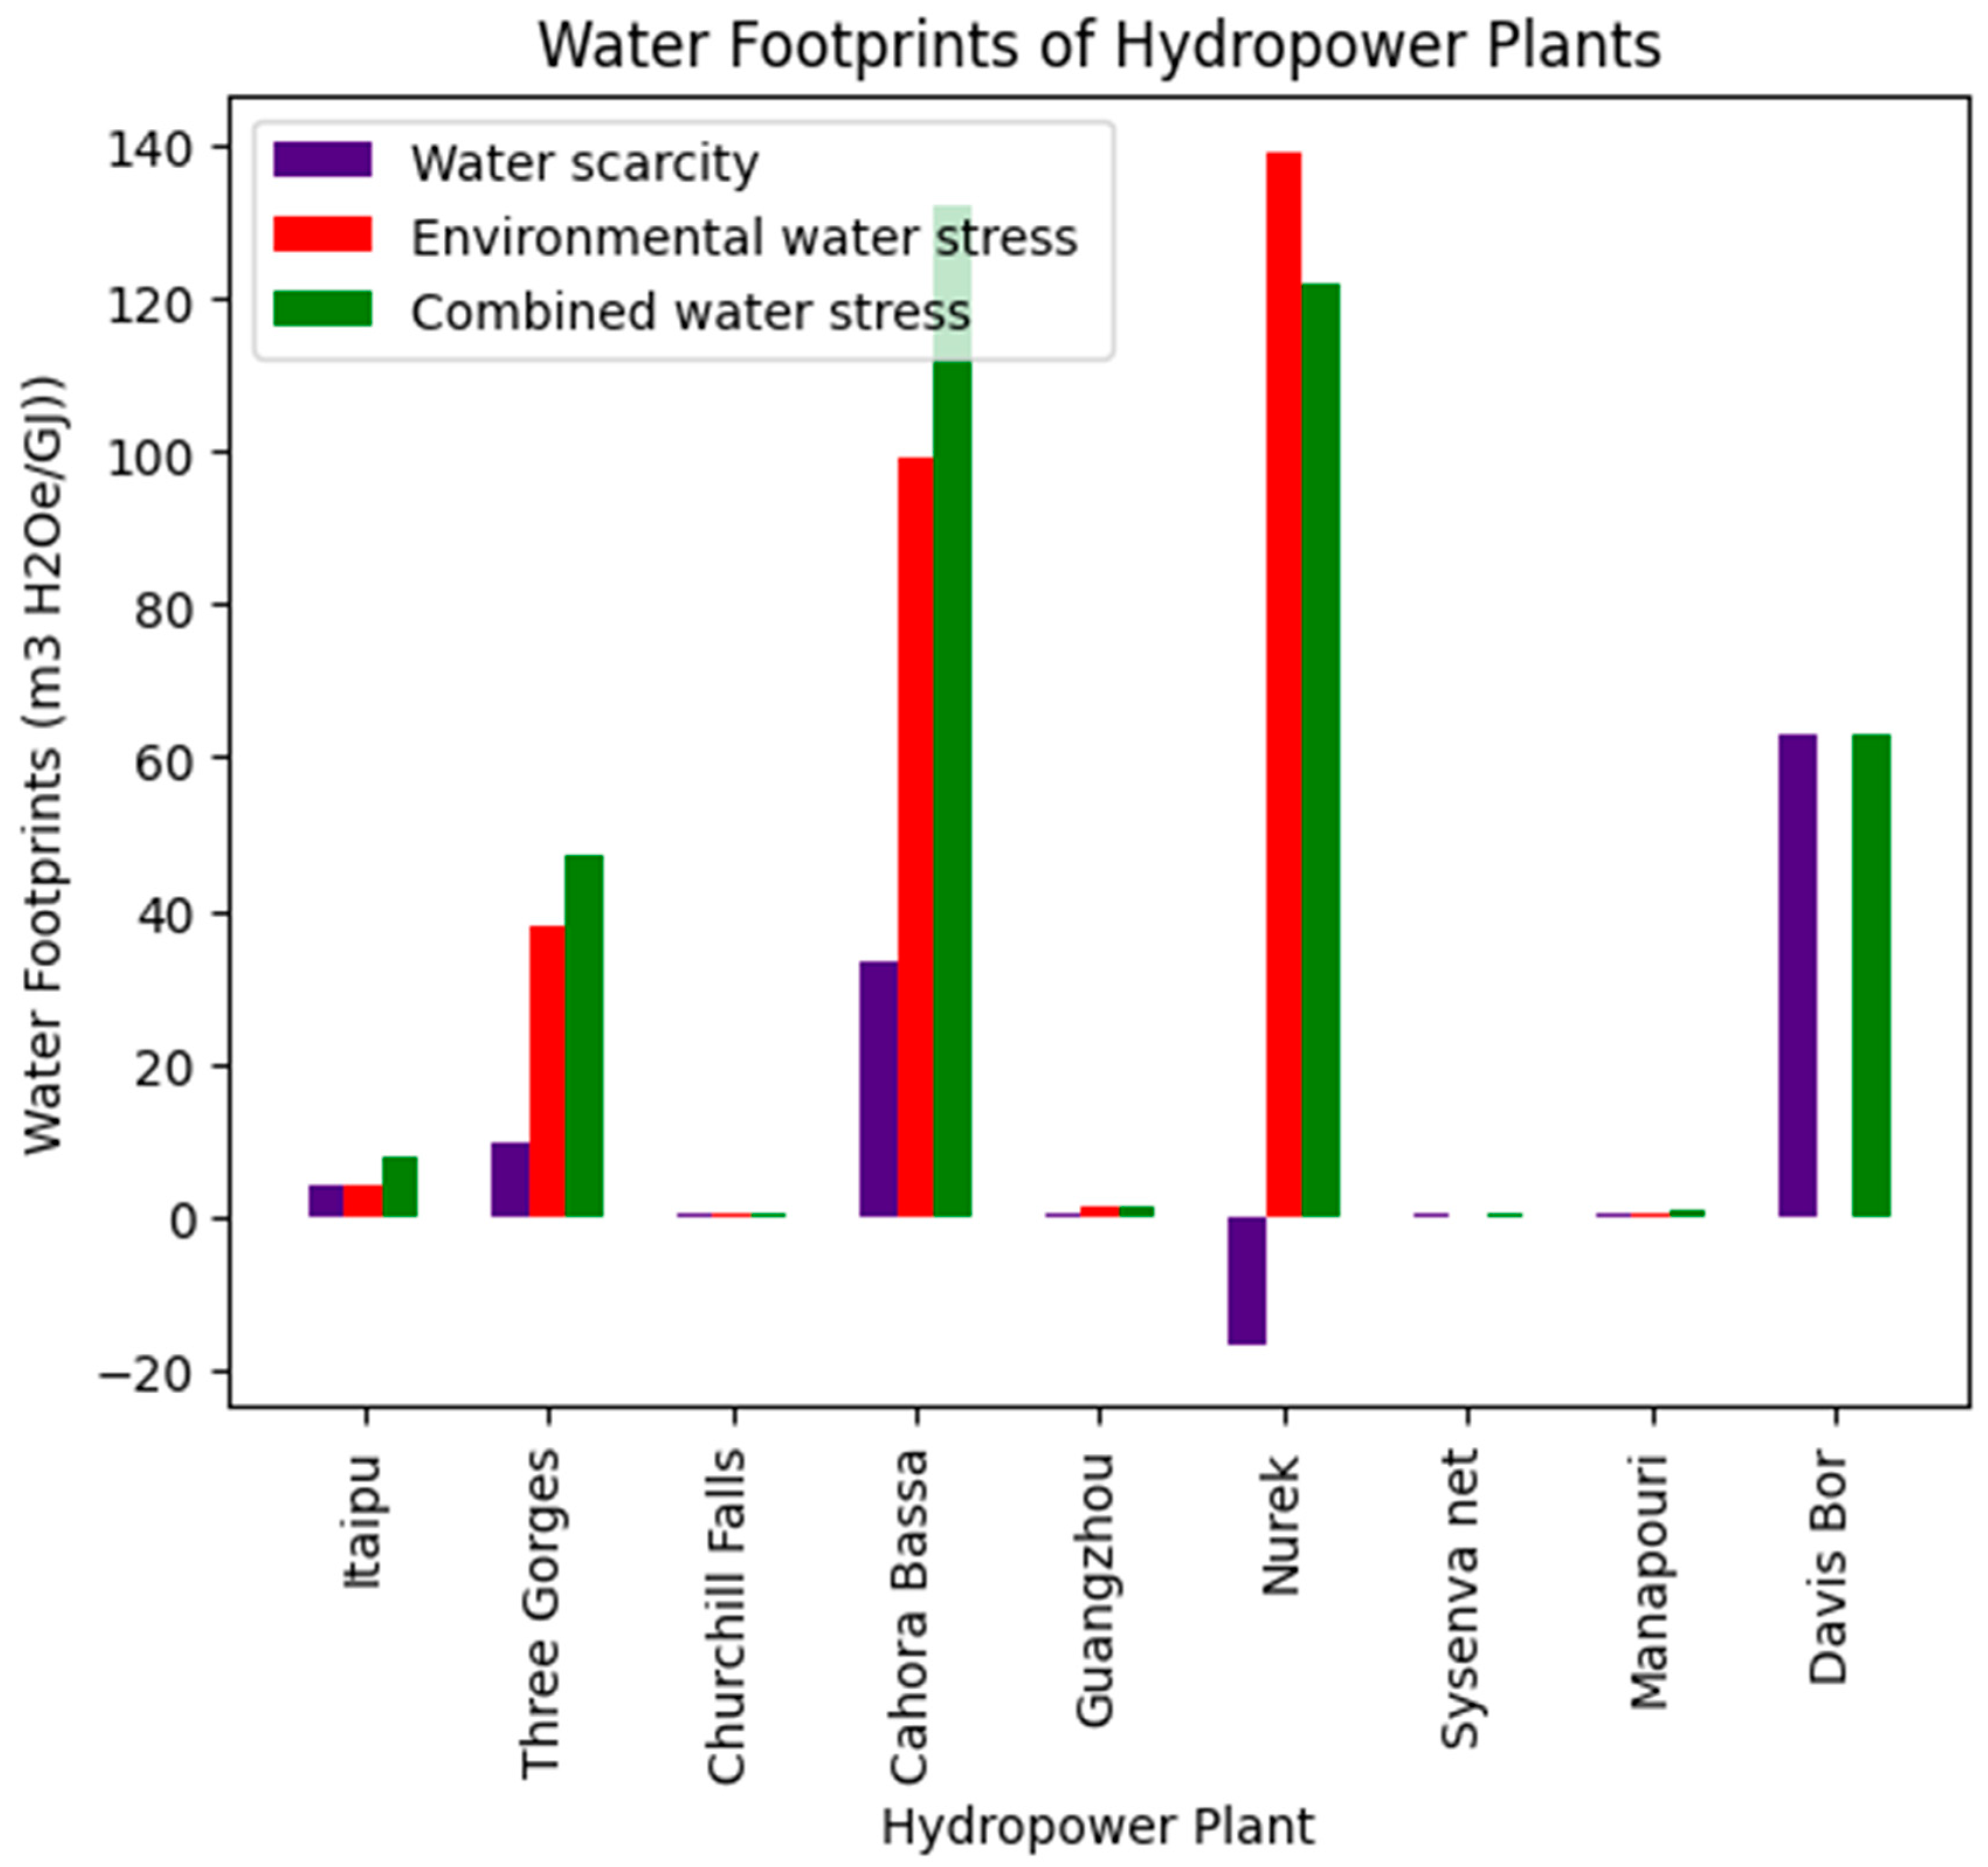
To illustrate the water footprints and requirements in leading hydropower dams across the globe, we plotted water requirements that was studied in Scherer & Pfister (2016). They showed that Cahora Bassa, Davis Bor, and Churchill Falls consume the most water per Gigajoule of electricity produced (
Figure 5 and
Figure 6). Their data from their results show that Cahora Bassa consumes gross water of 110 m³/GJ and net water of 75 m³/GJ, followed by Davis Bor with gross water of 67 m³/GJ and net water of 63 m³/GJ. Churchill Falls consumes a gross of 30 m³/GJ and a net of 10 m³/GJ. As a result, it is observed in
Figure 6 that Cahora Bassa leaves about 35 m³ H20e/GJ, 100 m³H20e/GJ, and 130 m³H20e/GJ in water scarcity, environmental water stress, and combined water stress footprints. Their data show that Neruk is the only hydropower plant that produces excess water of about 15 m³H20e/GJ. On the other hand, Neruk generates 140 m³H20e/GJ and 120 m³H20e/GJ of environmental water stress and combined water stress footprints, respectively. A review by Bakken et al., 2023 shows that many hydro dams across the world consumes to 5.4–234 m
3 MWh
−1 of gross water for their operations.
Using CIMP-5 estimation, Boulange et al. (2021) found a significant increase in the intensity of drought over a larger area of the globe between scenarios of transient and quasi-equilibrium climates than expected by natural climate variability. In addition to drought, the significant water footprints of Cahora Bassa in Mozambique and Itaipu in the Paraguay& Brazil Border (Scherer & Pfister (2016) guarantee the occurrence of the projected higher than 20% decrease in gross hydropower potential over southern South America, and Southern Africa as indicated in the IPCC report (Caretta et al., 2022). In Brazil, hydropower reserves have suffered a decrease in water levels due to an intense hydrological drought in the last decade (Cuartas, 2022). Recent droughts monitor updates from the U.S. Energy Information Administration (EIA) show that most of the power plants in drought are situated over the central and western parts of the United States (EIA, March 2023). If hydropower plants in the U.S. consume the equivalent of Davis Bor’s gross water of 67 m³/GJ and net water of 63 m³/GJ in the drought as shown in
Figure 3, it will be very difficult to operate hydropower plants in the future. Notwithstanding the projected droughts, Turner et al. (2017) predicted between 5% and 10% uncertainty in the direction of change in hydropower across the globe by the year 2080. Also, projections expect between a 2.4% and a 6.3% increase in global gross hydropower in 2080 (Vliet et al. 2016 (b)). The two 2080 projections highlight the potential of hydropower generation for clean energy production. The projected increase in the severity of drought and future water scarcity as reported in the above studies should be a deciding factor on which renewable technology to install in an which area.
Figure 5.
Net and Gross water consumption of leading global hydropower plants. Data Source: Scherer & Pfister (2016). Itaipu is in Paraguay& Brazil Border, Three Georges and Guangzhou are in China; Cahora Bassa is in Mozambique, Churchill Falls is in Canada; Nurek is in Tajikistan, Manapouri is in New Zeeland; Davis Bor is in the United States; and Sysenvatnet is in Norway.
Figure 6.
Water scarcity, environmental water stress, and the combined water stress footprints of leading hydropower plants in the world. Data Source: Scherer & Pfister (2016). Itaipu is in Paraguay& Brazil Border, Three Georges and Guangzhou are in China; Cahora Bassa is in Mozambique, Churchill Falls is in Canada; Nurek is in Tajikistan, Manapouri is in New Zeeland; Davis Bor is in the United States; and Sysenvatnet is in Norway.
3.3. Trends and Projections of Water Requirements
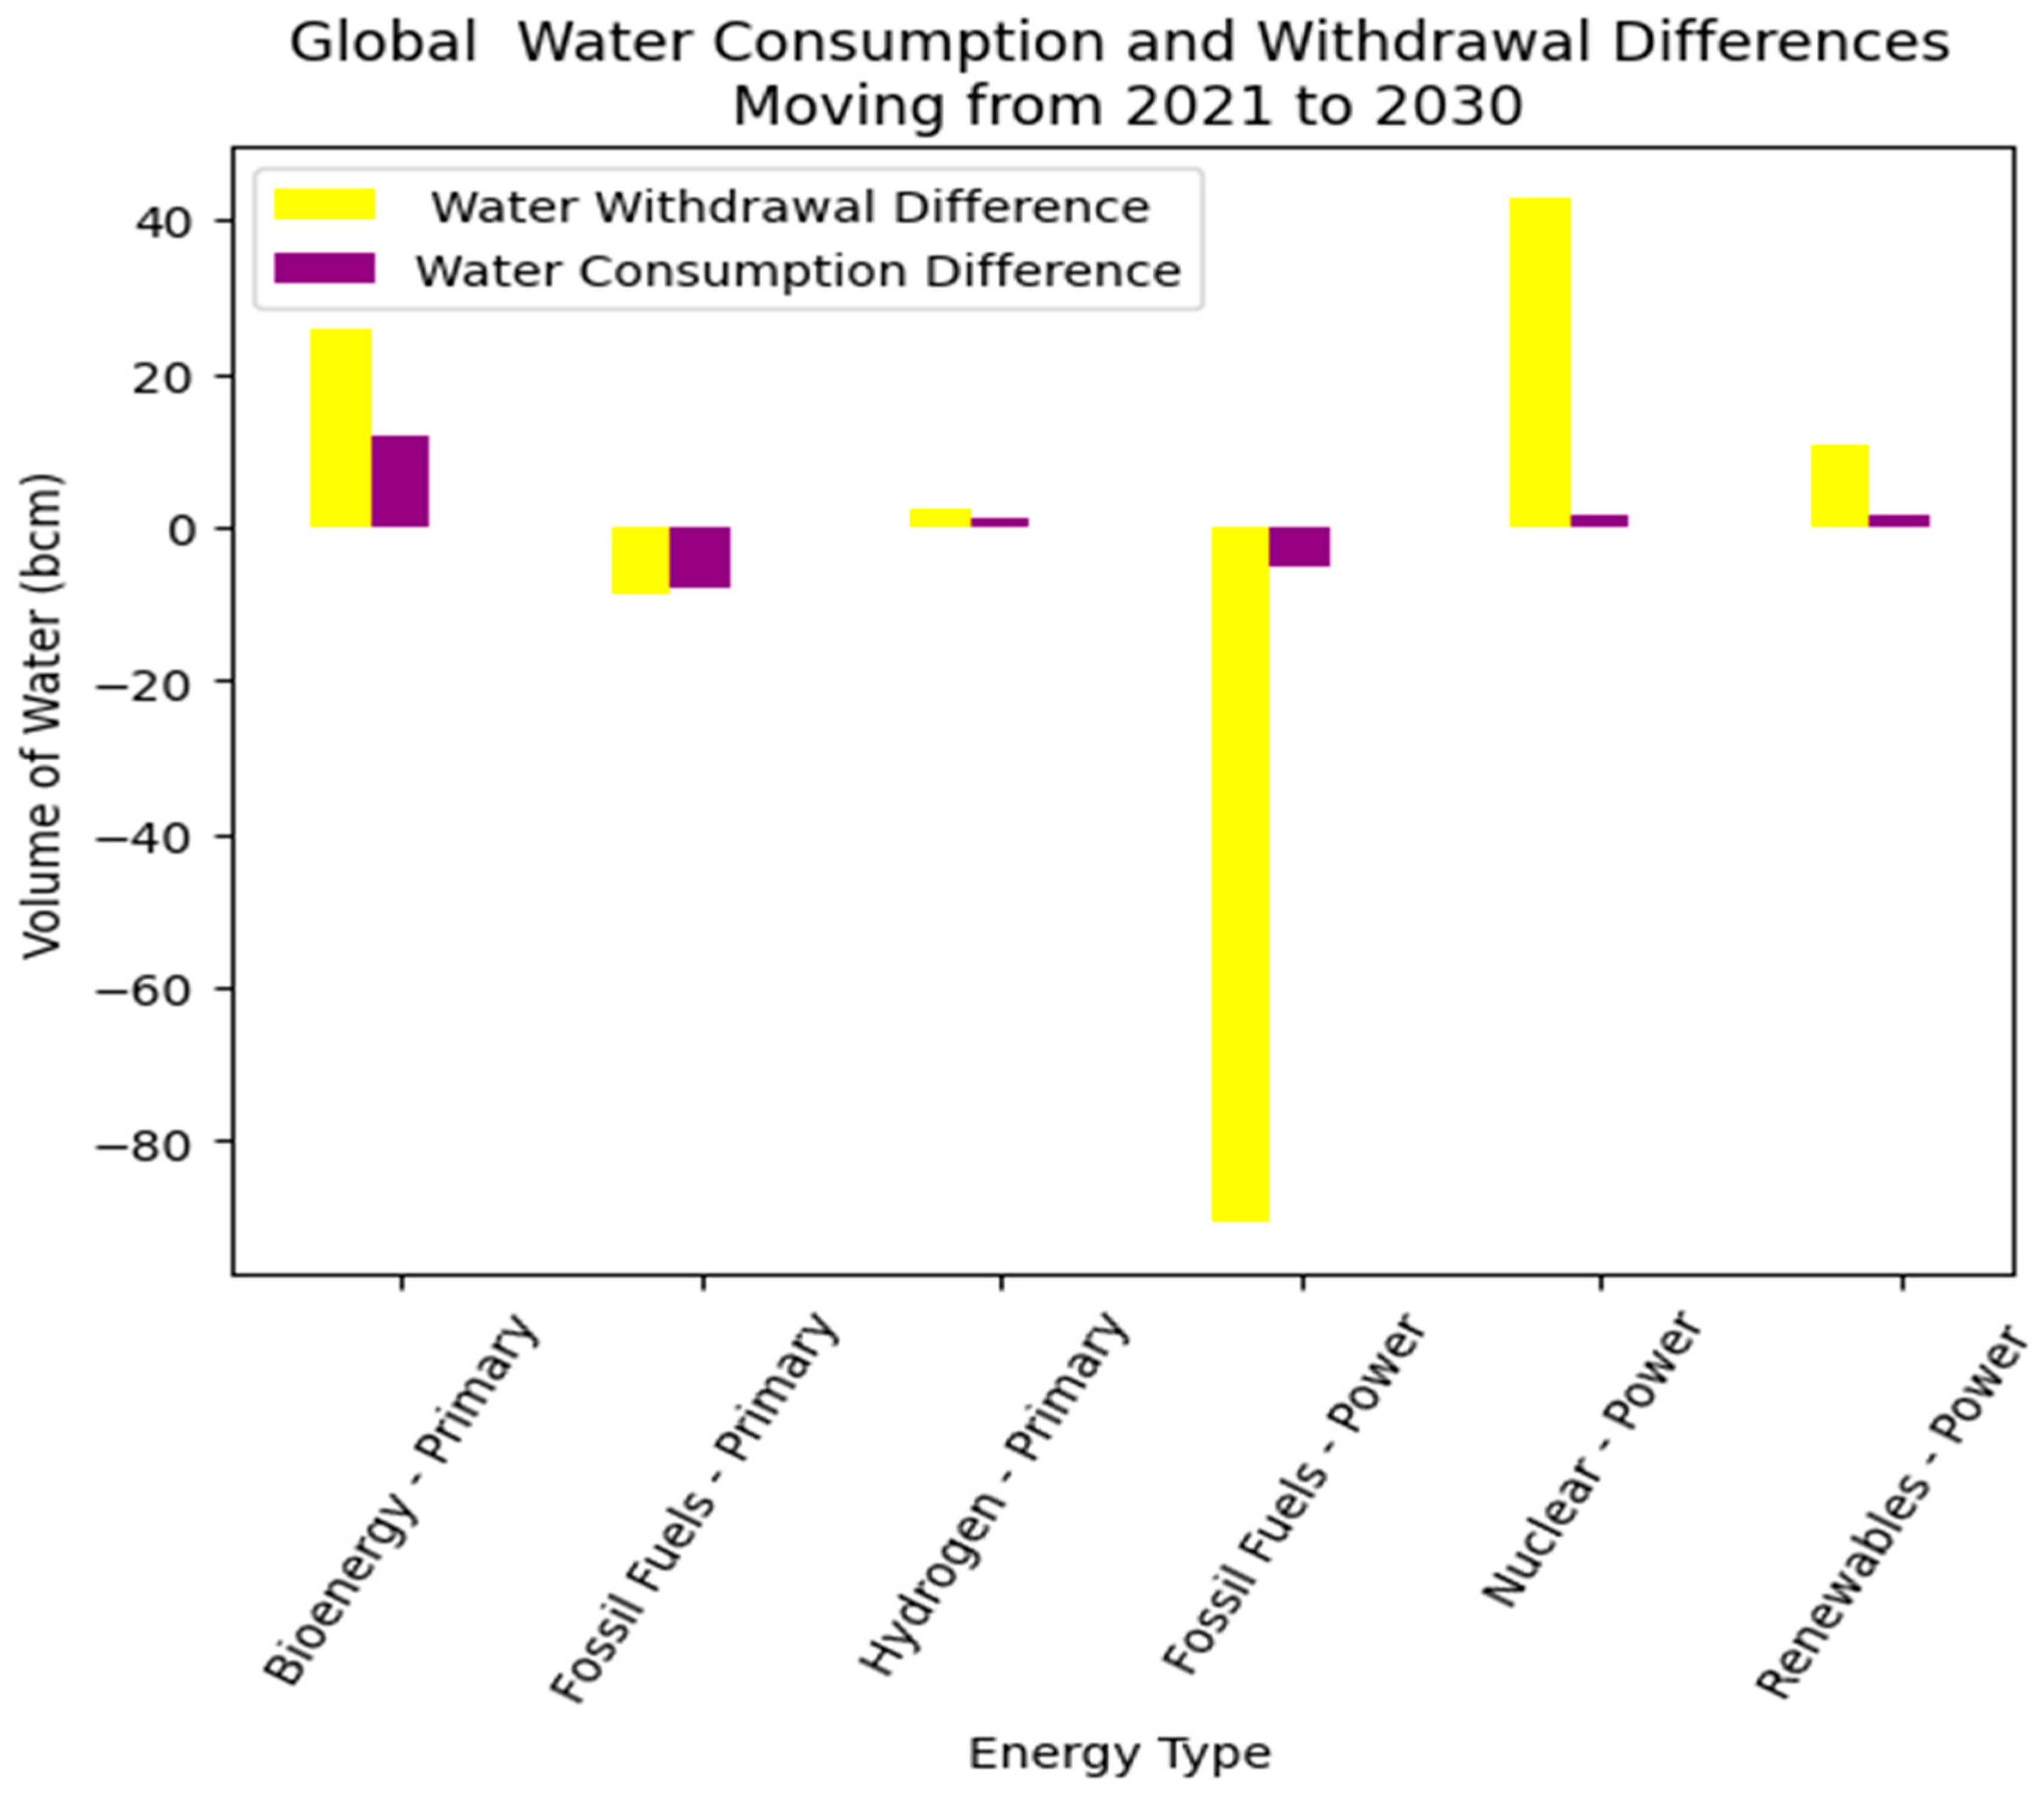
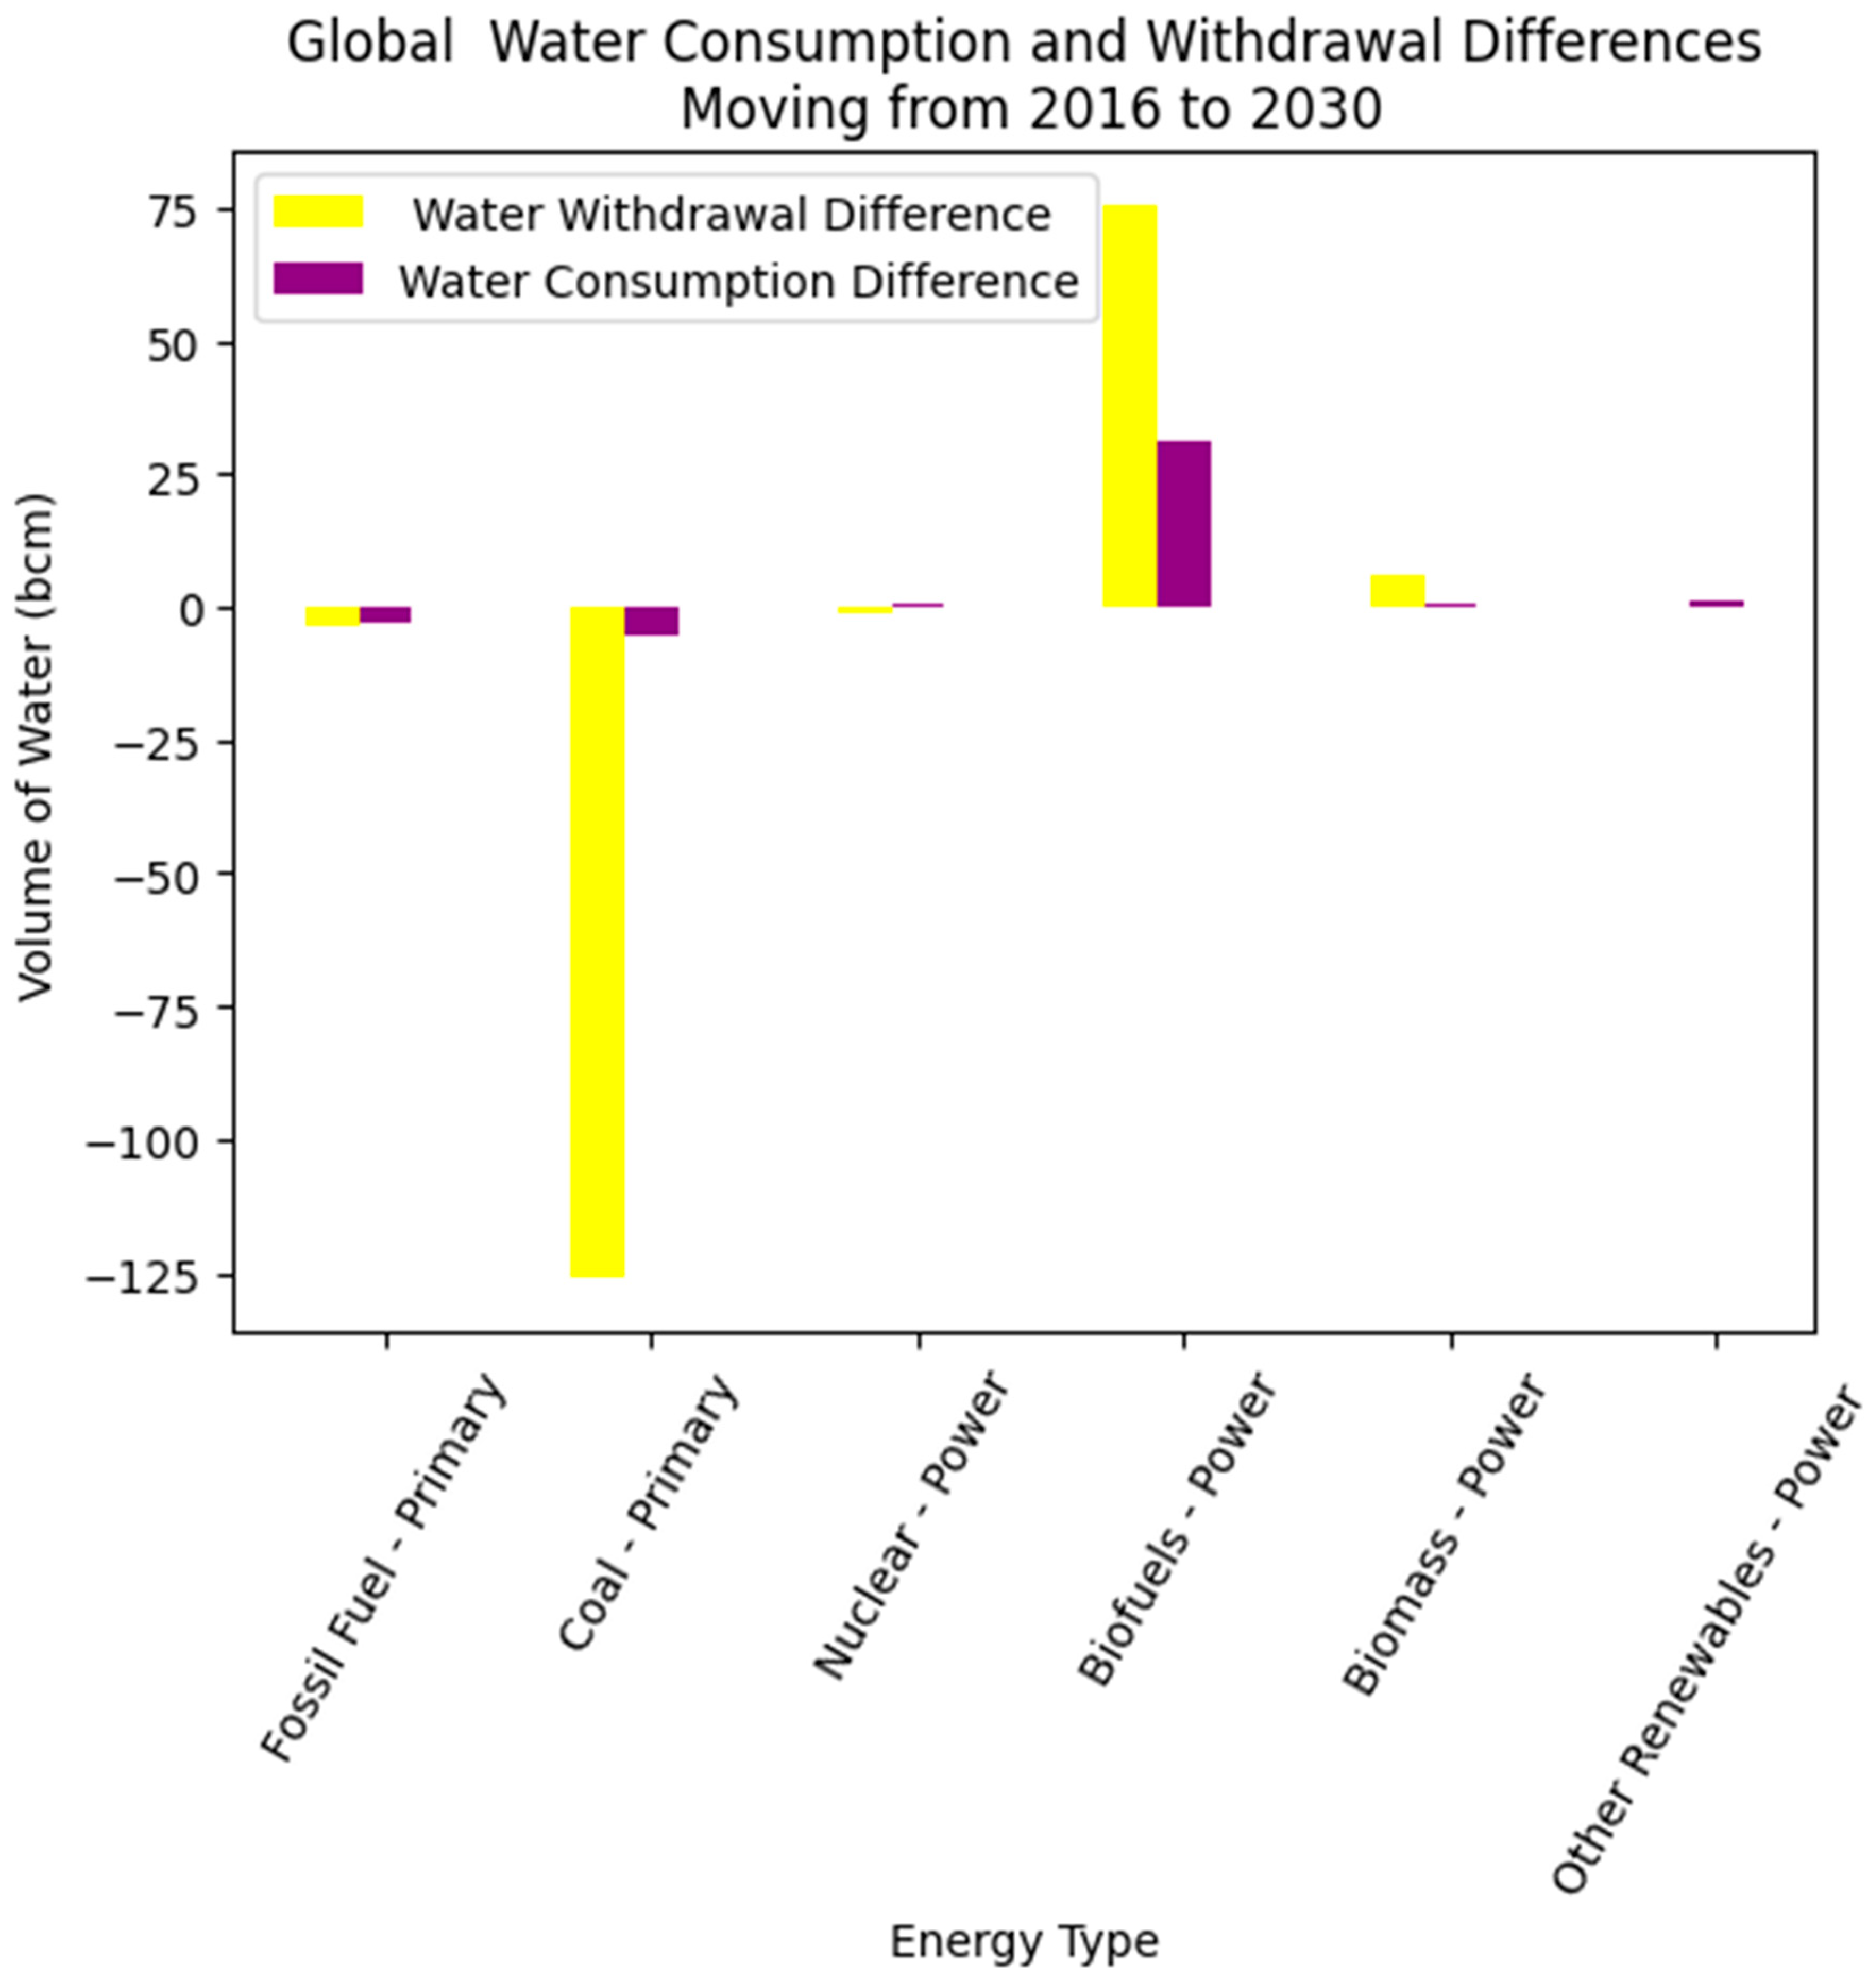
We present the results of our calculated differences between water needs for present and future scenarios. Renewables as a source of power for the net zero (2021-2030) scenario will require an additional 10 billion cubic meters (bcm) of water withdrawals and about 2 bcm of additional water consumption. In the sustainable development (2016-2030) scenario, additional water consumption will be close to zero in renewables. Therefore, in 2021 - 2030, when renewables will be the dominant source of energy, a sufficient amount of water will be saved for other purposes.
Bioenergy as a primary source of energy will require an additional 10 bcm and 25 bcm of water for consumption, and withdrawals respectively in the net zero scenarios. In the sustainable development scenario (2016-2030), water withdrawals of biofuels as power will need an additional 70 bcm. Biofuels as power have the highest water consumption of 30bcm in the 2016-2030 scenario. In the 2016-2030 scenario, biomass as power will require less than 5 bcm of additional water withdrawal. Hydrogen as primary energy will require less than 5 bcm of additional water withdrawal and consumption in the 2021-2030 scenario. Green hydrogen production using electrolysis can save 10 billion cubic meters of water that could have been consumed using fossil fuels (Beswick et al. (2021). Alinejad et al., 2024 mentioned that hydrogen can reduce greenhouse emissions by 1.47 MtCO2e/year. It is worth mentioning that Jiang et al., 2024 have proposed a Renewable Energy-Driven Hydrogen System that has the potential to achieve the net-zero objectives. Also, Biofuels are expected to produce 64 to 313 EJ in the year 2050 (Errara et al., 2023).
Fossil fuels as primary energy will require about 10bcm less water withdrawal or consumption in the net zero scenarios (2021 - 2030). On the other hand, fossil fuels as primary fuels will require about 2bcm of additional water in the sustainable development scenario (2016-2030). Therefore, the net zero scenarios will save more water in fossil fuels as a primary source than the sustainable development scenario. Water withdrawals by fossil fuels as power sources will decline by over 90 bcm in the net zero scenarios (
Figure 7). The significant decrease in water withdrawals of fossil fuels in the net zero scenarios is in the right direction to 97.7%, and 95.1% decrease in consumption and withdrawals of different energy types by 2050 as reported by Emeliano 2019. The decrease in water usage of fossil fuels is going to result from the use of water-free renewables like solar and wind. Welsby et al., 2021 reported that of 60% oil and methane, and 90% of coal should be remained unextracted by the year 2050 to prevent the 1 1.5 degree rise in temperatures. The argument gives more potential to renewables to save the climate against warming.
Nuclear power is estimated to have additional water withdrawals of more than 40bcm in both the 2016 - 2030, and 2021 – 2030 scenarios. Withdrawals by coal as primary energy are expected to reduce by 125bcm from 2016 to 2030 (
Figure 8). In contrast to the huge water requirements of nuclear power, Kharecha & Hansen, 2013 argues that Nuclear power contributes to climate change mitigation and have prevented 1.84 million air pollution related-deaths making it more advantageous. The same way Besmann at al., 2010 argues that nuclear power caanot have dramatic short-term carbon emissions.
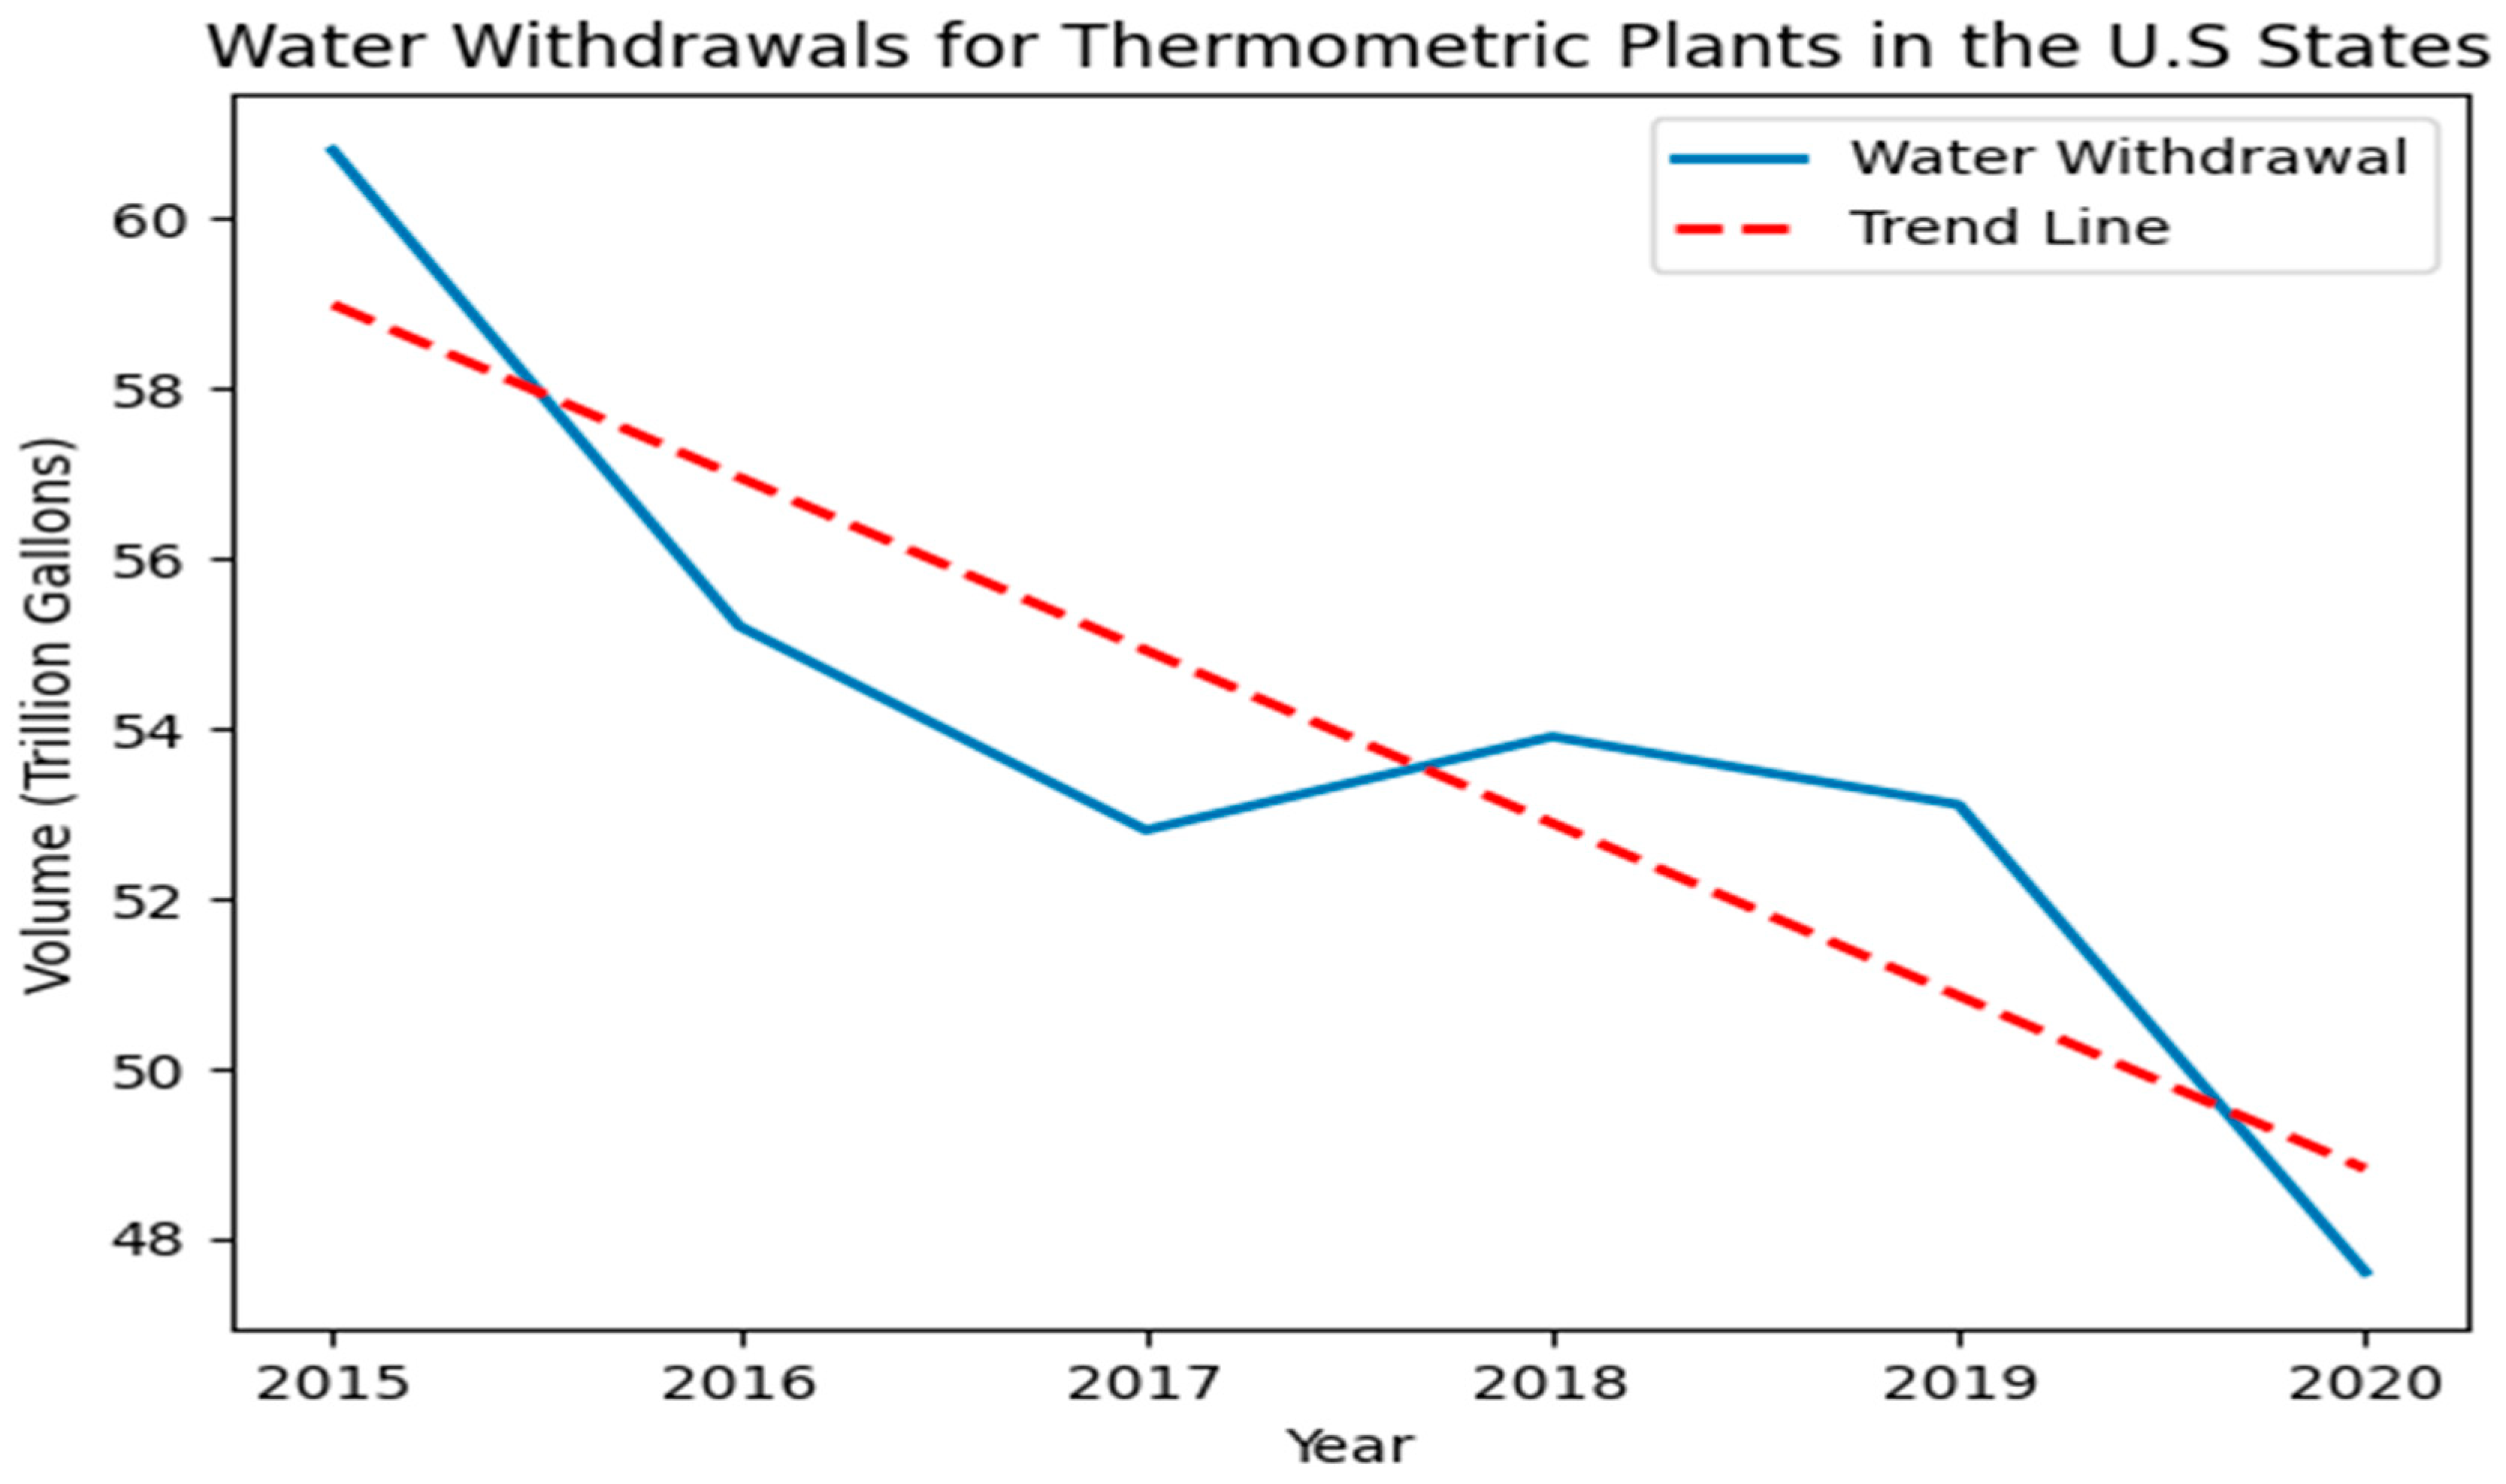
Our analysis-based data from US Energy Information Administration on Water withdrawal by thermometric plants in the United States shows a decreasing trend from 2015 to 2020 (
Figure 9). Water withdrawals by thermometric plants decreased from more than 60 trillion gallons in 2015 to less than 48 trillion gallons in 2020. The massive use of non-water-intensive renewables could account for the decreasing trend. In the sustainable development scenario, where renewables will have no additional water, withdrawals of thermometric plants stand a great chance to continue the decreasing trend.
4. Conclusion
We assessed current and projected water withdrawals and consumption of different energy types with the goal of streamlining the comprehensive role of water in the transition from fossil fuels to renewables. We realized that projections of water scarcity have the potential to affect the amount of water needed to keep different energy types in operation. Our analysis of previous studies shows that solar water can consume as little as 0.02 m³/MWh to generate one megawatt of electricity, which makes it the best choice (Food & Water Watch, July 2022). However, other solar technologies like the CSP require large amounts of water, and these water requirements are expected to prove a competition in the future where water will be scarce (Frisvold & Marquez, 2013). Our analysis based on previous studies showed that water stress footprints of hydropower of up to 140 m³ H20e/GJ in the era of high drought intensity possess potential treat to hydropower generation in southern America and southern Africa (Caretta et al., 2022; Scherer & Pfister, 2016). We analyzed water needs in our quest to transition from fossil fuels to renewables based on sustainable development (2016-2030) and net zero scenarios (2021–2030). Our analysis based on data from the International Energy Agency showed that water needs for fossil fuels as a power source will decline by over 90 bcm and by 10 bcm as primary energy in the net zero scenarios. Again, coal as a primary energy source will reduce water withdrawals by 125 bcm. Hydrogen as primary energy will require less than 5 bcm of additional water withdrawal and consumption in the 2021–2030 scenario. The operations of renewables as a source of power for the 2021-2030 scenario requires an additional 10 bcm of water withdrawals and 2 bcm of water consumption. Water required to operate biofuels as power in terms of withdrawals will need an additional 70 bcm as to water consumption of 30bcm in the 2016-2030 scenario. The dominant use of solar and wind is the potential cause of the significant expected decrease in water requirements of fossil fuels and coal in both sustainable development and net zero scenarios. The study implies the need to focus much on solar, wind, or hydrogen that have less water requirements for their operations to save enough water in the future where energy will be competing with humans for water.
Funding
The study received no external funding.
Data Availability Statement
All derived data sets are available on request from the corresponding author. Data used in this study were extracted from Scherer & Pfister, 2016; International Energy Agency; Frisvold & Marquez, 2013; Food & Water Watch, July 2022; US Energy.
Acknowledgment
I acknowledge the extraction of data from Scherer & Pfister, 2016; International Energy Agency; Frisvold & Marquez, 2013; Food & Water Watch, July 2022; US Energy Information Administration.
Disclosure statement
No potential conflict of interest was reported by the authors.
Abbreviations
| IEA |
International Energy Agency |
| EIA |
US Energy Information Administration |
| PV |
Photovoltaic |
| CSP |
Concentrated Solar Power |
| SPHS |
Seasonal Pumped Hydropower Storage |
| IPCC |
The international panel on climate change |
| bcm |
Billion Cubic Meters |
References
- Alinejad, A., Molazem, M. H., Sharma, A., & Dehghanpour, H. (2024). Predicting hydrogen storage requirements through the natural gas market for a low-emission future. International Journal of Hydrogen Energy, 52, 787-803. [CrossRef]
- Bakken, T. H., Killingtveit, Å., & Alfredsen, K. (2017). The water footprint of hydropower production—state of the art and methodological challenges. Global Challenges, 1(5), 1600018. [CrossRef]
- Bellini, E. (2019). 100% renewables mean 95% less water consumption for conventional power generation. PV Magazine. https://www.pv-magazine.com/2019/12/12/100-renewables-means-95-less-water-consumption-for-conventional-power-generation/.
- Besmann, T. M. (2010). Projections of US GHG reductions from nuclear power new capacity based on historic levels of investment. Energy Policy, 38(5), 2431-2437. [CrossRef]
- Beswick, R. R., Oliveira, A. M., & Yan, Y. (2021). Does the green hydrogen economy have a water problem?. ACS Energy Letters, 6(9), 3167-3169. [CrossRef]
- Boretti, A., Rosa, L. Reassessing the projections of the World Water Development Report. npj Clean Water 2, 15 (2019). [CrossRef]
- Boulange, J., Hanasaki, N., Satoh, Y., Yokohata, T., Shiogama, H., Burek, P., ... & Wanders, N. (2021). Validity of estimating flood and drought characteristics under equilibrium climates from transient simulations. Environmental Research Letters, 16(10), 104028. [CrossRef]
- Brockway, Paul & Owen, Anne & Brand Correa, Lina Isabel & Hardt, Lukas. (2019). Estimation of global final-stage energy-return-on-investment for fossil fuels with comparison to renewable energy sources. Nature Energy. 4. 612. [CrossRef]
- Bucknall J. (2013). Cutting Water Consumption in Concentrated Solar Power Plants. World Bank Blog. https://blogs.worldbank.org/water/cutting-water-consumption-concentrated-solar-power-plants-0.
- Bull, S. R. (2001). Renewable energy today and tomorrow. Proceedings of the IEEE, 89(8), 1216-1226. [CrossRef]
- Byakatonda, J., Parida, B. P., Moalafhi, D. B., & Kenabatho, P. K. (2018). Analysis of long term drought severity characteristics and trends across semiarid Botswana using two drought indices. Atmospheric research, 213, 492-508. [CrossRef]
- Caretta, A. M. M. A., Arfanuzzaman, R. B. M., Morgan, S. M. R., & Kumar, M. (2022). Water. In: Climate Change 2022: Impacts, Adaptation, and Vulnerability. Contribution of Working Group II to the Sixth Assessment Report of the Intergovernmental Panel on Climate Change.
- Cuartas, L. A., Cunha, A. P. M. D. A., Alves, J. A., Parra, L. M. P., Deusdará-Leal, K., Costa, L. C. O., ... & Marengo, J. A. (2022). Recent hydrological droughts in Brazil and their impact on hydropower generation. Water, 14(4), 601. [CrossRef]
- Dai, J., Wu, S., Han, G., Weinberg, J., Xie, X., Wu, X., ... & Yang, Q. (2018). Water-energy nexus: A review of methods and tools for macro-assessment. Applied energy, 210, 393-408. [CrossRef]
- Díaz, Hugo & Guedes Soares, Carlos. (2020). Review of the status, technology, and future trends of offshore wind farms. Ocean Engineering. 209. [CrossRef]
- Dincer, I. (2000). Renewable energy and sustainable development: a crucial review. Renewable and sustainable energy reviews, 4(2), 157-175. [CrossRef]
- Ding, T., Liang, L., Zhou, K., Yang, M., & Wei, Y. (2020). Water-energy nexus: The origin, development and prospect. Ecological Modelling, 419, 108943. [CrossRef]
- Edenhofer, O., Hirth, L., Knopf, B., Pahle, M., Schlömer, S., Schmid, E., & Ueckerdt, F. (2013). On the economics of renewable energy sources. Energy Economics, 40, S12-S23. [CrossRef]
- Errera, M. R., Dias, T. D. C., Maya, D. M. Y., & Lora, E. E. S. (2023). Global bioenergy potentials projections for 2050. Biomass and Bioenergy, 170, 106721. [CrossRef]
- European Commission. (2012). Energy Roadmap 2050. https://www.globalccsinstitute.com/archive/hub/publications/138033/energy-roadmap-2050.pdf.
- European Wind Energy Association. (2014, June). Saving Water with Wind Energy. https://www.ewea.org/fileadmin/files/library/publications/reports/Saving_water_with_wind_energy.pdf.
- Fact Sheet. (2022, July). Thirsty Fossil Fuels: Potentials for huge water savings by switching to renewables. Food and Water Watch. https://www.foodandwaterwatch.org/wp-content/uploads/2022/08/2207_FSW_WaterUseinRenewables-WEBFINAL.pdf.
- Frisvold, George & Marquez, Tatiana. (2013). Water Requirements for Large-Scale Solar Energy Projects in the West. Journal of Contemporary Water Research & Education. 151. [CrossRef]
- Goyal, N., Aggarwal, A., & Kumar, A. (2022). Concentrated solar power plants: A critical review of regional dynamics and operational parameters. Energy Research & Social Science, 83, 102331. [CrossRef]
- Hamiche, A. M., Stambouli, A. B., & Flazi, S. (2016). A review of the water-energy nexus. Renewable and Sustainable Energy Reviews, 65, 319-331. [CrossRef]
- Harjanne, A., & Korhonen, J. M. (2019). Abandoning the concept of renewable energy. Energy policy, 127, 330-340. [CrossRef]
- Heffron, R. J., & McCauley, D. (2017). The concept of energy justice across the disciplines. Energy Policy, 105, 658-667. [CrossRef]
- Hunt, J. D., Falchetta, G., Parkinson, S., Vinca, A., Zakeri, B., Byers, E., ... & Wada, Y. (2021). Hydropower and seasonal pumped hydropower storage in the Indus basin: pros and cons. Journal of Energy Storage, 41, 102916. [CrossRef]
- Hunt, J. D., Nascimento, A., ten Caten, C. S., Tomé, F. M. C., Schneider, P. S., Thomazoni, A. L. R., ... & Senne, R. (2022). Energy crisis in Brazil: Impact of hydropower reservoir level on the river flow. Energy, 239, 121927. [CrossRef]
- Hunt, J.D., Byers, E., Wada, Y. et al. Global resource potential of seasonal pumped hydropower storage for energy and water storage. Nat Commun 11, 947 (2020). [CrossRef]
- IEA, Global water consumption in the energy sector by fuel and power generation type in the Net Zero Scenario, 2021 and 2030, IEA, Paris https://www.iea.org/data-and-statistics/charts/global-water-consumption-in-the-energy-sector-by-fuel-and-power-generation-type-in-the-net-zero-scenario-2021-and-2030, IEA. Licence: CC BY 4.0.
- IEA, Global water consumption in the energy sector by fuel type in the Sustainable Development Scenario, 2016-2030, IEA, Paris https://www.iea.org/data-and-statistics/charts/global-water-consumption-in-the-energy-sector-by-fuel-type-in-the-sustainable-development-scenario-2016-2030, IEA. Licence: CC BY 4.0.
- International Renewable Energy Agency. (2018). Roadmap to 2050. Global Energy Transformation.https://www.irena.org//media/Files/IRENA/Agency/Publication/2018/Apr/IRENA_Report_GET_2018.pdf.
- Jiang, Y., Ren, Z., Lu, C., Li, H., & Yang, Z. (2024). A region-based low-carbon operation analysis method for integrated electricity-hydrogen-gas systems. Applied Energy, 355, 122230. [CrossRef]
- Kharecha, P. A., & Hansen, J. E. (2013). Prevented mortality and greenhouse gas emissions from historical and projected nuclear power. Environmental science & technology, 47(9), 4889-4895. [CrossRef]
- Lee, U., Chou, J., Xu, H., Carlson, D., Venkatesh, A., Shuster, E., ... & Wang, M. (2020). Regional and seasonal water stress analysis of United States thermoelectricity. Journal of Cleaner Production, 270, 122234. [CrossRef]
- Lhotka, O., Trnka, M., Kyselý, J., Markonis, Y., Balek, J., & Možný, M. (2020). Atmospheric circulation as a factor contributing to increasing drought severity in central Europe. Journal of Geophysical Research: Atmospheres, 125(18), e2019JD032269. [CrossRef]
- Li, X., Feng, K., Siu, Y. L., & Hubacek, K. (2012). Energy-water nexus of wind power in China: the balancing act between CO2 emissions and water consumption. Energy policy, 45, 440-448. [CrossRef]
- Lovins, A. B. (2022). US nuclear power: Status, prospects, and climate implications. The Electricity Journal, 35(4), 107122. [CrossRef]
- M.T.H. van Vliet, L.P.H. van Beek, S. Eisner, M. Flörke, Y. Wada, M.F.P. Bierkens,.
- Macknick, J., & Cohen, S. (2015). Water impacts of high solar PV electricity penetration (No. NREL/TP-6A20-63011). National Renewable Energy Lab.(NREL), Golden, CO (United States).
- Macknick, J., Newmark, R., Heath, G., & Hallett, K. C. (2011). Review of operational water consumption and withdrawal factors for electricity generating technologies.
- Modarres, R., Sarhadi, A., & Burn, D. H. (2016). Changes of extreme drought and flood events in Iran. Global and Planetary Change, 144, 67-81. [CrossRef]
- Moriarty, P., & Honnery, D. (2012). What is the global potential for renewable energy?. Renewable and Sustainable Energy Reviews, 16(1), 244-252. [CrossRef]
- Moriarty, P., & Honnery, D. (2016). Can renewable energy power the future? Energy policy, 93, 3-7.
- Panwar, N. L., Kaushik, S. C., & Kothari, S. (2011). Role of renewable energy sources in environmental protection: A review. Renewable and sustainable energy reviews, 15(3), 1513-1524. [CrossRef]
- Pazheri, F. R., Othman, M. F., & Malik, N. H. (2014). A review on global renewable electricity scenario. Renewable and Sustainable Energy Reviews, 31, 835-845. [CrossRef]
- Perez, Marc & Perez, Richard. (2022). Update 2022 – A fundamental look at supply side energy reserves for the planet. Solar Energy Advances. 2. 100014. [CrossRef]
- Scherer, Laura & Pfister, Stephan. (2016). Global water footprint assessment of hydropower. Renewable Energy. 99. 711-720. [CrossRef]
- Sovacool, B. K., & Dworkin, M. H. (2015). Energy justice: Conceptual insights and practical applications. Applied energy, 142, 435-444. [CrossRef]
- Sovacool, B. K., Martiskainen, M., Hook, A., & Baker, L. (2019). Decarbonization and its discontents: a critical energy justice perspective on four low-carbon transitions. Climatic Change, 155, 581-619. [CrossRef]
- U.S. Energy Information Administration. (2021). US. Electric power sector’s use of water continued its downward trend in 2020. Today in Energy. https://www.eia.gov/todayinenergy/detail.php?id=50698.
- United Nations Department of Economic and Social Affairs (2015). Water for Life 2005 to 2015.https://www.un.org/waterforlifedecade/water_and_energy.shtml.
- United Nations Water. (2018). World Water Development Report. https://www.unwater.org/publications/world-water-development-report-2018.
- Van Vliet, M. T. H., Van Beek, L. P. H., Eisner, S., Flörke, M., Wada, Y., & Bierkens, M. F. P. (2016). Multi-model assessment of global hydropower and cooling water discharge potential under climate change. Global Environmental Change, 40, 156-170. [CrossRef]
- Van Vliet, M. T., Sheffield, J., Wiberg, D., & Wood, E. F. (2016). Impacts of recent drought and warm years on water resources and electricity supply worldwide. Environmental Research Letters, 11(12), 124021. [CrossRef]
- Vicente-Serrano, S. M., Lopez-Moreno, J. I., Beguería, S., Lorenzo-Lacruz, J., Sanchez-Lorenzo, A., García-Ruiz, J. M., ... & Espejo, F. (2014). Evidence of increasing drought severity caused by temperature rise in southern Europe. Environmental Research Letters, 9(4), 044001. [CrossRef]
- Vicente-Serrano, S. M., Peña-Angulo, D., Beguería, S., Domínguez-Castro, F., Tomás-Burguera, M., Noguera, I., ... & El Kenawy, A. (2022). Global drought trends and future projections. Philosophical Transactions of the Royal Society A, 380(2238), 20210285. [CrossRef]
- Welsby, D., Price, J., Pye, S., & Ekins, P. (2021). Unextractable fossil fuels in a 1.5° C world. Nature, 597(7875), 230-234. [CrossRef]
- Zhang, X., Liu, J., Tang, Y., Zhao, X., Yang, H., Gerbens-Leenes, P. W., ... & Yan, J. (2017). China’s coal-fired power plants impose pressure on water resources. Journal of cleaner production, 161, 1171-1179. [CrossRef]
|
Disclaimer/Publisher’s Note: The statements, opinions and data contained in all publications are solely those of the individual author(s) and contributor(s) and not of MDPI and/or the editor(s). MDPI and/or the editor(s) disclaim responsibility for any injury to people or property resulting from any ideas, methods, instructions or products referred to in the content. |
© 2024 by the authors. Licensee MDPI, Basel, Switzerland. This article is an open access article distributed under the terms and conditions of the Creative Commons Attribution (CC BY) license (http://creativecommons.org/licenses/by/4.0/).
