1. Introduction
As one of the major marine meteorological disasters that appears in coastal areas, the thunderstorm gale is one type weather phenomena accompanied by both thunderstorms and gales [
1]. The thunderstorm gale refers to ground-level wind with speeds equal or exceeding 17.2 m·s
-1, resulting from convective storms [
2]. The thunderstorm gale often leads to significant human casualties and substantial economic losses [
3,
4].
The gust fronts (GFs), which is closely associated with convective storms, is defined as the boundary between the cold downdraft outflow propagated horizontally by the convective storm and the ambient air [
5,
6,
7]. The GFs not only acts an unstable triggering factor releases the instability of convective energy in the boundary layer [
8], but also plays an important role in the localization and evolution of convective storm [
9]. Historically, research on the characteristics of GFs has predominantly focused on quasi-linear convective system (QLCS) and bow echo (BE) [
10,
11,
12]. However, little work has investigated two different types of GFs along convective cells (CCs, [
2]). Therefore, the thermodynamic structures of GFs as well as the surface cold pool are analyzed in this study, and it has a positive impact for understanding the regularities of disastrous weather and enhancing the capabilities of early warning.
As the leading edge of strong outflow from thunderstorms, GFs are often accompanied by meteorological phenomena such as: pressure rise, wind shift, wind surge, temperature drop, and especially strong wind which occurs at the surface [
13,
14,
15,
16,
17]. There are obvious ground divergence which appears behind the GFs, meanwhile, the obvious convergence appears in front of it [
18,
19]. The obvious upward movement close to the GFs can be detected [
20,
21], and there are significant differences in the thermal and dynamical structures of GF between the cases with and without precipitation [
22]. GFs typically exhibit depths ranging from 0.5 to 2.0 km, although this range can vary between 100 m and 4 km depending on the intensity and proximity to the downdraft source [
23]. By utilizing the radar data, Martner [
24] observed that the GF achieved a maximum ascending speed of 10 m·s
-1 at an altitude of 1.35 km, which was subsequently followed by a rapid descent after one min, indicating the sudden transition between the strong ascending and descending motions near the GF.
From the GFs’ maintaining mechanism perspective, the significance of cold pool and low-level environmental wind shear in the perpetuation of thunderstorms has been a subject of concern [
25]. According to Rotunno-Klemp-Weisman (RKW) theory (hereafter RKW88, [
26]), the interaction between vertical wind shear ahead of thunderstorms and the cold pool formed by convective precipitation can directly influence the uplift of ambient air at the leading edge of the cold pool (near the outflow boundary), thereby determining the formation of new convective cells, as well as various aspects related to maintenance, development, propagation, and evolution of the entire convective system [
26,
27,
28]. Weckwerth and Wakimoto [
29] observed that GF updraft maxima occurred on the upshear side of Kelvin-Helmholtz waves, intersecting the boundary at altitudes approximately 1-2 km above the surface with angles close to 90° and intervals ranging from 3-5 km. Regrettably, the available data were insufficient to substantiate a causal relationship between these maxima and storm initiation. Kingsmill [
30] observed a sequence of small-scale (2-4 km) vertical vorticity maxima, evenly spaced at intervals of 3-5 km along an intense GF. It was pointed out that the GF was affected by Kelvin-Helmholtz instability (KHI), which is conducive to the strengthening of ascending motion and the maintenance of thunderstorms. Besides, meso-γ-scale vortices (MVs) tend to appear at the position of strong shear along the GFs [
31,
32]. The presence of moderate-to-strong vertical wind shear at low to mid-levels was found to be conducive to the formation of robust, deep, and long-lasting mesoscale vortices (MVs). Additionally, the Coriolis force and the presence of strong cold pools were also identified as favorable factors for the genesis of vigorous MVs [
33].
Convectively generated cold pools constitute an integral component within the convective storm cycle. These cold pools result from downdrafts that are latently cooled and subsequently reach the surface, spreading outward in a manner often referred to as a density current [
34]. As they displace the surrounding warm, moist air, this phenomenon can be described as a convective-induced density current [
13]. In conjunction with the ambient wind shear, cold pools contribute to the uplift of surrounding air parcels and facilitate the formation of new cells, thereby organizing mesoscale convective systems (MCSs) [
35]. Consequently, cold pools play a pivotal role in organizing deep convection and are an indispensable component of MCSs [
36,
37].
Weckwerth and Wakimoto [
29] were the first to quantitatively analyze the initiation of convection by a single GF atop the cold-air outflow, highlighting that the combined motion of Kelvin-Helmholtz (K-H) and internal gravity (IG) waves exhibited consistent behavior with convective cell movement. According to density current theory [
38], it is indicated that the compensatory relationship between cold pool density and depth results in a nearly constant speed of the leading edge of the cold pool (LECP), despite the diminishing strength and varying height of the cold pool over time [
39]. Forced mechanical lifting induced by the collision of cold pools within gust fronts can initiate convective processes and is particularly intensified during multi-cold pool collisions [
40]. The updrafts and mass flux exhibit significant enhancement in multi-cold pool collisions compared to single cold pool gust fronts [
41].
Previous results provide references to understand the conditions for the formation of GF gales and enhance the capability of forecasting and warning time. However, many important questions about GFs and cold pools still remain to be answered. For instance:
1) Why do GF gales occur in some environments but not in others? What environmental parameters determine the potential for GF gales?
2) What are the relationship between strength in GFs and cold pools? What are the potential role of cold pools on the evolution of GFs?
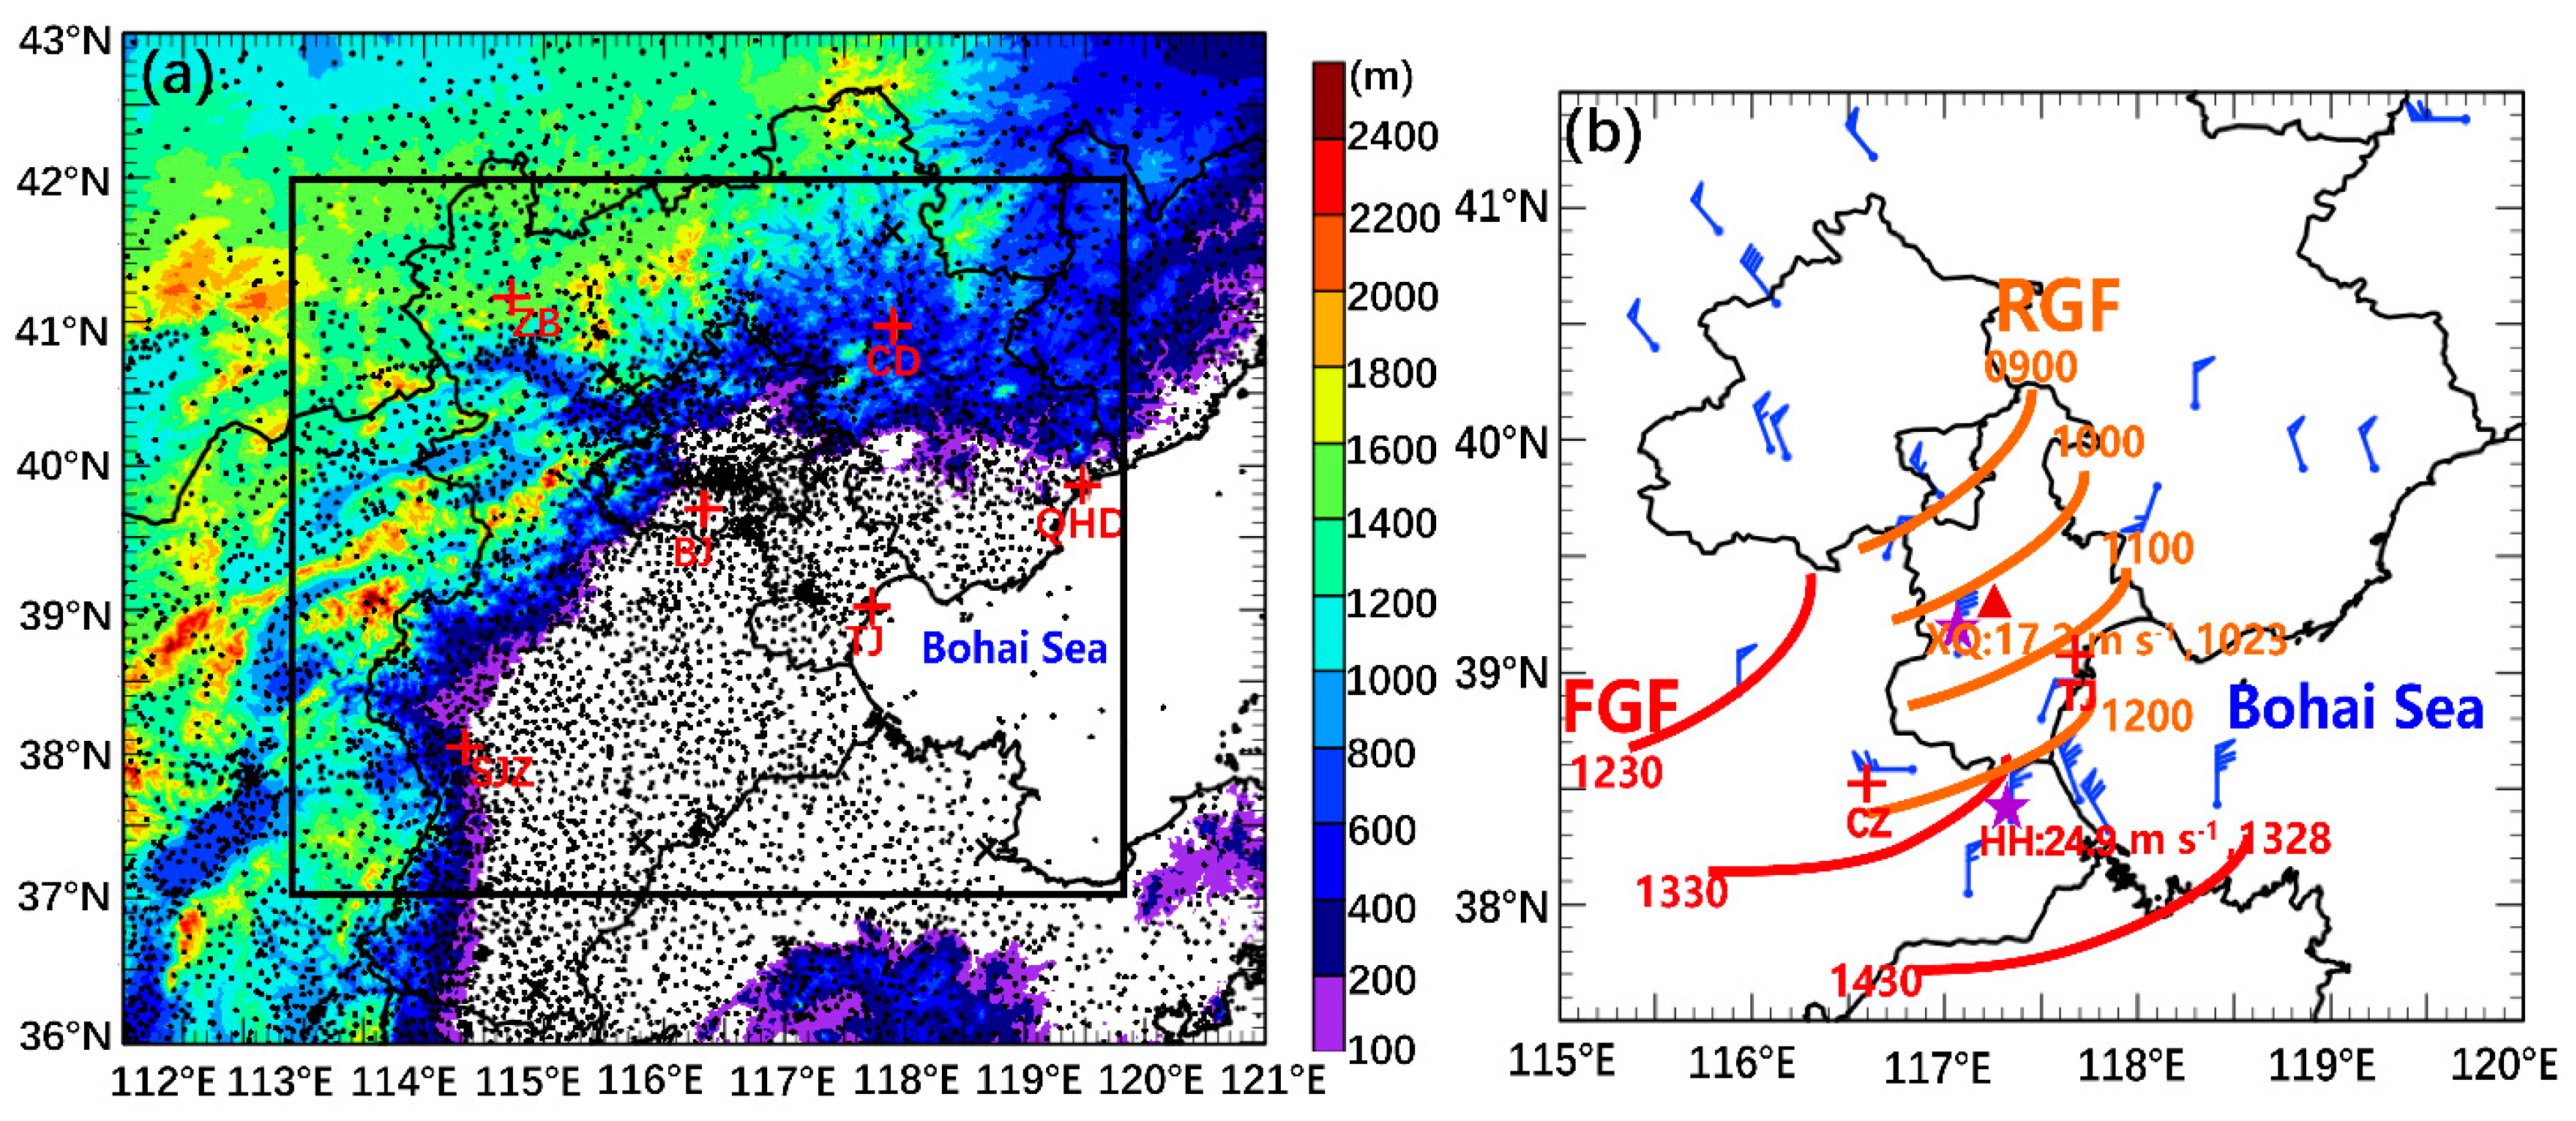
This paper is an attempt to answer the foregoing questions with the help of various kinds of meteorological data over the Bohai Sea Bay (BSB), China. On June 10, 2016, from 0600 UTC to 1800 UTC, two strong wind processes triggered by consecutive GFs along convective cells (CCs) occurred over the BSB. The maximum wind speed observed by the national automatic station is 26.0 m·s
-1 (grade 10, at 1251 UTC), while the regional station record is 32.6 m·s
-1 (grade 11, at 1346 UTC).
Figure 1b shows the distribution of instantaneous wind speed (≥17.2 m·s
-1) during 0600–1800 UTC at the national automatic station on June 10. Abulikemu et al. [
42] investigated the convection initiation (CI) mechanism associated with GFs generated by MCS of this particular case. This paper focuses on the differences between the evolution as well as the implications of cold pools on the evolution of two GFs.
2. Data and Methods
2.1. Reanalyzed and Observation Data
The pre-convective synoptic environments were examined using the fifth-generation European Center for Medium-Range Weather Forecast reanalysis (ERA5; Hersbach et al. [
43]). The spatial resolution of ERA5 is 0.25° with 1-hr temporal interval. The radar data used in this paper are from two WSR/98D Doppler weather radars (
Figure 1b), which located in Tanggu (39.04°N, 117.72°E) of Tianjin and Cangzhou (38.28°N, 116.08°E) of Hebei Province. The radars operate with a scanning radius of 230 km, a volume scanning cycle of 6 min and scanning elevations within 0.5°–19.5°. Surface automatic weather station (AWS) at an interval of 1 hour, including 2 m temperature, 2 m dew-point temperature, surface pressure, 10 m average winds and transient winds at the elevation of station height, were used to analyze the near-surface processes before and during this event.
2.2. Description of VDRAS
The VDRAS system is a rapid update four-dimensional variational (4DVAR) data assimilation system constrained by a cloud model (Sun and Crook, [
44,
45]). It includes three-dimensional cloud model, equations for the prediction of precipitation, adjoint model in assimilation, cost function, and recursive minimization algorithm. In addition to its use as a research tool for convective-scale analyses (Friedrich et al. [
46]; Tai et al. [
47]), VDRAS has been used for operational nowcasting in several forecasting offices (Crook and Sun, [
48]; Sun et al. [
49]). The surface observation data used in this study were surface automatic weather station (AWS) at an interval of 1 hr. The radar data from six S-band China New Generation Radars (CINRADs) located at Beijing (BJ), Tianjin (TJ), Shijiazhuang (SJZ), Zhangbei (ZB), Chengde (CD) and Qinhuangdao (QHD) are assimilated into the VDRAS (
Figure 1a for the locations of radars). These six radars run operationally by the same scan mode produced reflectivity and radial velocities at nine elevation angels (0.5°, 1.5°, 2.5°, 3.4°, 4.4°, 6.1°, 9.9°, 14.6°, and 19.6°) with a volume scan rate of 6 min. The mesoscale forecast data from the National Center for Atmospheric Research’s Weather Research and Forecast (WRF) model are used for first guesses and boundary conditions. The 4DVAR-based VDRAS seeks an optimal initial state with the smallest difference between model forecasts and observations within a short assimilation window (Sun [
50]). In this study, we used a 12-min window in which at least two radar volume scans from each of the six radars are assimilated to provide an accurate convective-scale analysis. The first guess and boundary conditions for VDRAS were WRF forecasts from the operational 3-hourly cycled WRF products produced by Beijing Meteorological Services.
The domain for the VDRAS analysis is 540 km×540 km with 5-km horizontal resolution centered at 39.58936°N, 116.1802°E (
Figure 1a). The vertical depth of the VDRAS analysis is 15 km with a 400 m vertical resolution and 30 layers. Several previous studies have evaluated the accuracy of VDRAS analyses of wind and temperature fields against wind profiler data and AWS data (Chen et al. [
51]; Xiao et al. [
52]). The reliability of the 4DVar model’s inversion results has been verified (Chen et al. [
51]). These studies found that VDRAS wind and temperature analyses yielded reasonable agreement with observations in severe weather situations for different regions of the world (Wu et al. [
53]; Zhang et al. [
54]; Xiao et al. [
55]; Cui et al. [
7]).
3. Synoptic Conditions and Environment Conditions
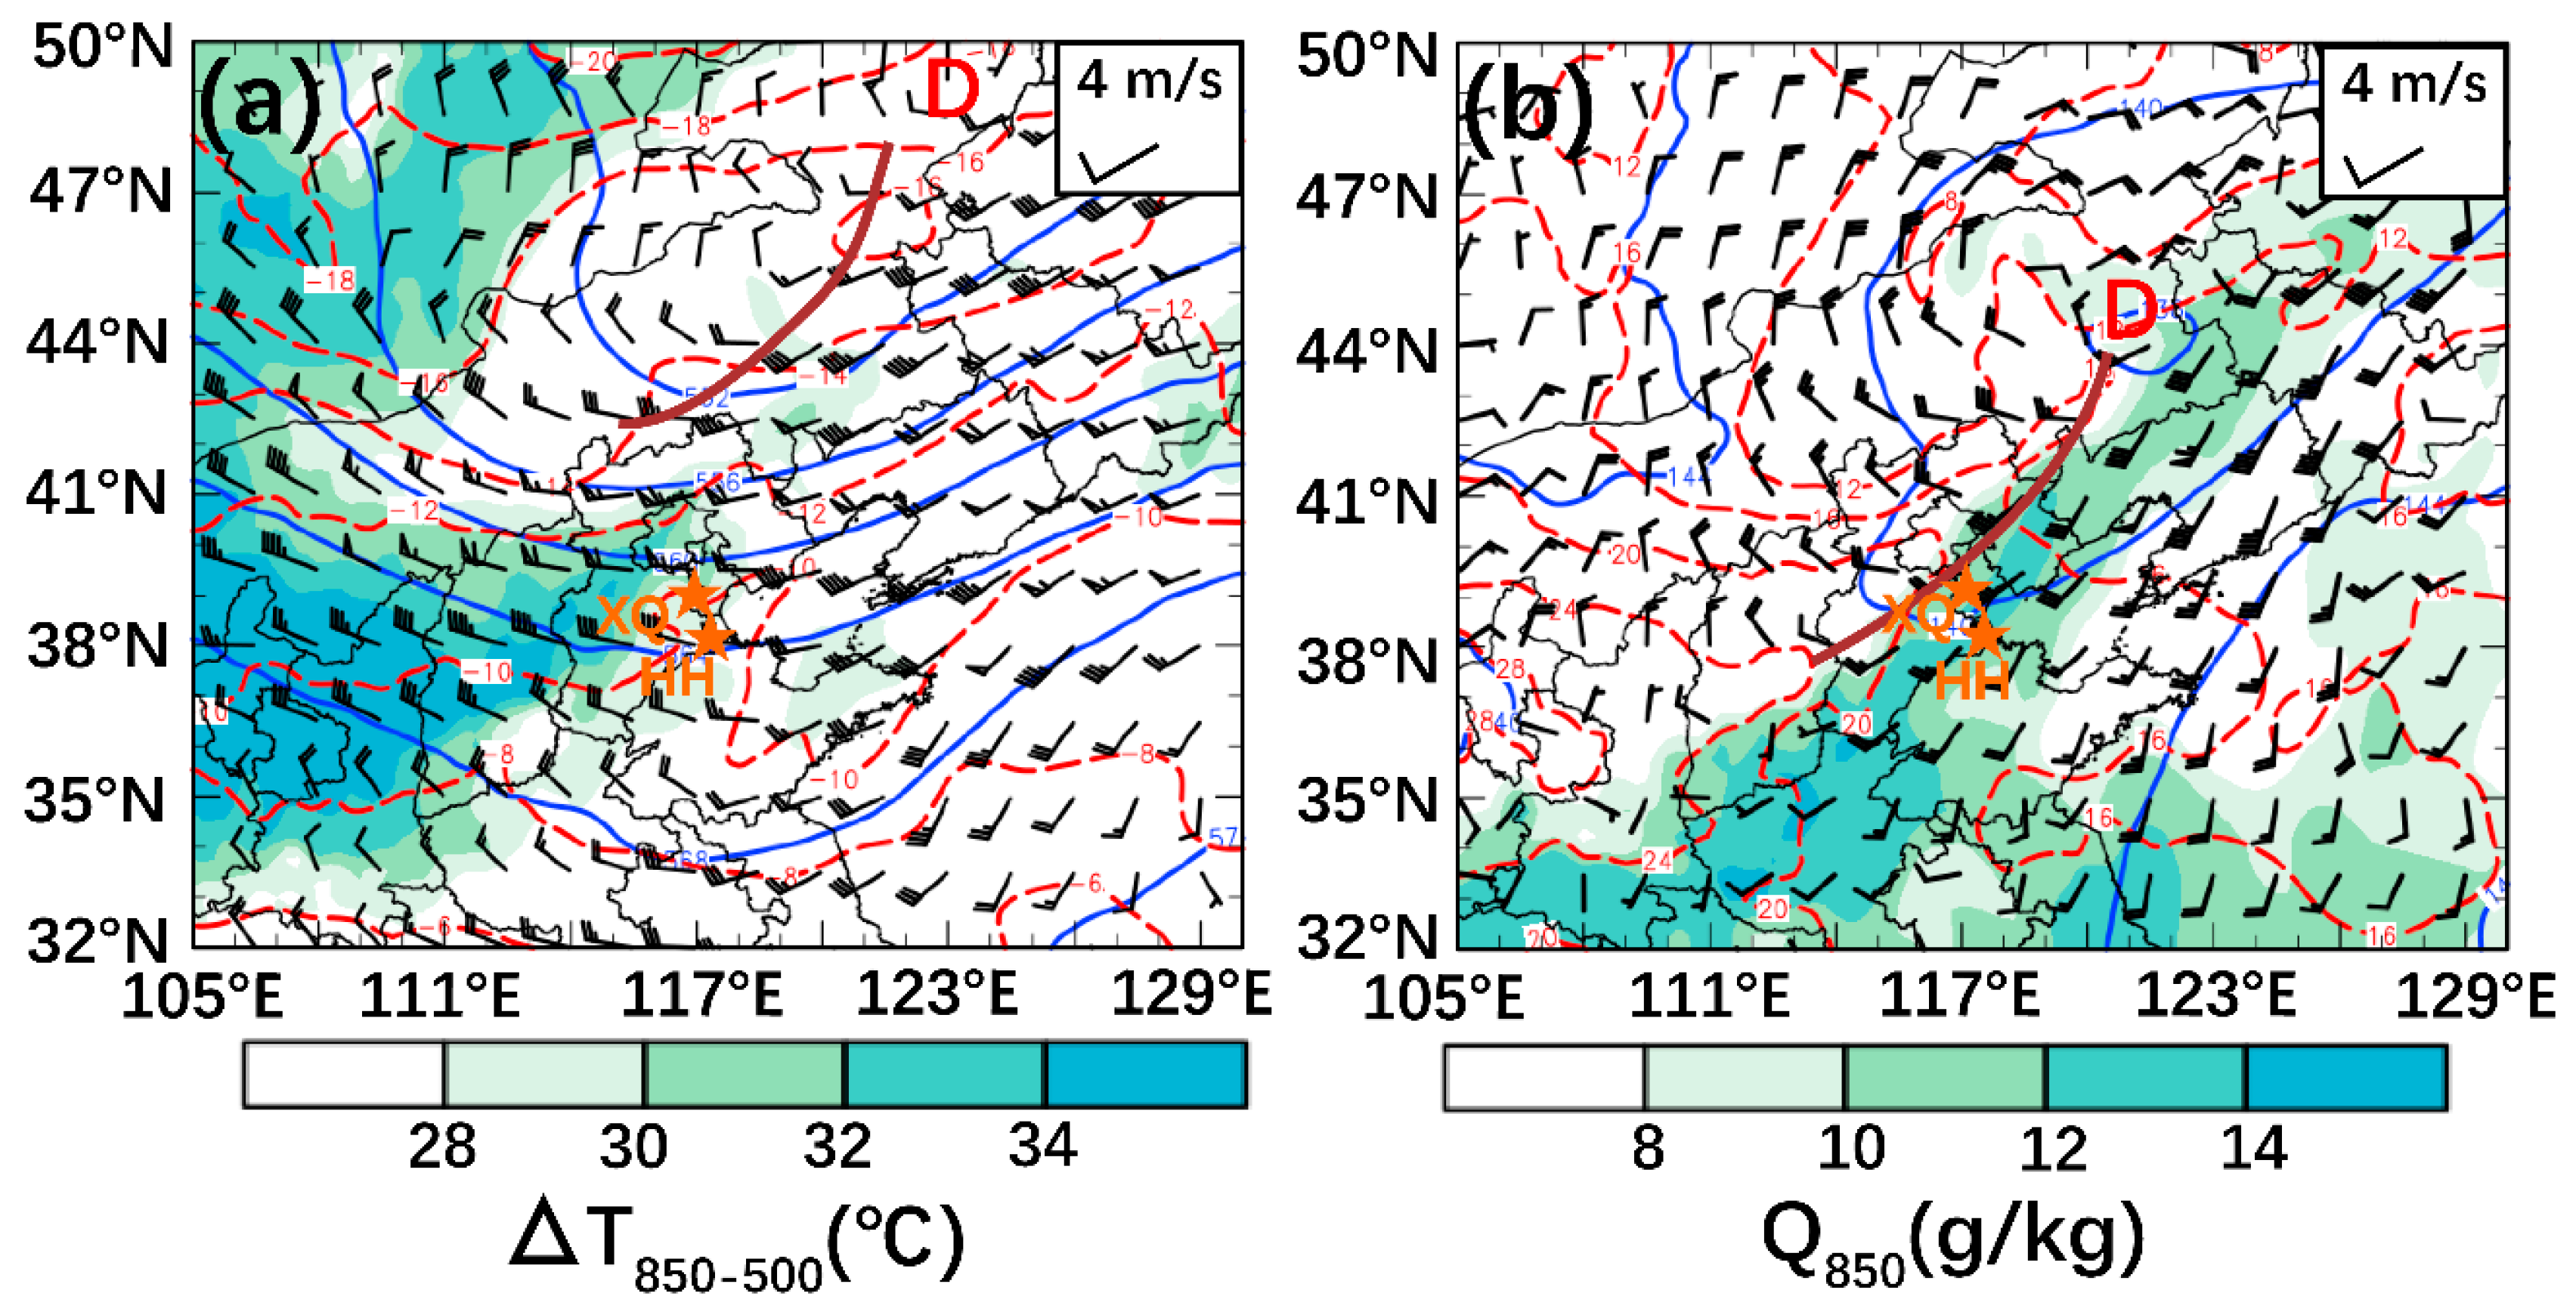
The synoptic pattern before the formation of GFs is shown in
Figure 2 according to ERA5. The 500 hPa geopotential height chart (
Figure 2a) shows a cold vortex in the Northeast China, and BSB lies in the westerly flow in front of upper trough at 0900 UTC 10 June 2016. The westerly flow increased from 20 m·s
-1 at 0600 UTC (figure omitted) to 24 m·s
-1 at 0900 UTC, as well as the cold advection increased from the afternoon. The temperature gradient between 850-500 hPa in BSB has increased to 30-32℃, indicating an enhanced vertical lapse rate. Furthermore, the warm and wet advection in front of the lower trough at 850 hPa caused the instability of the cold air in the upper level and warm air in the lower level (
Figure 2b), so it is reasonably favorable synoptic condition for the development of the convective storm.
(a) 500 hPa geopotential height (blue solid line, unit: dagpm), temperature (red dashed line, unit: ℃), temperature difference between 850-500 hPa (shading, unit: ℃) and wind (barb, unit: m·s-1). (b) 850 hPa geopotential height (blue solid line, unit: dagpm), temperature (red dashed line, unit: ℃), specific humidity (shading, unit: g·kg-1) and wind (barb, unit: m·s-1). The brown line represent shear line. D: low pressure, “★”denote the position of Xiqing (XQ) and Huanghua (HH).
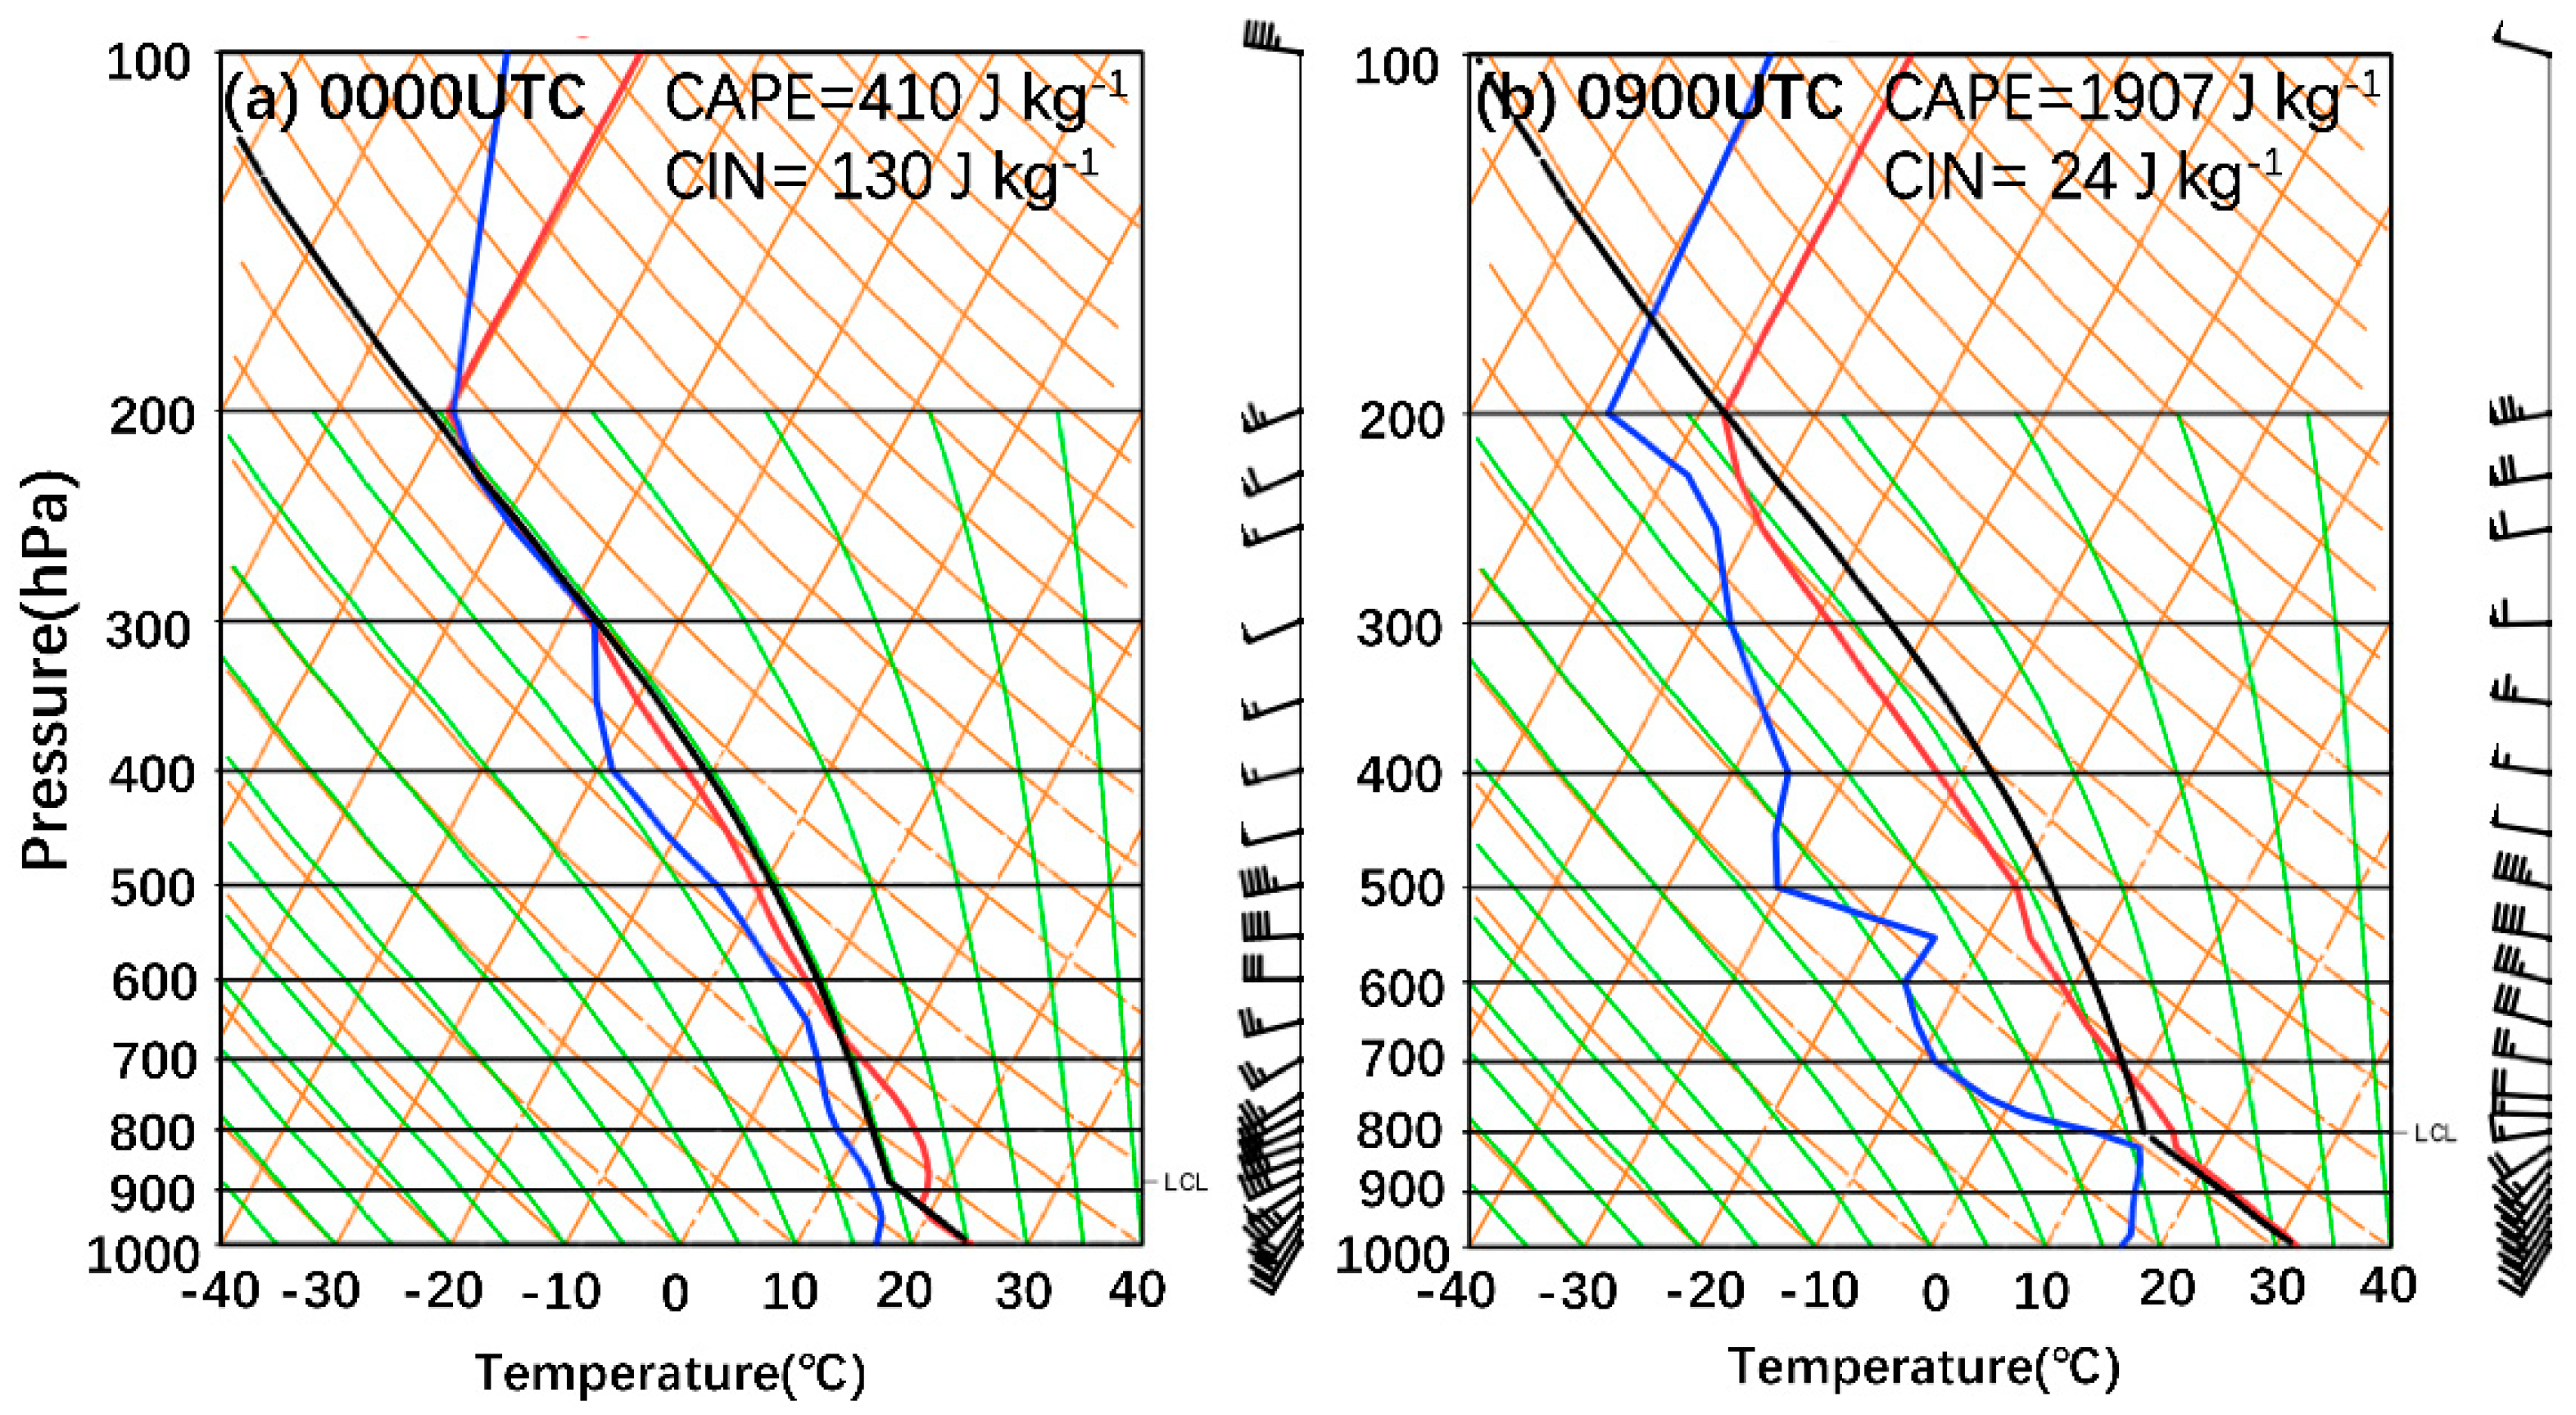
The sounding from Huanghua station are shown in the early morning (0800 LST, LST= UTC+8h,
Figure 3a) and in the afternoon (1700 LST,
Figure 3b). In the morning (0800 LST), the low convective available potential energy (CAPE) with 410 J·kg
-1 and the large convective inhibition (CIN) with 130 J·kg
-1 made air parcels hard to reach the lifting condensation level (LCL) to form convection. As the environment evolves with time, the thermal-dynamical conditions became more unstable than in the morning as the CAPE increased to 1907 J·kg
-1 and the CIN decreased to 24 J·kg
-1 at afternoon (1700 LST,
Figure 3b). Moreover, the temperature lapse rate of lower level (below 800 hPa) approaching dry-adiabatic lapse rates, that means the downdraft likely remained negatively buoyant below middle level and accelerated until it reached 800 hPa, about 2 km near the ground. Because of the temporal variability of the environment, the prestorm environmental conditions were favorable for convective development.
4. Comparison of Evolution Characteristics of Cold Pool GFs
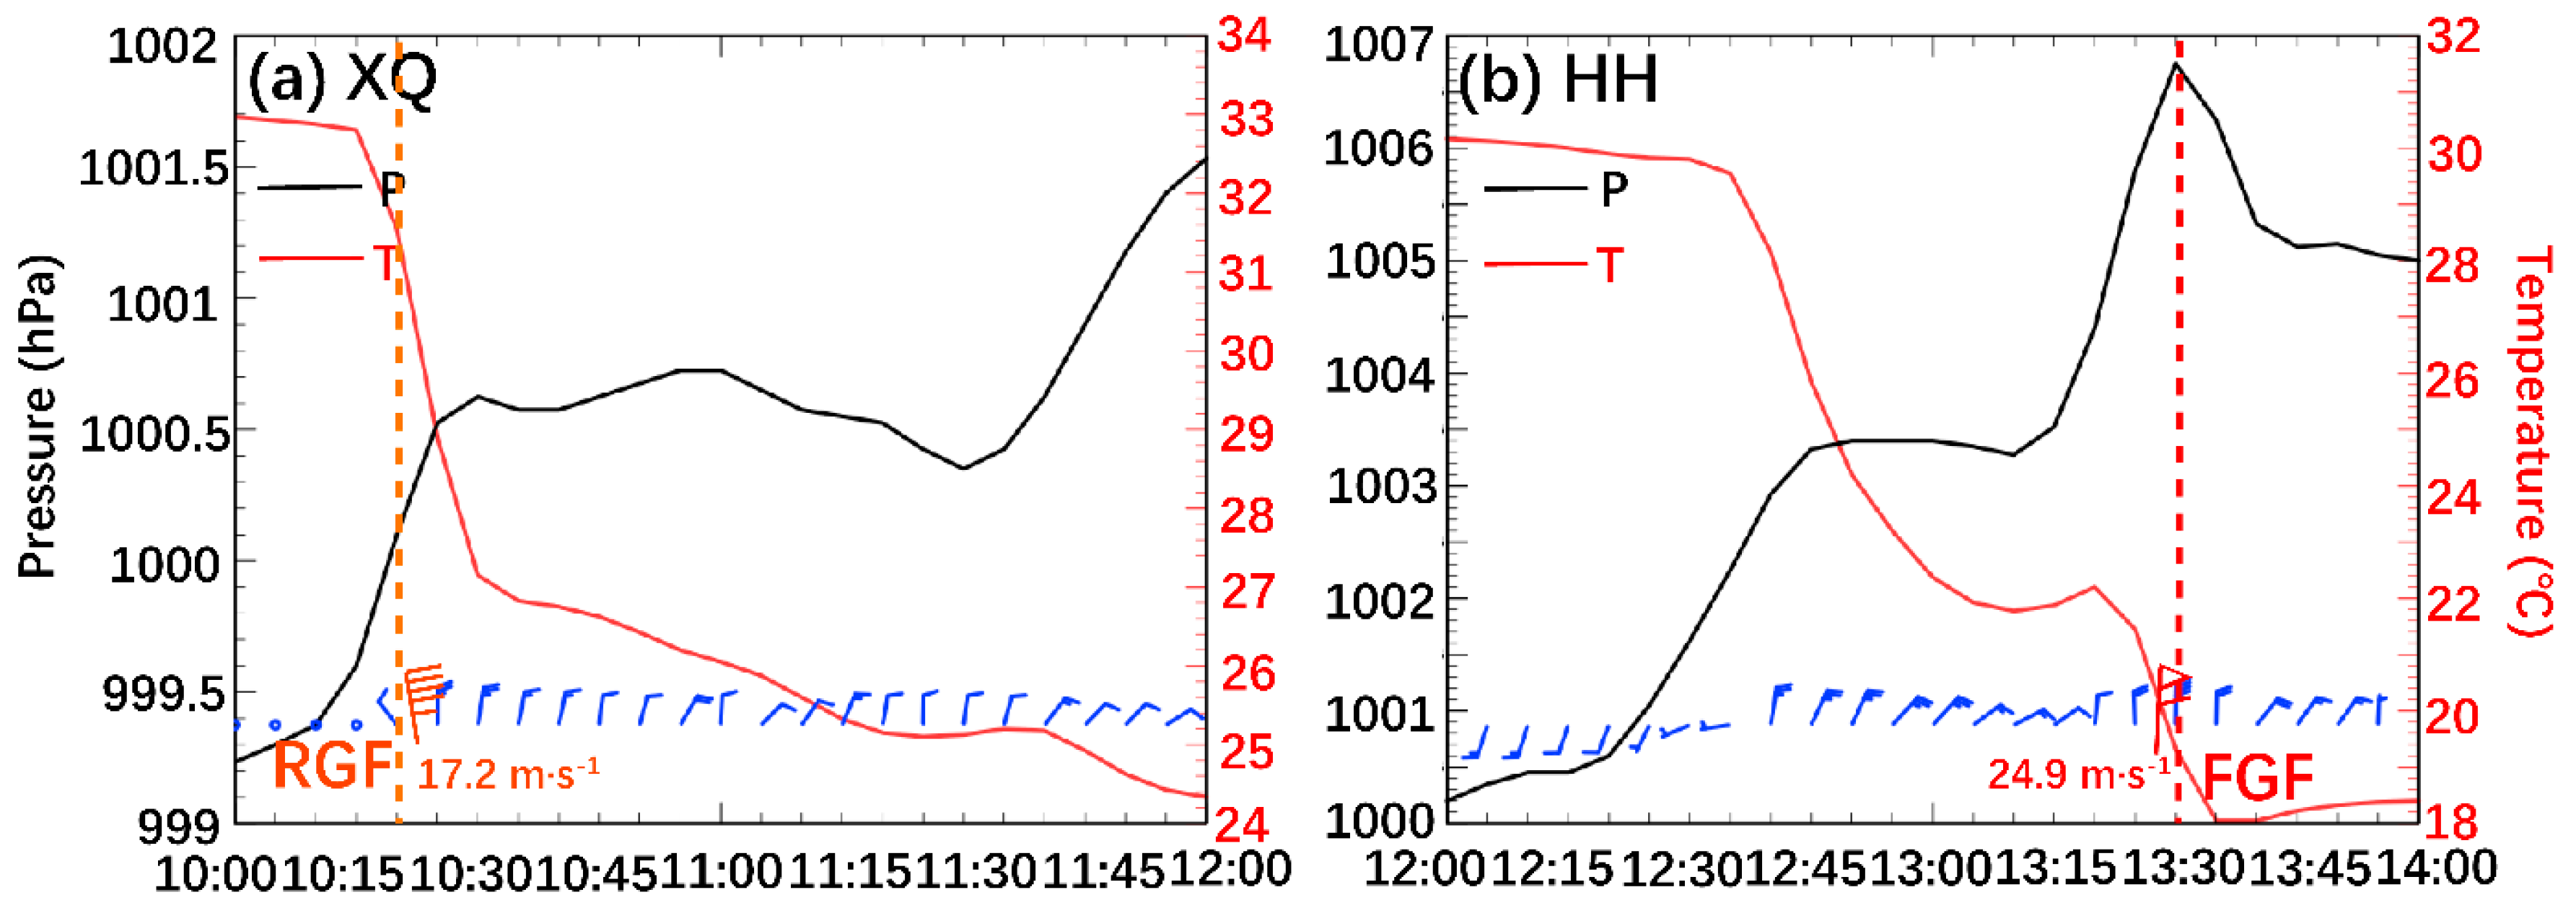
“6•10” thunderstorm gale was affected by two continuously GFs over the BSB. The rearward GF (designated as RGF, 8 grade gale appeared after passing GF) formed in the northwest region of Tianjin at 0900 UTC 10 June and disappeared at 1312 UTC in Bohai Sea (
Figure 1b). The gust speed at Xiqing station reached 17.2 m·s
-1 after passing through the RGF (
Figure 4a). The frontward GF (designated as FGF, 10 grade gale appeared before passing GF) formed in the southwest region of Hebei Province at 1212 UTC, entered Bohai Sea and disappeared around 1500 UTC. The gust speed at Huanghua station reached 24.9 m·s
-1 prior to the occurrence of the FGF (
Figure 4b).
4.1. Comparison of Surface Thermal Fields
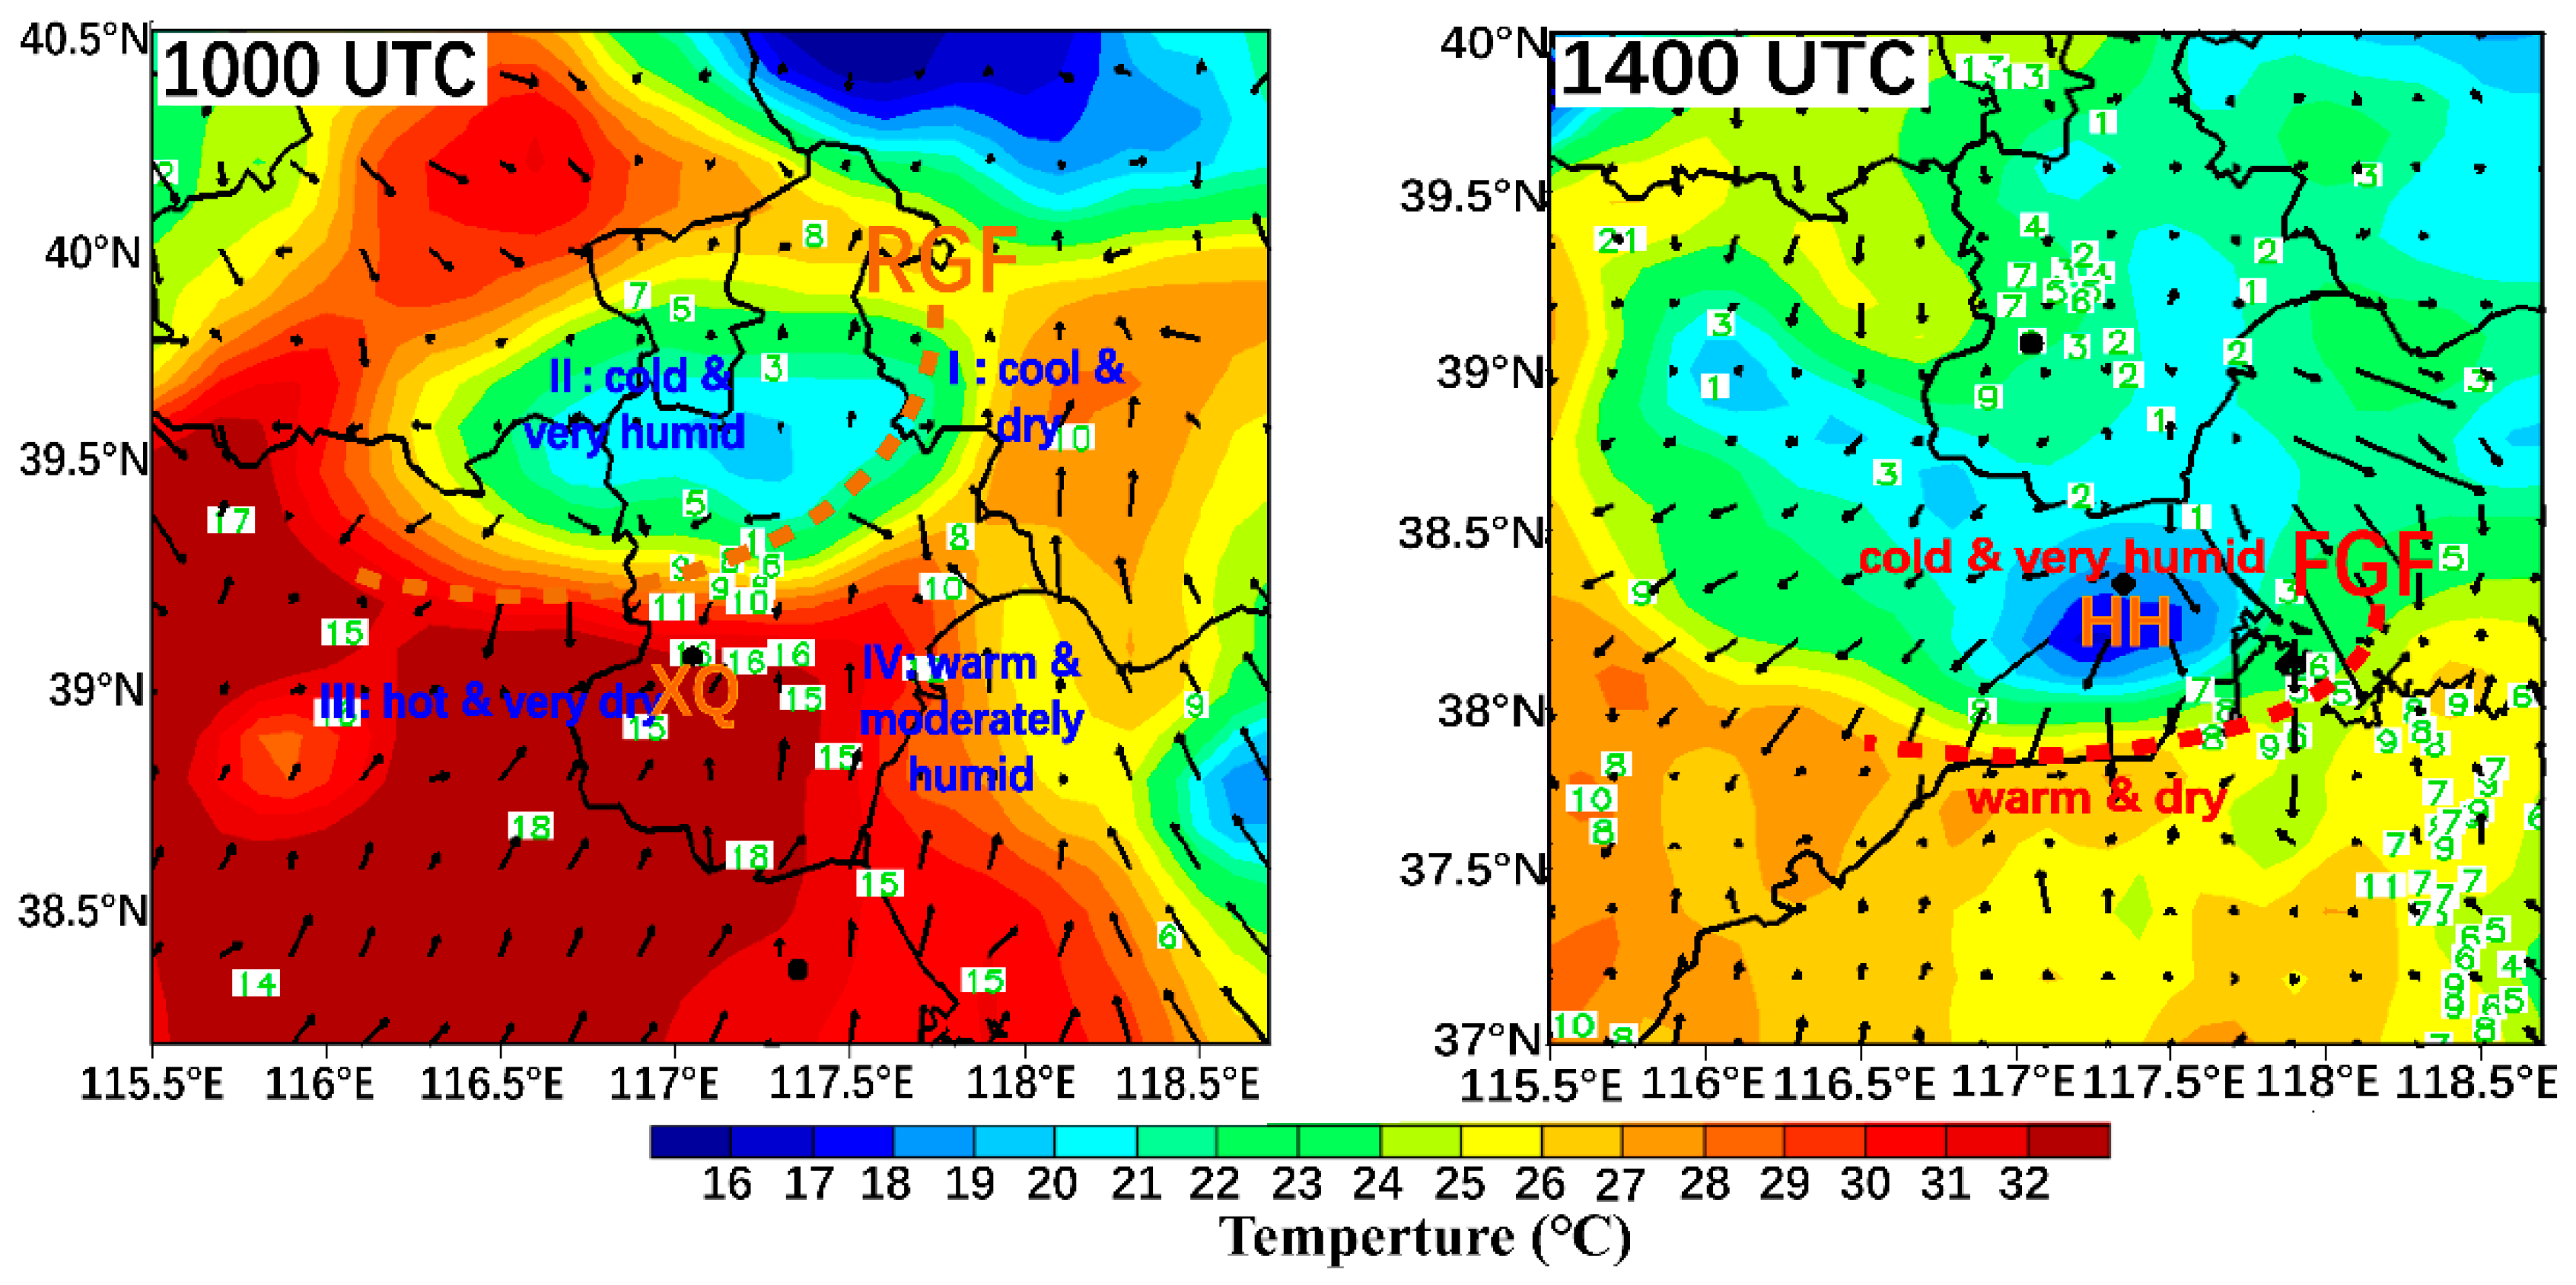
To better understand the characteristics of cold pool association with these two GFs, the surface temperature and dewpoint temperature based on AWS were compared in
Figure 5. The air masses observed at 1000 UTC could be classified into four distinct categories (
Figure 5a): a cool and dry air mass (quadrant I), a cold and very humid poster-RGF air mass (quadrant II), a more continental hot and very dry prior-RGF air mass (quadrant Ⅲ) and a more maritime warm and moderately humid (quadrant Ⅳ). This behavior suggests that the southwesterly inflow of boundary layer from quadrant Ⅲ plays a crucial role in generating the RGF and causing destructive wind at 1023 UTC within quadrant Ⅲ, where surface parcels with a temperature dewpoint difference / temperature ratio of 16/33 ℃ are present.
Different from RGF, there are only two air masses could be identified at 1400 UTC (
Figure 5b), the cold and very humid air masses poster-FGF, whereas warm and dry air masses prior-FGF. The downdraft associated with the destructive winds of FGF appears to originate from near-ground northeasterly inflow, originating within a cold and highly humid air mass at temperatures around 1/17 ℃. These findings contradict previous studies that suggest the updrafts associated with destructive winds primarily draw their boundary layer inflow from warm and highly humid air masses [
4].
Figure 6 shows the temporal evolutions of surface meteorological elements during the passage of the two GFs. The surface pressure typically begins to rise posterior to the passage of RGF and prior to the cold pool passage (Goff [
13]; Fujita [
14]). Therefore, the surface pressure prior to the arrival of the cold pool was determined by identifying the minimum surface pressure during the 32-min period prior to the wind shift (
Figure 6a). RGF conform to the structural characteristics of the traditional GF model [
56]. However, unlike RGF, the surface pressure of FGF decreased rapidly after surging, exhibits a “high-pressure nose”, and the temperature dropped from 30.0 ℃ to 17.9 ℃ (
Figure 6b). According to the theory, a stronger temperature difference between the boundary and ambient air leads to higher wind speeds behind the two air masses. These findings suggest that RFG exhibited a stronger relationship between temperature decrease and wind speed increase compared to FGF (with respective values of 6.9 ℃ and 17.2 m·s
-1 for RGF, versus 12.1 ℃ and 24.9 m·s
-1 for FGF).
4.2. Comparison of Evolution Characteristics of Cold Pool GFs
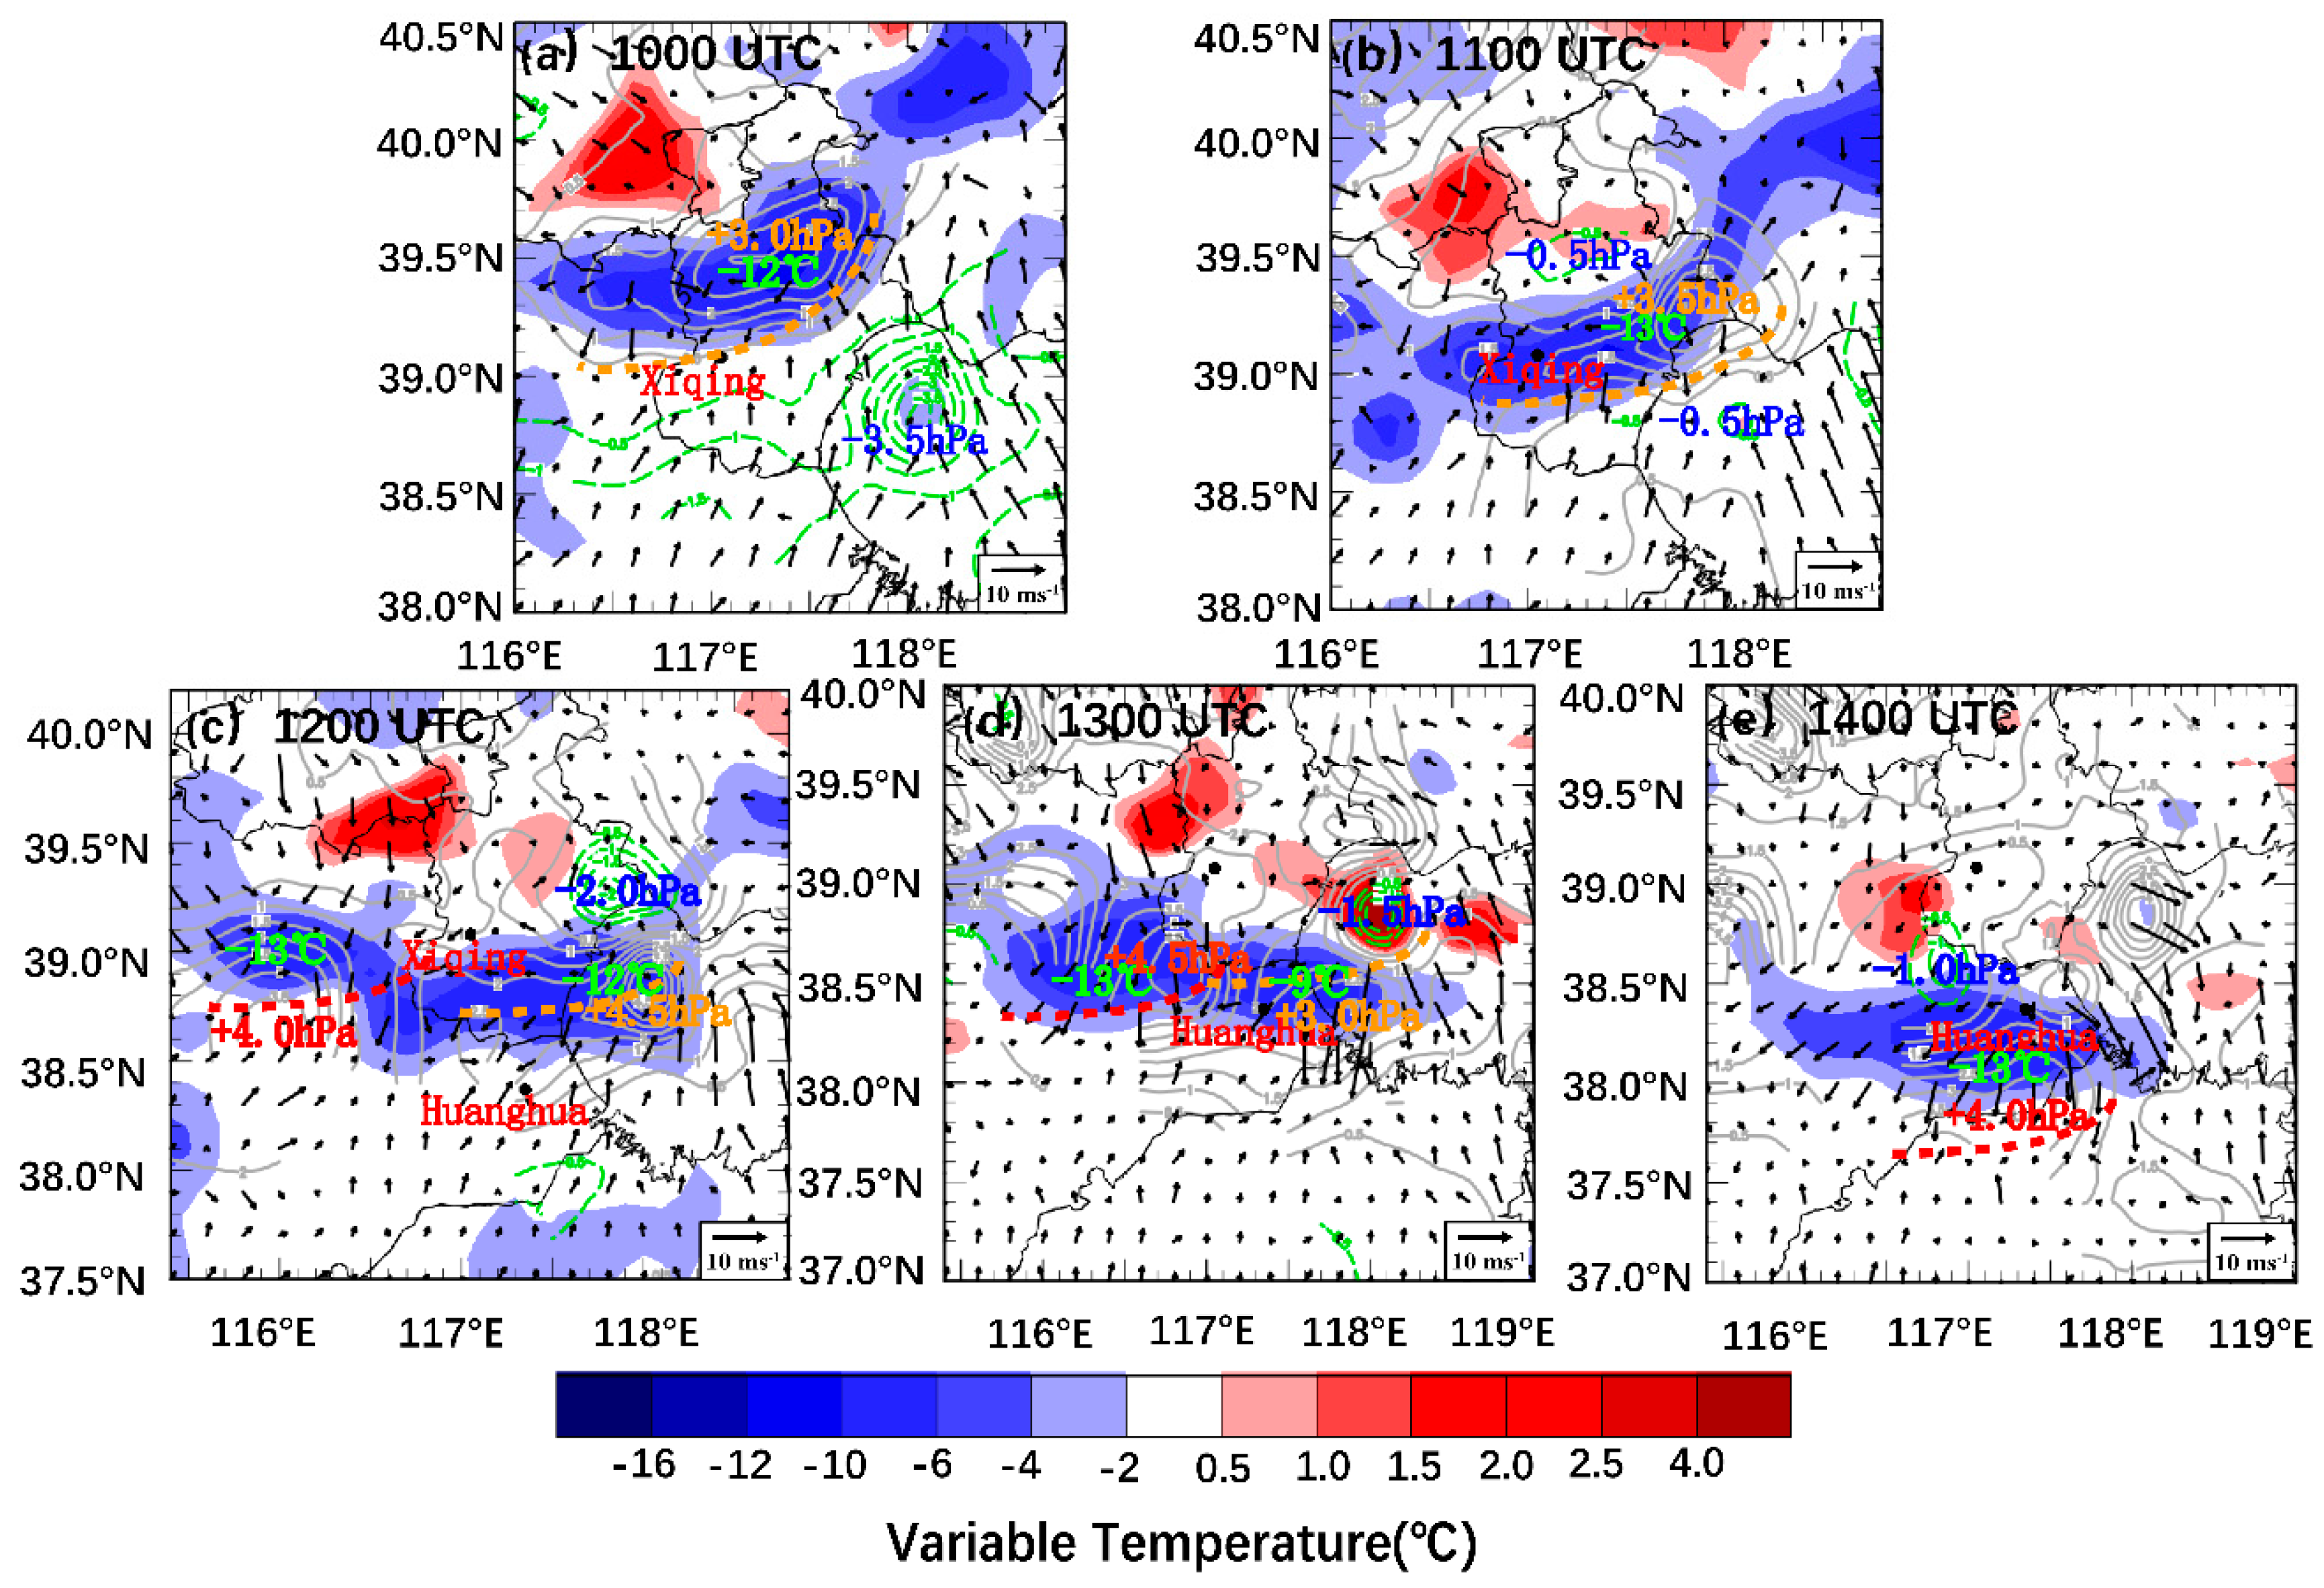
To investigate the evolutionary characteristics of cold pool GFs, we utilize the mean perturbation temperature field, which is obtained by subtracting the horizontal mean prior to calculating the average, as a representation of the cold pool structure [
52]. From surface meteorological elements, it can be seen that the precipitation intensity at 1000 UTC 10 June in the center of the convective storm is greater than 20 mm·h
-1, there is a temperature perturbation center of -12 ℃ below (
Figure 7a). It indicates that the dragging and evaporation cooling of heavy rainfall lead to the strong cold pool on the surface, RGF forms between the outflow of cold pool and the environmental wind from southwest. At that time, the near surface is still controlled by the southwesterly wind. At 1100 UTC, characteristics of mesoscale pressure field start to appear in RGF, including the katallobaric region ahead of the front, the anallobaric region on the rear of the front as well as the katallobaric region in the rear-flow. The strong echo develops toward the 1-h katallobaric center. Resulting in a temperature gradient across the RGF with a value of 1.9 ℃·(10km)
-1, and the pressure gradient reaches 7.4 hPa·(10km)
-1. The speed zone of the strong wind on the surface appears in the area with high gradients of isobars and isotherms.
Unlike the RGF, no katallobaric region appears in the rear-flow of FGF. The pressure at the anallobaric center behind the front is 4.5 hPa. The anallobaric center and negative temperature-change center correspond with the speed zone of the strong wind on the surface (
Figure 7c, d).
5. Implications of Cold Pools on the GFs
Since observations are limited to discrete surface AWS data, we now examine the potential role of cold pools on the evolution of GFs by utilizing high-resolution VDRAS data.
5.1. Meso-γ-Scale Vortices (MVs) of GFs
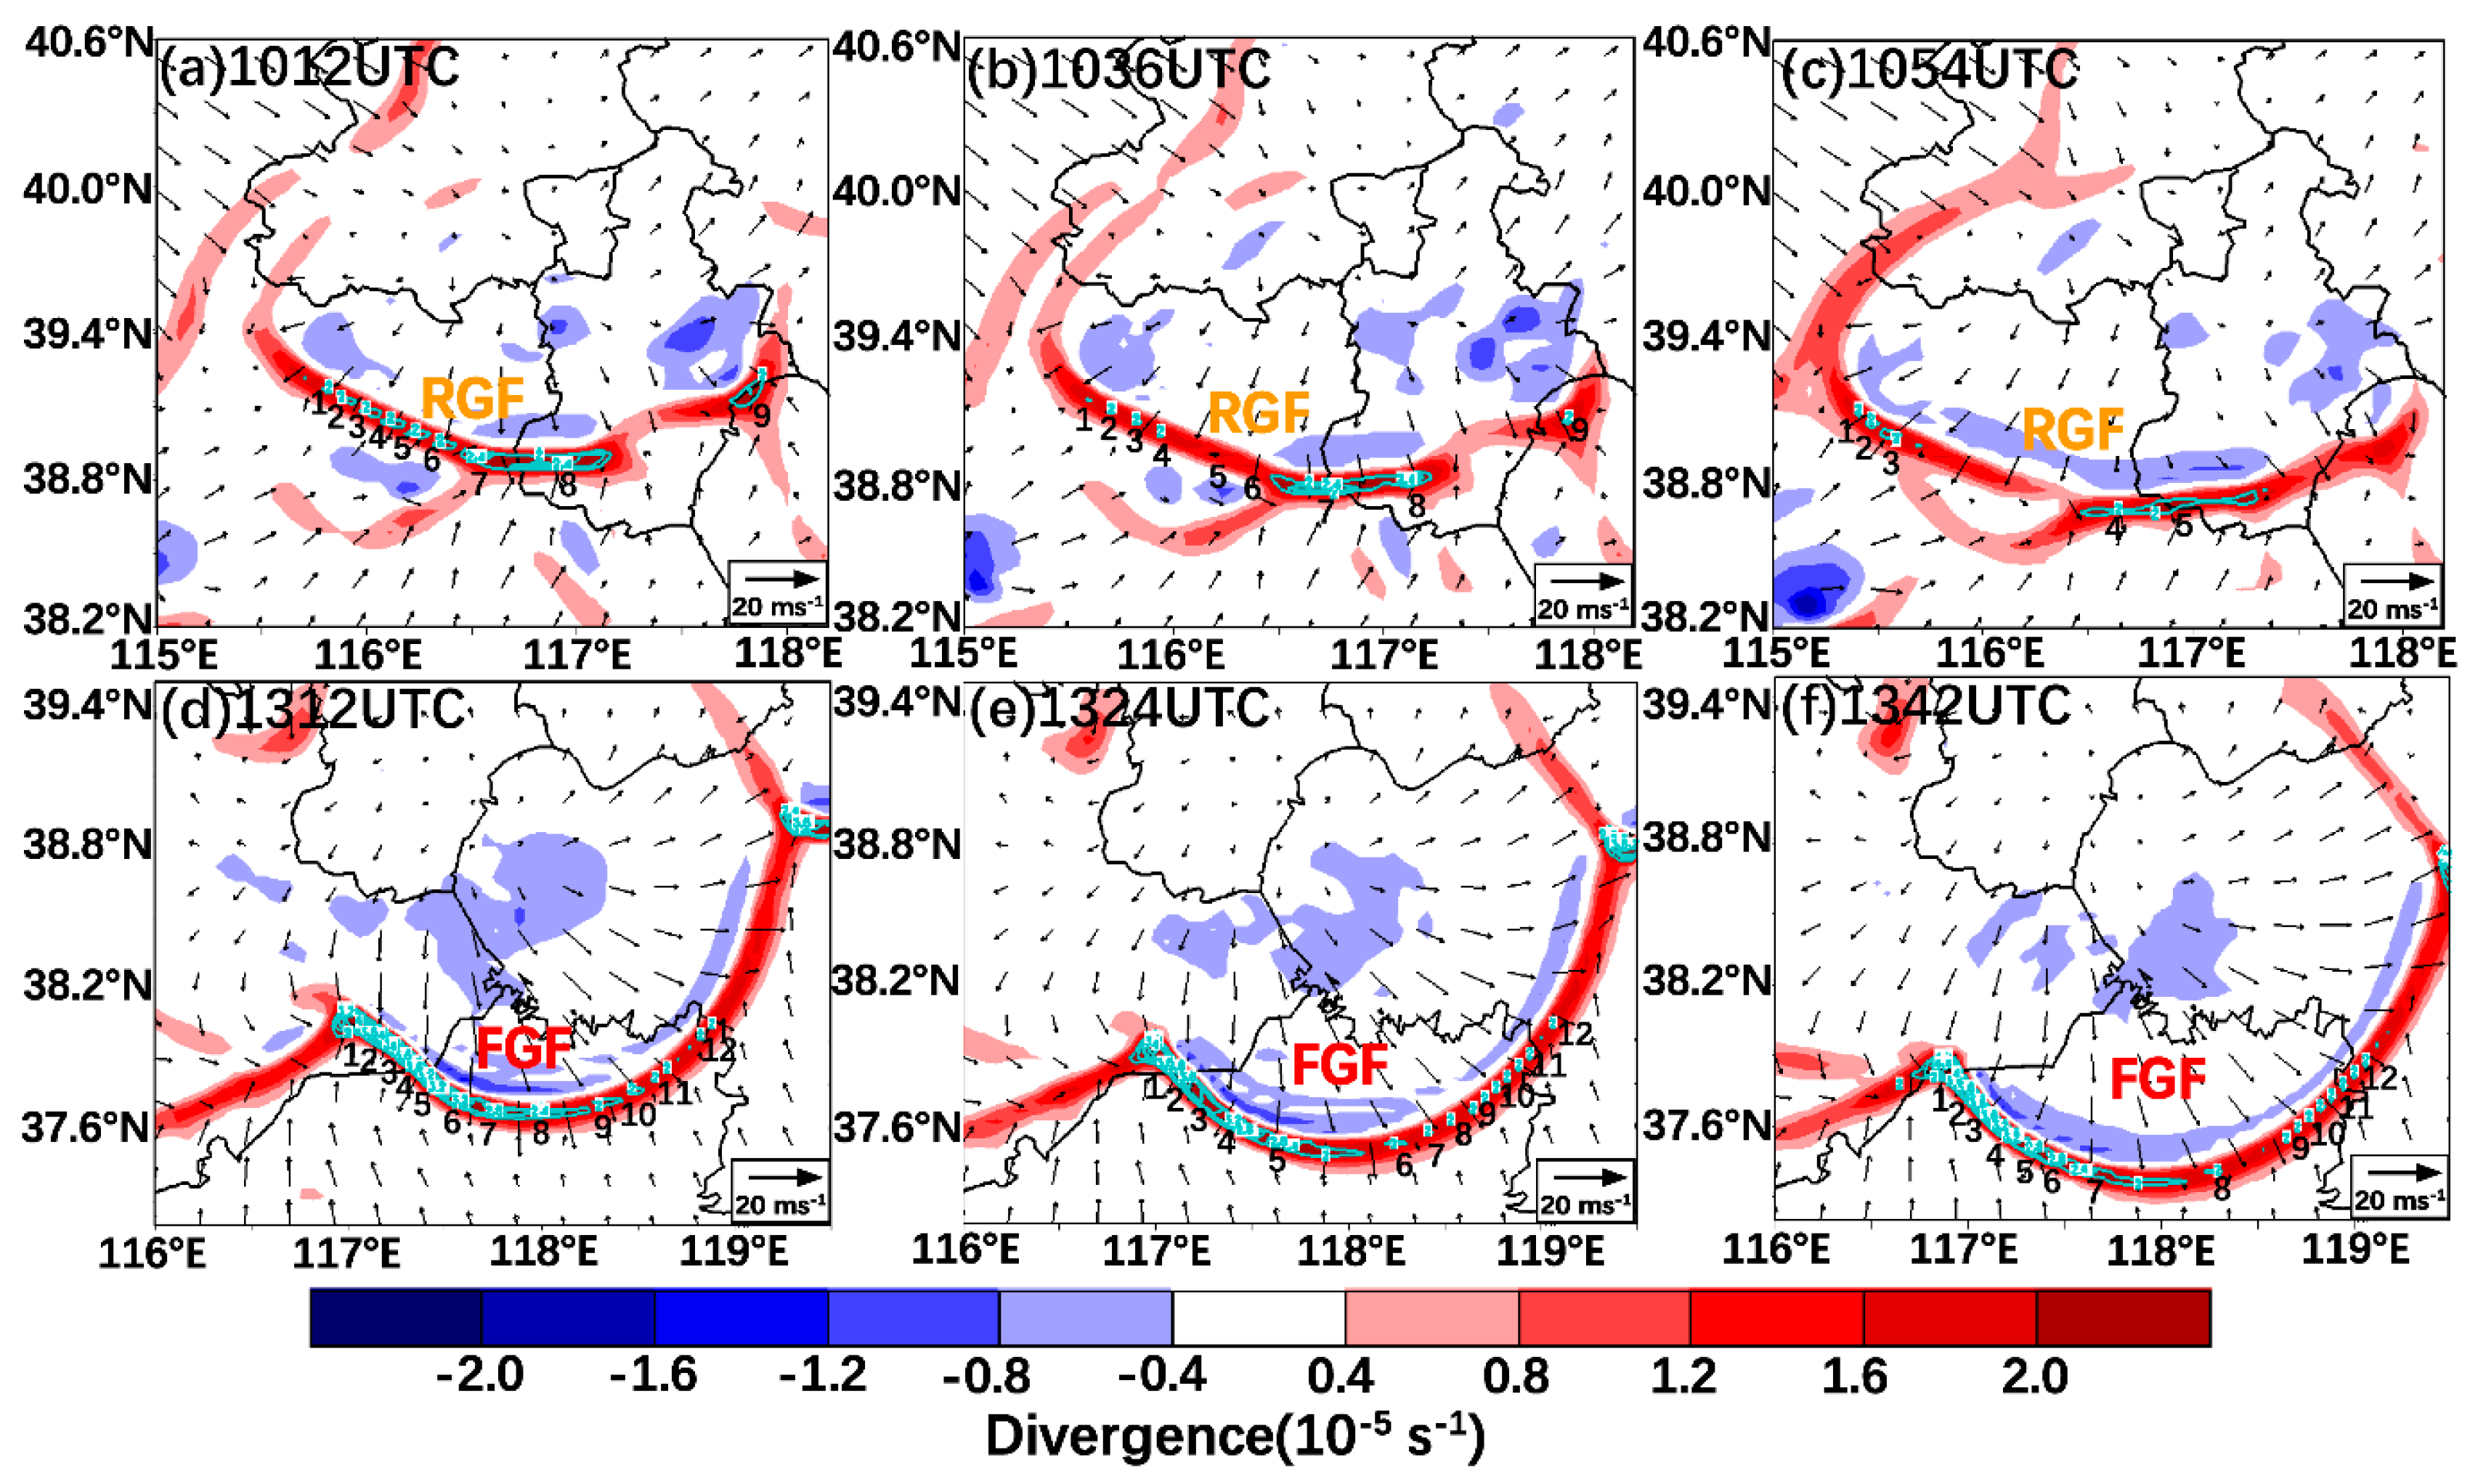
Figure 8 presents detailed evolution of MVs at 200 m AGL in association with GFs using the VDRAS data. The southwest flow at 200 m AGL within the RGF reaches speeds of 10-12 m·s
-1, facilitating the continuous transport of warm and humid air from the near surface to the region where thunderstorms develop. Within the RGF front, there exists a robust upward motion characterized by intense warmth and humidity, with a maximum vertical velocity reaching 1.8 m·s
-1 (
Figure 9a). Note that several MVs develop along the leading edge of the RGF (
Figure 8a), with diameter 5∼15 km, maximum vorticity 2.4×10
-5 s
-1, vertical depth 800 m. However, as depicted in the vertical cross sections for vortex illustrated in
Figure 9, these vortices persist at shallow depths (less than 1 km) and do not exhibit any association with midlevel updraft.
With the passage of time, the southwesterly flow at 200m AGL in front of FGF gradually shifted to southeasterly flow. The continuous transport of cold and moist air from nearby formations contributed to the development of a robust cold pool and a distinct outflow boundary at its forefront. The intensification of this cold pool resulted in enhanced vertical wind shear, promoting sustained upper and lower level rotation and generating significant horizontal vorticity. Notably, the maximum convergence-induced updraft speed reached 2.4 m·s-1 (
Figure 9b). Some significant MVs can also be found in association with the FGF, while the strongest vortice “1” with 3.6×10⁻⁵ s-1 is located at the forefront of FGF (identified in
Figure 8d-8f).
5.2. Intensity of Cold Pools
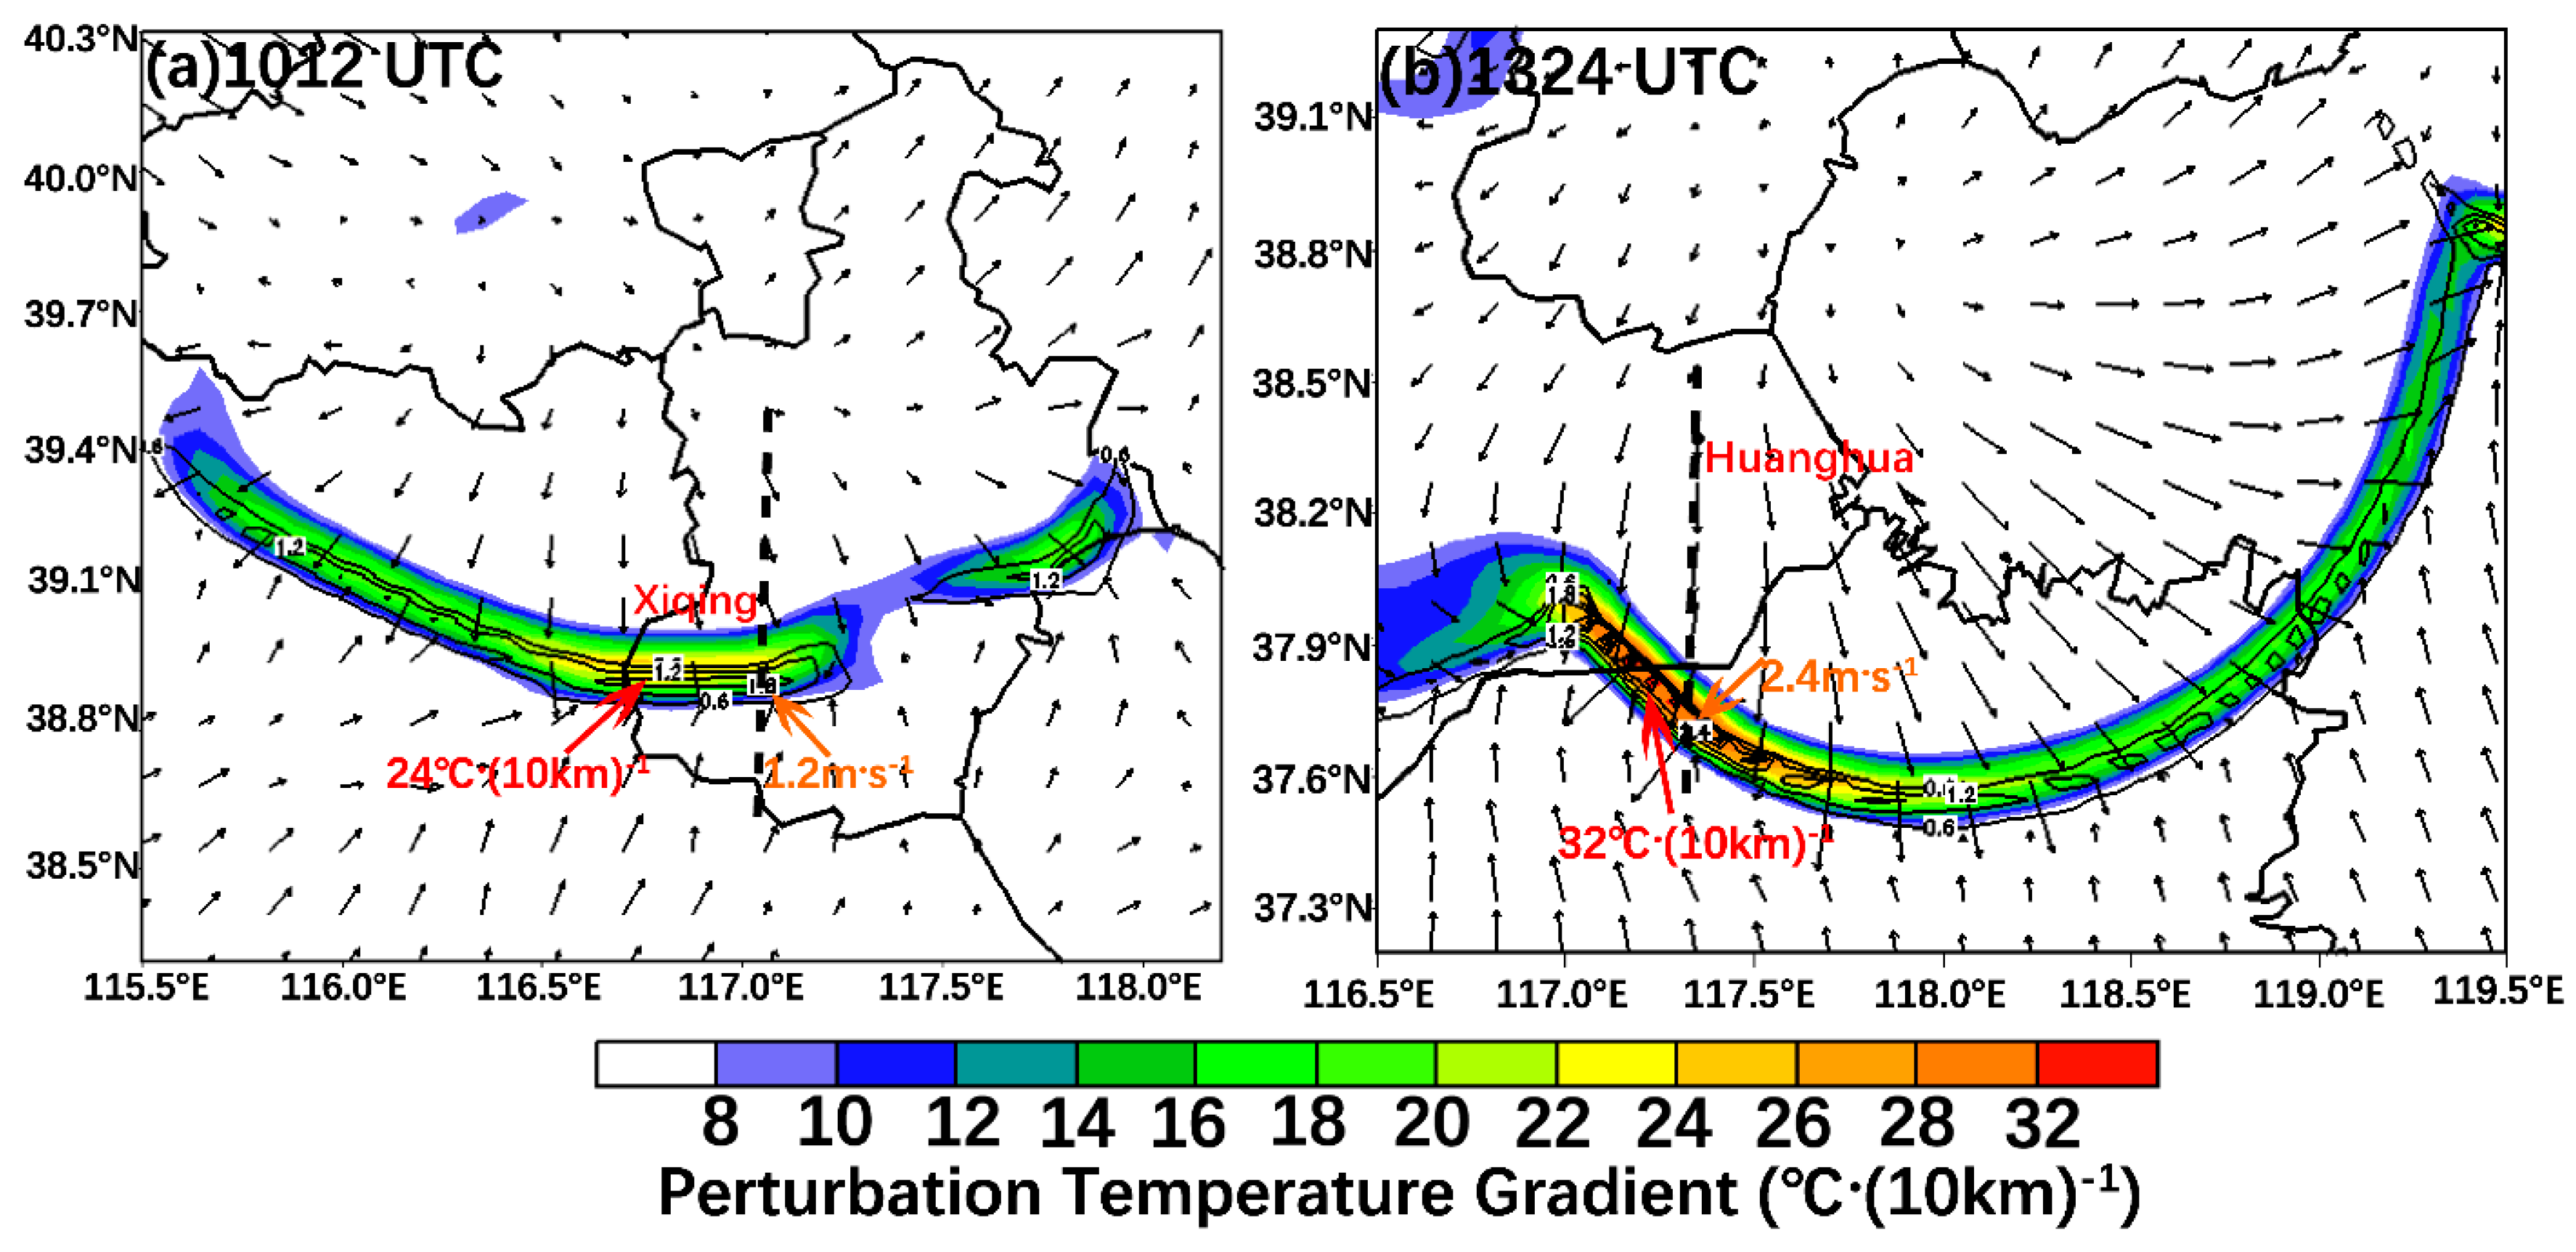
Figure 9 shows that there is an arc-shaped structure presented in the zone with a large value of a disturbance temperature gradient. The strongest temperature gradient caused by the RGF is 22–24 ℃·(10km)
-1, which is in the protuberance of the front edge along its moving direction. The maximum ascending speed at the leading edge of RGF is 1.2 m·s
-1, located in the left front along its moving direction.
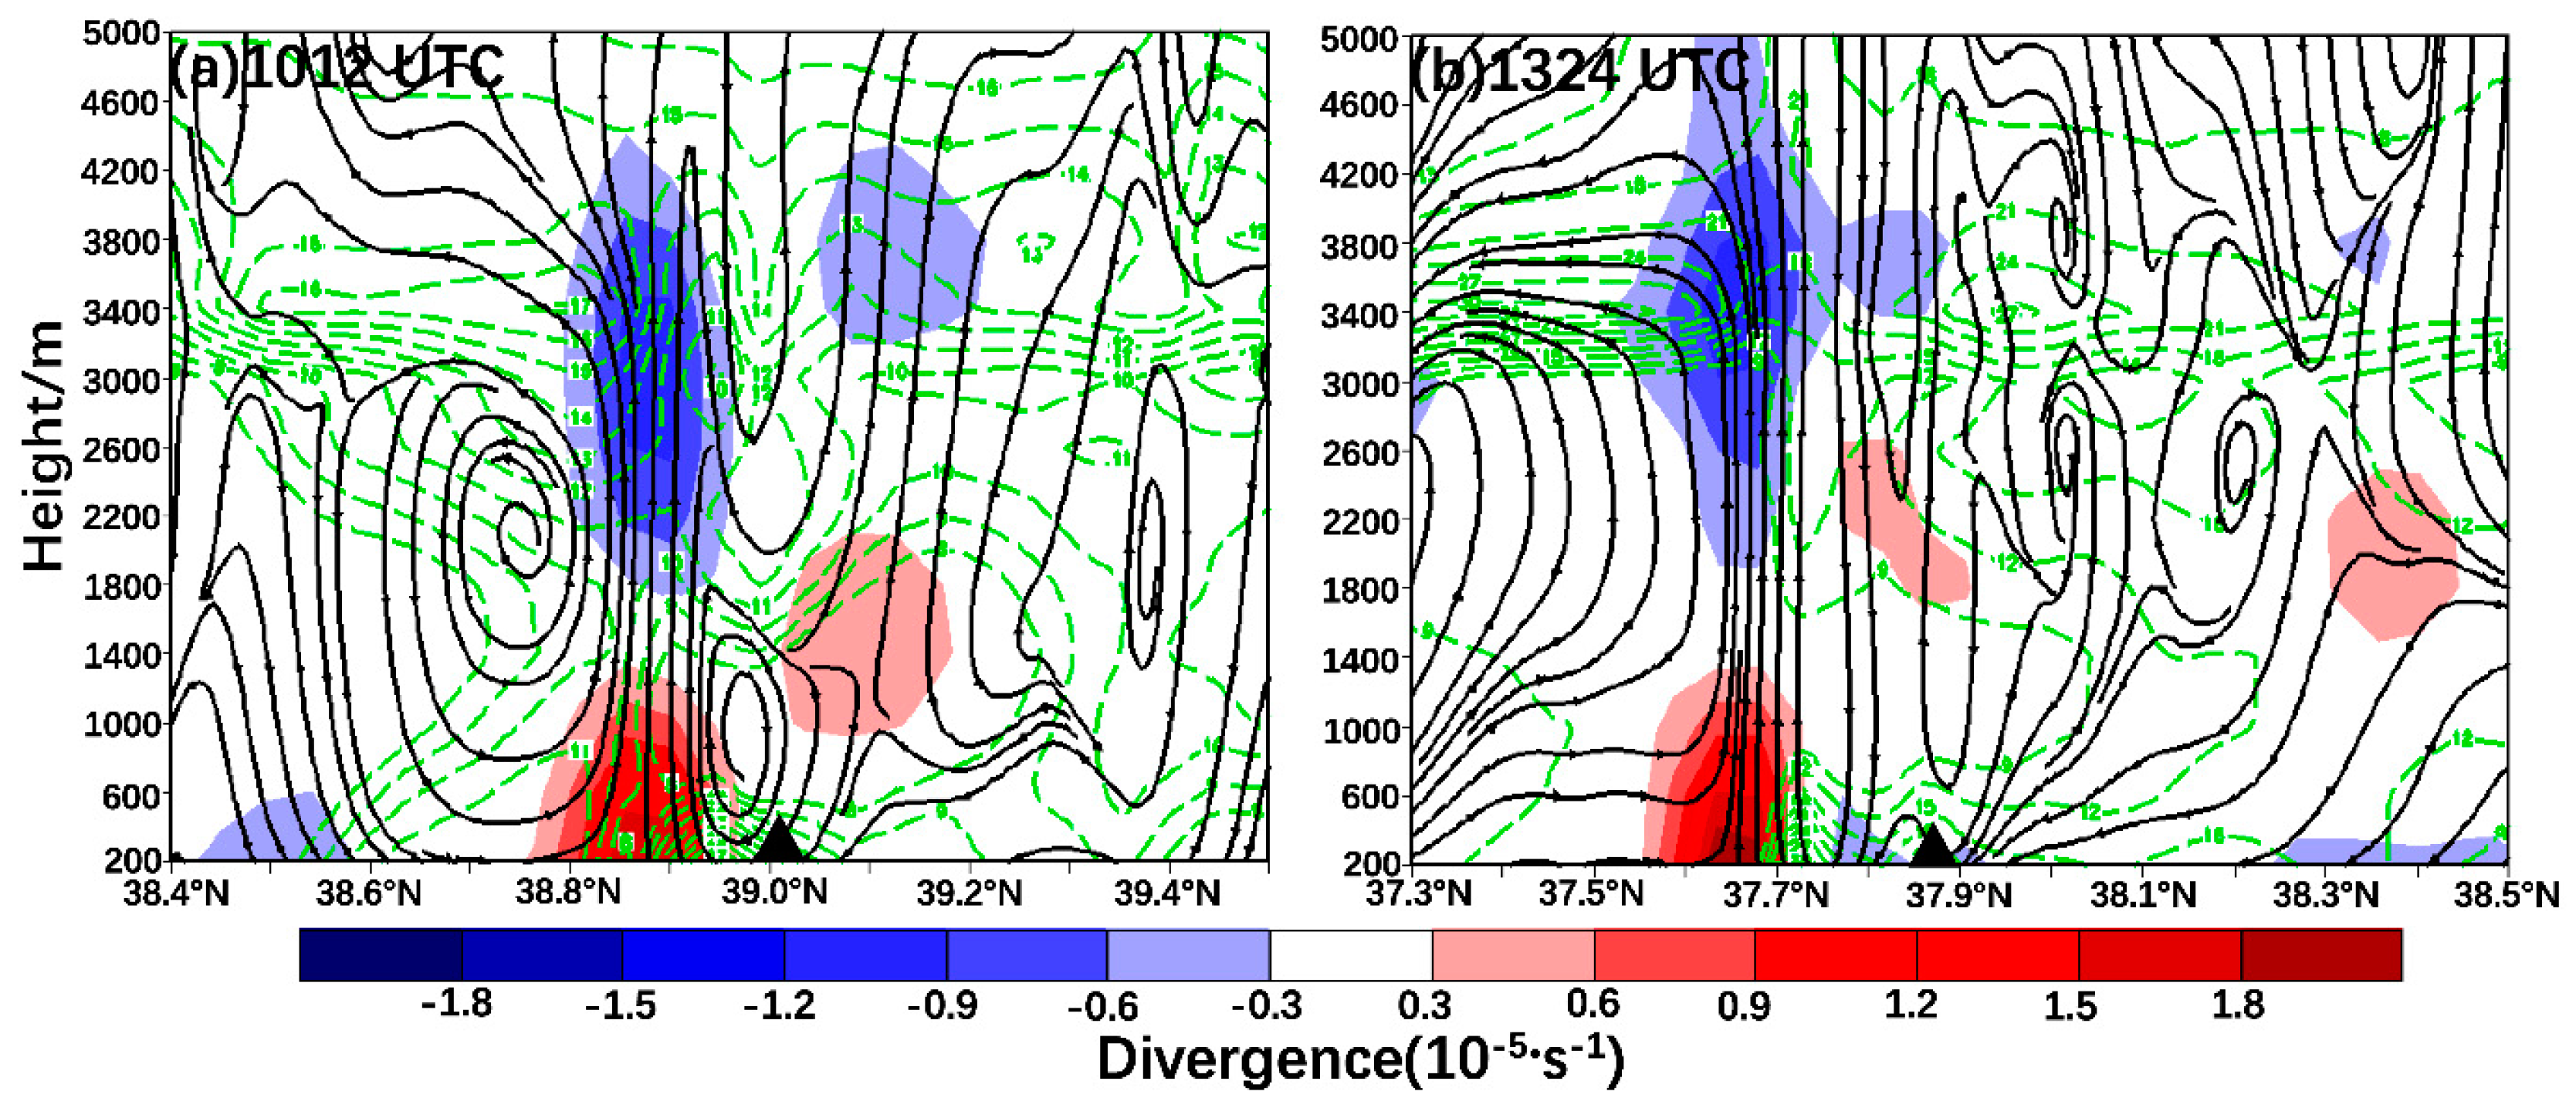
Figure 10 shows a vertical profile of the horizontal wind speed, divergence and V-W composite fields along the dashed line (i.e., the location of the GFs in
Figure 9). RGF exhibits opposite characteristics with the divergence below 0.6 km and convergence over 0.6 km. The descending motion and ascending motion on the rear of RGF constitute a vertical circulation. The extending height of the ascending branch reached about 1.8 km, which coincides well with the maximum height of development (1.7 km) observed by Doppler weather radar (figure omitted). The maximum ascending speed at the leading edge of RGF is 1.8 m·s
-1(
Figure 9a). The maximum horizontal wind speed at the height of 0.2 km around the rear of the RGF reaches 18 m·s
-1, basically equal to the maximum gust speed on the surface caused by it. The convergence in RGF is noticeably weaker than that in FGF, which is consistent with a comparatively weaker southwesterly environmental flow as well as the presence of cold pools and weaker outflow. The diminished outflow and its associated weakened convergence elucidate why the thunderstorm parent in RGF dissipated upon crossing BSB, whereas the thunderstorm parent in FGF intensified during its passage over BSB.
The disturbance temperature gradient reached a maximum value of 30–32 ℃·(10km)
-1, which located at the front right along the moving direction of FGF (
Figure 9b). The large-value zone of disturbance temperature gradient corresponds well with its vertical speed and wind speed. The FGF shows the convergent feature in all layers (
Figure 10b). The descending and ascending motion on the rear front constitute a vertical circulation, and the ascending branch extends up to a height around 2.6 km. The maximum ascending speed at the leading edge of FGF is 2.4 m·s
-1(
Figure 9b), whereas it is stronger in RGF. This difference corresponds to the intensity of the GFs that are significantly different. The maximum horizontal wind speed at the height of 0.2 km is 27 m·s
-1, slightly stronger than the maximum gust speed observed on the ground (24.9 m·s
-1). Provod et al. [
35] showed that the intensity of the cold pool is consistent with that of the ground gale. The difference between the intensity of the two thunderstorm gales also confirm that, the intensity of the cold pool after FGF (11.4 ℃), which is larger than that after RGF (6.9 ℃), produces a stronger thunderstorm gale eventually.
5.3. Depth of Cold Pools
The depth, size, and intensity of cold pools are contingent upon the environmental properties and downdrafts that nourish them. Conversely, the characteristics of downdrafts rely on both the environment and the attributes of associated updrafts. The idealized numerical modeling conducted by Marion and Trapp [
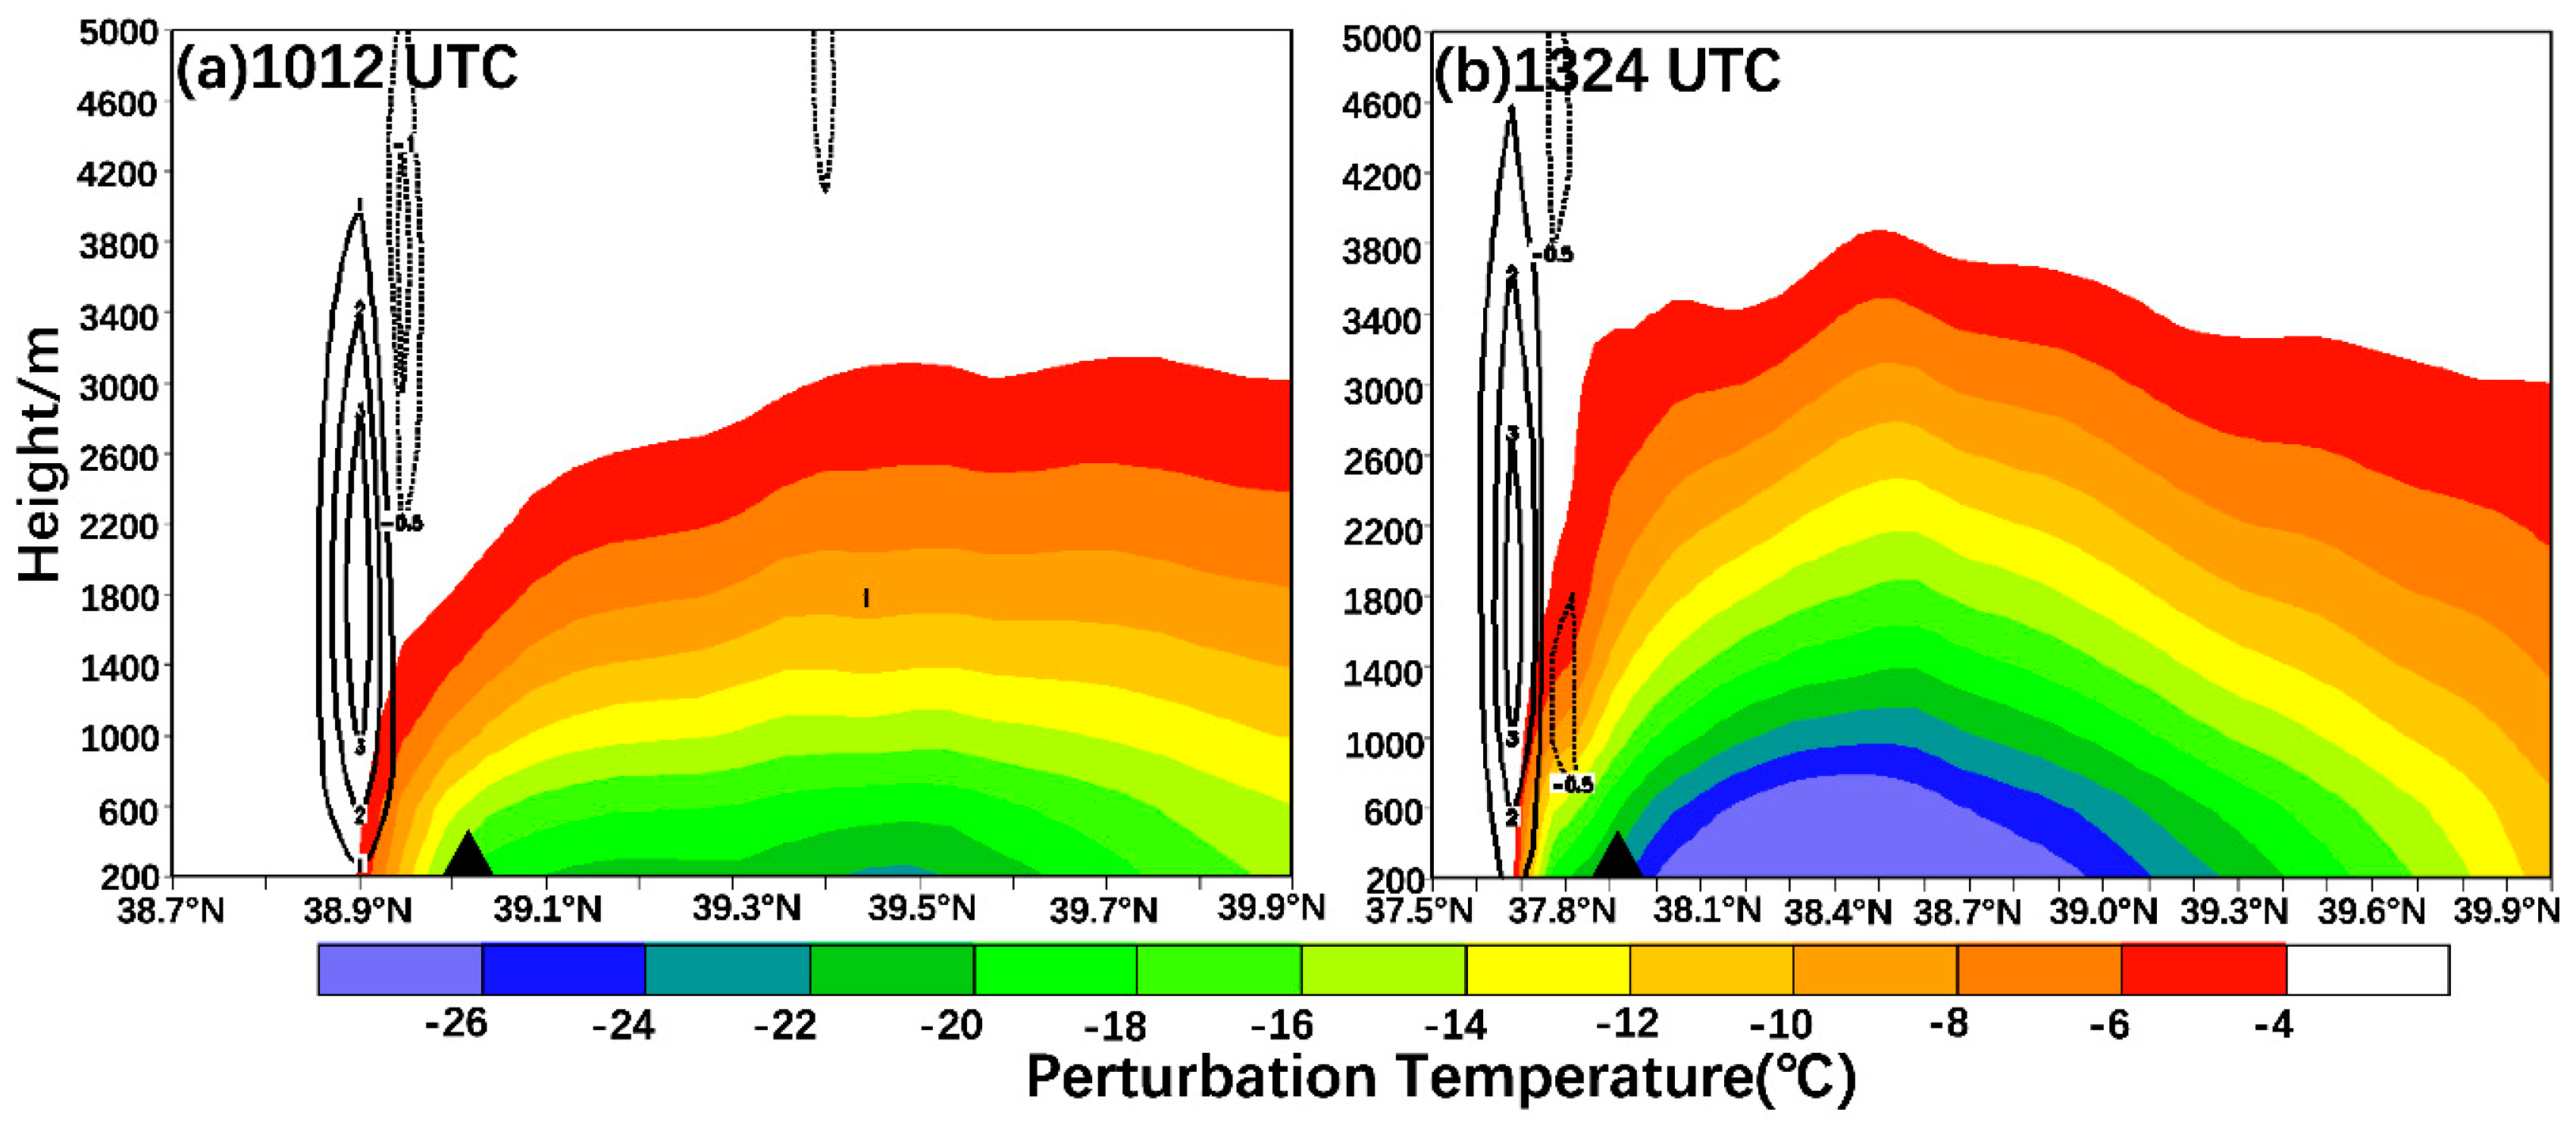
57] suggests a strong correlation between the depth of the cold pool and the widths of updrafts and downdrafts in supercell thunderstorms and their environments. These dimensions are ultimately governed by various storm-related factors, including CAPE, vertical wind shear, and mixed-layer depth. To identify these differences in the cold pool depth and vertical motion for the two types of GFs, the temperature perturbations of <-18 ℃ at the lower level is shown in
Figure 11. The FGF parent thunderstorm generates a significantly deeper cold pool compared to the RGF (0.6 km for RGF and 1.6 km for FGF). The divergence in cold pool characteristics between the two types of GFs is also evident from the variability observed in surface temperature (
Figure 6). The convection-induced downdraft in FGF is attributed to the strong dry and cold northwesterly inflow, resulting in a cold pool that resembles the typical vertical structure of GF [
13,
56]. In comparison, RGF exhibits much weaker updraft and downdraft (
Figure 11), leading to a shallower and weaker cold pool.
5.4. Propagation Speed of Cold Pools
The above analyses suggest that the dynamics of cold pools may play a crucial role in the evolution of the FGF and RGF. Richter et al. [
4] emphasized that when the outflow from a cold pool interacts with the ground, it accelerates outward into less dense ambient air, exhibiting characteristics similar to those of a spreading gravity current. Hutson et al. [
58] employed a numerical model to quantify the correlation between outflow thermodynamic deficit and gust front structure, revealing that in a sheared flow, the edge of a strong cold pool was less inclined than that of a weaker cold pool. Furthermore, a cold pool in weak ambient shear exhibited a steeper slope compared to the same cold pool in stronger shear.
The propagation speed of GFs is primarily determined by the cold pool depth H and density difference
compared to ambient air. This behavior aligns with both theoretical predictions for gravity currents and Benjamin’s derived propagation speed for cold pool boundaries [
59]:
where
is the density of the cold pool air,
is the pressure difference. According to Equation (1), the propagation speed of RGF and FGF were show in
Figure 12. The propagation speed of RGF is the value of 19.46 m·s-1 at 1030 UTC, about 7 minutes after the onset of surface destructive wind. Whereas the speed of FGF at 1330 UTC shows the peak speed of 31.04 m·s-1(
Figure 12b). Both of the propagation speed of GFs were exceed to the surface destructive wind. This contradicts several studies that have demonstrated the maximum wind gust was larger than GF propagation speed [
13,
17,
56]. These findings suggest that the downdraft decelerates near the ground as it interacts with the cold pool, indicating that the theoretical propagation speed of the cold pool in
Figure 12 overestimates realistic surface winds.
The RKW88 [
26] theory addresses the interaction between cold pool and shear, elucidating how shear influences the transformation of transient thunderstorms into a persistent line of cells. The RKW “optimal” state is envisioned when C/∆u approaches 1 (∆u represents the magnitude of low-level ambient vertical wind shear), ensuring an upright configuration for the system and generating maximum lifting at the leading edge of the cold pool (Weisman and Rotunno [
60]). The time series of vertical wind shear between 0-3 km AGL across Xiqing and Huanghua station are shown as curve in
Figure 12. The
of RGF is 0.46 at 1000 UTC, which means the thunderstorm tilt in a downshear direction to the ambient shear accordingly the convective cell along the leading edge of FGF is comparatively shallow. After the cold pool has developed quickly, its propagation speed counter with the low-level shear at 1020 UTC, which is a closer match to the time of the surface gust (1023 UTC). The cold pool reached a state where
, indicating that the circulation associated with the cold pool surpassed that of the low-level shear, resulting in the displacement of the thunderstorm and its cooling zone rearward. This finding aligns with modeling results from RKW88 [
26], which suggest that when the low-level shear across the depth of the cold pool is significantly lower than the speed of RGF propagation, similar dynamics occur. The fact that RGF was propagating away from the parent convection (figure omitted) indicates that the shear and speed of cold pool deviate significantly from RKW88’s optimal conditions for convectively coupled circulations. In the case of RGF, a reduced vertical wind shear may be necessary to enhance deep ascent along the leading edge of the elevated cold pool, although shear likely still plays a role in this ascent mechanism.
For FGF,
was ~2.1 at 1300 UTC, falling within the range of values indicative of upright convection, which exceeded the theoretical optimal balance proposed by Weisman and Rotunno [
60] by a factor of two. This ratio decreased to 1.1 at 1330 UTC (
Figure 12b), approaching the proposed optimal balance, indicating favorable conditions for supporting an upright convective process. The vertical wind shear in the 0-3 km layer was measured at 29.2 m·s-1 during the occurrence of FGF gust, which was significantly higher than that observed for RGF.
The helictiy concept is based on the utilization of streamwise and crosswise vorticity to characterize the rotational character of a quasi-steady propagating updraft (Davies-Jones [
61]). A study of the linearized vertical vorticity equation in an ambient vertically sheared environment reveals that when an updraft propagates parallel to the mean shear vector, it will exhibit a mid-level vortex couplet, resulting in negligible net rotation. However, if the updraft propagates perpendicular to the mean vertical wind shear vector, it will display a preferred direction of rotation. Davies-Jones [
61] derived this correlation analytically, based on a linear analysis of the equations of motion. The measure of this predicted correlation is commonly referred to as storm-relative environmental helicity (SREH), which quantifies twice the area enclosed by the hodograph and the storm-relative wind vectors, extending from the surface up to a specified height above it [usually 3 km AGL; Davies-Jones [
61]].
SREH gives a potential for rotational characteristics of convective storms (Davies-Jones [
61]), and is defined as
Where V is the environment wind vector, C is the storm motion vector, h is an assumed inflow depth, and k is a unit vertical vector.
Furthermore, the right-hand side of Eq. (2) can be written as follows (Marion and Trapp [
57])
Where
is the environment wind of each level,
is the storm motion vector. We adopt h≈3 km for the storm inflow come from low-level. We would estimated SERH according to VDRAS data of Xiqing and Huanghua station. This was done using an estimated storm motion. It was decided to estimate mean storm motion at 75% of the mean profile radar speed and at 30° to the right of the mean profile radar wind direction (Maddox [
62]).
Time-height cross sections of SREH are shown in
Figure 12 and clearly illustrate two GFs passage. After 1006 UTC, SREH in RGF gradually increased with and exceed 164 m2·s-2 at 1018 UTC (
Figure 12a). However, from 1300 UTC to 1318 UTC, SREH in FGF rapidly increased from 100 m2·s-2 to 440 m2·s-2(
Figure 12b). The differences in SHER between RGF and FGF are strongly correlated with the intensity of low-level vertical shear, as well as the enhanced propagation speed of cold pool, which are associated with the structural characteristics of GFs in the boundary and lower troposphere. Consequently, larger low-level vertical shear and faster cold pool density flow resulting in increased SREH.
6. Summery and Concluding Remarks
On 10 June 2016, destructive wind that occurred at the north coast of China was associated with a rearward gust front (RGF, 8 grade gale appeared after passing GF) and a frontward gust front (FGF, 10 grade gale appeared before passing GF) along CCs, which induced agriculture and port transportation economic losses in BSB, North China. By using multiple observation data and VDRAS data, we found that the intensity of GFs increased with cold pool strength, depth and propagation speed.
Of particular significances is that the configuration of cold pool and low-level vertical shear have large impact on the structure and strength of GFs. The FGF gale, in which cold pool counter with low-level vertical shear, has a deeper structure and stronger destructive wind. On the other hand, the RGF gale, in which cold pool smaller than low-level vertical shear, has a relatively shallower structure and weaker destructive wind. The MVs are generated just along the leading edge of GFs. However, some differences are evident as the strength and depth of the vertical wind shear increases, including a stronger, deeper and more upright thunderstorm and a closer inherent correlation between the MVs and GFs. Due to the enhancement of MVs, strong low-level convergence and updraft along FGF coordinate with the enhancement of cold pool, aggravated low-layer instability and rotation, which induced stronger horizontal vorticity, finally leading to the rapid strengthening of convective storm and surface gust.
Additionally, the conceptual model should be explored to deepen our understanding of these two types of GFs.
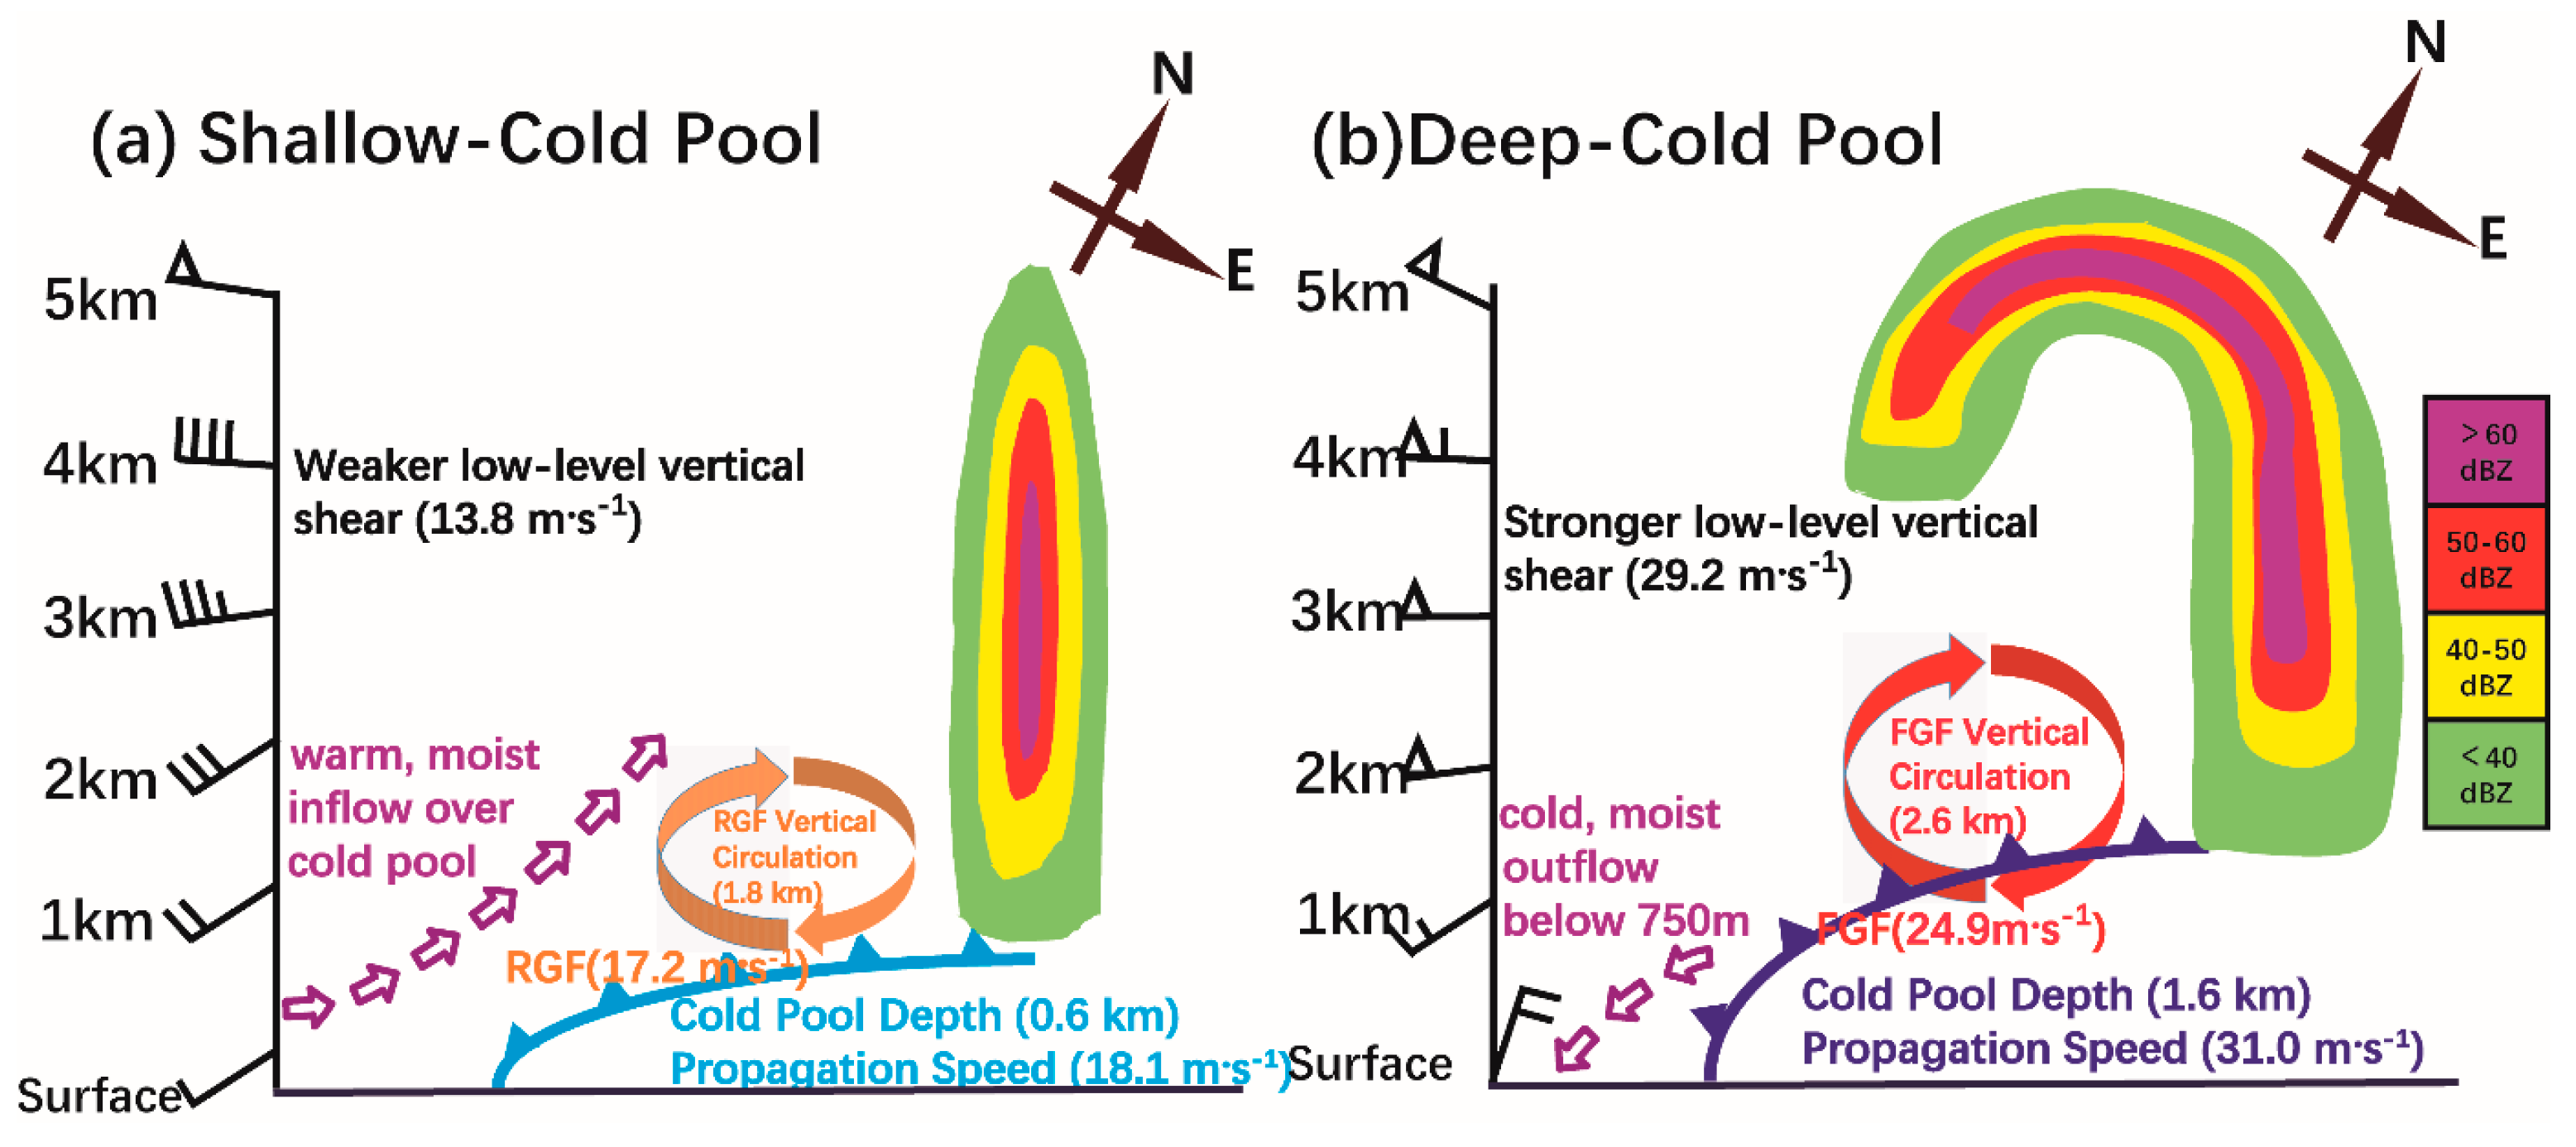
Figure 13 shows conceptual model of vertical structure and cold pool of RGF and FGF. By comparing the structure of these two GFs (
Table 1), it can be seen that the extension height of RGF vertical circulation is about 1.8 km (
Figure 13a). The destructive wind appears 5 min after the passage of RGF, which is caused by the discontinuous interfaces in the horizontal and vertical directions where the density flow consists of pressure and temperature gradients exist, results from the descending strong cold air and warm-humid air near the surface. Nevertheless, the extending height of FGF vertical circulation is reaching 2.6 km (
Figure 13b). The shallower and weaker cold pool of RGF leads to a correspondingly weaker outflow and downdraft, while the stronger wind and vertical shear of FGF generate more robust and organized downdrafts, resulting in a deeper cold pool with its associated large outflow. This enhanced outflow subsequently induces larger downdrafts ahead of the cold pool, thereby elucidating the formation of a more intense surface gale. The maximum descending speed of FGF in the boundary layer is higher in comparison with RGF, as well as the speed of gale. These results indicated that the downdraft forcing for FGF is stronger than that for RGF, and FGF have a more deepener structure and larger SREH than RGF, resulting in the stronger thunderstorm gale.
Both RGF and FGF gales occur under the same large circulation, while the sequences of gale and GF are obviously different, which brings uncertainty to the now-casting and early warning, leading to difficulties in the forecast operation. Similarities and differences can be found in the two GFs, each with its unique characteristics. On one hand, it reflects the diversity of GF gales. On the other hand, it has a question of “which one occurs first?” Whether the thunderstorm gale is caused by the GF or the GF is caused by the thunderstorm gale (including the downdraft), needs to be studied in a greater detail.
Finally, the results from this study suggest that the strength, depth, and propagation speed of cold pool are influenced by a multitude of multiscale processes, which pose challenges for simultaneous observation using existing platforms. Therefore, it is imperative to conduct more idealized numerical simulations in order to investigate the development of cold pools in diverse environments. Additionally, since hydrometeor evaporation plays a significant role in driving cold pool formation, enhancing the representation of microphysics in models would also be advantageous. As our comprehension regarding the adverse and beneficial feedbacks induced by outflow boundary (i.e. gust front) improves, undoubtedly our ability to forecast storm and GF intensity will also enhance.
Author Contributions
Conceptualization, C.X. and X.X.; methodology, X.X.; software, X.X.; validation, X.X.; formal analysis, C.X.; data curation, X.X.; writing-original draft preparation, C.X.; writing-review and editing, C.X. and X.X.; visualization, X.X.; supervision, C.X. and X.X. All authors have read and agreed to the published version of the manuscript.
Funding
The work was jointly supported by the Key Laboratory of Urban Meteorology, China Meteorological Administration, Beijing (LUM-2023-11), Open Research Fund for The Institute of Atmospheric Environment, China Meteorological Administration, Shenyangy (2023SYIAEKFMS05) and Beijing Natural Science Foundation (8212026).
Data Availability Statement
References
- Wilson, J. W.; Roberts, R. D. Lake Victoria thunderstorms: radar-observed initiation and storm evolution modes. Mon. Wea. Rev. 2022, 150, 2485-2502. [CrossRef]
- Ma, R. Y.; Sun, J. H.; Yang X. L. A 7-yr climatology of the initiation, decay, and morphology of severe convective storms during the warm season over North China. Mon. Wea. Rev. 2021, 149, 2599-2612. [CrossRef]
- Hurlbut, M.; Cohen, A. Environments of northeast U.S. severe thunderstorm events from 1999 to 2009. Wea. Forecasting. 2014, 29, 3-22. [CrossRef]
- Richter, H.; Peter, J.; Collis, S. Analysis of a destructive wind storm on 16 November 2008 in Brisbane, Australia. Mon. Wea. Rev. 2014, 142, 3038-3060. [CrossRef]
- Fritsch, J. M.; Vislocky, R. L. Enhanced depiction of surface weather features. Bull. Amer. Meteor. Soc. 1996, 77, 491-506. [CrossRef]
- Bai, L.Q.; Meng, Z. Y.; Huang, Y., Zhang, Y.; Niu, S.; Su, T. Convection initiation resulting from the interaction between a quasi-stationary dryline and intersecting gust fronts: A case study. J. Geophys. Res. Atmos. 2019, 124, 2379-2396. [CrossRef]
- Cui, X.Y.; Chen, M.X.; Qin, R.; Li, C.; Han L. The roles of surface convergence line and upper-level forcing on convection initiation ahead of a gust front: A case study. J. Geophys. Res. Atmos. 2023, 128, e2022JD036921. [CrossRef]
- Knupp, K.R. Observational analysis of a gust front to bore to solitary wave transition within an evolving nocturnal boundary layer. J. Atmos. Sci. 2006, 63, 2016-2035. [CrossRef]
- Marsham, J. H.; Parker, D. J. Secondary initiation of multiple bands of cumulonimbus over southern Britain. Ⅱ: Dynamics of secondary initiation. Quart. J. Roy. Meteor. Soc. 2006, 132, 1053-1072. [CrossRef]
- Friedrich, K.; Kingsmill, D. E.; Young, C. R. Misocyclone characteristics along Florida gust fronts during CaPE. Mon. Wea. Rev. 2005, 133, 3345-3367. [CrossRef]
- Wakimoto, R. M.; Murphey, H.V.; Davis, C.A.; Atkins, N.T. High winds generated by bow echoes. Part Ⅱ: The relationship between the mesovortices and damaging straight-line winds. Mon. Wea. Rev. 2006, 134, 2813-2829. [CrossRef]
- Xu, X.; Xue, M.; Wang, Y. Mesovortices within the 8 May 2009 bow echo over the central United States: Analyses of the characteristics and evolution based on Doppler radar observations and a high-resolution model simulation. Mon. Wea. Rev. 2015, 143, 2266-2290. [CrossRef]
- Goff, R. C. Vertical structure of thunderstorm outflows. Mon. Wea. Rev. 1976, 104, 1429-1440. [CrossRef]
- Fujita, T. T. Tornadoes and downbursts in the context of generalized planetary scales. J. Atmos. Sci. 1981, 38, 1511-1534. [CrossRef]
- Lompar, M.; Ćurić, M.; Romanic, D. Implementation of a gust front head collapse scheme in the WRF numerical model. Atmos. Res. 2018, 203, 231-245. [CrossRef]
- Luchetti, N.T.; Friedrich, K.; Rodell, C.E.; Lundquist, J.K. Characterizing thunderstorm gust fronts near complex terrain. Mon. Wea. Rev. 2020a, 148, 3267-3286. [CrossRef]
- Luchetti, N.T.; Friedrich, K.; Rodell, C.E. Evaluating thunderstorm gust fronts in New Mexico and Arizona. Mon. Wea. Rev. 2020b, 148, 4943-4956. [CrossRef]
- Wakimoto, R. M. The life cycle of thunderstorm gust fronts as viewed with Doppler radar and rawinsonde data. Mon. Wea. Rev. 1982, 110, 1060-1082. [CrossRef]
- Klingle, D.L.; Smith, D. R.; Wolfson, M.M. Gust front characteristics as detected by Doppler radar. Mon. Wea. Rev. 1987, 115, 905-918. [CrossRef]
- Harrison, S. J.; Mecikalski, J. R.; Knupp, K. R. Analysis of outflow boundary collisions in north-central Alabama. Wea. Forecasting. 2009, 24, 1680–1690. [CrossRef]
- Karan, H.; Knupp, K. Radar and profiler analysis of colliding boundaries: A case study. Mon. Wea. Rev. 2009, 137, 2203-2222. [CrossRef]
- May, P. T. Thermodynamic and vertical velocity structure of two gust fronts observed with a wind Profile/RASS during MCTEX. Mon. Wea. Rev. 1999, 127, 1796-1807. [CrossRef]
- Cotton, W.R.; Bryan, G.; Van den Heever, S.C. Storm and cloud dynamics (Vol.99). 2011, Academic press. 820pp.
- Martner, B. E. Vertical velocities in a thunderstorm gust front and outflow. J. Appl. Meteor. 1997, 36, 615-622. [CrossRef]
- Thorpe, A.J.; Miller, M.J.; Moncrieff, M.W. Two-dimensional convection in non-constant shear: A model of midlatitude squall lines. Quart. J. Roy. Meteor. Soc. 1982, 108, 739-762. [CrossRef]
- Rotunno, R.; Klemp, J.B.; Weisman, M.L. A theory for strong, long-lived squall lines. J.Atmos.Sci. 1988, 45, 463-485. [CrossRef]
- Weisman, M.L.; Klemp, J.B.; Rotunno, R. Structure and evolution of numerically simulated squall lines. J.Atmos.Sci. 1988, 45, 1900-2013. [CrossRef]
- Weisman, M.L.; Rotunno, R. The use of vertical wind shear versus helicity in interpreting supercell dynamics. J.Atmos.Sci. 2000, 57, 1452-1472. [CrossRef]
- Weckwerth, T.M.; Wakimoto, R.M. The initiation and organization of convective cells atop a cold-air outflow boundary. Mon. Wea. Rev. 1992, 120, 2169-2187. [CrossRef]
- Kingsmill, D.E. Convection initiation associated with a sea-breeze front, a gust front, and their collision. Mon. Wea. Rev. 1995, 123, 2913-2933. [CrossRef]
- Weisman, M.L.; Trapp, R.J. Low-level mesovortices within squall lines and bow echoes. Part Ⅰ: Overview and dependence on environmental shear. Mon. Wea. Rev. 2003, 131, 2779-2803. [CrossRef]
- Trapp, R. J.; Weisman, M.L. Low-level mesovortices within squall lines and bow echoes. Part Ⅱ: Their genesis and implications. Mon. Wea. Rev. 2003, 131, 2804-2823. [CrossRef]
- Atkins, N. T.; Laurent, M. St. Bow echo mesovortices. Part Ⅰ: Processes that influence their damaging potential. Mon. Wea. Rev. 2009, 137, 1497-1513. [CrossRef]
- Kirsch, B.; Ament, F.; Hohenegger, C. Convective cold pools in long-term boundary layer mast observations. Mon. Wea. Rev. 2021, 149, 811-820. [CrossRef]
- Provod, M.; Marsham, J.H.; Parker, D.J.; Birch, C.E. A characterization of cold pools in the West African Sahel. Mon. Wea. Rev. 2016, 144, 1923-1934. [CrossRef]
- Parker, M. D. Self-organization and maintenance of simulated nocturnal convective systems from PECAN. Mon. Wea. Rev. 2021, 149, 999-1022. [CrossRef]
- Squitieri, B. J.; Gallus, W. A. On the changes in convection-allowing WRF forecasts of MCS evolution due to decreases in model horizontal and vertical grid spacing. Part Ⅰ: Changes in cold pool evolution. Wea. Forecasting. 2022, 37, 1903-1923. [CrossRef]
- Xue, M. Density currents in shear flows: Effects of rigid lid and cold-pool internal circulation, and application to squall line dynamics. Quart. J. Roy. Meteor. Soc. 2002, 128, 47-73. [CrossRef]
- Borque, P.; Nesbitt, S.W.; Trapp, R.J.; Trapp, S.L.; Que, M. Observational study of the thermodynamics and morphological characteristics of a midlatitude continental cold pool event. Mon. Wea. Rev. 2020, 148, 719-737. [CrossRef]
- Meyer, B.; Haerter, J. O. Mechanical forcing of convection by cold pools: collisions and energy scaling. J. Adv. Model. Earth. SY. 2020, 12, e2020MS002281. [CrossRef]
- Hirt, M.; George, C. C.; Sophia, A. K. S.; Julien, S.; Rieke, H. Cold-pool-driven convective initiation: using causal graph analysis to determine what convection-permitting models are missing. Quart. J. Roy. Meteor. Soc. 2020, 146, 2205-2227. [CrossRef]
- Abulikemu, A.; Wang, Y.; R. X.Gao, Y. Wang, X. Xu, A numerical study of convection initiation associated with a gust front in Bohai Bay region, North China. J. Geophys. Res. Atmos. 2019, 124, 13843-13860. [CrossRef]
- Hersbach, H.; Bell, B.; Berrisford, P.; Hirahara, S.; Horányi, A.; Muñoz-Sabater, J.; et al. The ERA5 global reanalysis. Quart. J. Roy. Meteor. Soc. 2020, 146, 1999-2049. [CrossRef]
- Sun, J.; Crook, N. A. Dynamical and microphysical retrieval from Doppler radar observations using a cloud model and its adjoint. Part Ⅰ: Model development and simulated data experiments. J.Atmos.Sci. 1997, 54, 1642-1661. [CrossRef]
- Sun, J.; Crook, N. A. Dynamical and microphysical retrieval from Doppler radar observations using a cloud model and its adjoint. Part Ⅱ: Retrieval experiments of an observed Florida convective storm. J.Atmos.Sci. 1998, 55, 835-852. [CrossRef]
- Friedrich, K.; Kalina, E. A.; Aikins, J.; Gochis, D.; Rasmussen, R. Precipitation and cloud structures of intense rain during the 2013 Great Colorado Flood. J Hydrometeorol, 2015, 17, 22-27. [CrossRef]
- Tai, S. L.; Liou, Y. C.; Sun, J.; Chang, S. F. The development of a terrain-resolving scheme for the forward model and its adjoint in the four-dimensional Variational Doppler Radar Analysis System (VDRAS). Mon. Wea. Rev. 2016, 145, 289-306. [CrossRef]
- Crook, A.; Sun, J. Analysis and forecasting of the low-level wind during the Sydney 2000 Forecast Demonstration Project. Wea. Forecasting. 2004, 19, 151-167. [CrossRef]
- Sun, J. Z.; Chen, M. X.; Y. C. Wang, A frequent-updating analysis system based on radar, surface, and mesoscale model data for the Beijing 2008 forecast demonstration project. Wea. Forecasting. 2010, 25, 1715-1735. [CrossRef]
- Sun, J. (2006). Convective-scale assimilation for radar data: Progress and challenges. Quart. J. Roy. Meteor. Soc. 2006, 131, 3439-3463. [CrossRef]
- Chen, M. X.; Xiao, X.; Gao, F.; Lei, L.; Wang, Y.C.; Sun, J.Z. A case study and batch verification on high resolution numerical simulations of severe convective events using an analysis system based on rapid-refresh 4-D variational radar data assimilation (in Chinese). Acta Meteor Sinica, 2016, 74, 421-441. [CrossRef]
- Xiao, X.; Sun, J. Z.; Chen, M. X.; Qie, X. S.; Ying, Z. M.; Wang, Y. C.; Ji, L. Comparison of environmental and mesoscale characteristics of two types of mountain-to-plain precipitation systems in the Beijing Region, China. J. Geophys. Res. Atmos. 2019, 124, 6856-6872. [CrossRef]
- Wu, Y.; Sun, J. Z.; Ying, Z.; Xue, L.; Chen, D.; Lin, W. Effects of local-scale orography and urban heat island on the initiation of a record-breaking rainfall event. J. Geophys. Res. Atmos. 2021, 126, e2021JD034839. [CrossRef]
- Zhang, L.N.; Sun, J. Z.; Ying, Z. M.; Xian, X. Initiation and development of a squall line crossing Hangzhou Bay. J. Geophys. Res. Atmos., 2021, 126, e2020JD032504. [CrossRef]
- Xiao, X.; Sun, J.; Ji, L.; Zhang, L.; Ying, Z.; Chen, Z. A study on local-scale thermal and dynamical mechanisms in the initiation of a squall line under weak forcing. Journal of Geophysical Research: Atmospheres, 2022, 127, e2021JD035561. [CrossRef]
- Mahoney, W. P. Gust front characteristics and the kinematics associated with interacting thunderstorm outflows. Mon. Wea. Rev. 1988, 116, 1474-1491. [CrossRef]
- Marion, G. R.; Trapp, R. J. The dynamical coupling of convective updrafts, downdrafts, and cold pools in simulated supercell thunderstorms. J. Geophys. Res. Atmos. 2019, 124, 664-683. [CrossRef]
- Hutson, A.; Weiss, C.; Bryan, G. Using the translation speed and vertical structure of gust fronts to infer buoyancy deficits within thunderstorm outflow. Mon. Wea. Rev. 2019, 147, 3575-3594. [CrossRef]
- Weisman, M.L. The genesis of severe, long-lived bow echoes. J.Atmos.Sci. 1993, 50, 645-670. [CrossRef]
- Weisman, M.L.; Rotunno, R. “A theory for strong long-lived squall lines”revisited. J.Atmos.Sci. 2004, 61, 361-382. [CrossRef]
- Davies-Jones, R.P. Streamwise vorticity: The origin of updraft rotation in supercell storms. J.Atmos.Sci. 1984, 41, 2991-3006. [CrossRef]
- Maddox, R.A. An evaluation of tornado proximity wind and stability data. Mon. Wea. Rev. 1976, 104,133-142. [CrossRef]
Figure 1.
(a) Domain of the North China and terrain heights (shading, unit: m). The solid black rectangle represents the domain of Variational Doppler Radar Assimilation and Analysis System (VDRAS). The estuary in the west of the Bohai Sea is called Bohai Sea Bay (BSB). The six radar sites of the operational China New Generation Radars (CINRAD) network are indicated (+symbols) as: BJ, TJ, SJZ, ZB, CD, and QHD. The black dots represent automatic weather stations (AWSs). (b) Tracking gust fronts and analyzing the spatial distribution of maximum observed gust winds in the Bohai area from 0600-1800 UTC on June 10, 2016. The orange and red lines indicate the tracks of rearward GF (RPG) and frontward GF (FGF), respectively. The orange and red font are the time of RPF and FGF, respectively. TJ: Tianjin Doppler radar. CZ: Cangzhou Doppler radar. “★”denote the position of Xiqing (XQ) and Huanghua (HH) wind profile. “▲” is the position of meteorological tower.
Figure 2.
Synoptic setting at 0900 UTC 10 June 2016.
Figure 2.
Synoptic setting at 0900 UTC 10 June 2016.
Figure 3.
Skew T-logp diagram over Huanghua station at 0000 UTC (a) and 0900 UTC on 10 June 2016. T (red solid line, unit: ℃), T
d (blue solid line, unit: ℃), parcel T (black solid line, unit: ℃) and wind (barb, unit: m·s
-1). The location of the sounding is marked in
Figure 2.
Figure 3.
Skew T-logp diagram over Huanghua station at 0000 UTC (a) and 0900 UTC on 10 June 2016. T (red solid line, unit: ℃), T
d (blue solid line, unit: ℃), parcel T (black solid line, unit: ℃) and wind (barb, unit: m·s
-1). The location of the sounding is marked in
Figure 2.
Figure 4.
(a) Base reflectivity factors at an elevation of 1.5° in Tianjin (dBZ; shaded) on 1024 UTC June 10, 2016. (b) Base reflectivity factors at an elevation of 1.5° in Canghzou (dBZ; shaded) on 1024 UTC June 10, 2016. The color bar shows base reflectivity values in dBZ (The orange and red dashed lines refer to RPG and FGF, respectively.).
Figure 5.
Mesoscale surface analysis at 1000 UTC (a) and 1400 UTC (b) 10 Jun 2016. The shaded region and green figure indicate surface temperature and dewpoint temperature difference respectively given in ℃. Orange and red dashed line refers to RGF and FGF respectively.
Figure 5.
Mesoscale surface analysis at 1000 UTC (a) and 1400 UTC (b) 10 Jun 2016. The shaded region and green figure indicate surface temperature and dewpoint temperature difference respectively given in ℃. Orange and red dashed line refers to RGF and FGF respectively.
Figure 6.
Variation of surface pressure, temperature and wind from automatic weather observations on June 10, 2016. (a) Xiqing station, (b) Huanghua station. Orange and red numbers represent the gust wind speed, Orange and red dashed line refer to the time when RGF and FGF passed by, respectively.
Figure 6.
Variation of surface pressure, temperature and wind from automatic weather observations on June 10, 2016. (a) Xiqing station, (b) Huanghua station. Orange and red numbers represent the gust wind speed, Orange and red dashed line refer to the time when RGF and FGF passed by, respectively.
Figure 7.
Surface observation on June 10, 2016. The solid line represents 1h allobar with an interval of 0.5 hPa. The shaded region indicates 1h variable temperature. Orange and red dashed line refers to RGF and FGF respectively.
Figure 7.
Surface observation on June 10, 2016. The solid line represents 1h allobar with an interval of 0.5 hPa. The shaded region indicates 1h variable temperature. Orange and red dashed line refers to RGF and FGF respectively.
Figure 8.
Horizontal wind (vector, unit: m·s-1), vorticity (blue solid, unit: 10-5·s-1) and divergence (shaded, unit: 10-5·s-1, it is positive for convergence and negative for divergence) at a height of 200 meters of VDRAS data on June 10, 2016.
Figure 8.
Horizontal wind (vector, unit: m·s-1), vorticity (blue solid, unit: 10-5·s-1) and divergence (shaded, unit: 10-5·s-1, it is positive for convergence and negative for divergence) at a height of 200 meters of VDRAS data on June 10, 2016.
Figure 9.
Horizontal wind (m·s-1), perturbation temperature gradient (℃· (10km)-1; shaded) at a height of 200 meters and vertical velocity (m·s-1; black contours) at 600 meters of VDRAS data on June 10, 2016.
Figure 9.
Horizontal wind (m·s-1), perturbation temperature gradient (℃· (10km)-1; shaded) at a height of 200 meters and vertical velocity (m·s-1; black contours) at 600 meters of VDRAS data on June 10, 2016.
Figure 10.
Cross sections of horizontal wind speed (green dashed line, unit: m·s-1), divergence (shaded, unit: 10-5·s-1, it is positive for convergence and negative for divergence), V-w (w amplified 50 times) of VDRAS data on June 10, 2016. (a) Along 117.05°E at 1012 UTC. ▲: position of RGF. (b) Along 117.35°E at 1342 UTC. ▲: position of FGF.
Figure 11.
Cross section of perturbation temperature (shaded, unit: ℃), vertical velocity (black line, unit: m·s-1, positive for ascending and negative for descending) of VDRAS data on June 10, 2016. (a) Along 117.05°E at 1012 UTC. ▲: position of RGF. (b) Along 117.35°E at 1342 UTC. ▲: position of FGF.
Figure 12.
Time series of cold pool propagation speed (blue solid, unit: m·s-1), 0-3 km AGL shear wind shear (red solid, unit: m·s-1) and 0-3 km AGL storm-relative environmental helicity (black solid, unit: m2·s-2) during the passage of two GFs. ∆: The time of surface destructive winds.
Figure 12.
Time series of cold pool propagation speed (blue solid, unit: m·s-1), 0-3 km AGL shear wind shear (red solid, unit: m·s-1) and 0-3 km AGL storm-relative environmental helicity (black solid, unit: m2·s-2) during the passage of two GFs. ∆: The time of surface destructive winds.
Figure 13.
Schematic diagrams of the GFs, cold pools and environmental wind for (a) RGF, (b) FGF. The shading corresponds to composite radar reflectivity (dBZ).
Figure 13.
Schematic diagrams of the GFs, cold pools and environmental wind for (a) RGF, (b) FGF. The shading corresponds to composite radar reflectivity (dBZ).
Table 1.
Comparing structure and cold pool characteristics for RGF and FGF.
Table 1.
Comparing structure and cold pool characteristics for RGF and FGF.
| Element features |
RGF |
FGF |
| Representative station |
Xiqing |
Huanghua |
| Gust wind (m·s-1) |
17.2(8 grade) |
24.9(10 grade) |
| Height of vertical circulation (km) |
1.8 |
2.6 |
| Magnitude decrease in temperature (℃) |
6.9 |
4.7 |
| Intensity of gust outflow (m·s-1) |
10∼12 |
20∼24 |
| Depth of cold pools (m) |
600 |
1600 |
| Propagation speed of cold pools (m·s-1) |
18.1 |
31.0 |
| Maximum sinking velocity (m·s-1) |
0.4 |
0.8 |
|
Disclaimer/Publisher’s Note: The statements, opinions and data contained in all publications are solely those of the individual author(s) and contributor(s) and not of MDPI and/or the editor(s). MDPI and/or the editor(s) disclaim responsibility for any injury to people or property resulting from any ideas, methods, instructions or products referred to in the content. |
© 2024 by the authors. Licensee MDPI, Basel, Switzerland. This article is an open access article distributed under the terms and conditions of the Creative Commons Attribution (CC BY) license (http://creativecommons.org/licenses/by/4.0/).
