Submitted:
15 January 2024
Posted:
16 January 2024
You are already at the latest version
Abstract
Keywords:
1. Introduction
2. Materials and Methods
2.1. Preparation of electrolyte solution
2.2. Pretreatment of substrate
2.3. Preparation of composite coatings
2.4. Surface characterization
2.5. Electrochemical measurement
2.6. Microhardness test
2.7. Contact angle text
3. Results and discussion
3.1. Deposition mechanism of nanocomposite coatings
3.2. X-ray diffraction (XRD)
3.3. Surface morphology of composite coatings
3.4. Effect of particle loading on corrosion resistance
3.5. Microhardness test
3.6. Contact angle text
4. Conclusions
Author Contributions
Funding
Institutional Review Board Statement
Informed Consent Statement
Data Availability Statement
Conflicts of Interest
Abbreviations
| LSV | Linear sweep voltammetry |
| EIS | Electrochemical impedance spectroscopy |
| OCP | Open-circuit potential |
| CA | Contact angle |
References
- Zou, Y.; Wang, J.; Zheng, Y. Y. Electrochemical techniques for determining corrosion rate of rusted steel in seawater. Corros. Sci. 2011, 53, 208–216. [Google Scholar] [CrossRef]
- Lin, C. C.; Wang, C. X. Correlation between accelerated corrosion tests and atmospheric corrosion tests on steel. J. Appl. Electrochem. 2005, 35, 837–843. [Google Scholar] [CrossRef]
- Choi, Y. S.; Nesic, S.; Young, D. Effect of impurities on the corrosion behavior of CO2 transmission pipeline steel in supercritical CO2-water environments. Environ. Sci. Technol. 2010, 44, 9233–9238. [Google Scholar] [CrossRef] [PubMed]
- Wang, S.; Du, C.; Li, X.; Liu, Z.; Zhu, M.; Zhang, D. Field corrosion characterization of soil corrosion of X70 pipeline steel in a red clay soil. Prog. Nat. Sci.: Mater. Int. 2015, 25, 242–250. [Google Scholar] [CrossRef]
- Chen, B.; Wu, Q.; Li, J.; Lin, K.; Chen, D.; Zhou, C.; Wu, T.; Luo, X.; Liu, Y. A novel and green method to synthesize a epoxidized biomass eucommia gum as the nanofiller in the epoxy composite coating with excellent anticorrosive performance. Chem. Eng. J. 2020, 379. [Google Scholar] [CrossRef]
- Basavanna, S.; Naik, Y. A. Electrochemical studies of Zn-Ni alloy coatings from acid chloride bath. J. Appl. Electrochem. 2009, 39, 1975–1982. [Google Scholar] [CrossRef]
- Popoola, A. P. I.; Fayomi, O. S. Performance evaluation of zinc deposited mild steel in chloride medium. Int. J. Electrochem. Sci. 2011, 6, 3254–3263. [Google Scholar]
- Elsherief, A. E.; Shoeib, M. A. Characterization of electro-deposited Zn-Ni alloy from an all-chloride solution. Corros. Prev. Control 2003, 50, 25–34. [Google Scholar]
- Amuda, M. O. H.; Subair, O. W.; Obitayo, O. W. Study of optimum conditions for zinc plating on mild steel. Int. J. Eng. Res. Afr. 2010, 2, 31–39. [Google Scholar] [CrossRef]
- Vathsala, K.; Venkatesha, T. V. Zn-ZrO2 nanocomposite coatings: Elecrodeposition and evaluation of corrosion resistance. Appl. Surf. Sci. 2011, 257, 8929–8936. [Google Scholar] [CrossRef]
- Malatji, N.; Popoola, A. P. I.; Fayomi, O. S. I.; Loto, C. A. Multifaceted incorporation of Zn-Al2O3/Cr2O3/SiO2 nanocomposite coatings: anti-corrosion, tribological, and thermal stability. Int. J. Adv. Manuf. Technol. 2016, 82, 1335–1341. [Google Scholar]
- Zhang, P.; Zhao, Y.; Huang, J.; Li, J.; Cao, L.; Liu, J.; Han, G.; Du, W.; Chen, L.; Xiao, L.; Wang, Q.; Yang, Y.; Zhu, S.; Li, W. Enhanced mechanical and wear properties of Ni-W-SiC composite coatings by synergistic influence of micro-nano SiC mixture. Surf. Coat. Technol. 2023, 467. [Google Scholar] [CrossRef]
- Jin, X.; Wang, J.; Wang, S.; Cao, Y.; Fang, A.; Wang, Q.; Gong, J.; Dai, Y. Fabrication of Pb-Co-ZrO2 nanocomposite coatings and correlation of corrosion mechanisms with electronic work functions. Mater. Today Commun. 2023, 37. [Google Scholar] [CrossRef]
- Fustes, J.; Gomes, A.; da Silva Pereira, M. I. Electrodeposition of Zn-TiO2 nanocomposite films-effect of bath composition. J. Solid State Electrochem. 2008, 12, 1435–1443. [Google Scholar] [CrossRef]
- Praveen, B. M.; Venkatesha, T. V. Electrodeposition and properties of Zn-nanosized TiO2 composite coatings. Appl. Surf. Sci. 2008, 254, 2418–2424. [Google Scholar] [CrossRef]
- Zheng, H.-Y.; An, M.-Z. Electrodeposition of Zn-Ni-Al2O3 nanocomposite coatings under ultrasound conditions. J. Alloys Compd. 2008, 459, 548–552. [Google Scholar] [CrossRef]
- Ranganatha, S.; Venkatesha, T. V.; Vathsala, K.; Kumar, M. K. P. Electrochemical studies on Zn/nano-CeO2 electrodeposited composite coatings. Surf. Coat. Technol. 2012, 208, 64–72. [Google Scholar] [CrossRef]
- Blejan, D.; Muresan, L. M. Corrosion behavior of Zn-Ni-Al2O3 nanocomposite coatings obtained by electrodeposition from alkaline electrolytes. Mater. Corros. 2013, 64, 433–438. [Google Scholar] [CrossRef]
- Malatji, N.; Popoola, A. P. I.; Fayomi, O. S. I. The effect of nanoparticulate loading on the fabrication and characterization of multi-doped Zn-Al2O3-Cr2O3 hybrid coatings on mild steel. Int. J. Adv. Manuf. Technol. 2017, 90, 2443–2452. [Google Scholar] [CrossRef]
- Abdulwahab, M.; Fayomi, O. S. I.; Popoola, A. P. I.; Dodo, M. R. In-situ hybrid study of thermal behaviour of Zn-Ni and Zn-Ni-Al2O3 nanocrystallite thin films induced TEA/MEA by electrocodeposition. Results Phys. 2017, 7, 213–215. [Google Scholar] [CrossRef]
- Harvey, T. G. Cerium-based conversion coatings on aluminium alloys: A process review. Corros.Eng.Sci.Technol. 2013, 48, 248–269. [Google Scholar] [CrossRef]
- Xing, S.; Zhu, W.; You, S.; Yu, W.; Jiang, C.; Ji, V. Investigation on microstructure and tribological performances of electrodeposited Ni-W-Y2O3 composite coatings. J. Alloys Compd. 2023, 965. [Google Scholar] [CrossRef]
- Zhang, Y. J.; Wang, Z. X.; Yu, R. P.; Zhao, H. Effect of Adding Y2O3 on Property of Zn Coatings via Pack Cementation. Surf. Eng. Appl. Electrochem. 2023, 59, 192–198. [Google Scholar]
- Li, B.; Li, D.; Zhang, J.; Chen, W.; Zhang, W. Electrodeposition of Ni-W/TiN-Y2O3 nanocrystalline coating and investigation of its surface properties and corrosion resistance. J. Alloys Compd. 2019, 787, 952–962. [Google Scholar] [CrossRef]
- Safavi, M. S.; Tanhaei, M.; Ahmadipour, M. F.; Ghaffari Adli, R.; Mahdavi, S.; Walsh, F. C. Electrodeposited Ni-Co alloy-particle composite coatings: A comprehensive review. Surf. Coat. Technol. 2020, 382. [Google Scholar] [CrossRef]
- Wu, T.; Ma, M.; Ding, K.; Nan, X.; Wang, Z.; Wei, X.; Zhu, X. Effect of Y2O3 nanoparticles on the microstructure and corrosion resistance of electrodeposited Ni-Mo-Y2O3 nanocomposite coatings. Int. J. Electrochem. Sci. 2023, 18. [Google Scholar] [CrossRef]
- Kumar, C. M. P.; Chandrashekarappa, M. P. G.; Kulkarni, R. M.; Pimenov, D. Y.; Giasin, K. The Effect of Zn and Zn-WO3 Composites Nano-Coatings Deposition on Hardness and Corrosion Resistance in Steel Substrate. MATERIALS 2021, 14. [Google Scholar] [CrossRef]
- Jin, W.; Xiao, S.; Kou, Q.; Ding, D.; Zhang, J.; Fang, X.; Ge, C.; Zhong, C.; Zhu, H.; Haarberg, G. M. Preparation of diboride coatings by electrophoretic deposition in nanoparticle-containing molten inorganic salts. Mater. Lett. 2022, 306. [Google Scholar] [CrossRef]
- Bakhit, B.; Akbari, A.; Nasirpouri, F.; Hosseini, M. G. Corrosion resistance of Ni-Co alloy and Ni-Co/SiC nanocomposite coatings electrodeposited by sediment codeposition technique. Appl. Surf. Sci. 2014, 307, 351–359. [Google Scholar] [CrossRef]
- Ridosic, M.; Salicio-Paz, A.; Garcia-Lecina, E.; Zabinski, P.; Zivkovic, L. S.; Bajat, J. B. The effect of the ultrasound agitation and source of ceria particles on the morphology and structure of the Zn-Co-CeO2 composite coatings. J.MATER.RES.TECHNOL. 2021, 13, 1336–1349. [Google Scholar] [CrossRef]
- Liu, Y.; Li, S.; Zhang, J.; Liu, J.; Han, Z.; Ren, L. Corrosion inhibition of biomimetic super-hydrophobic electrodeposition coatings on copper substrate. Corros. Sci. 2015, 94, 190–196. [Google Scholar] [CrossRef]
- He, X.; Song, R. G.; Kong, D. J. Microstructure and corrosion behaviours of composite coatings on S355 offshore steel prepared by laser cladding combined with micro-arc oxidation. Appl. Surf. Sci. 2019, 497. [Google Scholar] [CrossRef]
- Du, Y.; Wang, D.; Si, P.; Wei, L.; Wang, Y.; Yu, B.; Zhang, X.; Ye, S. Electrodeposition of a Ni-P-Ti3C2Tx/MoS2 coating incorporating MoS2 intercalated Ti3C2Tx particles. Surf. Coat. Technol. 2018, 354, 119–125. [Google Scholar] [CrossRef]
- Ren, A.; Kang, M.; Fu, X. Corrosion behaviour of Ni/WC-MoS2 composite coatings prepared by jet electrodeposition with different MoS2 doping concentrations. Appl. Surf. Sci. 2023, 613. [Google Scholar] [CrossRef]
- Ma, Y.; Zhang, Y.; Liu, J.; Ge, Y.; Yan, X.; Sun, Y.; Wu, J.; Zhang, P. GO-modified double-walled polyurea microcapsules/epoxy composites for marine anticorrosive self-healing coating. Mater. Des. 2020, 189. [Google Scholar] [CrossRef]
- Calado, L. M.; Taryba, M. G.; Carmezim, M. J.; Montemor, M. F. Self-healing ceria-modified coating for corrosion protection of AZ31 magnesium alloy. Corros. Sci. 2018, 142, 12–21. [Google Scholar] [CrossRef]
- Cambon, J. B.; Ansart, F.; Bonino, J. P.; Turq, V. Effect of cerium concentration on corrosion resistance and polymerization of hybrid sol-gel coating on martensitic stainless steel. Prog. Org. Coat. 2012, 75, 486–493. [Google Scholar] [CrossRef]
- Della Rovere, C. A.; Alano, J. H.; Silva, R.; Nascente, P. A. P.; Otubo, J.; Kuri, S. E. Characterization of passive films on shape memory stainless steels. Corros. Sci. 2012, 57, 154–161. [Google Scholar] [CrossRef]
- Fayomi, O. S. I.; Abdulwahab, M.; Popoola, A. P. I. Properties evaluation of ternary surfactant-induced Zn-Ni-Al2O3 films on mild steel by electrolytic chemical deposition. J. Ovonic Res. 2013, 9, 123–132. [Google Scholar]
- Tuaweri, T. J.; Wilcox, G. D. Behaviour of Zn-SiO2 electrodeposition in the presence of N,N-dimethyldodecylamine. Surf. Coat. Technol. 2006, 200, 5921–5930. [Google Scholar] [CrossRef]
- Popoola, A. P. I.; Fayomi, O. S. I.; Aigbodion, V. S.; Abdulwahab, M. Surface modification, strengthening effect and electrochemical comparative study of Zn-Al2O3-CeO3 and Zn-TiO2-CeO3 coating on mild steel. Int. J. Adv. Manuf. Technol. 2016, 85, 1419–1427. [Google Scholar] [CrossRef]
- Shen, X.; Sheng, J.; Zhang, Q.; Xu, Q.; Cheng, D. The Corrosion Behavior of Zn/Graphene Oxide Composite Coatings Fabricated by Direct Current Electrodeposition. J. Mater. Eng. Perform. 2018, 27, 3750–3761. [Google Scholar] [CrossRef]
- Alagi, P.; Ghorpade, R.; Choi, Y. J.; Patil, U.; Kim, I.; Baik, J. H.; Hong, S. C. Carbon Dioxide-Based Polyols as Sustainable Feedstock of Thermoplastic Polyurethane for Corrosion-Resistant Metal Coating. ACS Sustainable Chem. Eng. 2017, 5, 3871–3881. [Google Scholar] [CrossRef]
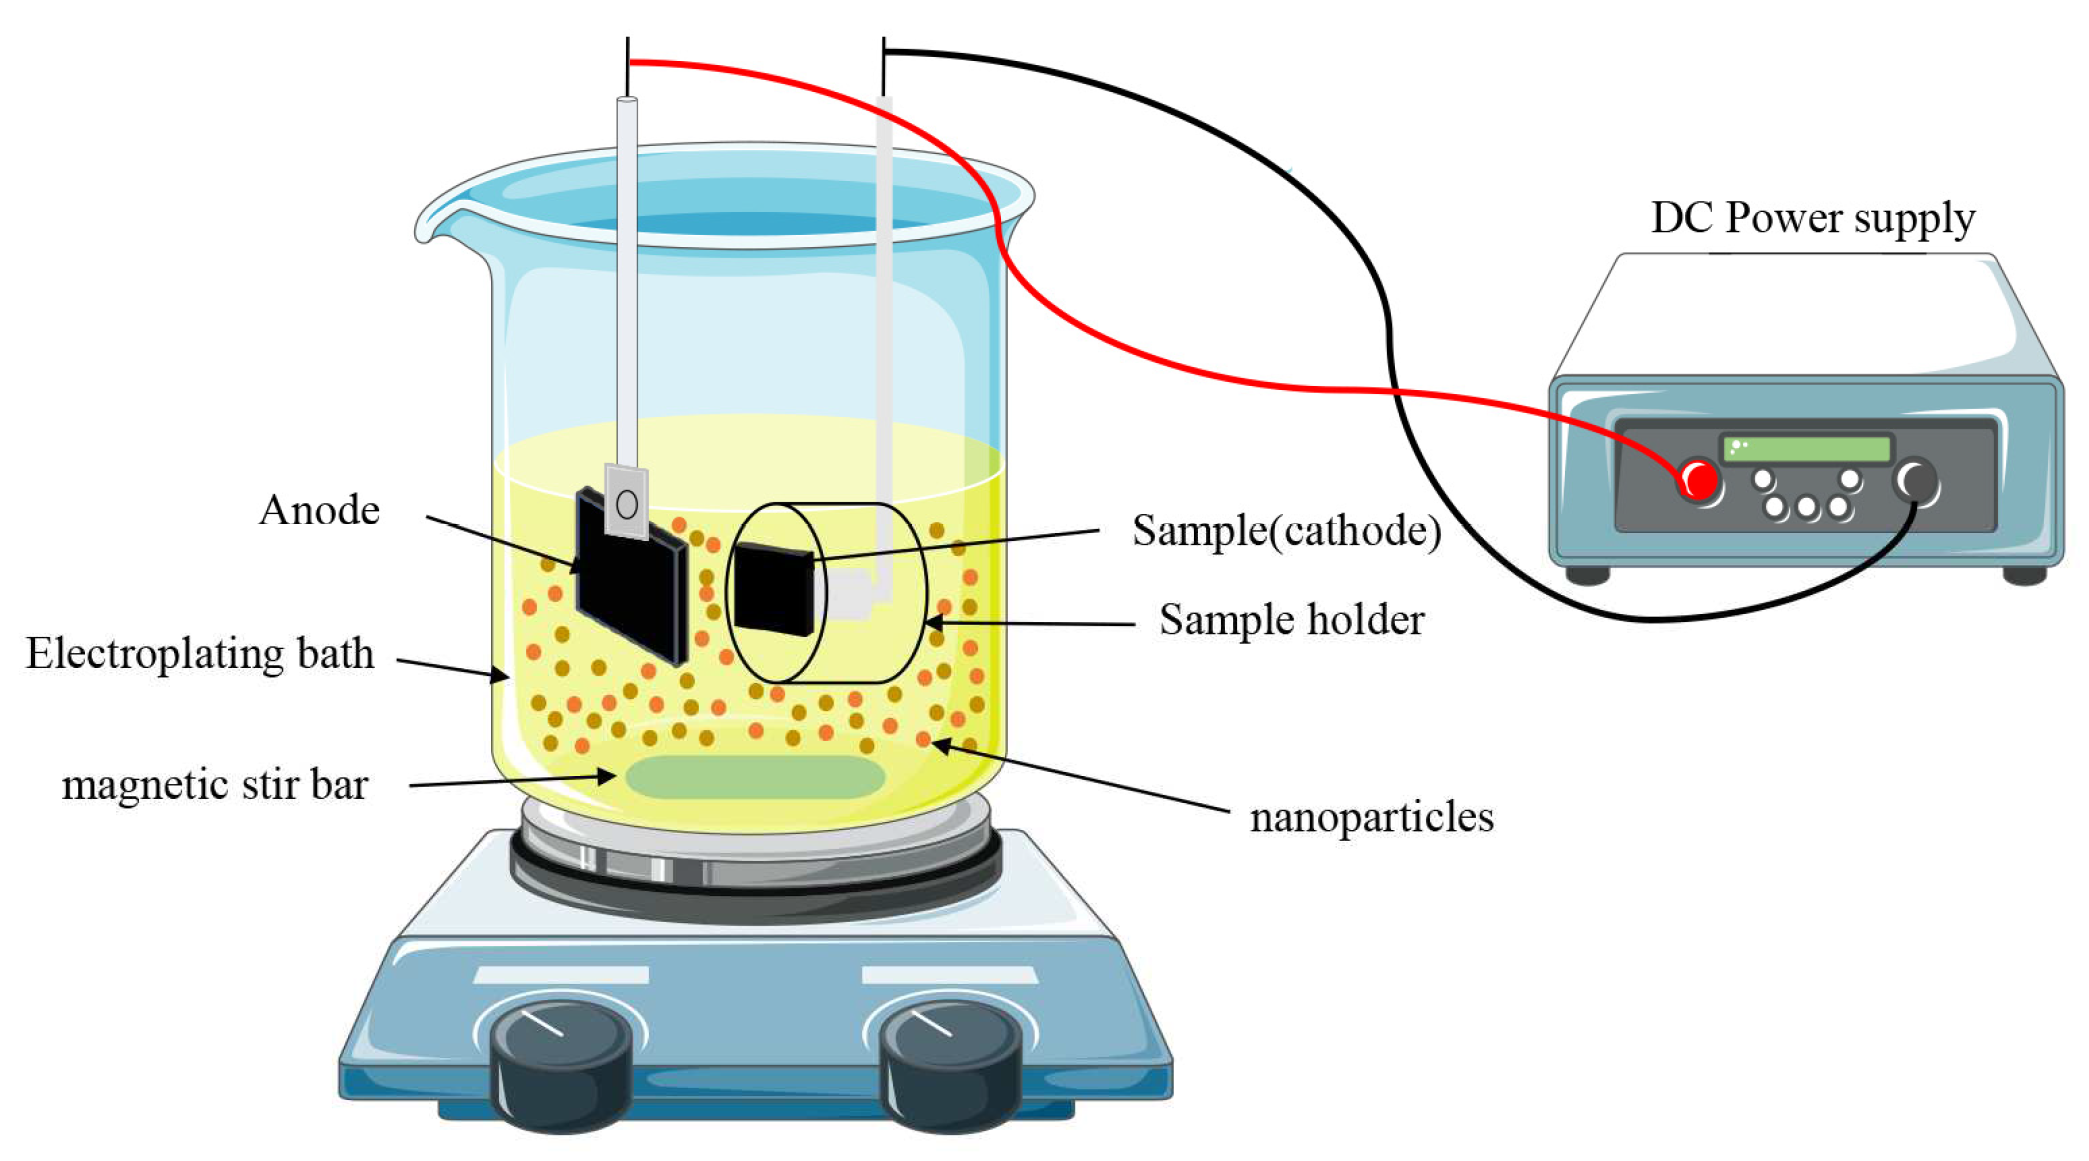
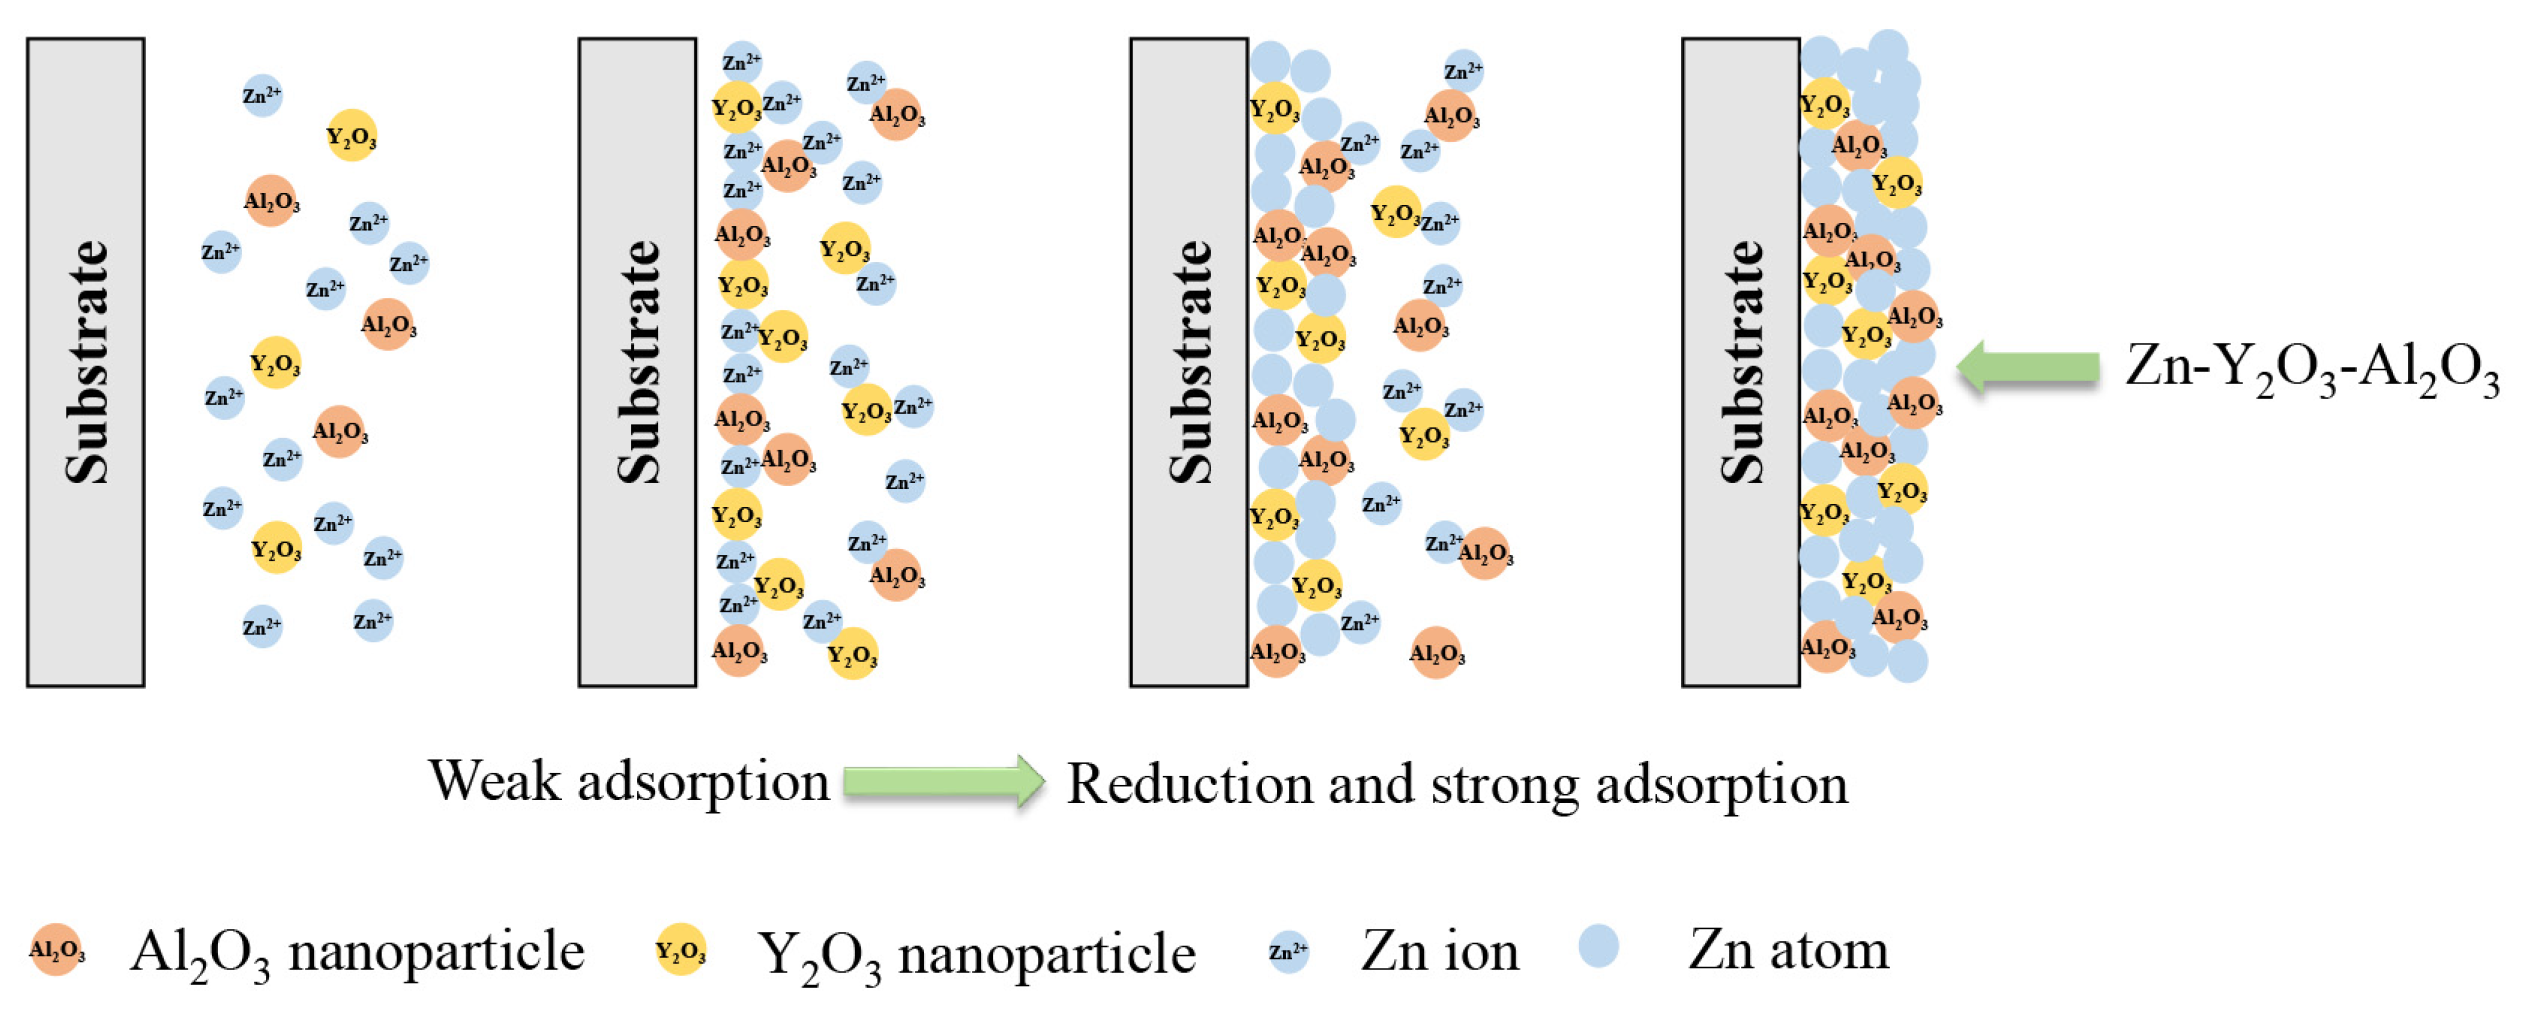
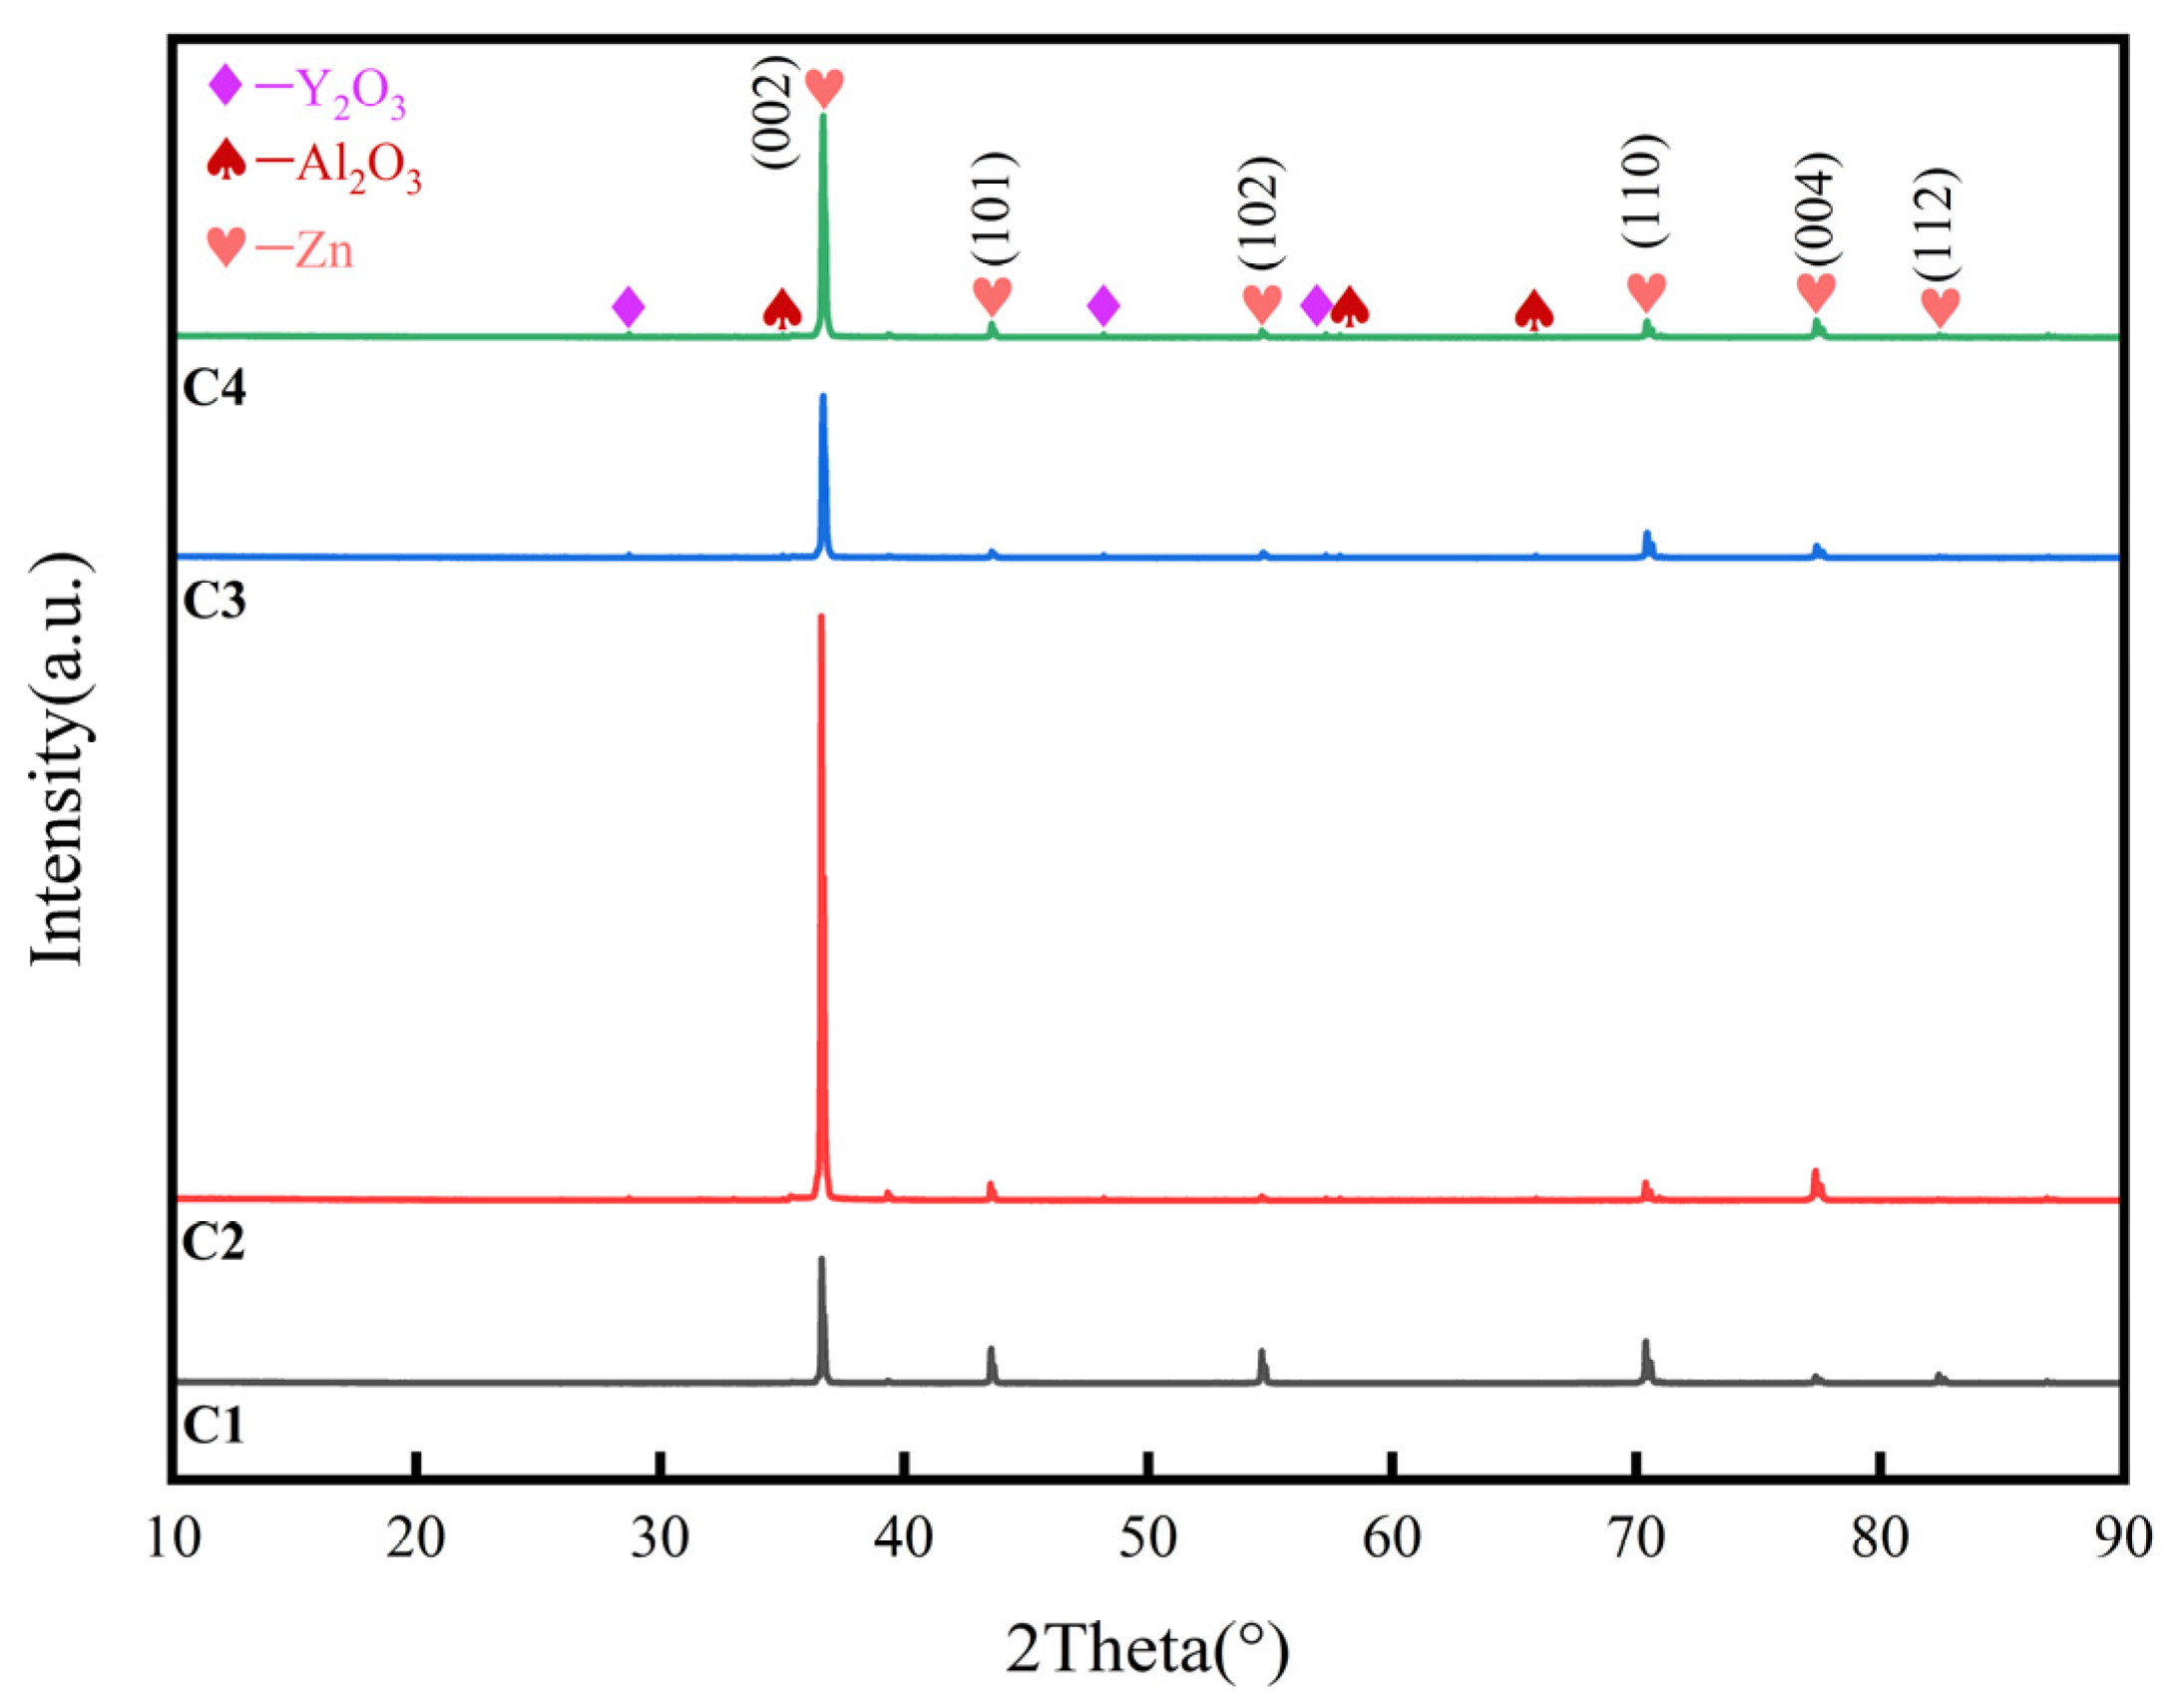
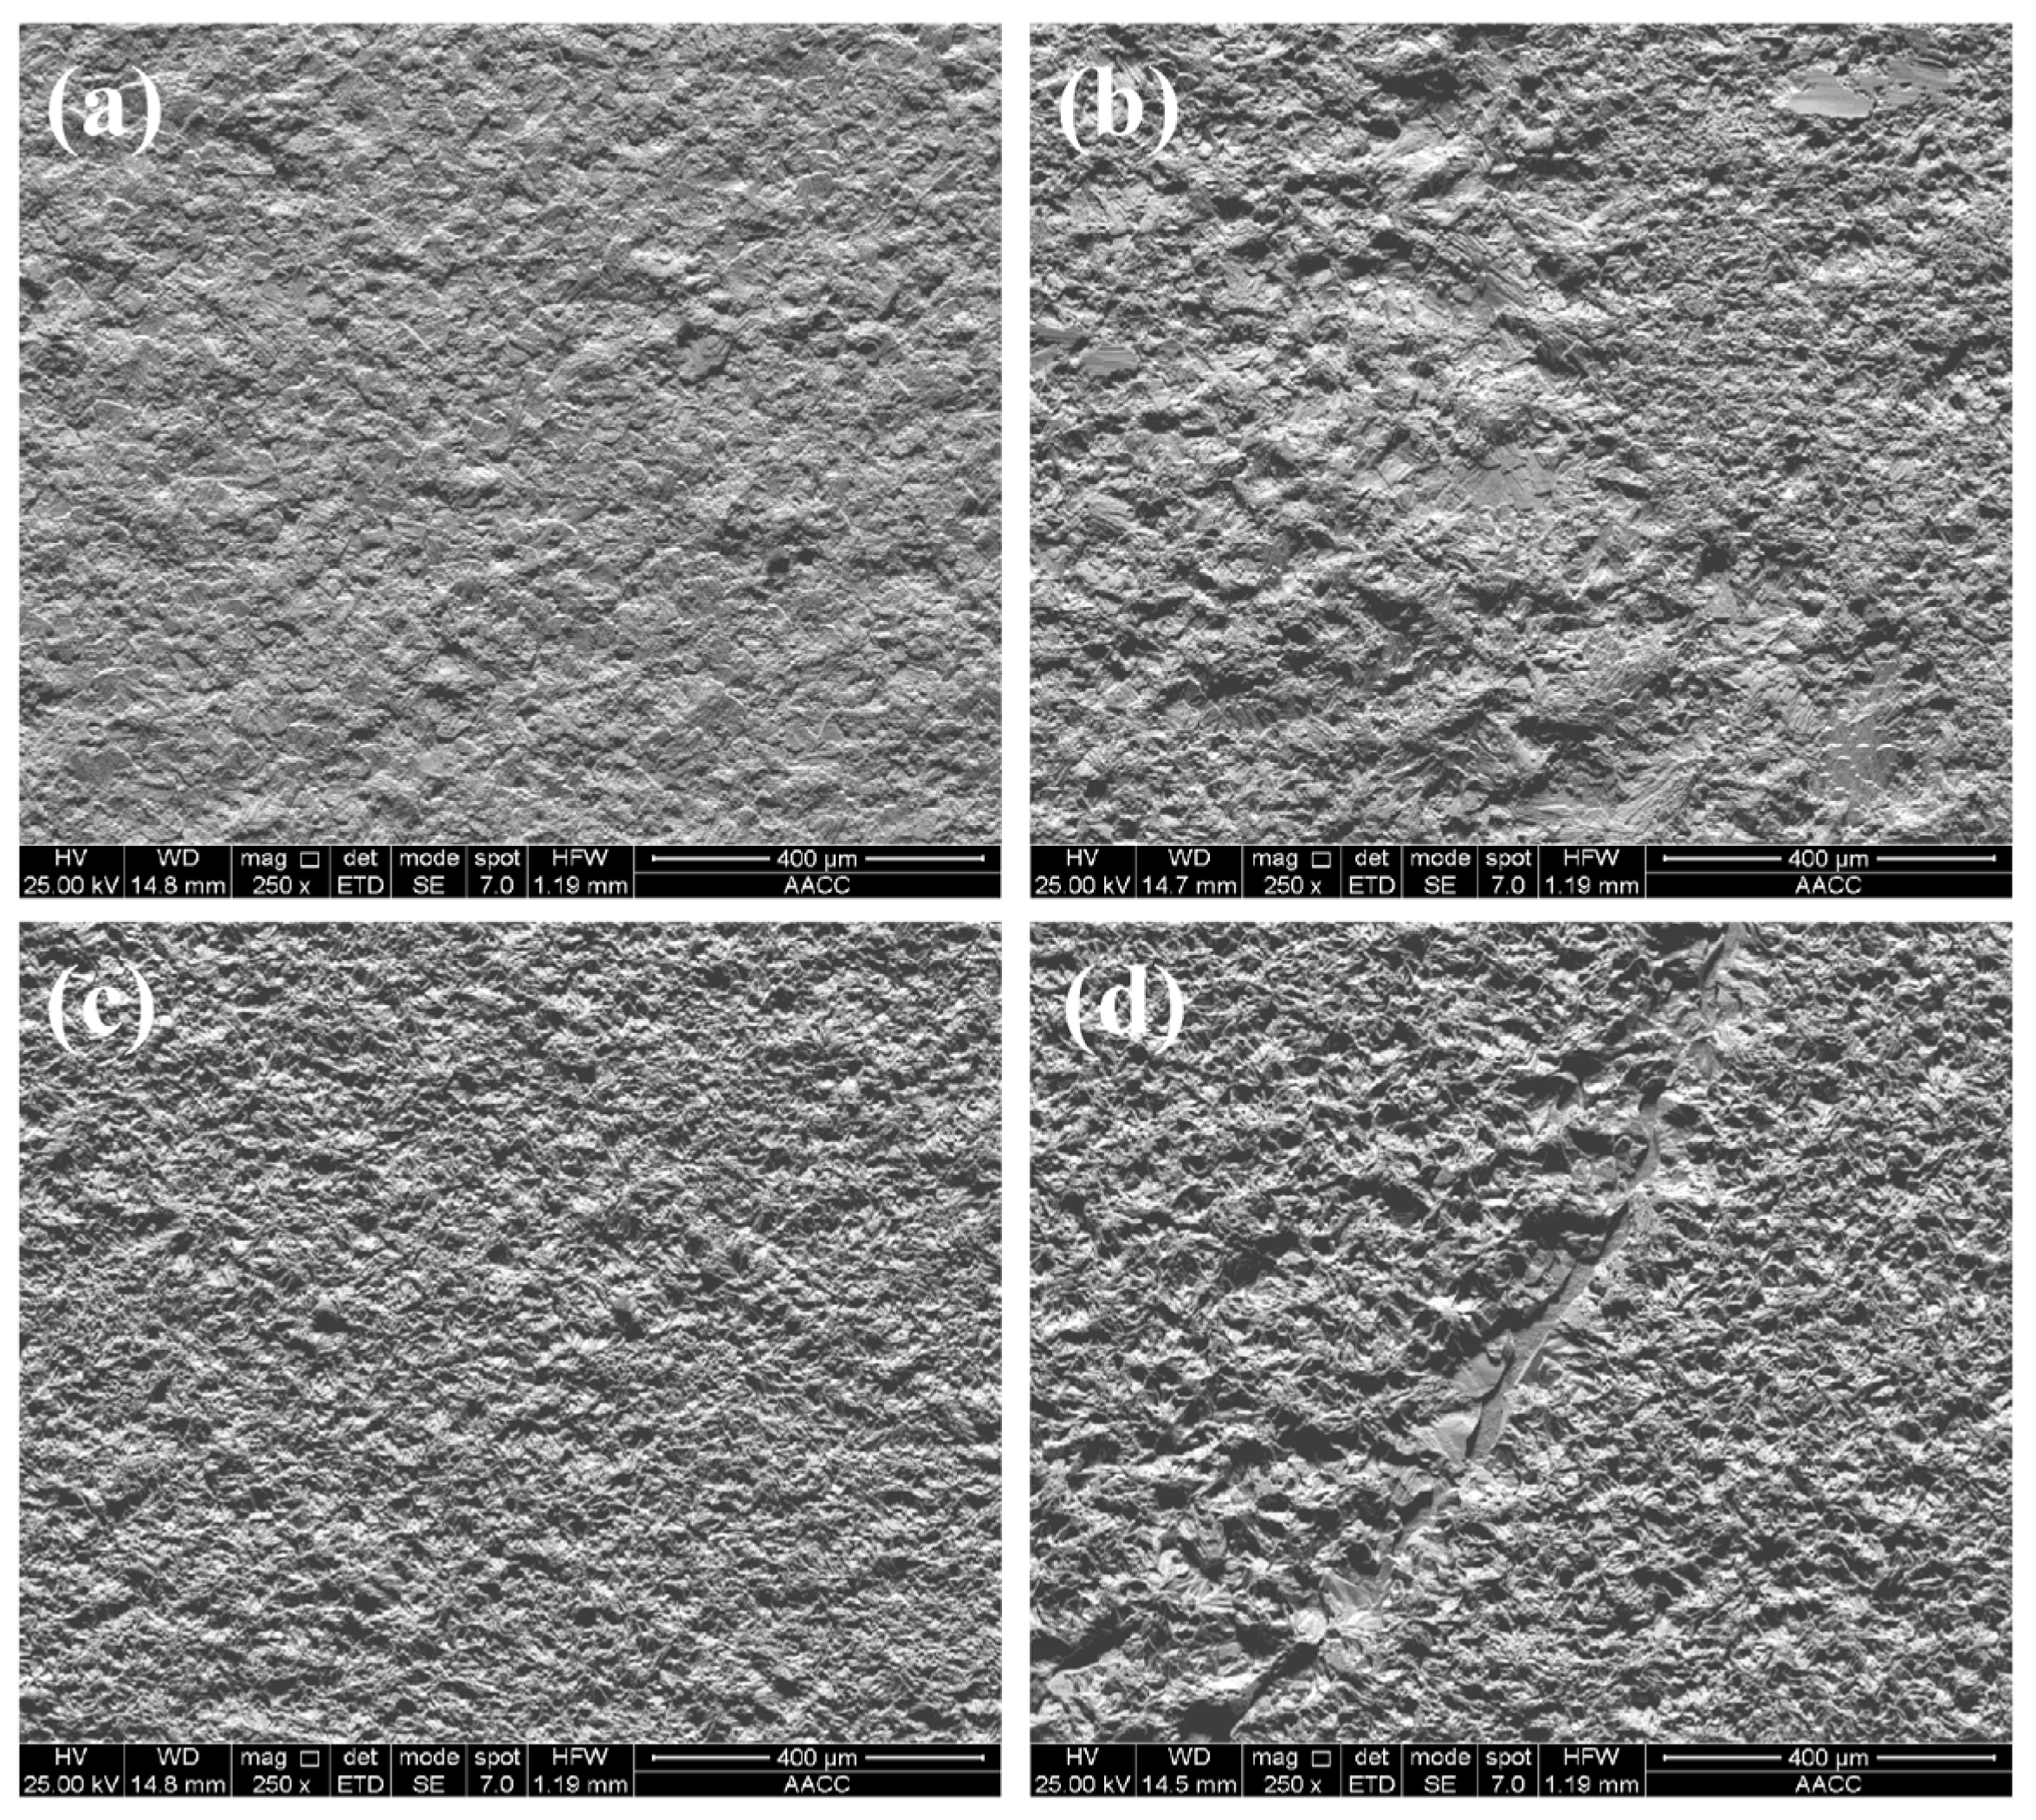
| Composition | Concentration (g/L) | Parameters | |
|---|---|---|---|
| ZnCl2 | 150 | Temperature (°C) | 25 |
| KCl | 50 | pH | 3.5 |
| Boric acid | 30 | Plating time (min) | 60 |
| Al2O3 | 0-15 | ||
| Y2O3 | 0-15 |
| Simple codes | Simple descriptions |
|---|---|
| C1 | Zn |
| C2 | Zn-5g/L Y2O3-5g/L Al2O3 |
| C3 | Zn-10g/L Y2O3-10g/L Al2O3 |
| C4 | Zn-15g/L Y2O3-15g/L Al2O3 |
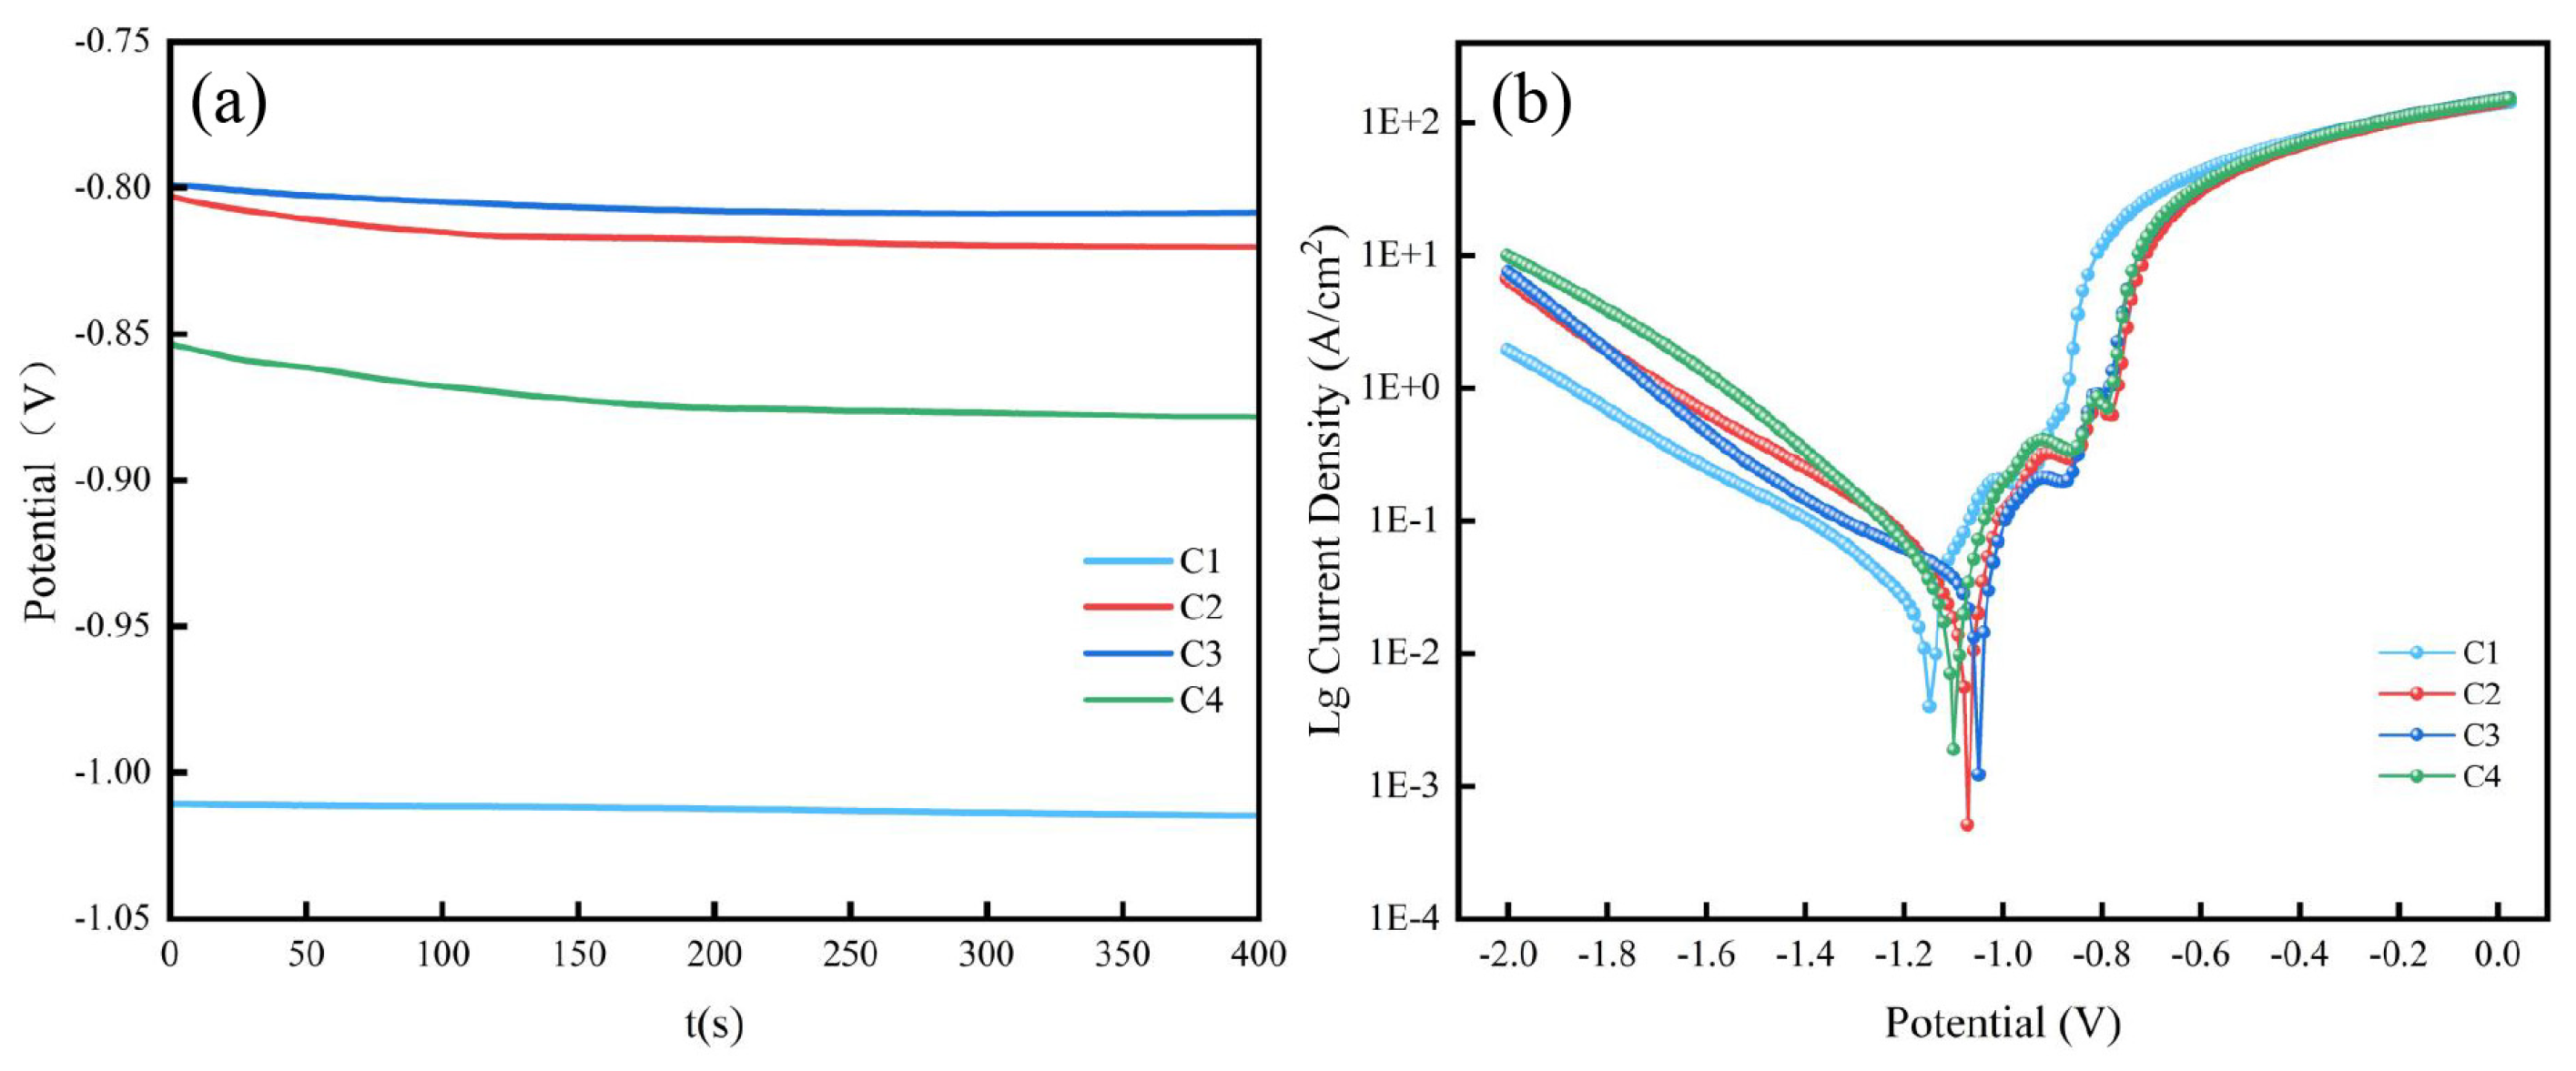
| Sample | Ecorr (V) | Icorr (A/cm2) |
|---|---|---|
| C1 | -1.18 | 6.64×10⁻⁵ |
| C2 | -1.07 | 3.28×10⁻⁵ |
| C3 | -1.02 | 6.15×10⁻⁶ |
| C4 | -1.10 | 3.91×10⁻⁵ |
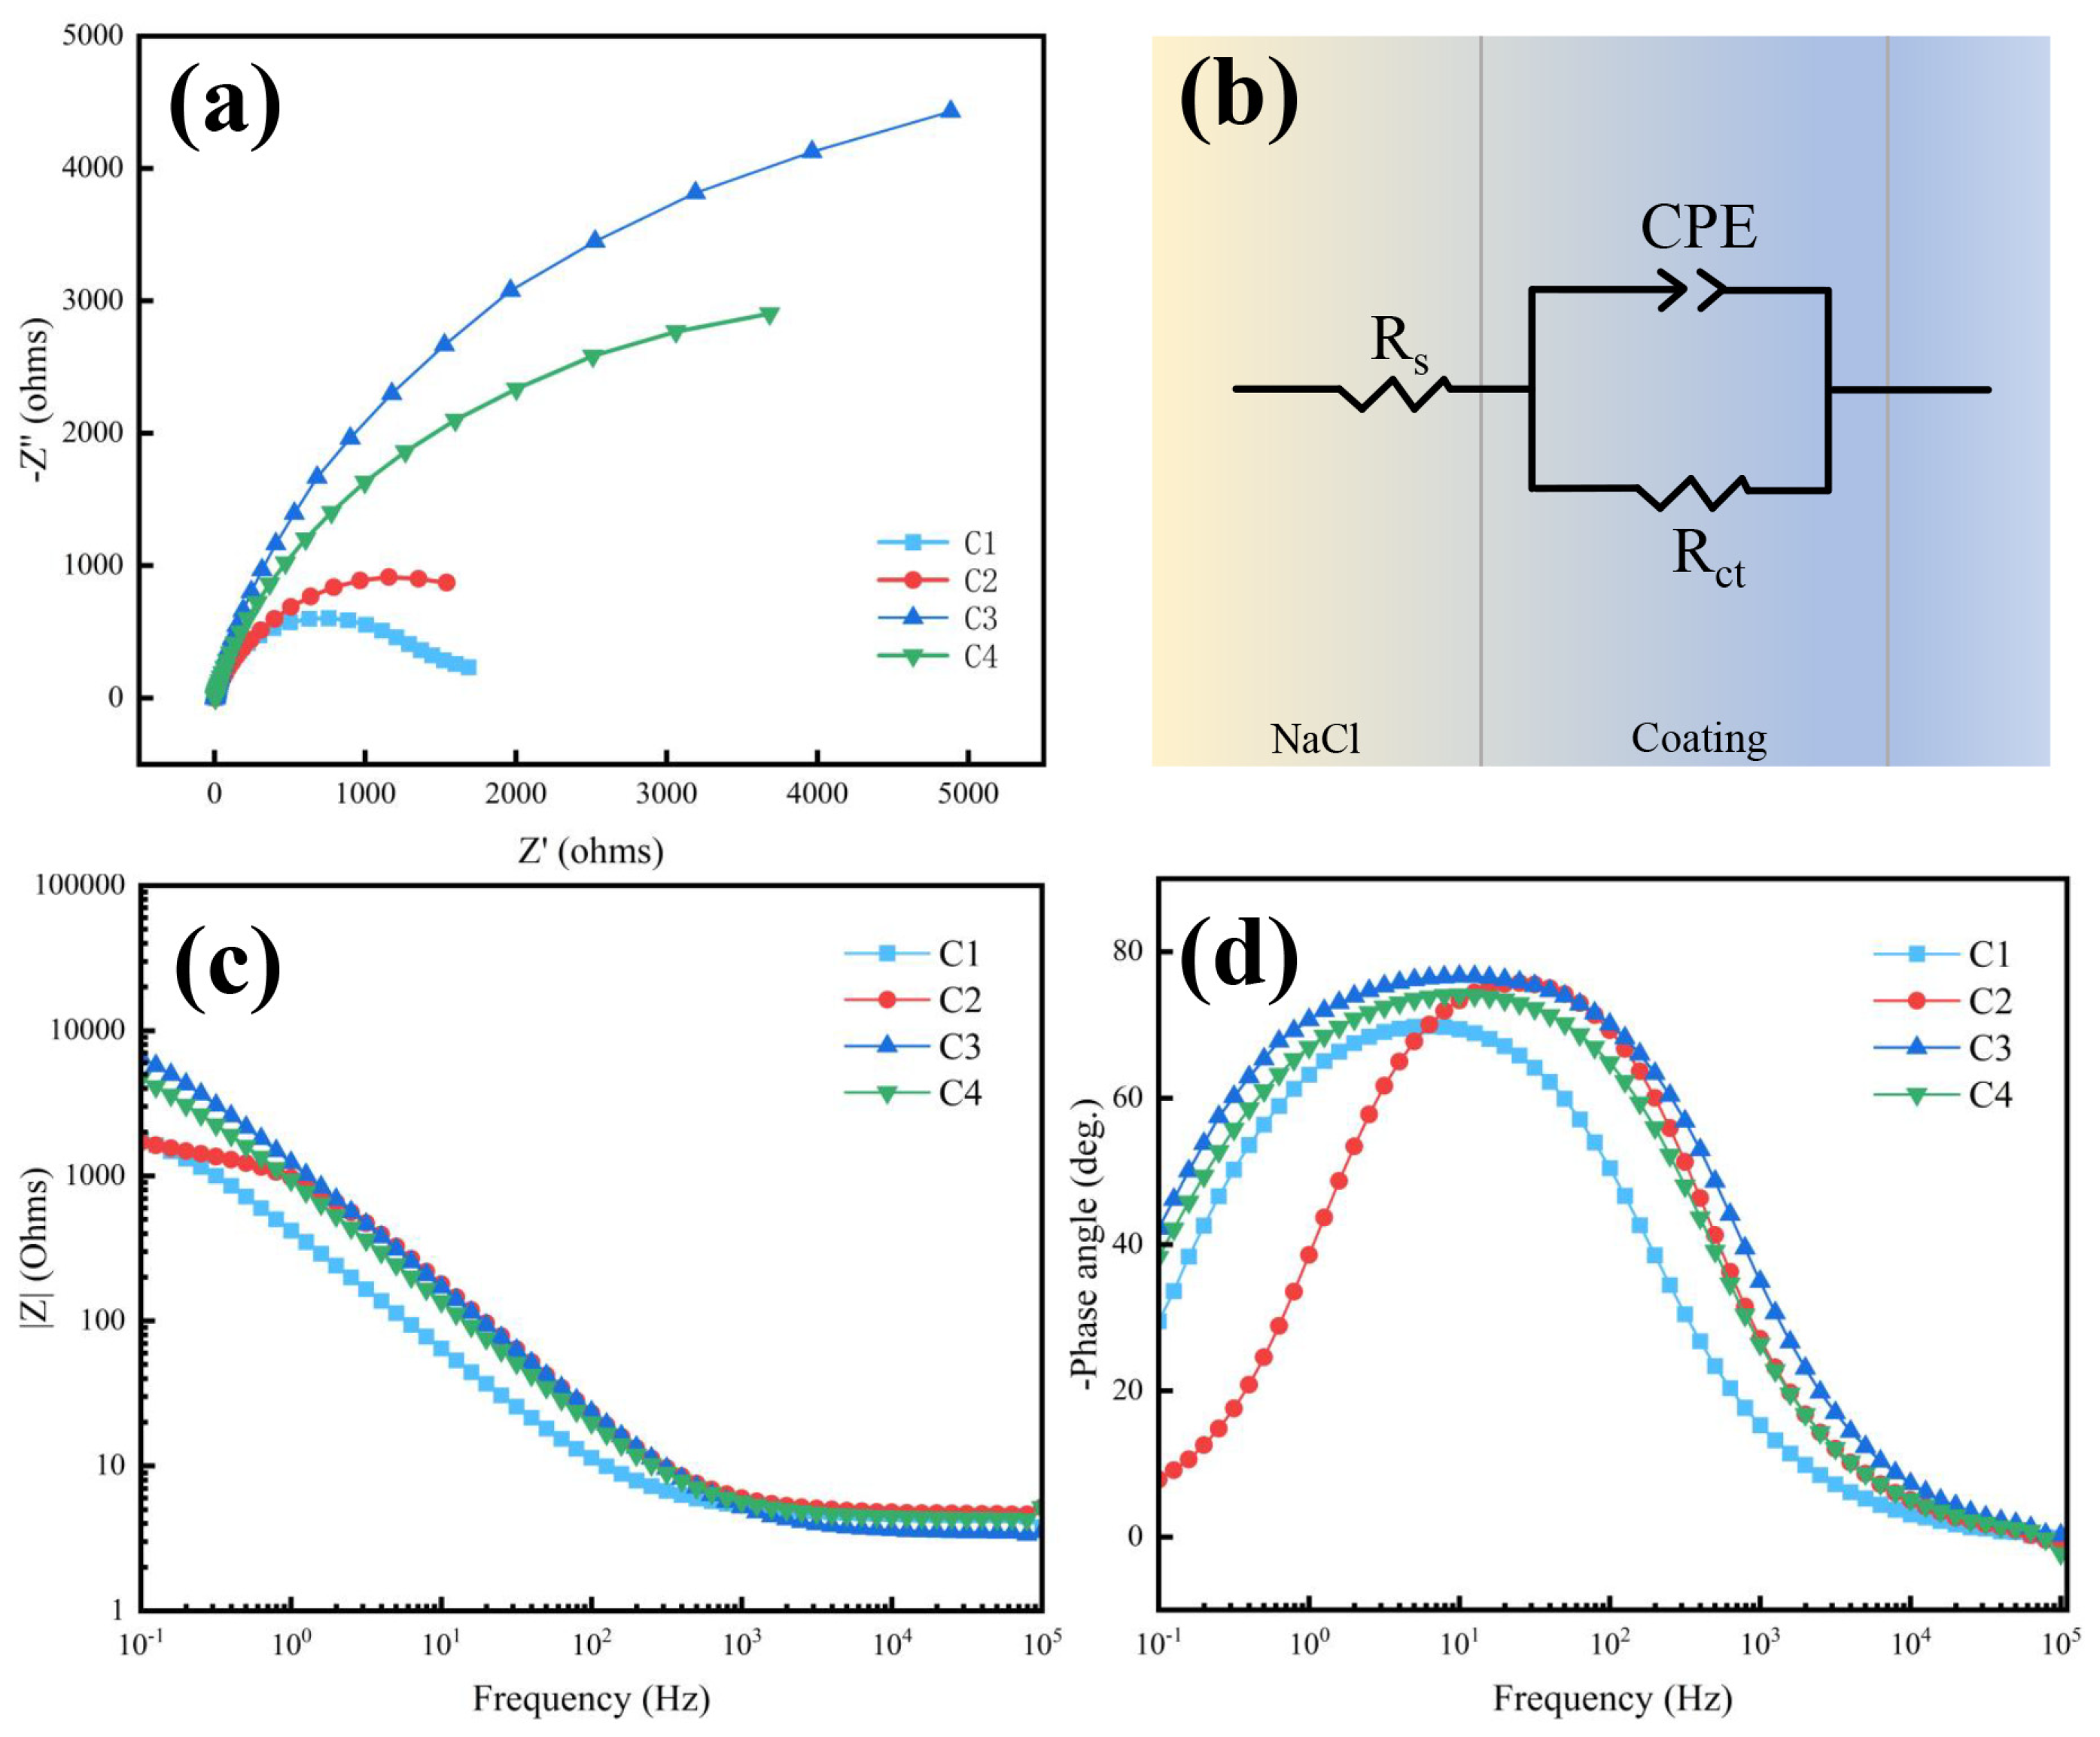
| Sample | Rs (Ω cm2) | Rct (Ω cm2) | CPE-P | CPE-T |
|---|---|---|---|---|
| C1 | 4.781 | 1385 | 0.912 | 1.26×10⁻⁴ |
| C2 | 4.678 | 2304 | 0.840 | 4.79×10⁻⁴ |
| C3 | 4.539 | 10257 | 0.823 | 6.59×10⁻⁴ |
| C4 | 4.384 | 6622 | 0.859 | 2.11×10⁻⁴ |
Disclaimer/Publisher’s Note: The statements, opinions and data contained in all publications are solely those of the individual author(s) and contributor(s) and not of MDPI and/or the editor(s). MDPI and/or the editor(s) disclaim responsibility for any injury to people or property resulting from any ideas, methods, instructions or products referred to in the content. |
© 2024 by the authors. Licensee MDPI, Basel, Switzerland. This article is an open access article distributed under the terms and conditions of the Creative Commons Attribution (CC BY) license (http://creativecommons.org/licenses/by/4.0/).


