Introduction
Wind turbines are pivotal in generating sustainable wind energy, one of the key renewable energy sources. Horizontal-axis wind turbines (HAWTs) and vertical-axis wind turbines (VAWTs) represent the two principal designs, each with unique construction attributes and operational advantages (Tong et al., 2023). The selection between HAWTs and VAWTs depends on factors such as wind characteristics, location, and spatial constraints. Despite their widespread use, HAWTs face challenges related to structural stability and material requirements for blade construction. At the same time, VAWTs exhibit superior wind energy utilisation, lower operational wind speeds, and reduced environmental footprint (Arredondo-Galeana & Brennan, 2021). Advances in numerical simulation have significantly mitigated the structural limitations of VAWTs, optimising their impeller blade design and thus broadening their commercial applicability (Bianchini et al., 2019; Melani et al., 2020).
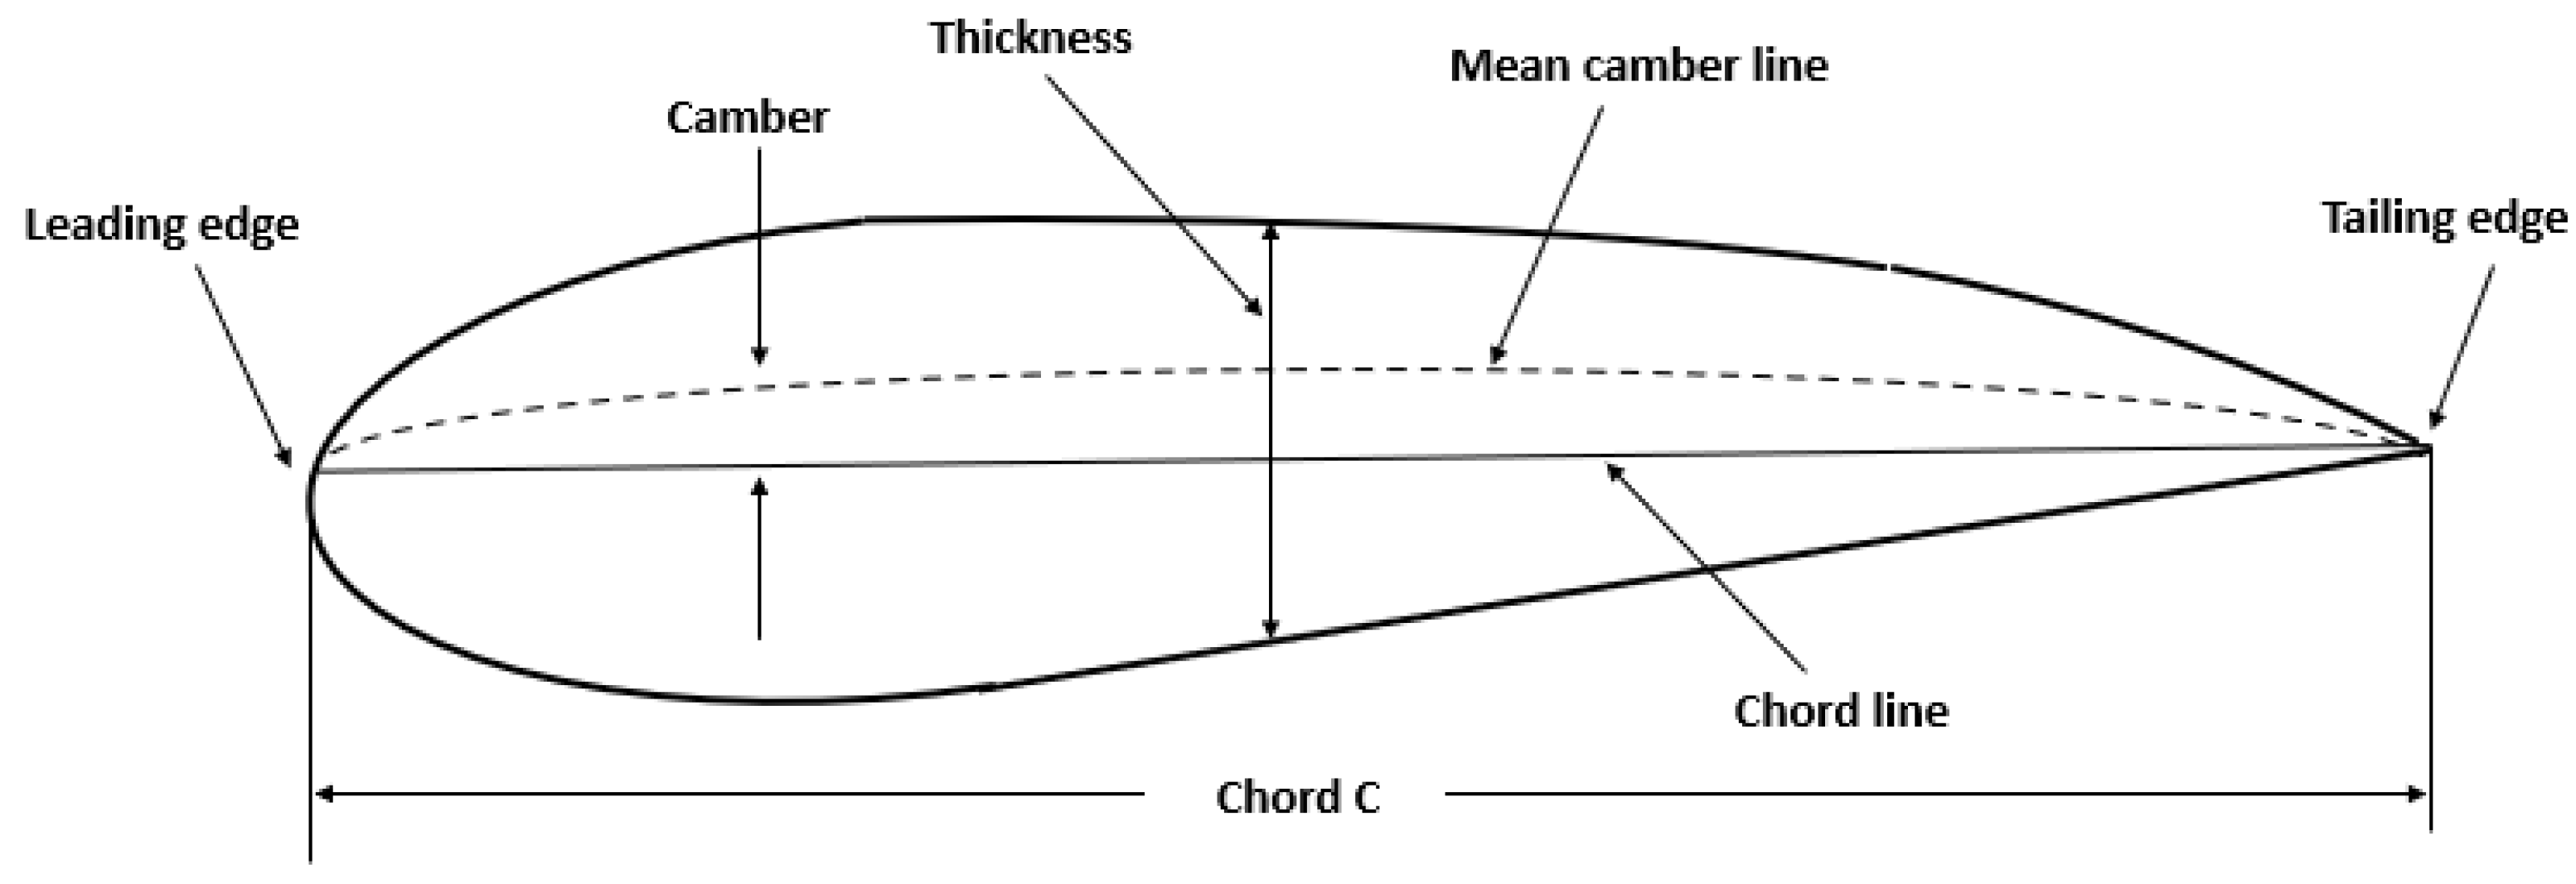
Airfoil technology is a hallmark of engineering innovation, integral to aviation and wind power generation (see
Figure 1). VAWT utilises airfoil-shaped blades arranged on a rotating platform to capture wind from multiple directions, thereby increasing efficiency. For optimal performance, the airfoil’s leading edge should face the wind directly to capitalise on the resultant pressure differential to generate lift while also contending with drag. However, varying wind conditions challenge energy utilisation, emphasising the need for ongoing improvements in airfoil design. The intricacies of airflow over an airfoil are predominantly influenced by the Reynolds number and the angle of attack, leading to phenomena such as laminar flow separation and transition to turbulence. The National Advisory Committee for Aeronautics (NACA) has systematised airfoils using numerical designations that encapsulate their geometric characteristics. For instance, in the present study, the airfoil NACA 4412 is characterised by a maximum camber of 4%, located 0.4 times the chord length from the leading edge, and a maximum thickness of 12% of the chord (Naca4412-IL) (Mahato et al., 2023; Nanda et al., 2023).
Extensive empirical and experimental research has shed light on the impact of external aerodynamic loads on airfoils under varying wind angles of attack. Advanced CFD methods, including potential flow panel and Reynolds Averaged Navier-Stokes (RANS) equations, have been utilised to compute airfoil aerodynamic coefficients (Matyushenko et al., 2017; Ricci et al., 2011). The accuracy of these approaches remains a topic of debate, with some researchers advocating for the comprehensive capabilities of CFD, contrasting with the more simplified assumptions in tools like Xfoil, even though their outcomes generally concur with experimental findings (Gunel et al., 2016; Lafountain et al., 2012; Morgado et al., 2016). However, these analyses’ complexity and high computational demand present significant challenges in accurately predicting aerodynamic forces on VAWTs. Hence, to address these challenges, the current study utilises numerical simulations and CFD to systematically evaluate key aerodynamic parameters at a constant angle of attack.
This study employs ANSYS CFX, a sophisticated CFD software integrated with sub-modules, including CFX-Pre, CFX-Solver, CFD-Post, and CFX Solver Manager, to conduct detailed fluid dynamic analyses. The research focuses on evaluating the lift and drag of an airfoil, considering various parameters like velocity and pressure at specific Angles of Attack (AoA). The objective is to understand better airfoils’ aerodynamic performance and behaviour under diverse operational conditions. This method streamlines the computational process, improving the efficiency and precision of aerodynamic force prediction in VAWT design.
Methodology
The Ansys Workbench application is employed in the design and simulation of a NACA (4412) airfoil using parameter points to import and generate mesh via Ansys meshing. The process involves the application of boundary conditions such as inlet, opening, symmetry, and no-slip walls. This approach ensures that the design and simulation process is optimized for efficiency and accuracy while minimizing errors and achieving desired results.
Figure 2 shows the flowchart outlining the process for conducting computational fluid dynamics (CFD) simulations using ANSYS software to obtain the lift, drag and lift-to-drag ratio values.
We determined the optimal angle of attack (AoA) by utilizing the lift-to-drag ratio function in the solver at various inlet velocities. Subsequently, the resulting data was analyzed to reveal the multiple lifts, drags, and lift-to-drag ratios, then presented graphically through MATLAB and Excel. Finally, the lift and drag forces exerted on the airfoil within the reference AoA range of 5 to 12o were also determined and documented.
Aerodynamic parameters and governing equations
The experiment is initiated by setting the fluid at an ambient temperature of
25oC (Ideal Air) and fixing the viscosity at
1.831 x 10⁻⁵ (kg/ms). The X and Y components of the velocity are determined from the trigonometric functions for the various angles of attack (α) using the expressions presented in Eq.1 and 2.
The components of the velocities, U, are varied at several AoA, and the resulting values are fed into the software to generate iterative outcomes for the lift force and drag force using the cartesian velocity.
Next, as an iterative process, the values for the drag and lift forces are obtained from Ansys and input into Eq. 3 and 4 to get the actual lift and drag forces acting on the airfoil:
Therefore, the lift and drag force are given in Eq. 5 and 6.
where, ρ= density of air,
= relative velocity to the blade, c= chord,
= lift coefficient and
= Drag coefficient.
The lift and drag coefficients are dimensionless numbers and can be expressed as given in Eq. 7 and 8.
where, A = Area (chord length x length of blade).
Equations 9 and 10 provide the Mach and Reynolds number equations.
where, M = Mach number, V = fluid flow speed (ms
-1) and C = speed of sound (ms
-1).
where, Re= Reynolds number,
ρ= Fluid density (kg m
-3), V= velocity of fluid flow (ms
-1), L= characteristic length of flow (m) and μ = dynamic Fluid viscosity (kg/ms).
Results and discussion
Ansys software was employed to conduct the airfoil simulations. The output dataset was meticulously analyzed utilizing MATLAB.
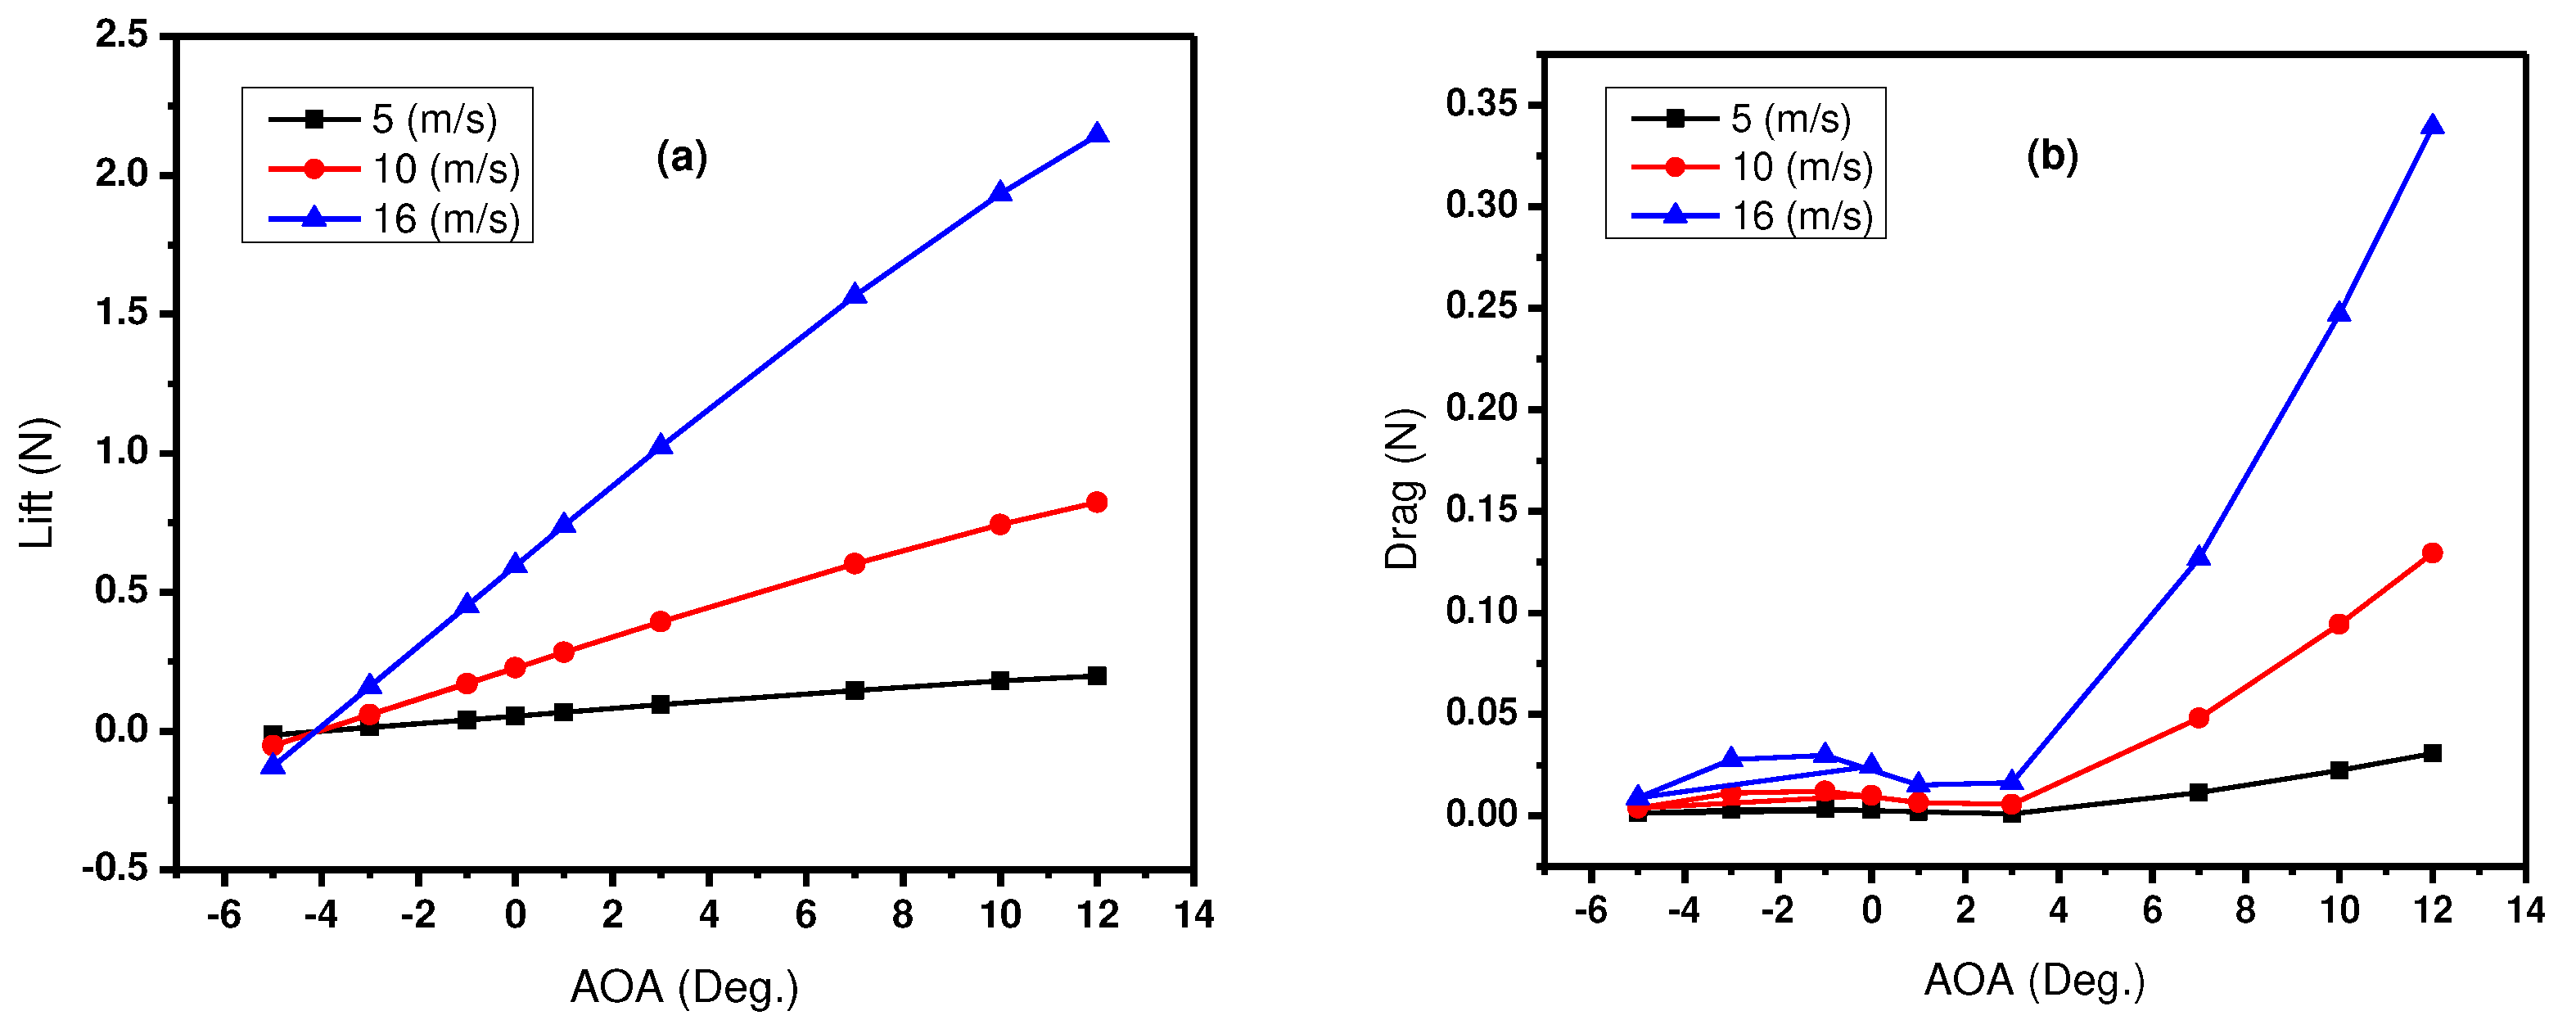
Table S1 in the supplementary materials presents the resulting data from the solver. The graph in
Figure 3(a) depicts the lift force variation concerning the angle of attack at three distinct velocities for the airfoil. The lift force increases with the angle of attack for all three velocities. At
5 m/s (blue line), the lift force is comparatively lower than higher velocities, indicating the airfoil’s inefficiency at slower speeds. The lift force is higher at
10 m/s (red line) and
16 m/s (yellow line), meaning the airfoil can generate more lift as the velocity increases. This characteristic is common among airfoils, where the lift generally increases with the angle of attack up to a certain point, known as the stall angle, beyond which the lift suddenly drops. The rate of increase in lift is steeper for higher velocities, which aligns with the aerodynamic principle that lift is proportional to the square of the airflow velocity over the airfoil.
At negative angles of attack, the airfoil generates an opposing lift force, resulting in a downward force. The transition from negative to positive lift occurs as the angle of attack crosses from negative to positive values. The negative values for the lift force indicate that the net downward force on the airfoil is within the range of angles.
The results from the simulation of
Figure 3(a) show a high level of alignment with the experimental data (AoA) and a close agreement with the fluid tunnel data (Zhao et al., 2019). This outcome validates the use of the computational method. However, it is essential to note that when the boundary layers over the airfoil are fully turbulent, the drag is over-predicted (Roslan et al., 2022). The graph displays angles of attack ranging from
5 to
12o at a fixed Reynolds number, where the lift force increases steadily, reaching its maximum value at
12°. Beyond this angle, a gradual decrease would be expected, typically around
15 to
20o for many airfoils. Although not indicated in the plot, this is the stalling angle for the airfoil at the given Reynolds number.
Figure 3(b) shows a graph depicting the relationship between the drag force and the Angle of Attack (AoA) for an airfoil, which was analyzed at three different velocities:
5 m/s, 10 m/s, and
16 m/s. The graph indicates that at low AOA (
-4 to
0o), the drag force is minimal and remains relatively constant across all velocities. This suggests that the airflow stays attached to the surface of the airfoil at low angles of attack, resulting in lower drag. In addition, at moderate AoA (
0 to 8o), drag gradually increases as the angle of attack increases, which is more pronounced at higher velocities. The airfoil is likely generating more lift at these angles, but this comes with increased drag costs. Finally, at a higher AoA (>
8o), there is a sharp increase in drag, especially at the highest velocity of
16 m/s. This region is typically where the airfoil may be approaching or exceeding its critical angle of attack, beyond which airflow separation occurs, leading to a condition known as stall, where the lift is dramatically reduced and drag increases significantly. Comparing the lift and drag characteristics, it is readily seen that lift generation is accompanied by drag generation within the positive AoA.
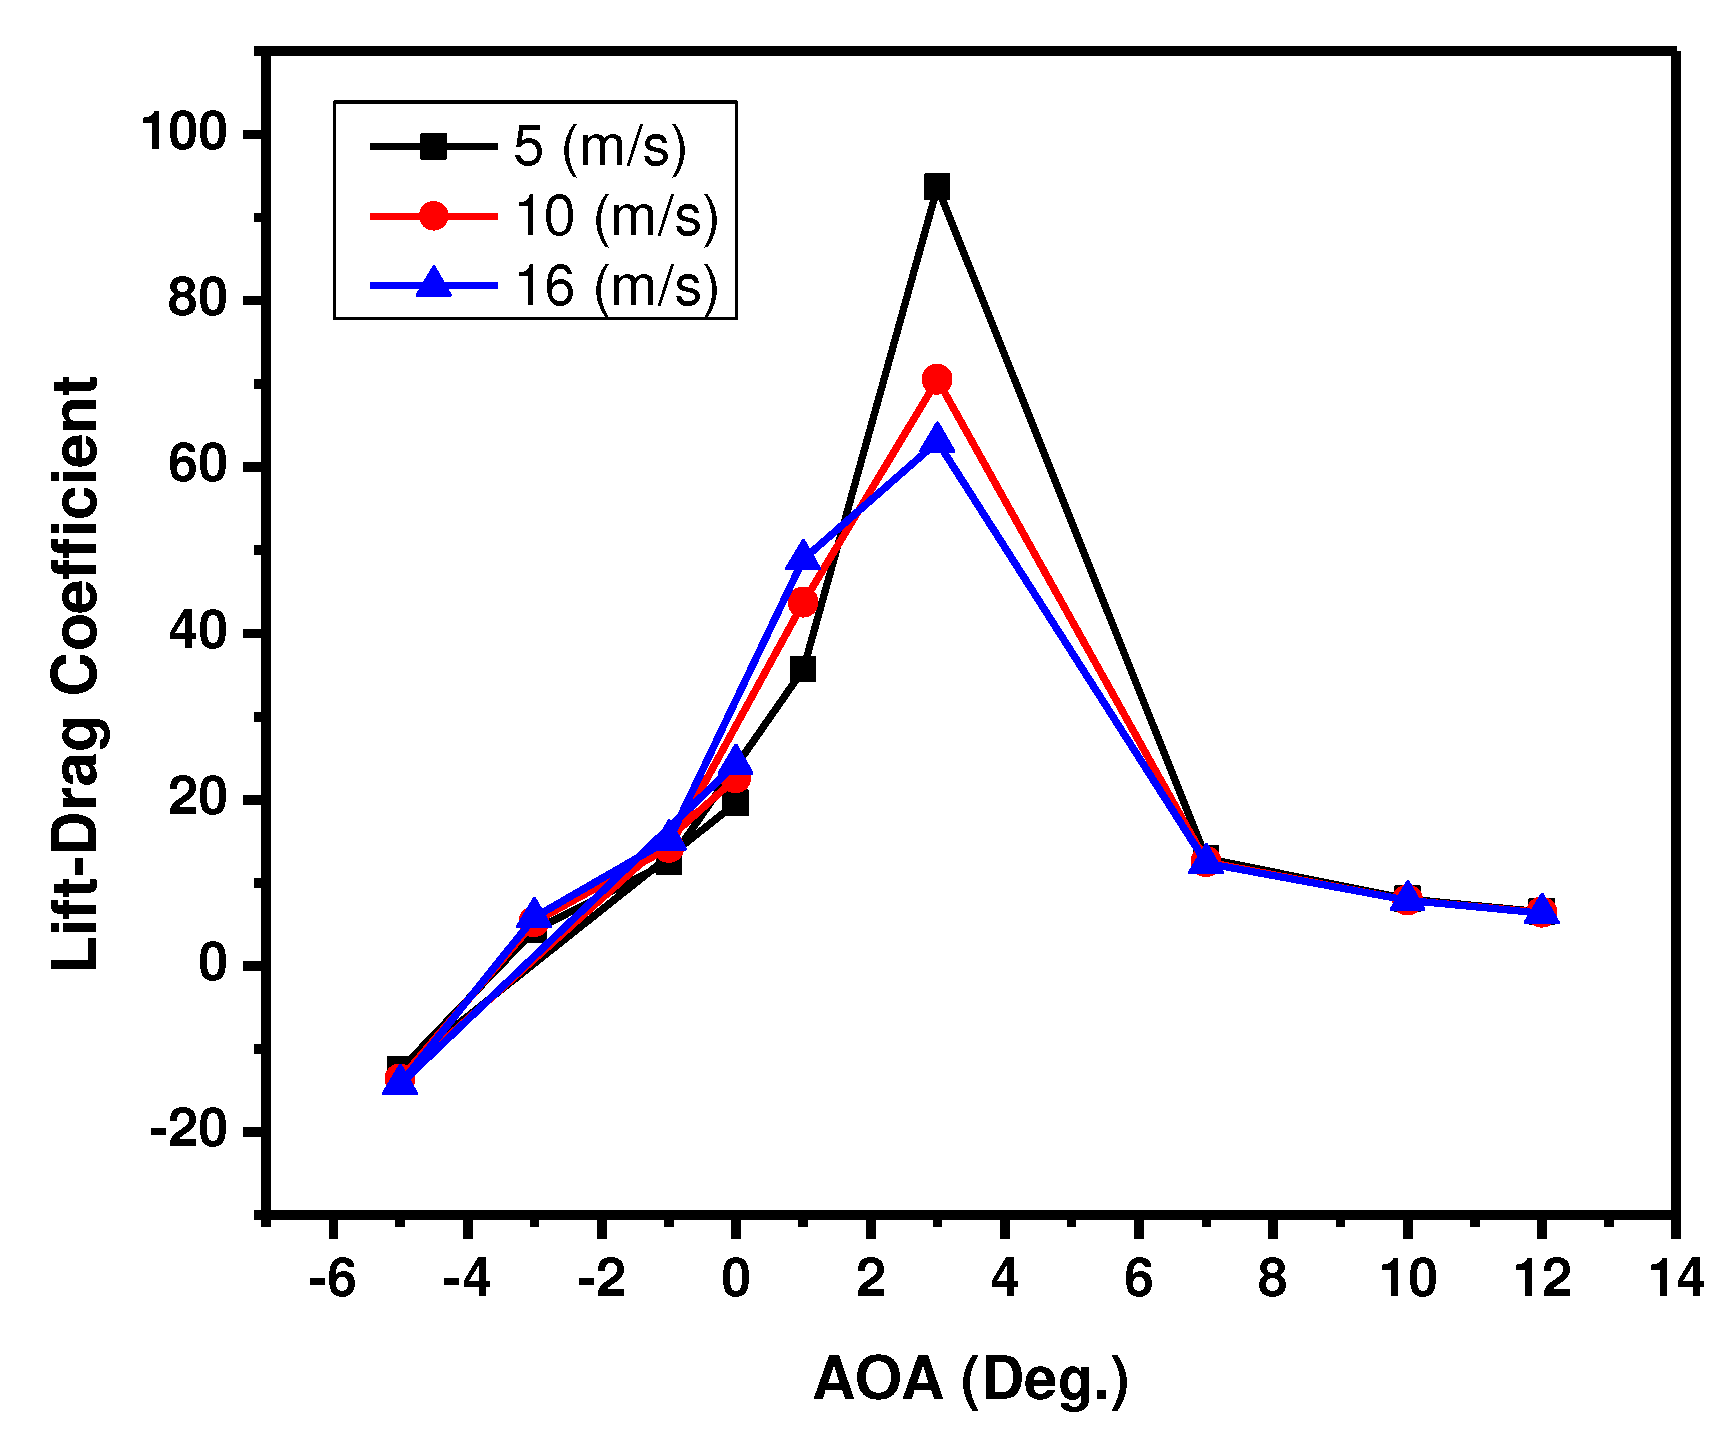
Figure 4 shows the lift-drag coefficient plotted against the angle of attack (AoA) for three different velocities:
5 m/s, 10 m/s, and
16 m/s. The ratio of the maximum lift-to-drag coefficient was at an angle of attack of
3°. For all velocities at low AoA (≈
-4 to
3o), the lift-drag coefficient increases with the angle of attack. All three velocities follow a similar trend in this region, indicating a consistent aerodynamic behaviour of the airfoil at low angles. At moderate AoA (≈
3 to
7o), there is a peak in the lift-drag coefficient for all velocities, which indicates optimal aerodynamic efficiency. At this point, the airfoil generates the most lift with the slightest drag. The peaks occur at slightly different angles of attack for each velocity, with the peak for the 16 m/s velocity occurring at a slightly lower angle than the others. Finally, at higher AoA (>
7o), there is a sharp decrease in the lift-drag coefficient, which is particularly noticeable for the 16 m/s velocity curve. This result indicates a rapid drop in aerodynamic efficiency, likely due to flow separation from the airfoil surface, which is a stall characteristic.
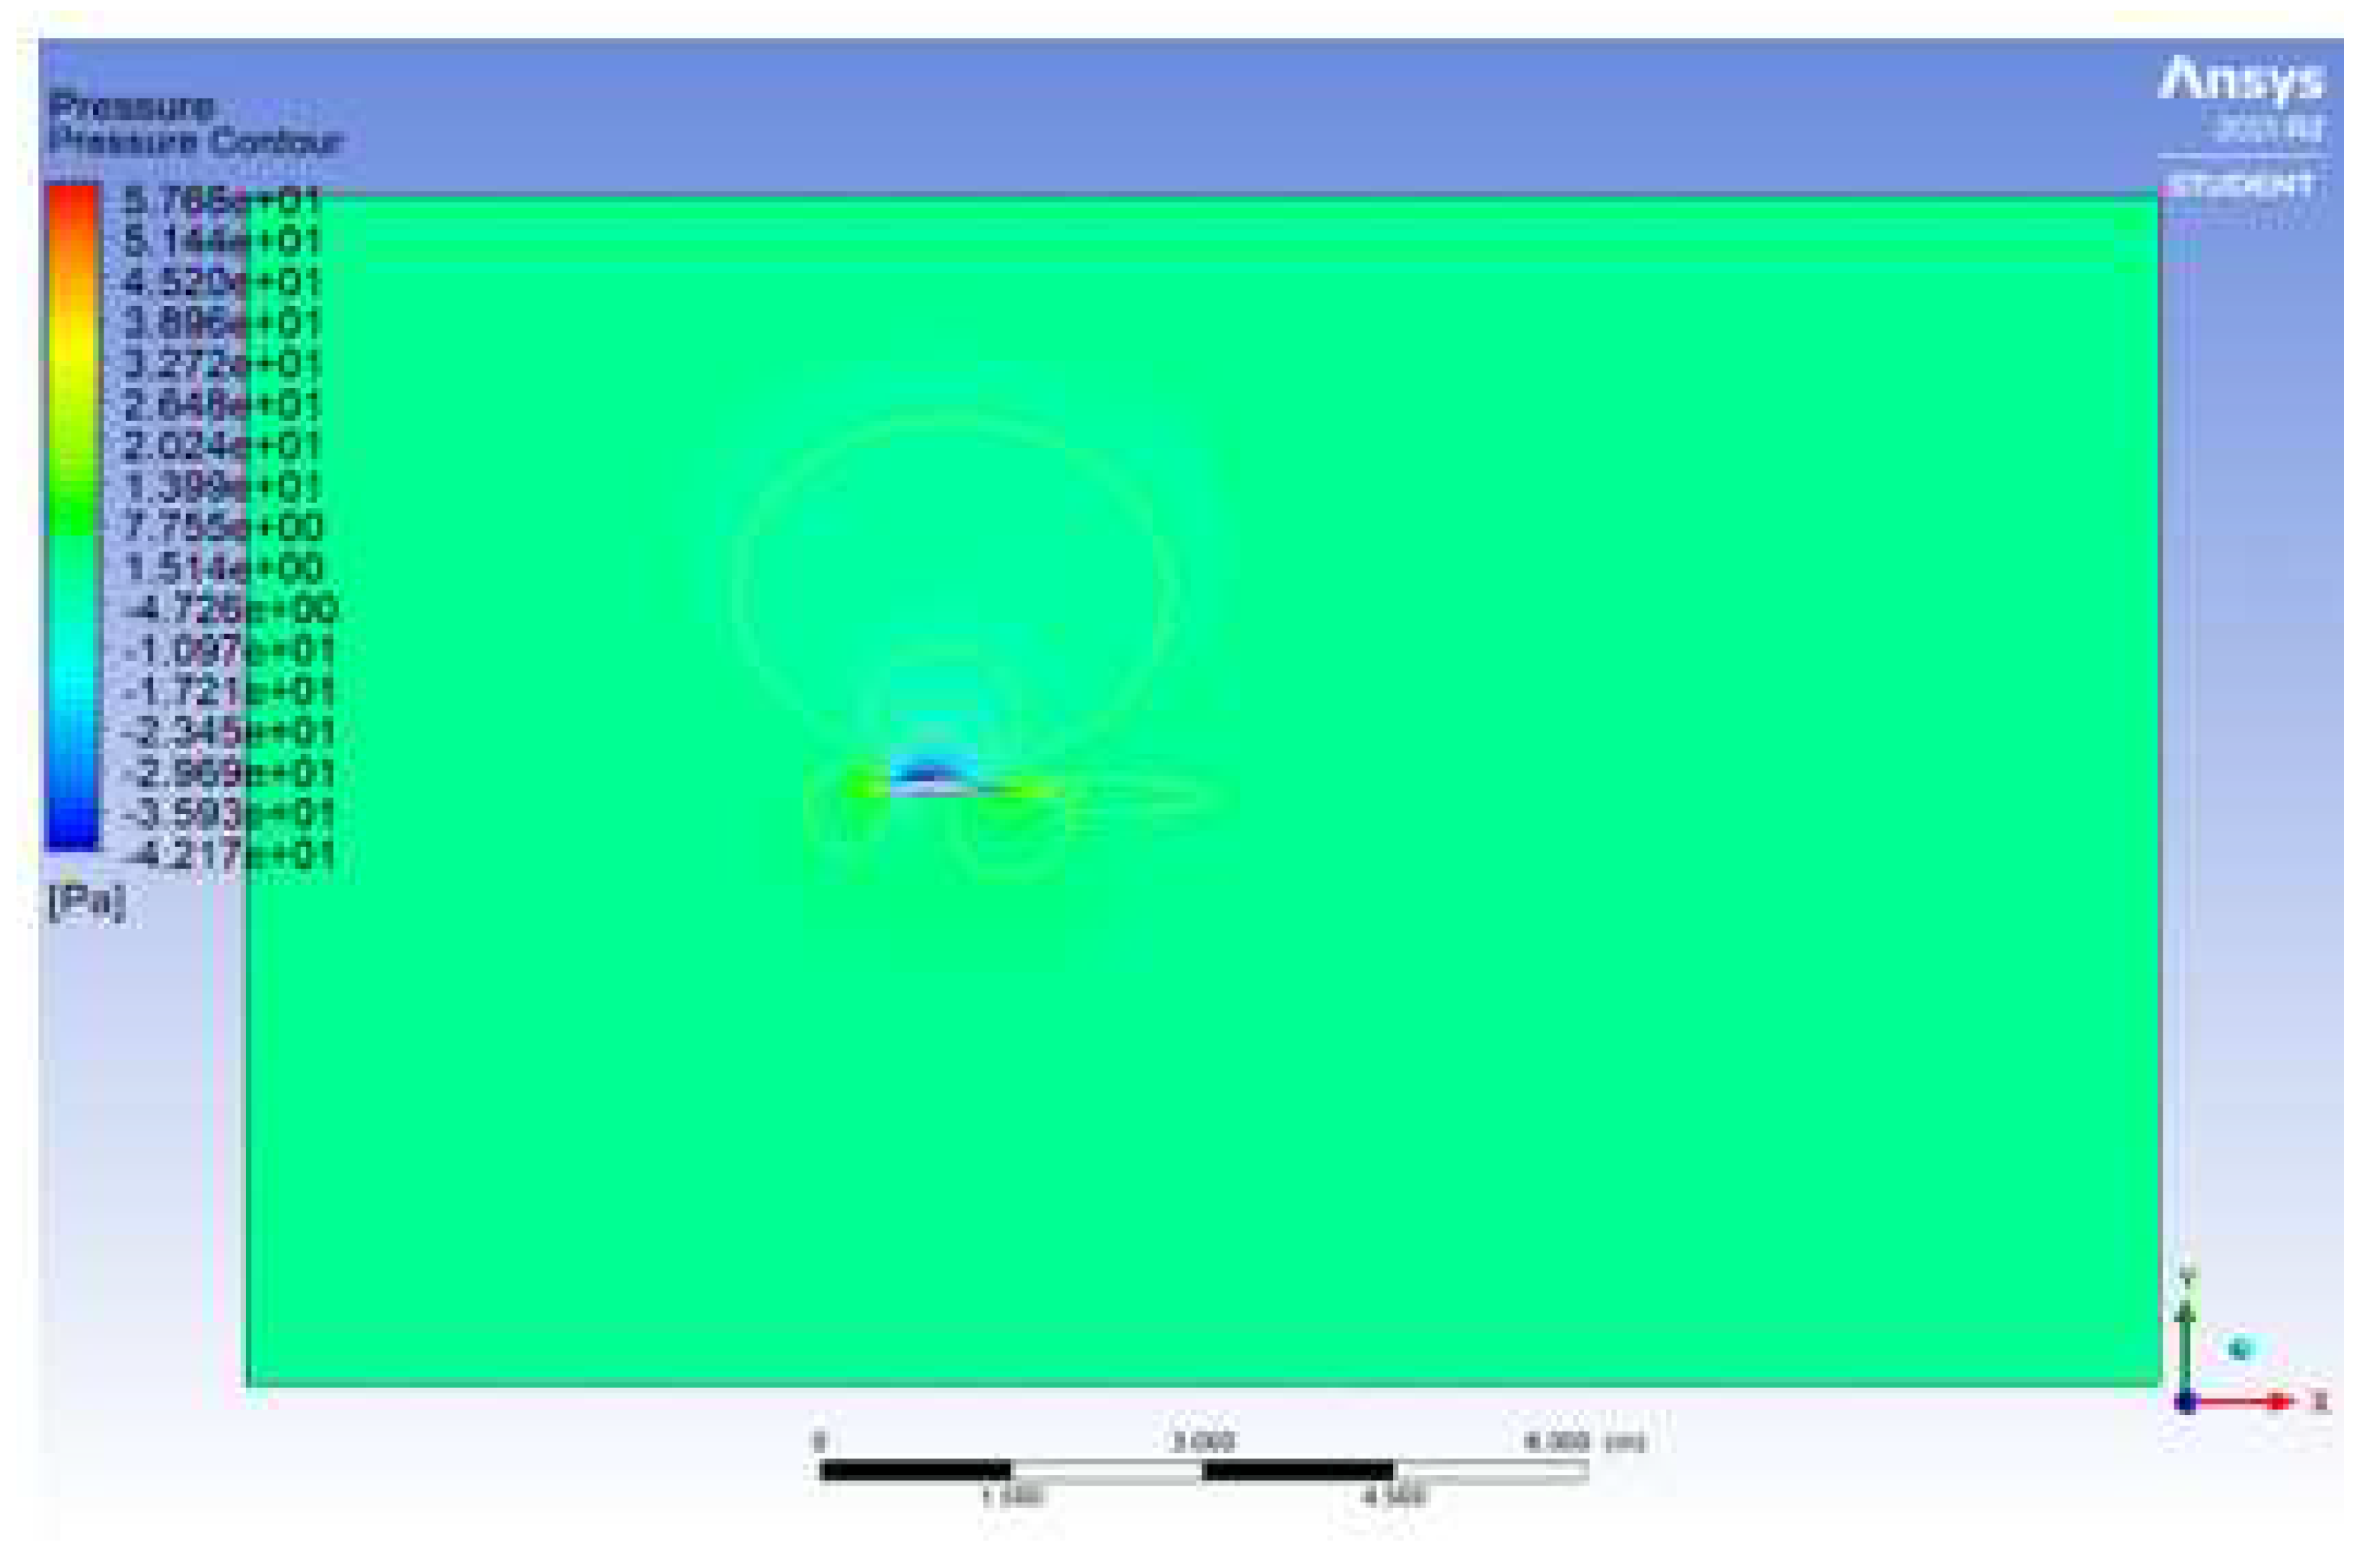
Figure 5 shows the computational fluid dynamics (CFD) simulation output from Ansys, which shows the velocity and pressure distribution contour around the airfoil. The pressure contour is color-coded, with the scale on the left indicating the pressure values in Pascals (
Pa). The colours represent different pressure levels, ranging from low pressure (indicated by blue) to high pressure (indicated by red). From
Figure 5, we can infer that the air molecules encounter a high-pressure region when they reach the airfoil’s leading edge, causing compression on the front side of the airfoil. Also, there is a low-pressure region on the top surface of the airfoil due to the air moving faster over the curved top surface, creating a drop in pressure according to Bernoulli’s principle. The low-pressure region is contributing to the lift generated by the airfoil. Thus, the flow behaviour shows an attached flow, resulting in a polar drag. This simulation and technique of obtaining qualitative values from the Ansys solver have posed some observable limitations. These include:
The geometry of the airfoil considered (NACA 4412) is non-symmetric.
The use of air as a fluid at 25oC.
The number of iterations done by the solver is 500 at a convergence value of 0.000001 residual points.
Conclusions
This paper has conducted a direct numerical and CFD simulation study on an airfoil using Ansys software which has yielded comprehensive insights into the aerodynamic performance of the airfoil (NACA 4412). The aerodynamic performances and the structural behaviour are thoroughly investigated. The main conclusions drawn based on the results obtained are as follows:
The pressure and velocity distribution contours indicate an efficient lift-generating profile with a high-pressure buildup at the leading edge and a significant low-pressure region over the top surface, suggesting higher velocities and effective lift. While high-pressure regions indicate slower flow speeds, the rear of the airfoil shows signs of flow disturbance, which could be an area for further study to minimize drag and optimize performance.
The lift-drag coefficient shows that the AoA for velocities 5 m/s, 10 m/s, and 16 m/s have a maximum lift-to-drag ratio occurring at an angle of attack of 3°. The lift-drag coefficient rises with the angle of attack for all velocities at low AoA. Therefore, establishing a consistent peak-to-peak aerodynamic behaviour at the three velocities at low angles could affect the airfoil’s stability. Thus, increasing the Reynolds number can increase the velocity acting on the airfoil.
The results from these simulations are critical for advancing airfoil design, providing a baseline for further experimental validation, and informing adjustments to enhance aerodynamic efficiency. Future work could consider a range of angles of attack and flow conditions to fully characterize the airfoil’s behaviour and identify optimal operating parameters for real-world applications.
Supplementary Materials
The following supporting information can be downloaded at the website of this paper posted on
Preprints.org.
Credit authorship contribution statement
A. Adesiyan: Data curation, Formal analysis, Writing-original draft, O. O. Akinnawo: Conceptualization, Funding acquisition, Writing-review & editing.
Acknowledgements
The authors express their sincere gratitude for the support from the Petroleum Technology Development Fund (PTDF), Nigeria.
Conflict of Interest
The authors have no conflict of interest to declare.
References
- Arredondo-Galeana, A.; Brennan, F. Floating Offshore Vertical Axis Wind Turbines: Opportunities, Challenges and Way Forward. Energies 2021, 14, 8000. [Google Scholar] [CrossRef]
- Bianchini, A.; Balduzzi, F.; Ferrara, G.; Persico, G.; Dossena, V.; Ferrari, L. A critical analysis on low-order simulation models for darrieus vawts: How much do they pertain to the real flow? Journal of Engineering for Gas Turbines and Power 2019, 141. [Google Scholar] [CrossRef]
- Gunel, O.; Koc, E.; Yavuz, T. COMPARISON OF CFD AND XFOIL AIRFOIL ANALYSES FOR LOW REYNOLDS NUMBER. International Journal of Energy Applications and Technologies 2016, 3, 83–86. [Google Scholar]
- Lafountain, C.; Cohen, K.; Abdallah, S. Use of XFOIL in design of camber-controlled morphing UAVs. Computer Applications in Engineering Education 2012, 20, 673–680. [Google Scholar] [CrossRef]
- Mahato, A.; Kant Singh, R.; Barnwal, R.; Chandra Rana, S. Aerodynamic characteristics of NACA 0012 vs. NACA 4418 airfoil for wind turbine applications through CFD simulation. Materials Today: Proceedings 2023. [Google Scholar] [CrossRef]
- Matyushenko, A.A.; Kotov, E.V.; Garbaruk, A.V. Calculations of flow around airfoils using two-dimensional RANS: an analysis of the reduction in accuracy. St. Petersburg Polytechnical University Journal: Physics and Mathematics 2017, 3, 15–21. [Google Scholar] [CrossRef]
- Melani, P.F.; Balduzzi, F.; Brandetti, L.; Ferreira CJ, S.; Bianchini, A. An experimental and numerical analysis of the dynamic variation of the angle of attack in a vertical-axis wind turbine. Journal of Physics: Conference Series 2020, 1618, 052064. [Google Scholar] [CrossRef]
- Morgado, J.; Vizinho, R.; Silvestre MA, R.; Páscoa, J.C. XFOIL vs CFD performance predictions for high lift low Reynolds number airfoils. Aerospace Science and Technology 2016, 52, 207–214. [Google Scholar] [CrossRef]
- Nanda, S.; Ahmed, S.; Warudkar, V.; Gautam, A. Effect of uniformly varying width leading-edge slots on the aerodynamic performance of wind turbine blade. Materials Today: Proceedings 2023, 78, 120–127. [Google Scholar] [CrossRef]
- Ricci, R.; Montelpare, S.; Renzi, E. Study of mechanical disturbances effects on the laminar separation bubble by means of infrared thermography. International Journal of Thermal Sciences 2011, 50, 2091–2103. [Google Scholar] [CrossRef]
- Roslan SA, H.; Rasid, Z.A.; Ehsan AK, A.M. The Aerodynamic Performance of the Small-Scale Wind Turbine Blade with NACA0012 Airfoil. CFD Letters 2022, 14, 87–98. [Google Scholar] [CrossRef]
- Tong, G.; Li, Y.; Tagawa, K.; Feng, F. Effects of blade airfoil chord length and rotor diameter on aerodynamic performance of straight-bladed vertical axis wind turbines by numerical simulation. Energy 2023, 265. [Google Scholar] [CrossRef]
- Zhao, A.; Hui, Z.; Jin, H.; Wen, D. Analysis on the Aerodynamic Characteristics of a Continuous Whole Variable Camber Airfoil. Journal of Physics: Conference Series 2019, 1215, 012005. [Google Scholar] [CrossRef]
|
Disclaimer/Publisher’s Note: The statements, opinions and data contained in all publications are solely those of the individual author(s) and contributor(s) and not of MDPI and/or the editor(s). MDPI and/or the editor(s) disclaim responsibility for any injury to people or property resulting from any ideas, methods, instructions or products referred to in the content. |
© 2024 by the authors. Licensee MDPI, Basel, Switzerland. This article is an open access article distributed under the terms and conditions of the Creative Commons Attribution (CC BY) license (http://creativecommons.org/licenses/by/4.0/).


