1. Introduction
As an ultrasound marker of carotid atherosclerosis, carotid intima–media thickness (CIMT) is a measure of the combined thickness of intima and media layers of the carotid arteries. The CIMT has been reported as representative of subclinical and asymptomatic atherosclerotic vascular diseases, and therefore determination of CIMT is a procedure to detect primordial atherosclerosis implicated in the development of cardiovascular diseases (CVD), cognitive impairment and white matter hyperintensities (Gardener et al. 2017; Park et al 2019; Della-Morte et al. 2018). Epidemiologic studies have shown that CIMT can be influenced by multiple factors including genetic and environmental elements like lifestyle factors (Marshell et al. 2011), dietary patterns (Akbari-Sedigh et al. 2019), etc. The genetic contribution to CIMT has been estimated to be 40% in a family study (Juo et al. 2004). A twin study reported a heritability estimate of around 60% (Zhao et al. 2008). The study also revealed that most of this genetic effect occurs through pathways independent of traditional coronary risk factors. The genetic contribution to CIMT has inspired a large number of genome-wide association studies (GWASs) to look for single-nucleotide polymorphisms (SNPs) that influence CIMT (Franceschini et al. 2018). Although multiple SNPs have been detected to associate with CIMT measurements, a very large proportion of its variation remains unexplained. A recent large-scale GWAS based on the UK Biobank data with CIMT measurements identified seven novel loci that were associated with all 3 phenotypes of CIMT (minimum, mean, and maximum thickness) (Yeung et al. 2022). Of special note, among the reported novel loci, two are transcription factor (TF) genes ZNF385D and HAND2.
Transcription factors recognize specific DNA sequences to control chromatin and transcription regulation (?), forming a complex system that guides expression of the genome (Lambert et al. 2018), through either activating or repressing the expression of target genes. Mutated or dysregulated transcription factors represent a unique class of drug targets that mediate aberrant gene expression in disease development (Bushweller 2019). Characterizing the regulatory activities of TFs using transcriptomic data offers the opportunity to uncover their targeting genes and networks, thus helping with the understanding of molecular etiologies of specific diseases. This accumulated knowledge can contribute to the design of interventional and treatment strategies.
This study applies transcriptional regulatory network analysis (Fletcher et al. 2013) to genome-wide gene expression data on CIMT to infer the target genes (networks) regulated by ZNF385D and HAND2. Furthermore, the joint association with CIMT is explored in order to obtain a better understanding of TF involvement in carotid atheroma plaque formation and exploring its impacts on intervention and prevention of carotid atherosclerosis.
2. Materials and Methods
Study samples and transcriptomic data
This study uses global gene expression data contributed in 2013 and last updated in 2018 by Catherine Cerutti and colleagues at Université Lyon 1 & Hôpital Nord-Ouest to the Gene Expression Omnibus with accession number GSE43292. Detailed information about sample collection and laboratory experiment can be found elsewhere (Ayari & Bricca, 2013). In brief, 34 patients (5 females and 29 males, mean age 70 years) who underwent carotid endarterectomy were included in the study. The carotid endarterectomy samples were collected in the surgery room and immediately dissected into two fragments: Atheroma plaque (ATH) of stages IV and above according to the Stary classification, containing core and shoulders of the plaque, each paired with one sample of distant macroscopically intact tissue (MIT) of stages I and II. Genome-wide gene expression data were obtained using the Affymetrix GeneChip Human Gene 1.0 ST arrays (Affymetrix, Santa Clara, CA, USA) covering a total of 764,885 distinct probes from 20,267 genes. Before data analysis, the probe level expression data were first log transformed with base 2 and then averaged across multiple probes within each gene to obtain gene level expression data.
Transcriptome-wide association study (TWAS)
To perform the network-based analysis for the cluster of targeted genes of a specific TF, each gene cover by the platform needs to be statistically tested to provide a basic distribution for the subsequent enrichment testing of a specific TF regulated network. Considering the self-matched experiment design, a paired t-test was applied to compare the mean expression level in atheroma plaque (ATH) with that from the macroscopically intact tissue (MIT) for each gene. A genome-wide significance was defined by an adjust p<2.5e-6 using the Bonferroni correction.
TF Regulatory Network Inference
We applied the Bioconductor package, RTN (Reconstruction of Transcriptional regulatory Networks and analysis of regulons,
https://bioconductor.org/packages/devel/bioc/vignettes/RTN/inst/doc/RTN.html) for TF regulatory network analysis. By defining the set of genes controlled by a given TF as a regulon, the RTN package provides classes and methods for the reconstruction of TRNs and analysis of regulons. The network inference procedure starts with computing MI (mutual information) (Kinney & Atwal, 2014) between a regulator and all potential targets using function tni.constructor() and removing non-significant associations by permutation using function tni.permutation(), followed by additional steps that remove unstable and weak interactions in any triplet formed by two TFs and a common target gene.
TF Regulatory Network Analysis
In order to test whether an inferred regulon is positively or negatively associated with CIMT, we applied the gene-set enrichment analysis (GSEA) using tna.gsea1() function for one-tailed GSEA (GSEA-1T) and tna.gsea2() for two-tailed GSEA (GSEA-2T). GSEA-1T finds regulons associated with CIMT represented by a ranked list of genes generated from a global differential gene expression signature (i.e. TWAS). Here the regulon’s target genes are considered a gene set, which is evaluated against a phenotype (here the absolute value of log fold change, logFC, with base 2). The GSEA-1T uses a rank-based scoring metric to test the association between the gene set and CIMT (Subramanian et al. 2005). A GSEA-2T considers the target genes could be either up (or positively) or down (or negatively) regulated by a TF. The function first maps the target genes in a regulon to the distribution of all ranked TWAS genes by a phenotype (logFC). The algorithm in both GSEA-1T and GSEA-2T calculates an enrichment score (ES) that reflects the degree to which the target genes are overrepresented at the extremes (top or bottom) of the entire ranked distribution. Note that GSEA-2T calculates two ESs, ESpositive and ESnegative, for positively or negatively regulated target genes respectively, with the difference between them (△ES = ESpositive - ESnegative) representing the overall regulon activity. Finally, the statistical significance of a regulon is assessed by a permutation test with 1000 random permutations or replications. A permutation p<0.05 is considered statistically significant.
3. Results
Global differential expression analysis
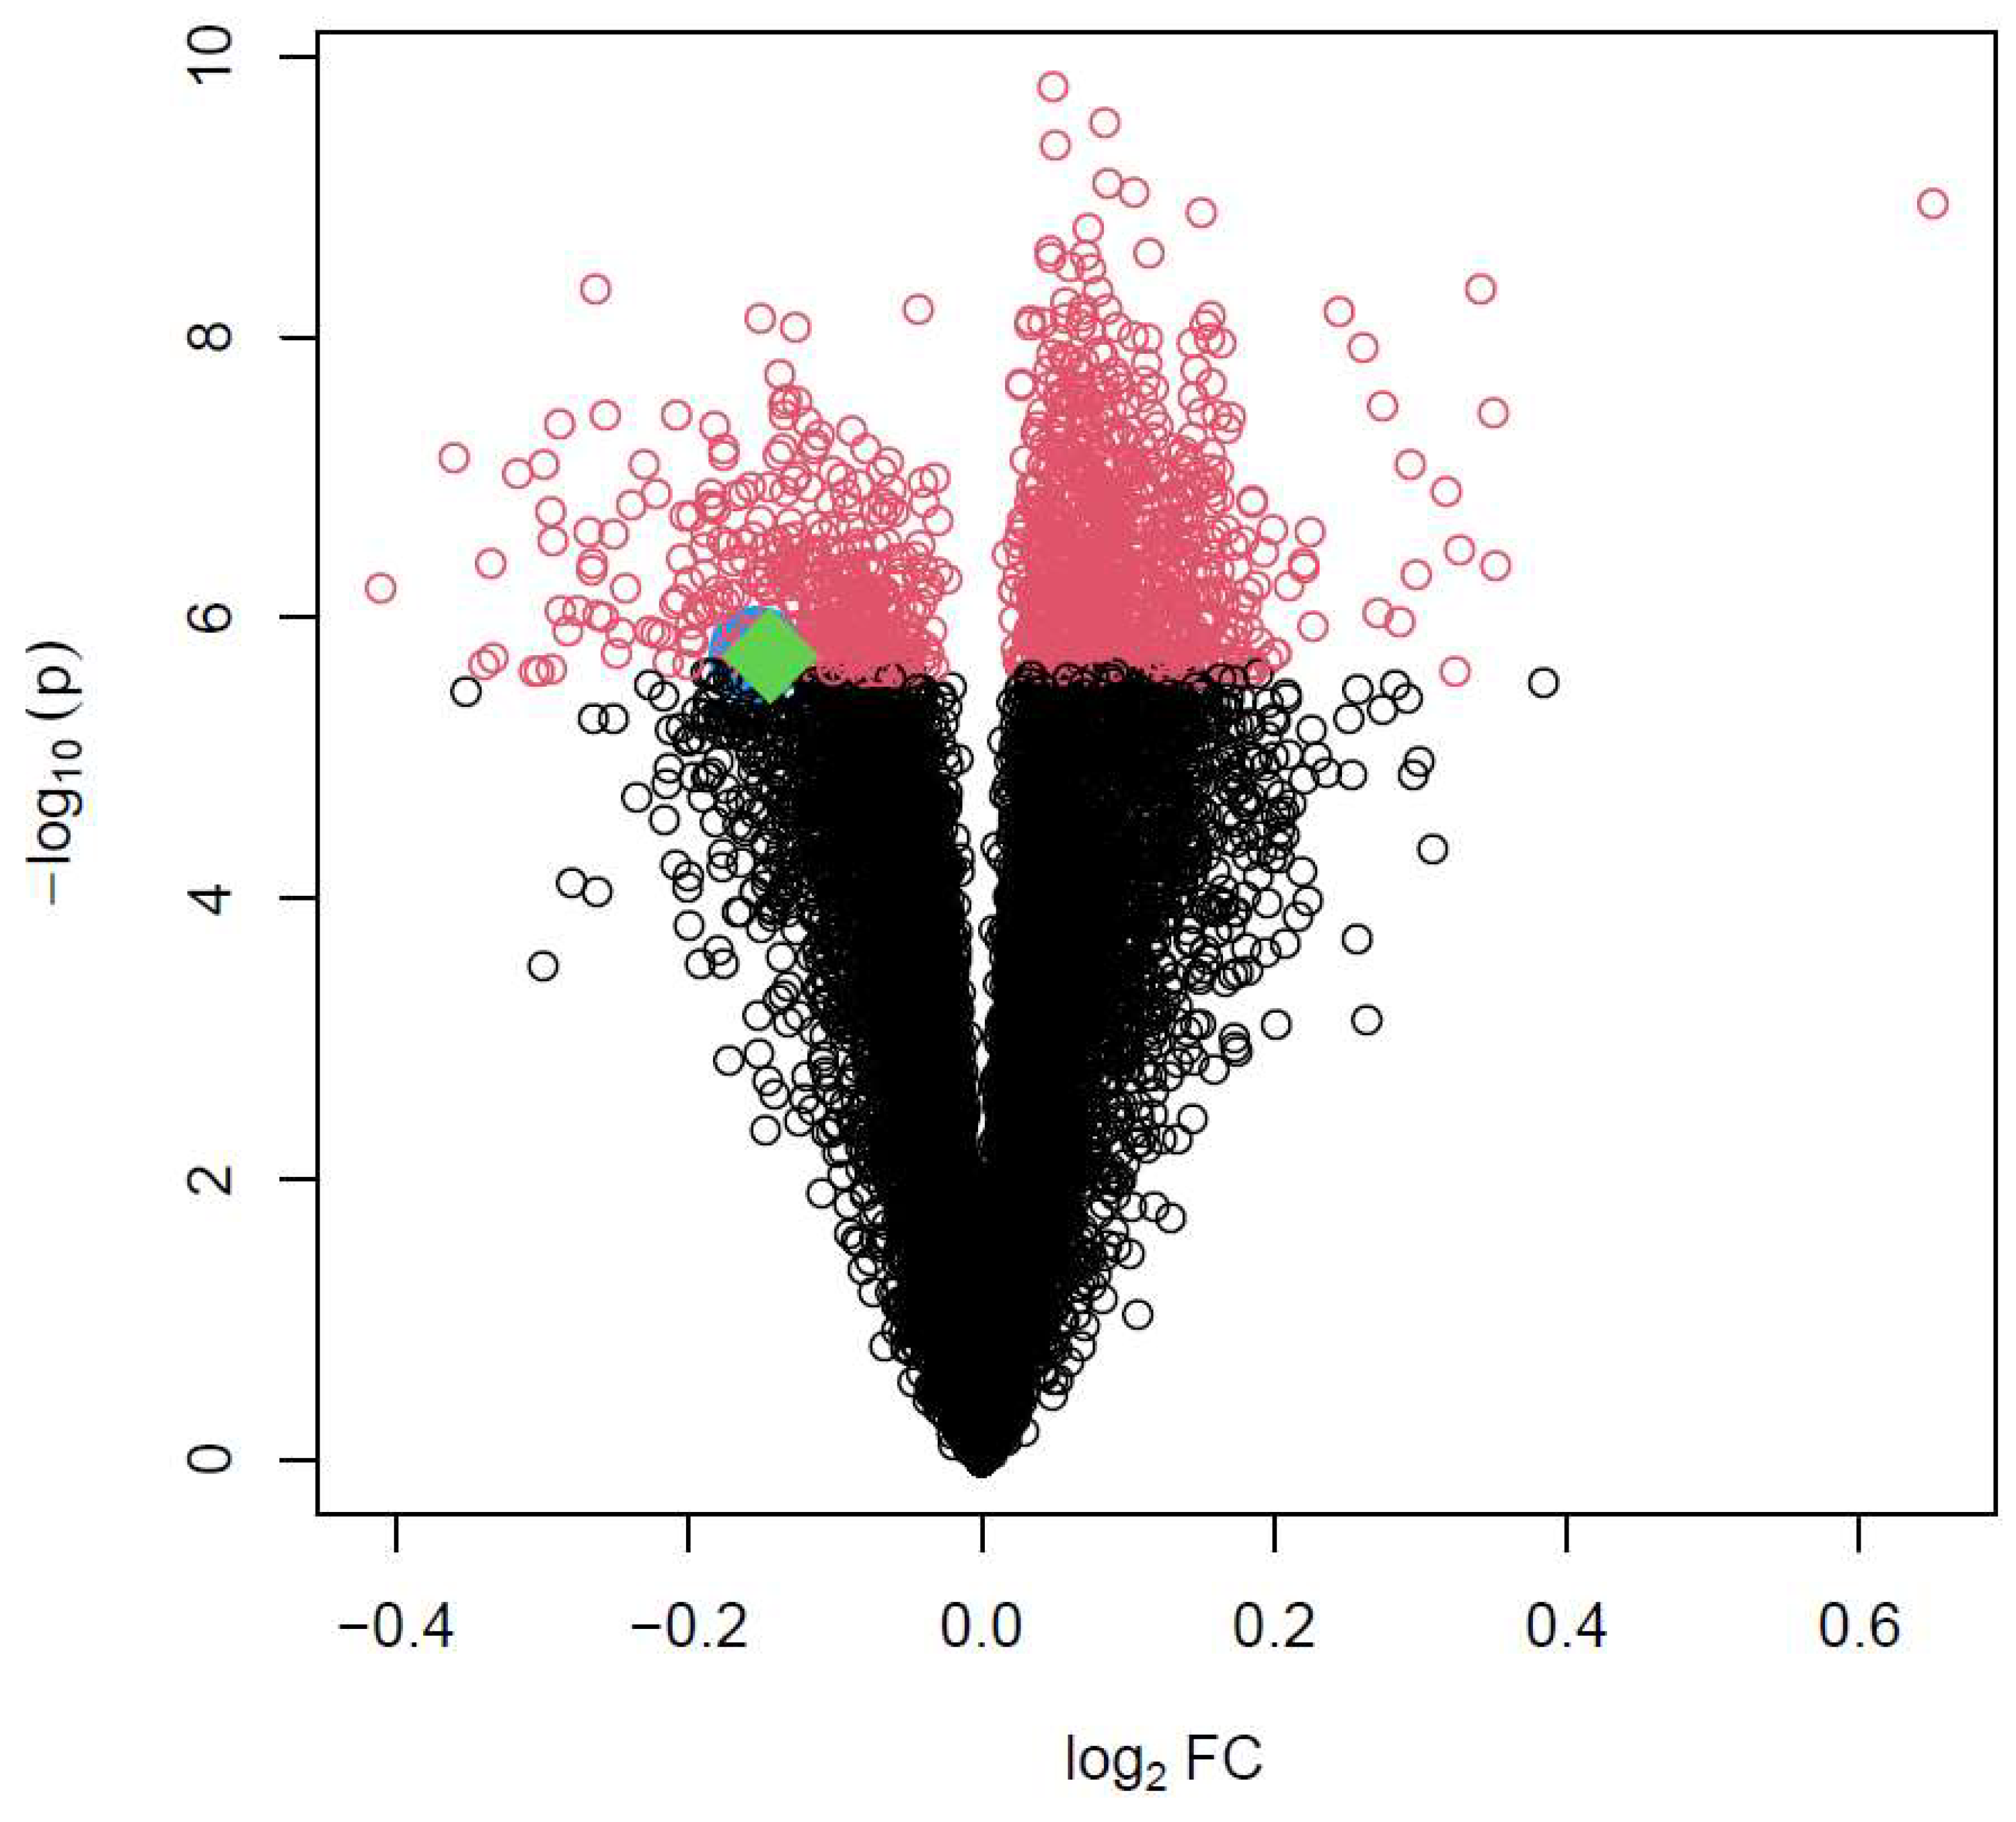
To provide a reference distribution of statistical testing on differential expression of the 20267 genes for subsequent network enrichment analysis, we first performed a global gene expression analysis i.e. TWAS using paired t-test. After adjusting for multiple testing using the stringent Bonferroni correction, 1111 genes meet genome-wide significance with p<2.5e-06.
Figure 1 is a volcano plot displaying the statistical significance (minus log p value with base 10) against the fold change (log scale with base 2, logFC), with the 1111 genes colored red (
Supplementary Table S1). The two transcription factor genes,
ZNF385D (logFC=-0.14, p=1.88e-06) and
HAND2 (logFC=-0.15, p=1.82e-06), are specifically shown by enlarged symbols (
ZNF385D as red,
HAND2 as blue) in
Figure 1. Both genes are down-regulated in ATH with logFC<0 and with nearly borderline genome-wide significance.
Inference of transcriptional network
Transcriptional network inference for
ZNF385D identified a large and balanced network with a total of 5644 target genes, among them 3078 genes are positively regulated, and 2566 genes negatively regulated by
ZNF385D (
Table 1). For
HAND2, a large but unbalanced regulatory network was detected, consisting of 781 target genes – 144 with positive while 637 with negative regulation by
HAND2. This network is unbalanced because there are many more target genes that are negatively regulated.
Analysis of transcriptional network
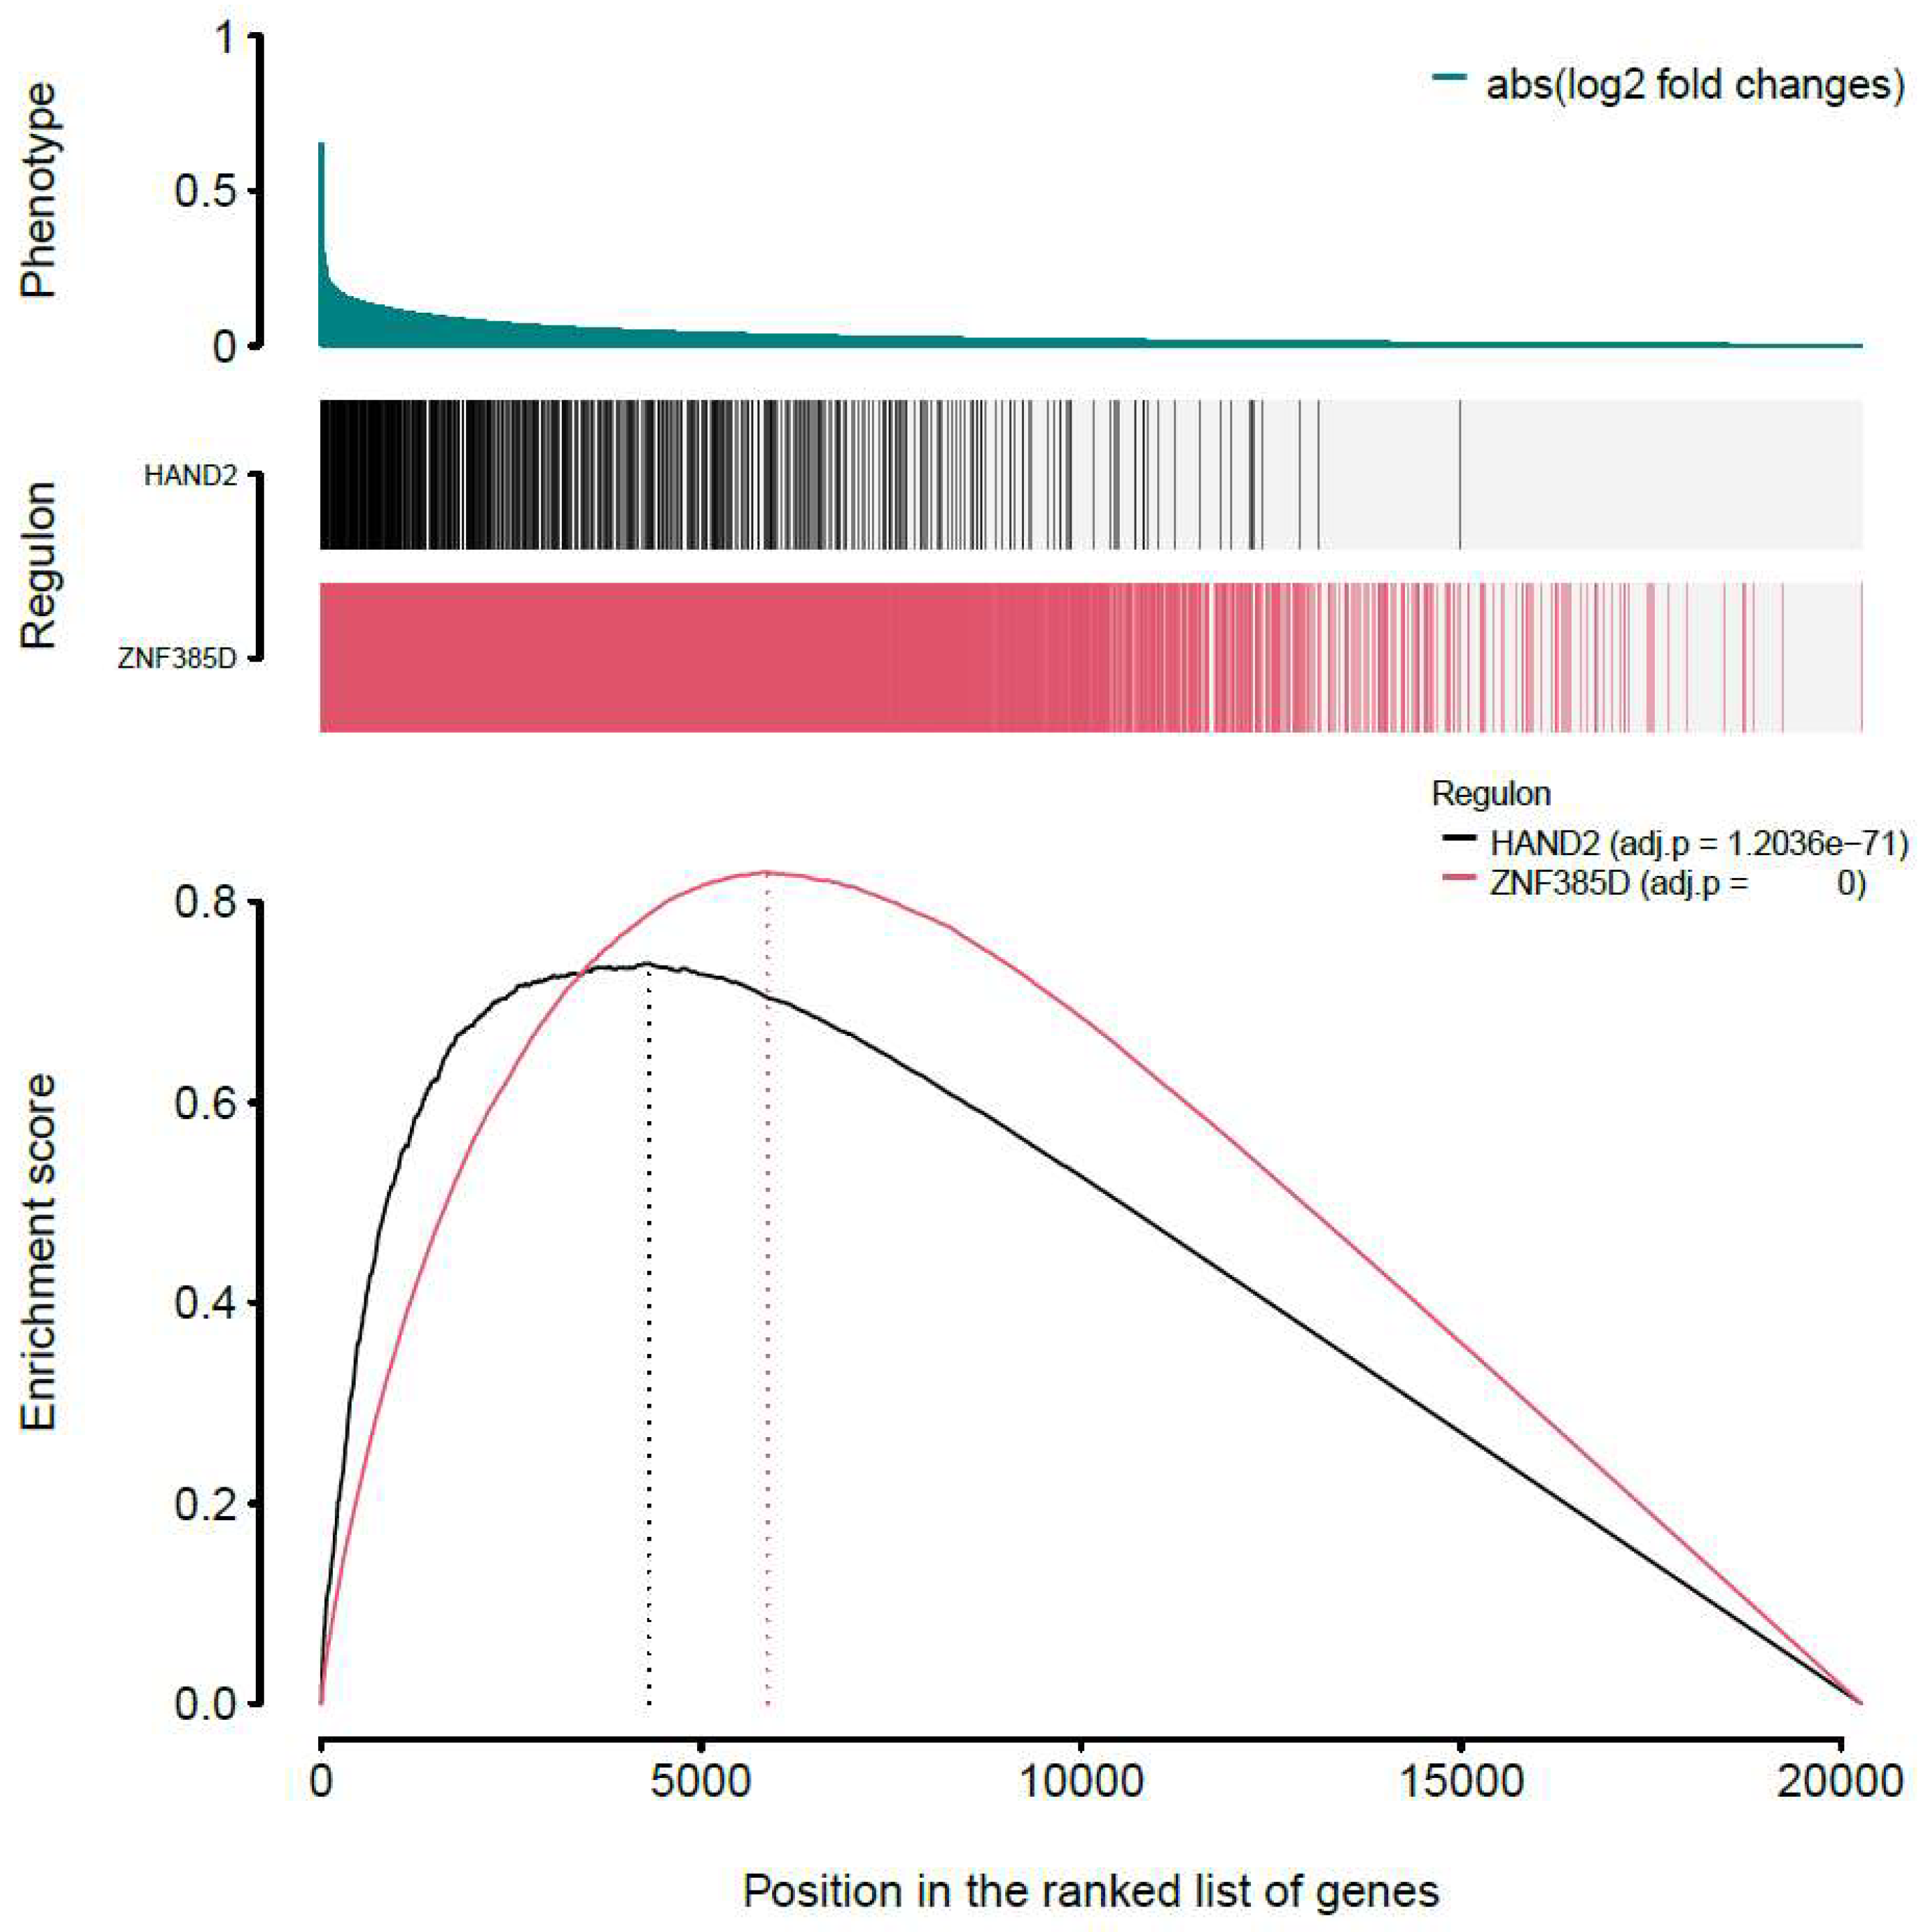
By introducing GSEA, we first started with the one-tailed test, GSEA-1T, where genes are ranked by their phenotype or effect size (absolute logFC). For
ZNF385D, an enrichment score of 0.83 is observed with a p value of 0 (
Table 1,
Figure 2). For
HAND2, the ES is estimated as 0.74 with a p value of 1.2e-71. In
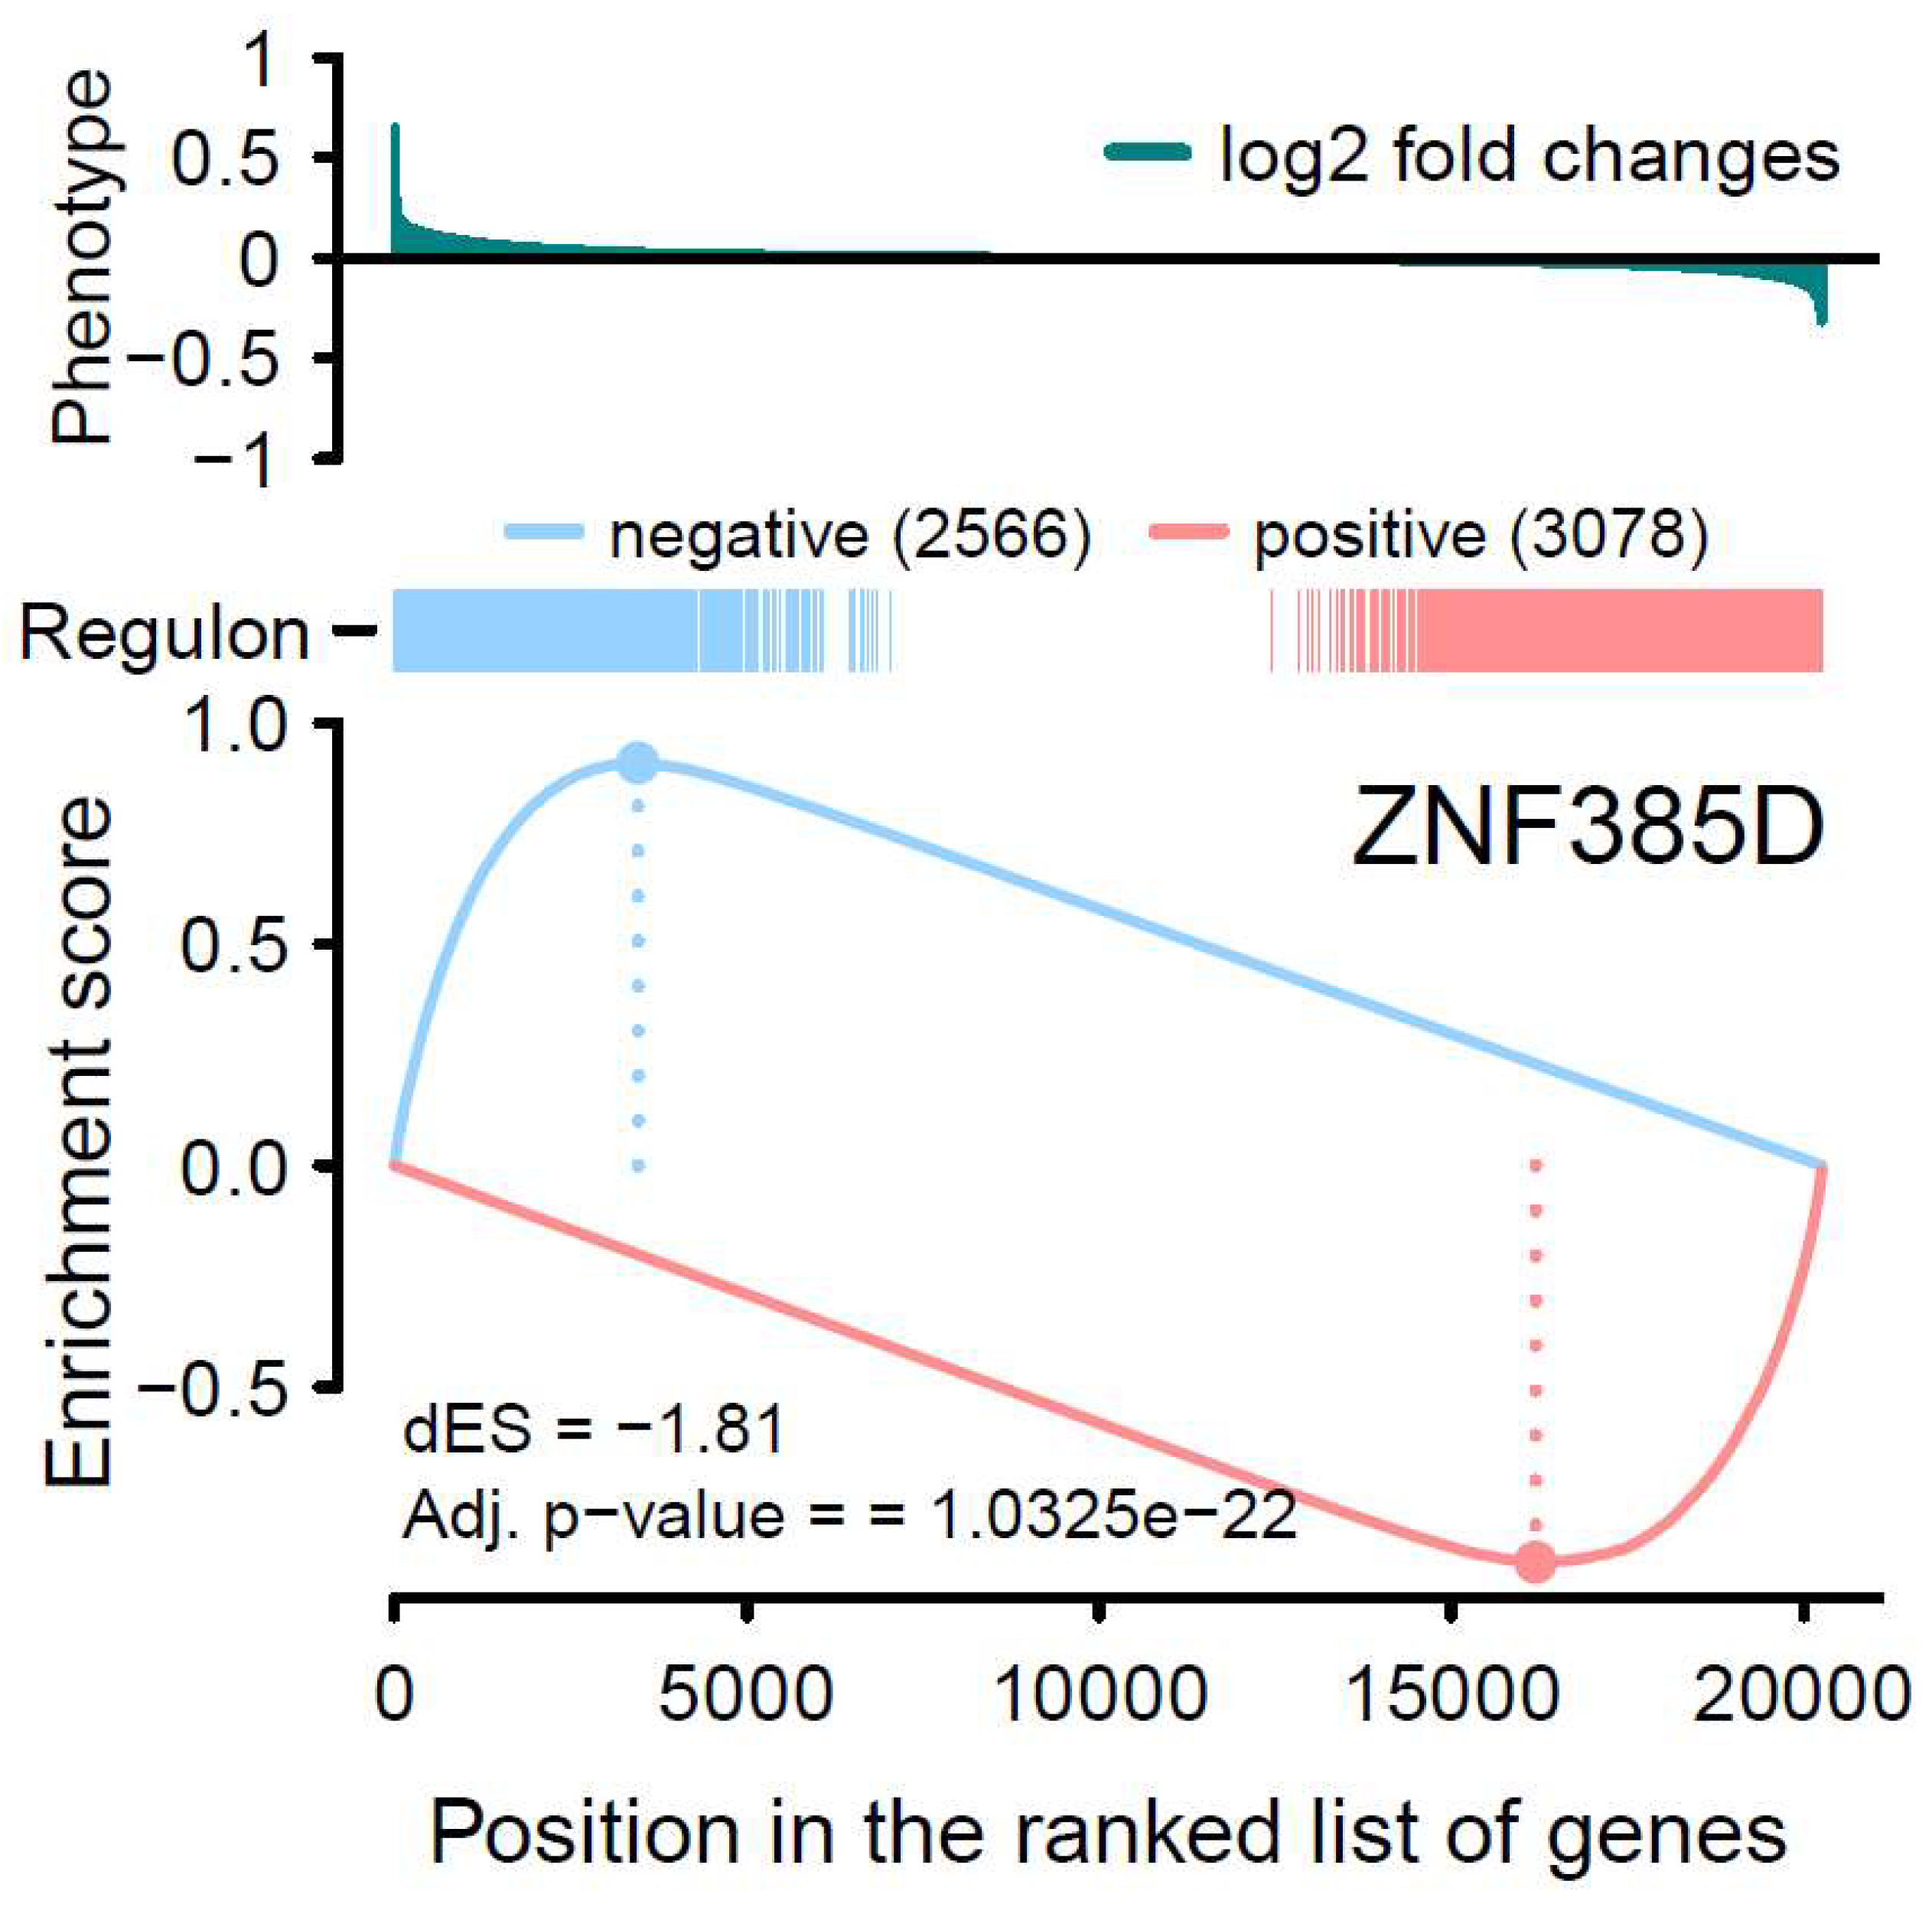
Figure 2, the target genes in both networks (regulons) are densely mapped to the left side of the ranked phenotype (absolute logFC) distribution. As a result, both networks are extremely significantly enriched by genes differentially expressed in ATH. We next move to a two-sided test, GSEA-2T, taking the direction (positive and negative) of TF regulation into account. For
ZNF385D, the ES for positive regulation, ES
positive, is -0.9 (p=1.18e-20) and that for negative regulation, ES
negative, is 0.91 (p=3.03e-7) (
Table 1). The difference between positive and negative enrichment scores, ∆ES, which represent the overall activity of the network, is 1.81 with a p value of 5.16e-23. It can be seen from
Figure 3, the target genes in the network are enriched at two ends of the phenotype distribution of ranked logFC showing both increased (negatively regulated by
ZNF385D, colored blue) and decreased (positively regulated by
ZNF385D, colored red) expression in ATH. The figure also displays an adjusted p value of 1.03e-22 for the overall regulatory activity of the network because two networks have been tested. Likewise, GSEA-2T on the
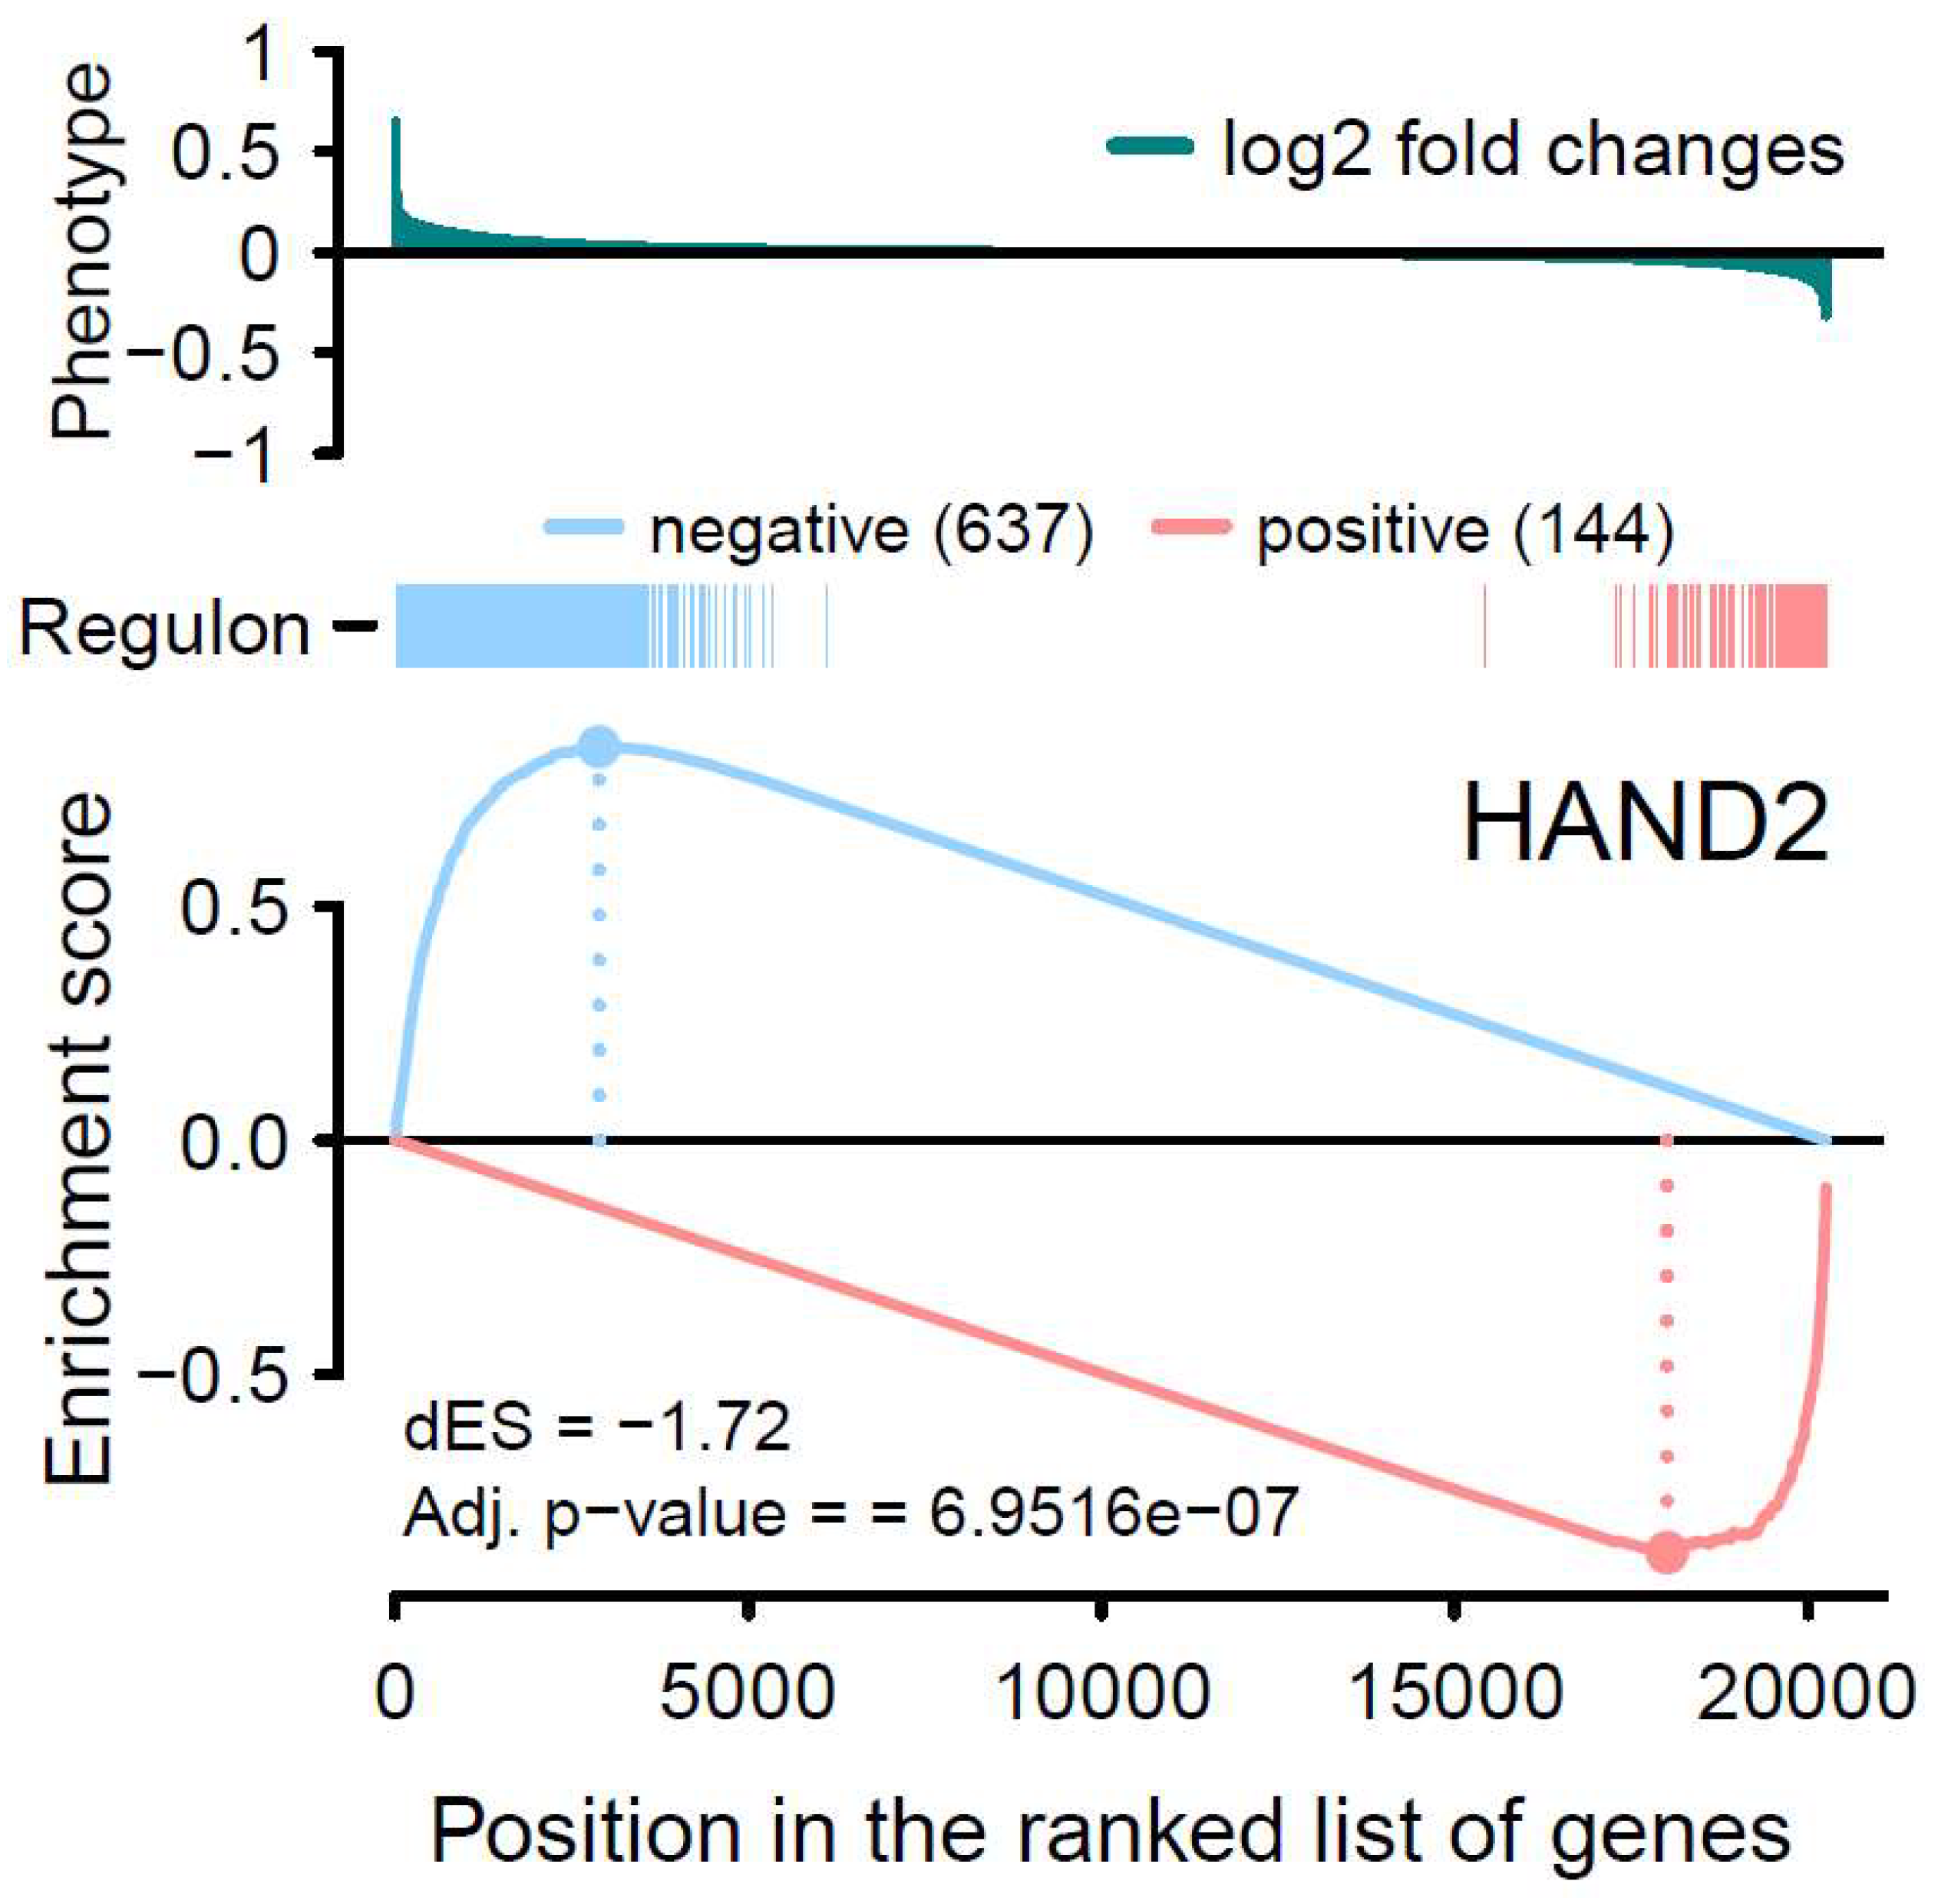
HAND2 regulated network estimated an ES
postive of -0.88 (p=2.64e-4), an ES
negative of 0.84 (p=4.4e-4), and a ∆ES of -1.72 (p=6.95e-7) (
Table 1). The unbalanced regulation can be seen in
Figure 4, where the many more target genes are mapped to the left side of the ranked phenotype distribution.
4. Discussion
Based on high coverage global gene expression data, we can infer and test the transcriptional networks of two transcription factors, ZNF385D and HAND2, whose genetic polymorphisms have been very recently reported to show association with carotid intima-media thickness in a large scale GWAS (Yeung et al. 2022). As a transcriptomic approach, our results provide novel insights concerning the regulatory mechanism of the two TFs in the development of carotid atherosclerosis while suggesting the critical impact of TF regulation in cardiovascular pathogenesis.
It is important to note that, in
Figure 1, the expression activities of both
ZNF385D and
HAND2 are downregulated in the disease tissue (ATH). From
Figure 3 and
Figure 4, it is clear the target genes that are activated in ATH show negative correlation with
ZNF385D and
HAND2 activities, while target genes that are suppressed in ATH are positively correlated with the functionalities of the two TFs. In other words, the target genes in the TF networks that are active in ATH are inhibited by TF expression, while target genes that are suppressed in ATH are activated by TF expression. Such observation can have high clinical and interventional relevance, as activation of the two TF genes could lead to altered expression patterns unfavorable to carotid atheroma plaque formation and potentially slow down or stop carotid atherosclerosis.
As genetic polymorphisms of the two TFs genes are reported to associate with CIMT (Yeung et al. 2022), the extremely high significant expression patterns of their inferred regulatory network could together suggest that the significant SNPs from the GWAS function as expression quantitative loci (eQTL) in the pathogenesis of CIMT. Here the effective variants of the significant SNPs could manifest improved binding affinity to target genes to activate or inhibit their transcription (Flynn et al. 2022). Although our network-based analysis for
ZNF385D and
HAND2 showed extremely high significant association with CIMT, as can be seen from
Figure 1, the two genes are not on top of the most significant genes in TWAS. We think, however, the different polymorphisms at the relevant SNPs could mean that only carriers of the effective alleles benefit from the favorable regulation patterns of the network, while what we see from
Figure 1 is an overall mean expression of both carriers and non-carriers in the samples. Further studies collecting SNP and gene expression data on the same individuals should help to clarify the relationship in eQTL regulation.
It is generally believed that lifestyle risk factors for atherosclerosis are also partly genetically determined and some of the variants, which play a role in atherogenesis overlap with those modulating its risk factors (Holdt & Teupser, 2015). However, a traditional genetic epidemiology study using twin modeling indicated that most of this genetic effect on CIMT occurs through pathways independent of traditional coronary risk factors (Zhao et al. 2008). The extremely strong CIMT association from our inferred gene expression networks under regulation of genetically polymorphic ZNF385D and HAND2 is in support of genetically controlled functional pathways independent of lifestyle and behavior factors in the development of atherosclerosis.
In
Figure 2, the one-sided GSEA obtained much high statistical significance as indicated by the extremely low p values (close to 0). This enriched power in statistical testing is because GSEA-1T jointly tests both positively and negatively regulated target genes, while ignoring the direction of TF regulation. As exemplified in our analysis, it is however highly important to test the enrichment patterns of the positive and negative regulations in the network, so that more insightful interpretation of the TF activity in disease pathogenesis can be made and clinical or interventional impacts discussed. To this end, it is sensible to perform both one and two-sided GSEAs for evaluating each inferred transcriptional network.
Overall, our analysis on the transcriptional networks of ZNF385D and HAND2 reveals extremely high statistical significance in their joint contribution to CIMT development. Detailed examination of the regulation and correlation patterns suggest that the regulatory activities of the two TF genes could have high clinical and interventional impacts on retarding and preventing carotid atherosclerosis and cardiovascular diseases.
Supplementary Materials
The following supporting information can be downloaded at the website of this paper posted on Preprints.org.
Author Contributions
M.T. conceived the study and wrote the paper. M.T. coordinated the research. L.J.A., N.E.B., M.S. and M.G.L. contributed to interpretation and discussion of the results. Q.T. designed and performed data analysis and bioinformatics. All authors reviewed the manuscript. The primary work with this study was conducted during M.T.’s affiliation with Zealand University Hospital, Roskilde, Denmark.
Ethical Approval
Not applicable.
Availability of data and materials
Not applicable.
Acknowledgments
We thank the original authors, Ayari H. and Bricca G at University of Lyon1 1 & Hôpital Nord-Ouest for their data contribution to Gene Expression Omnibus, which enabled our new analysis.
Conflicts of Interest
None declared.
References
- Akbari-Sedigh, A., Asghari, G., Yuzbashian, E. et al. Association of dietary pattern withcarotid intima media thickness among children with overweight or obesity. Diabetol Metab Syndr 2019; 11:77.
- Ayari H, Bricca G. Identification of two genes potentially associated in iron-heme homeostasis in human carotid plaque using microarray analysis. J Biosci 2013;38(2):311-5. [CrossRef]
- Bushweller JH. Targeting transcription factors in cancer - from undruggable to reality. Nat Rev Cancer. 2019;19(11):611-624. [CrossRef]
- Della-Morte D, Dong C, Markert MS, et al. Carotid Intima-Media Thickness Is Associated With White Matter Hyperintensities: The Northern Manhattan Study. Stroke. 2018;49(2):304–311. [CrossRef]
- Fletcher MN, Castro MA, Wang X, de Santiago I, O'Reilly M, Chin SF, Rueda OM, Caldas C, Ponder BA, Markowetz F, Meyer KB. Master regulators of FGFR2 signalling and breast cancer risk. Nat Commun. 2013;4:2464. [CrossRef]
- Flynn ED, Tsu AL, Kasela S, Kim-Hellmuth S, Aguet F, Ardlie KG, Bussemaker HJ, Mohammadi P, Lappalainen T. Transcription factor regulation of eQTL activity across individuals and tissues. PLoS Genet. 2022;18(1):e1009719. [CrossRef]
- Franceschini N, Giambartolomei C, de Vries PS, et al. GWAS and colocalization analyses implicate carotid intima-media thickness and carotid plaque loci in cardiovascular outcomes. Nat Commun. 2018;9(1):5141. [CrossRef]
- Gardener H, Caunca MR, Dong C, et al. Ultrasound Markers of Carotid Atherosclerosis and Cognition: The Northern Manhattan Study. Stroke. 2017;48(7):1855–1861.
- Holdt LM, and Teupser D. Genetic background of atherosclerosis and its risk factors, in Stephan Gielen and others (eds), The ESC Textbook of Preventive Cardiology, ESC textbook (Oxford, 2015; online edn, ESC Publications, 1 June 2015). 1 June. [CrossRef]
- Juo SH, Lin HF, Rundek T, et al. Genetic and environmental contributions to carotid intima-media thickness and obesity phenotypes in the Northern Manhattan Family Study. Stroke. 2004;35(10):2243–2247. [CrossRef]
- Kinney JB, Atwal GS. Equitability, mutual information, and the maximal information coefficient. Proc Natl Acad Sci U S A. 2014;111(9):3354-9. [CrossRef]
- Lambert SA, Jolma A, Campitelli LF, Das PK, Yin Y, Albu M, Chen X, Taipale J, Hughes TR, Weirauch MT. The Human Transcription Factors. Cell. 2018;172(4):650-665. [CrossRef]
- Marshall D, Elaine W, Vernalis M.The effect of a one-year lifestyle intervention program on carotid intima media thickness. Mil Med. 2011;176(7):798-804.
- Park J, Park JH, Park H. Association Between Carotid Artery Intima-Media Thickness and Combinations of Mild Cognitive Impairment and Pre-Frailty in Older Adults. Int J Environ Res Public Health. 2019;16(16):2978.
- Subramanian A, Tamayo P, Mootha VK, Mukherjee S, Ebert BL, Gillette MA, Paulovich A, Pomeroy SL, Golub TR, Lander ES, Mesirov JP. Gene set enrichment analysis: a knowledge-based approach for interpreting genome-wide expression profiles. Proc Natl Acad Sci U S A. 2005;102(43):15545-50. [CrossRef]
- Yeung MW, Wang S, van de Vegte YJ, Borisov O, van Setten J, Snieder H, Verweij N, Said MA, van der Harst P. Twenty-Five Novel Loci for Carotid Intima-Media Thickness: A Genome-Wide Association Study in >45 000 Individuals and Meta-Analysis of >100 000 Individuals. Arterioscler Thromb Vasc Biol. 2022;42(4):484-501. [CrossRef]
- Zhao J, Cheema FA, Bremner JD, et al. Heritability of carotid intima-media thickness: a twin study. Atherosclerosis. 2008;197(2):814–820. [CrossRef]
|
Disclaimer/Publisher’s Note: The statements, opinions and data contained in all publications are solely those of the individual author(s) and contributor(s) and not of MDPI and/or the editor(s). MDPI and/or the editor(s) disclaim responsibility for any injury to people or property resulting from any ideas, methods, instructions or products referred to in the content. |
© 2024 by the authors. Licensee MDPI, Basel, Switzerland. This article is an open access article distributed under the terms and conditions of the Creative Commons Attribution (CC BY) license (http://creativecommons.org/licenses/by/4.0/).


