Submitted:
13 January 2024
Posted:
15 January 2024
You are already at the latest version
Abstract
Keywords:
1. Introduction
1.1. The Abyss between Cosmic Turbulence and Theory and Laboratory Experiments ...
1.2. And Yet...
1.3. Specific Molecules, as Tracers of Turbulent Dissipation
2. Intermittency in Simulations of Magnetised Turbulence
2.1. Numerical Dissipation
2.2. The Nature of Coherent Structures in MHD Turbulence
2.3. Synthetic Observables and the Regions of Strong Dissipation
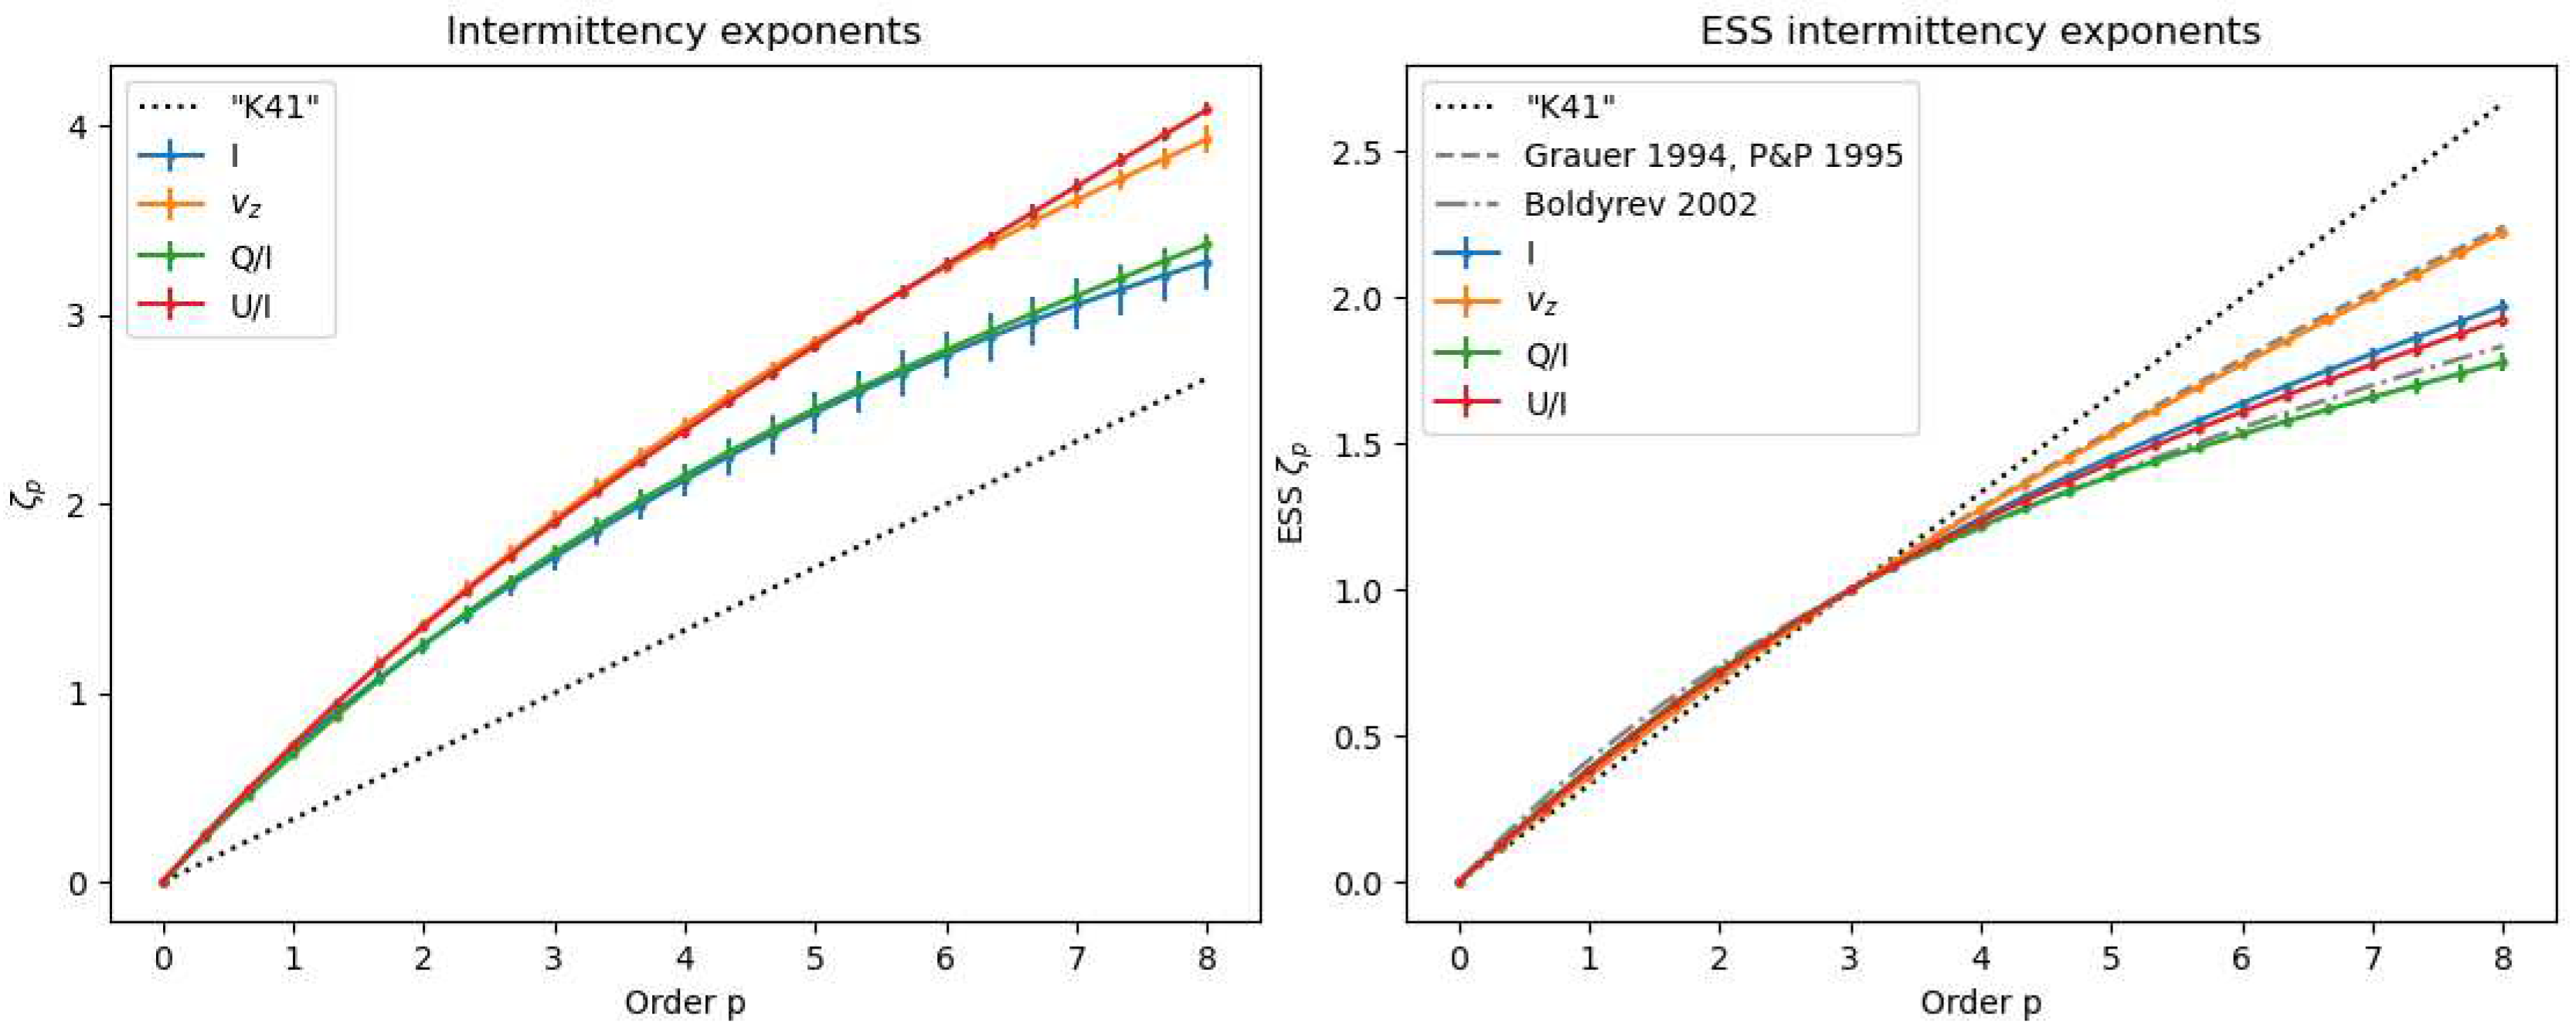
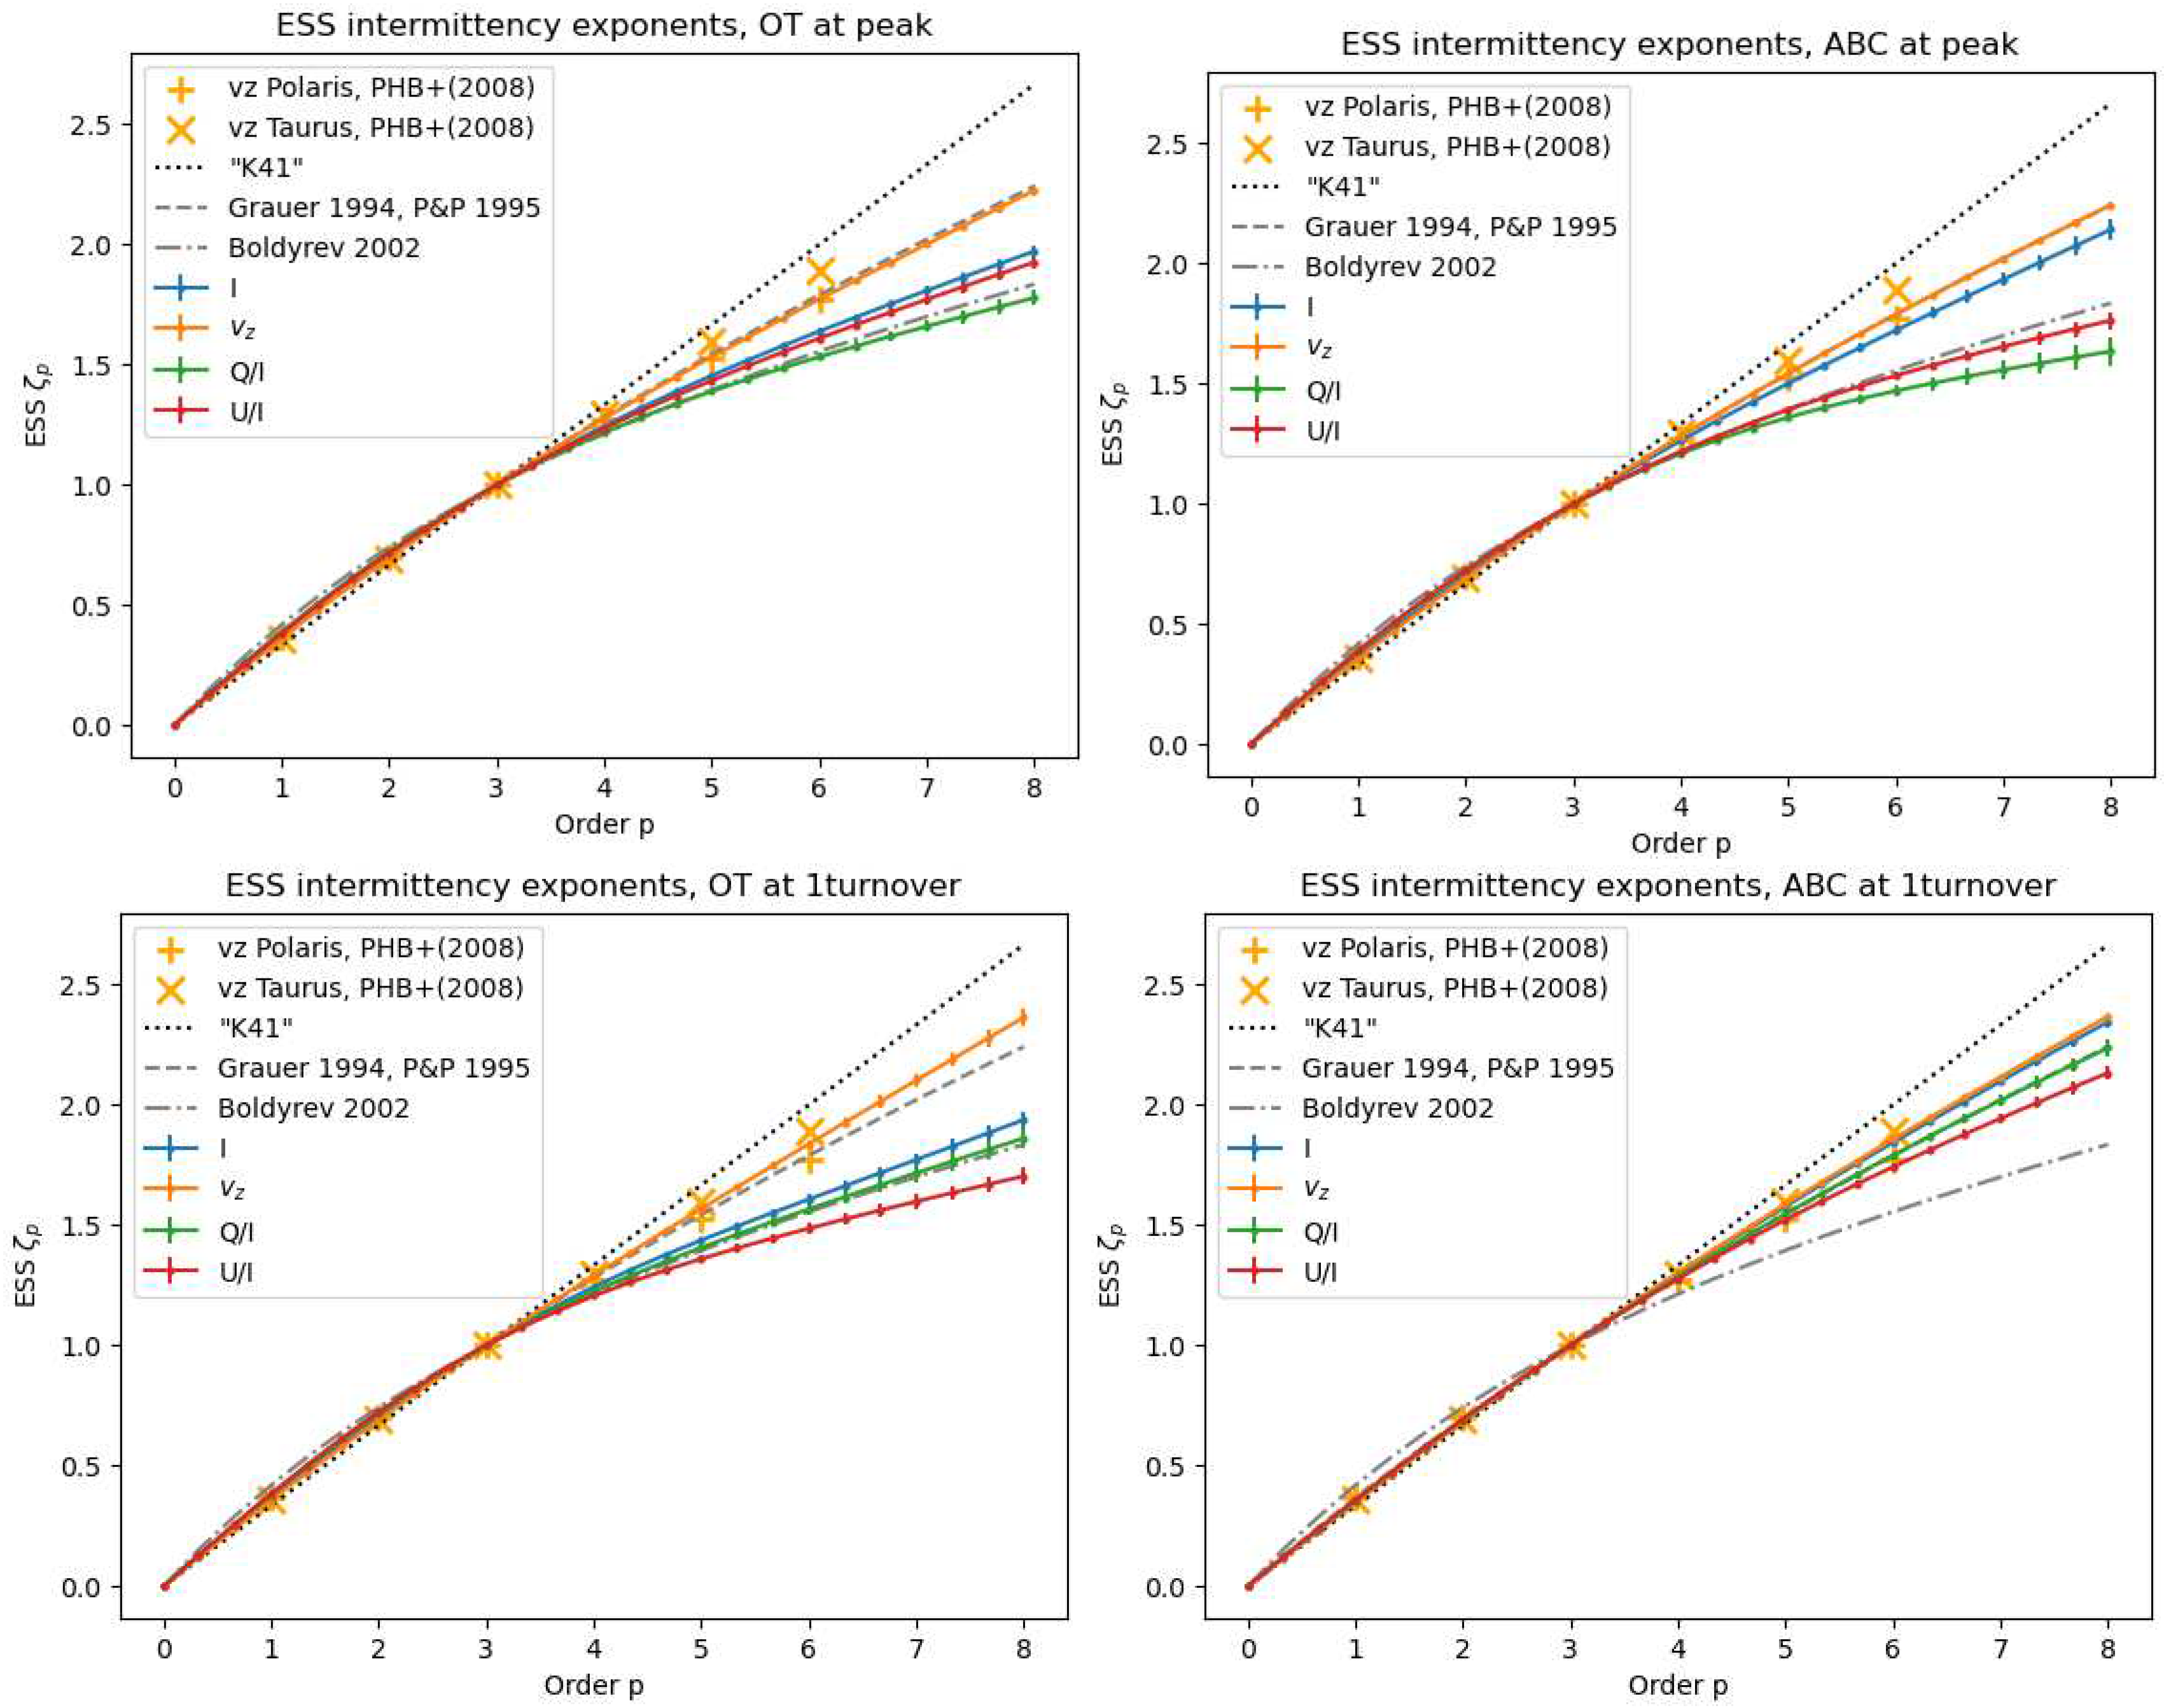
2.4. Intermittency Statistics from Increments of Observables.
3. Intermittency in Cosmic Turbulence
3.1. Extrema of Turbulent Dissipation in a Nearby Diffuse Molecular Cloud: A Source of CO Molecules
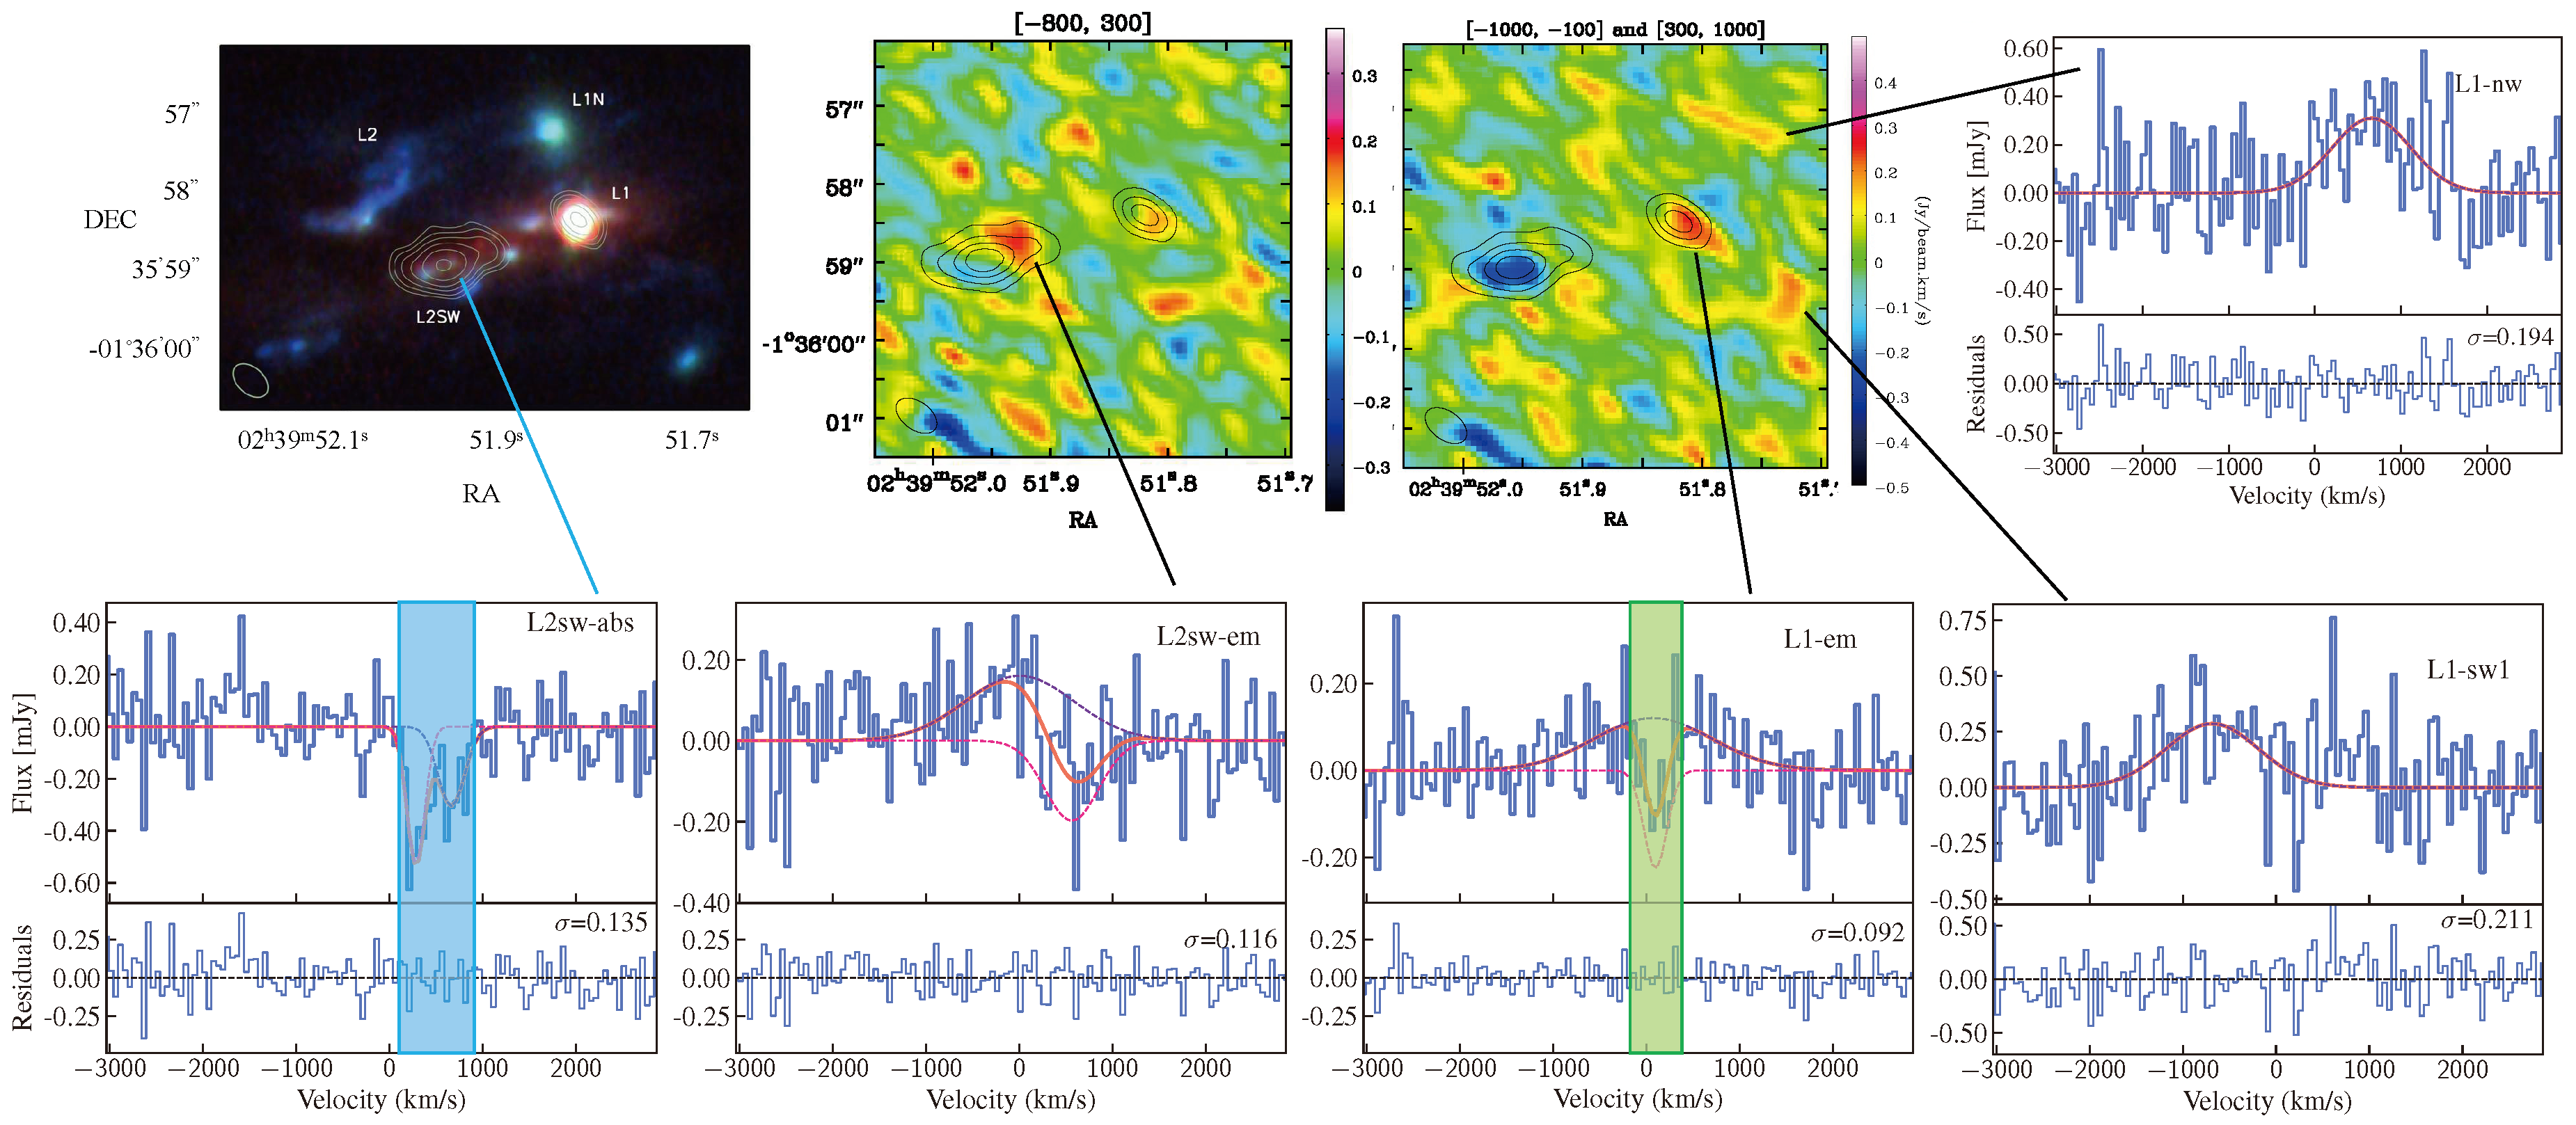
3.2. Turbulent Dissipation in the Circum-Galactic Medium of a Galaxy Group at Redshift 2.8
4. Conclusions and Perspectives
- in a situation outside stationary driven turbulence (we are in a case of decaying turbulence).
- for projected variables and plane of sky increments instead of the actual 3D increments.
Acknowledgments
References
- Chandrasekhar, S.; Fermi, E. Problems of Gravitational Stability in the Presence of a Magnetic Field. The Astrophysical Journal 1953, 118, 116. [Google Scholar] [CrossRef]
- Meneveau, C.; Sreenivasan, K.R. The multifractal nature of turbulent energy dissipation. Journal of Fluid Mechanics 1991, 224, 429–484. [Google Scholar] [CrossRef]
- She, Z.S.; Leveque, E. Universal scaling laws in fully developed turbulence. Phys. Rev. Letters 1994, 72, 336–339. [Google Scholar] [CrossRef] [PubMed]
- Alexakis, A.; Mininni, P.D.; Pouquet, A. Shell-to-shell energy transfer in magnetohydrodynamics. I. Steady state turbulence. Phys. Rev. E 2005, 72, 046301. [Google Scholar] [CrossRef] [PubMed]
- Alexakis, A.; Mininni, P.D.; Pouquet, A. Imprint of Large-Scale Flows on Turbulence. Phys. Rev. Letters 2005, 95, 264503. [Google Scholar] [CrossRef]
- Moffatt, H.K.; Kida, S.; Ohkitani, K. Stretched vortices - the sinews of turbulence; large-Reynolds-number asymptotics. Journal of Fluid Mechanics 1994, 259, 241–264. [Google Scholar] [CrossRef]
- Kimura, Y.; Sullivan, P.; Herring, J. Formation of temperature front in stably stratified turbulence. APS Division of Fluid Dynamics Meeting Abstracts, 2016, APS Meeting Abstracts, p. D35.005.
- Cadot, O.; Douady, S.; Couder, Y. Characterization of the low-pressure filaments in a three-dimensional turbulent shear flow. Physics of Fluids 1995, 7, 630–646. [Google Scholar] [CrossRef]
- Tabeling, P.; Zocchi, G.; Belin, F.; Maurer, J.; Willaime, H. Probability density functions, skewness, and flatness in large Reynolds number turbulence. Phys. Rev. E 1996, 53, 1613–1621. [Google Scholar] [CrossRef] [PubMed]
- Politano, H.; Pouquet, A. Dynamical length scales for turbulent magnetized flows. Geophysics Research Letters 1998, 25, 273–276. [Google Scholar] [CrossRef]
- Schekochihin, A.A. MHD turbulence: a biased review. Journal of Plasma Physics 2022, 88, 155880501. [Google Scholar] [CrossRef]
- Draine, B.T. Physics of the Interstellar and Intergalactic Medium; 2011.
- Balbus, S.A.; Terquem, C. Linear Analysis of the Hall Effect in Protostellar Disks. The Astrophysical Journal 2001, 552, 235–247. [Google Scholar] [CrossRef]
- Momferratos, G.; Lesaffre, P.; Falgarone, E.; Pineau des Forêts, G. Turbulent energy dissipation and intermittency in ambipolar diffusion magnetohydrodynamics. Monthly Notices of the Royal Astronomical Society 2014, 443, 86–101, https://academic.oup.com/mnras/article-pdf/443/1/86/4322985/stu853.pdf. [Google Scholar] [CrossRef]
- Field, G.B. Thermal Instability. The Astrophysical Journal 1965, 142, 531. [Google Scholar] [CrossRef]
- Stanimirović, S.; Zweibel, E.G. Atomic and Ionized Microstructures in the Diffuse Interstellar Medium. ARA&A 2018, 56, 489–540. [Google Scholar] [CrossRef]
- Ibáñez-Mejía, J.C.; Walch, S.; Ivlev, A.V.; Clarke, S.; Caselli, P.; Joshi, P.R. Dust charge distribution in the interstellar medium. MNRAS 2019, 485, 1220–1247. [Google Scholar] [CrossRef]
- Hennebelle, P.; Falgarone, E. Turbulent molecular clouds. A&ARv 2012, 20, 55. [Google Scholar] [CrossRef]
- Ferrière, K. Magnetic fields and UHECR propagation. European Physical Journal Web of Conferences, 2023, Vol. 283, European Physical Journal Web of Conferences, p. 03001. [CrossRef]
- Audit, E.; Hennebelle, P. On the structure of the turbulent interstellar clouds . Influence of the equation of state on the dynamics of 3D compressible flows. A&A 2010, 511, A76. [Google Scholar] [CrossRef]
- Kulsrud, R.; Pearce, W.P. The Effect of Wave-Particle Interactions on the Propagation of Cosmic Rays. The Astrophysical Journal 1969, 156, 445. [Google Scholar] [CrossRef]
- Draine, B.T.; Katz, N. Magnetohydrodynamic Shocks in Diffuse Clouds. II. Production of CH +, OH, CH, and Other Species. The Astrophysical Journal 1986, 310, 392. [Google Scholar] [CrossRef]
- Flower, D.R.; Pineau des Forets, G. C-type shocks in the interstellar medium: profiles of CH+ and CH absorption lines. MNRAS 1998, 297, 1182–1188. [Google Scholar] [CrossRef]
- Godard, B.; Pineau des Forêts, G.; Lesaffre, P.; Lehmann, A.; Gusdorf, A.; Falgarone, E. Models of irradiated molecular shocks. A&A 2019, 622, A100. [Google Scholar] [CrossRef]
- Lehmann, A.; Godard, B.; Pineau des Forêts, G.; Falgarone, E. Self-generated ultraviolet radiation in molecular shock waves. I. Effects of Lyman α, Lyman β, and two-photon continuum. A&A 2020, 643, A101. [Google Scholar] [CrossRef]
- Lehmann, A.; Godard, B.; Pineau des Forêts, G.; Vidal-García, A.; Falgarone, E. Self-generated ultraviolet radiation in molecular shock waves. II. CH+ and the interpretation of emission from shock ensembles. A&A 2022, 658, A165. [Google Scholar] [CrossRef]
- Lesaffre, P.; Pineau des Forêts, G.; Godard, B.; Guillard, P.; Boulanger, F.; Falgarone, E. Low-velocity shocks: signatures of turbulent dissipation in diffuse irradiated gas. A&A 2013, 550, A106. [Google Scholar] [CrossRef]
- Armstrong, J.W.; Rickett, B.J.; Spangler, S.R. Electron Density Power Spectrum in the Local Interstellar Medium. The Astrophysical Journal 1995, 443, 209. [Google Scholar] [CrossRef]
- Miville-Deschênes, M.A.; Martin, P.G.; Abergel, A.; Bernard, J.P.; Boulanger, F.; Lagache, G.; Anderson, L.D.; André, P.; Arab, H.; Baluteau, J.P.; Blagrave, K.; Bontemps, S.; Cohen, M.; Compiegne, M.; Cox, P.; Dartois, E.; Davis, G.; Emery, R.; Fulton, T.; Gry, C.; Habart, E.; Huang, M.; Joblin, C.; Jones, S.C.; Kirk, J.; Lim, T.; Madden, S.; Makiwa, G.; Menshchikov, A.; Molinari, S.; Moseley, H.; Motte, F.; Naylor, D.A.; Okumura, K.; Pinheiro Gonçalves, D.; Polehampton, E.; Rodón, J.A.; Russeil, D.; Saraceno, P.; Schneider, N.; Sidher, S.; Spencer, L.; Swinyard, B.; Ward-Thompson, D.; White, G.J.; Zavagno, A. Herschel-SPIRE observations of the Polaris flare: Structure of the diffuse interstellar medium at the sub-parsec scale. A&A 2010, 518, L104. [Google Scholar] [CrossRef]
- Miville-Deschênes, M.A.; Duc, P.A.; Marleau, F.; Cuillandre, J.C.; Didelon, P.; Gwyn, S.; Karabal, E. Probing interstellar turbulence in cirrus with deep optical imaging: no sign of energy dissipation at 0.01 pc scale. A&A 2016, 593, A4. [Google Scholar] [CrossRef]
- Larson, R.B. Turbulence and star formation in molecular clouds. MNRAS 1981, 194, 809–826. [Google Scholar] [CrossRef]
- Heyer, M.; Krawczyk, C.; Duval, J.; Jackson, J.M. Re-Examining Larson’s Scaling Relationships in Galactic Molecular Clouds. The Astrophysical Journal 2009, 699, 1092–1103. [Google Scholar] [CrossRef]
- Kritsuk, A.G.; Norman, M.L.; Padoan, P.; Wagner, R. The Statistics of Supersonic Isothermal Turbulence. The Astrophysical Journal 2007, 665, 416–431. [Google Scholar] [CrossRef]
- Field, G.B.; Blackman, E.G.; Keto, E.R. Does external pressure explain recent results for molecular clouds? MNRAS 2011, 416, 710–714. [Google Scholar] [CrossRef]
- Miville-Deschênes, M.A.; Murray, N.; Lee, E.J. Physical Properties of Molecular Clouds for the Entire Milky Way Disk. The Astrophysical Journal 2017, 834, 57. [Google Scholar] [CrossRef]
- Godard, B.; Falgarone, E.; Pineau Des Forêts, G. Models of turbulent dissipation regions in the diffuse interstellar medium. A&A 2009, 495, 847–867. [Google Scholar] [CrossRef]
- Levrier, F.; Le Petit, F.; Hennebelle, P.; Lesaffre, P.; Gerin, M.; Falgarone, E. UV-driven chemistry in simulations of the interstellar medium. I. Post-processed chemistry with the Meudon PDR code. A&A 2012, 544, A22. [Google Scholar] [CrossRef]
- Lucas, R.; Liszt, H. The Plateau de Bure survey of galactic λ3mm HCO+âbsorption toward compact extragalactic continuum sources. A&A 1996, 307, 237. [Google Scholar]
- Lesaffre, P.; Gerin, M.; Hennebelle, P. Effects of turbulent diffusion on the chemistry of diffuse clouds. A&A 2007, 469, 949–961. [Google Scholar] [CrossRef]
- Godard, B.; Pineau des Forêts, G.; Hennebelle, P.; Bellomi, E.; Valdivia, V. 3D chemical structure of the diffuse turbulent interstellar medium. II. The origin of CH+: A new solution to an 80-year mystery. A&A 2023, 669, A74. [Google Scholar] [CrossRef]
- Flower, D.R.; Pineau des Forêts, G.; Hartquist, T.W. Theoretical studies of interstellar molecular shocks. I - General formulation and effects of the ion-molecule chemistry. MNRAS 1985, 216, 775–794. [Google Scholar] [CrossRef]
- Lesaffre, P.; Todorov, P.; Levrier, F.; Valdivia, V.; Dzyurkevich, N.; Godard, B.; Tram, L.N.; Gusdorf, A.; Lehmann, A.; Falgarone, E. Production and excitation of molecules by dissipation of two-dimensional turbulence. MNRAS 2020, 495, 816–834. [Google Scholar] [CrossRef]
- Godard, B.; Falgarone, E.; Pineau des Forêts, G. Chemical probes of turbulence in the diffuse medium: the TDR model. A&A 2014, 570, A27. [Google Scholar] [CrossRef]
- Falgarone, E.; Pineau des Forets, G.; Roueff, E. Chemical signatures of the intermittency of turbulence in low density interstellar clouds. A&A 1995, 300, 870. [Google Scholar]
- Joulain, K.; Falgarone, E.; Pineau des Forets, G.; Flower, D. Non-equilibrium chemistry in the dissipative structures of interstellar turbulence. A&A 1998, 340, 241–256. [Google Scholar]
- Federman, S.R.; Rawlings, J.M.C.; Taylor, S.D.; Williams, D.A. Synthesis of interstellar CH+ without OH. MNRAS 1996, 279, L41–L46. [Google Scholar] [CrossRef]
- Crutcher, R.M.; Wandelt, B.; Heiles, C.; Falgarone, E.; Troland, T.H. Magnetic Fields in Interstellar Clouds from Zeeman Observations: Inference of Total Field Strengths by Bayesian Analysis. The Astrophysical Journal 2010, 725, 466–479. [Google Scholar] [CrossRef]
- Crutcher, R.M. Magnetic Fields in Molecular Clouds. ARA&A 2012, 50, 29–63. [Google Scholar] [CrossRef]
- Falgarone, E.; Pety, J.; Hily-Blant, P. Intermittency of interstellar turbulence: extreme velocity-shears and CO emission on milliparsec scale. A&A 2009, 507, 355–368. [Google Scholar] [CrossRef]
- Richard, T.; Lesaffre, P.; Falgarone, E.; Lehmann, A. Probing the nature of dissipation in compressible MHD turbulence. A&A 2022, 664, A193. [Google Scholar] [CrossRef]
- Hily-Blant, P.; Falgarone, E.; Pety, J. Dissipative structures of diffuse molecular gas. III. Small-scale intermittency of intense velocity-shears. A&A 2008, 481, 367–380. [Google Scholar] [CrossRef]
- Hily-Blant, P.; Falgarone, E. Intermittency of interstellar turbulence: parsec-scale coherent structure of intense, velocity shear. A&A 2009, 500, L29–L32. [Google Scholar] [CrossRef]
- Vidal-García, A.; Falgarone, E.; Arrigoni Battaia, F.; Godard, B.; Ivison, R.J.; Zwaan, M.A.; Herrera, C.; Frayer, D.; Andreani, P.; Li, Q.; Gavazzi, R. Where infall meets outflows: turbulent dissipation probed by CH+ and Lyα in the starburst/AGN galaxy group SMM J02399-0136 at z 2.8. MNRAS 2021, 506, 2551–2573. [Google Scholar] [CrossRef]
- Moisy, F.; Jiménez, J. Geometry and clustering of intense structures in isotropic turbulence. Journal of Fluid Mechanics 2004, 513, 111–133. [Google Scholar] [CrossRef]
- Uritsky, V.M.; Pouquet, A.; Rosenberg, D.; Mininni, P.D.; Donovan, E.F. Structures in magnetohydrodynamic turbulence: Detection and scaling. Physical Review E - Statistical, Nonlinear, and Soft Matter Physics 2010, 82, 1–15. [Google Scholar] [CrossRef] [PubMed]
- Zhdankin, V.; Uzdensky, D.A.; Perez, J.C.; Boldyrev, S. Statistical analysis of current sheets in three-dimensional magnetohydrodynamic turbulence. The Astrophysical Journal 2013, 771. [Google Scholar] [CrossRef]
- Lehmann, A.; Federrath, C.; Wardle, M. SHOCKFIND - an algorithm to identify magnetohydrodynamic shock waves in turbulent clouds. Monthly Notices of the Royal Astronomical Society 2016, 463, 1026–1039. [Google Scholar] [CrossRef]
- Macquorn Rankine, W.J. On the Thermodynamic Theory of Waves of Finite Longitudinal Disturbance. Philosophical Transactions of the Royal Society of London Series I 1870, 160, 277–288. [Google Scholar]
- Lesaffre, P.; Todorov, P.; Levrier, F.; Valdivia, V.; Dzyurkevich, N.; Godard, B.; Tram, L.N.; Gusdorf, A.; Lehmann, A.; Falgarone, E. Production and excitation of molecules by dissipation of two-dimensional turbulence. Monthly Notices of the Royal Astronomical Society 2020, 495, 816–834. [Google Scholar] [CrossRef]
- Kolmogorov, A. The Local Structure of Turbulence in Incompressible Viscous Fluid for Very Large Reynolds’ Numbers. Akademiia Nauk SSSR Doklady 1941, 30, 301–305. [Google Scholar]
- Iroshnikov, P.S. Turbulence of a Conducting Fluid in a Strong Magnetic Field. Astronomicheskii Zhurnal 1963, 40, 742. [Google Scholar]
- Kraichnan, R.H. Inertial-Range Spectrum of Hydromagnetic Turbulence. Physics of Fluids 1965, 8, 1385–1387. [Google Scholar] [CrossRef]
- Goldreich, P.; Sridhar, S. Toward a Theory of Interstellar Turbulence. II. Strong Alfvenic Turbulence. The Astrophysical Journal 1995, 438, 763. [Google Scholar] [CrossRef]
- Galtier, S.; Banerjee, S. Exact Relation for Correlation Functions in Compressible Isothermal Turbulence. Phys. Rev. Letters 2011, 107, 134501. [Google Scholar] [CrossRef] [PubMed]
- Federrath, C.; Klessen, R.S.; Iapichino, L.; Beattie, J.R. The sonic scale of interstellar turbulence. Nature Astronomy 2021, 5, 365–371. [Google Scholar] [CrossRef]
- Banerjee, S.; Galtier, S. Exact relation with two-point correlation functions and phenomenological approach for compressible magnetohydrodynamic turbulence. Phys. Rev. E 2013, 87, 013019. [Google Scholar] [CrossRef] [PubMed]
- Lazarian, A.; Pogosyan, D. Velocity Modification of H I Power Spectrum. The Astrophysical Journal 2000, 537, 720–748. [Google Scholar] [CrossRef]
- Miville-Deschênes, M.A.; Levrier, F.; Falgarone, E. On the Use of Fractional Brownian Motion Simulations to Determine the Three-dimensional Statistical Properties of Interstellar Gas. The Astrophysical Journal 2003, 593, 831–847. [Google Scholar] [CrossRef]
- Kim, J.; Ryu, D. Density Power Spectrum of Compressible Hydrodynamic Turbulent Flows. The Astrophysical Journal Letters 2005, 630, L45–L48. [Google Scholar] [CrossRef]
- Saury, E.; Miville-Deschênes, M.A.; Hennebelle, P.; Audit, E.; Schmidt, W. The structure of the thermally bistable and turbulent atomic gas in the local interstellar medium. A&A 2014, 567, A16. [Google Scholar] [CrossRef]
- Kolmogorov, A.N. A refinement of previous hypotheses concerning the local structure of turbulence in a viscous incompressible fluid at high Reynolds number. Journal of Fluid Mechanics 1962, 13, 82–85. [Google Scholar] [CrossRef]
- Frisch, U. Turbulence; 1996; p. 310.
- Grauer, R.; Krug, J.; Marliani, C. Scaling of high-order structure functions in magnetohydrodynamic turbulence. Physics Letters A 1994, 195, 335–338. [Google Scholar] [CrossRef]
- Politano, H.; Pouquet, A. Model of intermittency in magnetohydrodynamic turbulence. Phys. Rev. E 1995, 52, 636–641. [Google Scholar] [CrossRef]
- Boldyrev, S.; Nordlund, Å.; Padoan, P. Scaling Relations of Supersonic Turbulence in Star-forming Molecular Clouds. The Astrophysical Journal 2002, 573, 678–684. [Google Scholar] [CrossRef]
- Chevillard, L.; Robert, R.; Vargas, V. Random vectorial fields representing the local structure of turbulence. Journal of Physics Conference Series, 2011, Vol. 318, Journal of Physics Conference Series, p. 042002. [CrossRef]
- Durrive, J.B.; Lesaffre, P.; Ferrière, K. Magnetic fields from multiplicative chaos. MNRAS 2020, 496, 3015–3034. [Google Scholar] [CrossRef]
- Benzi, R.; Biferale, L.; Ciliberto, S.; Struglia, M.V.; Tripiccione, R. Scaling property of turbulent flows. Phys. Rev. E 1996, 53, R3025–R3027. [Google Scholar] [CrossRef]
- Douady, S.; Couder, Y.; Brachet, M.E. Direct observation of the intermittency of intense vorticity filaments in turbulence. Phys. Rev. Letters 1991, 67, 983–986. [Google Scholar] [CrossRef] [PubMed]
- Ishihara, T.; Hunt, J.C.R.; Kaneda, Y. Intense dissipative mechanisms of strong thin shear layers in high Reynolds number turbulence. APS Division of Fluid Dynamics Meeting Abstracts, 2012, APS Meeting Abstracts, p. A23.004.
- Buaria, D.; Pumir, A.; Bodenschatz, E.; Yeung, P.K. Extreme velocity gradients in turbulent flows. New Journal of Physics 2019, 21, 043004. [Google Scholar] [CrossRef]
- Moseley, E.R.; Draine, B.T.; Tomida, K.; Stone, J.M. Turbulent dissipation, CH+ abundance, H2 line luminosities, and polarization in the cold neutral medium. MNRAS 2021, 500, 3290–3308. [Google Scholar] [CrossRef]
- Falgarone, E.; Zwaan, M.A.; Godard, B.; Bergin, E.; Ivison, R.J.; Andreani, P.M.; Bournaud, F.; Bussmann, R.S.; Elbaz, D.; Omont, A.; Oteo, I.; Walter, F. Large turbulent reservoirs of cold molecular gas around high-redshift starburst galaxies. Nature 2017, 548, 430–433. [Google Scholar] [CrossRef]
- Madau, P.; Dickinson, M. Cosmic Star-Formation History. ARA&A 2014, 52, 415–486. [Google Scholar] [CrossRef]
- Veilleux, S.; Maiolino, R.; Bolatto, A.D.; Aalto, S. Cool outflows in galaxies and their implications. A&ARv 2020, 28, 2. [Google Scholar] [CrossRef]
| 1 | Two practical units for lengths/distances in astrophysics are: the astronomical unit (1au), the Earth-Sun distance, 1.5cm and the parsec (pc), 3cm, adapted to proto-planetary disks and galactic scales, respectively |
| 2 | If the maximum wavenumber times the Kolmogorov dissipation scale is too small (lower than order unity, for example), Gibbs phenomena generate an excessive pile up of energy at small scales. An exponential decay of power spectra at small scales is a good indication that numerical convergence has been obtained. |
| 3 | Gradients of fast, intermediate and slow waves form an orthogonal basis of gradients of MHD variables. It turns out slow shocks decompose almost purely on gradients of slow waves, and similarly fast shocks on fast waves. |



| HIM | WNM | CNM | Diffuse H | Dense H | |
|---|---|---|---|---|---|
| Density n [cm] | 0.004 | 0.6 | 30 | 200 | 10 |
| Temperature T [K] | 3.10 | 5000 | 100 | 50 | 10 |
| Length scale L [pc] | 100 | 50 | 10 | 3 | 0.1 |
| Velocity [km.s] | 10 | 10 | 10 | 3 | 0.1 |
| 0.2 | 2 | 13 | 7 | 0.5 | |
| 10 | 10 | 10 | 10 | 10 | |
| 10 | 10 | 10 | 10 | 10 | |
| 10 | 10 | 10 | 10 | 10 | |
| Ionisation fraction | 1 | 10 | 10 | 10 | 10 |
Disclaimer/Publisher’s Note: The statements, opinions and data contained in all publications are solely those of the individual author(s) and contributor(s) and not of MDPI and/or the editor(s). MDPI and/or the editor(s) disclaim responsibility for any injury to people or property resulting from any ideas, methods, instructions or products referred to in the content. |
© 2024 by the authors. Licensee MDPI, Basel, Switzerland. This article is an open access article distributed under the terms and conditions of the Creative Commons Attribution (CC BY) license (http://creativecommons.org/licenses/by/4.0/).


