Submitted:
10 April 2024
Posted:
11 April 2024
You are already at the latest version
Abstract
Keywords:
1. Introduction
2. Materials and Methods
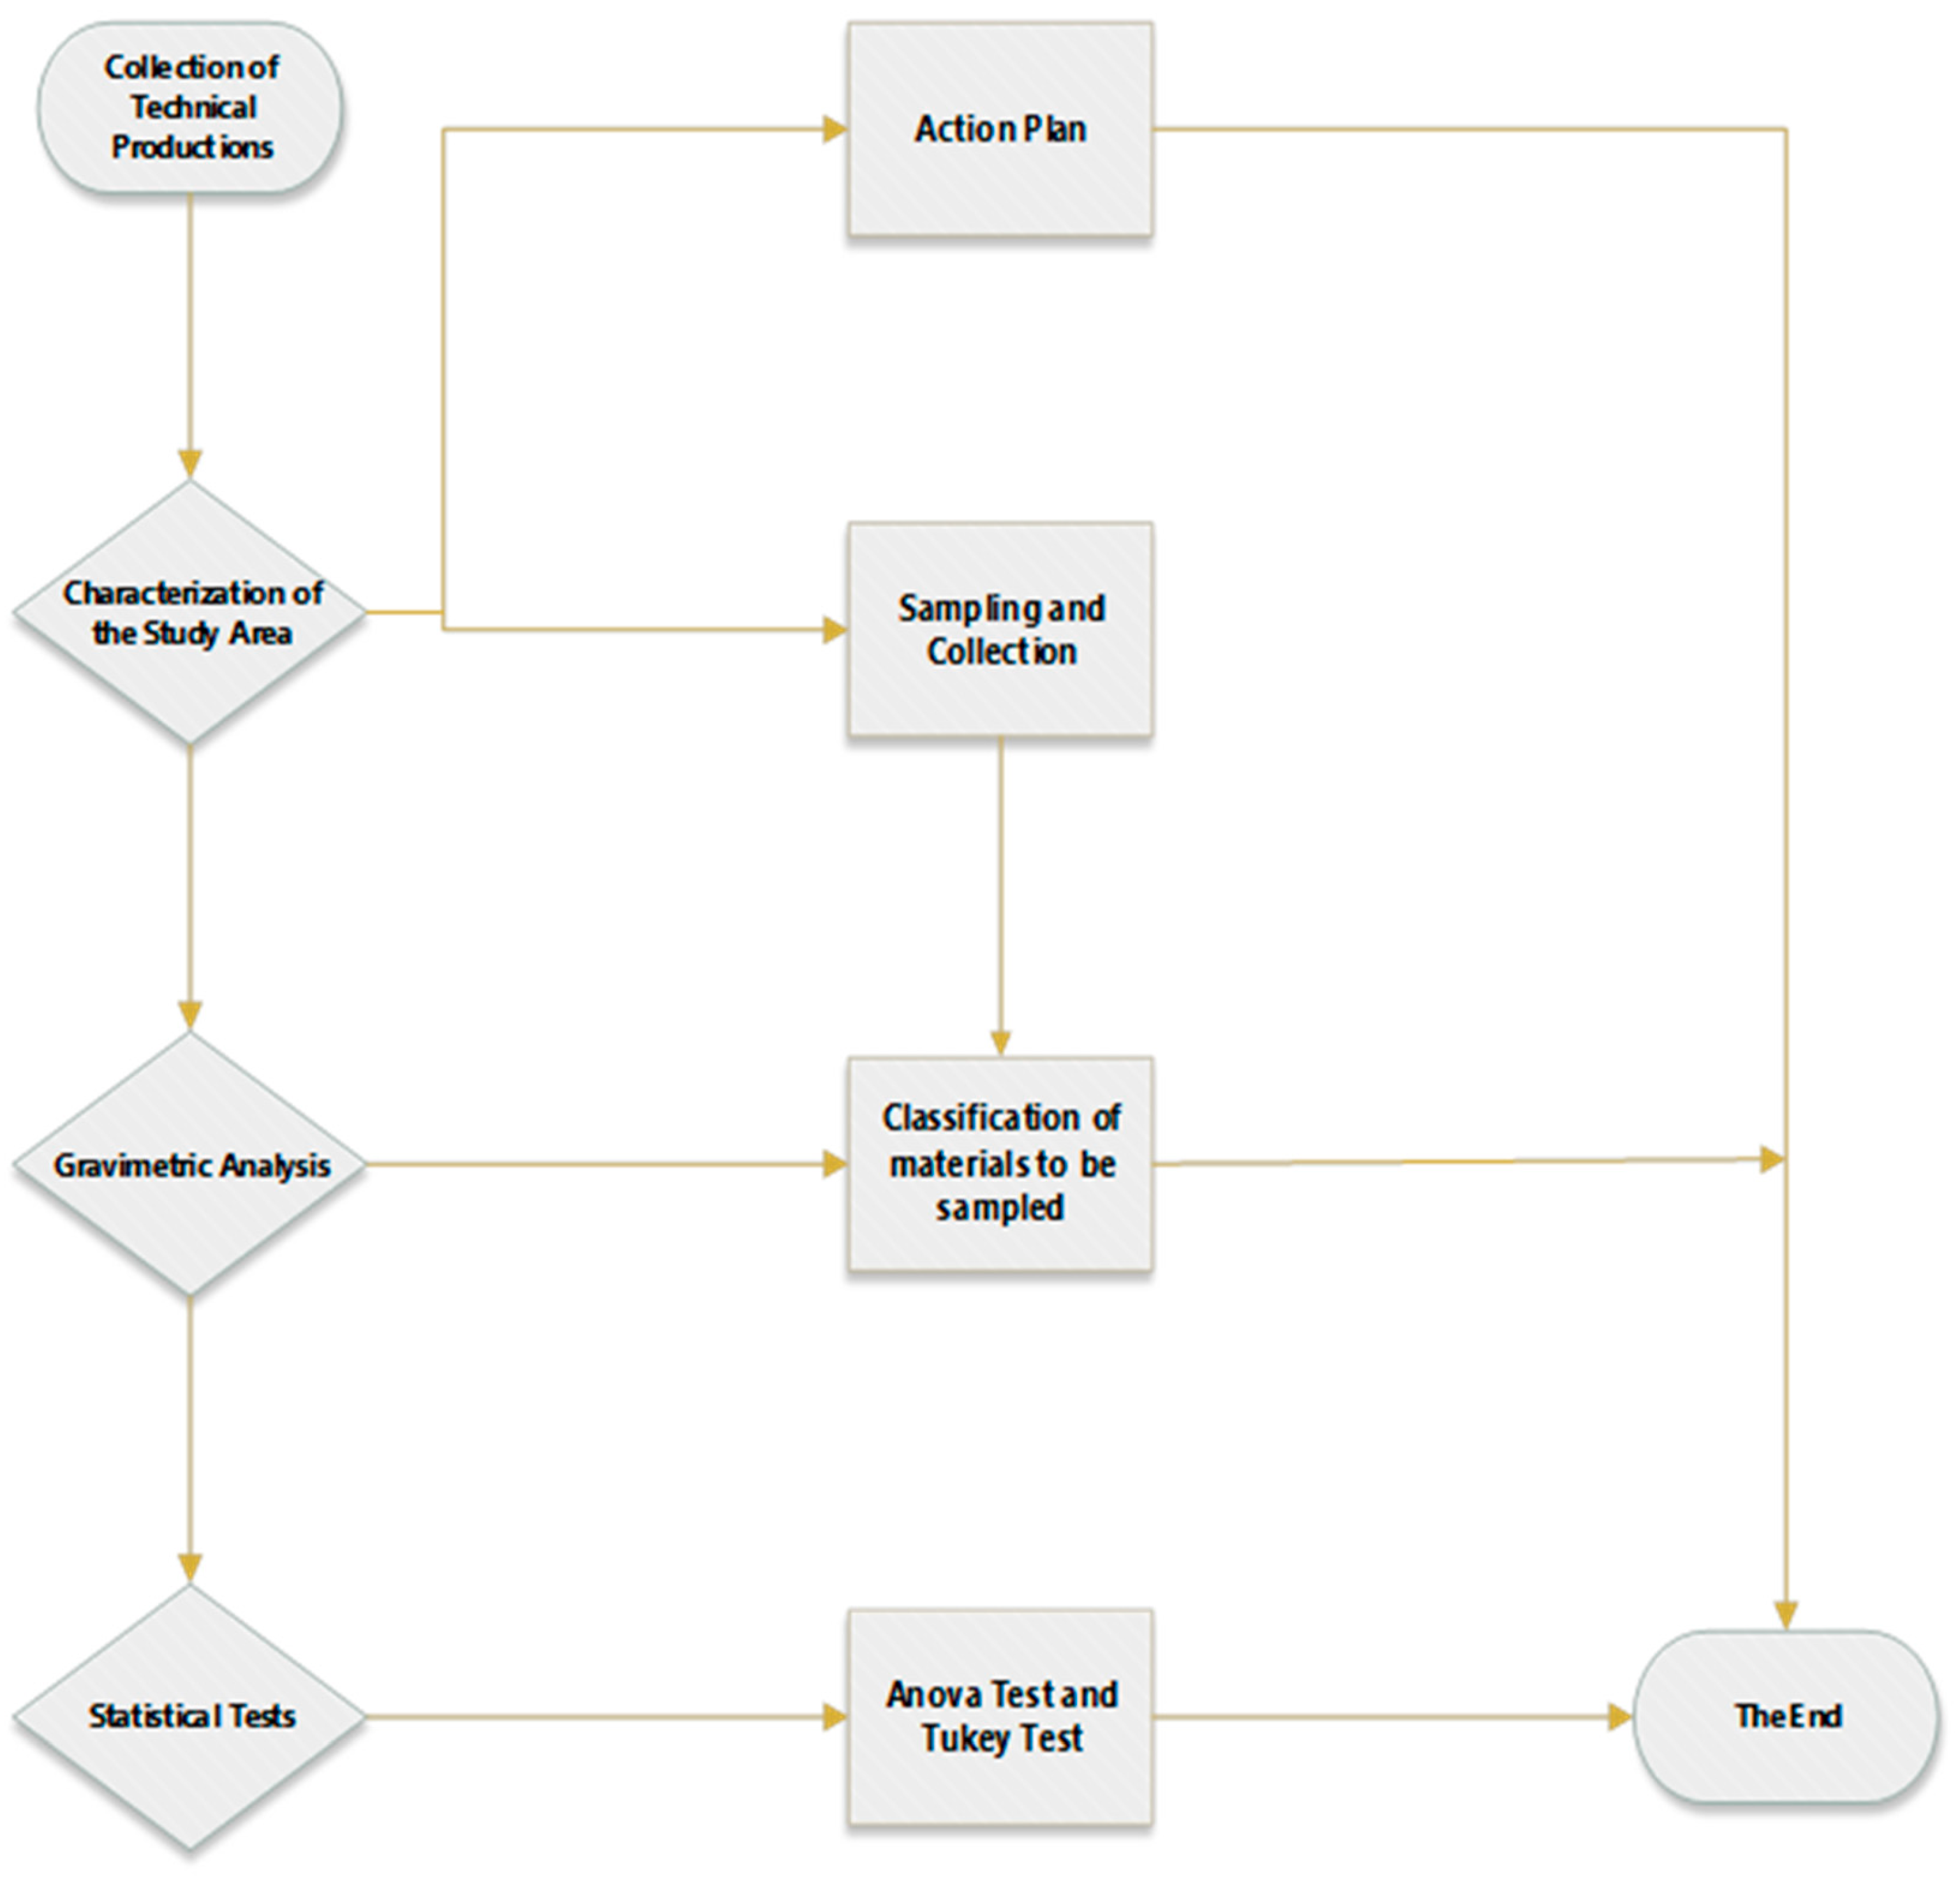
2.1. Collection of Technical Productions
2.2. Characterization of the Study Area
2.3. Gravimetric Analysis
2.4. Statistical Tests
2.4.1. Descriptive and Analytical Statistics
- I.
- H0: the averages of the materials are the same.
- II.
- H1: the averages of the materials are different.
3. Results
3.1. Analysis by Descriptive Statistics of Gravimetric Analysis
3.2. Analysis by Analytical Statistics (ANOVA and TUKEY Test)
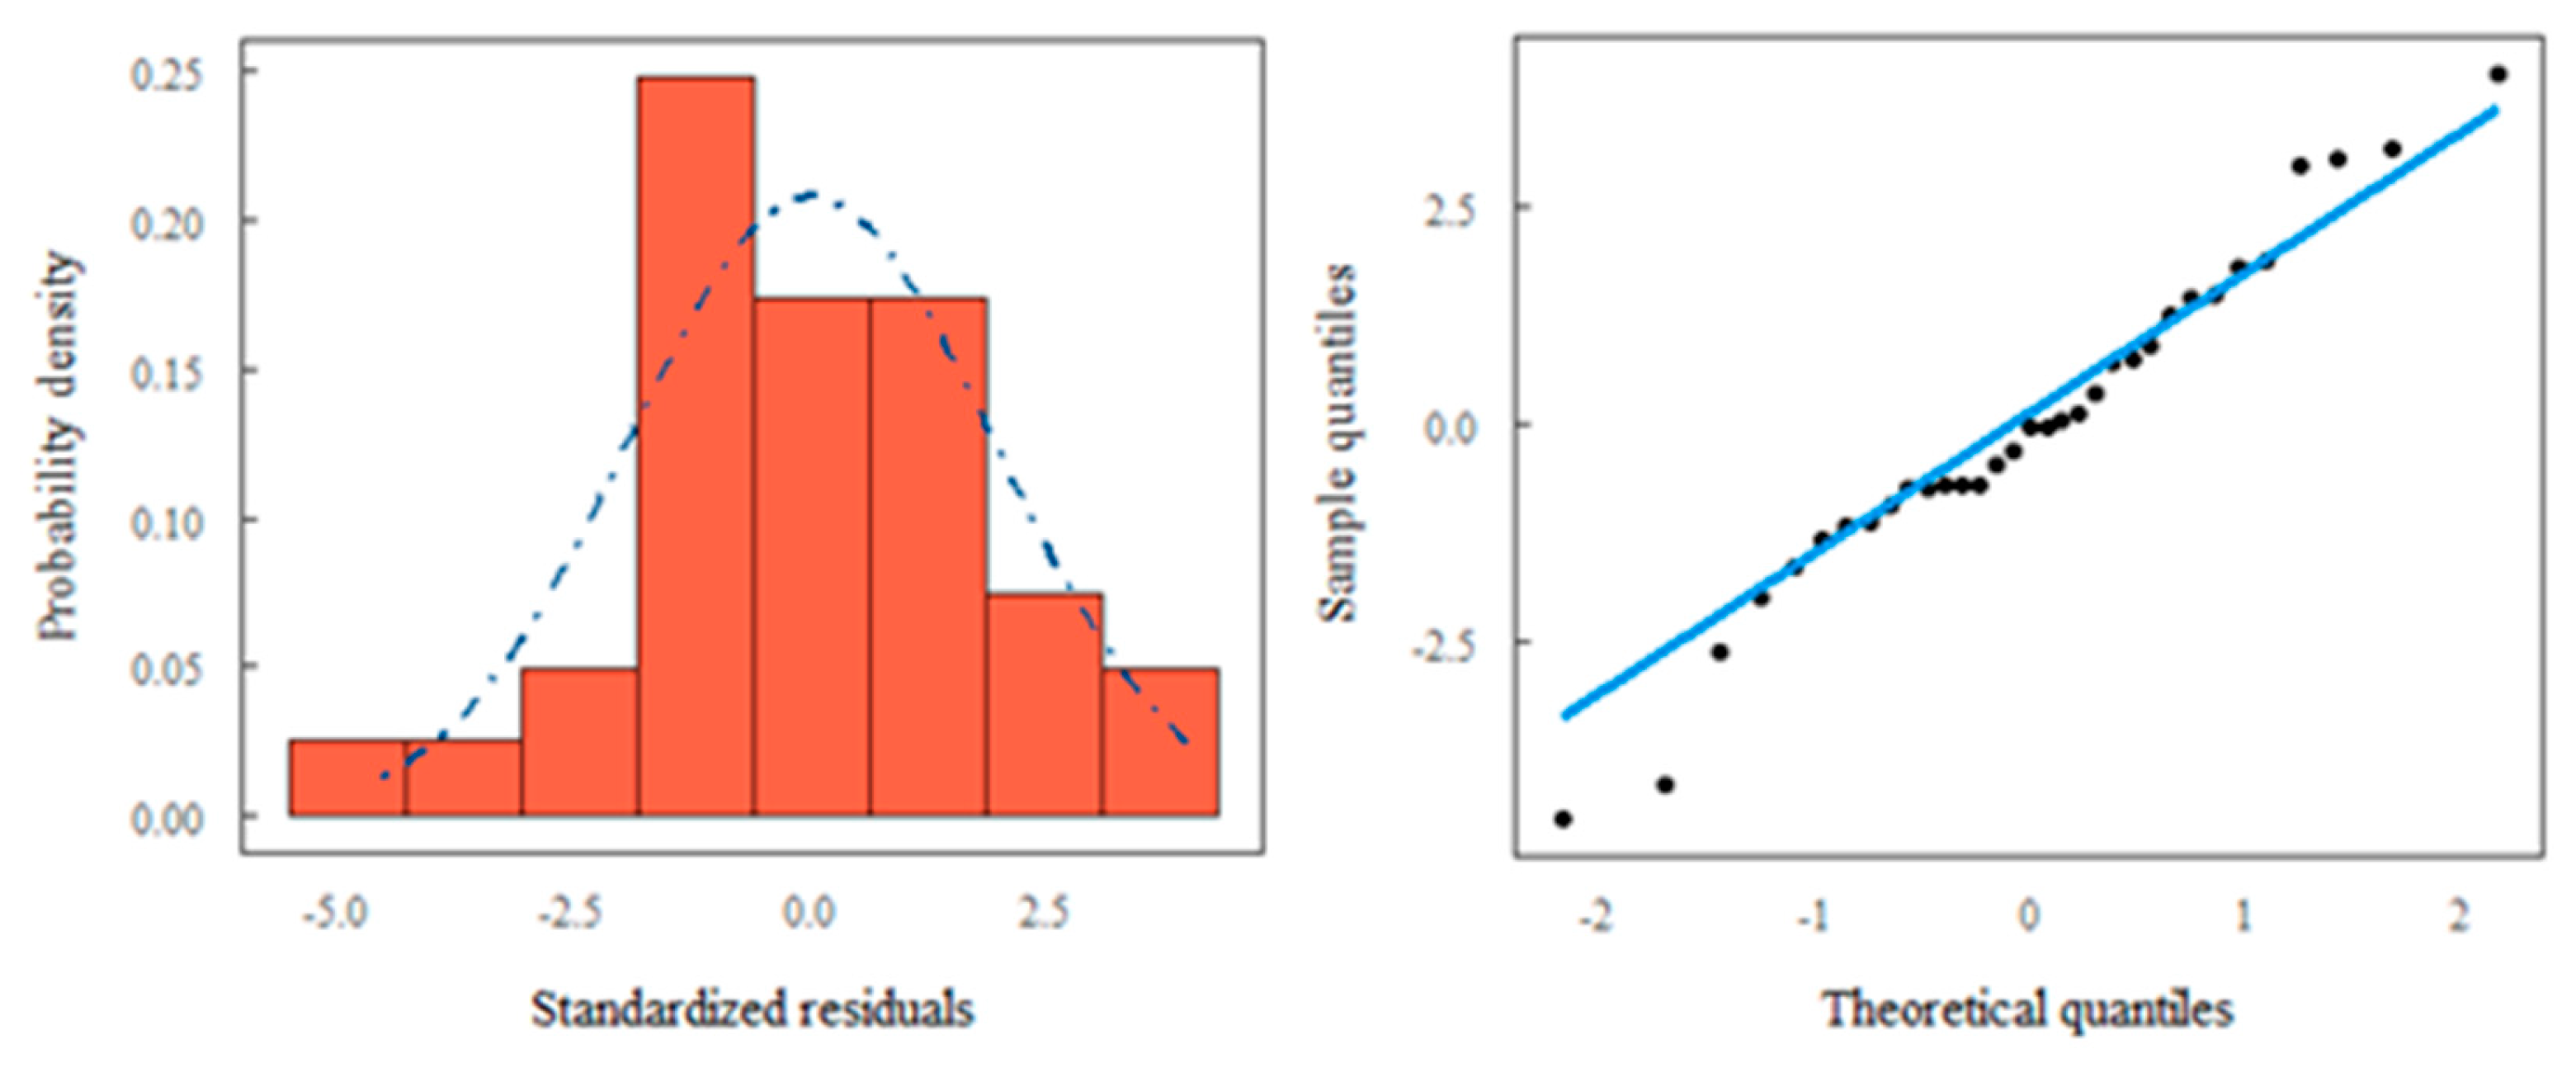
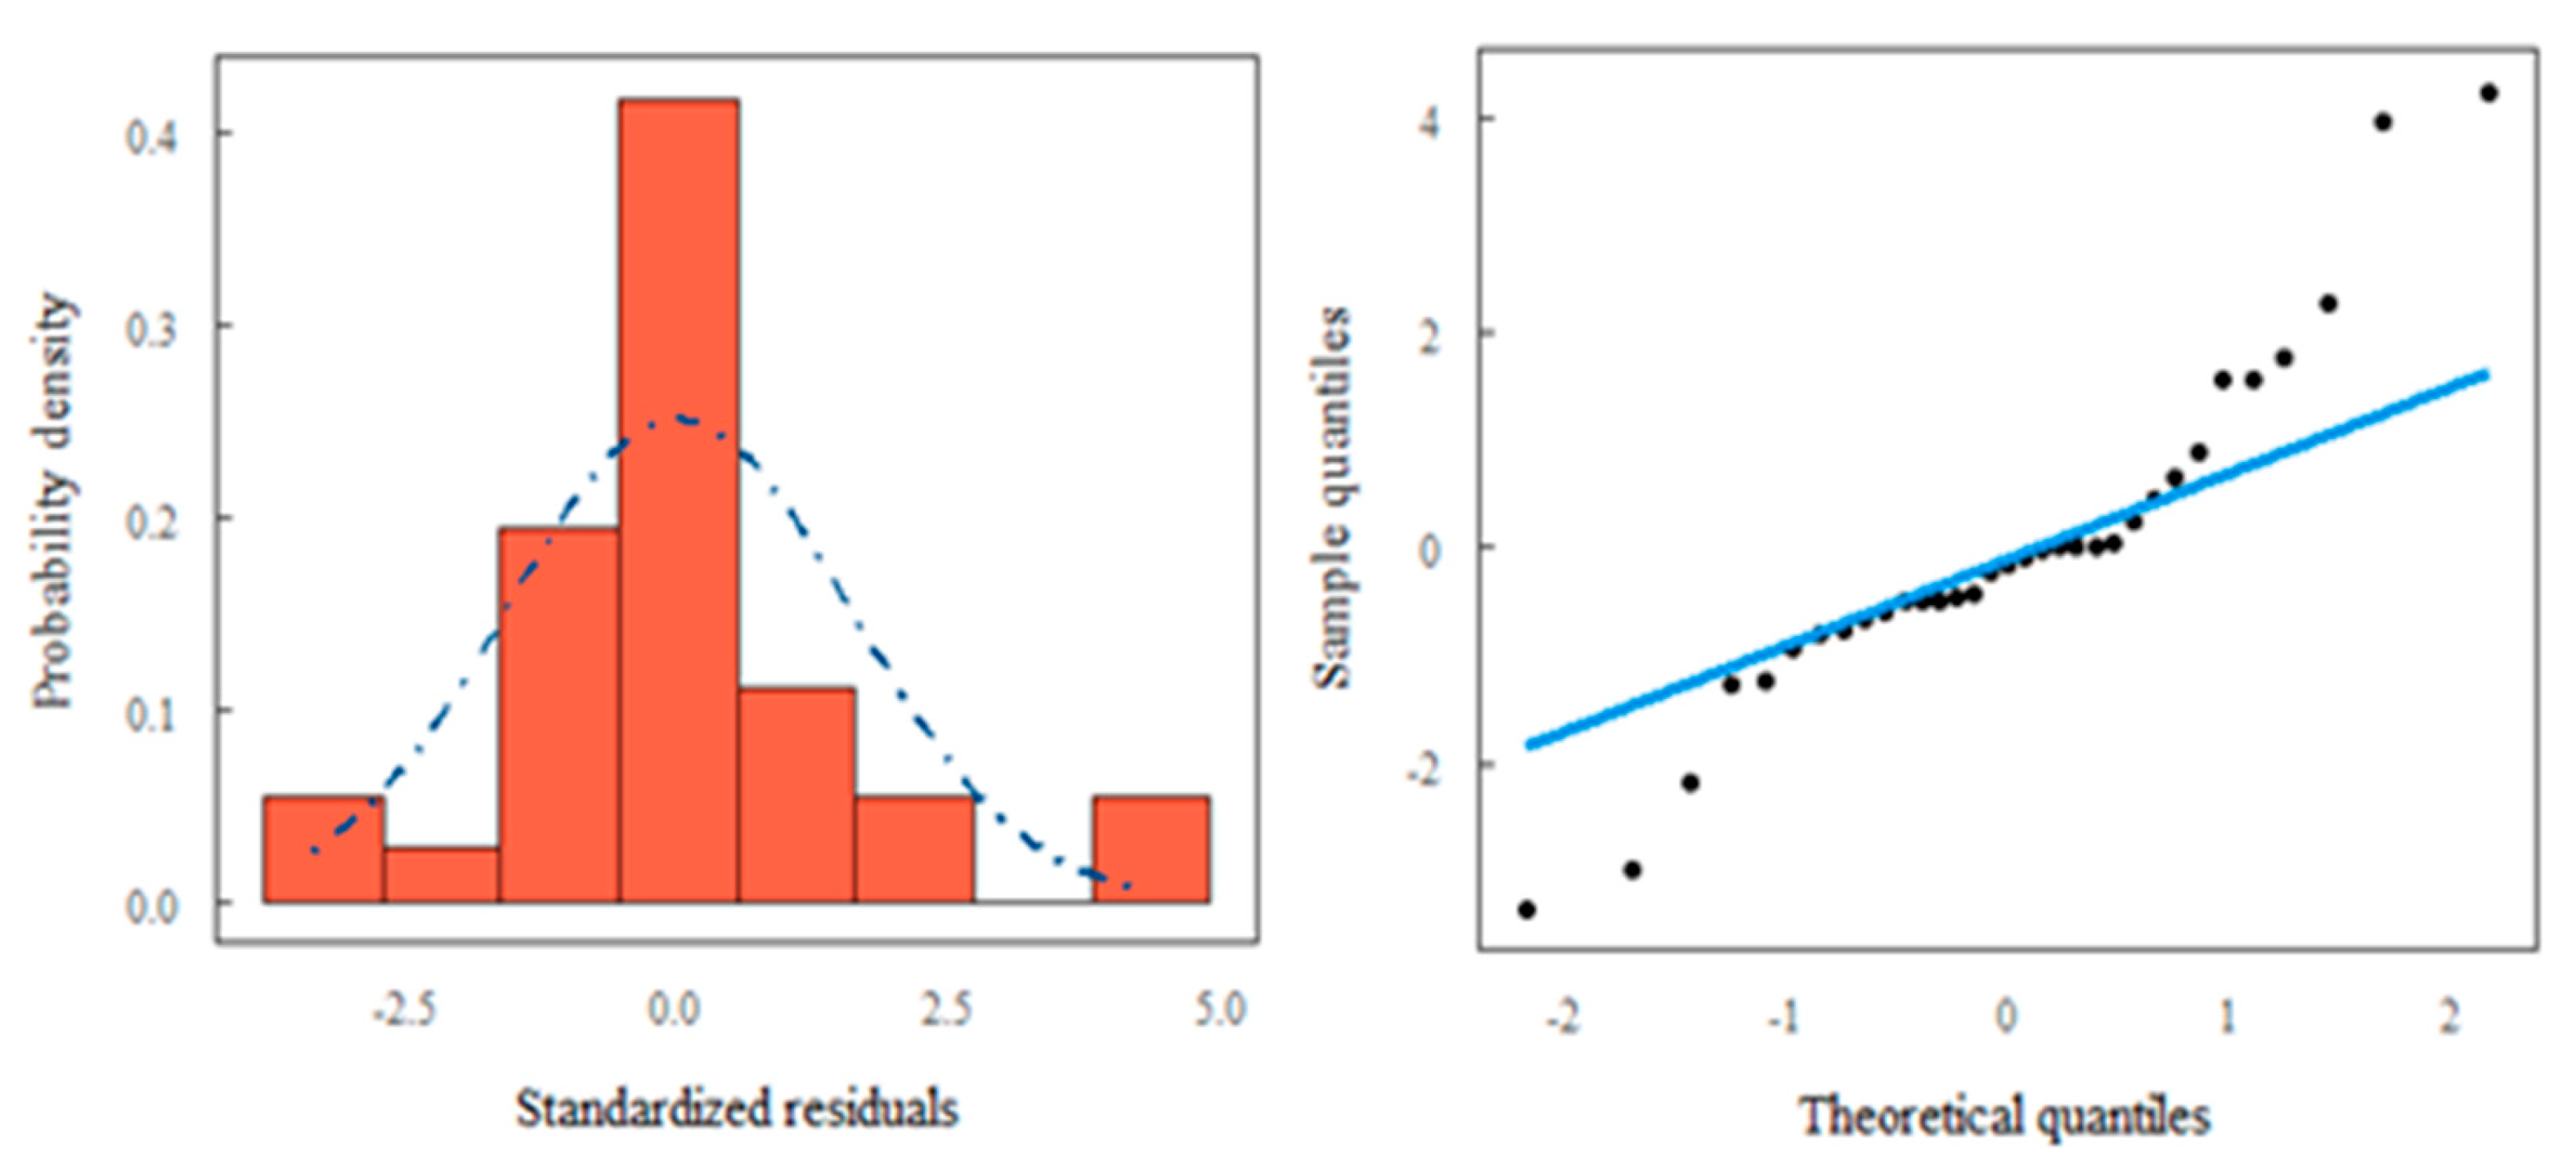
3.3. Analysis Based on Household Income
4. Conclusions
Author Contributions
Funding
Institutional Review Board Statement
Informed Consent Statement
Data Availability Statement
Acknowledgments
Conflicts of Interest
References
- Associação Brasileira de Empresas de Limpeza Pública E Resíduos Especiais—ABRELPE. Panorama 2022; ABRELPE: São Paulo, Brazil, 2023. [Google Scholar]
- Brasil Ministério do Desenvolvimento Regional. Diagnóstico Temático do Manejo de Resíduos Sólidos Urbanos; SNIS: São Paulo, Brazil, 2022. [Google Scholar]
- AYRES, M. Elementos de Bioestatística 2.ed. Belém: Supercores. 2012.
- Mutz, D. , Hengevoss, D., Hugi, C.M. and Gross, T. (2017) Waste-to-Energy Options in Municipal Solid Waste Management. A Guide for Decision Makers in Developing and Emerging Countries. Eschborn.
- Legado da COP-30 para Belém vai transformar a vida da população e beneficiar a cidade. Agência Belém, 2023. Disponível em: Agência Belém (agenciabelem.com.br). Acesso em: 24, novembro de 2023.
- BRASIL. Sistema Nacional de Informação sobre Saneamento. Diagnóstico dos Serviços de Água e Esgoto - 201 Brasília: SNIS, 2021.
- Chang, Y.; Lin, C.; Chyan, J.; Chen, I.; Chang, J. Multiple regression models for the lower heating value of municipal solid waste in Taiwan. J. Environ. Manag. 2007, 85, 891–899. [Google Scholar] [CrossRef] [PubMed]
- Lin, C.-J.; Chyan, J.-M.; Chen, I.-M.; Wang, Y.-T. Swift model for a lower heating value prediction based on wet-based physical components of municipal solid waste. Waste Manag. 2013, 33, 268–276. [Google Scholar] [CrossRef]
- Ryu, C.; Shin, D. Combined Heat and Power from Municipal Solid Waste: Current Status and Issues in South Korea. Energies 2013, 6, 45–57. [Google Scholar] [CrossRef]
- Zhou, C.; Gong, Z.; Hu, J.; Cao, A.; Liang, H. A cost-benefit analysis of landfill mining and material recycling in China. Waste Manag. 2015, 35, 191–198. [Google Scholar] [CrossRef] [PubMed]
- Rajendran, N.; Gurunathan, B.; Han, J.; Krishna, S.; Ananth, A.; Venugopal, K.; Priyanka, R.S. Recent advances in valorization of organic municipal waste into energy using biorefinery approach, environment and economic analysis. Bioresour. Technol. 2021, 337, 125498. [Google Scholar] [CrossRef] [PubMed]
- Scarlat, N.; Motola, V.; Dallemand, J.F.; Monforti-Ferrario, F.; Mofor, L. Evaluation of energy potential of Municipal Solid Waste from African urban areas. Renew. Sustain. Energy Rev. 2015, 50, 1269–1286. [Google Scholar] [CrossRef]
- Kaza, S. et al. (2018). What a Waste 2.0: A Global Snapshot of Solid Waste Management to 2050. Washington DC: The World Bank.
- Wang, N.; Chen, D.; Arena, U.; He, P. Hot char-catalytic reforming of volatiles from MSW pyrolysis. Appl. Energy 2017, 191, 111–124. [Google Scholar] [CrossRef]
- BRASIL, 2010. Lei Federal N° 12.305, de 2 de agosto de 2010. Institui a Política Nacional de Resíduos Sólidos que altera a Lei n° 9605, de 12 de fevereiro de 1998; e outros arranjos, Brasil.
- Gouveia, N. Resíduos sólidos urbanos: impactos socioambientais e perspectiva de manejo sustentável com inclusão social. Ciência e Saúde Coletiva 2012, 17, 1503–1510. [Google Scholar] [CrossRef] [PubMed]
- PURCELL, M.; MAGETTE, W.L. (2009) Prediction of household and commercial BMW generation according to socioeconomic and other factors for the Dublin region. Waste Management, v. 29, n. 4, p. 1237-1250. [CrossRef]
- Dahlén, H.; Pereira, A.; Lagerkvist, P.E.O. Berg. Inconsistent household waste trajectories. Waste Management., 29 (2009), pp. 1798-1806.
- STREB, C.S.; NAGLE, E.C.; TEIXEIRA, E.N. (2004) Caracterização do resíduo sólido doméstico: metodologia para avaliação do potencial de minimização. In: CONGRESSO INTERAMERICANO DE ENGENHARIA SANITÁRIA E AMBIENTAL, 29., 2004, San Juan. Anais... San Juan: AIDIS.
- VEGA, C.A.; BENÍTEZ, S.O.; BARRETO, M.E.R. (2008) Solid waste characterization and recycling potential for a university campus. Waste Management, v. 28, supl. 1, p. S21-S26. [CrossRef]
- CARNEIRO, Paulo Fernando Norat. Caracterização e avaliação da potencialidade econômica da coleta seletiva e reciclagem dos resíduos sólidos domiciliares gerados nos municípios de Belém e Ananindeua - PA. 2006. Dissertação (Mestrado em Engenharia Civil) – Programa de Pós-Graduação em Engenharia Civil (PPGEC), Instituto de Tecnologia (ITEC), Centro Tecnológico, Universidade Federal do Pará, Belém, 2006.
- Drudi, K.C.; Drudi, R.; Martins, G.; Antonio, G.C.; Leite, J.T.C. Statistical model for heating value of municipal solid waste in Brazil based on gravimetric composition. Waste Manag. 2019, 87, 782–790. [Google Scholar] [CrossRef]
- Nizami, A.; Shahzad, K.; Rehan, M.; Ouda, O.; Khan, M.; Ismail, I.; Almeelbi, T.; Basahi, J.; Demirbas, A. Developing waste biorefinery in Makkah: A way forward to convert urban waste into renewable energy. Appl. Energy 2017, 186, 189–196. [Google Scholar] [CrossRef]
- Singh, J.; Laurenti, R.; Sinha, R.; Frostell, B. Progress and challenges to the global waste management system. Waste Manag. Res. J. a Sustain. Circ. Econ. 2014, 32, 800–812. [Google Scholar] [CrossRef]
- DA SILVA, Rodrigo Cândido Passos da; COSTA, Amanda Rodrigues Santos; ELDEIR, Soraya Giovanetti; JUCÁ, José Fernando Thomé. Setorização de rotas de coleta de resíduos sólidos domiciliares por técnicas multivariadas: estudo de caso da cidade do Recife, Brasil. Engenharia Sanitária e Ambiental, v. 25, n. 6, p. 821-832, 2020. [CrossRef]
- MENDONÇA, Neyson Martins; RUSSO, Mário Augusto Tavares; PENNER, Giovanni Chaves; ALMEIDA, Hélio da Silva; ASSUNÇÃO, Maurilo André da Cunha; BRANDAO, Isaque Wilkson de Sousa; SILVA, Rafael Haruo Yoshida; PEREIRA, Filipe Castro; SANTOS, Filippe Vilhena dos; MACHADO, Paulo Christian de Freitas Machado; MARTINS, Rubens Takeji Aoki Araujo; GONCALVES, Moisés Marçal. Relatório Final do Estudo “Monitoramento das atividades decorrentes do plano emergencial na área da CPTR de Marituba (PA) para ações do tratamento do lixiviado e de emissão de gases”. Belém (PA): Fundação de Amparo e Desenvolvimento da Pesquisa (FADESP), 2021.
- Assunção, F.P.d.C.; Pereira, D.O.; da Silva, J.C.C.; Ferreira, J.F.H.; Bezerra, K.C.A.; Bernar, L.P.; Ferreira, C.C.; Costa, A.F.d.F.; Pereira, L.M.; da Paz, S.P.A.; et al. A Systematic Approach to Thermochemical Treatment of Municipal Household Solid Waste into Valuable Products: Analysis of Routes, Gravimetric Analysis, Pre-Treatment of Solid Mixtures, Thermochemical Processes, and Characterization of Bio-Oils and Bio-Adsorbents. Energies 2022, 15, 7971. [Google Scholar] [CrossRef]
- Fesseha, S.N.; Bin, F. The Assessment of Solid Waste Products Management in Ethiopians Municipal Urban Areas. Int. J. Soc. Sci. Manag. 2015, 2, 165–179. [Google Scholar] [CrossRef]
- IBGE. Instituto Brasileiro de Geografia e Estatística. Censo Brasileiro de 2010; IBGE: Rio de Janeiro, Brazil, 2012; Available online: https://censo2010.ibge.gov.br/ (accessed on 1 August 2022).
- Menezes, R.O.; Castro, S.R.; Silva, J.B.G.; Teixeira, G.P.; Silva, M.A.M. Análise estatística da caracterização gravimétrica de resíduos sólidos domiciliares: Estudo de caso do município de Juiz de Fora, Minas Gerais. Eng. Sanitária Ambient 2019, 24, 271–282. [Google Scholar] [CrossRef]
- Pereira, D.O.; da Costa Assunção, F.P.; da Silva, J.C.C.; Ferreira, J.F.H.; Ferreira, R.B.P.; Lola, Á.L.; do Nascimento, Í.C.P.; Chaves, J.P.; do Nascimento, M.S.C.; da Silva Gouvêa, T.; et al. Prediction of Leachate Characteristics via an Analysis of the Solubilized Extract of the Organic Fraction of Domestic Solid Waste from the Municipality of Belém, PA. Sustainability. 2023, 15, 15456. [Google Scholar] [CrossRef]
- Hair, J.F.; Black, W.C.; Babin, B.J.; Anderson, R.E. & Tatham, R.L. (2009). Análise multivariada de dados. Porto Alegre, RS: ArtMed.
- FIELD, A. P. (2009). Descobrindo a estatística usando o SPSS. Porto Alegre, Brasil, Artmed, 2a edição.
- Al-Khatib, I.A.; Monou, M.; Abu Zahra, A.S.F.; Shaheen, H.Q.; Kassinos, D. Solid waste characterization, quantification and management practices in developing countries. A case study: Nablus district – Palestine. J. Environ. Manag. 2010, 91, 1131–1138. [Google Scholar] [CrossRef]
- BELÉM. Lei Municipal nº 9.656, de 30 de dezembro de 2020. Institui a Política Municipal de Saneamento Básico do Município de Belém, o Plano Municipal de Saneamento Básico (PMSB), e o Plano de Gestão Integrada de Resíduos Sólidos (PGIRS), em atenção ao disposto no Art. 9º da Lei Federal nº 11.445/2007, com as atualizações trazidas pela Lei nº 14.026/2020, o Novo Marco do Saneamento Básico, e dá outras providências. Belém, PA, 30 dez. 2020.
- Al-Khatib, I. A. , Monou, M., Abu Zahra, A. S. F., Shaheen, H. Q., & Kassinos, D. (2010). Solid waste characterization, quantification and management practices in developing countries. A case study: Nablus district e Palestine. Journal of Environmental Management, 91, 1131–1138.
- Monavari, S.M.; Omrani, G.A.; Karbassi, A.; Raof, F.F. The effects of socioeconomic parameters on household solid-waste generation and composition in developing countries (a case study: Ahvaz, Iran). Environ. Monit. Assess. 2012, 184, 1841–1846. [Google Scholar] [CrossRef]
- Suthar, S.; Singh, P. Household solid waste generation and composition in different family size and socio-economic groups: A case study. Sustain. Cities Soc. 2015, 14, 56–63. [Google Scholar] [CrossRef]
- Ojeda-Benítez, S.; Vega, C.A.-D.; Marquez-Montenegro, M.Y. Household solid waste characterization by family socioeconomic profile as unit of analysis. Resour. Conserv. Recycl. 2008, 52, 992–999. [Google Scholar] [CrossRef]
- PNUMA – Programa das Nações Unidas para o Ambiente. Índice de desperdício alimentar: relatório 2021. 100p. Disponível em: <https://www.unep.org/ptbr/resources/relatorios/indice-de-desperdicio-de-alimentos-2021>. Acesso em: 01 agosto 2023.
- OLIVEIRA, S.A. ; LEITE. V.D.; PRASAD, S.; RIBEIRO, M.D. (2004) Estudo da produção per capita de resíduos sólidos domiciliares da cidade de Campina Grande-PB. Revista Saúde e Ambiente, v. 5, n. 2, p. 37-44.
- Campos, H.K.T. Renda e evolução da geração per capita de resíduos sólidos no Brasil. Eng. Sanit. e Ambient. 2012, 17, 171–180. [Google Scholar] [CrossRef]
- Gupta, S.; Mohan, K.; Prasad, R.; Gupta, S.; Kansal, A. Solid waste management in India: options and opportunities. Resour. Conserv. Recycl. 1998, 24, 137–154. [Google Scholar] [CrossRef]
- TERI, 2002. Impact of population on water and the quality of life. [Project report no. 1999d42]. Submitted to United Nations Population Fund, The Energy and Resource Institute, TERI,New Delhi.
- ACIESP. 1987. Glossário de Ecologia. Publicação ACIESP nº57. ACIESP – Academia de Ciências do Estado de São Paulo.
- BRASIL. Conselho Nacional do Meio Ambiente (CONAMA). (2009). Resolução nº 420 Brasil: Conselho Nacional do Meio Ambiente, 2009.
- S.J. Burnley, J.C. S.J. Burnley, J.C. Ellis, R. Flowerdew, A.J. Poll, H. Prosser Assessing the composition of municipal solid waste in Wales Resources, Conservation and Recycling, 49 (3) (2007), pp. 264-283.
- Gomez, G.; Meneses, M.; Ballinas, L.; Castells, F. Characterization of urban solid waste in Chihuahua, Mexico. Waste Manag. 2008, 28, 2465–2471. [Google Scholar] [CrossRef]
- LUIZARI, J. D. 2019. ANÁLISE DA GERAÇÃO E COMPOSIÇÃO DOS RESÍDUOS SÓLIDOS DOMICILIARES: ESTUDO DE CASO NO PLANO PILOTO - DF. Monografia de Projeto Final, Departamento de Engenharia Civil e Ambiental, Universidade de Brasília, Brasília, DF, 100 p.
- Trang, P.T.T.; Dong, H.Q.; Toan, D.Q.; Hanh, N.T.X.; Thu, N.T. The Effects of Socio-economic Factors on Household Solid Waste Generation and Composition: A Case Study in Thu Dau Mot, Vietnam. Energy Procedia 2017, 107, 253–258. [Google Scholar] [CrossRef]
- Costa, L.E.B.; Costa, S.K.; Rego, N.A.C.; Silva Júnior, M.F. Gravimétrica dos resíduos sólidos urbanos domiciliares e perfil socioeconômico no município de Salinas, Minas Gerais. Revista Ibero-Americana de Ciências Ambientais 2012, 3, 73–90. [Google Scholar] [CrossRef]
- Yang, W.; Pudasainee, D.; Gupta, R.; Li, W.; Wang, B.; Sun, L. An overview of inorganic particulate matter emission from coal/biomass/MSW combustion: Sampling and measurement, formation, distribution, inorganic composition and influencing factors. Fuel Process. Technol. 2020, 213, 106657. [Google Scholar] [CrossRef]
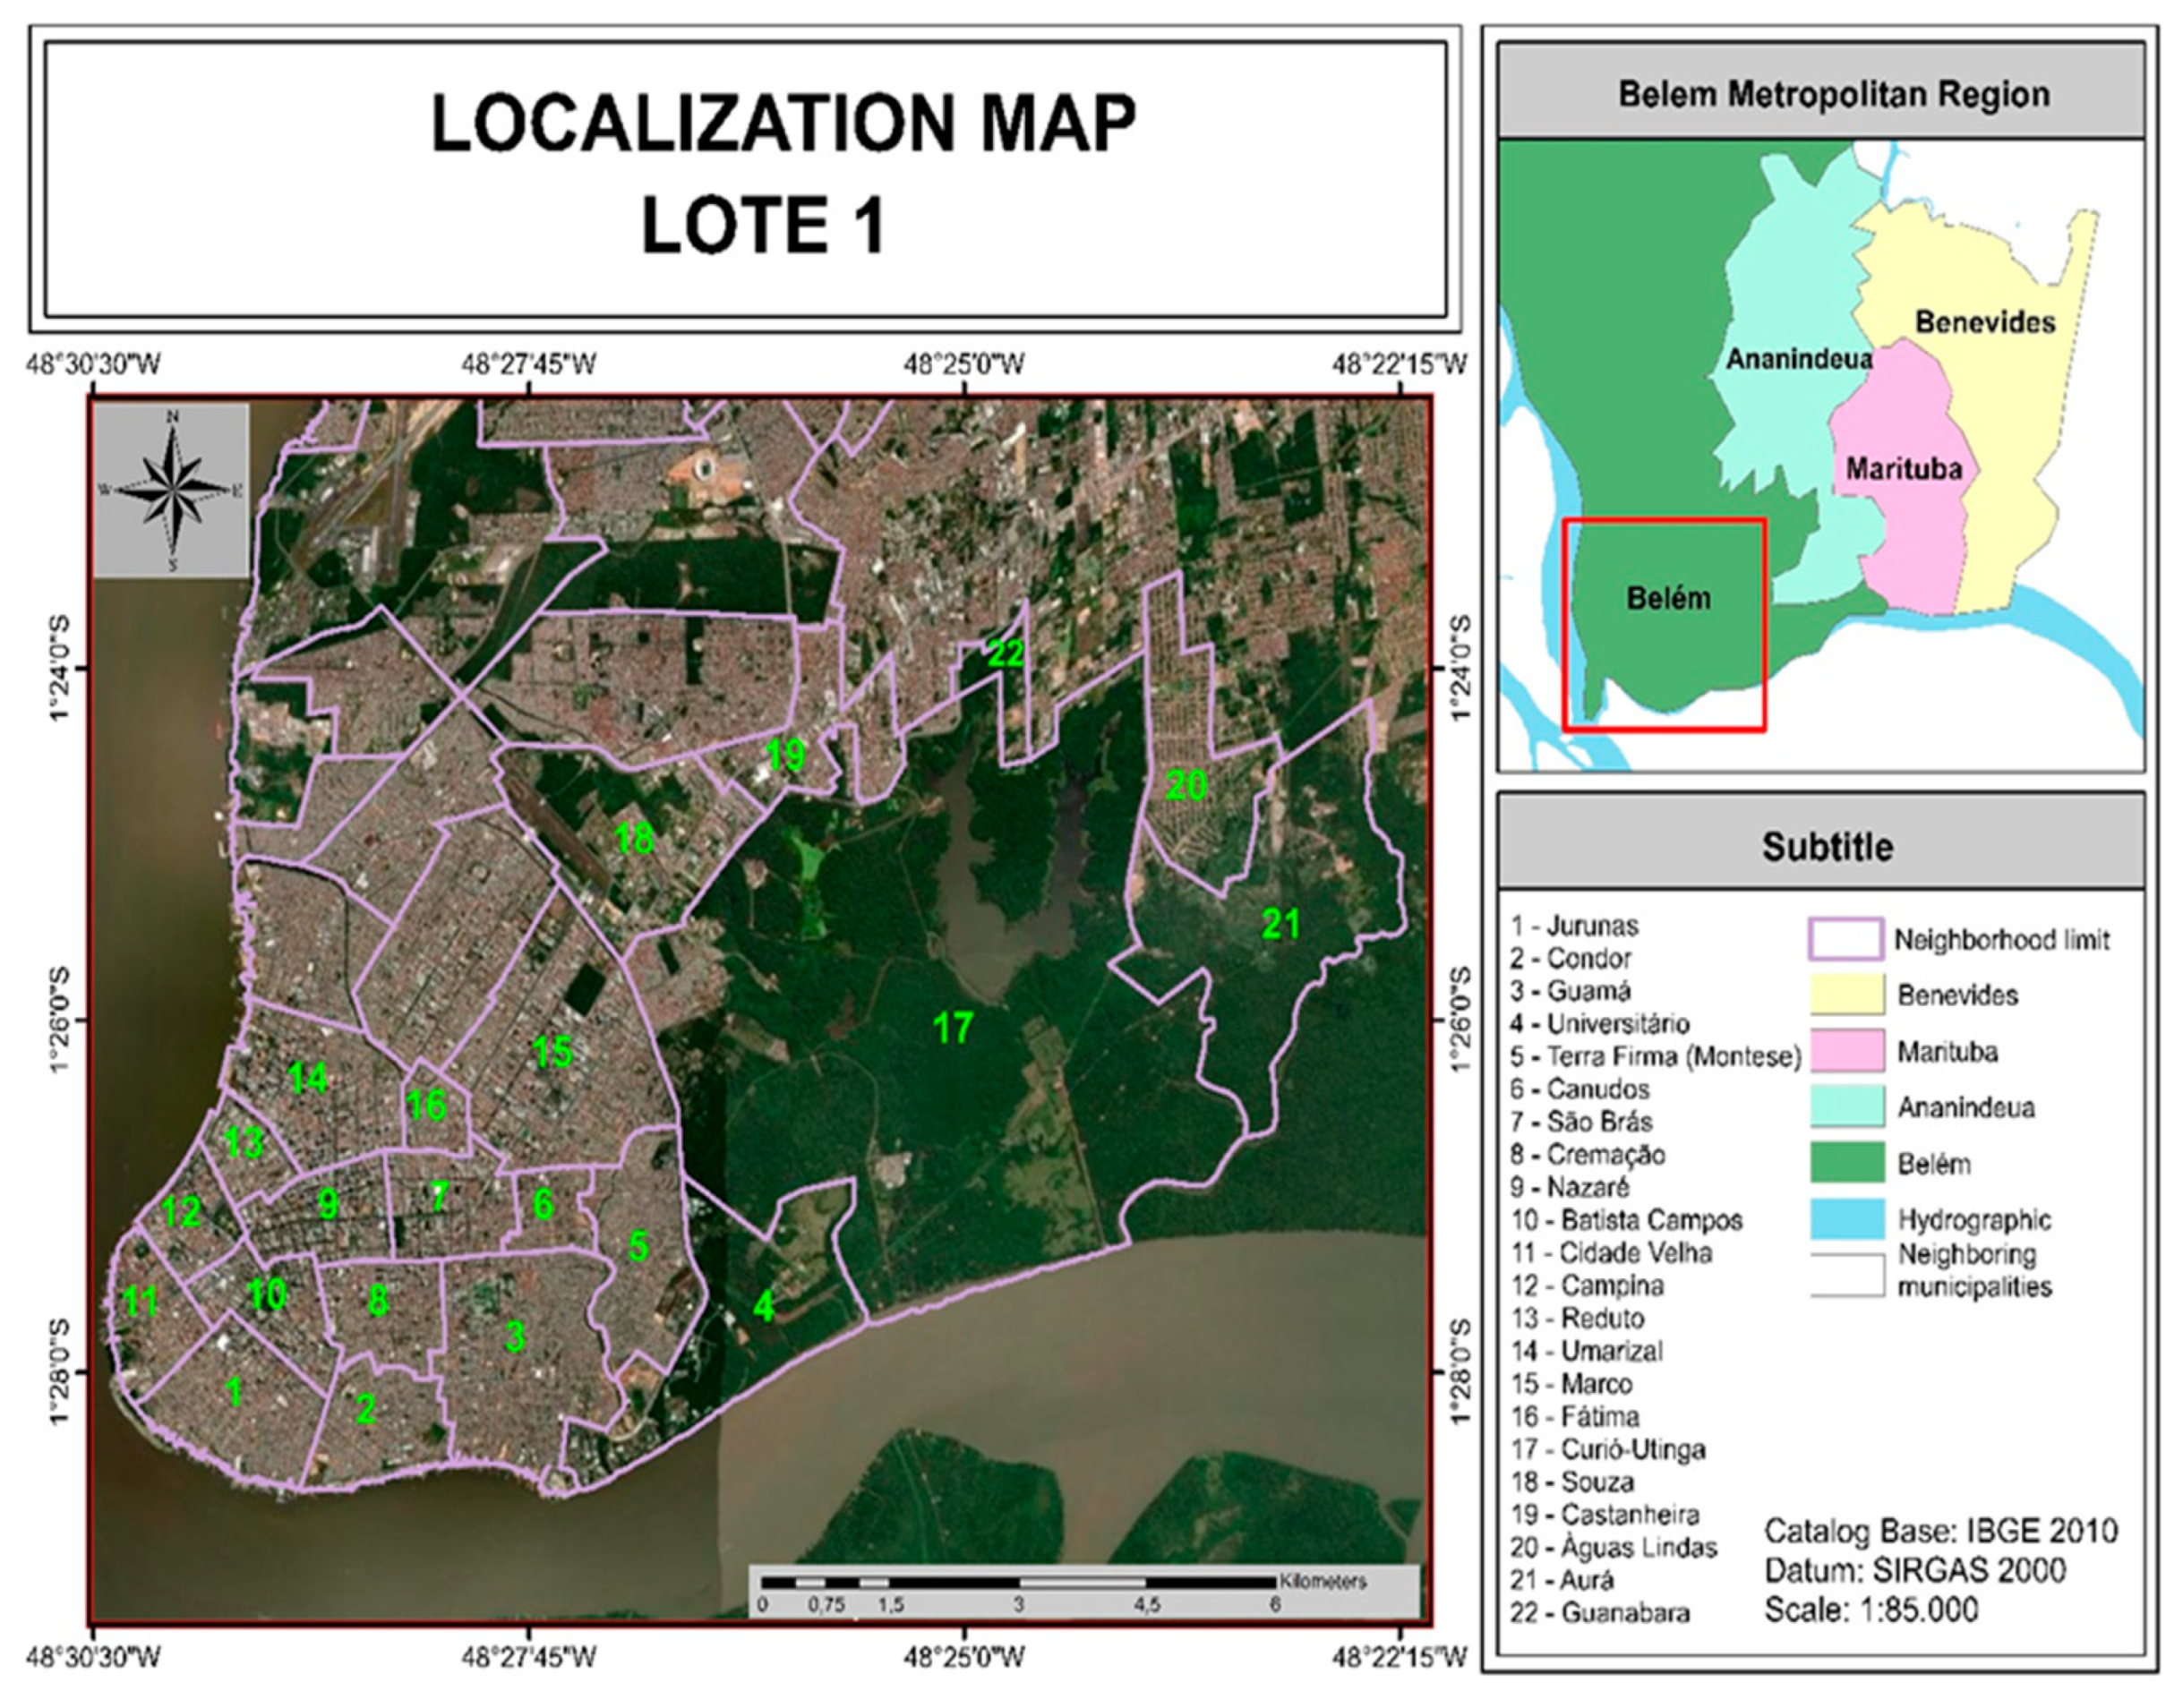
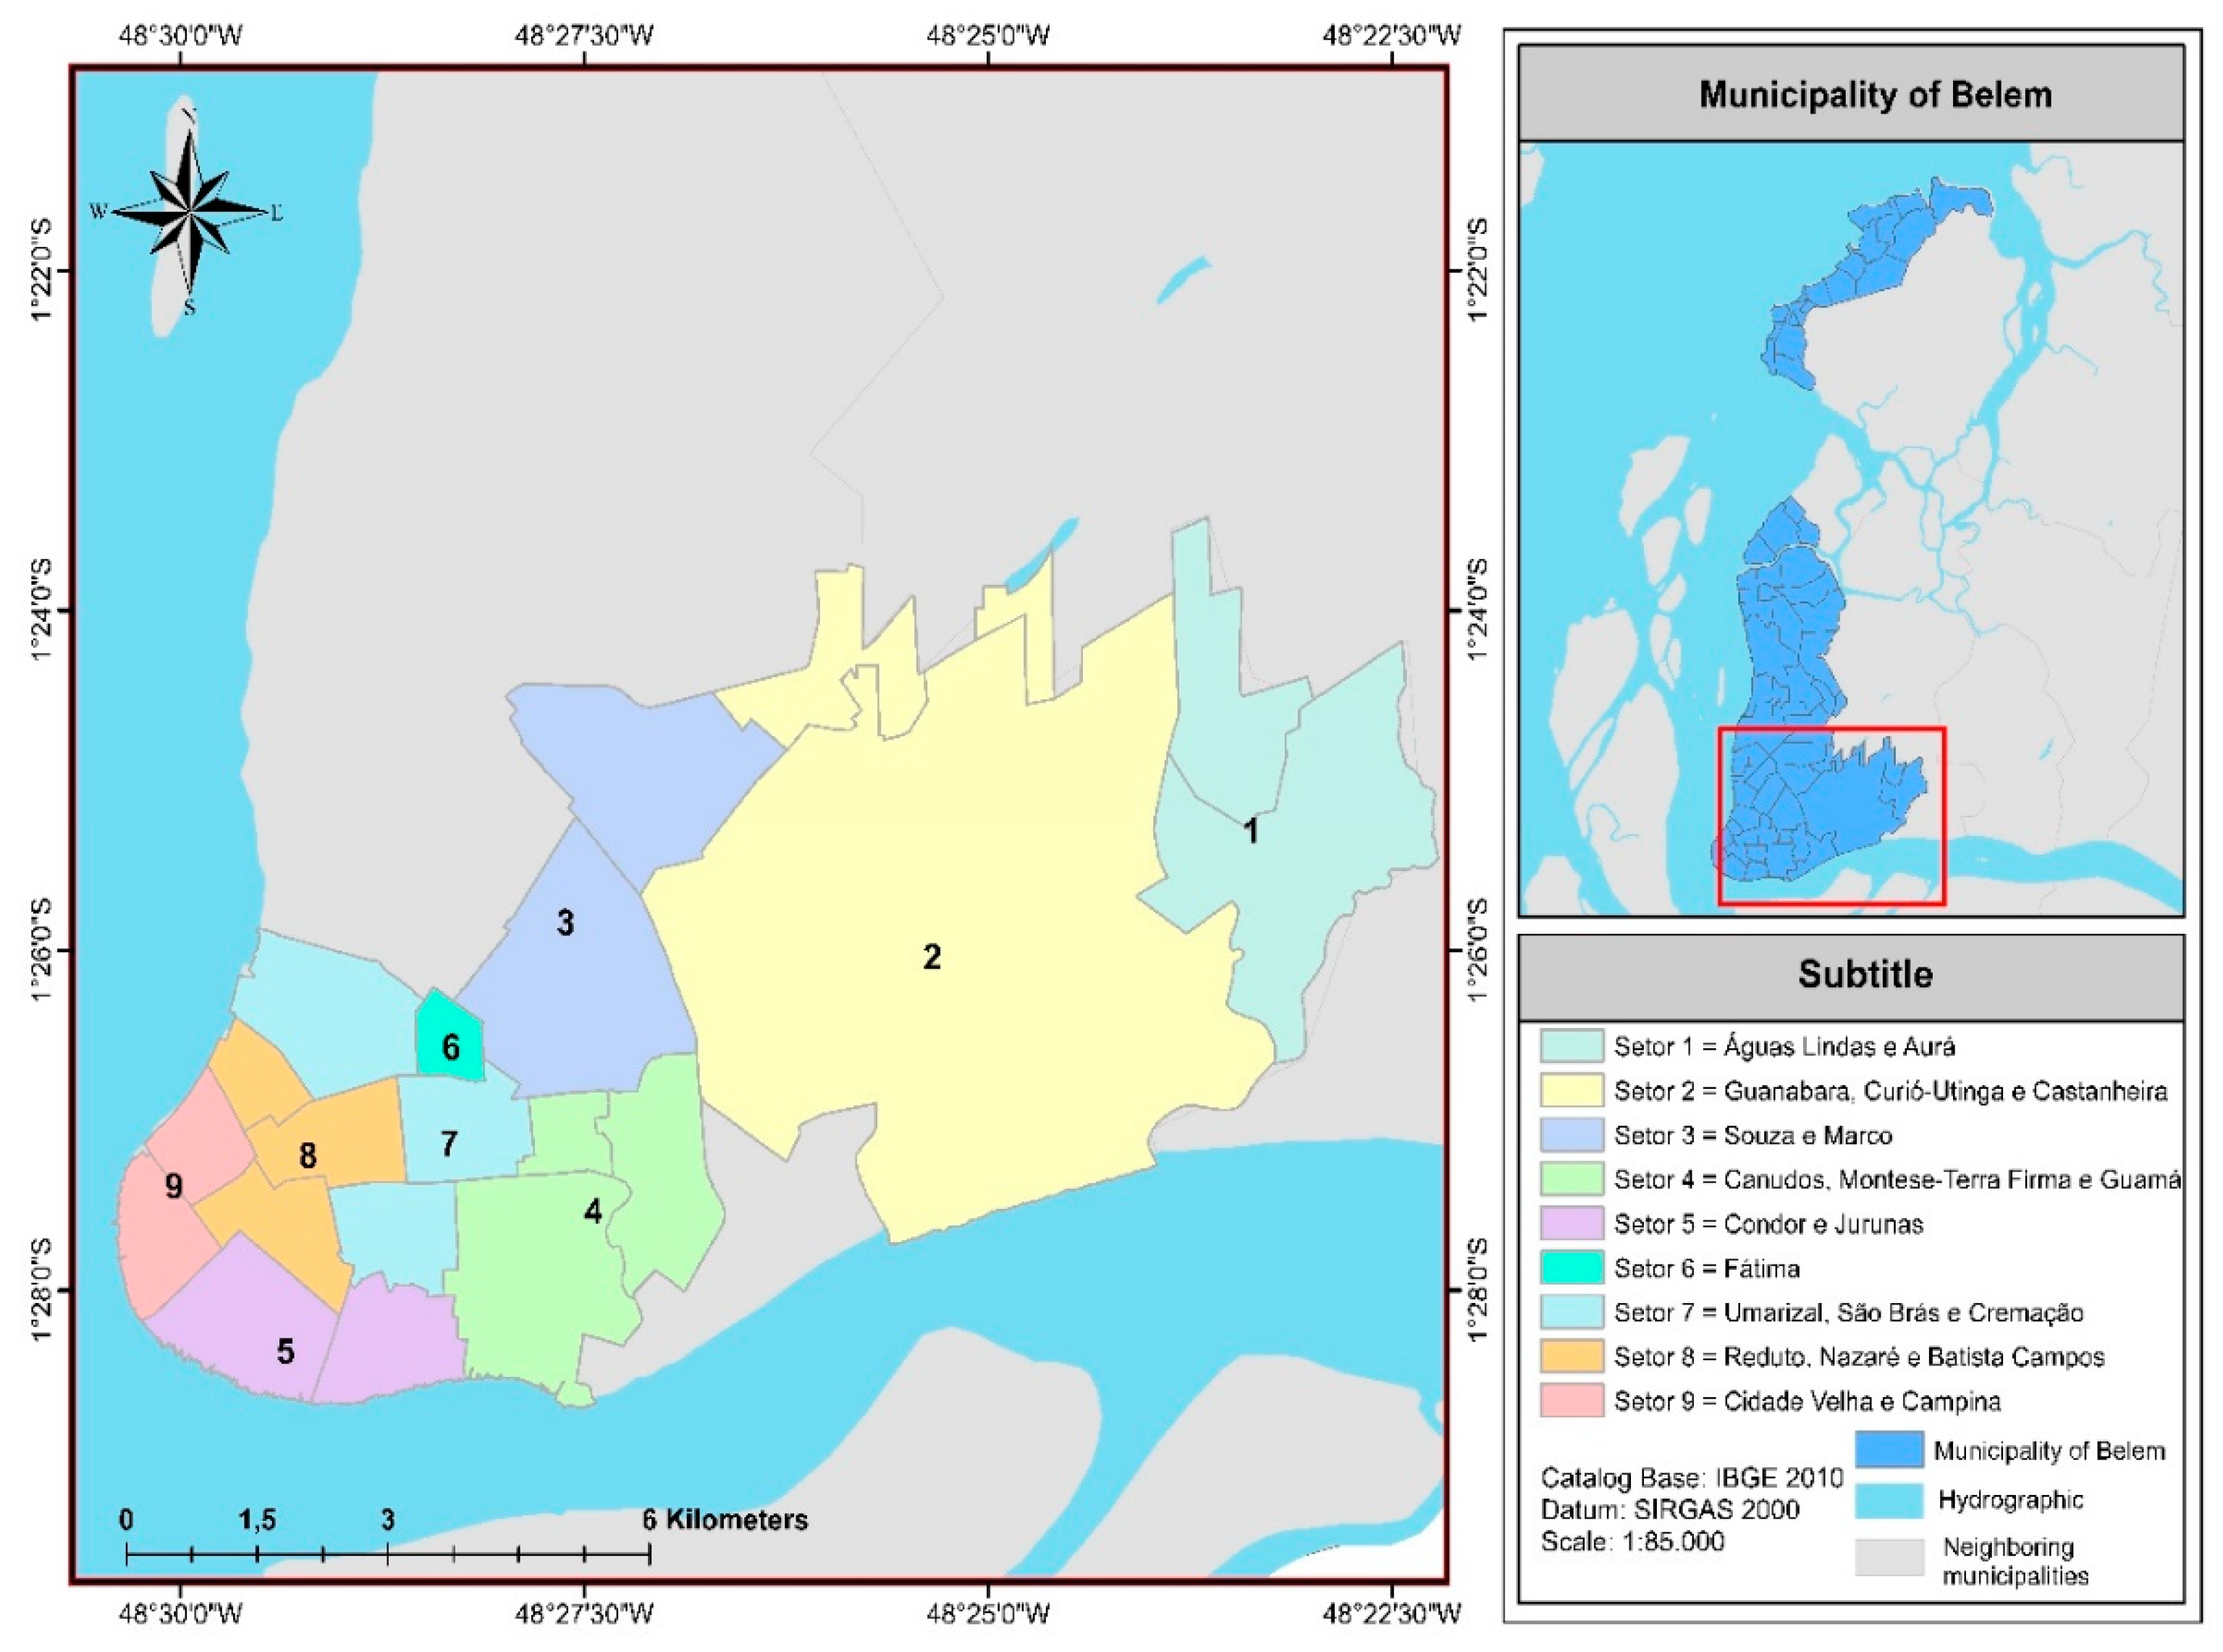
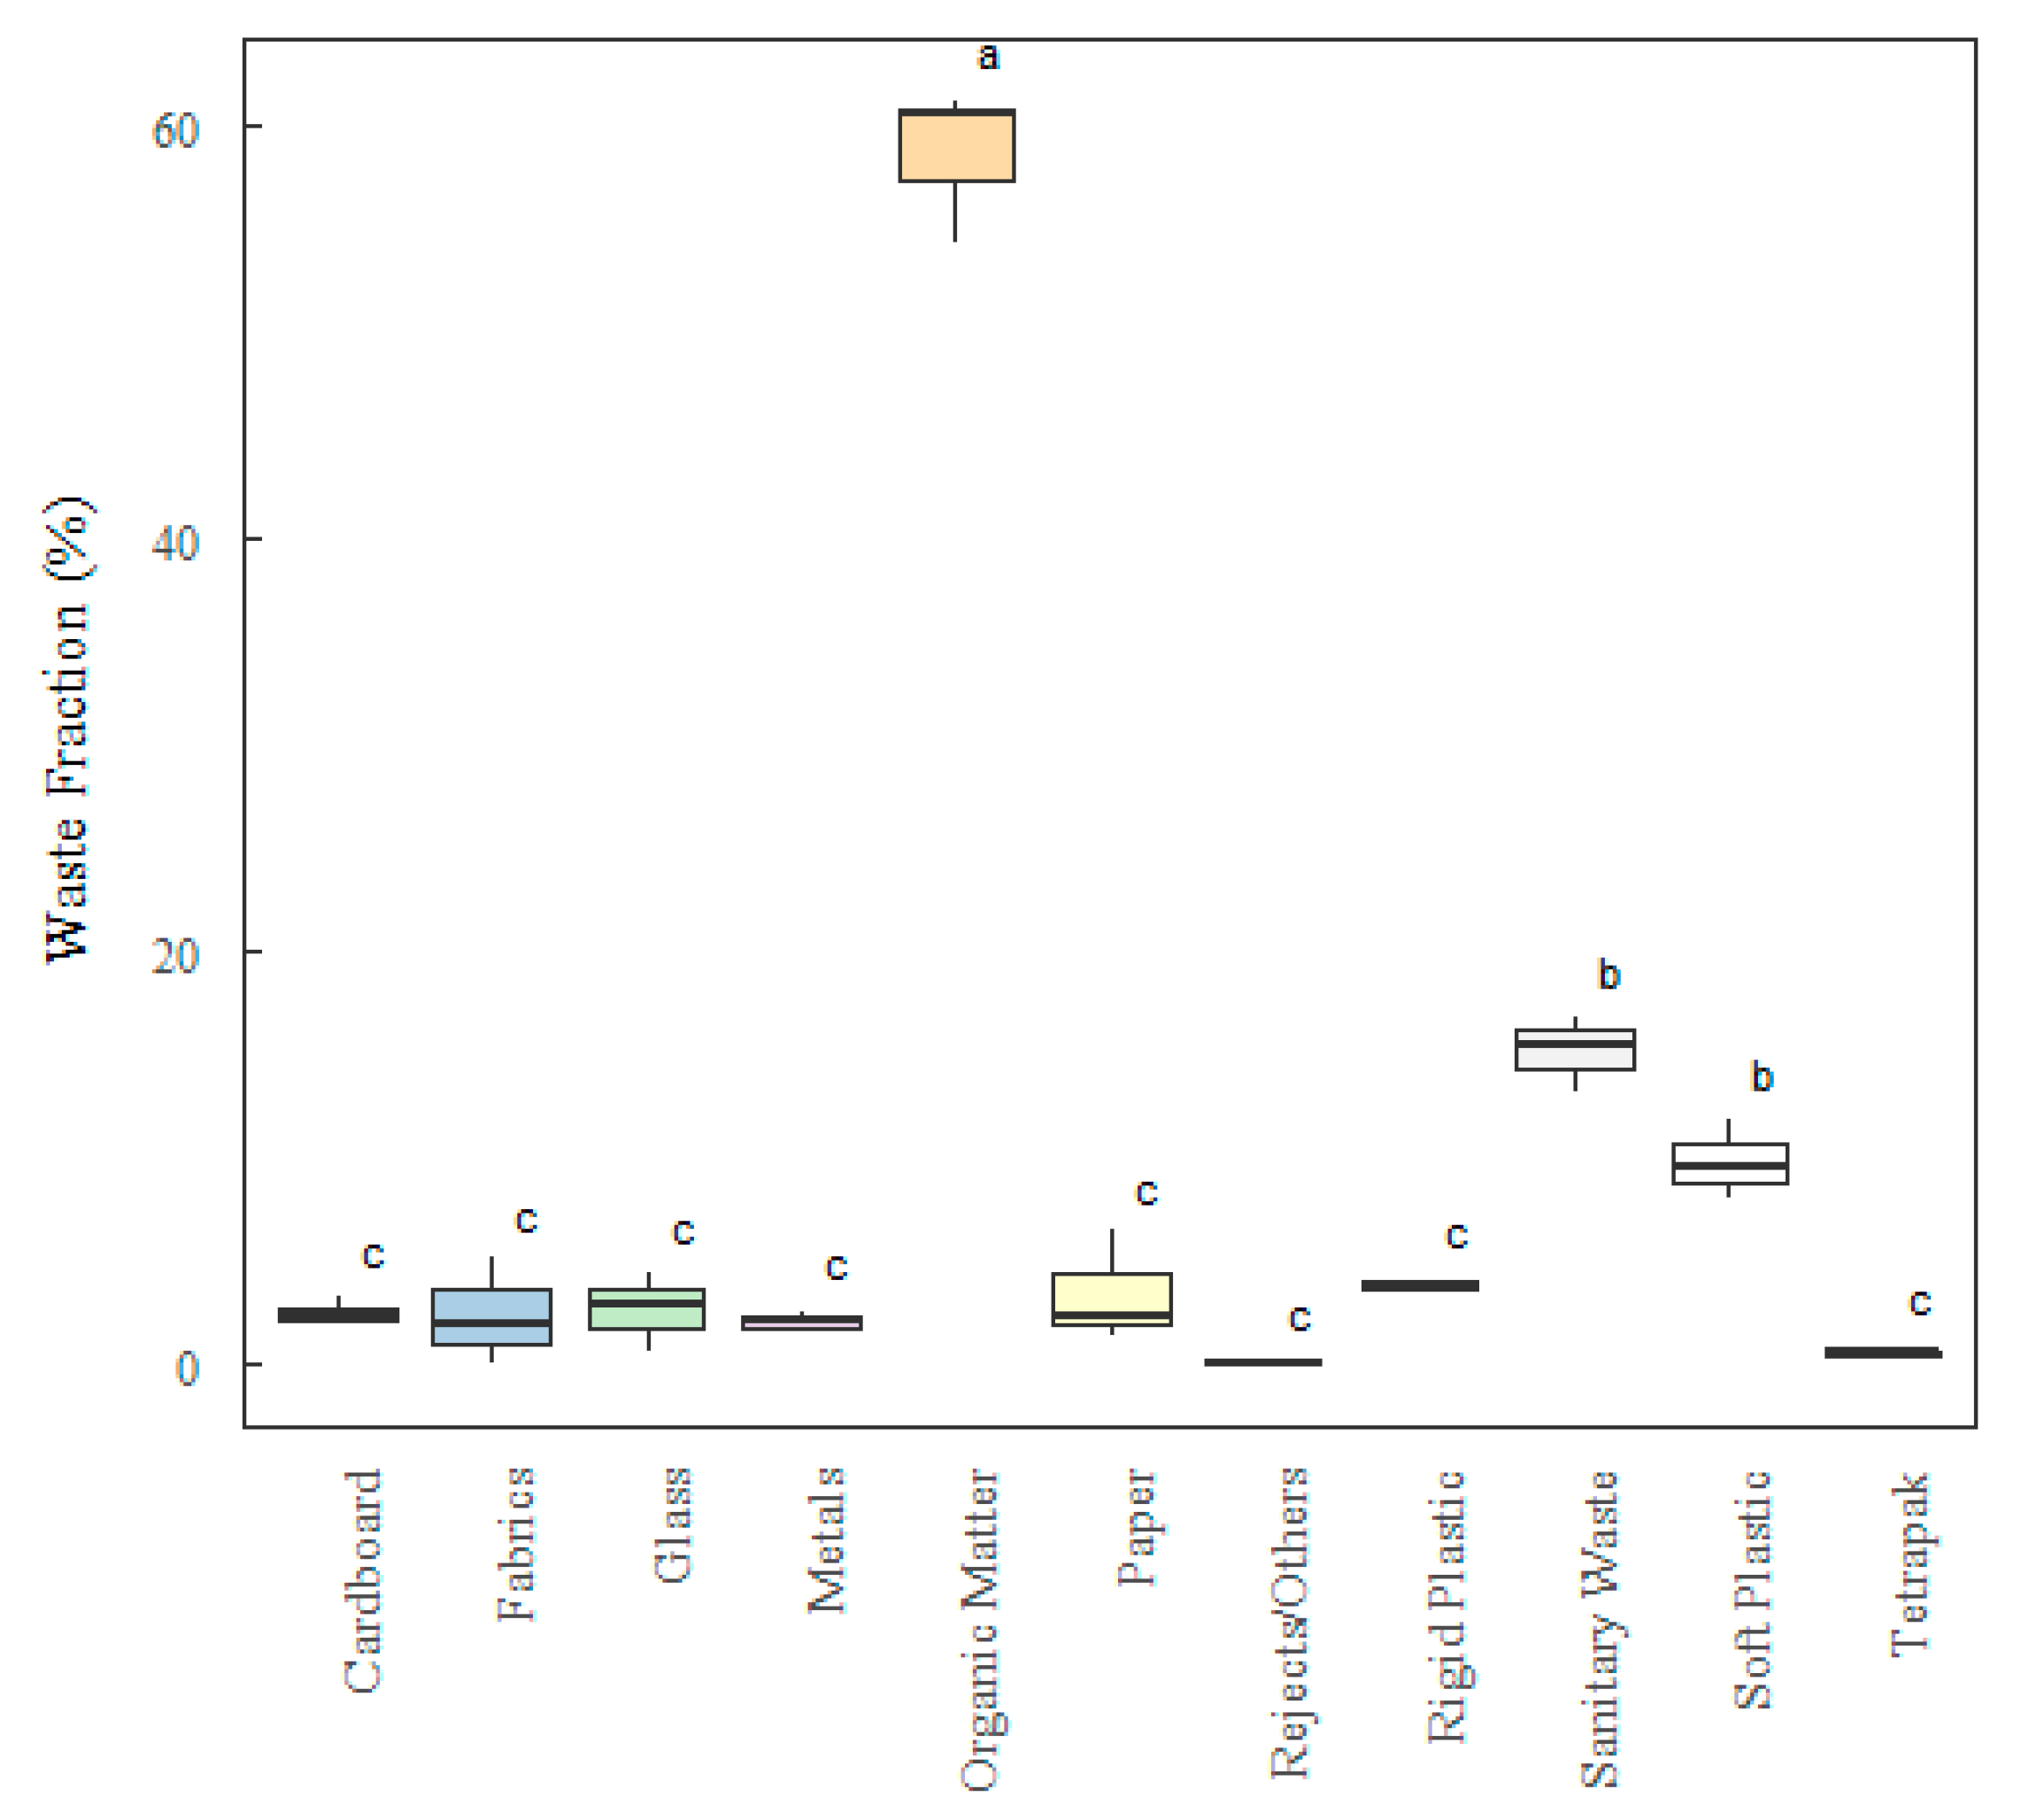
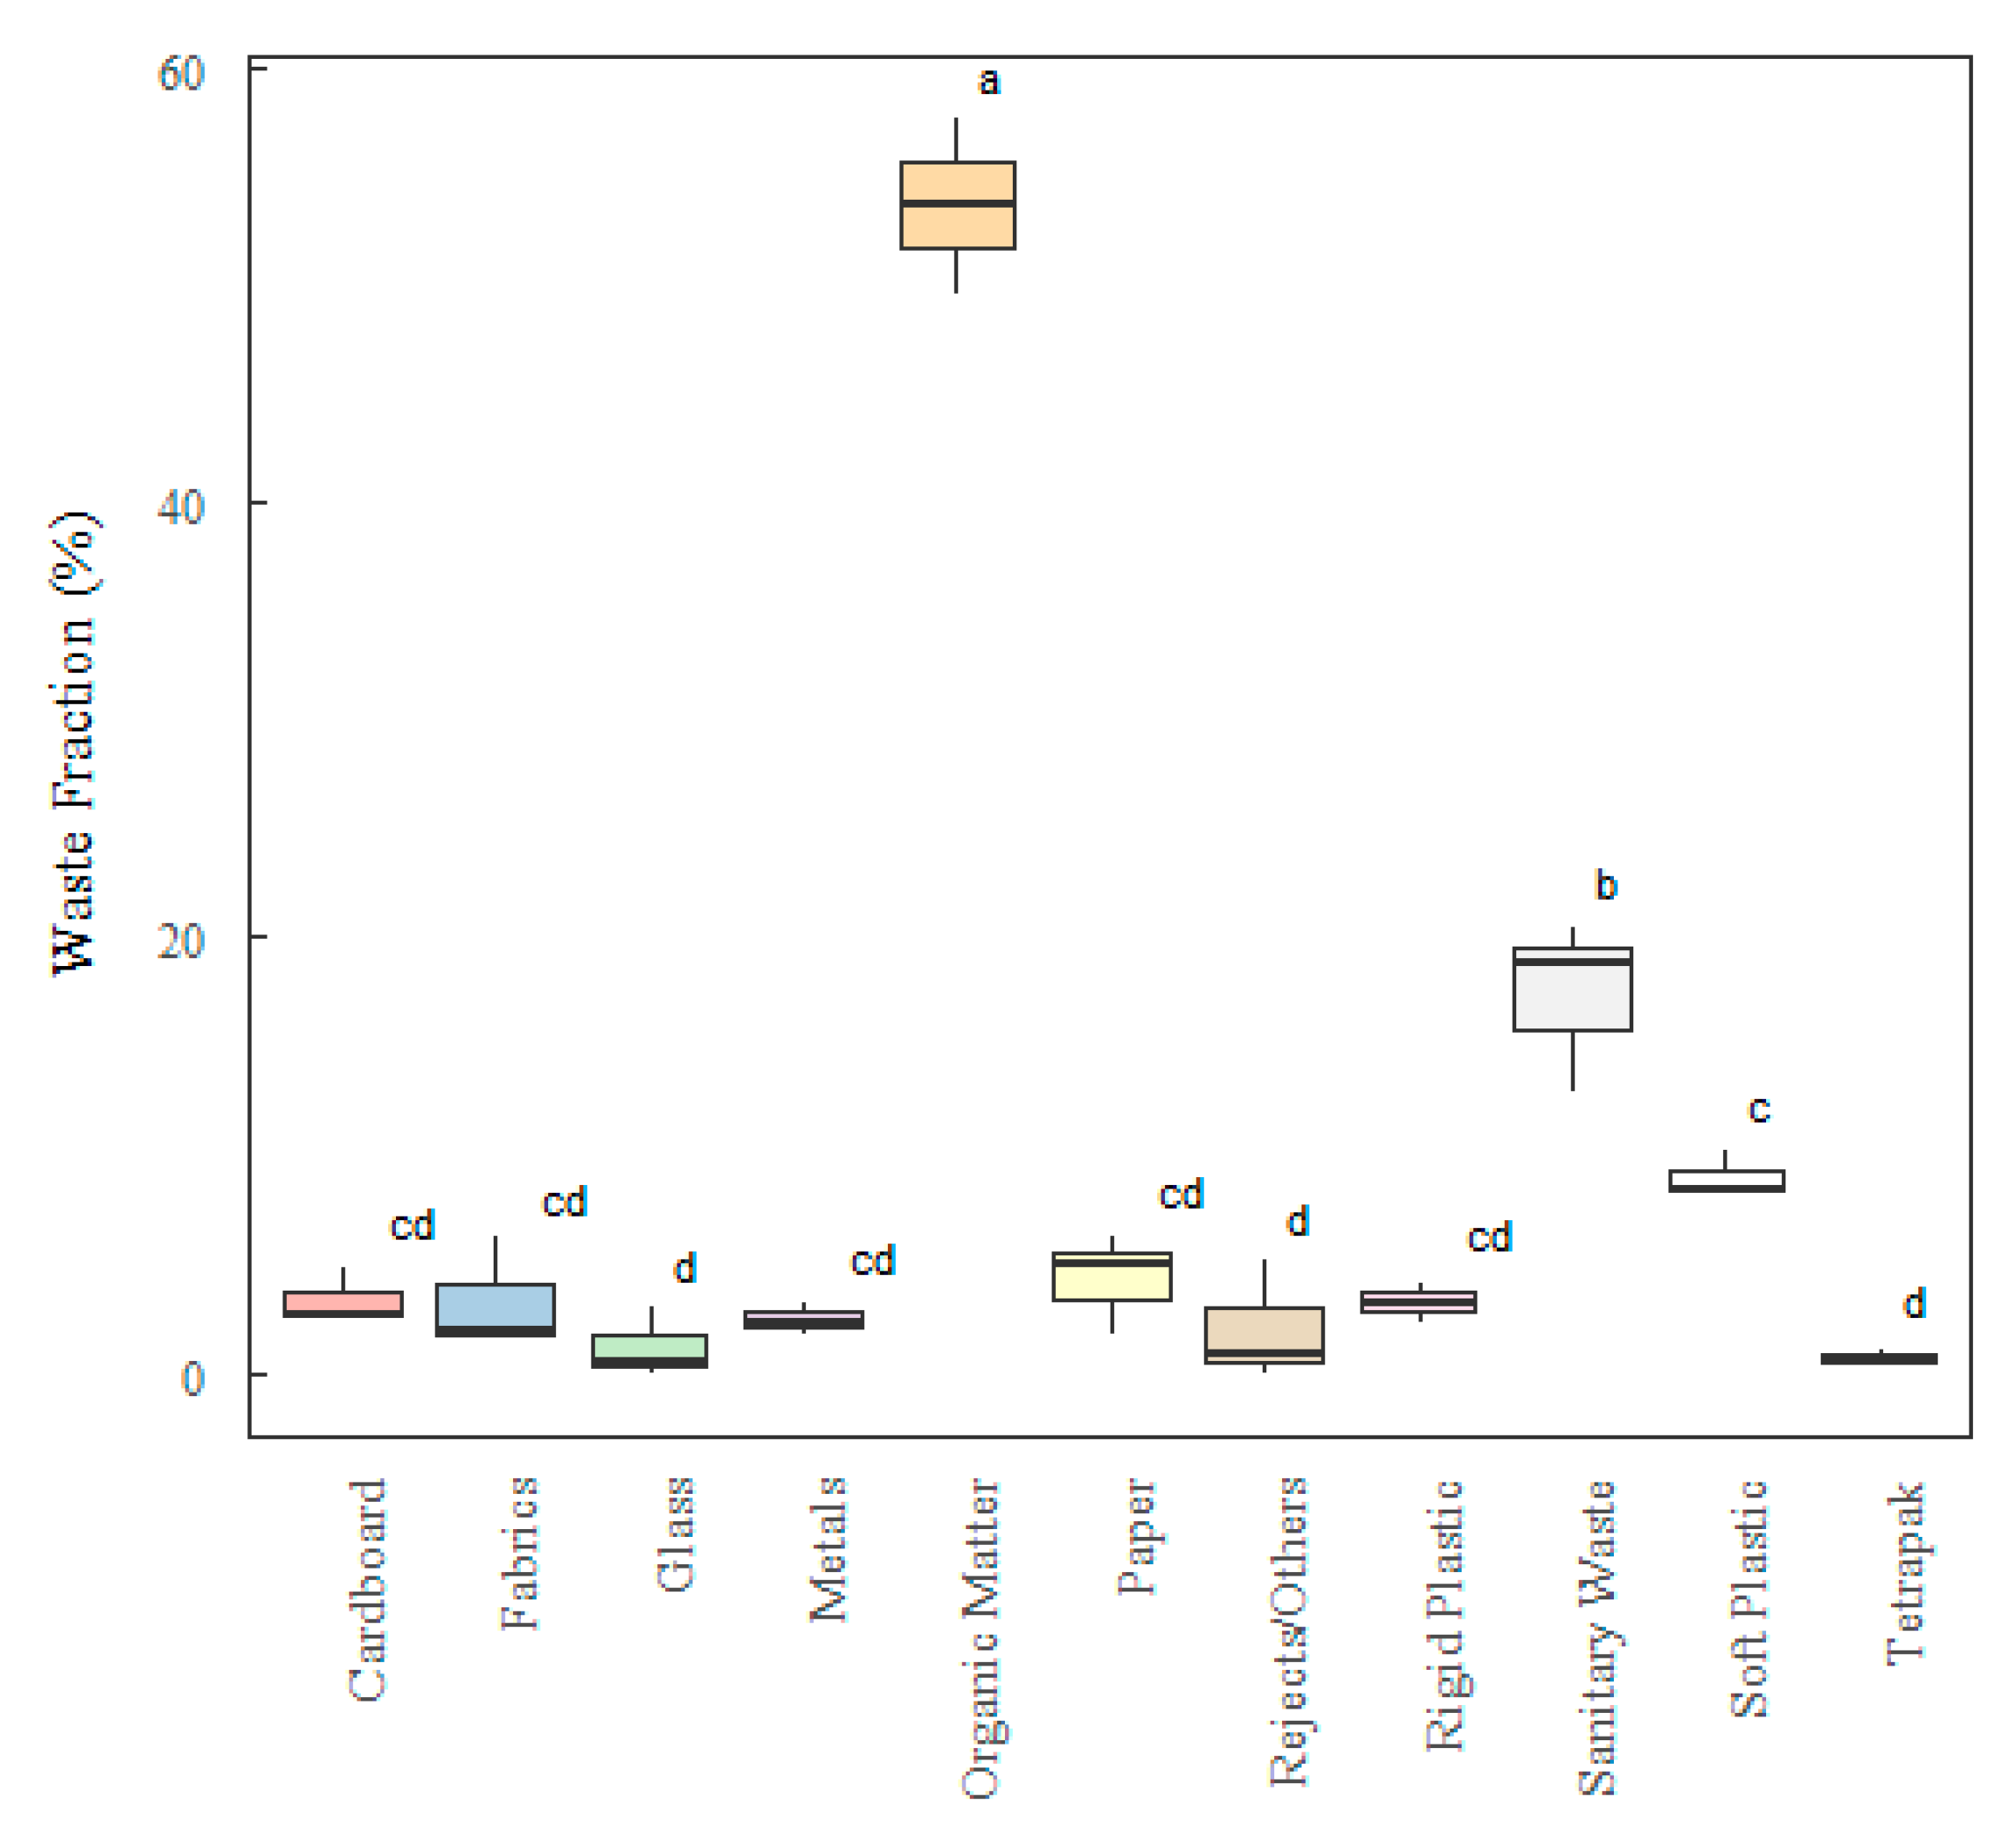
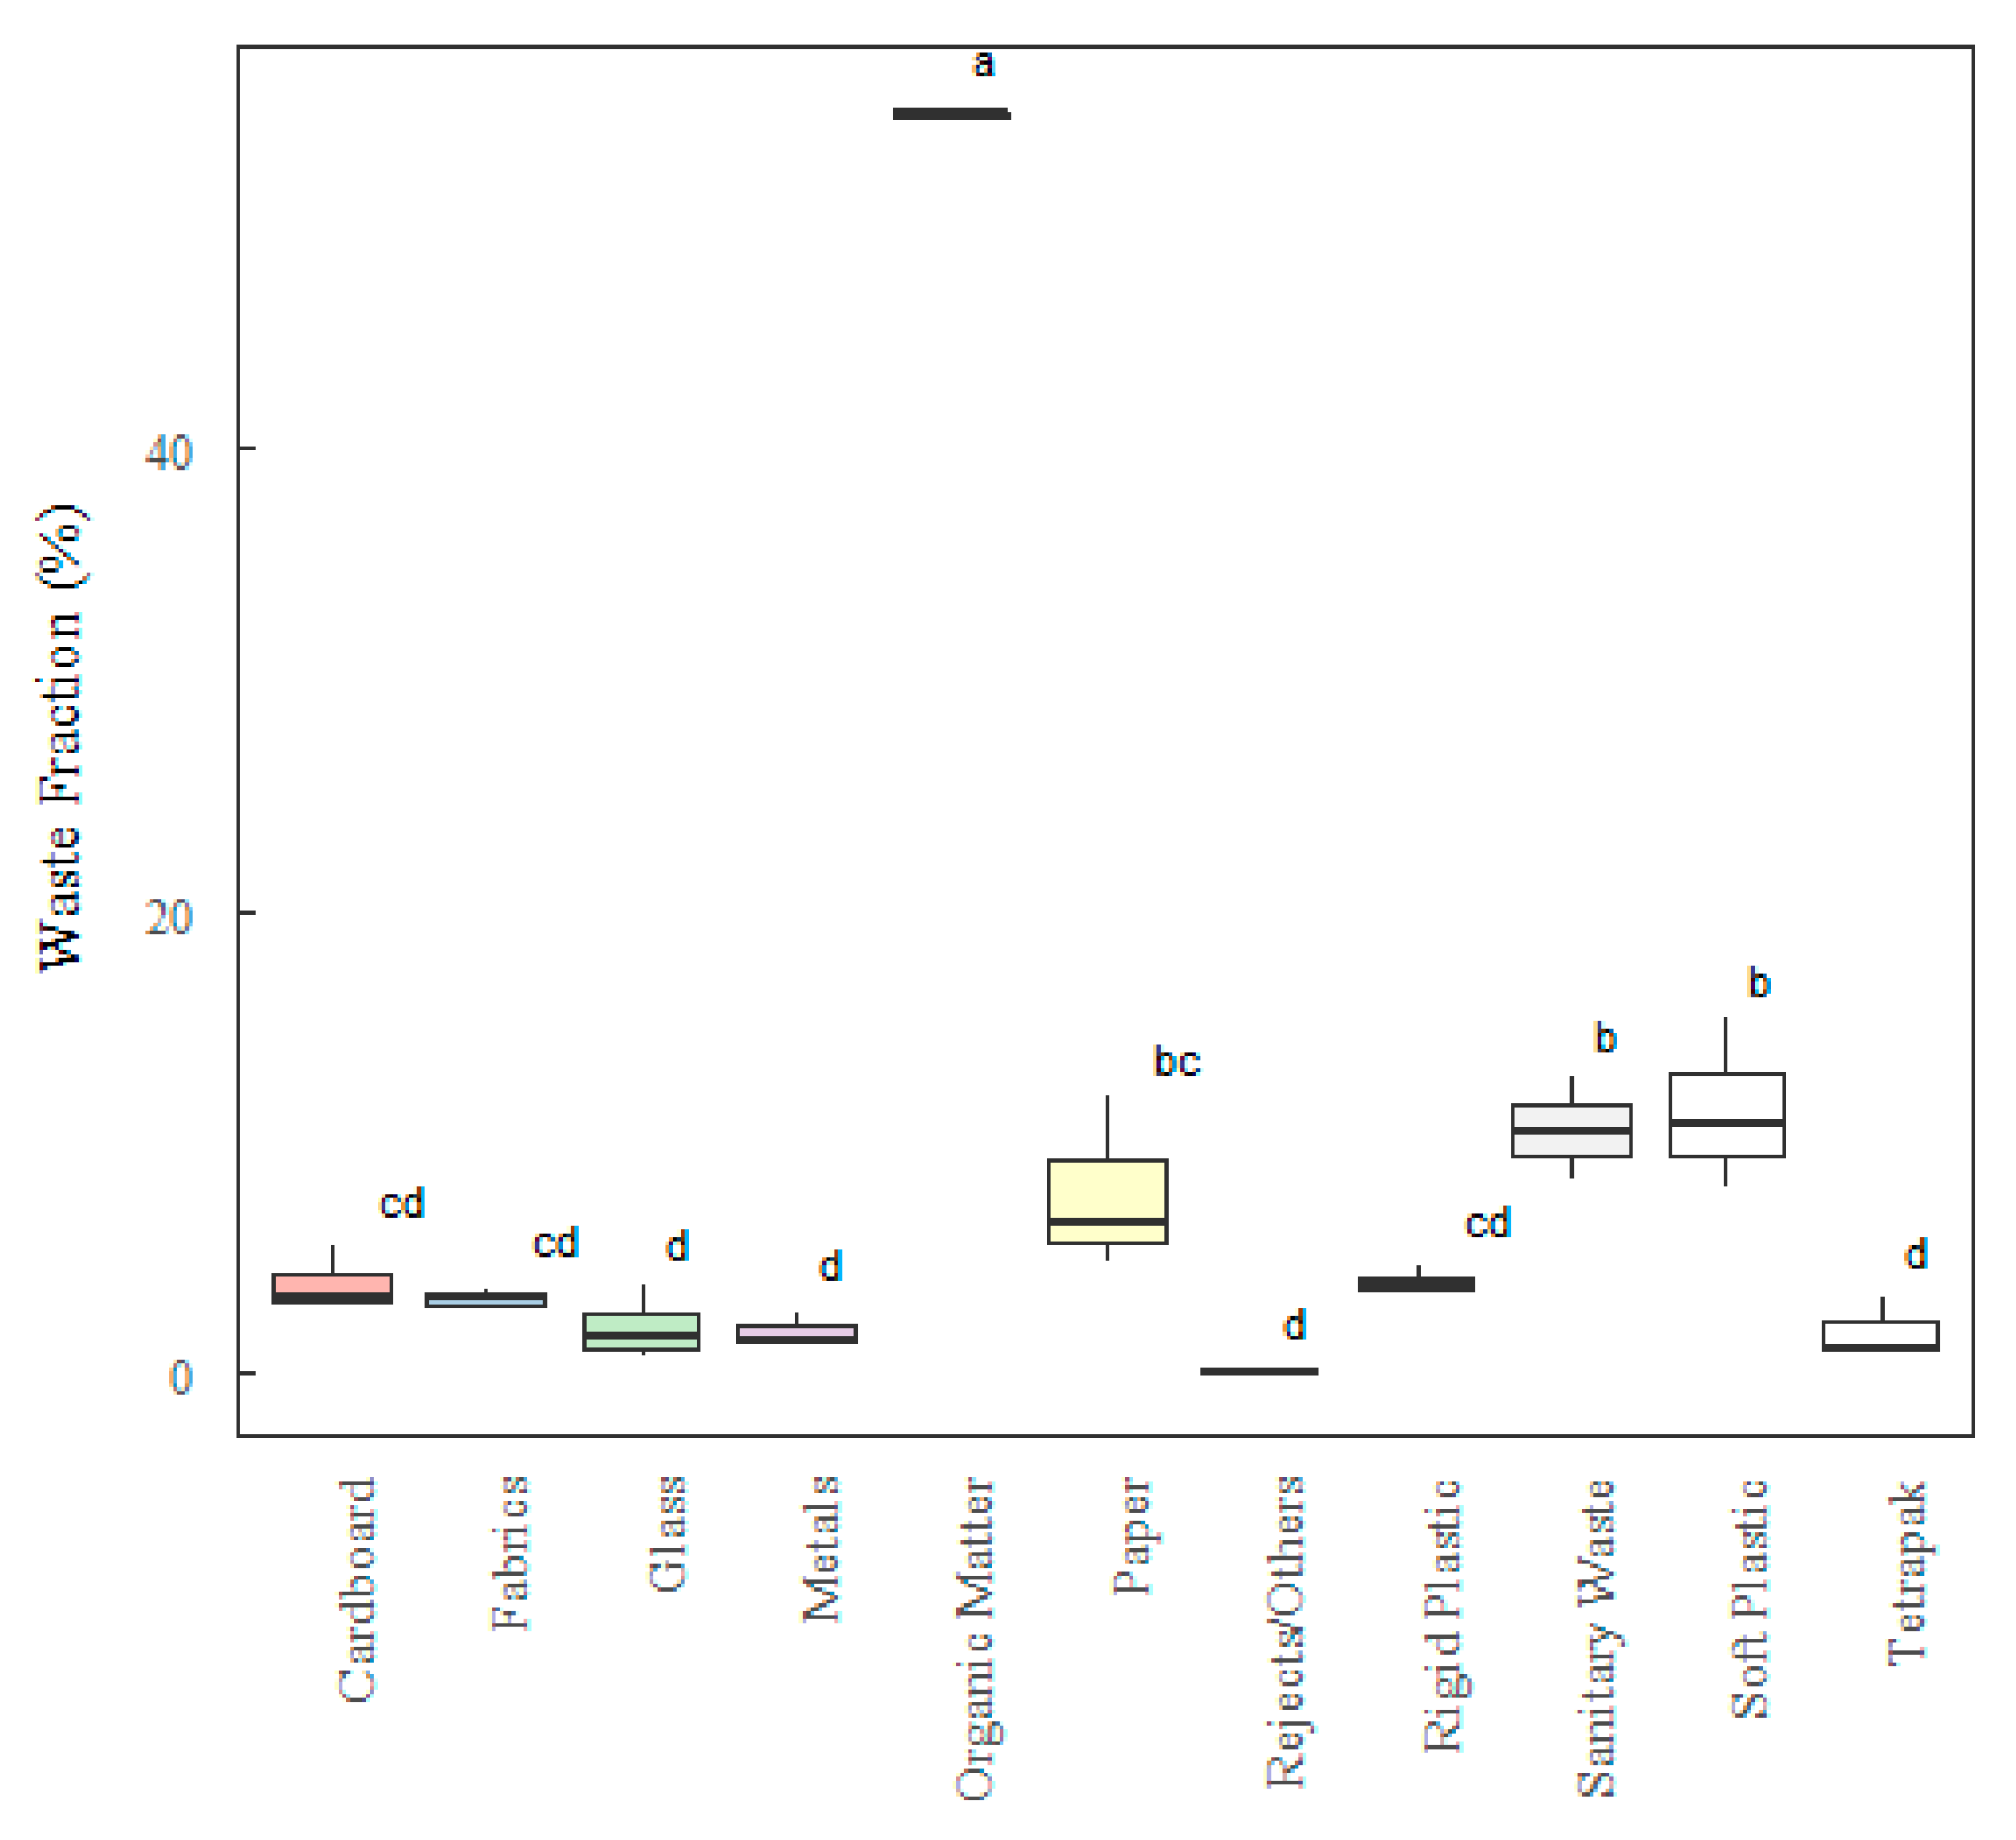
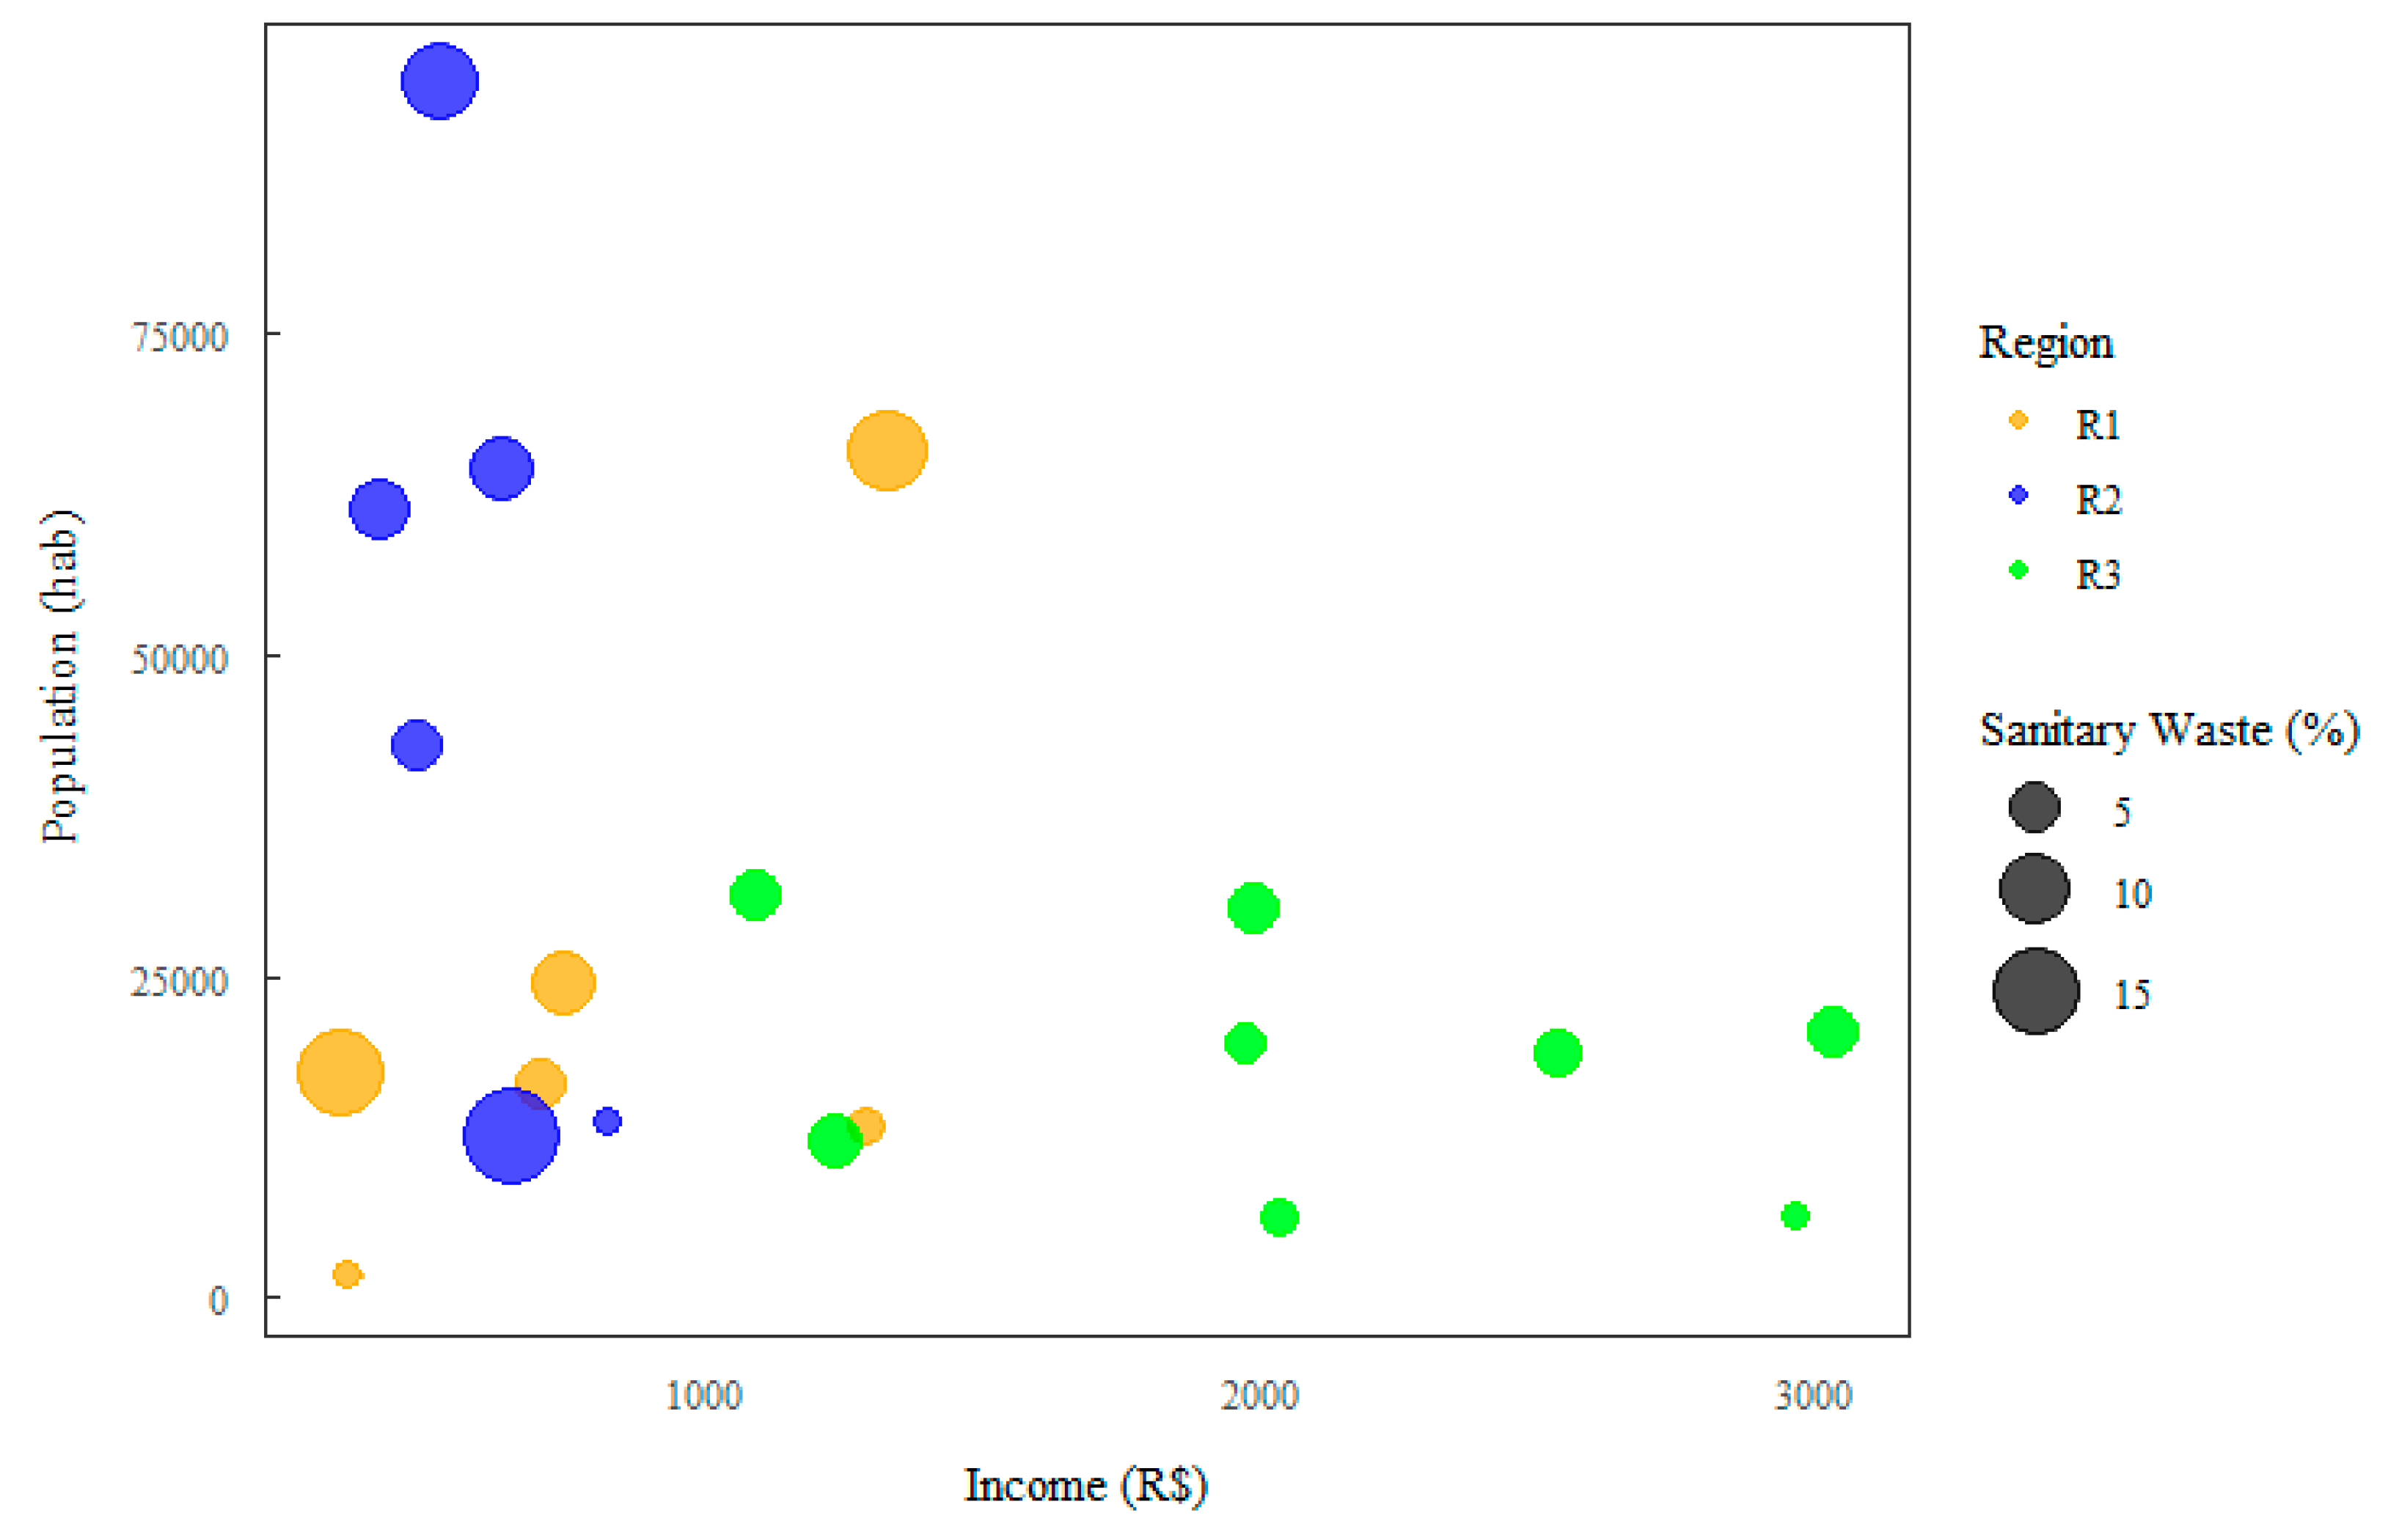
| Region | Class | Sectors | Neighborhoods |
|---|---|---|---|
| 1 | E | 1, 2 e 3 | Aurá, Águas Lindas, Curió-Utinga, Guanabara, Castanheira, Souza e Marco. |
| 2 | D | 4, 5 e 6 | Canudos, Terra Firme, Guamá, Condor, Jurunas e Fátima. |
| 3 | C | 7, 8 e 9 | Umarizal, São Brás, Cremação, Batista Campos, Nazaré, Reduto, Campina e Cidade Velha. |
| Class of MHSW | Sectors | ||||||||
|---|---|---|---|---|---|---|---|---|---|
| S1 (%) | S2 (%) | S3 (%) | S4 (%) | S5 (%) | S6 (%) | S7 (%) | S8 (%) | S9 (%) | |
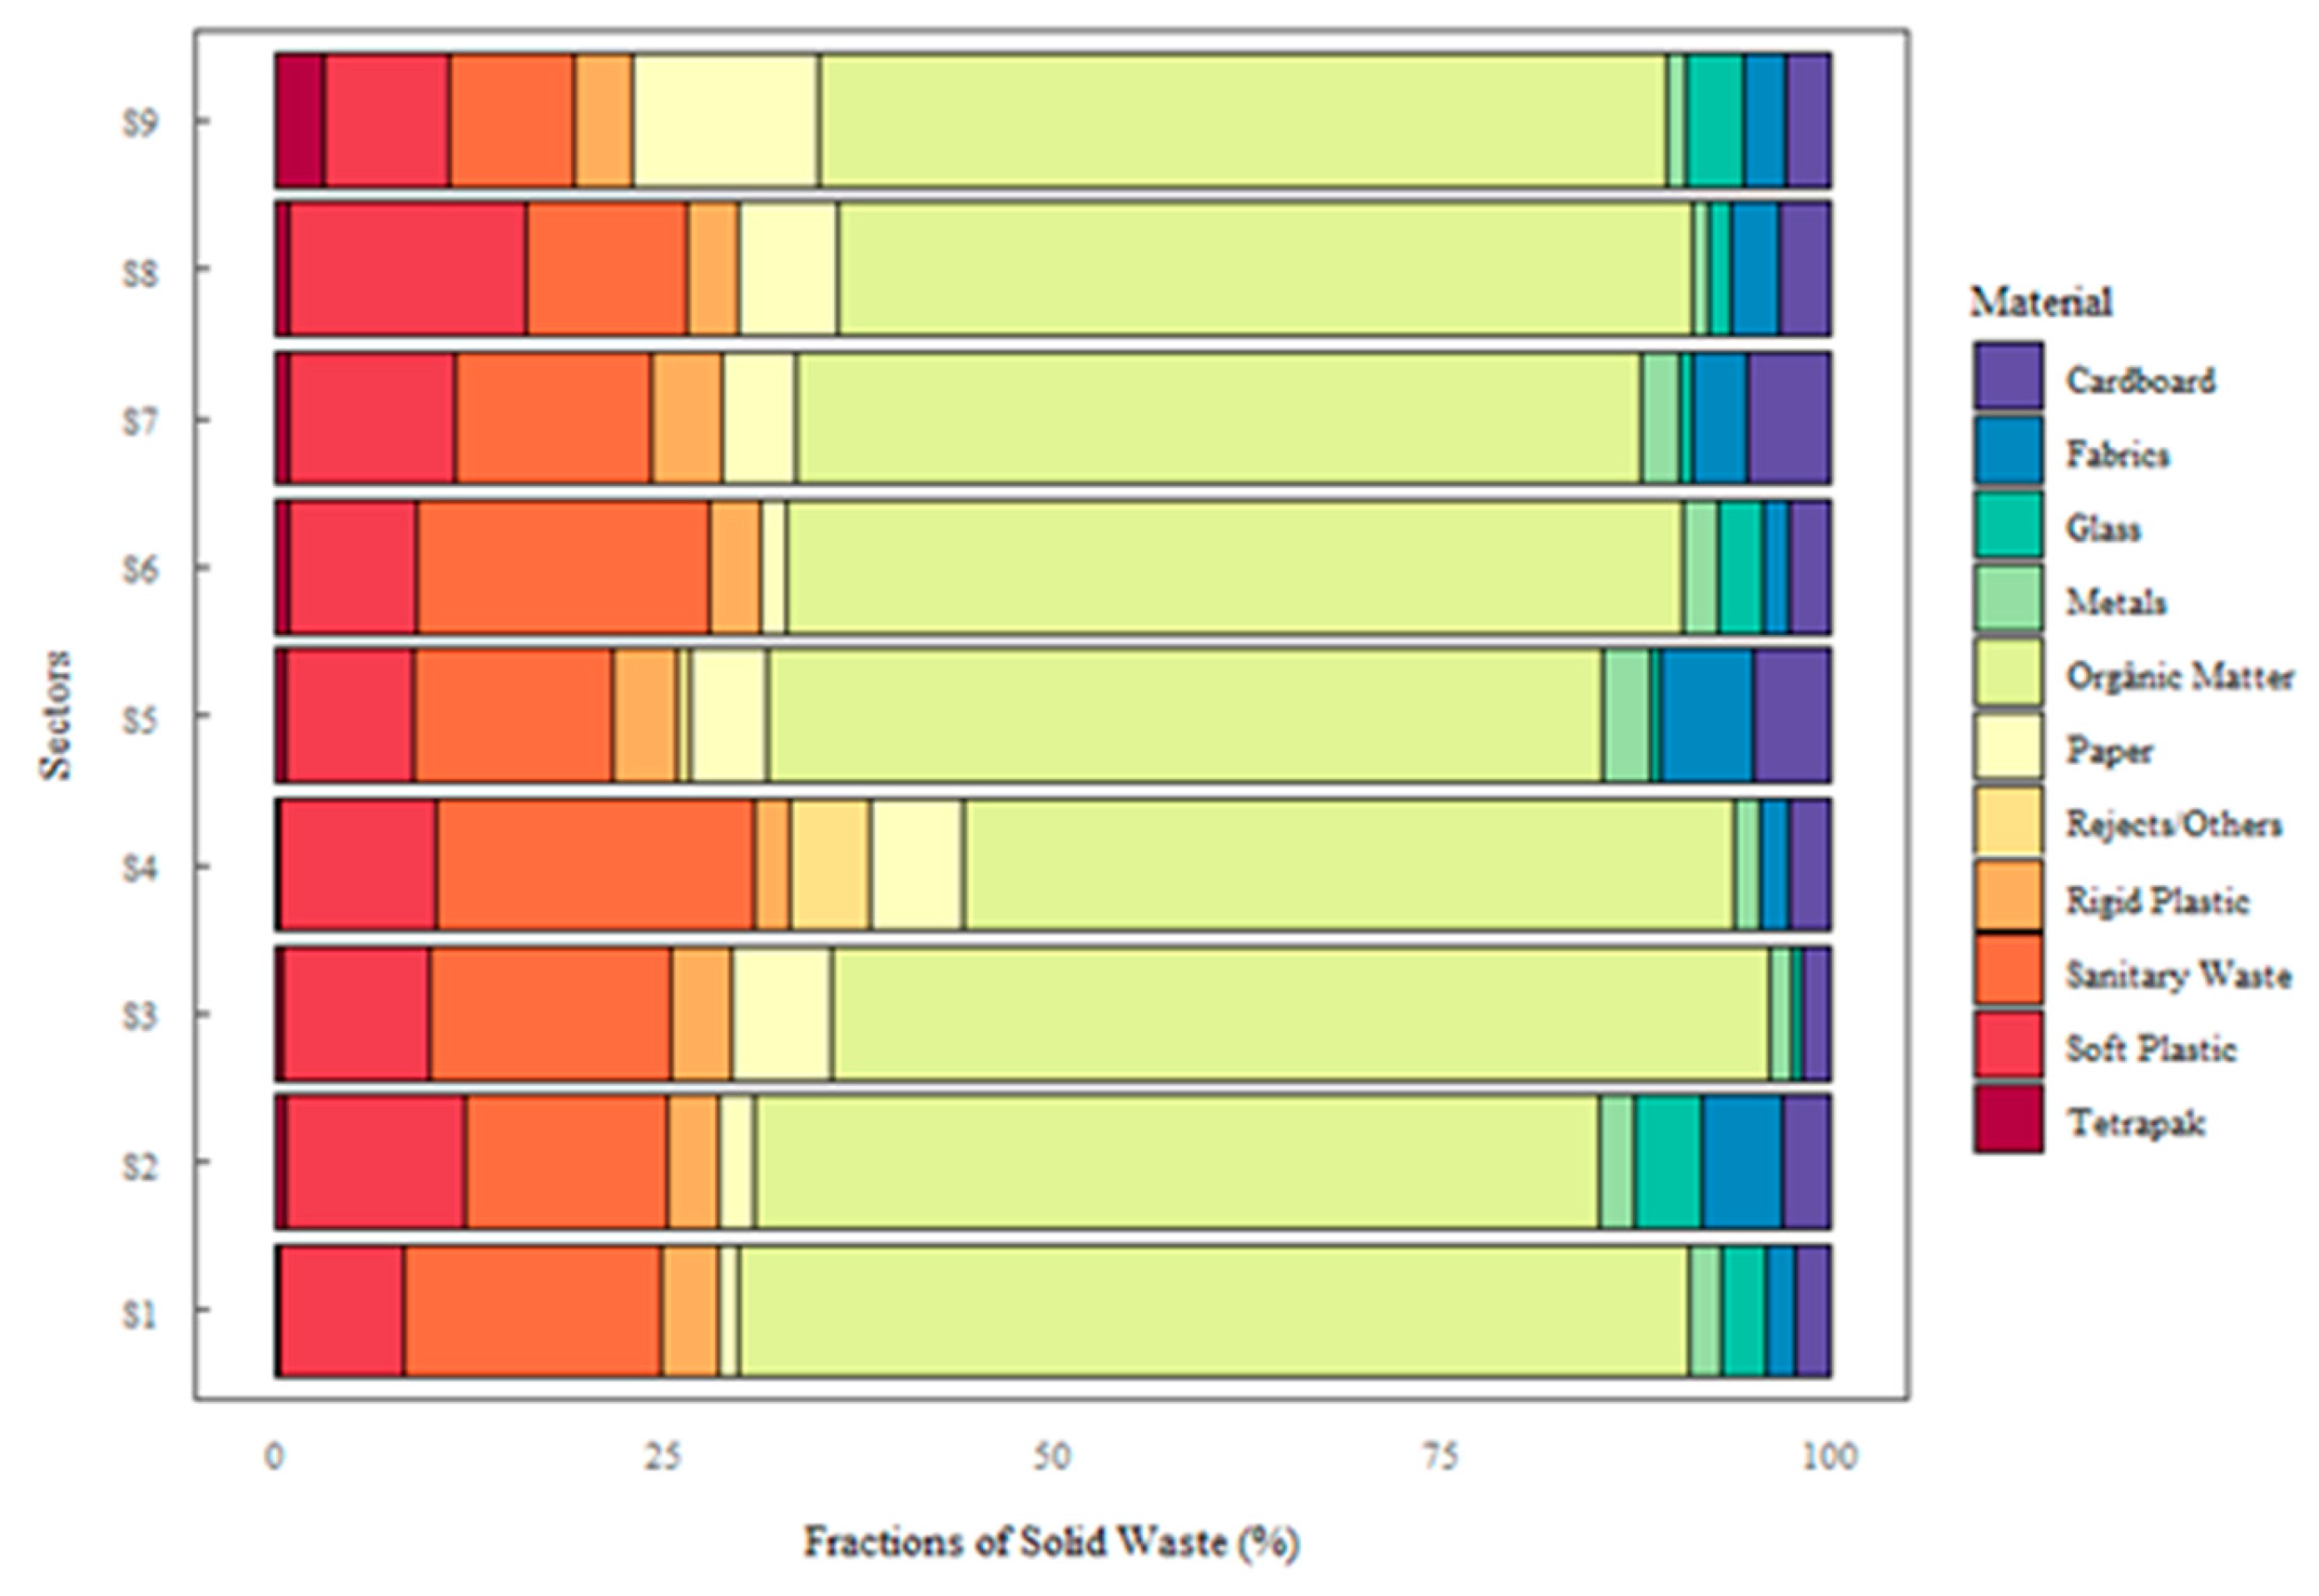
| Paper | 1.24 | 2.30 | 6.38 | 6.13 | 5.01 | 1.67 | 4.70 | 6.45 | 11.95 |
| Cardboard | 2.26 | 3.11 | 1.87 | 2.63 | 4.82 | 2.66 | 5.39 | 3.17 | 2.90 |
| Tetra Pak | 0.31 | 0.68 | 0.48 | 0.34 | 0.63 | 0.99 | 0.92 | 0.87 | 3.25 |
| Hard plastic | 3.72 | 3.29 | 3.98 | 2.25 | 4.10 | 3.25 | 4.53 | 3.37 | 3.70 |
| Soft plastic | 7.96 | 11.69 | 9.50 | 10.15 | 8.44 | 8.17 | 10.66 | 15.25 | 7.90 |
| Metal | 2.03 | 2.39 | 1.39 | 1.68 | 3.09 | 2.35 | 2.58 | 1.20 | 1.25 |
| Organic matter | 61.12 | 54.15 | 60.43 | 49.45 | 53.71 | 57.61 | 54.33 | 54.79 | 54.55 |
| Glass | 2.87 | 4.29 | 0.53 | 0.00 | 0.43 | 2.93 | 0.63 | 1.39 | 3.65 |
| Sanitary waste | 16.67 | 13.00 | 15.44 | 20.34 | 12.78 | 18.78 | 12.72 | 10.34 | 8.25 |
| Fabrics | 1.81 | 5.10 | - | 1.87 | 6.17 | 1.58 | 3.55 | 3.17 | 2.60 |
| Rejects/Others | - | - | - | 5.17 | 0.82 | - | - | - | - |
| Total | 100 | 100 | 100 | 100 | 100 | 100 | 100 | 100 | 100 |
| Class of MHSW | Mean ± SD | Weighted Averade | Median | Variance | Maximum | Minimum |
|---|---|---|---|---|---|---|
| Paper | 5.09 ± 3.28 | 5.35 | 5.01 | 10.76 | 11.95 | 1.24 |
| Cardboard | 3.20 ± 1.16 | 3.40 | 2.90 | 1.35 | 5.39 | 1.87 |
| Tetra Pak | 0.94 ± 0.90 | 0.64 | 0.68 | 0.81 | 3.25 | 0.31 |
| Hard plastic | 3.58 ± 0.65 | 3.43 | 3.70 | 0.42 | 4.53 | 2.25 |
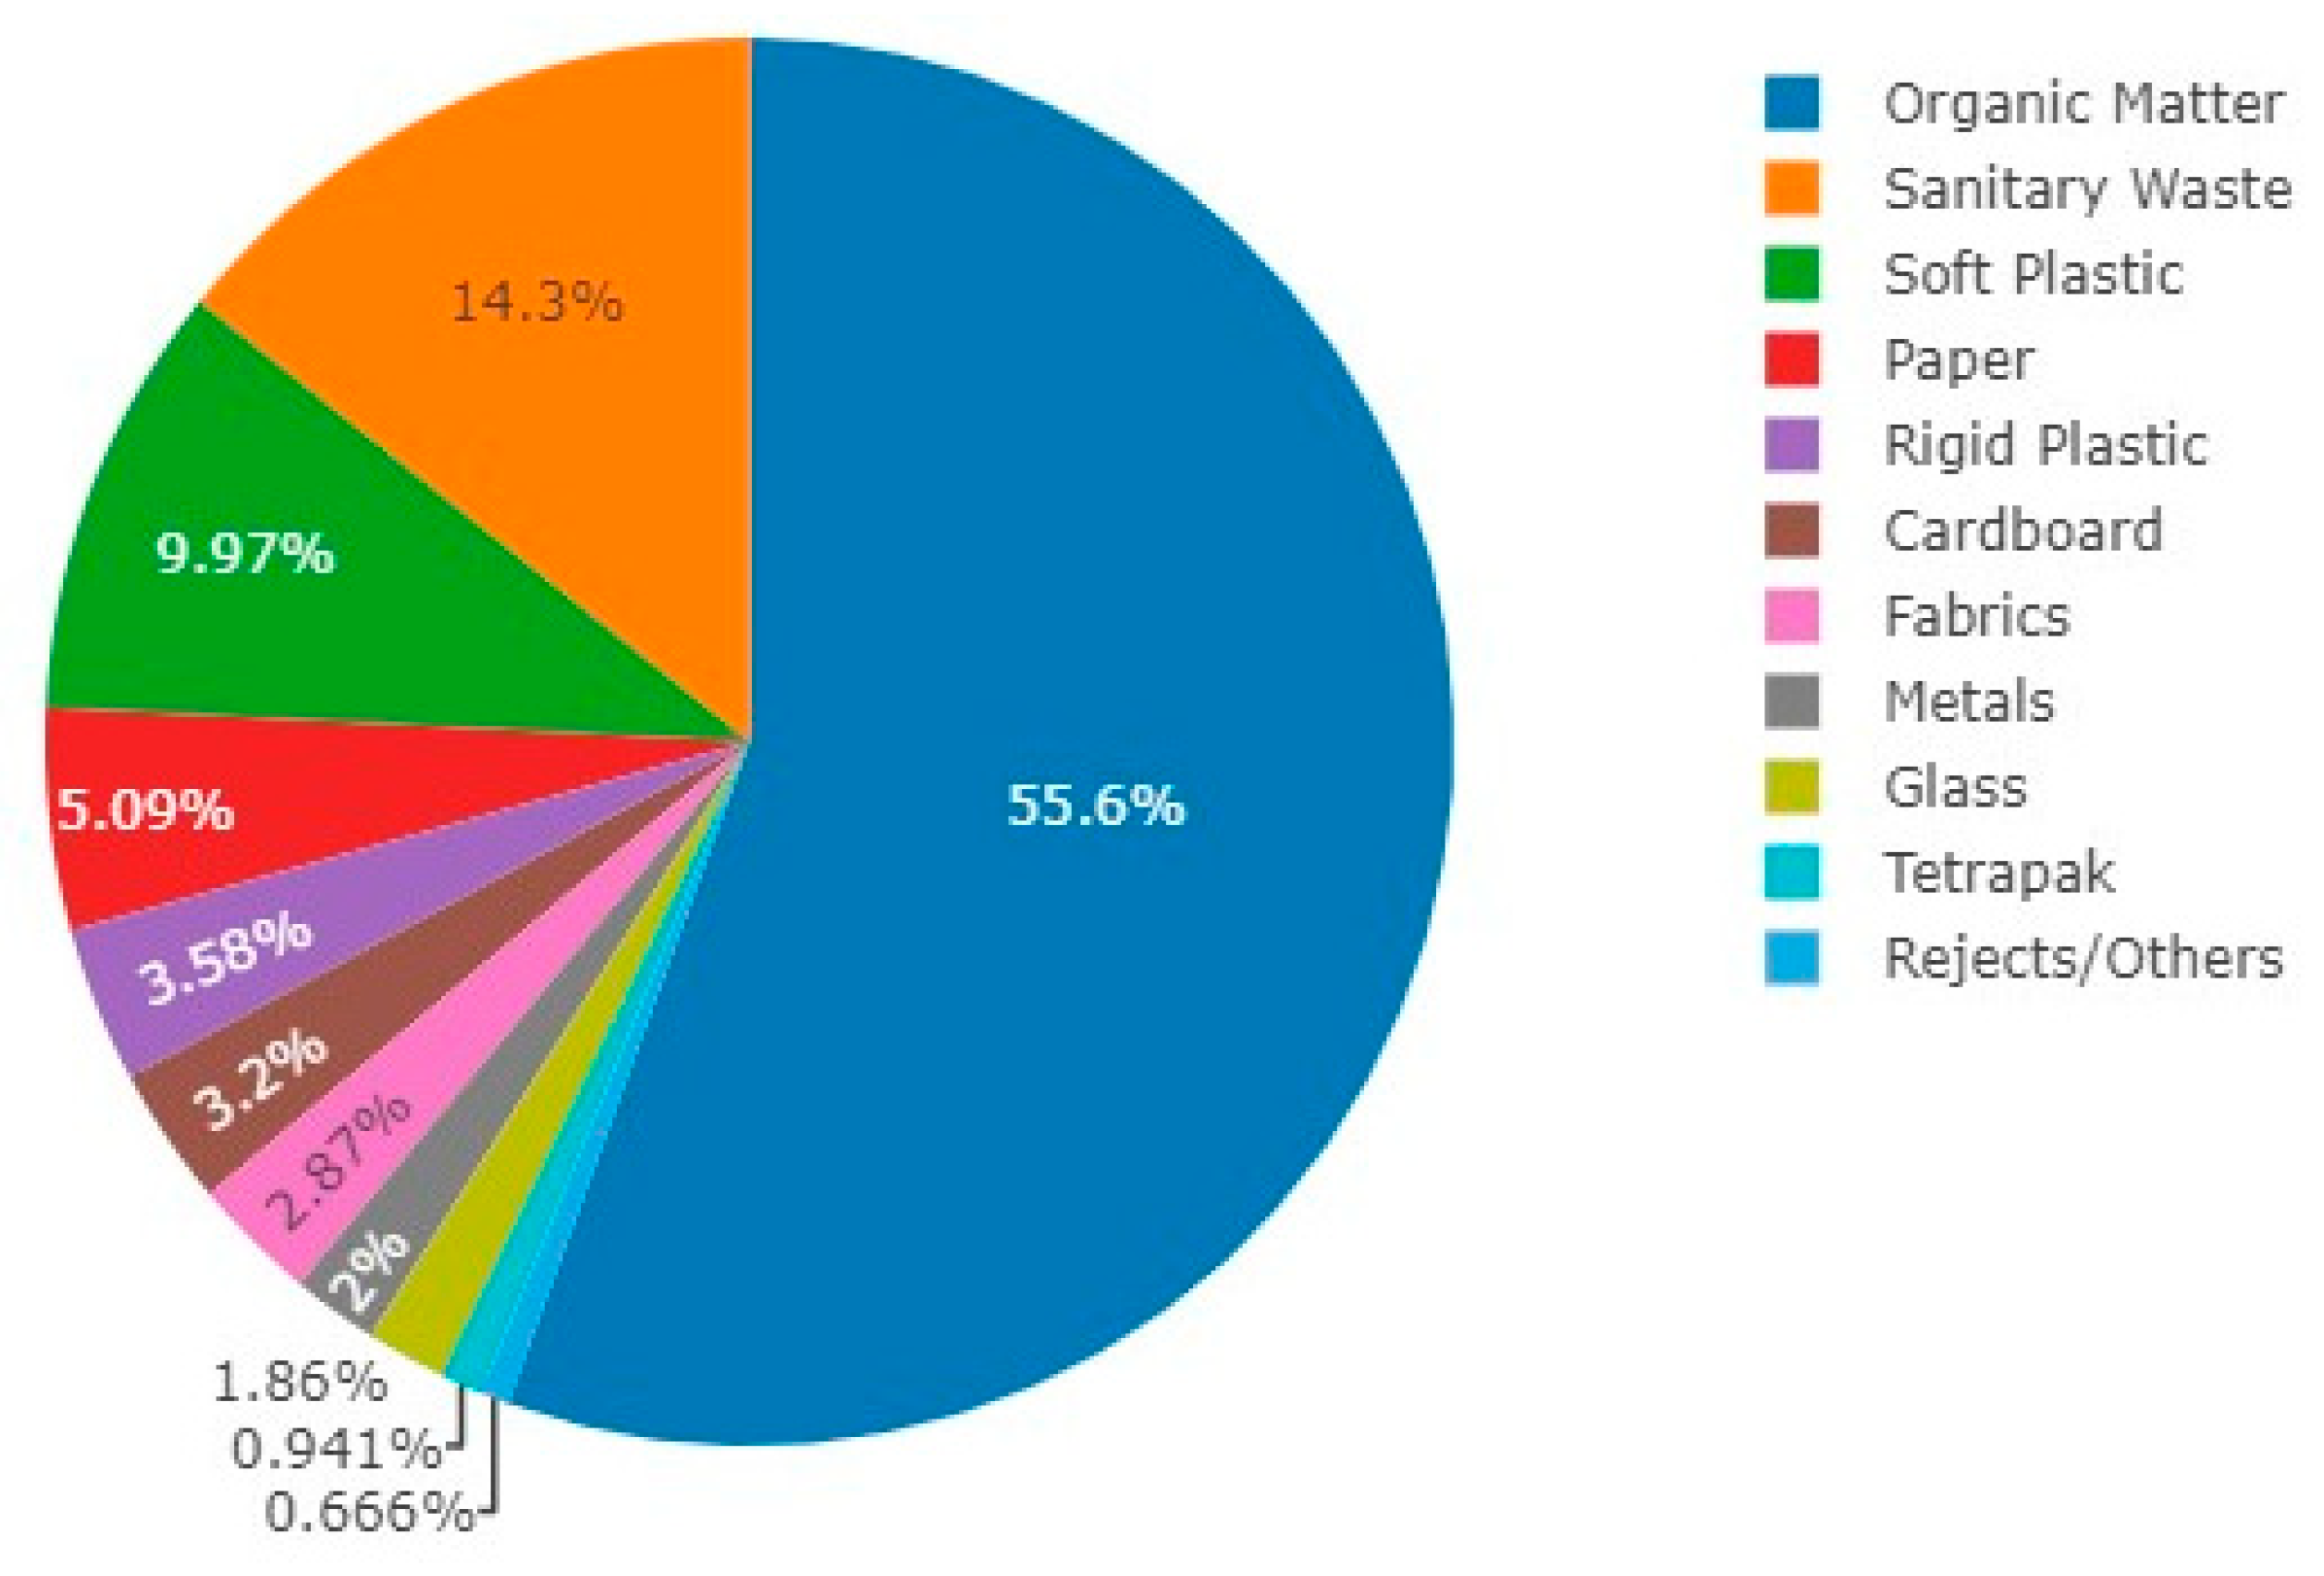
| Soft plastic | 9.97 ± 2.38 | 10.17 | 9.50 | 5.68 | 15.25 | 7.90 |
| Metal | 2.00 ± 0.66 | 2.06 | 2.03 | 0.43 | 3.09 | 1.20 |
| Organic matter | 55.57 ± 3.62 | 53.94 | 54.55 | 13.09 | 61.12 | 49.45 |
| Glass | 1.86 ± 1.59 | 0.92 | 1.39 | 2.53 | 4.29 | 0.00 |
| Sanitary waste | 14.26 ± 3.91 | 15.38 | 13.00 | 15.29 | 20.34 | 8.25 |
| Fabrics | 3.23 ± 1.66 | 3.01 | 2.89 | 2.75 | 6.17 | 1.58 |
| Rejects/Others | 3.00 ± 3.08 | 1.69 | 3.00 | 9.46 | 5.17 | 0.82 |
|
R1 (E) |
GL | SQ (Aj.) | QM (Aj.) | F-Value | P-Value | F-Critical | |
| Factor | 10 | 8663.8 | 866.28 | 236.92 | 0.000 | 2.297 | |
| Error | 22 | 80.4 | 3.66 | ||||
| Total | 32 | 8744.2 | |||||
|
R2 (D) |
GL | SQ (Aj.) | QM (Aj.) | F-Value | P-Value | F-Critical | |
| Factor | 10 | 7209.2 | 720.92 | 134.42 | 0.000 | 2.297 | |
| Error | 22 | 118.0 | 5.36 | ||||
| Total | 32 | 7327.2 | |||||
|
R3 (C) |
GL | SQ (Aj.) | QM (Aj.) | F-Value | P-Value | F-Critical | |
| Factor | 10 | 7232.7 | 723.27 | 196.28 | 0.000 | 2.297 | |
| Error | 22 | 81.1 | 3.68 | ||||
| Total | 32 | 7313.8 |
Disclaimer/Publisher’s Note: The statements, opinions and data contained in all publications are solely those of the individual author(s) and contributor(s) and not of MDPI and/or the editor(s). MDPI and/or the editor(s) disclaim responsibility for any injury to people or property resulting from any ideas, methods, instructions or products referred to in the content. |
© 2024 by the authors. Licensee MDPI, Basel, Switzerland. This article is an open access article distributed under the terms and conditions of the Creative Commons Attribution (CC BY) license (http://creativecommons.org/licenses/by/4.0/).


