Submitted:
15 January 2024
Posted:
16 January 2024
You are already at the latest version
Abstract
Keywords:
1. Introduction
2. Results and discussion
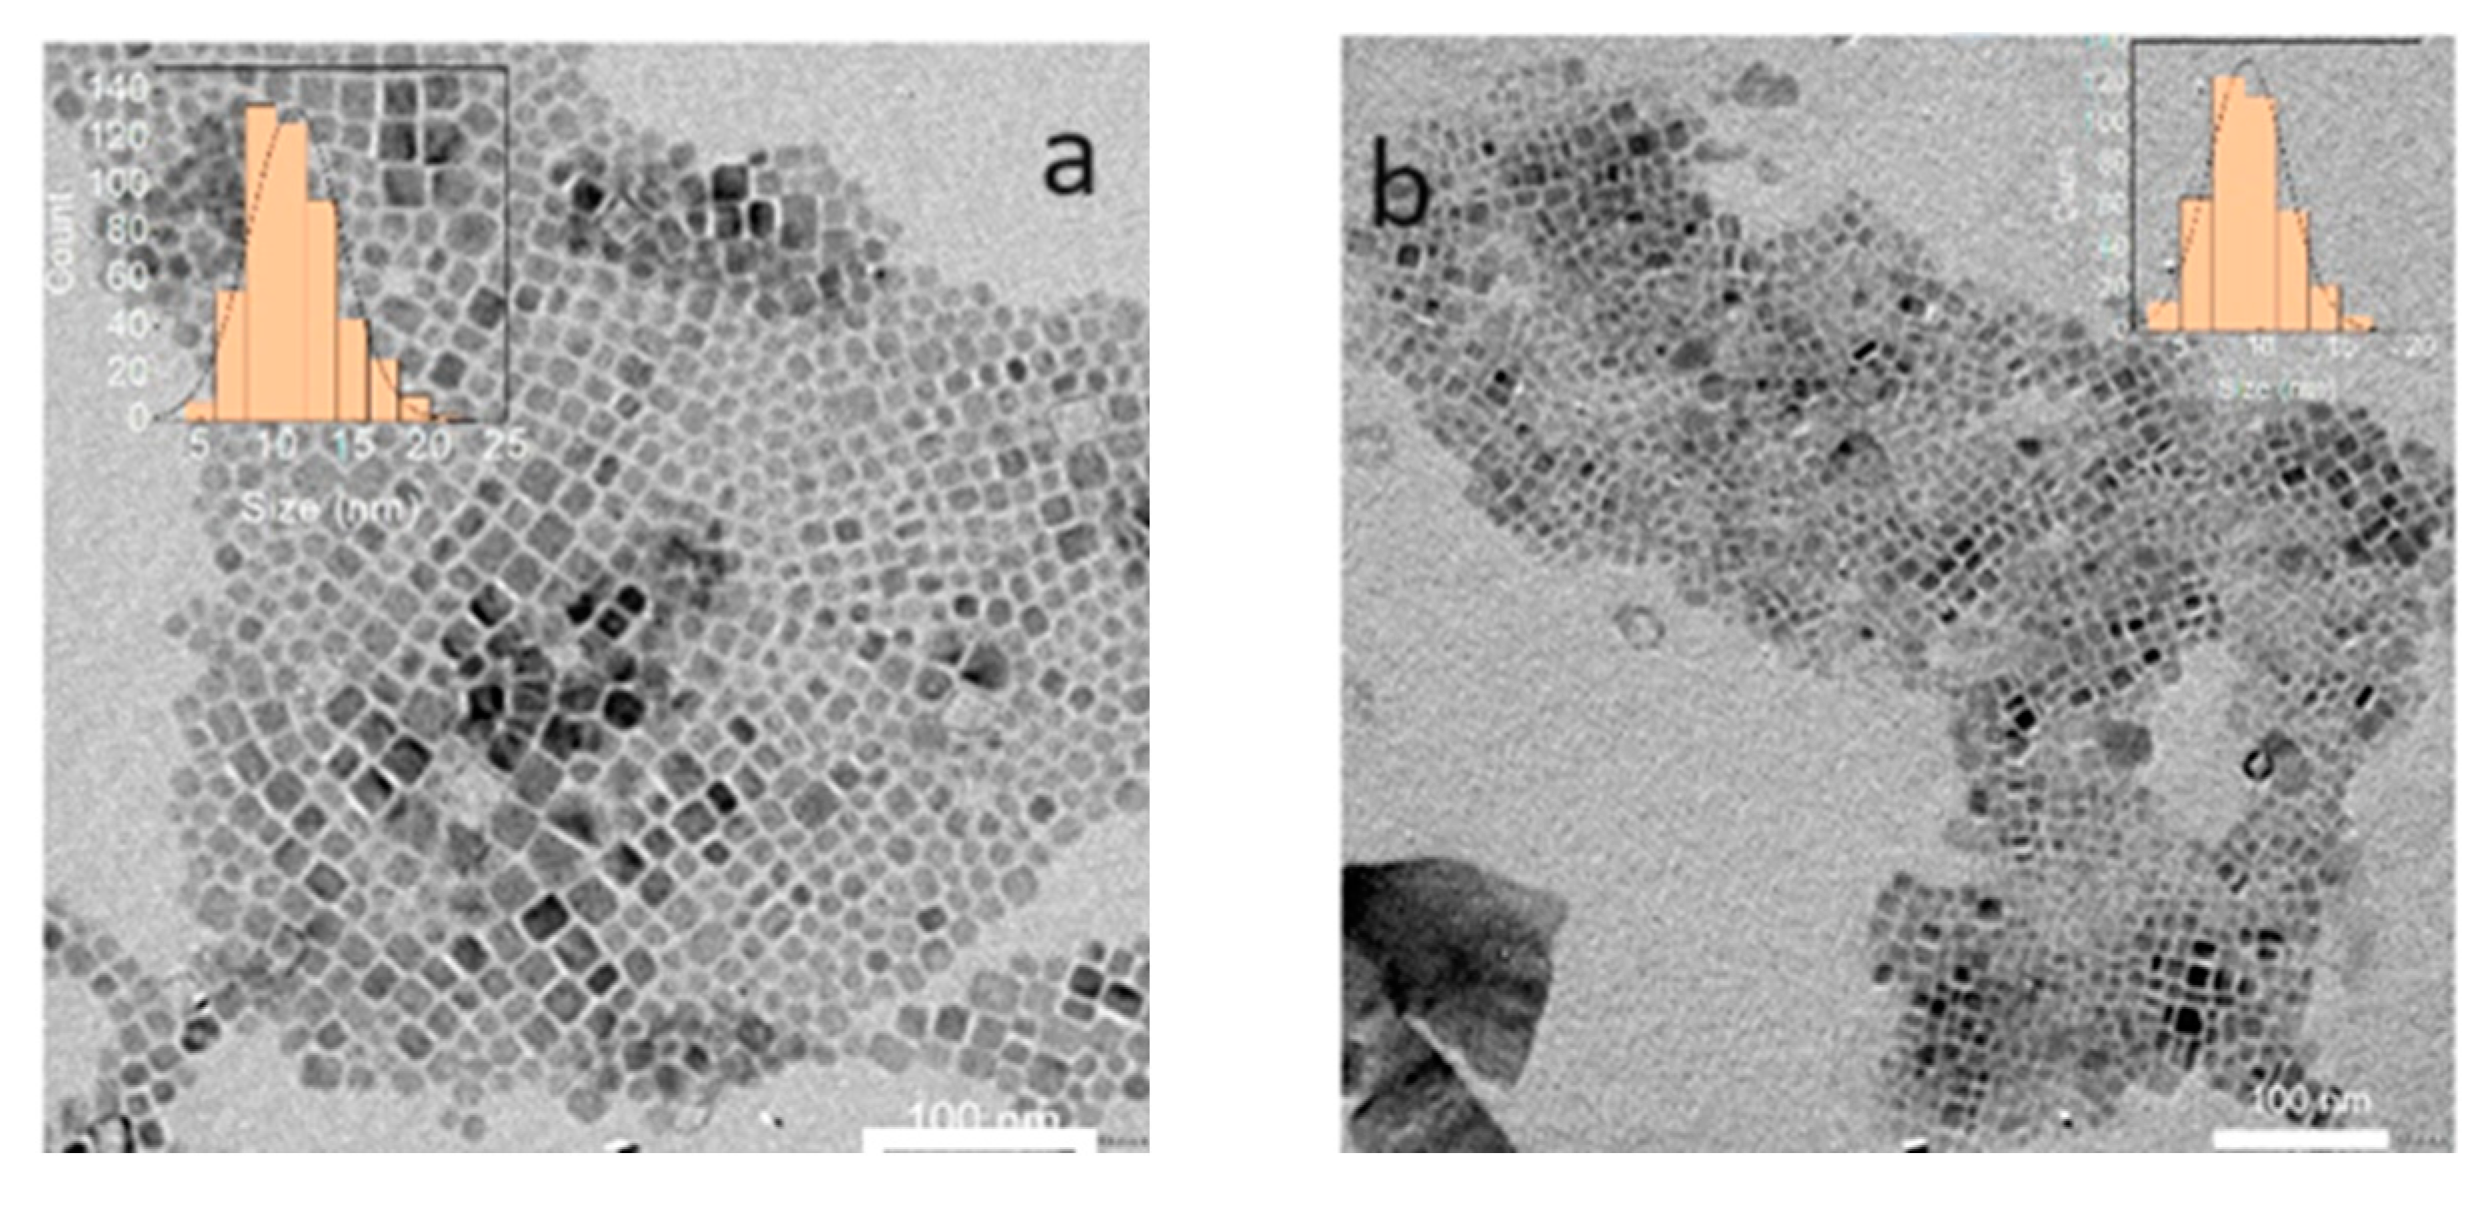
2.1. Synthesis of Cs2NaInCl6 QDs
2.2. Properties of Cs2NaInCl6 double perovskite QDs
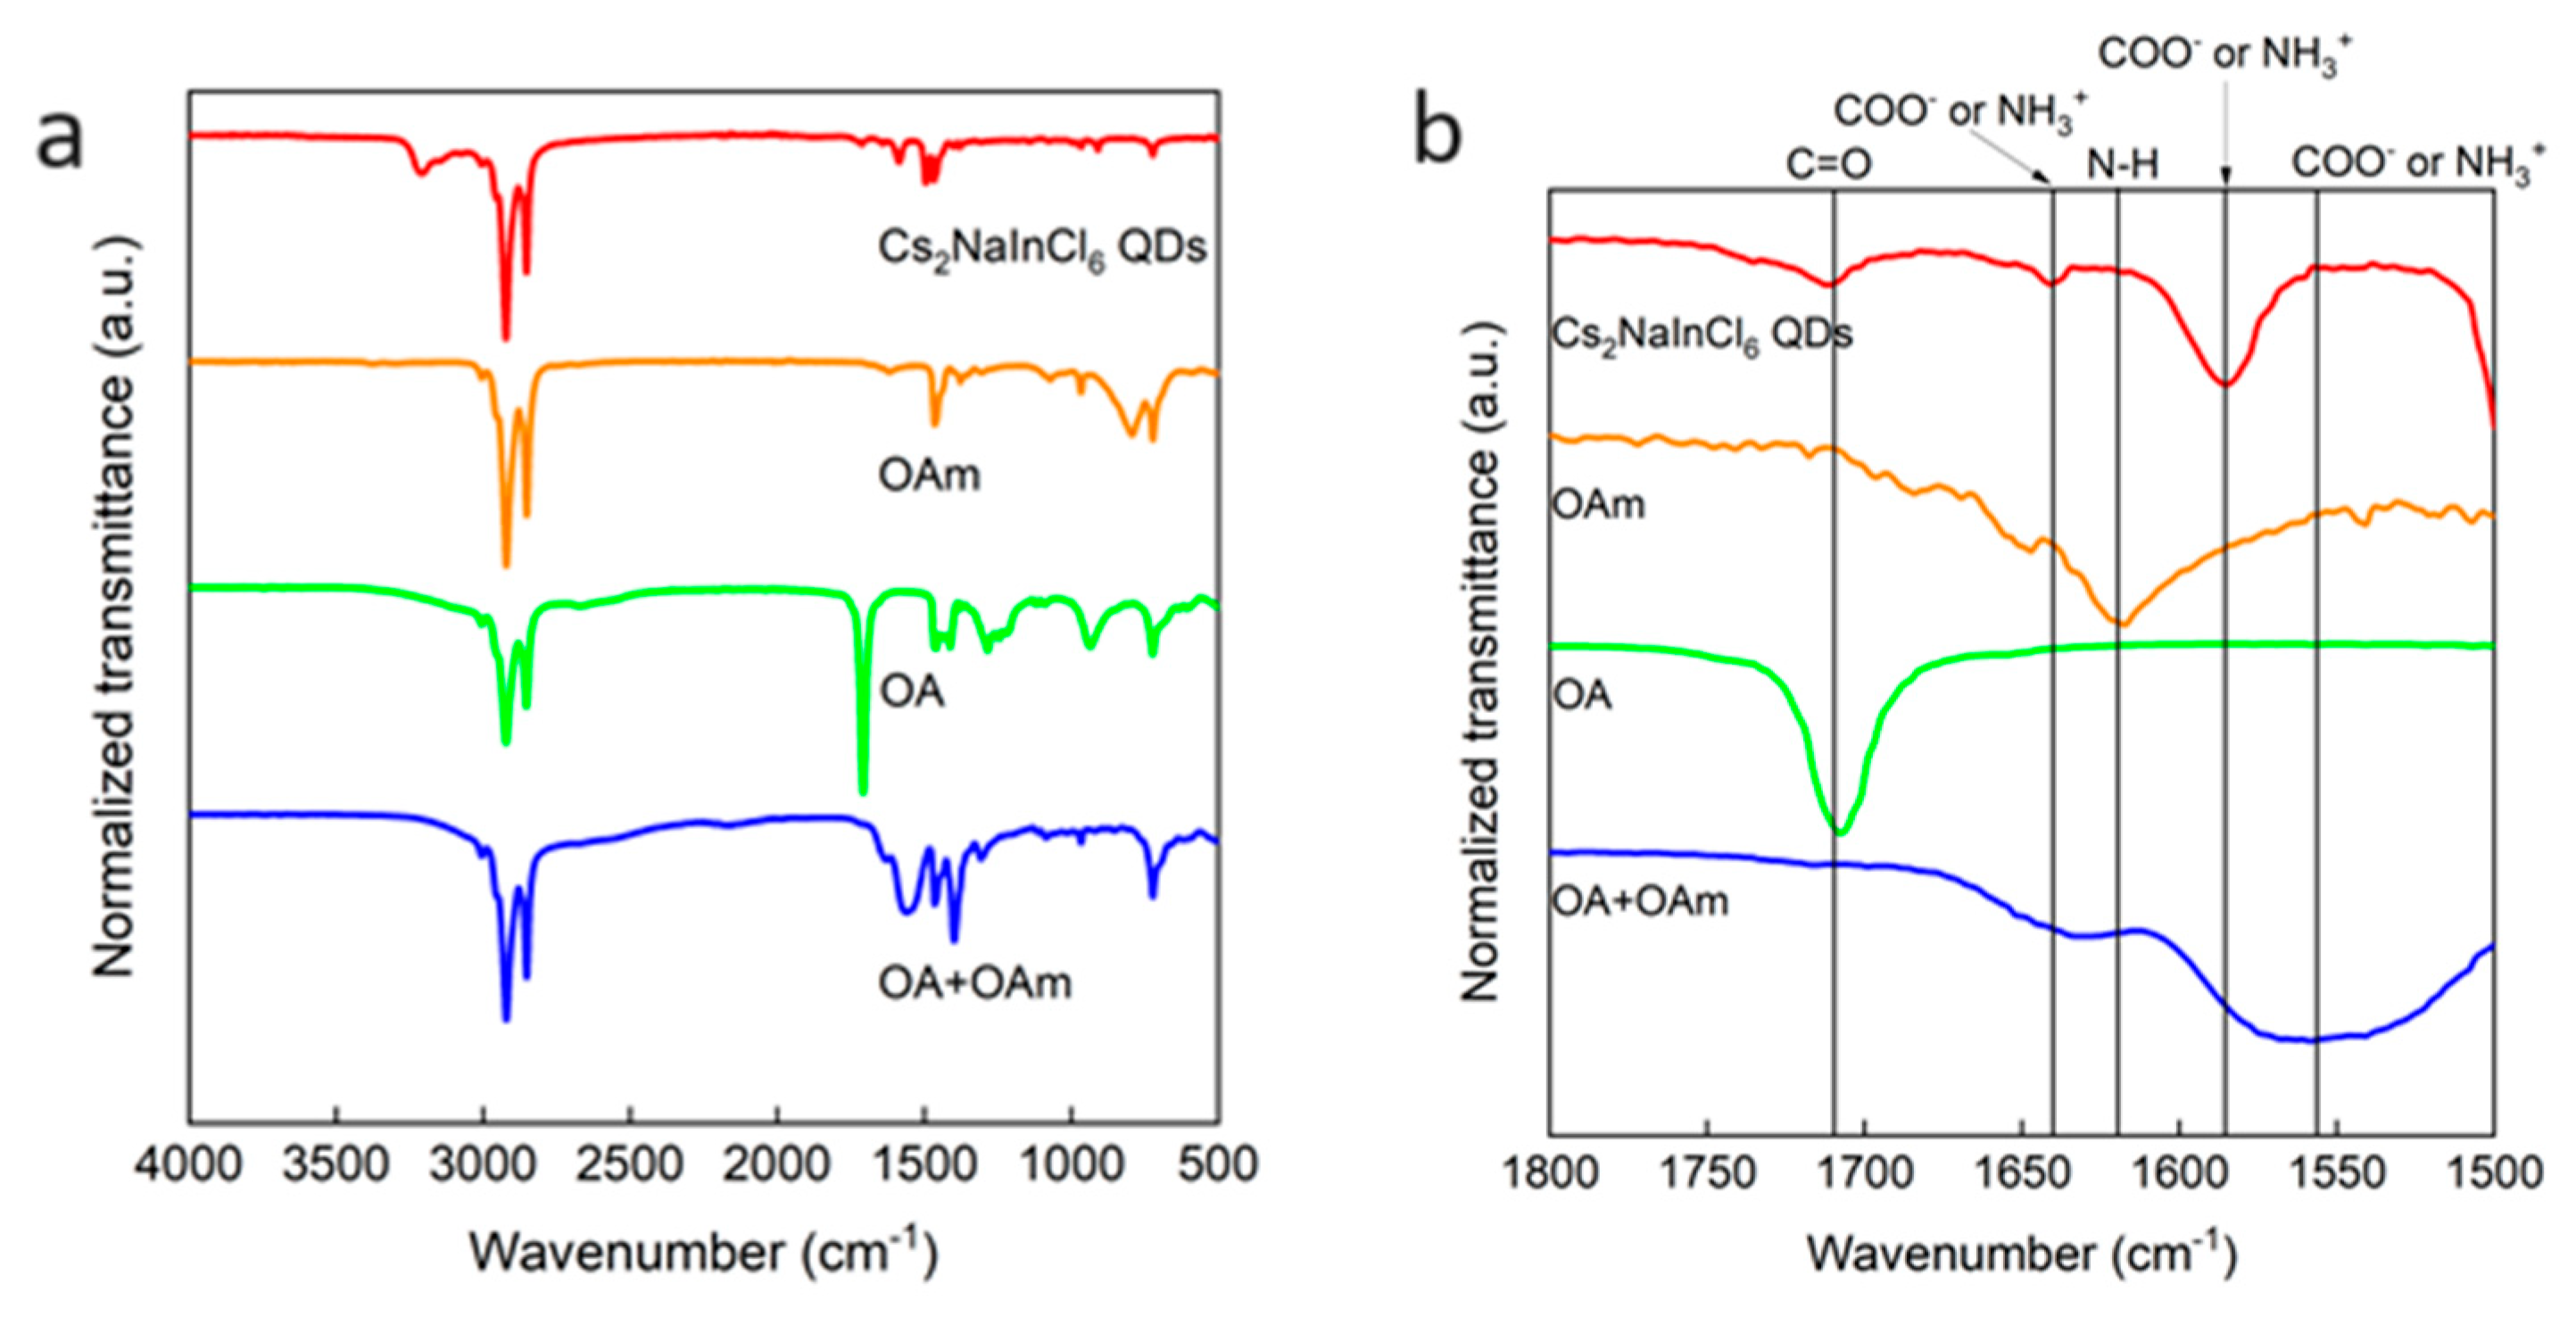
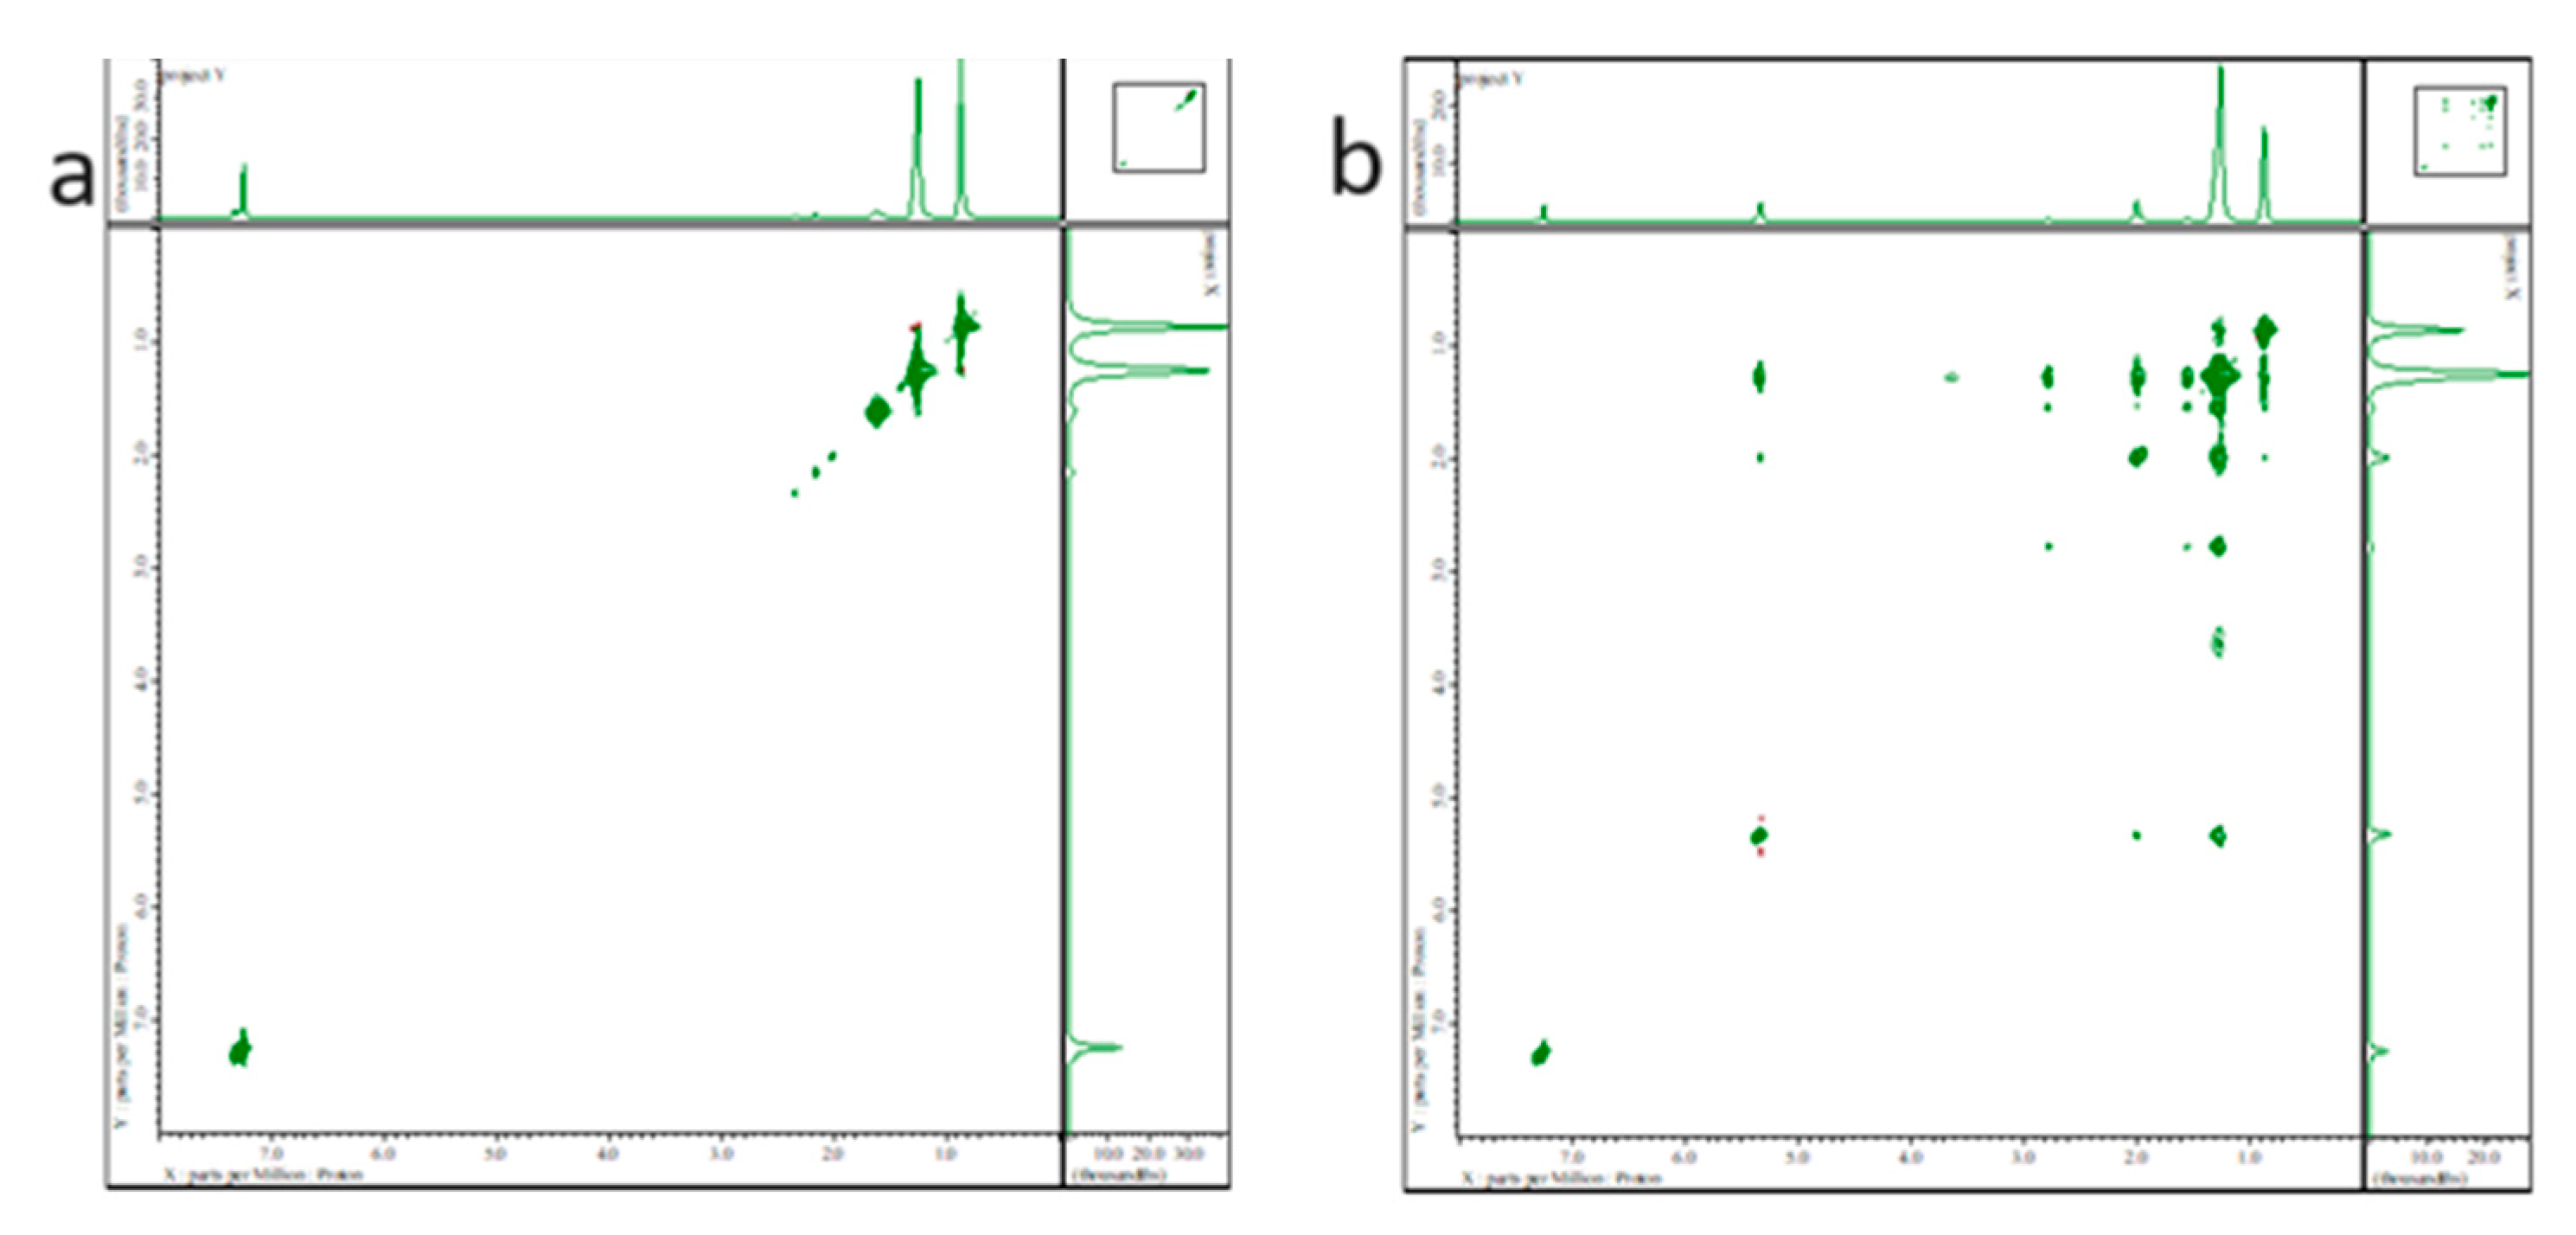
2.3. OA and OAm states in Cs2NaInCl6 double perovskite QDs
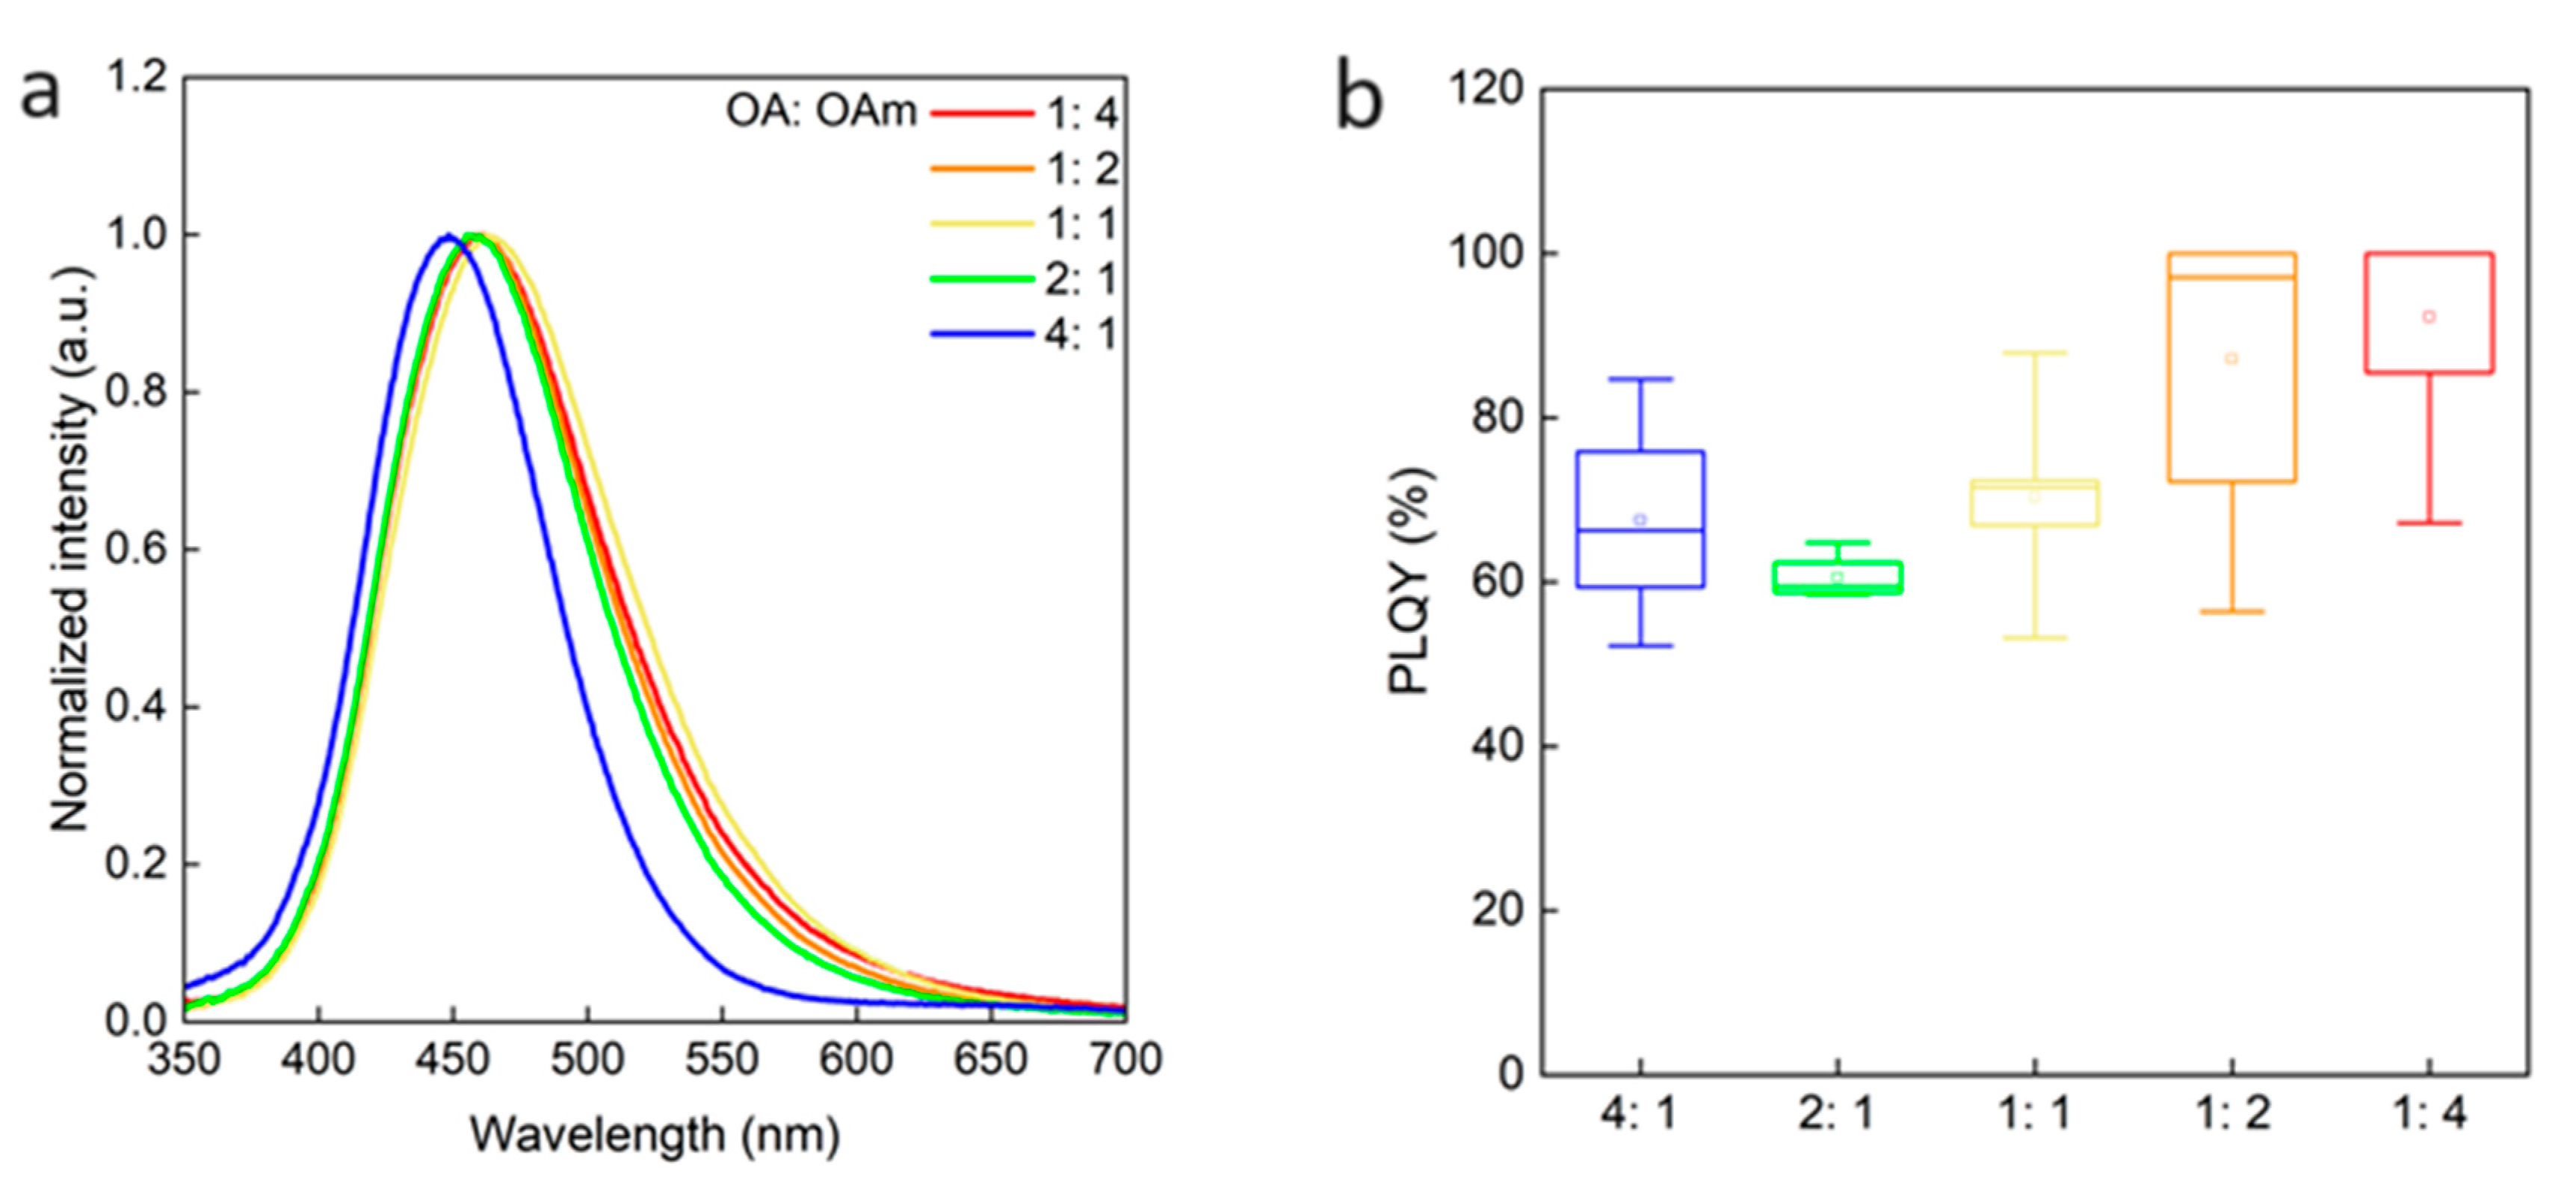
2.4. Roles of OA and OAm on Cs2NaInCl6 QDs
3. Conclusions
Funding
Data Availability Statement
Conflicts of Interest
References
- T. Chiba, Y. Hayashi, H. Ebe, K. Hoshi, J. Sato, S. Sato, Y. Jin Pu, S. Ohisa, and J. Kido, “Anion-exchange red perovskite quantum dots with ammonium iodine salts for highly efficient light-emitting devices”, Nature Photon, 12, 681 (2018). [CrossRef]
- A. Swaenker, A. Marashall, E. Sanehira, B. Chernomordik, D. Moore, J. Christinas, T. Chakrabarti, and J. Luther, “Quantum dot–induced phase stabilization of a-CsPbI3 perovskite for high-efficiency photovoltaics”, Science, 354, 92 (2016). [CrossRef]
- X. Li, F. Cao, D. Yu, J. Chen, Z. Sun, Y. Shen, Y. Zhu, L. Wang, Y. Wei, Y. Wu, H. Zeng, “All Inorganic Halide Perovskites Nanosystem: Synthesis, Structural Features, Optical Properties and Optoelectronic Applications”, 13, 1603996 (2017). [CrossRef]
- M. Green, A. Ho-Baillie, and H. Snaith, “The emergence of perovskite solar cells”, Nature Photon, 8, 506 (2014). [CrossRef]
- L. Protesescu, S. Yakunin, M. Bodnarchuk, F. Krieg, R. Caputo, C. Hendon, R. Yang, A. Walsh, and M. Kovalenko, “Nanocrystals of Cesium Lead Halide Perovskites (CsPbX3, X = Cl, Br, and I): Novel Optoelectronic Materials Showing Bright Emission with Wide Color Gamut”, Nano Lett., 15, 3692 (2015). [CrossRef]
- X. Du, G. Wu, J. Chenga, H. Danga, K. Maa, Y. Zhanga, P. Tana, and S. Chen, “High-quality CsPbBr3 perovskite nanocrystals for quantum dot light-emitting diodes”, RSC Adv., 7, 10391 (2017). [CrossRef]
- H. Utzat, W, Sun, A. Kaplan, F. Krieg, M. Ginterseder, B. Spokoyny, N. Klein, K. Shulenberger, C. Perkinson, M. Kovalenko, and M. Bawendi, “Coherent single-photon emission from colloidal lead halide perovskite quantum dots”, Science, 363, 1068 (2019). [CrossRef]
- H. Huang, M. Bodnarchuk, S. Kershaw, M. Kovalenko, and A. Rogach, “Lead Halide Perovskite Nanocrystals in the Research Spotlight: Stability and Defect Tolerance”, ACS Energy Lett., 2, 2071 (2017). [CrossRef]
- N. Noel, S. Stranks, A. Abate, C. Wehrenfennig, S. Guarnera, A. Haghighirad, A. Sadhanala, G. Eperon, S. Pathak, M. Johnston, A. Petrozza, L. Herza, and H. Snaith, “Lead-free organic–inorganic tin halide perovskites for photovoltaic applications”, Energy Environ. Sci., 7, 3061 (2014). [CrossRef]
- I. Kopacic, B. Friesenbichler, S. Hoefler, B. Kunert, H. Plank, T. Rath, and G. Trimmel, “Enhanced Performance of Germanium Halide Perovskite Solar Cells through Compositional Engineering”, ACS Appl. Energy Mater., 1, 343 (2018). [CrossRef]
- Y. Liu, A. Nag, L. Manna, and Z. Xia, “Lead-Free Double Perovskite Cs2AgInCl6”, Angew. Chem. Int. Ed., 60, 11592 (2021). [CrossRef]
- J. Zhou, X. Rong, P. Zhang, M. Molokeev, P. Wei, Q. Liu, X. Zhang, Z. Xia, “Manipulation of Bi3+/In3+ Transmutation and Mn2+-Doping Effect on the Structure and Optical Properties of Double Perovskite Cs2NaBi1-xInxCl6”, Adv. Opt. Mater., 7, 1801435 (2019). [CrossRef]
- X. Wang, T. Bai, B. Yang, R. Zhang, D. Zheng, J. Jiang, S. Tao, F. Liu, and K. Han, “Germanium Halides Serving as Ideal Precursors: Designing a More Effective and Less Toxic Route to High-Optoelectronic-Quality Metal Halide Perovskite Nanocrystals”, Nano Lett., 22, 636 (2022). [CrossRef]
- R. Zeng, L. Zhang, Y. Xue, B. Ke, Z. Zhao, D. Huang, Q. Wei, W. Zhou, and B. Zou, “Highly Efficient Blue Emission from Self-Trapped Excitons in Stable Sb3+-Doped Cs2NaInCl6 Double Perovskites”, J. Phys. Chem. Lett., 11, 2053 (2020). [CrossRef]
- B. Zhou, Z. Liu, S. Fang, H. Zhong, B. Tian, Y. Wang, H. Li, H. Hu, and Y. Shi, “Efficient White Photoluminescence from Self-Trapped Excitons in Sb3+/Bi3+-Codoped Cs2NaInCl6 Double Perovskites with Tunable Dual-Emission”, ACS Energy Lett., 6, 3343 (2021). [CrossRef]
- X. Liu, X. Xu, B. Li, L. Yang, Q. Li, H. Jiang, and D. Xu, “Tunable Dual-Emission in Monodispersed Sb3+/Mn2+ Codoped Cs2NaInCl6 Perovskite Nanocrystals through an Energy Transfer Process”, Small, 16, 2002547 (2020). [CrossRef]
- R. Ahmad, L. Zdražil, S. Kalytchuk, A. Naldoni, A. Rogach, P. Schmuki, R. Zboril, and Š. Kment, “Uncovering the Role of Trioctylphosphine on Colloidal and Emission Stability of Sb-Alloyed Cs2NaInCl6 Double Perovskite Nanocrystals”, ACS Appl. Mater. Interfaces, 13, 47845 (2021). [CrossRef]
- F. Remacle, and R. Levine, “Quantum Dots as Chemical Building Blocks: Elementary Theoretical Considerations”, Chemphyschem, 2, 20 (2001). [CrossRef]
- Y. Chen, S. Smock, A. Flintgruber, F. Perras, R. Brutchey, and A. Rossini, “Surface Termination of CsPbBr3 Perovskite Quantum Dots Determined by Solid-State NMR Spectroscopy”, J. Am. Chem. Soc., 142, 6117 (2020). [CrossRef]
- M. Boles, D. Ling, T. Hyeon, and D. Talapin, “The surface science of nanocrystals”, Nature Mater, 15, 141 (2016). [CrossRef]
- Roo, M. Ibáñez, P. Geiregat, G. Nedelcu, W. Walravens, J. Maes, J. Martins, I. Driessche, M. Kovalenko, and Z. Hens, “Highly Dynamic Ligand Binding and Light Absorption Coefficient of Cesium Lead Bromide Perovskite Nanocrystals”, ACS Nano, 10, 2071 (2016). [CrossRef]
- Z. Hens, and J. Martins, “A Solution NMR Toolbox for Characterizing the Surface Chemistry of Colloidal Nanocrystals”, Chem. Mater., 25, 1211 (2013). [CrossRef]
- V. Ravi, P. Santra, N. Joshi, J. Chugh, S. Singh, H. Rensmo, P. Ghosh, and A. Nag, “Origin of the Substitution Mechanism for the Binding of Organic Ligands on the Surface of CsPbBr3 Perovskite Nanocubes”, J. Phys. Chem. Lett., 8, 4988 (2017). [CrossRef]
- A. Owen, “Uses of Derivative Spectroscopy”, Agilent Technologies (1995).
- G. Fulmer, A. Miller, N. Sherden, H. Gottlieb, A. Nudelman, B. Stoltz, J. Bercaw, and K. Goldberg, “NMR Chemical Shifts of Trace Impurities: Common Laboratory Solvents, Organics, and Gases in Deuterated Solvents Relevant to the Organometallic Chemist”, Organometallics, 29, 2179 (2010). [CrossRef]
- J. Roo, Y. Justo, K. Keukeleere, F. Broeck, J. Martins, I. Driessche, and Z. Hens, “Carboxylic-Acid-Passivated Metal Oxide Nanocrystals: Ligand Exchange Characteristics of a New Binding Motif”, Angew. Chem. Int. Ed., 54, 6488 (2015). [CrossRef]
- J. Sachleben, E. Wooten, L. Emsley, A. Pines, V. Colvin, and P. Alivisatos, “NMR studies of the surface structure and dynamics of semiconductor nanocrystals”, Chem. Phys. Lett., 198, 431 (1992). [CrossRef]
- Hostetler, J. Wingate, C. Zhong, J. Harris, R. Vachet, M. Clark, J. Londono, S. Green, J. Stokes, G. Wignall, G. Glish, M. Porter, N. Evans, and R. Murray, “Alkanethiolate Gold Cluster Molecules with Core Diameters from 1.5 to 5.2 nm: Core and Monolayer Properties as a Function of Core Size”, Langmuir, 14, 17 (1998). [CrossRef]
- B. Fritzinger, I. Moreels, P. Lommens, R. Koole, Z. Hens, and J. Martins, “In Situ Observation of Rapid Ligand Exchange in Colloidal Nanocrystal Suspensions Using Transfer NOE Nuclear Magnetic Resonance Spectroscopy”, J. Am. Chem. Soc., 131, 3024 (2009). [CrossRef]
- Y. Zhang, T. Shah, F. Deepak, and B. Korgel, “Surface Science and Colloidal Stability of Double-Perovskite Cs2AgBiBr6 Nanocrystals and Their Superlattices”, Chem. Mater., 31, 7962 (2019). [CrossRef]



Disclaimer/Publisher’s Note: The statements, opinions and data contained in all publications are solely those of the individual author(s) and contributor(s) and not of MDPI and/or the editor(s). MDPI and/or the editor(s) disclaim responsibility for any injury to people or property resulting from any ideas, methods, instructions or products referred to in the content. |
© 2024 by the authors. Licensee MDPI, Basel, Switzerland. This article is an open access article distributed under the terms and conditions of the Creative Commons Attribution (CC BY) license (http://creativecommons.org/licenses/by/4.0/).


