Preprint
Article

The Energy Saving Potential in an Office Building Using Louvers in Mid-Latitude Climate Condition

Altmetrics

Downloads

126

Views

37

Comments

0

A peer-reviewed article of this preprint also exists.

Submitted:

15 January 2024

Posted:

16 January 2024

You are already at the latest version

Alerts
Abstract
Daylighting has been widely adopted in recent years due to its potential to improve the indoor environment in terms of visual comfort and energy-saving. One of the energy-saving techniques for energy-efficient buildings is the integration of louver systems. Louvers are considered more efficient for providing daylight in the interior as compared to other daylighting systems. Here, this paper presents the design of a louver system for conducting energy simulations for lighting and cooling requirements in office spaces. The simulation results indicate that the use of louvers in different opening configurations can lead to energy savings, particularly in the lighting aspect. The louver system in office spaces with a 50% louver opening leads to 27.0% energy savings. Further, the results are presented for different louver openings to calculate the lighting and cooling energy savings. The overall performance of the system is better in terms of providing consistent daylight, which eventually improves energy saving.
Keywords: 
Subject: Engineering  -   Energy and Fuel Technology

1. Introduction

According to the International Energy Agency (IEA) 2022 report, developing economies have increased CO2 emissions in buildings using fossil fuel gasses, leading to a rise of approximately 4% in buildings' energy demand, Identifying the largest surge that has taken place in the last 10 years [1]. Consequently, it has been recorded that buildings are generating an all-time high of approximately 10 GtCO2 emissions, which is approximately 5% higher than in 2020 [1]. In 2021, buildings accounted for around 37% of global CO2 emissions, as stated in [1]. A building is classified as energy-efficient when its construction and energy-consuming systems, such as heating, cooling, lighting, and ventilation, are designed to achieve a high level of efficiency. Performance of a building envelope is considered as a crucial factor for an energy-efficient building. As building design evolves, the façade and shading systems are now recognized as major features that serve important functions in passive design strategies and contribute significantly to improving energy efficiency and occupant comfort. The use of highly glassed facades and large windows in modern buildings is becoming increasingly popular, as it allows for abundant natural light, maximizes solar energy utilization, and provides exterior view. For natural light illumination, various techniques have been used including louvers, light shelves, lighting redirecting, and daylighting systems [2,3,4,5,6].
Daylighting provides natural light in the interior spaces to save electric lighting energy consumption. Various studies have been conducted to design sunlight-redirecting systems for indoor illumination [7]. According to a study, daylighting redirecting system can save up to 50-80% electric light energy in buildings. Likewise, researchers have developed efficient light sources that consumes less power compared to conventional light sources [7]. A daylighting system redirects sunlight to indoor spaces using reflectors, lenses, light pipe, and optical fiber. Likewise, other techniques are also used for daylighting and shading such as louvers, awnings, blinds, and light shelves [2,3,4,5,6]. Windows have been considered the most effective component in buildings to provide daylight in the interior space because of its high performance. Therefore, it is preferred to install the light redirecting system on windows by considering the elevation angles of the sun.
Louvers can reduce the need for artificial lighting by allowing natural light to enter the building. They are used to control the amount of light which is needed to be delivered indoor of a building. Various designs of louvers have been developed to control the amount of daylight. To provide daylight in the interior space through louvers, three types of designs are used: Fixed, adjustable, and operable louvers. Fixed ones provide a consistent level of light and ventilation, while adjustable louvers allow for greater control over light levels and ventilation by varying the tilt angle of the slats. Operable louvers are motorized to provide even greater flexibility in controlling light levels [8]. In the literature, various types of louvers have been designed, including vertical, horizontal, and eggcrate louvers, and their performances have also been measured [9]. Louvers are selected based on the direction of a building and applied in different environments. Vertical ones are installed in the east–west direction of the building while horizontal ones are generally installed in the south-facing direction [10].
To design a louver, building orientation, location, and the light level are considered as important parameters [11]. The orientation of the building determines the angle of incident light, which affects the amount of direct sunlight entering the space. For high illuminance areas, louvers need to be installed with more adjustable options to control the amount of light entering the space. For buildings in urban areas, louvers are designed more efficiently to redirect maximum light inside buildings. For such cases, the design of louver should be optimized based on the building's orientation to achieve the desired amount of daylight. The design of a louver includes: shape of the slats, the size of the slat, spacing between the slats. Designing the slat angle of a louver is essential to effectively redirect low-angle winter daylight and high-angle summer daylight into the deeper parts of the interior space.
Additionally, louvers can also play a critical role for energy saving by reducing the need for artificial lighting and providing ventilation systems. According to the US Department of Energy (DOE), louvers can help to reduce energy costs by improving ventilation and air circulation in buildings. Louvers can control the airflow through horizontal or vertical slats while blocking out unwanted elements such as rain and wind. They are commonly used in commercial, industrial, and residential buildings for ventilation and climate control.
Louvers are made from different materials (e.g., wood, aluminum, or glass). Material selection is another crucial factor in louver design for daylighting [12]. The material should allow for maximum light transmission while minimizing heat gain. Glass and acrylic are common materials used in louvers for daylighting, with clear or translucent options to control light transmission levels. If the illuminance level in an interior space is below the required standard value, it is recommended to incorporate additional lighting fixtures, such as light shelves and skylights. In the contemporary context, to augment the light reflection capability of louver slats, advanced coating technologies have been harnessed, yielding an impressive light reflection efficiency of up to 92% on aluminum surfaces [13]. This innovative integration of coatings marks a substantial advancement in refining the light manipulation attributes of louver systems, promising substantial enhancements in energy efficiency and precise illumination management across diverse environments.
A study is presented to optimize daylight and energy consumption using an optimization technique for louvers shading devices [14]. The design parameters of the building, including overhang, blade size, spacing, and rotation, were meticulously optimized to maximize useful daylight illuminance and shading aperture. Louvers can optimize daylight performance by providing daylight in the interior and saving energy utilization. In [15], researchers unveiled an automated prismatic louver system comprising reflective and prismatic louvers that worked together to achieve the dual objectives of shading and redirecting daylight. The results indicated that the automated louver performed better than that of traditional louvers. For producing electric energy and saving electric lighting energy consumption, photovoltaic (PV) based louver system was proposed in [16]. The PV-based louver was able to produce 22.46 kWh energy while delivering an illuminance of 2000 lx.
Louvers are considered crucial for sustainable building design to save energy, enhance the visual comfort, minimizing glare and heat gain. To assess the impact of louvers on energy consumption in buildings and indoor thermal environment, there are typically two categories of evaluation methods: i) transmitting and absorption of solar radiation (ii) heat exchange between the building envelope and its surroundings. In [17], researchers conducted a study to explore the heat exchange that occurs between the blinds and the facade located behind them. The study found that the temperature of the air, blinds, and facade varied in response to changes in the weather. A case study was conducted to experiment the performance of shuttle louvers [18], and a model was presented to calculate the heat transfer through building envelopes. Further, exterior louvers have also been used to stop the solar radiation for transmitting inside the interior space through windows [19].
In [20], a simulation study was conducted to assess the impact of louver shading devices on achieving comfortable indoor thermal conditions and reducing energy consumption. A movable louver with sun-tracking was designed to reduce energy consumption and improve the indoor illumination uniformity [21]. Four different types of louvers were compared: horizontal, vertical, eggcrate, and hybrid. It was concluded that the movable louver with sun-tracking can reduce lighting, heating, and colling energy up to 49.7%. Likewise, to reduce energy consumption, four different control strategies were applied on curved fixed louvers for four cities with different climate conditions [22].
A summary of different louver systems is shown in Table 1. Most of the louvers were used for visual comfort by providing daylighting in the interior space. Horizontal louvers are most widely used to redirect daylight towards the ceiling of the interior space.
The proposed study investigates both the lighting and thermal energy-saving through simulations and experimental data. A test room was designed for the simulation and experiments located at Seoul, South Korea under mid-latitude climate condition.

2.2. Methodology

In this study, we conducted an assessment of the effectiveness of using louvers with energy-saving capabilities through simulation methods. The following were simulated:
  • Lighting conditions within a room using louvers and the amount of energy saved using the louver system, using DIALux software.
  • Calculation of the energy required for heating and cooling in an office with and without the use of louvers, using Rhino software. The results were then analyzed to determine the energy-saving potential of the louver system. The research was carried out using a virtual model and a parametric approach on a simulation platform. The research workflow is depicted in Figure 1.
The results were used to compare and validate the accuracy of the simulation method. Based on this, we made recommendations for the use of louvers to save energy and increase energy efficiency in office buildings. The findings of our study demonstrate the potential benefits of incorporating louvers into building designs as a means of reducing energy consumption and improving indoor environmental quality.

2.1. Model specifications

2.1.1. Test room specifications

In this study, simulations were conducted on a model office with dimensions of l x w x h, 6.0 m x 4.0 x 2.5 m, respectively, and a window size of 3.0 m x 2.0 m on the south-facing wall. Some specifications provide a framework for the simulations conducted in this study, which focused on evaluating the effectiveness of louvers with energy-saving capabilities. As shown in Table 2, the thermal transmission parameters and lighting parameters of the test room are mentioned.

2.1.2. Louver

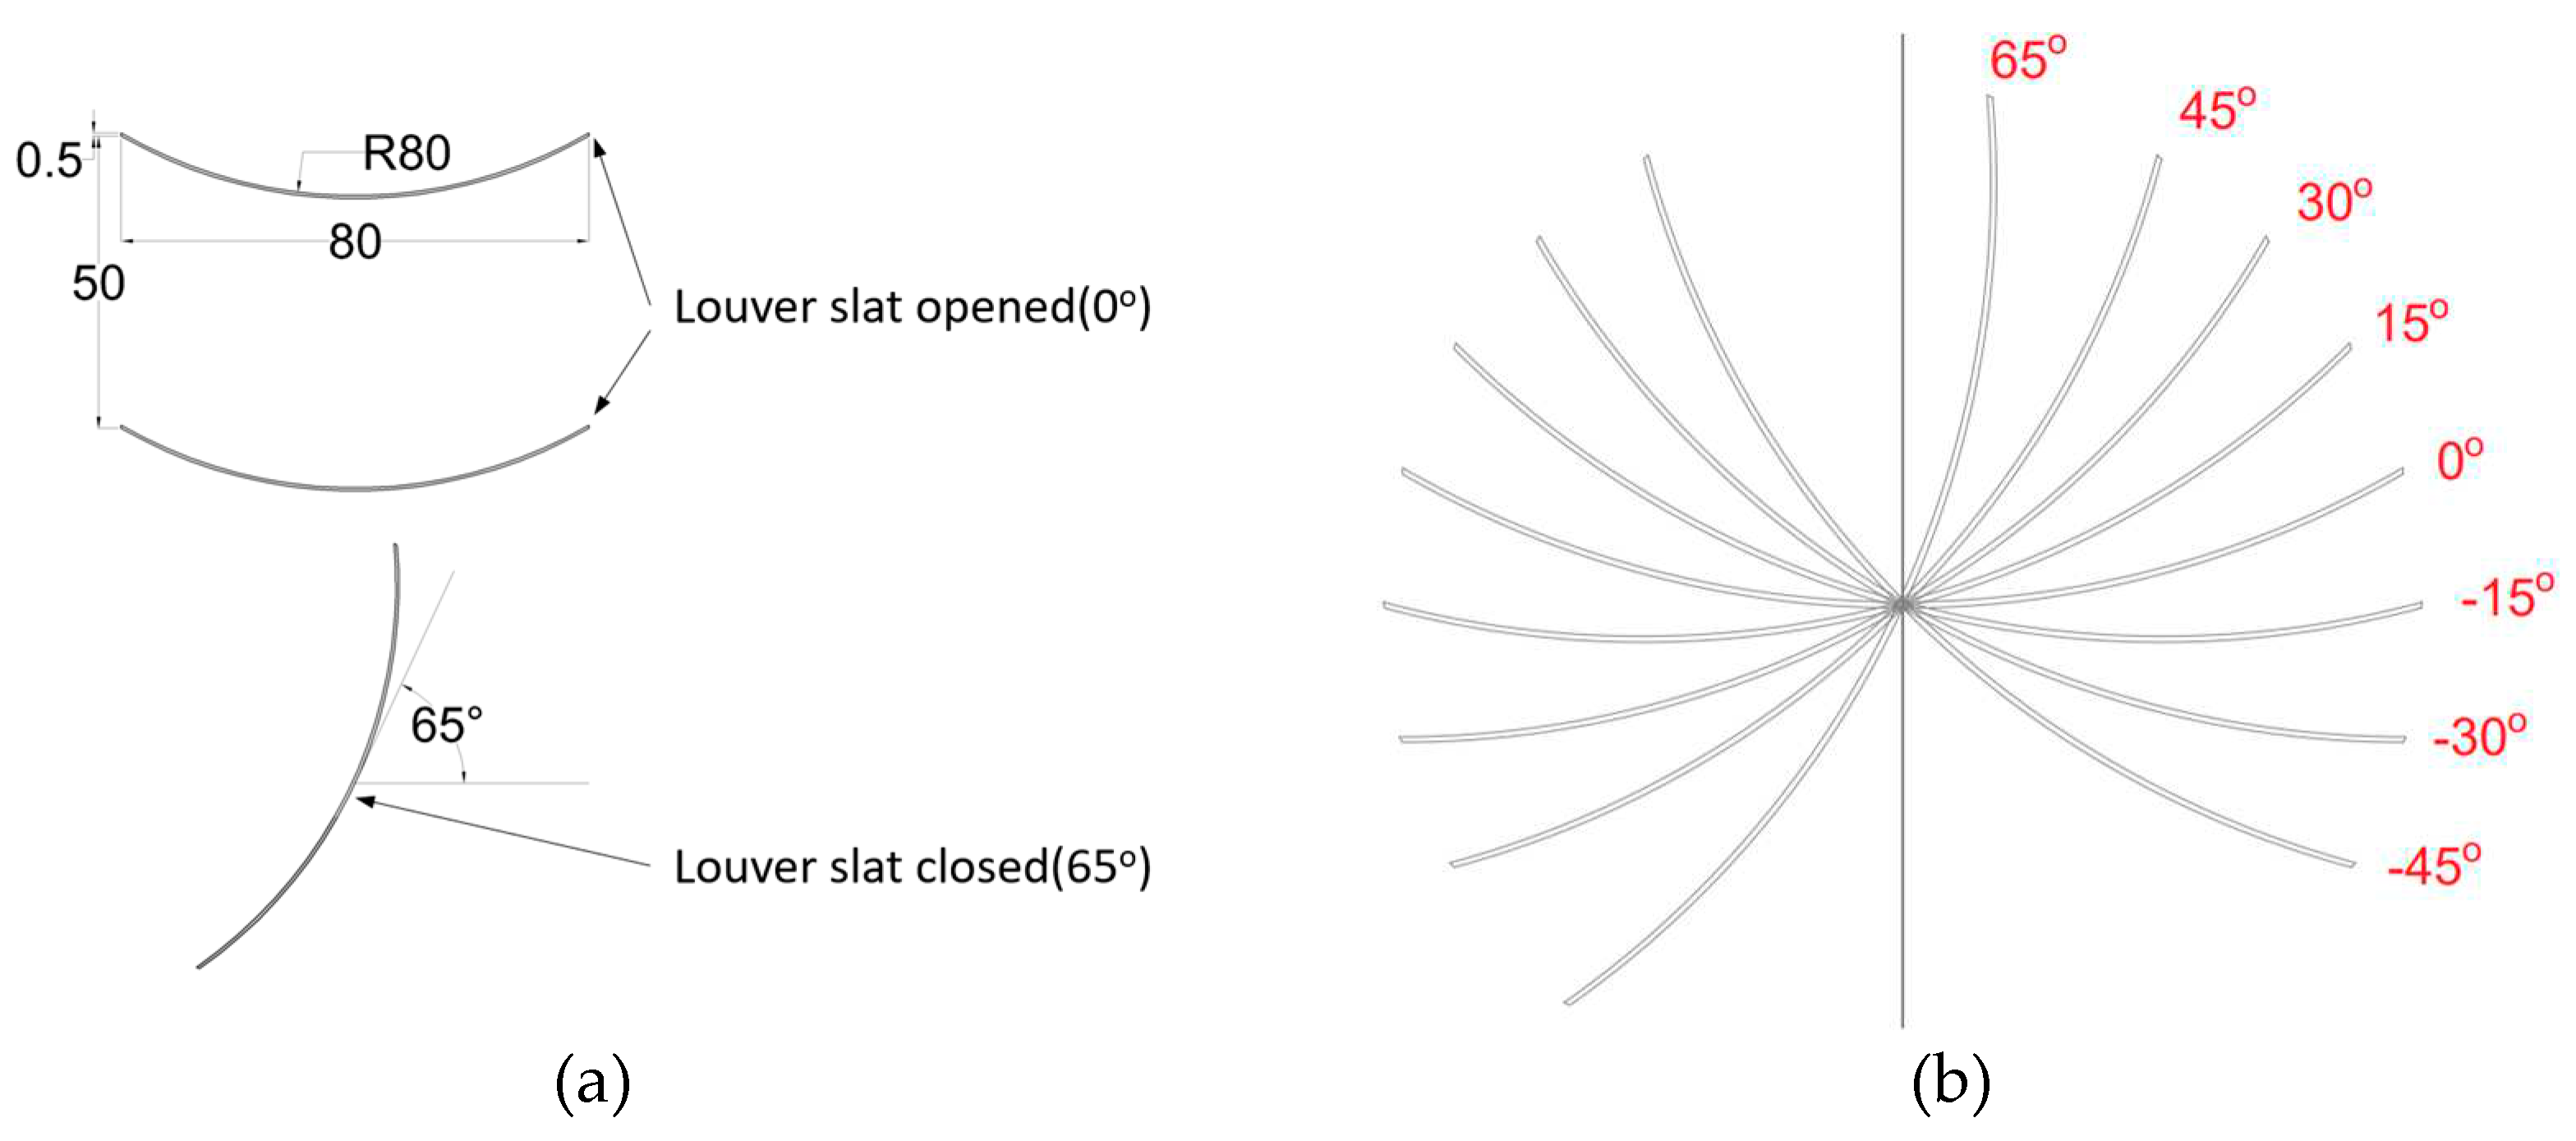
In this study, curved louvers were used with a radius of curvature of 8.0 cm, a length of 3.0 m, a width and thickness of 0.5 mm, and made of aluminum with a reflective coating of 90% reflectance, which was used in the simulations. The louver slats were placed 5.5 cm apart from each other. A total of 36 louver slats were applied to the window in the model. The curved louvers were able to reflect most of the direct sunlight onto the ceiling, thereby reducing the phenomenon of direct sunlight shining on the floor or occupants in the room. The specifications of the louvers are provided in Figure 2.
For calculating the amount of light and energy, four different conditions were considered in the model: the louvers are fully open at 100%, 60%, 50%, and 30%. In the condition where the louvers were fully open at 100%, all 36 louver slats were positioned at a 0-degree angle. In the condition where the louvers were fully open at 60%, 21 louver slats (60%) were positioned at 0 degrees, while the remaining 14 slats (40%) were positioned at a 65-degree angle. Similarly, in the condition where the louvers were fully open at 50%, 18 slats (50%) were positioned at 0 degrees, and the other 18 slats (50%) were positioned at a 65-degree angle. In the condition where the louvers were fully open at 30%, only 11 slats (30%) were positioned at 0 degrees, while the remaining 25 slats (70%) were positioned at a 65-degree angle.
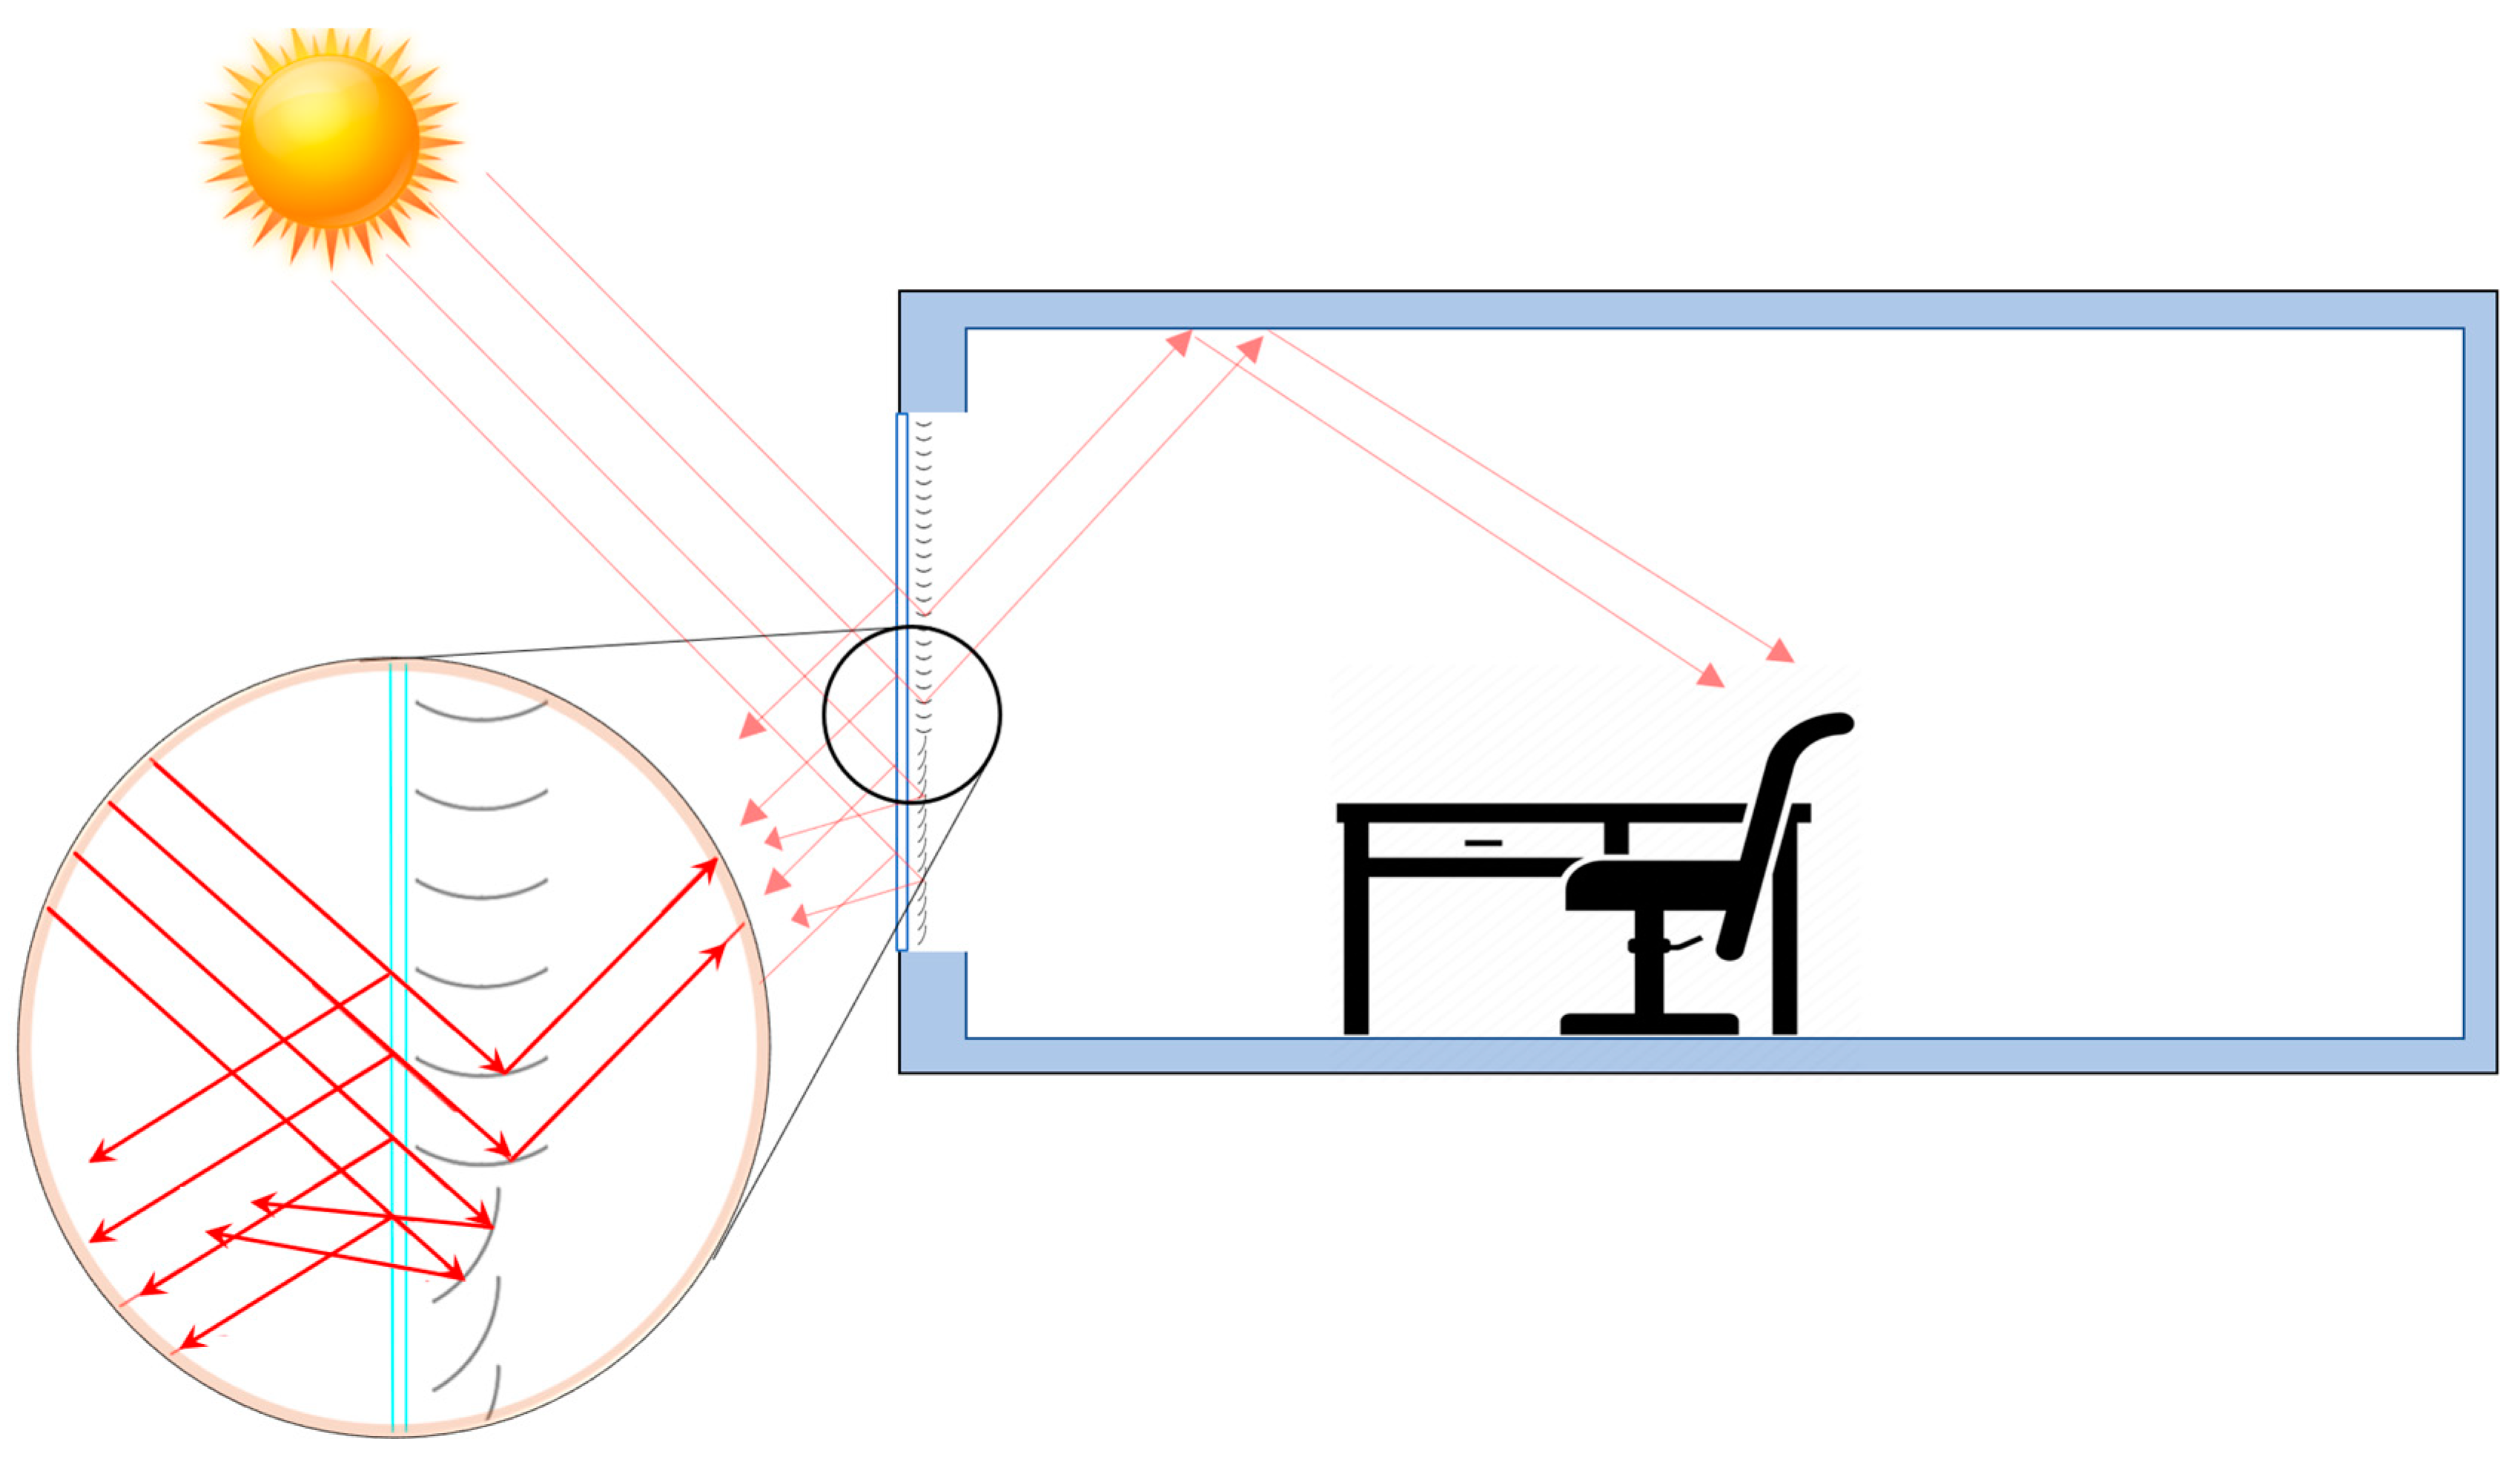
The louver slats placed at 0-degrees angle can bring light into the room increasing natural light in the room and reducing energy consumption for lighting. The louver slats placed at a 65-degree angle could reflect light, reduce discomfort from sunlight in the room, and reduce the issue of increased room temperature due to sunlight radiation. The principle of this approach is described in Figure 3.

2.3. Measurement and Comparison Analysis

Owing to inherent limitations, this study regrettably faced constraints that precluded the execution of experimental tests for all simulated scenarios. To address this, we constructed a dedicated testing chamber to meticulously examine both light intensity and distribution within the physical space, allowing for a nuanced comparison with the simulated light distribution outcomes. The dimensions, orientation, and types of louvers in the testing chamber were meticulously calibrated to mirror those integrated into the simulation model. The tangible manifestation of this real-world testing setup in South Korea is visually presented in Figure 4.
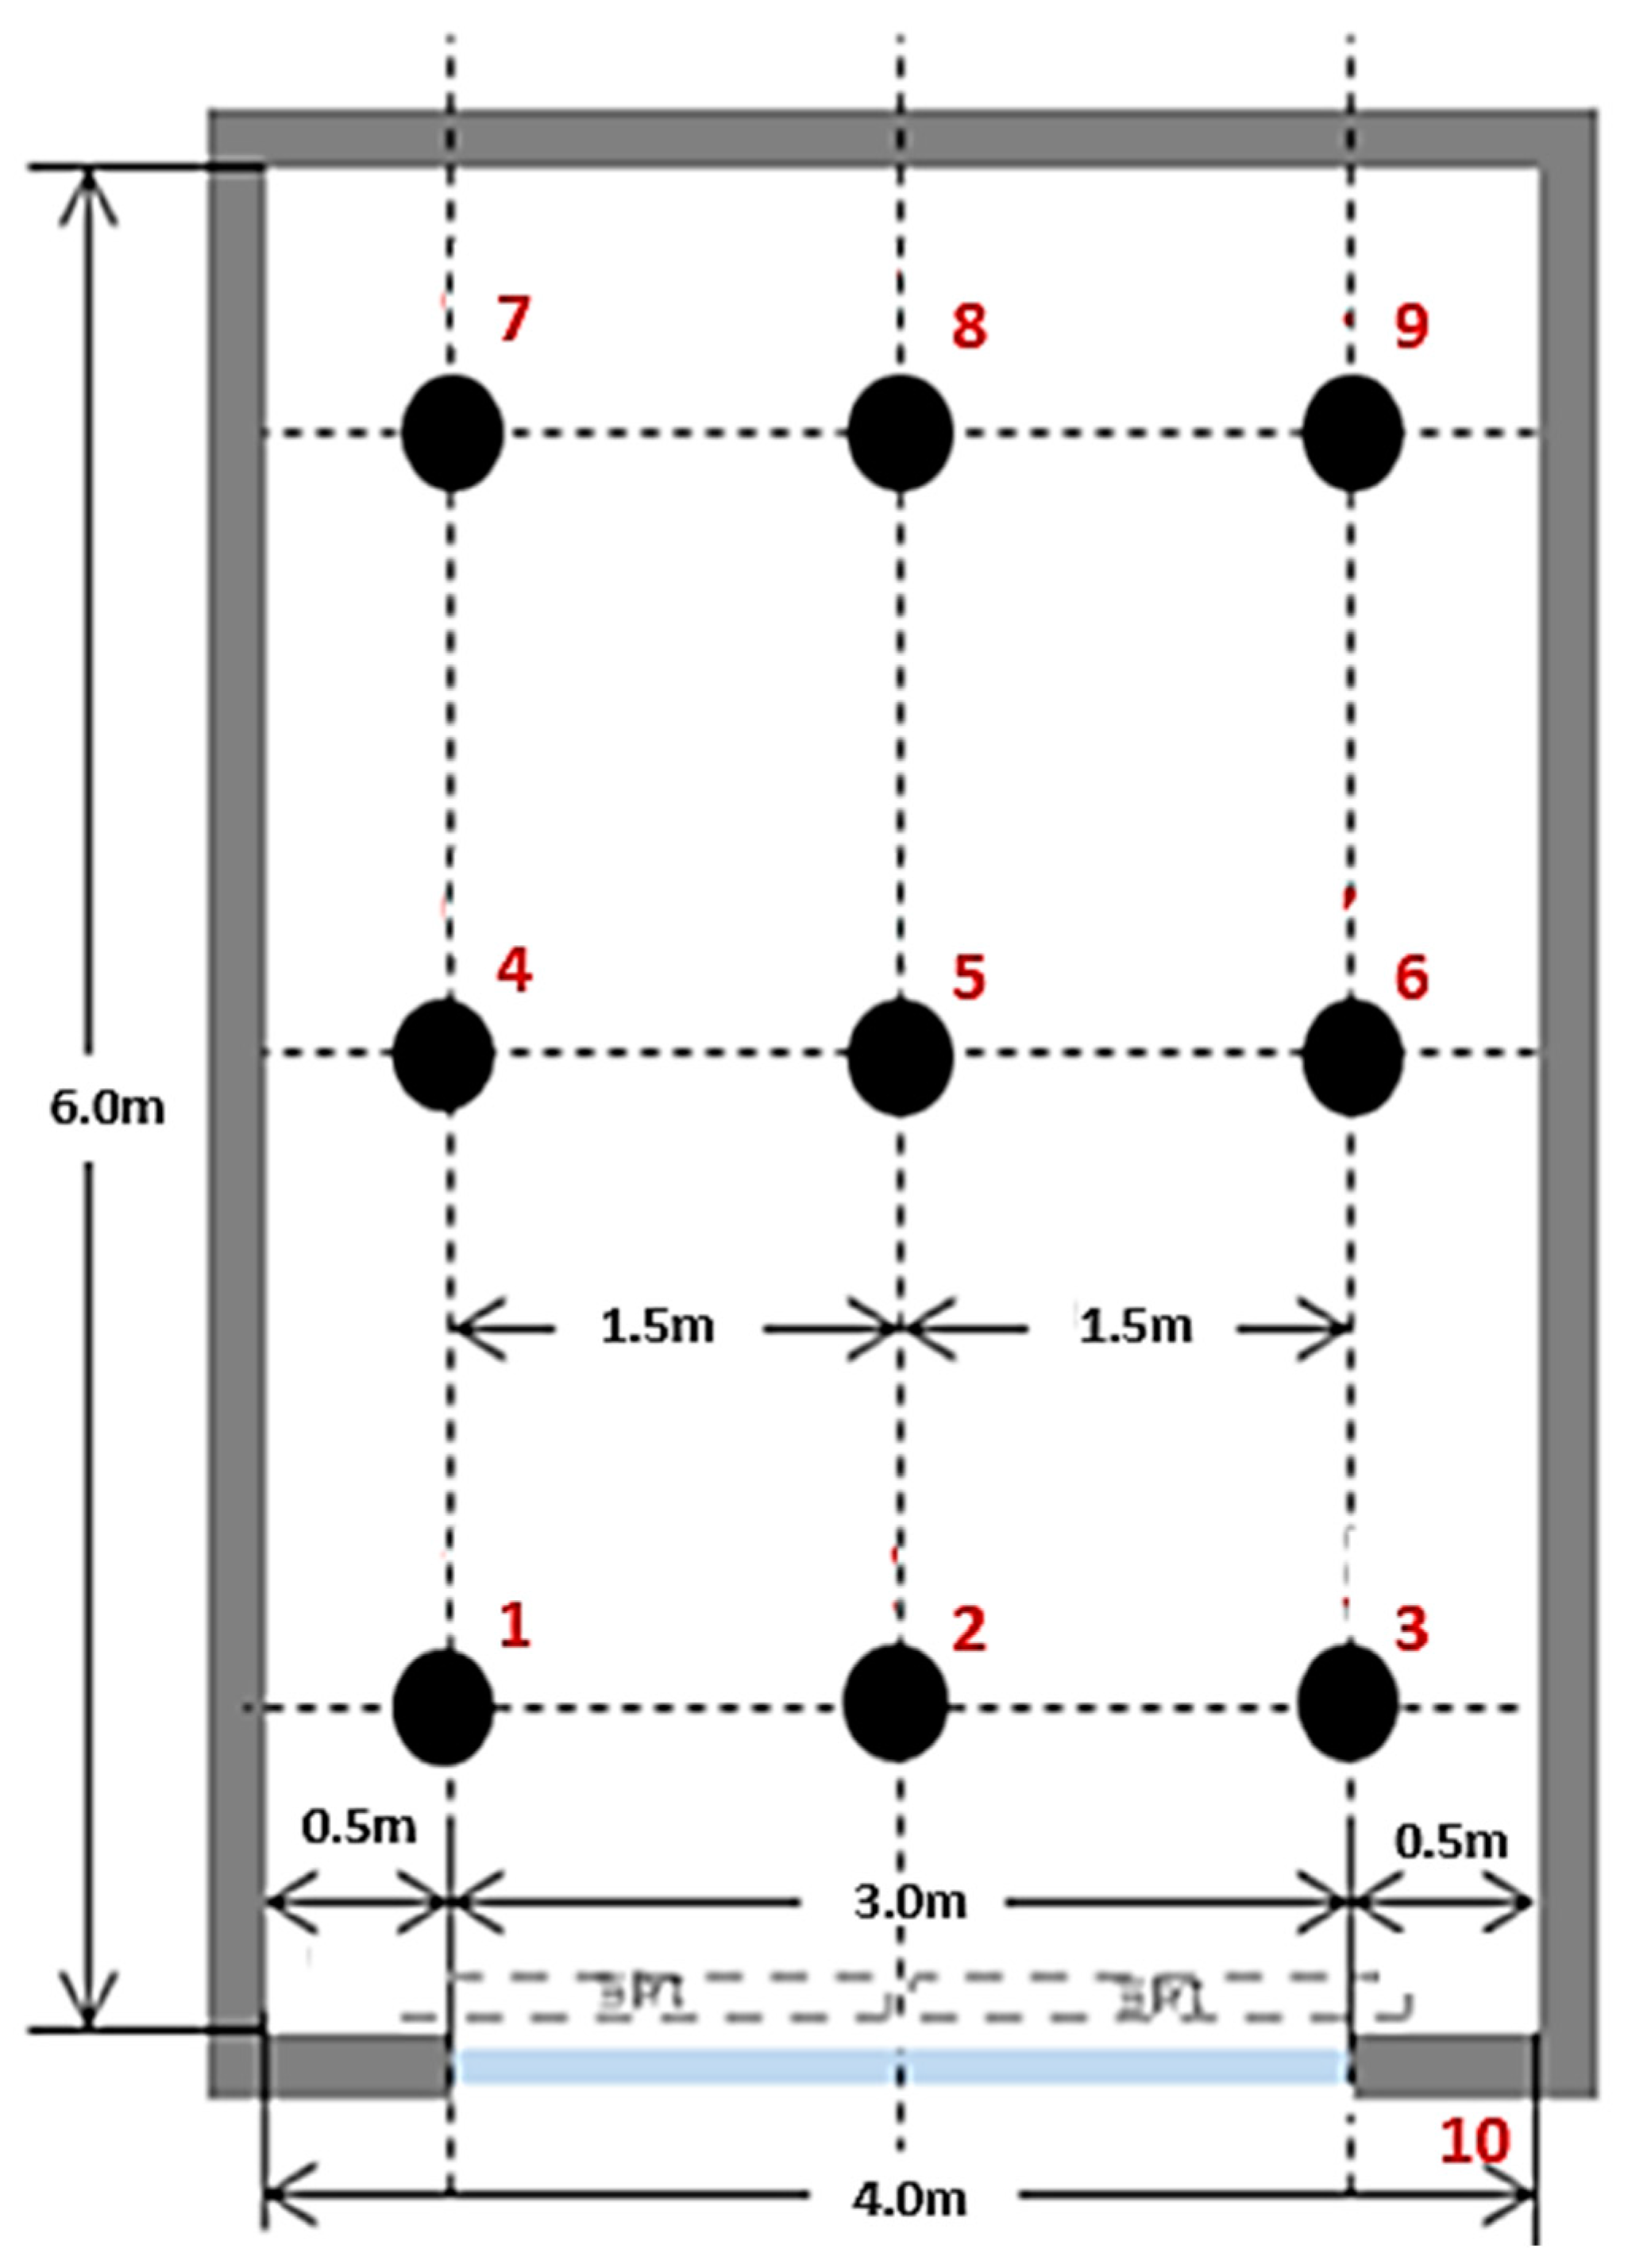
Within this testing environment, we strategically positioned 09 sensors to comprehensively capture and evaluate the light distribution dynamics within the confined space. Additionally, an additional sensor (01) was strategically placed to measure the intensity of external light. The precise locations of these sensors are meticulously illustrated in Figure 5, providing a detailed insight into our methodological approach.

3. Simulation and results

3.1. Calculation and simulation of room lighting
The DIALux software is a powerful and widely used tool for lighting design in architecture and engineering [23]. This software allows users to simulate and analyze various lighting scenarios for indoor and outdoor environments, such as offices, schools, stadiums, and streets. With a user-friendly interface and extensive database of luminaires and lighting controls, the DIALux software provides a flexible and efficient solution for lighting design projects of different scales and complexities. The software can generate detailed reports on lighting calculations, energy consumption, and light distribution, which can assist designers and engineers in making informed decisions on lighting design and optimization. Furthermore, the DIALux software has been continuously updated and improved with new features and functionalities, including the integration of sustainable lighting design concepts and the support for advanced visualization, and rendering techniques. As such, the DIALux software represents a valuable tool for researchers and practitioners in the field of lighting design and engineering [24].
We utilized the software DIALux to calculate the required energy for illuminating an office, as well as the illuminance and light distribution within the test room. The illuminance within the room was measured at a height of 0.8 m above the floor. The average illuminance, E a v , within a space is calculated using the formula:
E a v = Φ S
where Φ is the total luminous flux measured in lumens and S is the area of the room.
The uniformity of lighting in the room was calculated using the formula:
U = E m i n E a v
where E m i n is the minimum illuminance on the measurement plane (lux), and E a v is the average measured illuminance (lux).
These are the fundamental parameters for assessing whether an office meets the standards for its intended use. The parameters and standards conform to EN 12464-1:2021. EN 12464-1:2021 is a standard of the European Union (EU) and serves as a guiding tool for ensuring the level of lighting quality in working environments. This standard applies to lighting design in industrial, commercial, and residential constructions, including offices, schools, hospitals, and residential areas. The standard for reading and writing offices was used in this simulation. Analysis time is from 9:00 to 18:00 according to working hours in Korea.
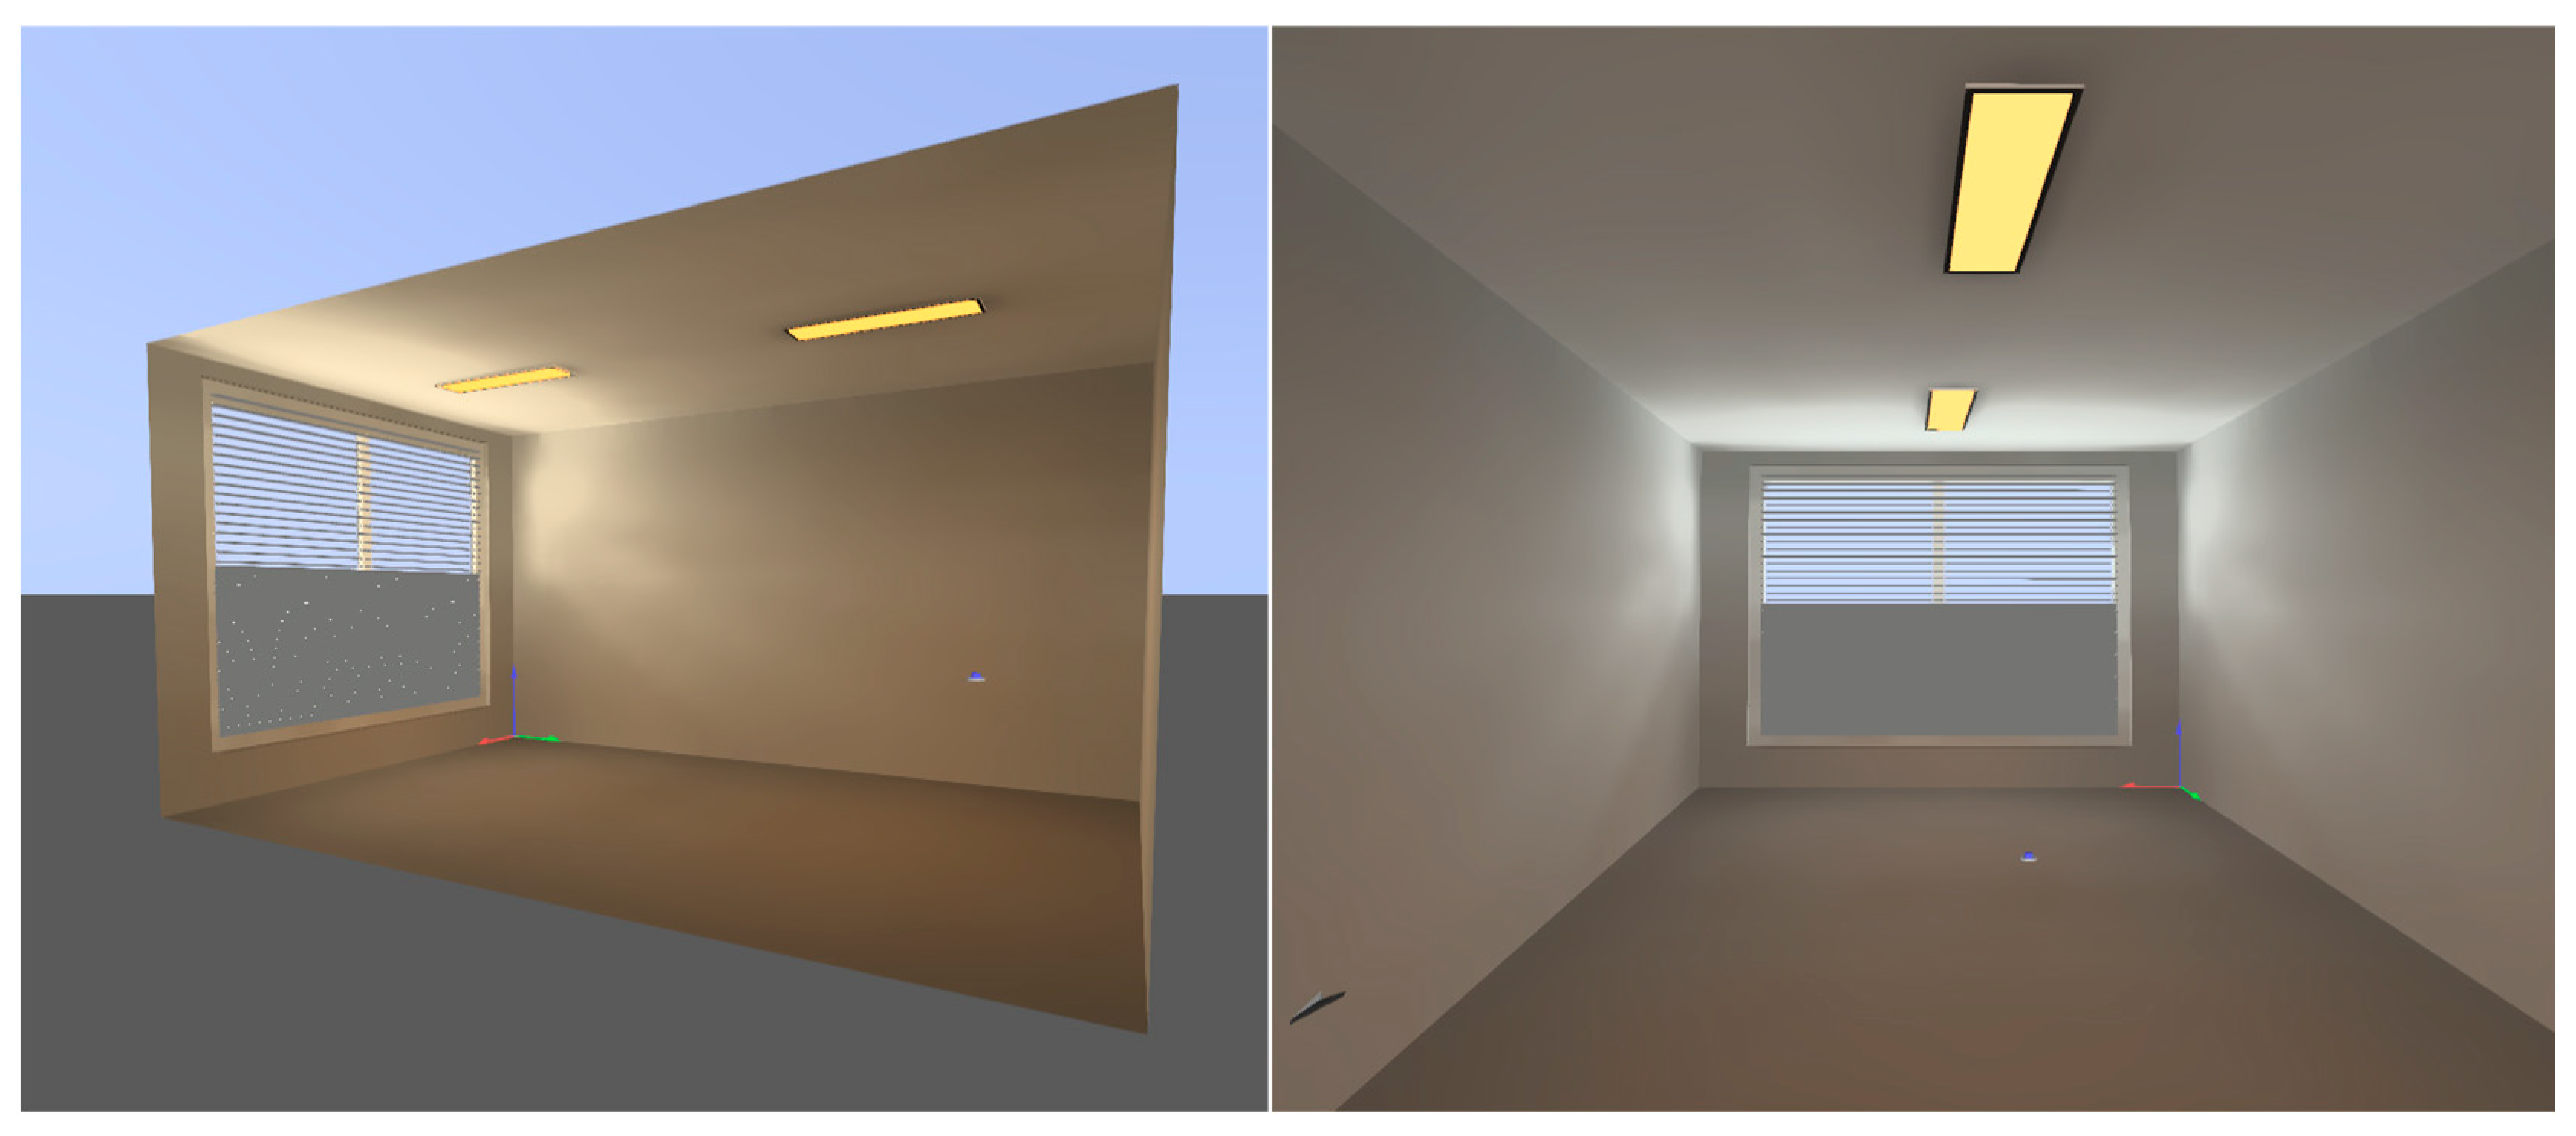
The calculation of energy consumption is based on the EN 15193 standard for energy efficiency in residential lighting systems. The geographical location and model are used to calculate the energy consumption when using daylight and not using daylight. For more convenience and specificity in calculating the energy consumption for lighting, we assigned two 30 Watt LED-panels with a luminous flux of 3600 lumens each to the model. The sensor is located 5 m away from the south-facing wall and between the two walls facing east and west. Figure 4 describes the test room model used in the simulation.
Figure 6. The test room model is used for simulation in the DIALux software.
Preprints 96367 g006
The lighting standard for an average office necessitates an illuminance level between 300 and 500 lux. In this simulation, we adopted a target illuminance of 500 lux, in accordance with the EN 12464-1:2021 standard on lighting requirements.

3.2. Thermal Energy Calculation and Simulation Using Rhino Software
Rhino and Grasshopper are powerful software tools widely used in architecture, engineering, and construction fields. They are particularly useful for designing and simulating building systems and analyzing their energy performance. Rhino is a 3D modeling software that allows users to create detailed building models, while Grasshopper is a visual programming language that enables users to automate complex tasks and create parametric models [13]. Together, they provide a powerful and flexible platform for energy calculations, enabling users to evaluate different design options and optimize building performance [25].
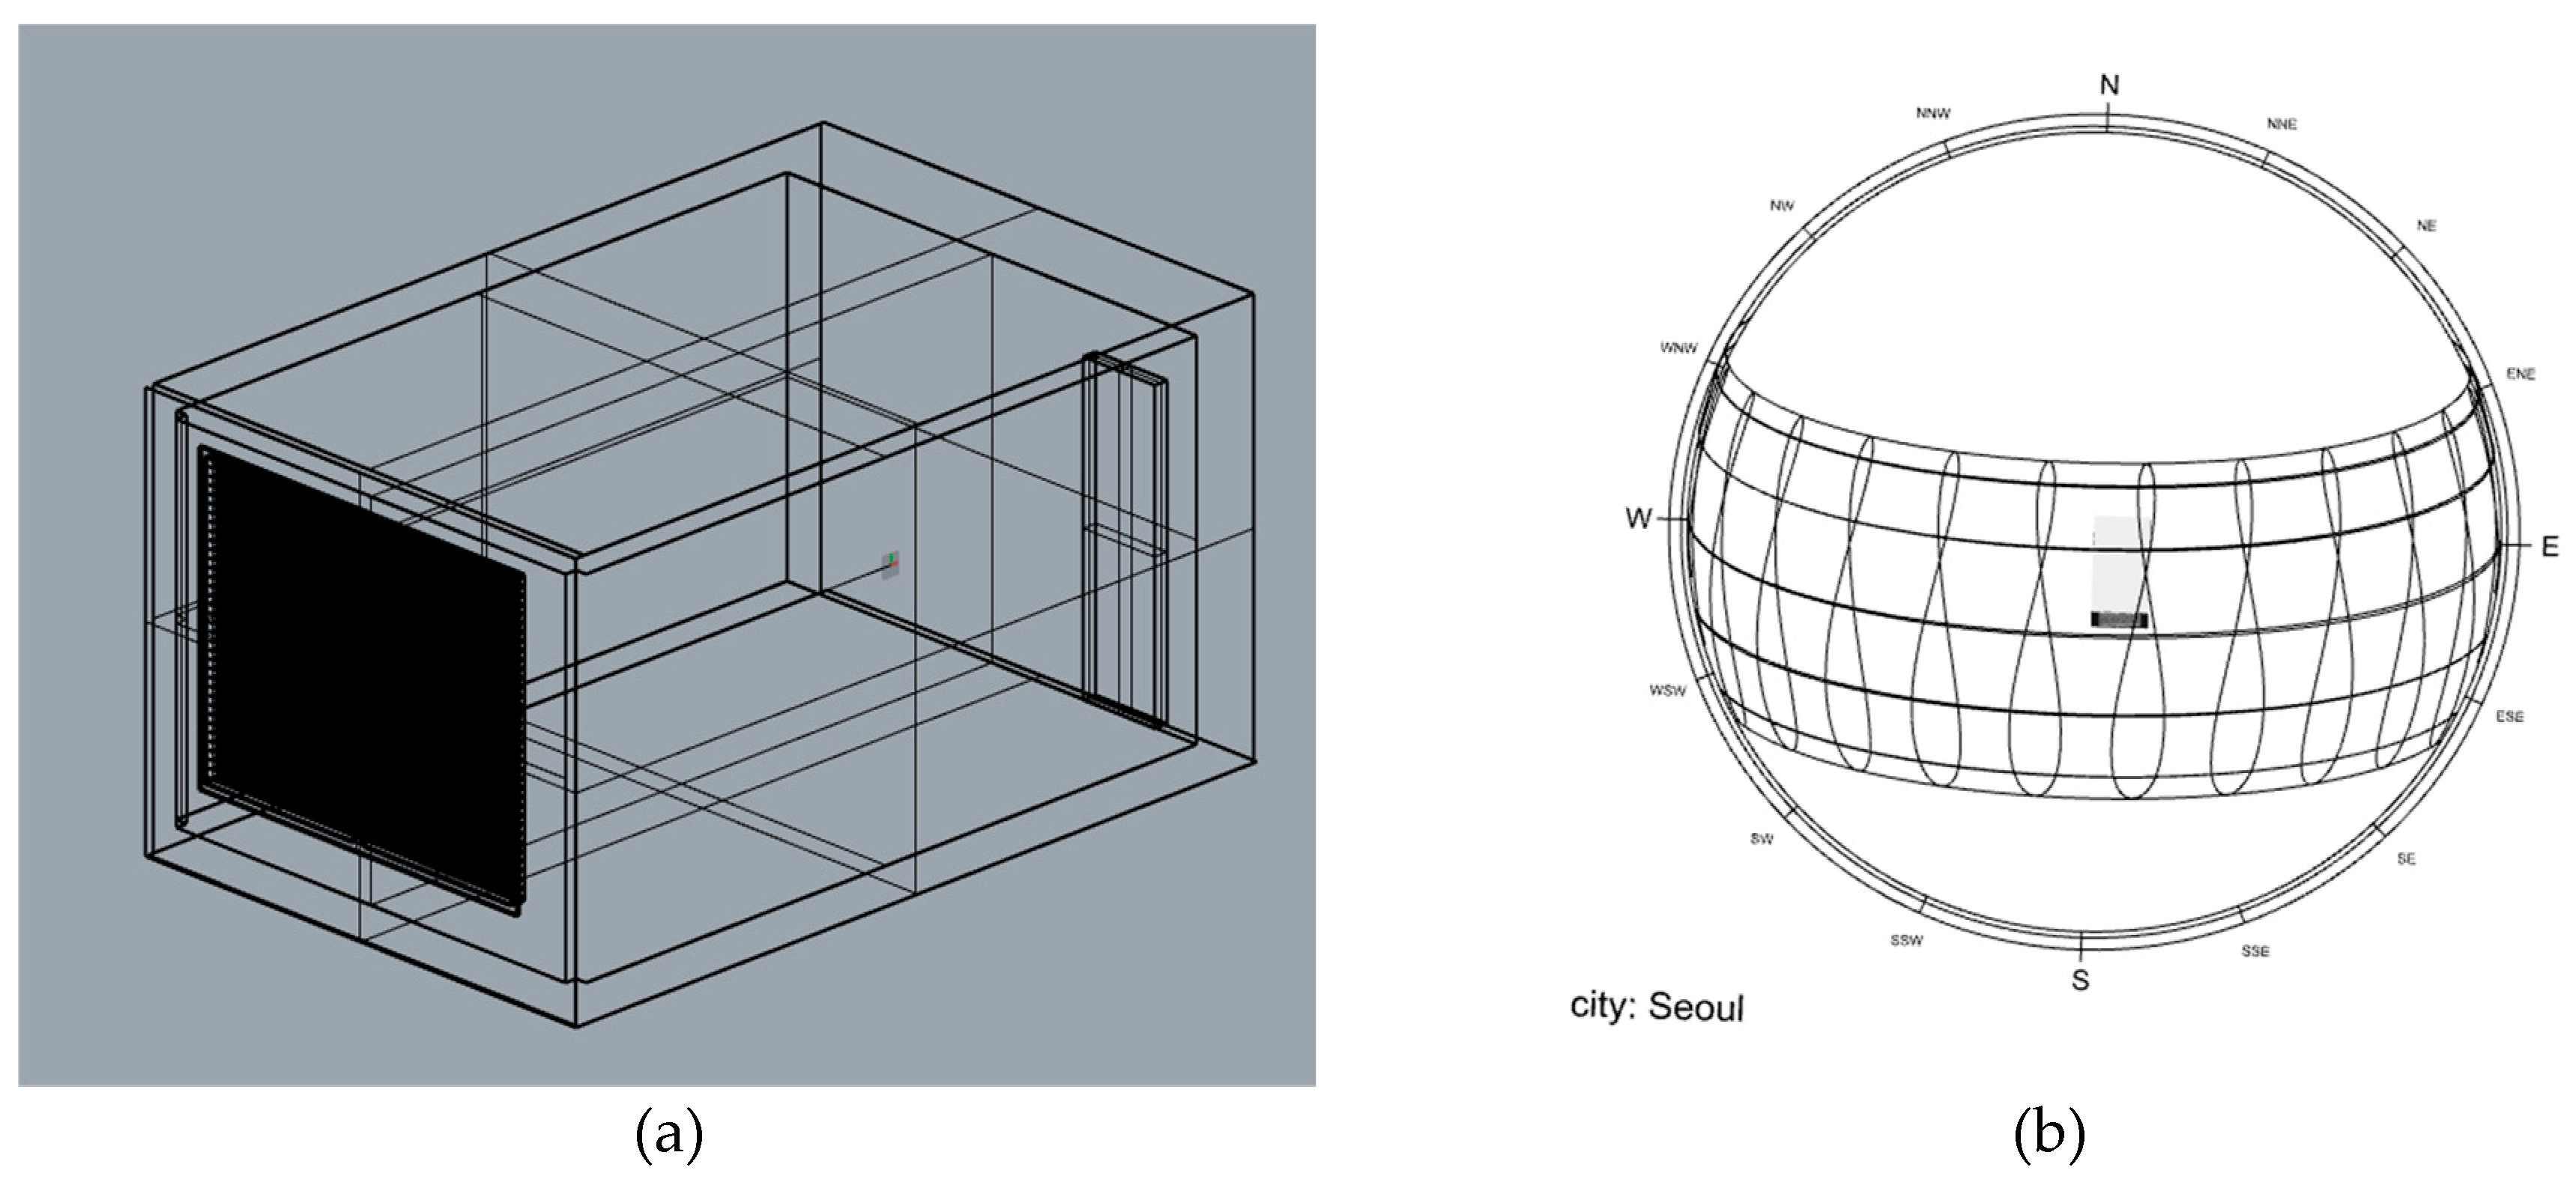
Typical Meteorological Year (TMY) provides hourly weather data for a specific location, including solar radiation and meteorological elements. It's widely used in energy simulations and renewable energy design to estimate consumption, evaluate building performance, and optimize system sizing. The data is generated by selecting a subset of weather data from a longer period, typically at least 12 years, to represent typical conditions for the location [26]. Different versions may exist for the same location based on different data sources and selection criteria. Other weather data sets are also available for different purposes. The weather data used in this study is climate data of the site located at Seoul, Korea (37°33′36″N 126°59′24″E), regional climate data is provided by Ladybug EPWmap. Given that the operation of HVAC systems is influenced by the thermal needs of indoor environments, which vary across seasons, we did not assume the installation of an HVAC system on the site. This decision was made to ensure that our energy calculations accurately reflected the site's actual energy use patterns. Figure 5 depicts the model's image during the design phase in Rhino software, along with the sunpath of the designated simulation site.
Once we obtained the model to be simulated, the parameters of the walls, roof, floor, glass, louvers were applied, and simulated them on the software tools EnergyPlus and Honeybee Radiance. The simulation was carried out using the Rhino software, and we focused on the energy consumption for cooling only.
Figure 7. (a) Test room in Rhino software and (b) the sun path of the designated simulation site.
Preprints 96367 g007
The study adhered to the ASHRAE (American Society of Heating, Refrigerating and Air-Conditioning Engineers) Standard 55-2020 schedule for Thermal Environmental Conditions for Human Occupancy [27], which specifies cooling temperatures. In this simulation, temperatures of 25°C were applied during summer.

4. Result

4.1. Compare the results of measuring light distribution in the test room and the simulated values

In the realm of lighting simulation using Dialux Evo software, the utilization of Typical Meteorological Year (TMY) data limits the available daylighting options to three categories: clear sky, average sky, and overcast sky. This constraint poses a challenge to accurate modeling as real-time weather conditions exhibit constant variations influenced by factors such as clouds, wind, and other atmospheric elements. Consequently, a substantial disparity arises in the intensity of interior lighting values between simulated scenarios and real-world measurements.
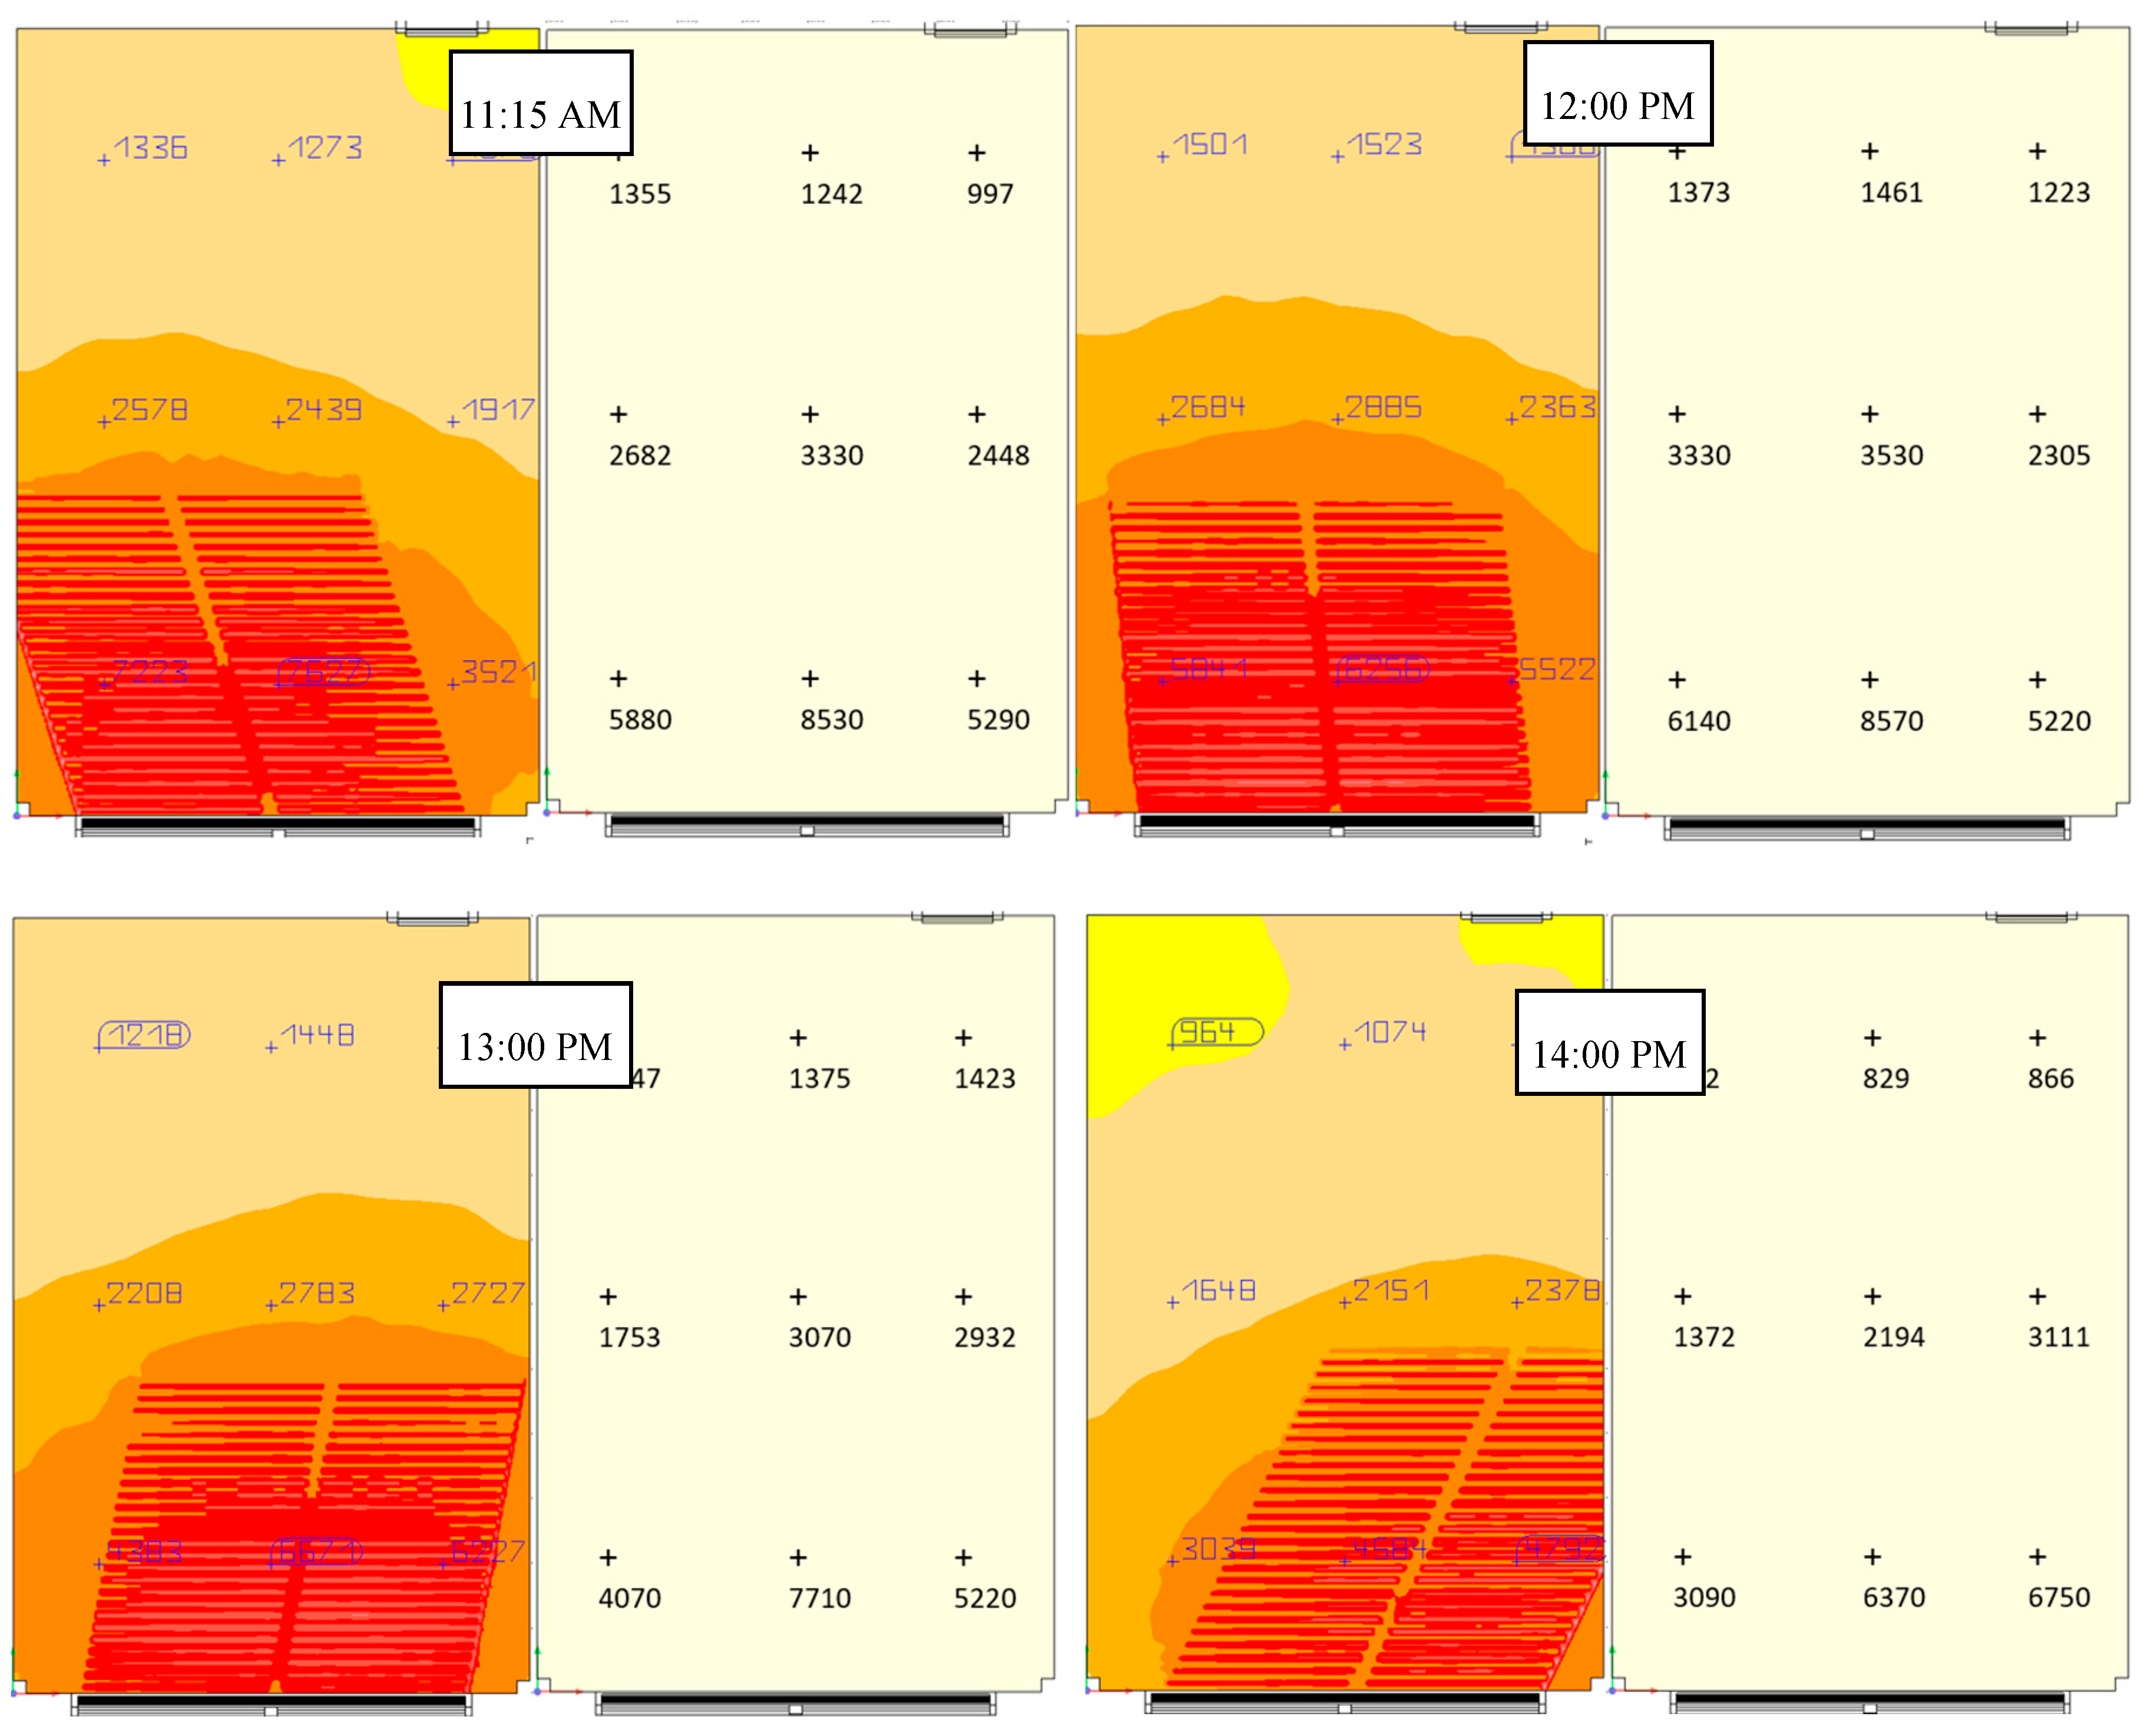
To bridge this gap, a practical measurement was conducted on November 30, 2022, spanning from 11:00 AM to 2:00 PM, with a sampling interval of 30 seconds per observation. Table 3 presents a segment of the dataset acquired through these real-time measurements. Due to the voluminous nature of the dataset, our comparative analysis focuses on specific time points: 11:15 AM, 12:00 PM, 1:00 PM, and 2:00 PM.
Figure 8 juxtaposes the results of the simulation against the actual measurements. The color-coded distribution in the image represents the simulated lighting distribution within the room through the software. Notably, the discrepancy between simulated and actual conditions becomes apparent, emphasizing the need for improved methodologies in lighting simulation to enhance accuracy and reliability in architectural and environmental design practices.
Fundamentally, the values at six measurement points situated away from the window in the simulation closely mirror the actual results; however, a noticeable deviation emerges in the immediate vicinity of the window. This peculiarity can be expounded by considering the sun's position in November, marked by a notably low altitude (Altitude: 30.64°, Azimuth: 174.44° at noon). The direct sunlight, endowed with a high reflectance (>90%), undergoes two reflections off the slat louvers before impinging directly onto the floor. This process gives rise to regions characterized by alternating high and low light intensities, with minimal separation between these contrasting zones. Consequently, the placement of sensors in these two regions yields markedly distinct readings, underscoring the intricate interplay of sunlight reflections and surface interactions.

4.2. Calculation and simulation results of lighting energy

In this section, we present an analysis of the lighting energy consumption and potential savings achieved through various scenarios. The following data in Table 4 illustrates the lighting energy requirements and the corresponding energy savings for each case
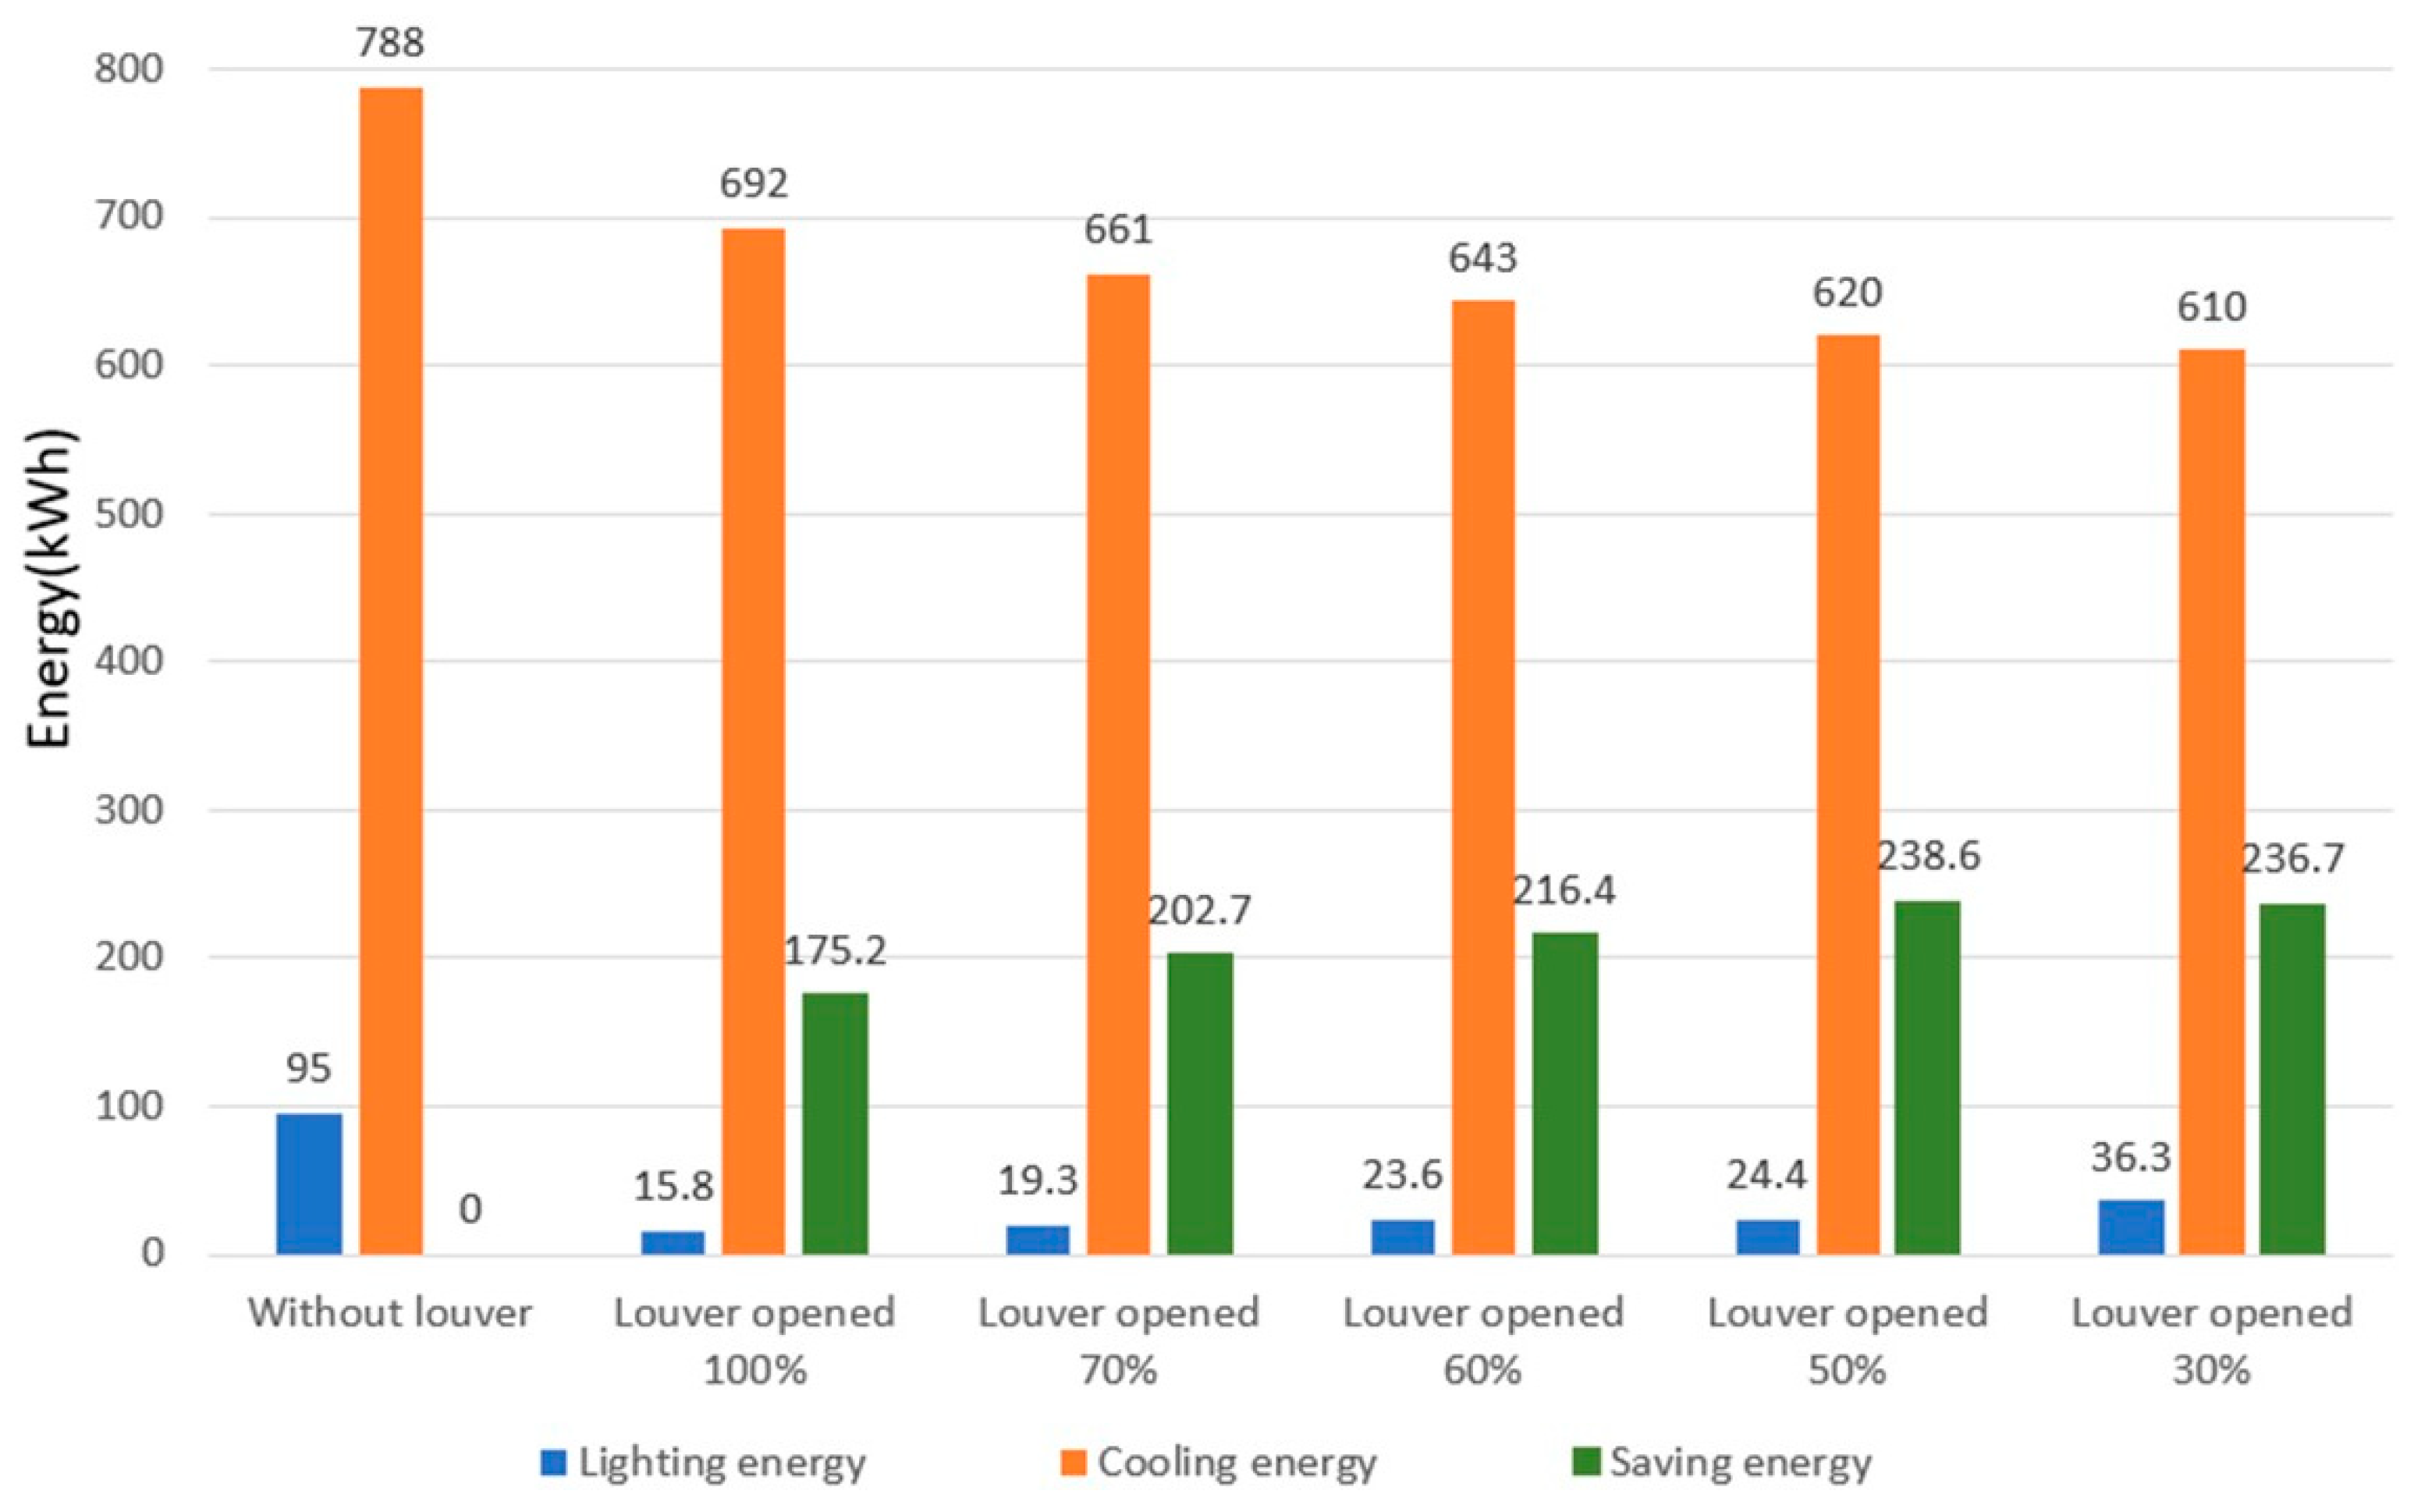
The lighting energy requirement for the office in this study is 95 kWh. In the case of a 100% louver opening, the annual lighting energy consumption is 15.8 kWh, resulting in energy savings of 79.2 kWh, with a savings rate of 83.3%. For a 70% louver opening, the annual lighting energy consumption is 19.3 kWh, leading to energy savings of 75.7 kWh, with a savings rate of 79.7%. With a 60% louver opening, the annual lighting energy consumption is 23.6 kWh, resulting in energy savings of 71.4 kWh, with a savings rate of 75.2%. When the louvers are opened 50%, the annual lighting energy consumption is 24.4 kWh, leading to energy savings of 70.6 kWh, with a savings rate of 74.3%. Finally, for a 30% louver opening, the annual lighting energy consumption is 36.3 kWh, resulting in energy savings of 58.7 kWh, with a savings rate of 61.8%.
These findings provide valuable insights into the influence of louver opening on lighting energy consumption. The results demonstrate that reducing the louver opening leads to significant energy savings, indicating the potential for enhanced energy efficiency and cost reduction. Optimal louver settings are crucial for achieving efficient lighting performance and maximizing energy savings in various lighting design applications.

4.3. Calculation and simulation results of cooling energy

The cooling energy consumption analysis includes different scenarios: without louver, 100% louver opening, 70% louver opening, 60% louver opening, 50% louver opening, and 30% louver opening. The results are shown in Table 5.
In the base-case without louvers, the cooling energy consumption during a year is 788 kWh. When the louvers are fully opened (100% louver opening), the cooling energy consumption reduces to 692 kWh, resulting in energy savings of 96 kWh (savings rate: 12.2%). For a 70% louver opening, the cooling energy consumption decreases to 661 kWh, achieving savings of 127 kWh (savings rate: 16.1%). With a 60% louver opening, the cooling energy consumption further decreases to 643 kWh, resulting in energy savings of 145 kWh (savings rate: 18.4%). When the louvers are opened 50%, the cooling energy consumption reduces to 620 kWh, leading to energy savings of 168 kWh (savings rate: 21.3%). Finally, with a 30% louver opening, the cooling energy consumption decreases to 610 kWh, resulting in energy savings of 178 kWh (savings rate: 22.5%).
The results highlight the impact of louver opening on cooling energy consumption. As the louver opening increases, there is a corresponding decrease in cooling energy demand, resulting in significant energy savings. The highest savings rate of 22.5% is achieved with a 30% louver opening, leading to a cooling energy savings of 178 kWh.
These findings emphasize the effectiveness of louver systems in optimizing cooling energy performance and enhancing energy efficiency. By selecting the appropriate louver opening percentage, substantial energy savings can be realized, leading to cost reductions and improved sustainability in cooling operations. Further research can explore additional louver configurations to advance energy-efficient building design and sustainable cooling strategies.

4.4. Total energy saved

The analysis reveals that incorporating louver openings can result in significant energy savings in lighting and cooling (Figure 9). However, it shows minimal or negative impact on heating energy consumption. Therefore, while louver openings contribute to reducing overall energy consumption in lighting and cooling systems, they may not effectively contribute to heating energy savings.
In the scenario where the louvers are opened 100%, the greatest energy savings are observed in lighting compared to the baseline case. However, the overall total energy savings achieved are relatively modest, amounting to 175.2 kWh (19.84%). With a 70% louver opening, the total energy savings increase to 202.7 kWh (22.96%). Further, opening the louvers to 60% results in a higher total energy savings of 216.4 kWh (24.50%).
The most significant total energy savings among the cases considered in this study are attained with a 50% louver opening, reaching 238.6 kWh (27.02%). On the other hand, when the louvers are opened by 30%, although the cooling energy savings are the greatest, the savings in lighting lead to a total energy savings of only 236.7 kWh (26.80%).

5. Conclusions

In this study, we conducted energy simulations for lighting, cooling, and heating requirements in an office located in Seoul, South Korea. The results of the study indicate that the use of louvers in different opening configurations can lead to energy savings, particularly in the lighting aspect. The obtained results demonstrate that the utilization of a louver system in office spaces can achieve energy savings of over 80% for lighting requirements and up to 22% for cooling energy consumption. Opening the louvers in different configurations results in varying levels of energy savings. The highest energy savings are achieved with a 50% louver opening, reaching 6.15%. However, the overall energy savings observed in the study are relatively modest. Opening the louvers 100% leads to a 4.56% energy savings, while a 70% opening yields 5.24% savings. The study also found that a 30% louver opening has the highest cooling energy savings but lower savings in lighting and heating, resulting in a total energy savings of 6.04%. These findings suggest the potential for energy reduction through louver adjustments, although additional measures may be needed to achieve more significant energy efficiency improvements.
In conclusion, while the use of louvers, especially at higher opening percentages, can contribute to energy savings, the impact on the overall total energy consumption is limited. Further optimizations and complementary strategies may be required to achieve more substantial energy efficiency improvements in the studied context.

Author Contributions

Conceptualization, S.S. and J.P.; methodology, N-M.K. and H.B.; software, N-M.K.; validation, S.S., I. U.; formal analysis, N-M.K.; investigation, N-M.K.; resources, S.S., G.L.; data curation, H.B.; writing—original draft preparation, N-M.K.; writing—review and editing, I.U.; visualization, X.X.; supervision, S.S.; project administration, S.S, J.P. and M.C.; All authors have read and agreed to the published version of the manuscript.

Funding

This work was supported under the framework of the international cooperation program managed by the National Research Foundation of Korea (project number NRF-2022K2A9A1A06092471) and NRF grant funded by the Korean government (MIST) (project number 2021R1A2C1010879).

Data Availability Statement

The data presented in this study are available on request from the corresponding author.

Conflicts of Interest

The authors declare no conflicts of interest.

References

  1. United Nations Environment Programme (2022). 2022 Global Status Report for Buildings and Construction: Towards a Zero-emission, Efficient and Resilient Buildings and Construction Sector. https://wedocs.unep.org/20.500.11822/41133.
  2. Muna Alsukkar, Mingke Hu, Ahmad Eltaweel, Yuehong Su, Daylighting performance improvements using of split louver with parametrically incremental slat angle control, Energy and Buildings, Volume 274, 112444, 2022 . [CrossRef]
  3. Yu Bian, Yanan Chen, Yanyi Sun, Yuan Ma, Daxing Yu, Tianxiang Leng, Simulation of daylight availability, visual comfort and view clarity for a novel window system with switchable blinds in classrooms, Building and Environment, Volume 235, 2023, 110243. [CrossRef]
  4. Ali Ahmed Salem Bahdad, Sharifah Fairuz Syed Fadzil, Hilary Omatule Onubi, Saleh Ahmed BenLasod, Sensitivity analysis linked to multi-objective optimization for adjustments of light-shelves design parameters in response to visual comfort and thermal energy performance, Journal of Building Engineering, Volume 44, 2021, 102996 . [CrossRef]
  5. Fayrouz H. F. Hassan, Khaled A. Y. Ali, Salwa A. M. Ahmed, Biomimicry as an Approach to Improve Daylighting Performance in Office Buildings in Assiut City, Egypt, Journal of Daylighting 10 (2023) 1-16. [CrossRef]
  6. Atthaillah, Rizki A. Mangkuto, M. Donny Koerniawan, Jan L.M. Hensen, Brian Yuliarto, Optimization of Daylighting Design Using Self-Shading Mechanism in Tropical School Classrooms with Bilateral Openings, Journal of Daylighting 9 (2022) 117-136. [CrossRef]
  7. Michael Jakubowsky, Jan de Boer, Façade elements for room illumination with integrated microstructures for daylight redirection and LED lighting, Energy and Buildings, Volume 266, 2022, 112106. [CrossRef]
  8. Yao Tao, Xiang Fang, Sujeeva Setunge, Jiyuan Tu, Jingcheng Liu, Long Shi, Naturally ventilated double-skin façade with adjustable louvers, Solar Energy, Volume 225, 2021, Pages 33-43. [CrossRef]
  9. Guoqing Yu, Hongxing Yang, Daina Luo, Xu Cheng, Mark Kyeredey Ansah, A review on developments and researches of building integrated photovoltaic (BIPV) windows and shading blinds, Renewable and Sustainable Energy Reviews, Volume 149, 2021, 111355. [CrossRef]
  10. Ahmed A. Freewan, Li Shao, Saffa Riffat, Interactions between louvers and ceiling geometry for maximum daylighting performance, Renewable Energy, Volume 34, Issue 1, 2009, Pages 223-232. [CrossRef]
  11. Jiafeng Fang, Yongqing Zhao, Zhen Tian, Peng Lin, Analysis of dynamic louver control with prism redirecting fenestrations for office daylighting optimization, Energy and Buildings, Volume 262, 2022, 112019. [CrossRef]
  12. Hikaru Kobayashi, Kodai Kawagishi, Keisuke Arata, Stationary dielectric daylighting louver based on concept of Köhler integrator, Solar Energy, Volume 241, 2022, Pages 361-371. [CrossRef]
  13. Liu, Ron. “An Overview of Aluminum Protective Coating Properties and Treatments.” (2009).
  14. Rendy Perdana Khidmat, Hiroatsu Fukuda, Beta Paramita, M. Donny Koerniawan, Kustiani, The optimization of louvers shading devices and room orientation under three different sky conditions, Journal of Daylighting 9 (2022) 137-149. [CrossRef]
  15. Ahmad Eltaweel, Mohamed Alaa Mandour, Qinghua Lv, Yuehong Su, Daylight Distribution Improvement Using Automated Prismatic Louvre, Journal of Daylighting 7 (2020) 84-92. [CrossRef]
  16. Haifei Chen, Baorui Cai, Huihan Yang, Yunjie Wang, Jie Yang, Study on natural lighting and electrical performance of louvered photovoltaic windows in hot summer and cold winter areas, Energy and Buildings, Volume 271, 2022, 112313. [CrossRef]
  17. Fujian Jiang, Zhengrong Li, Qun Zhao, Qiuhua Tao, Shunyao Lu, Kaiming Zhao, The influence of exterior louver blinds’ geometric and thermal attributes on the convective heat transfer at building facades, Solar Energy, Volume 193, 2019, Pages 654-665. [CrossRef]
  18. Qiuhua Tao, Fujian Jiang, Zhengrong Li, Jianwen Zheng, A model of heat gain calculation for buildings with shuttle louvers: Verification and a case study, Journal of Building Engineering, Volume 29, 2020, 101101. [CrossRef]
  19. Fujian Jiang, Yanping Yuan, Zhengrong Li, Qun Zhao, Kaiming Zhao, Correlations for the forced convective heat transfer at a windward building façade with exterior louver blinds, Solar Energy, Volume 209, 2020, Pages 709-723. [CrossRef]
  20. Daniel Uribe, Sergio Vera, Waldo Bustamante, Andrew McNeil, Gilles Flamant, Impact of different control strategies of perforated curved louvers on the visual comfort and energy consumption of office buildings in different climates, Solar Energy, Volume 190, 2019, Pages 495-510. [CrossRef]
  21. F.F. Hernández; J.M.C. López; J.M.P. Suárez; M.C.G. Muriano; S.C. Rueda, Effects of louvers shading devices on visual comfort and energy demand of an office building. A case of study. Energy Procedia 2017, 140, 207–216. [CrossRef]
  22. J.-H. Kim, S.-H. Han, Indoor Daylight Performances of Optimized Transmittances with Electrochromic-Applied Kinetic Louvers, Buildings, vol. 12, 2022, 263. [CrossRef]
  23. Ullah, S. Shin, Highly Concentrated Optical Fiber-Based Daylighting Systems for Multi-Floor Office Buildings, Energy and Buildings, vol. 72, pp. 246-261, 2014. [CrossRef]
  24. DIALux. https://www.dialux.com/en-GB/about-dial.
  25. Rhino. https://blog.rhino3d.com/.
  26. Wu, Y., An, J., Gui, C. et al. A global typical meteorological year (TMY) database on ERA5 dataset. Build. Simul. 16, 1013–1026 (2023). [CrossRef]
  27. Standard 55 – Thermal Environmental Conditions for Human Occupancy (ashrae.org).
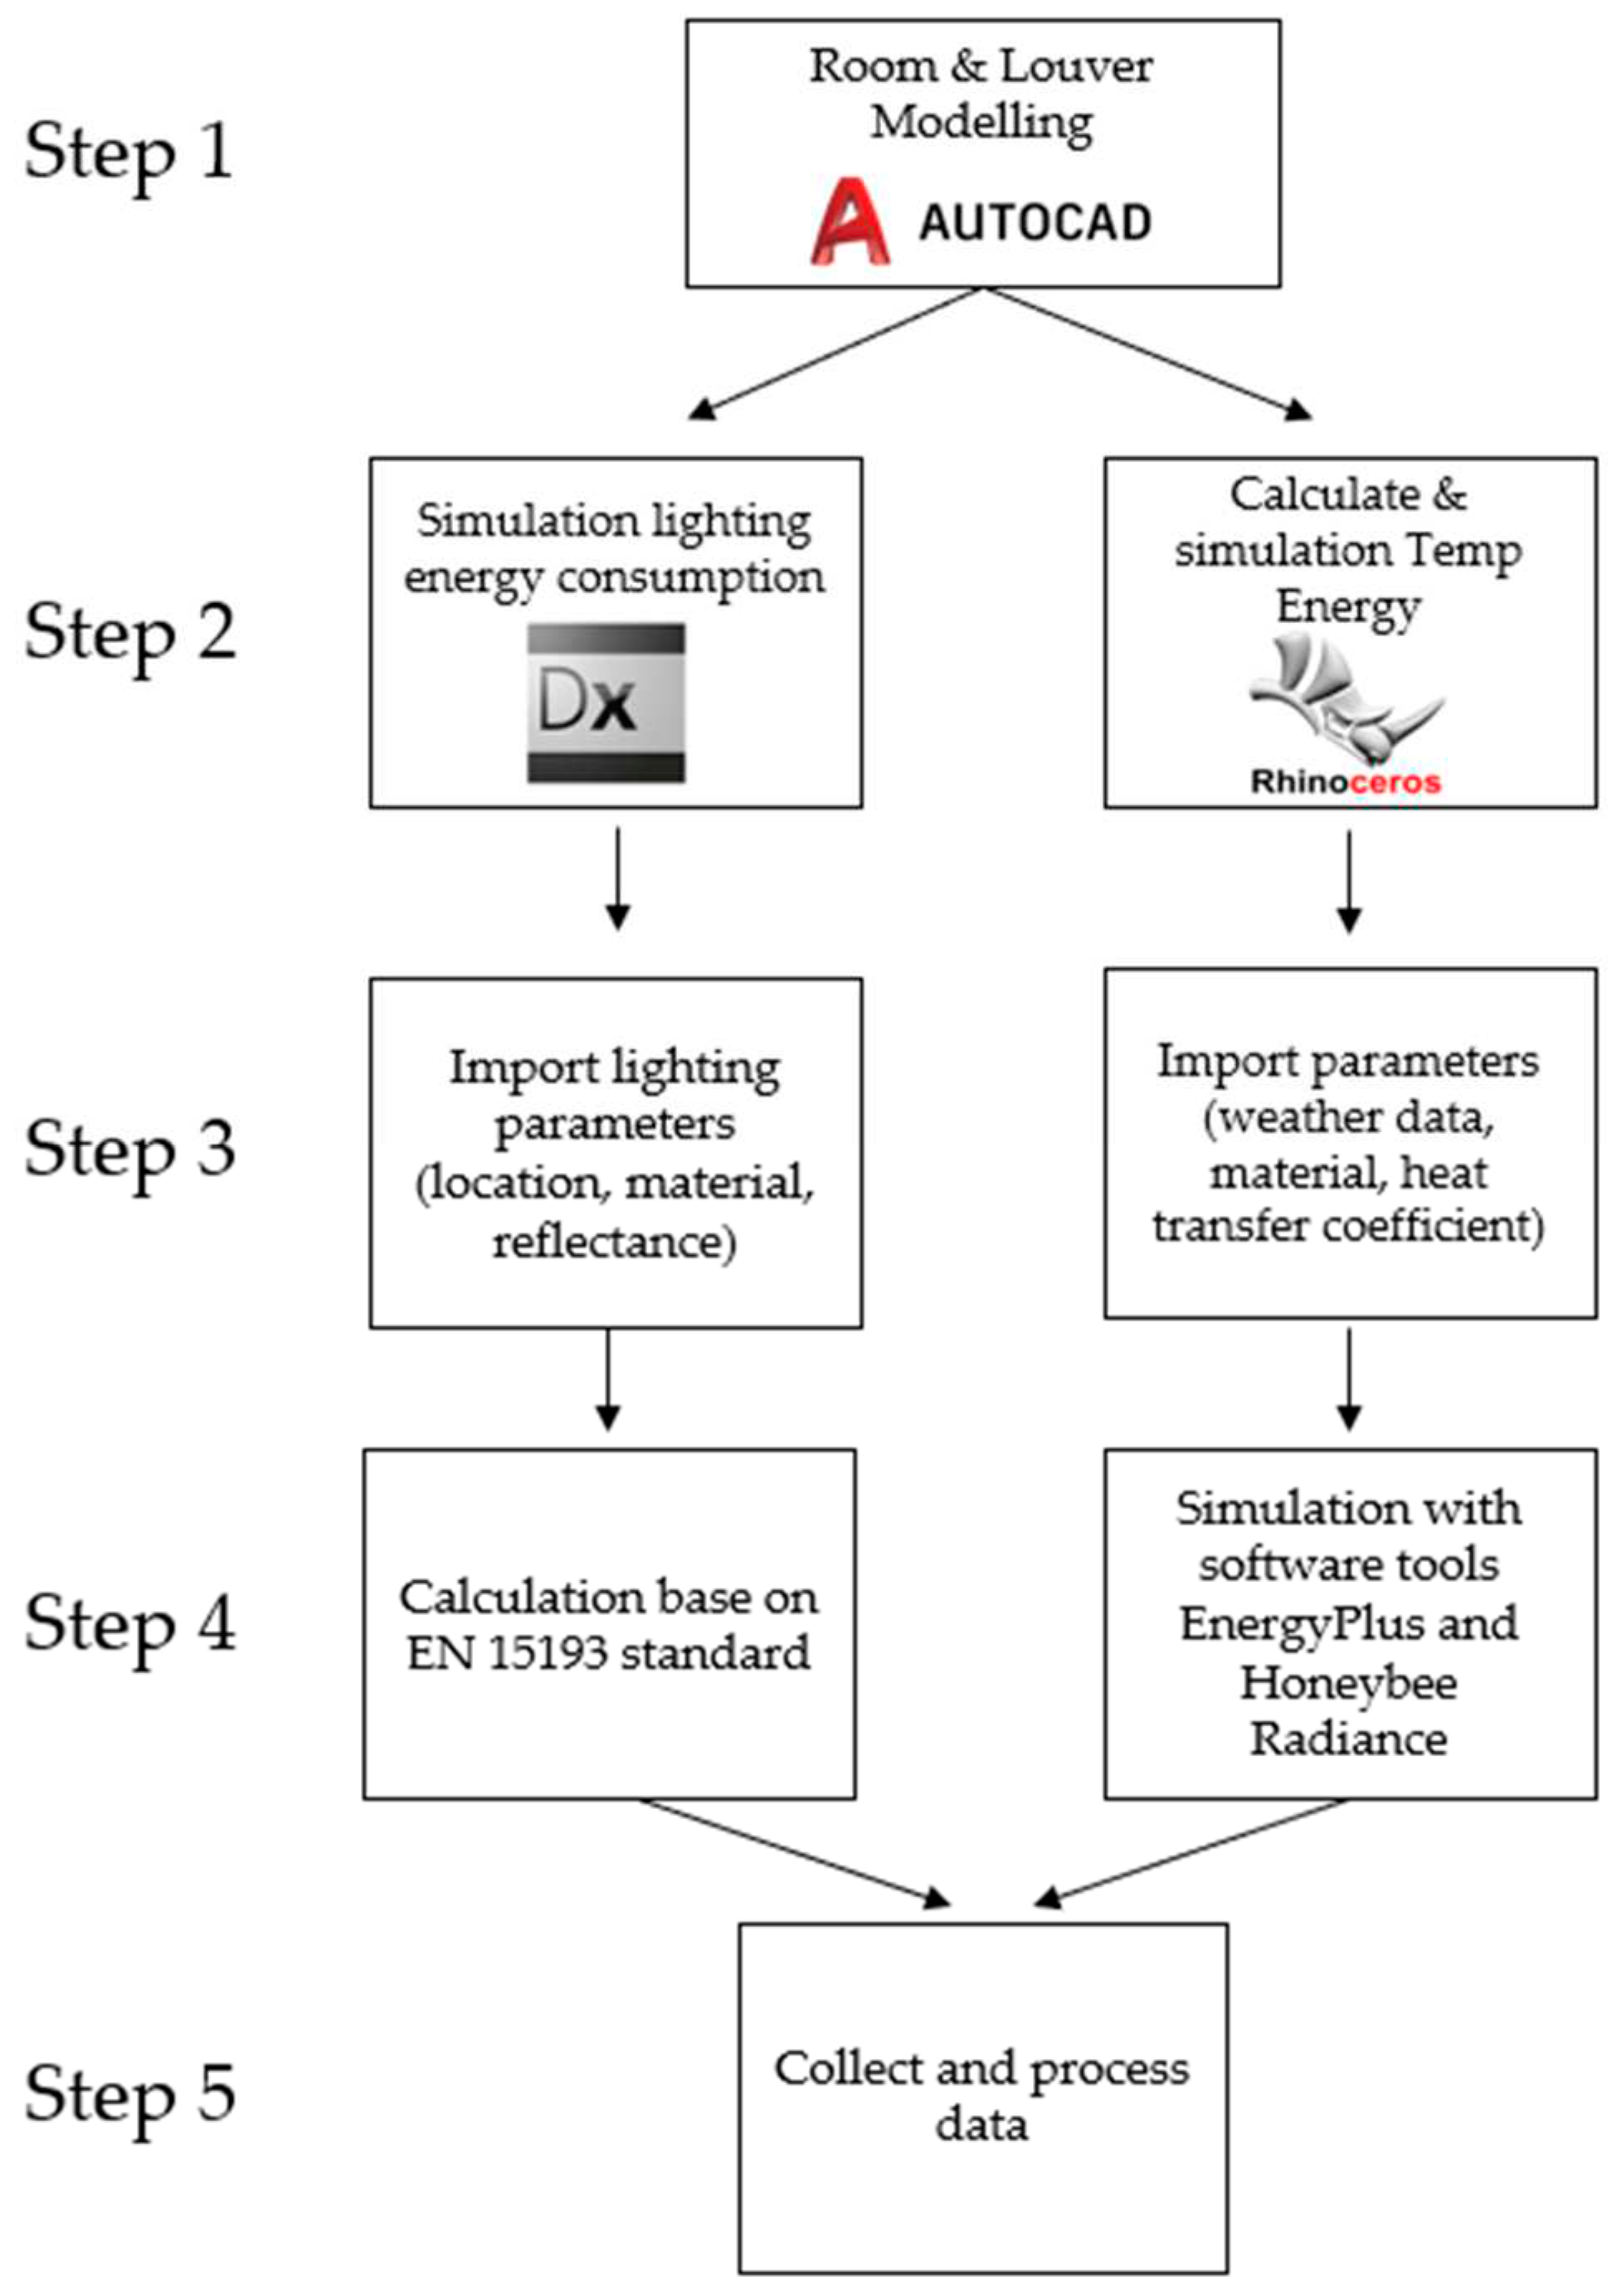
Figure 1. Research workflow.
Preprints 96367 g001
Figure 2. (a) Structure of louver and (b) definition of louver angles used in this study.
Preprints 96367 g002
Figure 3. Louver's principal model.
Preprints 96367 g003
Figure 4. The test room was built for reference measurements.
Preprints 96367 g004
Figure 5. Distribution of sensor positions in the test room.
Preprints 96367 g005
Figure 8. The results of the simulation against the measurements.
Preprints 96367 g008
Figure 9. Total energy that can be saved through the use cases of louver.
Preprints 96367 g009
Table 1. Comparison of recent work on louver systems.
Article Type Louver slat angle Comments
M. Alsukkar et al. (2022) [2] Horizontal 0° to 60° & -40° to -10° Free-glare indoor illumination
J. Fang et al. (2022) [11] Horizontal Better daylighting luminous environment
M. Alsukkar et al. (2022) [30] Horizontal 0° to 38° Improve the daylighting performance of the split louver
J.-H. Kim etal. (2022) [31] Horizontal 0° to 90° Uniform indoor illuminance
D. Uribe et al. (2019) [28] Horizontal 30°, 40°, 60° visual comfort
F. Jiang (2019) [16] Horizontal 0°, 45°, 60° Airflow for heat exchange
F.F. Hernández et al. (2017) [29] Horizontal & vertical Vertical 0°, 30°, 60° -30°, -60°
Horizontal 0°
Visual comfort and energy saving
Table 2. Thermal transmission and lighting specifications.
Component Construction Reflectance Transmittance Heat transfer coefficient (W/m2.K)
Interior Walls General Interior Wall 0.5 - 2.58
Exterior Walls General Exterior Wall - - 0.46
Interior Ceiling General Ceiling 0.8 - 1.45
Interior Floor General Floor 0.2 - 1.45
Window Clear Glass 0.05 0.9 0.5
Louver slats Coating Aluminum 0.9 - 10
Table 3. Segment of the dataset acquired through these real-time measurements.
Data No. Date & Time Ev [lx](10) Ev [lx](1) Ev [lx](2) Ev [lx](3) Ev [lx](4) Ev [lx](5) Ev [lx](6) Ev [lx](7) Ev [lx](8) Ev [lx](9)
1 2022-11-30 오전 11:05:57 1.35 0.28 0.26 1.38 0.2 0.68 0.36 0.13 0.44 0.19
2 2022-11-30 오전 11:06:27 5830 0.27 0.26 1.37 0.2 0.68 0.36 0.14 0.44 0.19
3 2022-11-30 오전 11:06:57 12530 0.28 0.26 1.4 0.2 0.68 0.37 0.12 0.45 0.19
4 2022-11-30 오전 11:07:29 12860 4710 8330 5840 2287 3200 2641 711 0.44 0.19
5 2022-11-30 오전 11:07:58 14240 4770 8370 5860 2321 3230 2659 944 1278 1134
6 2022-11-30 오전 11:08:31 24790 4830 8380 5860 2336 3240 2662 951 1286 1137
7 2022-11-30 오전 11:09:01 39700 4890 8430 5880 2354 3260 2673 959 1296 1143
8 2022-11-30 오전 11:09:32 54400 4960 8430 5880 2365 3270 2672 964 1302 1143
9 2022-11-30 오전 11:10:02 65700 5050 8440 5880 2377 3280 2676 970 1309 1147
10 2022-11-30 오전 11:10:31 68700 5090 8420 5850 2378 3270 2663 970 1309 1142
11 2022-11-30 오전 11:11:01 68700 5150 8420 5840 2388 3280 2663 974 1314 1143
12 2022-11-30 오전 11:11:31 68700 5170 8430 5840 2398 3280 2662 979 1321 1145
13 2022-11-30 오전 11:12:01 69600 5260 8520 5890 2432 3320 2686 992 1336 1156
14 2022-11-30 오전 11:12:31 69600 5280 8530 5900 2440 3330 2693 998 1344 1160
15 2022-11-30 오전 11:13:01 69700 5290 8530 5880 2448 3330 2682 997 1342 1155
16 2022-11-30 오전 11:13:31 69500 5280 8490 5850 2448 3320 2669 997 1342 1151
17 2022-11-30 오전 11:14:01 69300 5270 8460 5810 2449 3310 2654 996 1338 1145
18 2022-11-30 오전 11:14:31 69200 5270 8440 5800 2452 3310 2650 998 1340 1144
19 2022-11-30 오전 11:15:01 69500 5290 8530 5880 2448 3330 2682 997 1242 1355
20 2022-11-30 오전 11:15:31 69800 5290 8470 5800 2478 3330 2651 1007 1349 1145
21 2022-11-30 오전 11:16:01 69800 5290 8490 5800 2489 3340 2651 1012 1353 1147
22 2022-11-30 오전 11:16:31 70100 5310 8520 5820 2505 3350 2659 1019 1361 1150
23 2022-11-30 오전 11:17:01 70200 5300 8500 5800 2511 3350 2650 1020 1361 1148
24 2022-11-30 오전 11:17:31 70200 5310 8510 5800 2520 3360 2650 1024 1364 1148
25 2022-11-30 오전 11:18:01 70100 5310 8500 5790 2525 3360 2645 1026 1366 1145
26 2022-11-30 오전 11:18:31 70000 5320 8490 5770 2530 3350 2638 1029 1367 1144
27 2022-11-30 오전 11:19:01 70200 5350 8510 5770 2542 3360 2640 1035 1372 1145
28 2022-11-30 오전 11:19:31 70100 5360 8490 5760 2547 3360 2631 1035 1372 1141
29 2022-11-30 오전 11:20:01 70100 5380 8490 5750 2555 3370 2628 1039 1374 1141
30 2022-11-30 오전 11:20:31 70400 5410 8530 5760 2571 3380 2634 1045 1382 1144
31 2022-11-30 오전 11:21:01 70800 5420 8560 5780 2586 3390 2641 1051 1389 1148
32 2022-11-30 오전 11:21:31 71400 5460 8630 5820 2615 3420 2659 1062 1402 1156
33 2022-11-30 오전 11:22:01 71700 5460 8650 5820 2629 3440 2662 1069 1408 1158
34 2022-11-30 오전 11:22:31 72000 5470 8680 5830 2647 3450 2665 1075 1414 1160
35 2022-11-30 오전 11:23:01 72100 5470 8680 5820 2658 3450 2660 1079 1416 1159
36 2022-11-30 오전 11:23:31 72200 5460 8670 5800 2666 3450 2653 1082 1417 1156
37 2022-11-30 오전 11:24:01 72400 5470 8690 5800 2682 3460 2653 1089 1422 1157
38 2022-11-30 오전 11:24:31 70900 5350 8500 5660 2639 3390 2590 1073 1394 1132
39 2022-11-30 오전 11:25:01 68400 5140 8180 5440 2556 3260 2481 1036 1341 1083
40 2022-11-30 오전 11:25:31 60300 4520 7170 4750 2264 2860 2173 922 1184 953
41 2022-11-30 오전 11:26:01 59700 4480 7150 4730 2258 2840 2174 924 1188 957
Table 4. Energy required for lighting through the case.
Energy requirement Louver opened 100% Louver opened 70% Louver opened 60% Louver
opened 50%
Louver
opened 30%
Lighting Energy during a Year (KWh) 95 15.8 19.3 23.6 24.4 36.3
Energy saving (KWh) 0 79.2 75.7 71.4 70.6 58.7
Savings rate(%) 0 83.3% 79.7% 75.2% 74.3% 61.8%
Table 5. Energy required for cooling through the case.
Without louver Louver opened 100% Louver opened 70% Louver opened 60% Louver
opened 50%
Louver
opened 30%
Cooling energy during a year (KWh) 788 692 661 643 620 610
Energy saving (KWh) 0 96 127 145 168 178
Savings rate (%) 0 12.2% 16.1% 18.4% 21.3% 22.5%
Disclaimer/Publisher’s Note: The statements, opinions and data contained in all publications are solely those of the individual author(s) and contributor(s) and not of MDPI and/or the editor(s). MDPI and/or the editor(s) disclaim responsibility for any injury to people or property resulting from any ideas, methods, instructions or products referred to in the content.
Copyright: This open access article is published under a Creative Commons CC BY 4.0 license, which permit the free download, distribution, and reuse, provided that the author and preprint are cited in any reuse.
Prerpints.org logo

Preprints.org is a free preprint server supported by MDPI in Basel, Switzerland.

Subscribe

© 2024 MDPI (Basel, Switzerland) unless otherwise stated