Submitted:
15 January 2024
Posted:
16 January 2024
You are already at the latest version
Abstract
Keywords:
1. Introduction
2. Materials and Methods
2.1. Design of the transparent ultrasound probe
2.2. Fabrication of the transparent ultrasound probe
2.3. Testing the performance of the transparent ultrasound probe
2.4. Experimental setup
2.5. Animal preparation
3. Results
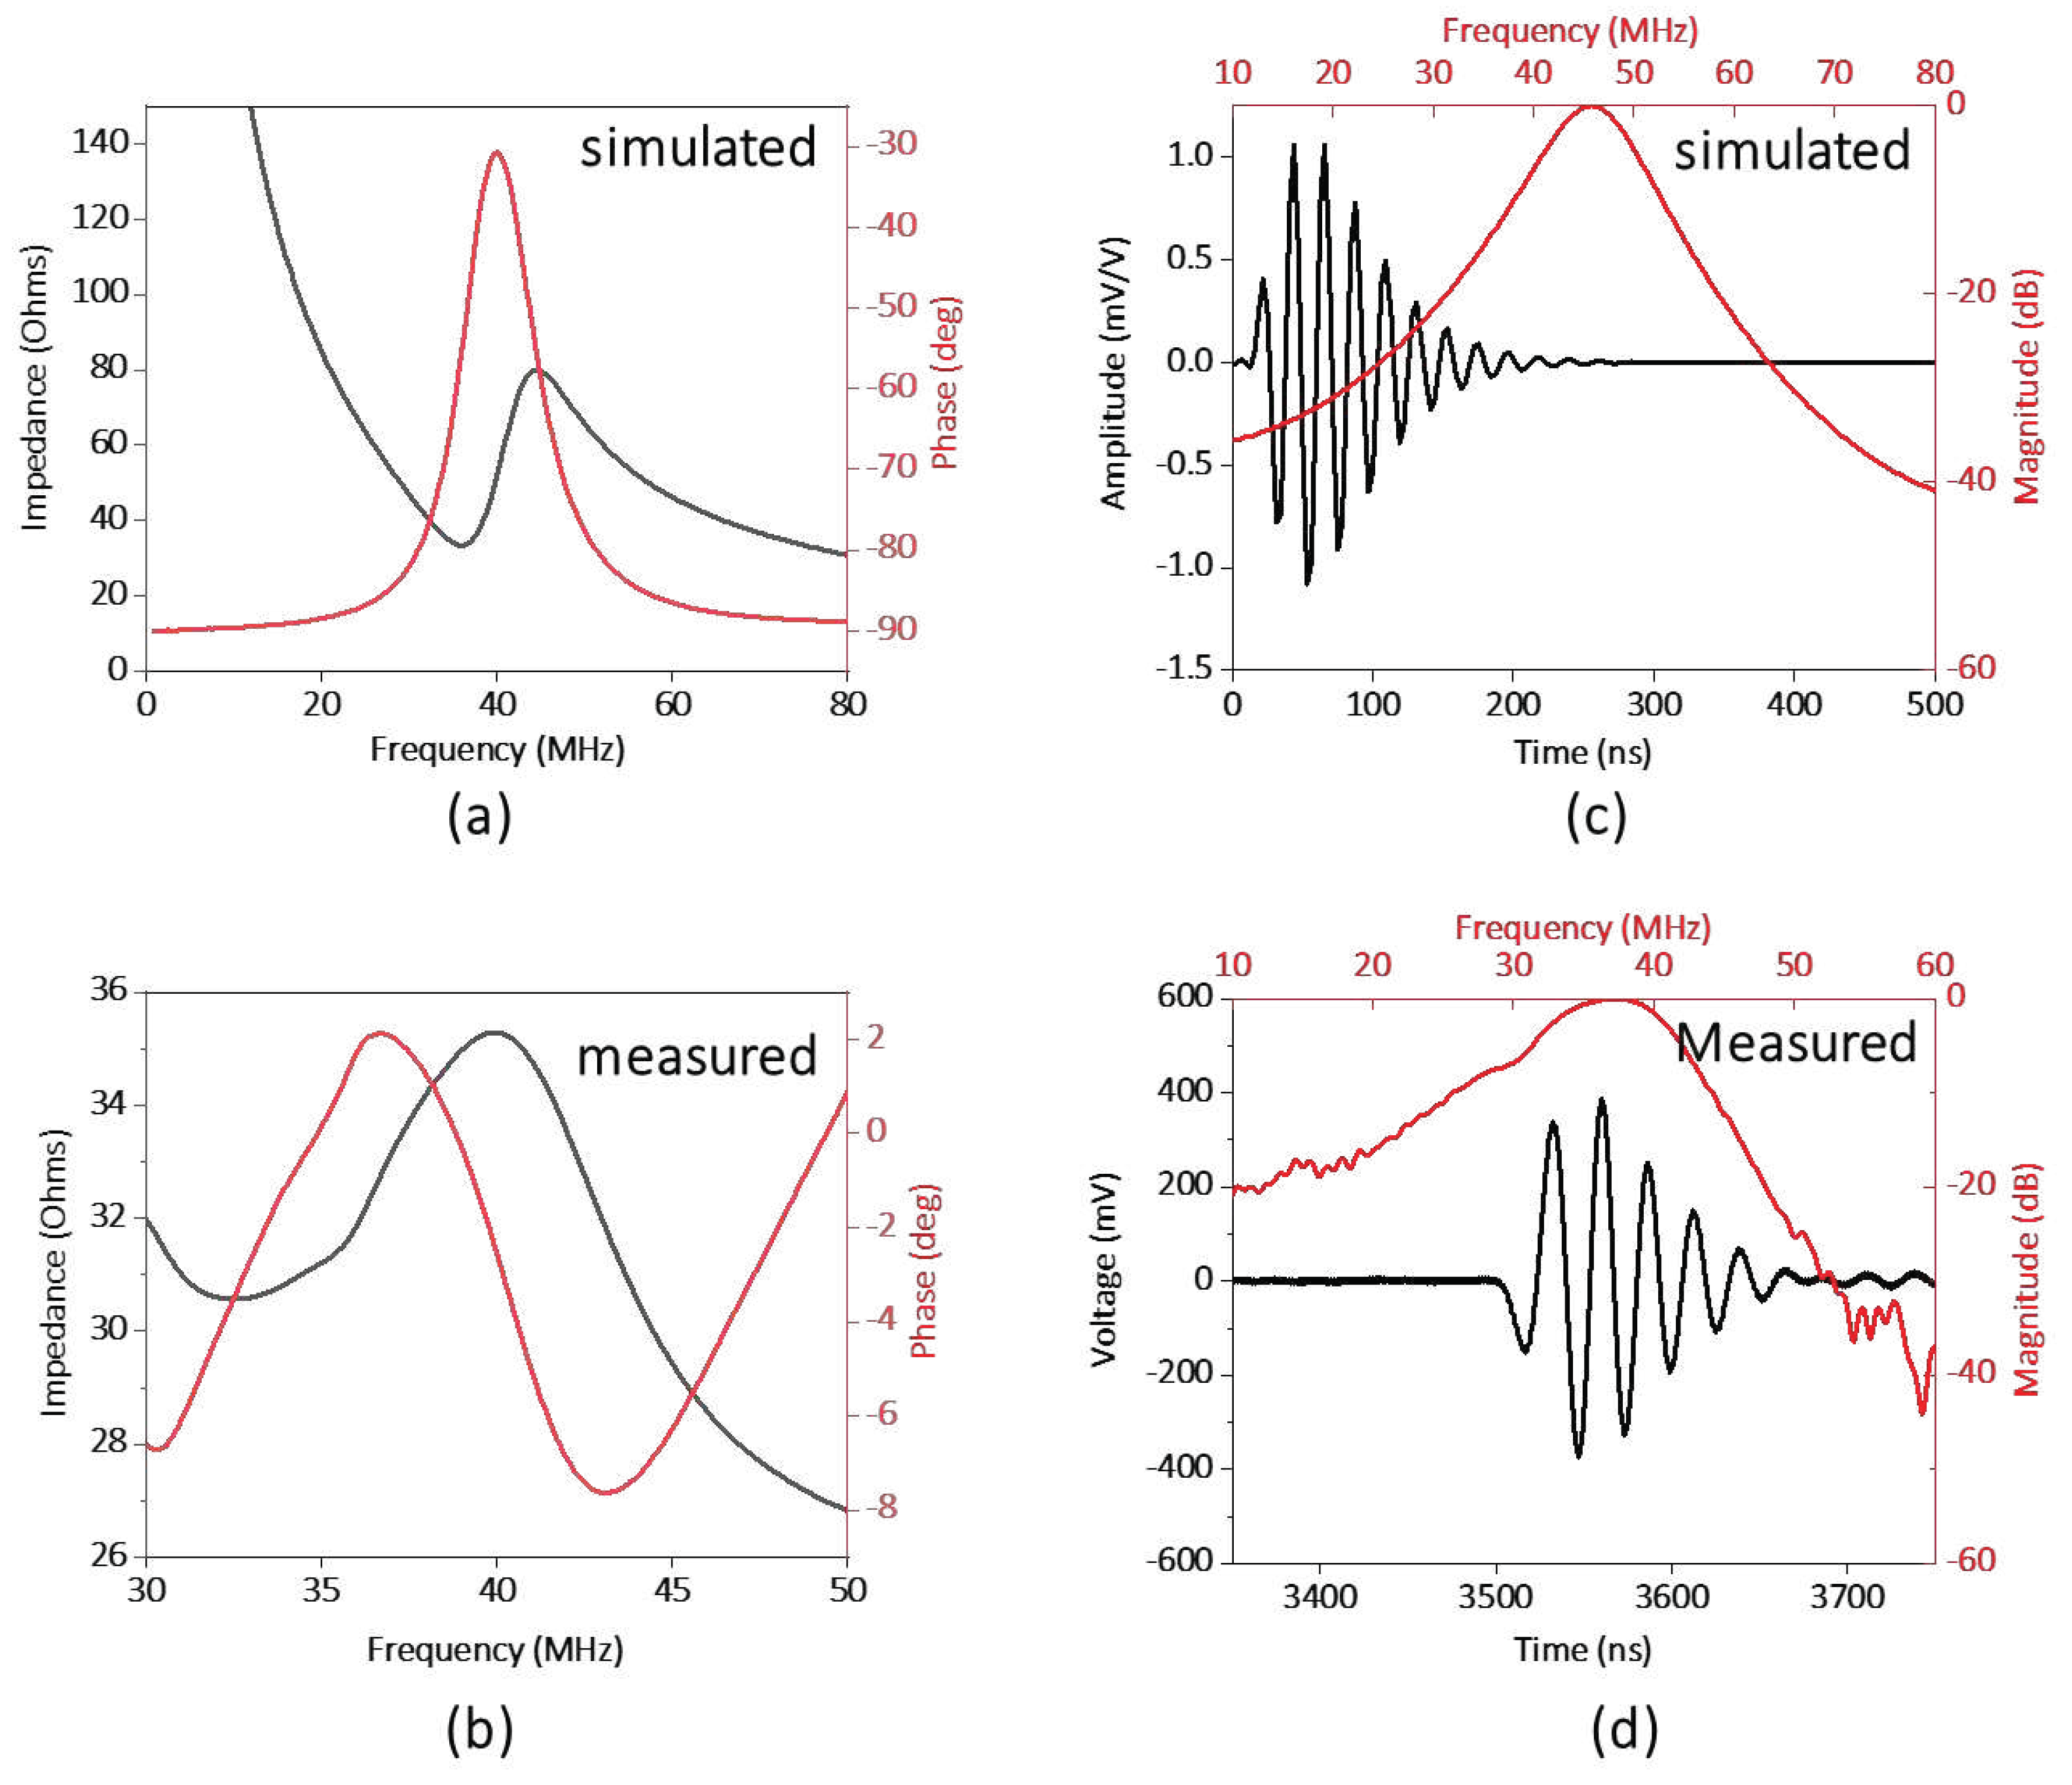
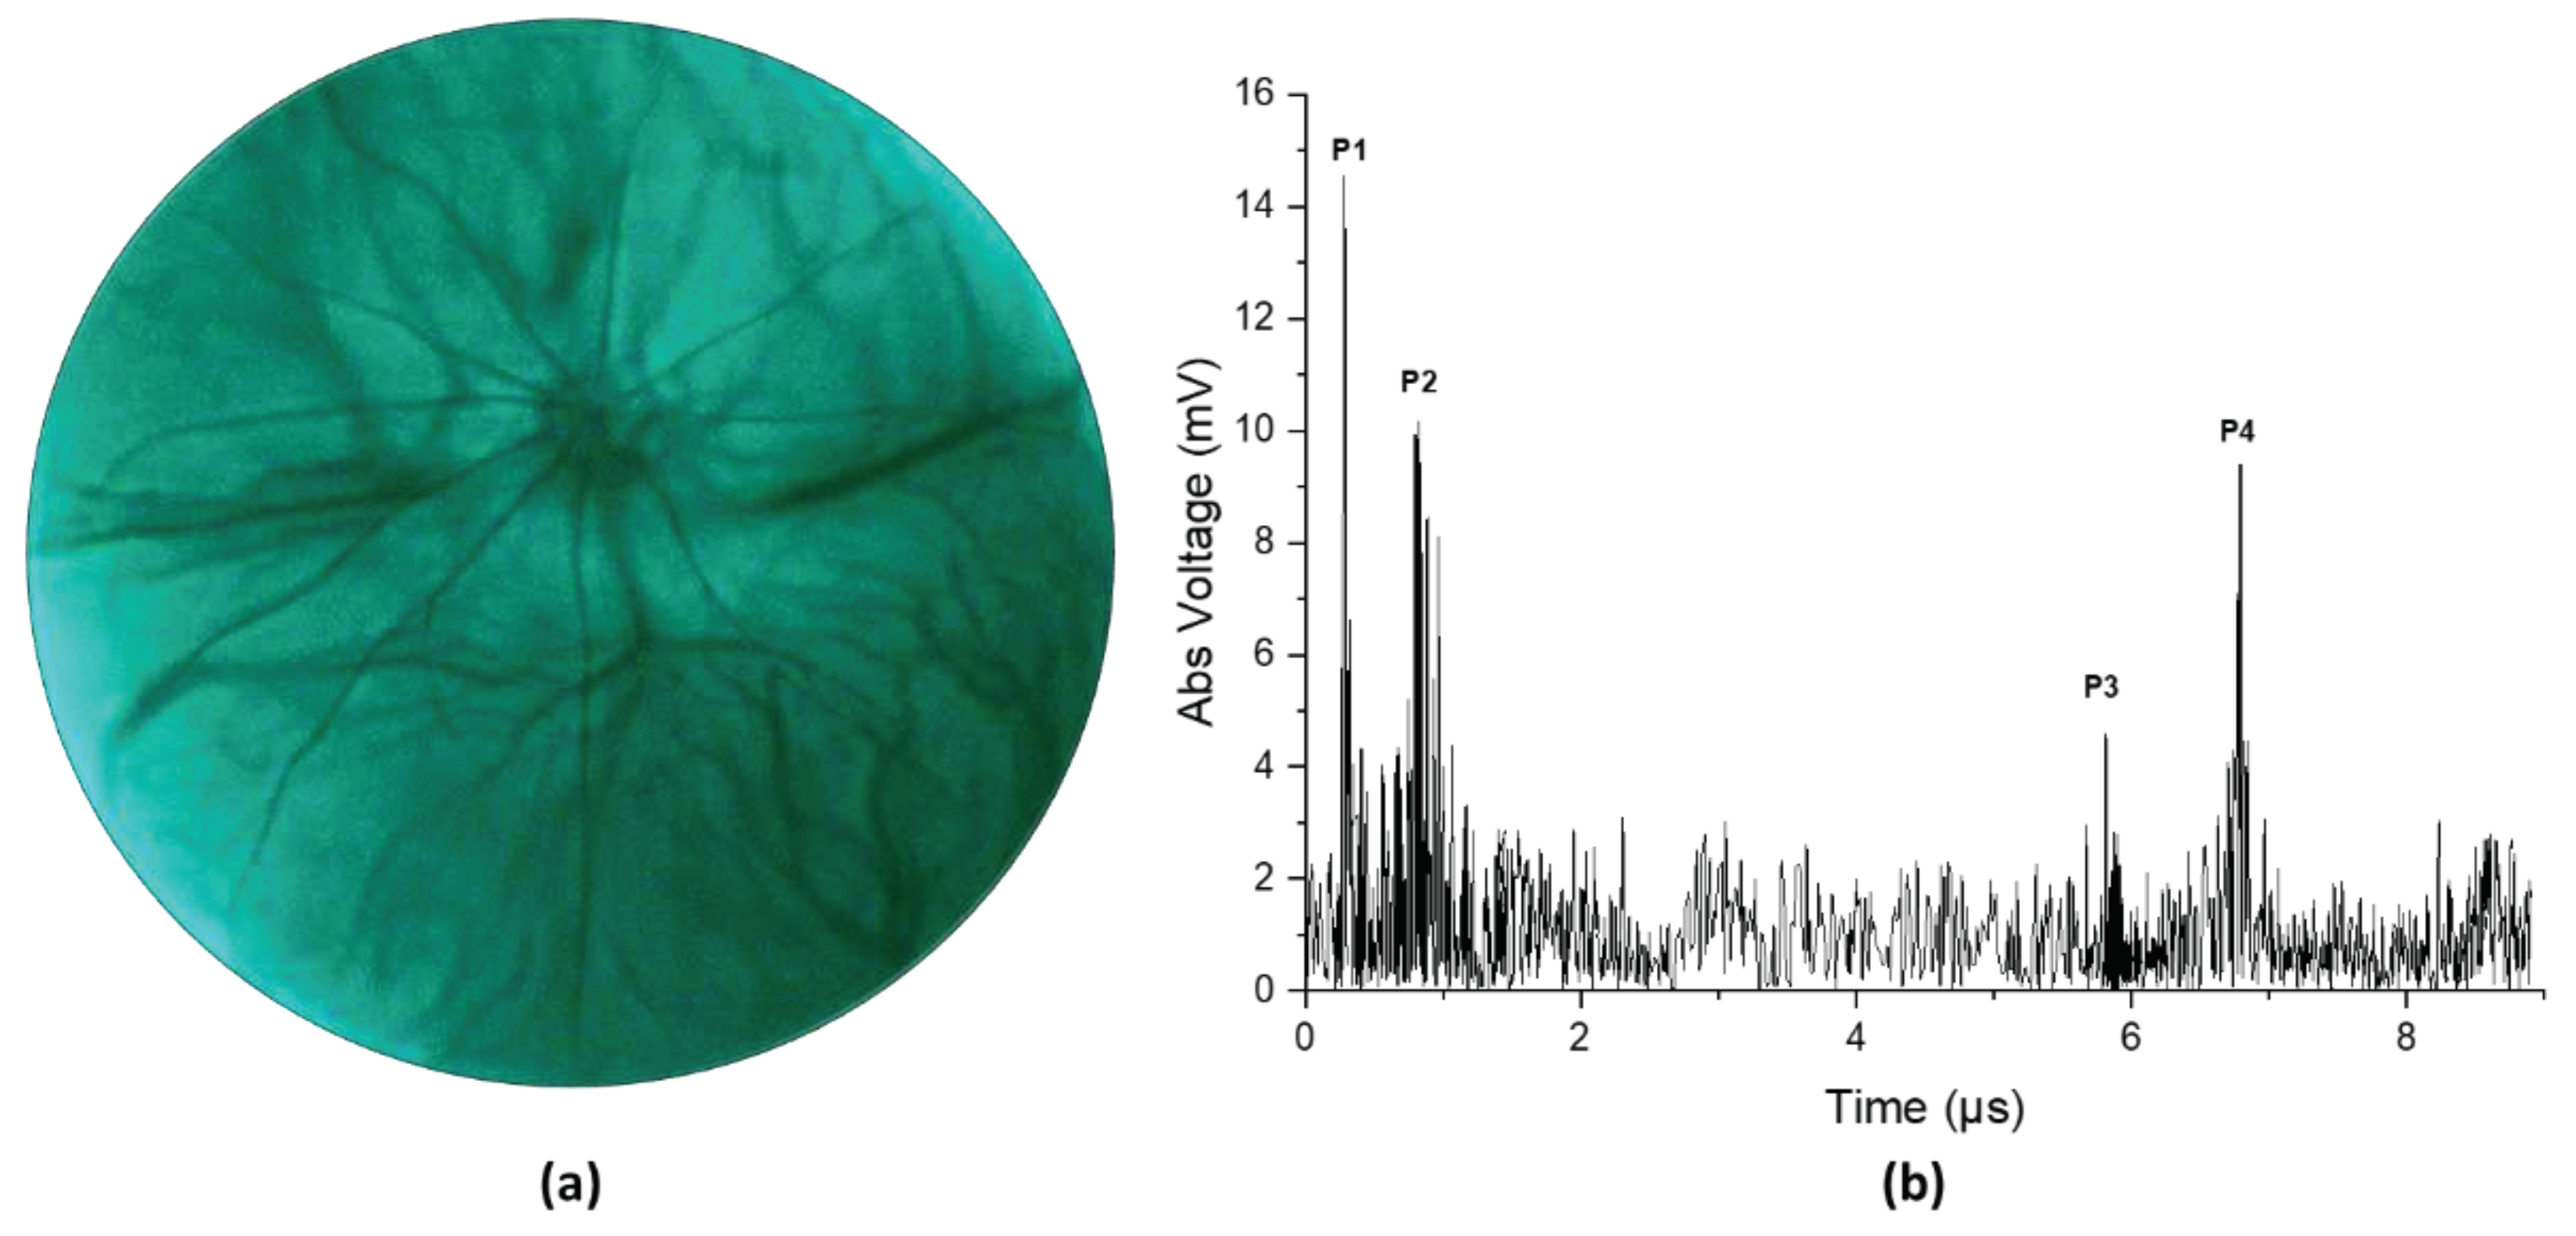
4. Discussion
5. Conclusions
6. Patents
Author Contributions
Funding
Institutional Review Board Statement
Data Availability Statement
Acknowledgments
Conflicts of Interest
References
- Chien, J.L.; Sioufi, K.; Surakiatchanukul, T.; Shields, J.A.; Shields, C.L. Choroidal nevus: a review of prevalence, features, genetics, risks, and outcomes. Current opinion in ophthalmology 2017, 28, 228–237. [Google Scholar] [CrossRef]
- Solnik, M.; Paduszyńska, N.; Czarnecka, A.M.; Synoradzki, K.J.; Yousef, Y.A.; Chorągiewicz, T.; Rejdak, R.; Toro, M.D.; Zweifel, S.; Dyndor, K.; et al. Imaging of Uveal Melanoma-Current Standard and Methods in Development. Cancers 2022, 14. [Google Scholar] [CrossRef]
- Krantz, B.A.; Dave, N.; Komatsubara, K.M.; Marr, B.P.; Carvajal, R.D. Uveal melanoma: epidemiology, etiology, and treatment of primary disease. Clinical ophthalmology (Auckland, N.Z.) 2017, 11, 279–289. [Google Scholar] [CrossRef] [PubMed]
- Cruz-Gálvez, C.C.; Ordaz-Favila, J.C.; Villar-Calvo, V.M.; Cancino-Marentes, M.E.; Bosch-Canto, V. Retinoblastoma: Review and new insights. Frontiers in oncology 2022, 12, 963780. [Google Scholar] [CrossRef] [PubMed]
- Shields, C.L.; Furuta, M.; Berman, E.L.; Zahler, J.D.; Hoberman, D.M.; Dinh, D.H.; Mashayekhi, A.; Shields, J.A. Choroidal nevus transformation into melanoma: analysis of 2514 consecutive cases. Archives of ophthalmology (Chicago, Ill.: 1960). 2009, 127, 981–987. [Google Scholar] [PubMed]
- Yao, X.; Son, T.; Ma, J. Developing portable widefield fundus camera for teleophthalmology: Technical challenges and potential solutions. Experimental biology and medicine (Maywood, N.J.) 2022, 247, 289–299. [Google Scholar] [CrossRef] [PubMed]
- Nagiel, A.; Lalane, R.A.; Sadda, S.R.; Schwartz, S.D. ULTRA-WIDEFIELD FUNDUS IMAGING: A Review of Clinical Applications and Future Trends. Retina (Philadelphia, Pa.) 2016, 36, 660–678. [Google Scholar] [CrossRef]
- Quinn, N.; Csincsik, L.; Flynn, E.; Curcio, C.A.; Kiss, S.; Sadda, S.R.; Hogg, R.; Peto, T.; Lengyel, I. The clinical relevance of visualising the peripheral retina. Progress in Retinal and Eye Research 2019, 68, 83–109. [Google Scholar] [CrossRef] [PubMed]
- Singh, P.; Singh, A. Choroidal melanoma. Oman journal of ophthalmology 2012, 5, 3–9. [Google Scholar] [CrossRef]
- Torres, V.L.; Brugnoni, N.; Kaiser, P.K.; Singh, A.D. Optical coherence tomography enhanced depth imaging of choroidal tumors. American journal of ophthalmology 2011, 151, 586–593. [Google Scholar] [CrossRef]
- Say, E.A.; Shah, S.U.; Ferenczy, S.; Shields, C.L. Optical coherence tomography of retinal and choroidal tumors. Journal of ophthalmology 2011, 2011, 385058. [Google Scholar] [CrossRef]
- Gündüz, K. Gündüz, K.; Yeşiltaş; YS. Diagnostic Techniques: Angiography. in Singh, A.D., and Damato, B.E. (Eds.): ‘Clinical Ophthalmic Oncology: Basic Principles’ (Springer International Publishing, 2019), pp. 209–234.
- Midena, E.; Frizziero, L.; Pilotto, E.; Parrozzani, R. Diagnostic Techniques: Autofluorescence. in Singh, A.D., and Damato, B.E. (Eds.): ‘Clinical Ophthalmic Oncology: Basic Principles’ (Springer International Publishing, 2019), pp. 257-270.
- Lorek, B.H.; Aronow, M.E.; Singh, A.D. Diagnostic Techniques: Ultrasonography. in Singh, A.D., and Damato, B.E. (Eds.): ‘Clinical Ophthalmic Oncology: Basic Principles’ (Springer International Publishing, 2019), pp. 271–293.
- Kadakia, A.; Zhang, J.; Yao, X.; Zhou, Q.; Heiferman, M.J. Ultrasound in ocular oncology: Technical advances, clinical applications, and limitations. Experimental biology and medicine (Maywood, N.J.) 2023, 248, 371–379. [Google Scholar] [CrossRef]
- Safari, A.; Zhou, Q.; Zeng, Y.; Leber, J.D. Advances in development of Pb-free piezoelectric materials for transducer applications. Japanese Journal of Applied Physics 2023, 62, SJ0801. [Google Scholar] [CrossRef]
- Sun, Y.; Jiang, L.; Chen, R.; Li, R.; Kang, H.; Zeng, Y.; Yan, Y.; Priya, S.; Zhou, Q. Design and Fabrication of 15-MHz Ultrasonic Transducers Based on a Textured Pb(Mg1/3Nb2/3)O3-Pb(Zr, Ti)O3 Ceramic. IEEE Transactions on Ultrasonics, Ferroelectrics, and Frequency Control 2022, 69, 3095–3101. [Google Scholar] [CrossRef]
- Li, R.; Zeng, Y.; Sun, X.-x.; Li, C.; Li, R.; Zheng, T.; Jiang, L.; Wu, J. Multidimensional synergy-induced high piezoelectricity and reliability KNN piezoceramics for high-frequency ultrasonic transducers. Science China Materials 2023, 66, 686–695. [Google Scholar] [CrossRef]
- Fonkeu, Y.; Singh, N.; Hayden-Loreck, B.; Singh, A.D. Diagnostic A-Scan of Choroidal Melanoma: Automated Quantification of Parameters. Ocular oncology and pathology 2019, 5, 350–357. [Google Scholar] [CrossRef]
- Silverman, R.H. Focused ultrasound in ophthalmology. Clinical ophthalmology (Auckland, N.Z.) 2016, 10, 1865–1875. [Google Scholar] [CrossRef] [PubMed]
- Chopdar, A.; Aung, T. Multimodal retinal imaging. (JP Medical Ltd, 2014) 2014.
- Ossoinig, K.C. Standardized echography: basic principles, clinical applications, and results. International ophthalmology clinics 1979, 19, 127–210. [Google Scholar] [CrossRef] [PubMed]
- Ossoinig, K.C. Quantitative echography--the basis of tissue differentiation. Journal of clinical ultrasound: JCU 1974, 2, 33–46. [Google Scholar] [CrossRef] [PubMed]
- Singh, N.; Fonkeu, Y.; Lorek, B.H.; Singh, A.D. Diagnostic A-Scan of Choroidal Tumors: Comparison of Quantified Parameters. Ocular oncology and pathology 2019, 5, 358–368. [Google Scholar] [CrossRef] [PubMed]
- Campagnoli, T.R.; Medina, C.A.; Singh, A.D. CHOROIDAL MELANOMA INITIALLY TREATED AS HEMANGIOMA: DIAGNOSTIC AND THERAPEUTIC CONSIDERATIONS. Retinal cases & brief reports 2016, 10, 175–182. [Google Scholar]
- ‘Factors Predictive of Growth and Treatment of Small Choroidal Melanoma: COMS Report No. 5. Archives of Ophthalmology 1997, 115, 1537–1544. [Google Scholar]
- Chen, R.; Jiang, L.; Zhang, T.; Matsuoka, T.; Yamazaki, M.; Qian, X.; Lu, G.; Safari, A.; Zhu, J.; Shung, K.K.; et al. Eco-Friendly Highly Sensitive Transducers Based on a New KNN–NTK–FM Lead-Free Piezoelectric Ceramic for High-Frequency Biomedical Ultrasonic Imaging Applications. IEEE Transactions on Biomedical Engineering 2019, 66, 1580–1587. [Google Scholar] [CrossRef]
- Alterini, T.; Díaz-Doutón, F.; Burgos-Fernández, F.J.; González, L.; Mateo, C.; Vilaseca, M. Fast visible and extended near-infrared multispectral fundus camera. Journal of biomedical optics 2019, 24, 1–7. [Google Scholar]
- Lozano, D.C.; Twa, M.D. Development of a Rat Schematic Eye From In Vivo Biometry and the Correction of Lateral Magnification in SD-OCT Imaging. Investigative Ophthalmology & Visual Science 2013, 54, 6446–6455. [Google Scholar]
- Wu, Y.; Luo, X.; Feng, Y.; Yang, J.; Fan, H.; Cen, X.; Li, W. Comparison of the accuracy of axial length measurement by different imaging methods in Sprague Dawley rats. Frontiers in Neuroscience, 2023, 16. 2023. [Google Scholar]
- Remtulla, S.; Hallett, P.E. A schematic eye for the mouse, and comparisons with the rat. Vision research 1985, 25, 21–31. [Google Scholar] [CrossRef] [PubMed]
- Hoffer, K.J. Ultrasound velocities for axial eye length measurement. Journal of cataract and refractive surgery 1994, 20, 554–562. [Google Scholar] [CrossRef] [PubMed]
- Shields, C.L.; Shields, J.A.; Kiratli, H.; De Potter, P.; Cater, J.R. Risk factors for growth and metastasis of small choroidal melanocytic lesions. Ophthalmology 1995, 102, 1351–1361. [Google Scholar] [CrossRef] [PubMed]
- Carpenter, C.L.; Kim, A.Y.; Kashani, A.H. Normative Retinal Thicknesses in Common Animal Models of Eye Disease Using Spectral Domain Optical Coherence Tomography. in Editor (Ed.)^(Eds.): ‘Book Normative Retinal Thicknesses in Common Animal Models of Eye Disease Using Spectral Domain Optical Coherence Tomography’ (Springer International Publishing, 2018, edn.), pp. 157–166.
- Toslak, D.; Thapa, D.; Chen, Y.; Erol, M.K.; Paul Chan, R.V.; Yao, X. Trans-palpebral illumination: an approach for wide-angle fundus photography without the need for pupil dilation. Opt. Lett. 2016, 41, 2688–2691. [Google Scholar] [CrossRef]
- Rossi, A.; Rahimi, M.; Le, D.; Son, T.; Heiferman, M.J.; Chan, R.V.P.; Yao, X. Portable widefield fundus camera with high dynamic range imaging capability. Biomedical optics express 2023, 14, 906–917. [Google Scholar] [CrossRef]
- Toslak, D.; Liu, C.; Alam, M.N.; Yao, X. Near-infrared light-guided miniaturized indirect ophthalmoscopy for nonmydriatic wide-field fundus photography. Opt. Lett. 2018, 43, 2551–2554. [Google Scholar] [CrossRef] [PubMed]
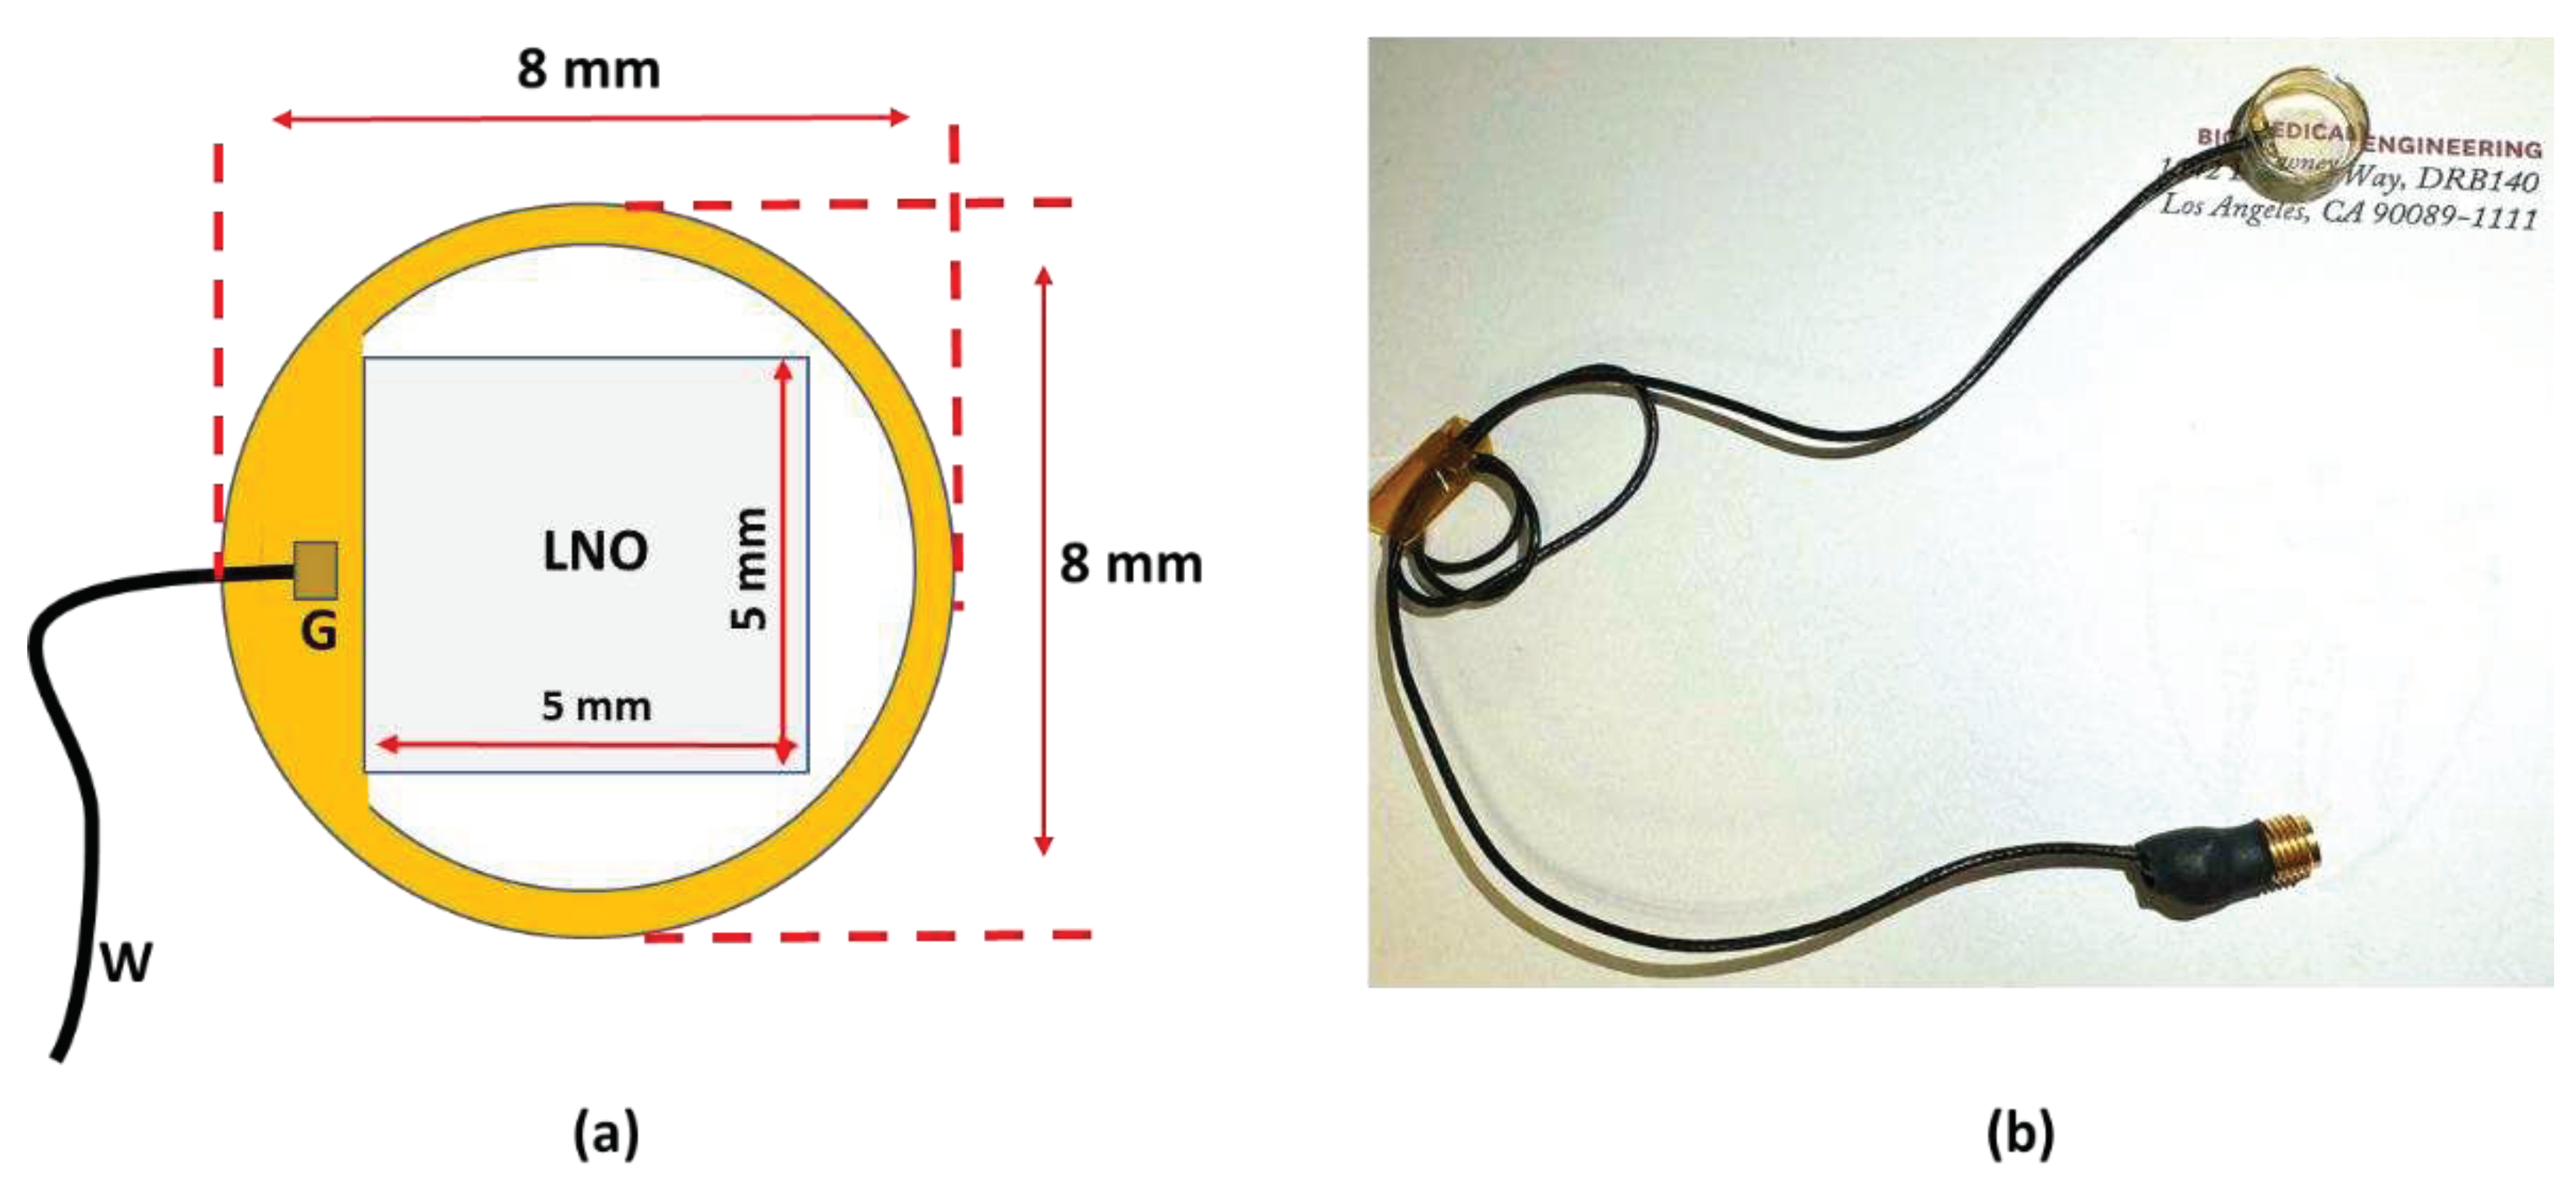
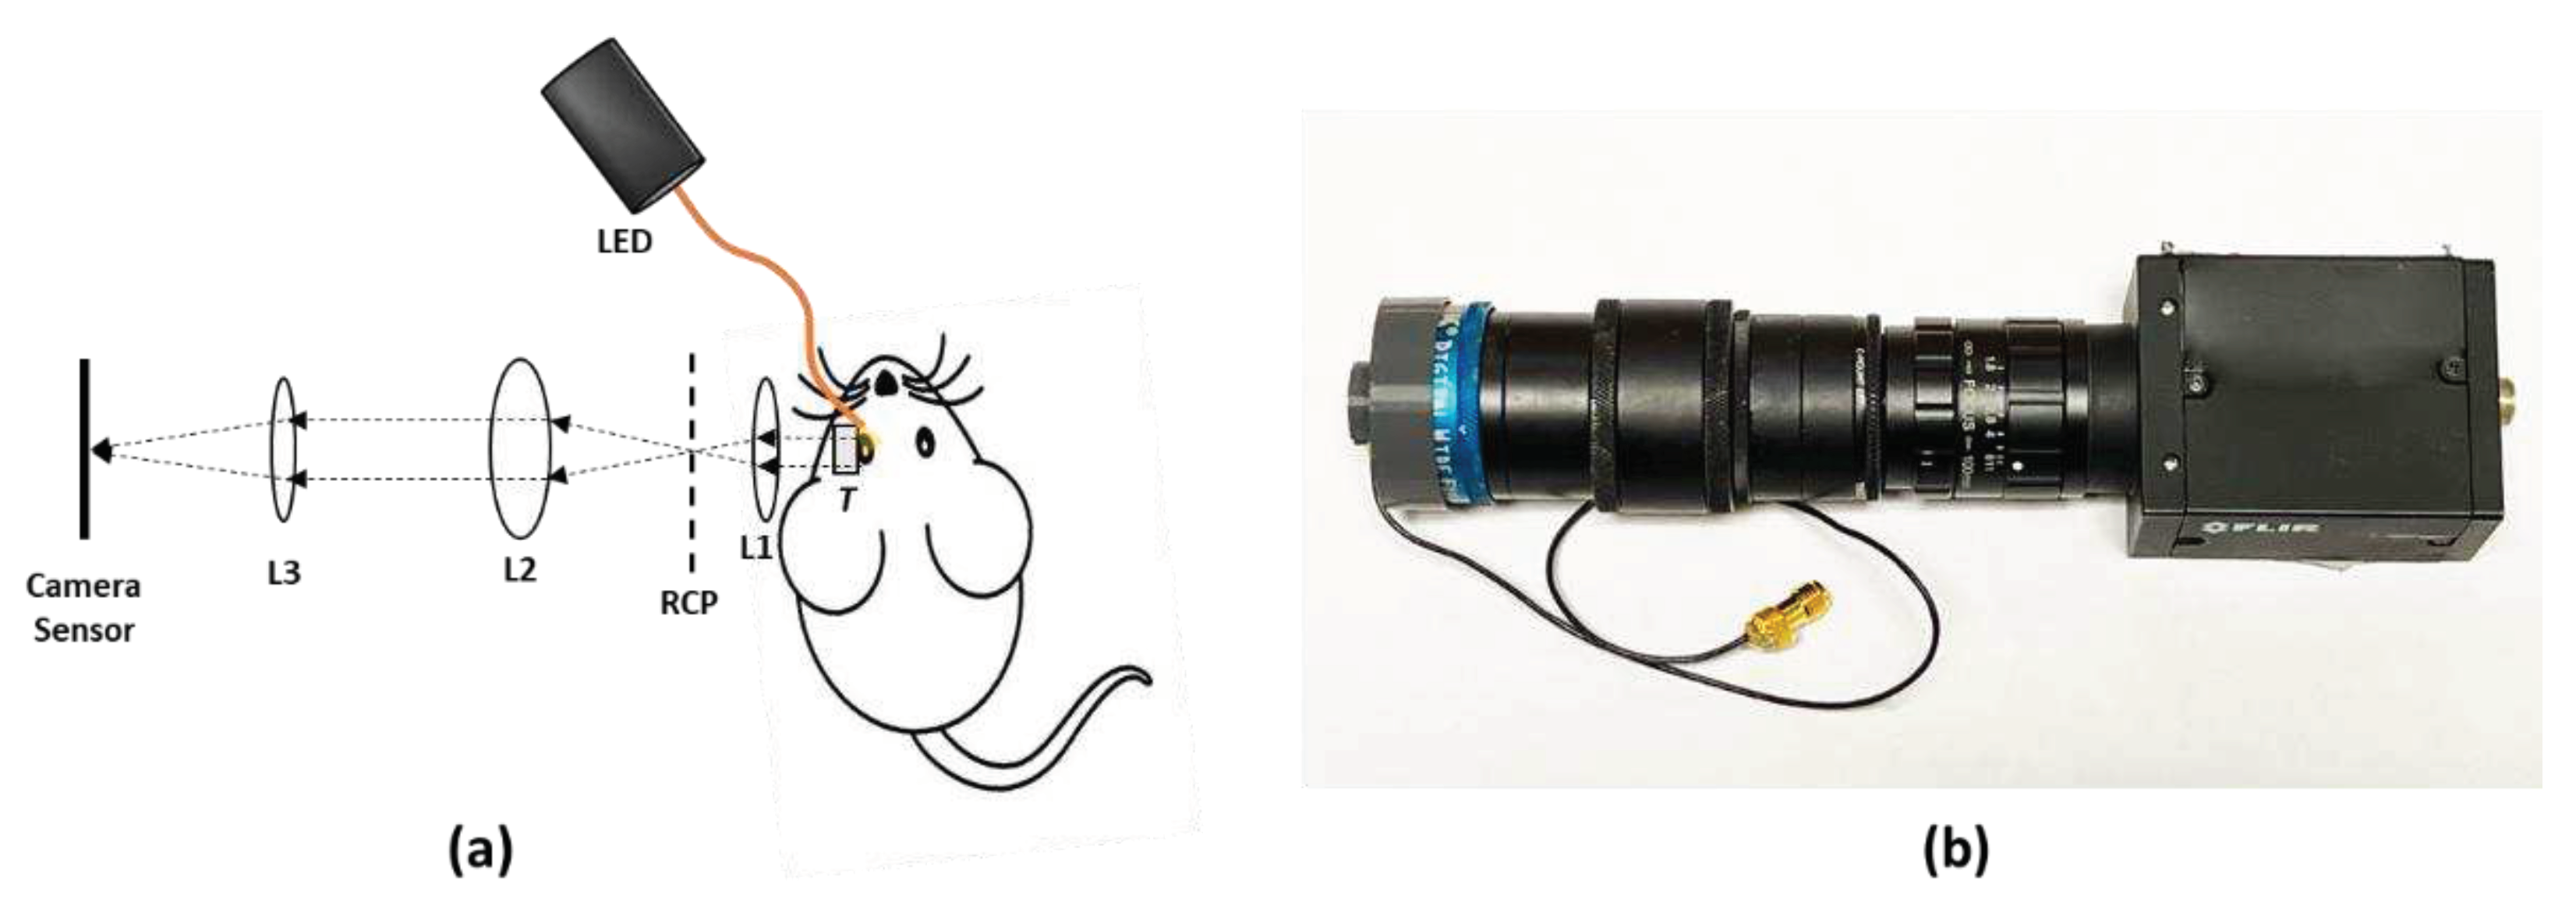
| Parameter | Value |
|---|---|
| Center frequency | 40 MHz |
| Surface area | 5 mm x 5 mm |
| Lithium Niobate (LNO) thickness | 70 µm |
| Matching layer (Parylene) thickness | 10 µm |
| Backing layer (Epo-Tek 301) thickness | 5 mm |
Disclaimer/Publisher’s Note: The statements, opinions and data contained in all publications are solely those of the individual author(s) and contributor(s) and not of MDPI and/or the editor(s). MDPI and/or the editor(s) disclaim responsibility for any injury to people or property resulting from any ideas, methods, instructions or products referred to in the content. |
© 2024 by the authors. Licensee MDPI, Basel, Switzerland. This article is an open access article distributed under the terms and conditions of the Creative Commons Attribution (CC BY) license (http://creativecommons.org/licenses/by/4.0/).


