1. Introduction
In the last years there has been a great progress in the development of unmanned aerial vehicles (UAVs) like quadrocopters and octocopters, especially regarding semi-autonomous or autonomous flight capabilities and increasing payload, due to which a drone became a carrier for intelligent sensors and materials for spying and attacking people and properties. Good and fast drones that can be used for illegal purposes are now affordable and easy to obtain, which is also reflected by the number of sold drones. According to a German research company, this market reached
$22.5 billion in 2020 and is expected to surpass
$42 billion by 2025 [
1]. The market is young, but is expected to continue growing until 2030 [
2]. Corresponding defense systems are however complex and expensive and effort and benefit are rarely in a good balance. There are many providers of anti-drone systems on the market and a lot on offer, which are advertised as powerful. But the reality looks different. Big and expensive radar devices are used, which can actually detect large flying objects far away, but for micro drones they either do not provide any detections in the short- and mid-range or cause many false detections. Radio surveillance systems offer a high detection range, but can only detect radio-controlled drones, which in the future will be, due to the usage of targeted drones, less and less used. What the prices look like is another question. MODEAS offers an economical solution for this prevailing gap, which can be used for various detection ranges and types of drones in open or complex environments.
2. System overview
The MODEAS experimental system [
3] was designed as a modular and scalable multisensorial system at Fraunhofer IOSB in Karlsruhe for detection and classification of approaching drones. Additionally, a suitable visualization on a map is available in order to support the decision-maker in selecting the appropriate defensive measures. The system currently consists of two networked sensor stations - radar and optical - and a control center, see
Figure 1. Additional sensors such as radio or acoustics can be also integrated in the system architecture.
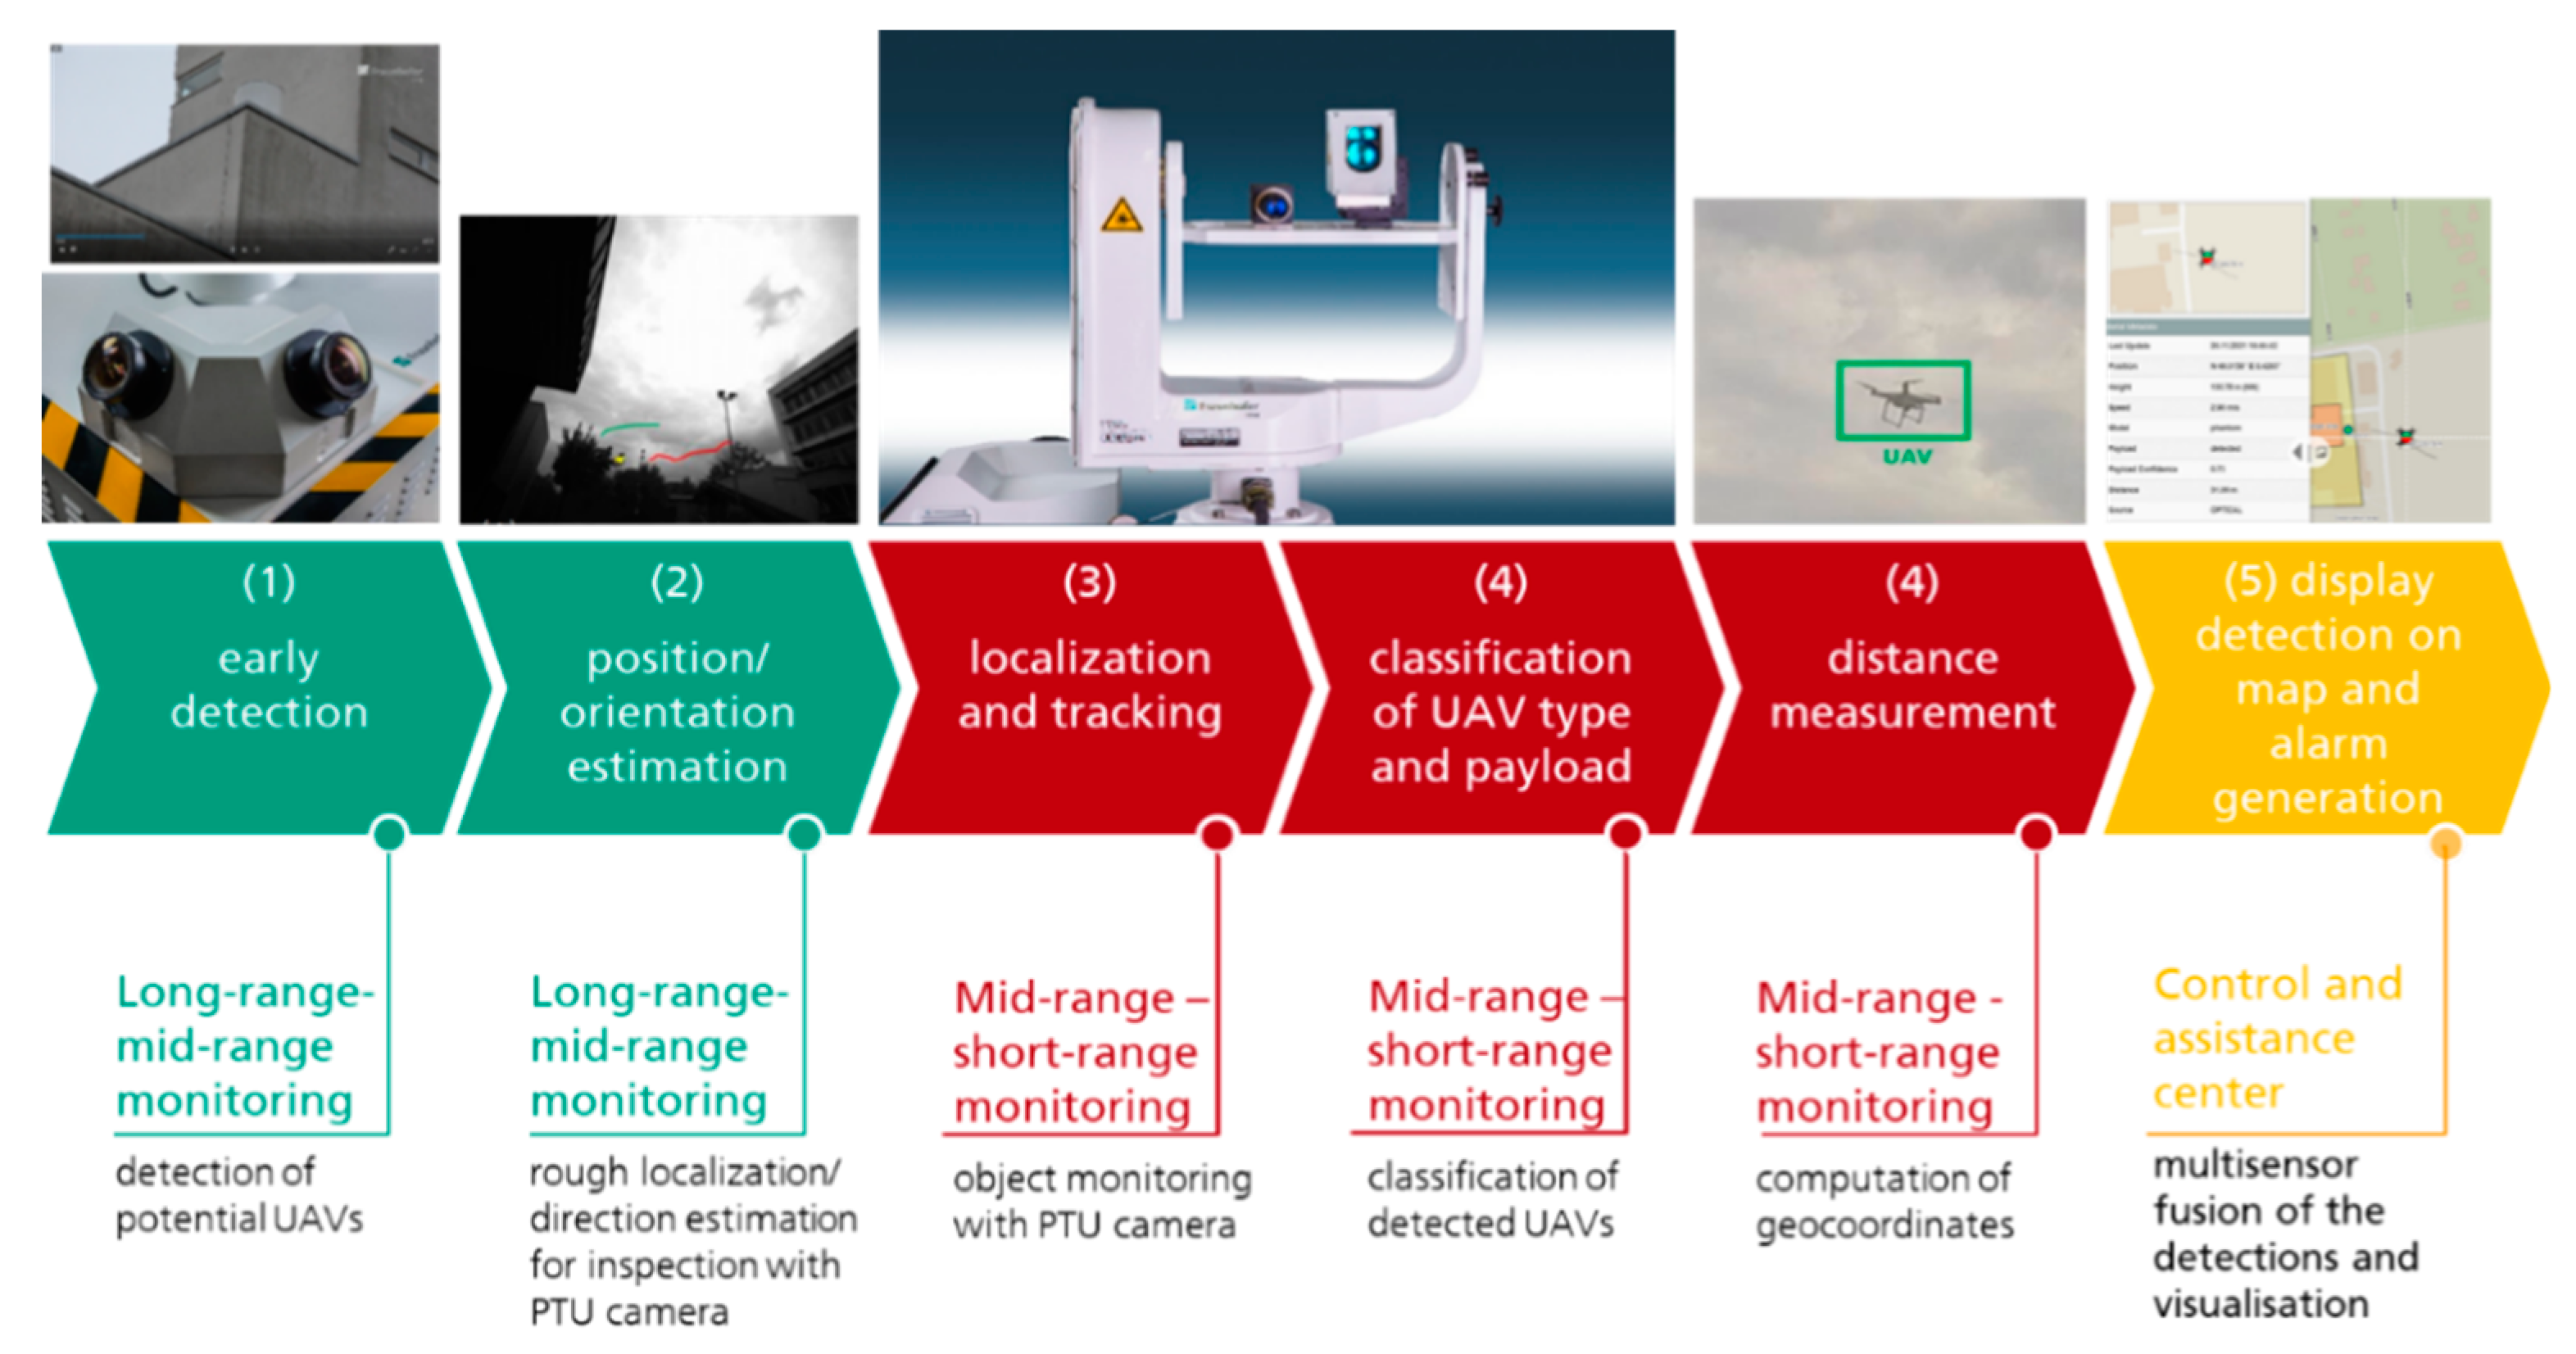
The processing workflow in MODEAS performs slew to cue tracking in two steps, see in
Figure 2 the green and red marked components. First, object candidates are detected with various sensors, like visual optical, radar, radio or acoustic sensors. Currently we use for the first detection four high-resolution (5120 x 5120 pixel) grayscale visual optical cameras, which offer full 360-degree observation within a distance up to several hundred meters and a commercial radar system with a detection range up to 5 kilometers. In a second step, the herewith produced potential candidates are one after another inspected by automatically directing a pan-tilt-unit (PTU), on which a full HD color camera and a laser rangefinder (LRF) are mounted, on the object. For this purpose, a convolutional neural network (CNN) is used to detect and coarse classify the object in the image of the PTU-camera as a UAV and discard false alarms due to clutter. Once a drone was recognized, the type and payload, if any, is determined with a CNN-based classifier and the distance from the ground station to the object measured with the LRF. All information is collected, fused and visualized on a 2D or 3D environmental map or situation representation based on the geo-coordinates of the drone. For this computation, the geo-position of the sensor station is automatically measured by an RTK GNSS sensor. Each processing step of the workflow is described in detail in the following sections.
3. Early detection and tracking of flying objects
As already mentioned in the previous section, early detection of flying objects can be performed by several types of sensors, each having their advantages and disadvantages. For long-range detection radar and radio sensors are best suited, whereas the radio detection is only suitable for radio-controlled drones. Radar detects drones accurately, but a direct sight is needed. Thus, drones flying low, in the blind spot of the radar, cannot be detected. Visual optical sensors perform better in such cases, but the detection range is shorter. Based on these insight gains, a radar and some optical sensors were integrated in MODEAS in order to combine their advantages. Each technology is explained in the following subsections.
3.1. Detection with radar (long- and mid-range)
The commercial drone detection system Elvira from Robin Radar
1 was, due to its long detection range and good classification, integrated in MODEAS. The radar operates in 2D space, i.e., there is no height information in the radar output data, only a rough estimation can be made by using the vertical beam angle and the distance. In the long-range the estimate is precise enough, but in the short- and mid-range the small vertical field of view is a disadvantage. Additionally, the radar requires an open view in the full 360-degree detection range, otherwise false detections are generated by surrounding constructions or vegetation. That’s why it must be placed on an elevated position, in our case, on the roof of a building, while the optical sensor station remains on the ground. Due to the distributed software architecture in MODEAS, the radar could be easily integrated as a separate sensor station.
The role of the radar is in MODEAS twofold: either it can be used to generate classified drone detections with a high confidence and feed these along with further attributes like position, speed and direction into the system to be fused with classified detections of the same drone made by other sensor stations. Or, for the mid- and short-range, to choose the detections of the radar for guiding the PTU, as described in
Section 2, to inspect the object in the high-resolution image of the PTU-camera and extract further information like model or recognize whether the drone carries a payload below. In fact, the radar system, due to micro-Doppler, provides a lower rate of false alarms with its integrated UAV classification than the CNN. But false alarms could be observed on technical objects, like, e.g., construction cranes. However, with this sensor combination, classified detections of the radar can be enriched with visual-based information, an idea which was followed up in MODEAS.
3.2. Detection with visual optical wide-angle cameras (mid- and short-range)
The early detection with visual optical cameras performs in two steps: first, object candidates are discovered, these are then tracked and the tracks analyzed and ranked, such that false detections could be lower prioritized than real drones for the further inspection with the PTU-camera.
3.2.1. Detection of object candidates
Since drones should be early detected in the image of a visual optical camera, when they are just 1-2 pixels wide, and their size grows, as they are approaching, one must algorithmically distinguish between short- and mid-range object detection. We classify the distance of a drone to be mid-range, if the drone is visible in the image as a small dark or bright spot. Short-range is reached, if the shape of the drone in the image exceeds a certain pixel size. In order to reach a high robustness level, these two cases must be processed by different detectors, which are described in the following paragraphs. To adapt the system to practical scenarios, both detectors can be switched on or off independently from each other.
The mid-range detector captures drones as soon as they are visible as small spots in the image, but since the size of an approaching drone may grow rapidly in the image, it must cope with larger sizes as well. Because detection of spots of different sizes, which are brighter or darker than the surrounding background, is a time-consuming task [
4], only spots with a diameter up to 15 pixels are analyzed, a threshold which was defined experimentally. For each detected spot, a bounding box specifying the position in the image and the size of the found object is generated. In order to keep the implementation independent of the used camera, a GPU implementation of the detector as designed in [
5] for a NVIDIA GeForce RTX 3060 graphic card was integrated in MODEAS. Experimentally, with the visual optical overview cameras integrated in the system, a detection range up to some hundred meters could be observed.
Drones with a diameter greater than 15 pixels in the image are detected with a short-range detector. The algorithm is based on background modelling with codebook and performs structural adaptive image differencing to detect changes in the image against the background in the past, see [
6,
7]. For this purpose, the behavior of the scene background is registered, especially movement caused by grass, stalks, flowers, or tree leaves in the wind, or by driving cars, which belong to a normal background behavior and hence must be filtered out. Nevertheless, clouds, moving with high speed or showing strong appearance changes over time, produce more global effects in the image and cannot be captured by the rather locally operating codebook and thus are leading to false alarms. Therefore, a shape analysis of image changes is performed as a post processing step to filter out most of such false alarms. This selection is based on the observation, that changes in clouds mostly have a typical shape or low sparseness characteristics. As final result, the algorithm registers and locates changes in the image mostly stemming from moving objects, each being specified by a bounding box holding the position and size in the image.
3.2.2. Trajectory Processing
The detections of the mid-range or short-range detector are tracked over time by combining the detections to temporal trajectories based on a first order drone motion model [
5,
6,
7]. In order to reduce the impact of false detections due to vegetation, for example, certain regions in the image can be masked out manually, if desired, to be excluded from trajectory processing.
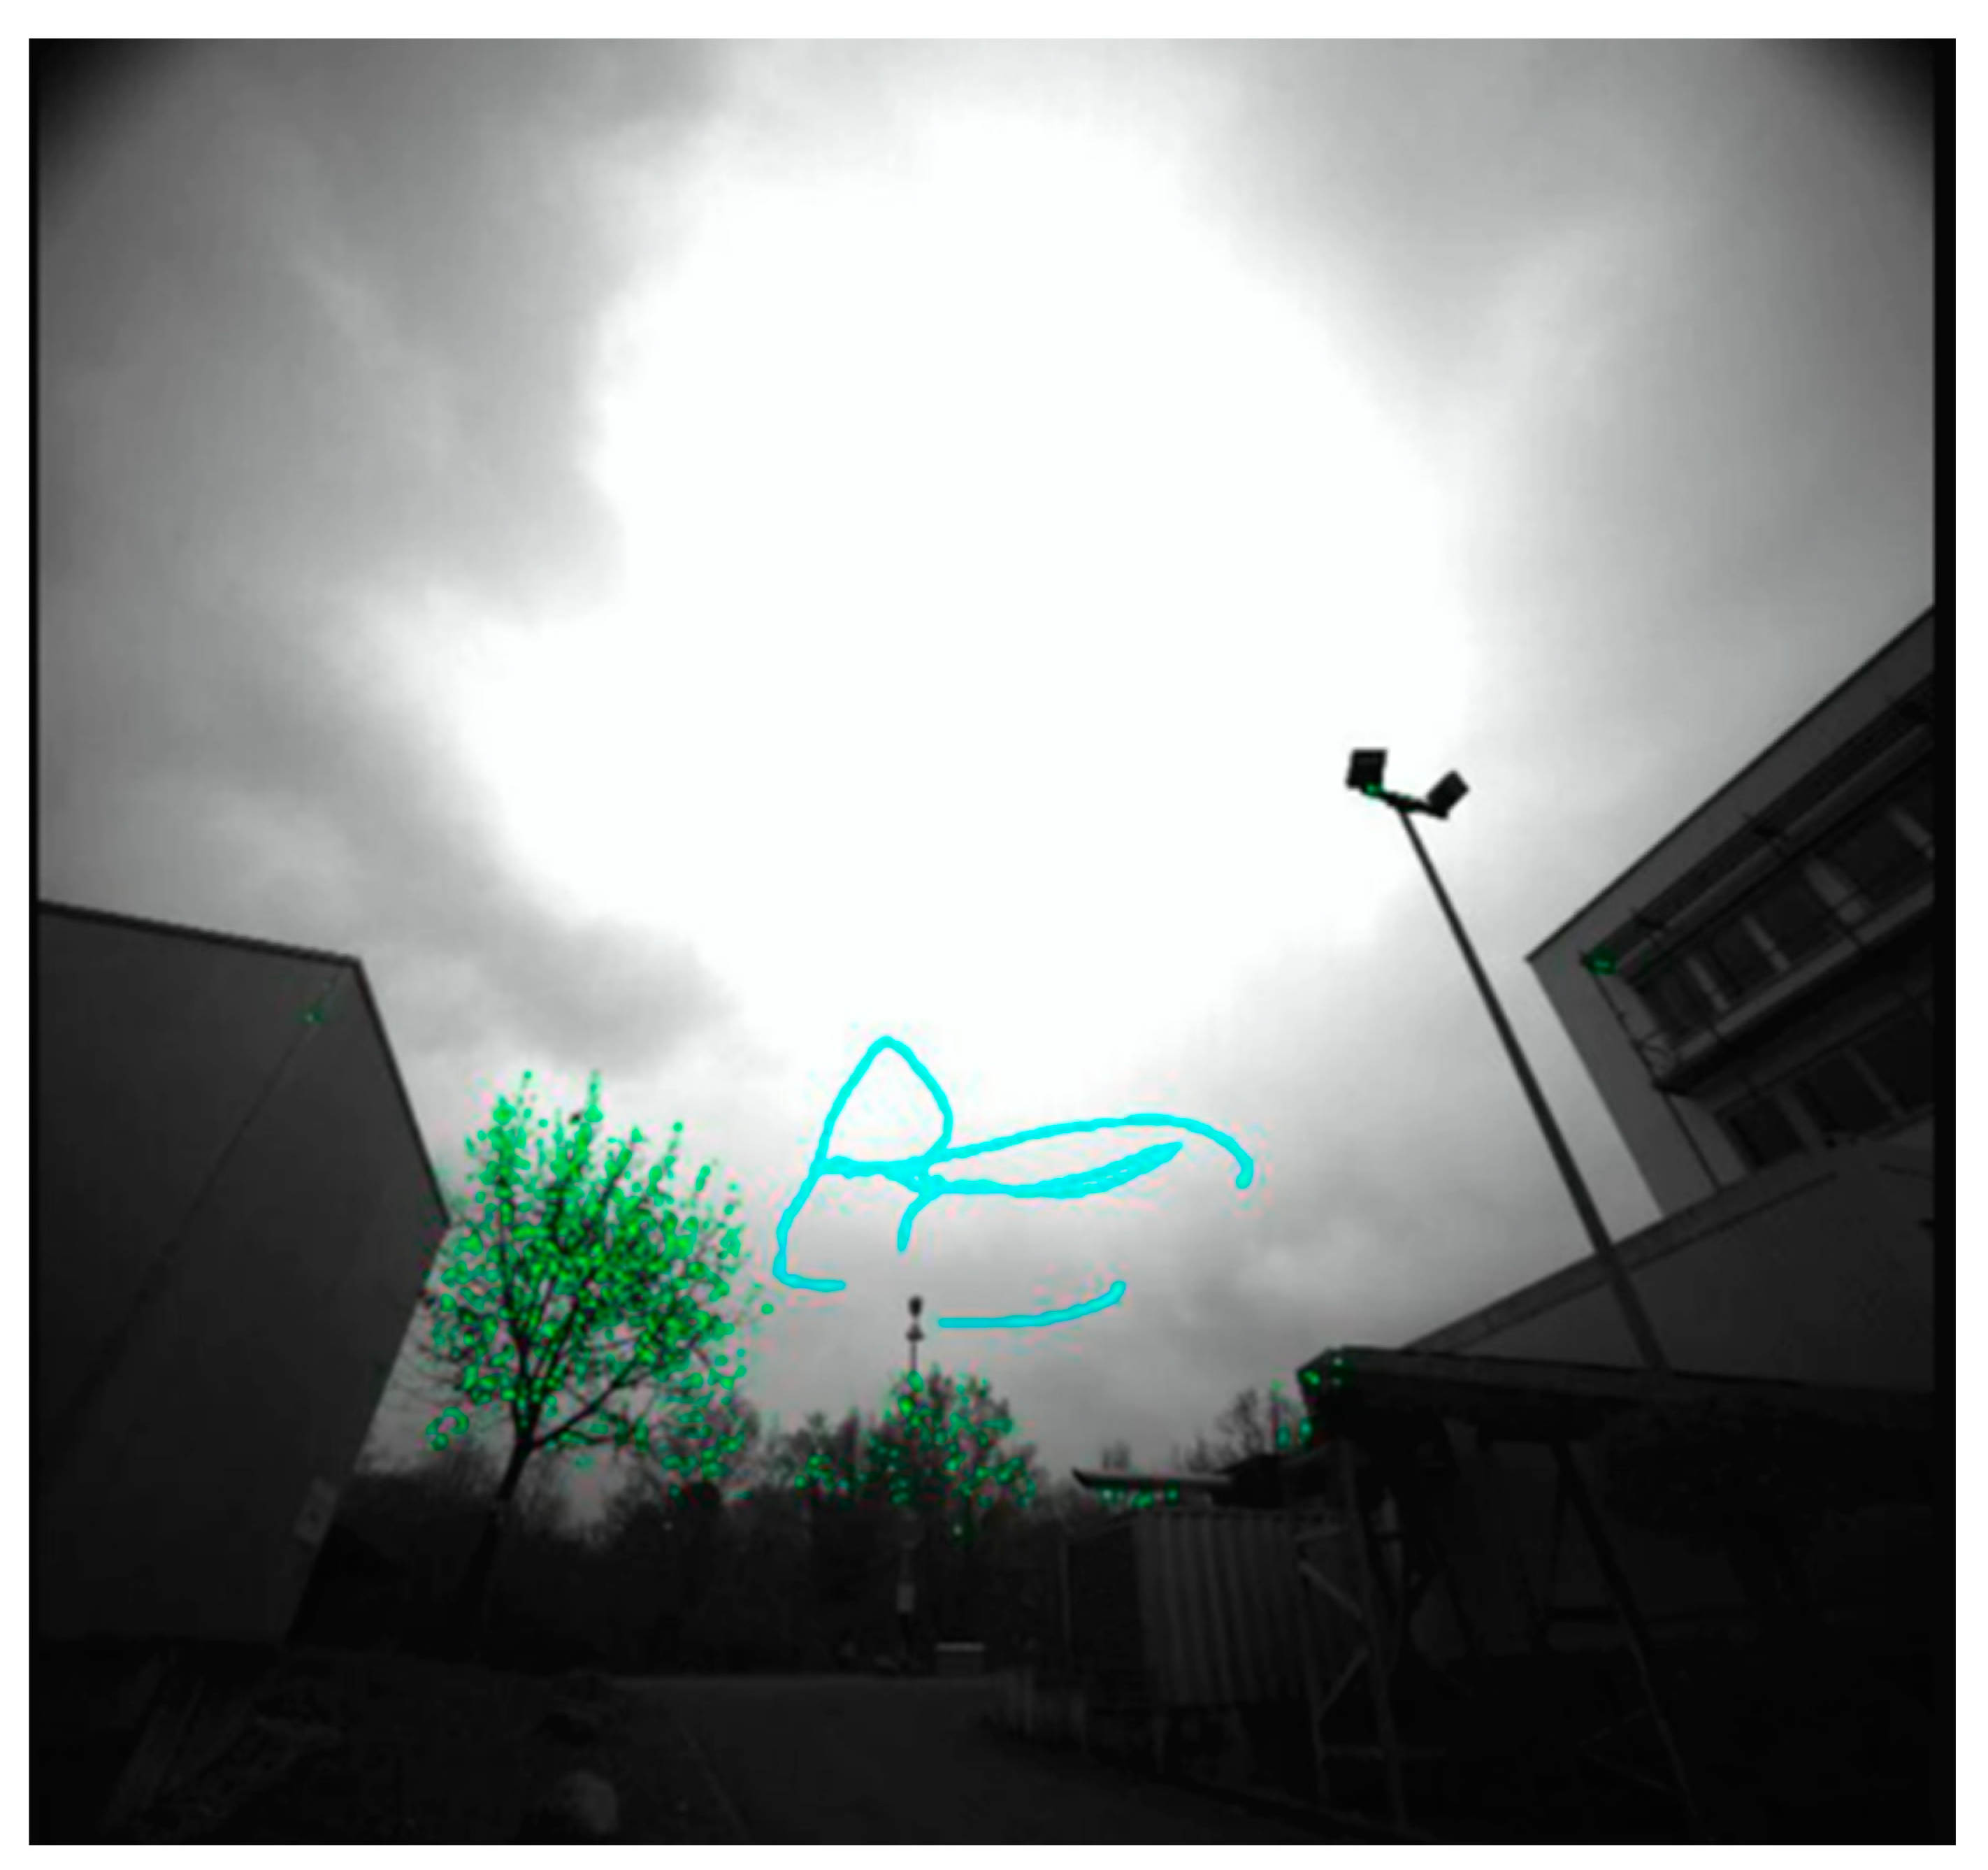
Figure 3 shows an example in which the buildings and the trees were masked out. For the mid-range detections in the tree (marked green) no trajectories are processed, only for the two moving objects in the sky trajectories are built up (marked light blue). Since spots in the image are quite unspecific features, they cannot be only caused by small flying drones. Moving leaves in trees, bushes or cloud formations in some weathering situations may lead to spot detections as well. If such regions would be masked out, also the detection of real drones flying in such environments would be prevented. Therefore, a trajectory analysis is performed to reduce such false alarms. The analysis is based on the observation that most trajectories generated by false alarms either seem to capture a nearly static object or the captured object only jumps around over time leading to a trajectory with a lot of spikes. This occurs often in vegetation, where the wind produces seemingly moving, randomly appearing and disappearing spots.
However, drones can also easily produce trajectories similar to those caused by false alarms. That’s why no trajectory should be excluded from further consideration. In order to deal with such cases, a trajectory ranking is computed using the heuristic in [
4], which, based on the number and strength of the spikes, trajectory length, bounding box of the trajectory and current speed, tries to higher prioritize trajectories produced by real drone detections than those due to false alarms, such that most drones can quickly be found.
4. Drone inspection and tracking with high-resolution pan-tilt-camera
As soon as object candidates are detected, a tracking management component triggers their inspection with the high-resolution PTU-camera. For each object, the PTU is continuously redirected, such that the flying object is captured, and then constantly kept for some seconds in the center of the image of the PTU-camera to be further classified by a CNN algorithm. Each step of the tracking by detection loop with the PTU-camera is explained in the following subsections.
4.1. Tracking management
To further analyze the early detections with a PTU-system, all these trajectories described in Subsection 3.2.2 are collected in a data structure to capture the current situation of potential drone candidates. As soon as there is a new object detection in this data structure stemming from the radar, it is selected for closer observation with the PTU-camera. Otherwise, the trajectory from a visual optical sensor station is selected, which has the highest trajectory ranking among all candidates and was not selected for closer observation so far.
In both cases, the current object's position is converted in angle positions of the PTU, such that the PTU can automatically be directed to capture this object in the image of the high-resolution PTU-camera, which is mounted well aligned with the PTU coordinate system. The overview camera system and the PTU were calibrated with respect to the local sensor station coordinate system, such that positions can be easily transformed from one system into another. Since radar detections are generated in WGS84 (World Geodetic System 1984) coordinates, they have to be converted in angle positions of the PTU. For this purpose, the geo-position of the sensor station, on which the PTU is mounted, is determined based on three RTK (Real Time Kinematics) GNSS (Global Navigation Satellite System) receivers. One operates as a base and the other two as rovers in a moving base RTK system. By mounting antennas of the three systems on top of the sensor station, the rover antennas on the pitch and roll axis, respectively, it is possible to measure the distance between the rovers and the base. These distances then can be used to calculate the orientation of the whole system. With the used RTK chipsets (UBlox Zed F9P) it is also possible to use the base as rover in another Fixed Base RTK system simultaneously, which will result in a precise absolute localization. Thus, a fully automatic calibration of the sensor station is enabled with the described procedure.
A CNN classifier evaluates a couple of recorded images to check, if the candidate is a drone and, according to the result, the selected trajectory is marked as a UAV or something else. If it is a UAV, it is tracked with the PTU-camera in a hardware control loop for a couple of seconds, i.e., the PTU is moved while the CNN detector computes the UAV position in the image to control the movement. During the tracking, a CNN classifier tries to determine the model of the drone and also whether it carries a payload below or not. Both knowledge (of model type and payload) help to assess the drone’s dangerousness. Simultaneously, the LRF measures the UAV distance from the sensor station.
For this purpose, the LRF is mounted on the PTU next to the camera, such that it keeps the orientation to the center of the camera image, also when pan and tilt angles are continuously changing during drone tracking. As soon as the drone is tracked by the PTU, it is captured in the center of the camera image and the exact drone distance
can be measured with the LRF. This allows then to compute the UAV size
in the scene (in centimeters) according to the following formula:
where
is the opening angle of the camera,
is the UAV size in pixels and
is the resolution of the camera image. This information can be further on used to estimate the distance of the UAV, in case that the LRF does not hit the drone.
The integrated LRF of class 1 works at a wavelength of 1.5 µm and is capable to measure distances of up to several kilometers when pointed to an extended diffuse reflecting target of medium reflectance. Depending on individual geometric and surface properties of a UAV we could observe a detection range of 0.5 km up to 1.0 km. The true pulse time of flight working principle of the LRF enables it to recognize several targets in different distances and specially to distinguish objects comprising a small cross section like UAV from the more intense signal of an extended background. A distance resolution of below 1 m and a repetition rate of up to 25 Hz combined with the angle information from the tracking system allow for the calculation of a 3D trajectory and flight velocity of a UAV.
To calculate the exact scene position of a detected and classified UAV, the position of the UAV in the image of the PTU-camera has to be transferred in angle values of the PTU and based on the estimated or measured UAV distance and geo-position of the sensor station be further converted to WGS84 coordinates. For this transformation, a reference ellipsoid is used. The parameters of the reference ellipsoid are redefined at regular intervals. To calculate the WGS84 coordinates, the data from the moving base RTK system on the sensor station is first transferred into a rotation matrix. After the pan and tilt values have also been converted into a rotation matrix, the WGS84 coordinates are calculated.
After tracking a UAV with the PTU-system, the next candidate in the list of detected objects is chosen to be inspected. This is done until all detected objects are classified. In parallel to that, there is a timer for each trajectory, which has been already classified to be a UAV, to periodically revisit each drone once found by the system with the PTU tracking procedure to capture the actual position and report the latest image data.
4.2. UAV detection and classification with CNN
For the visual-based verification of an object candidate, a CNN-based detection method is applied on the images of the full HD PTU-camera, focusing on the object, to distinguish between a UAV or a false alarm caused by a bird or clutter. For this task, the popular Faster R-CNN [
8] is used to generate first region candidates, which are classified in a subsequent stage. In order to deal with objects on differing scales, a Feature Pyramid Network (FPN) [
9] is attached to the backbone architecture. ResNet-50 [
10] is used as backbone architecture and weights pre-trained on MS COCO [
11] for initialization. Training of the UAV detector was performed with the publicly available Drone-vs-Bird Detection Challenge dataset [
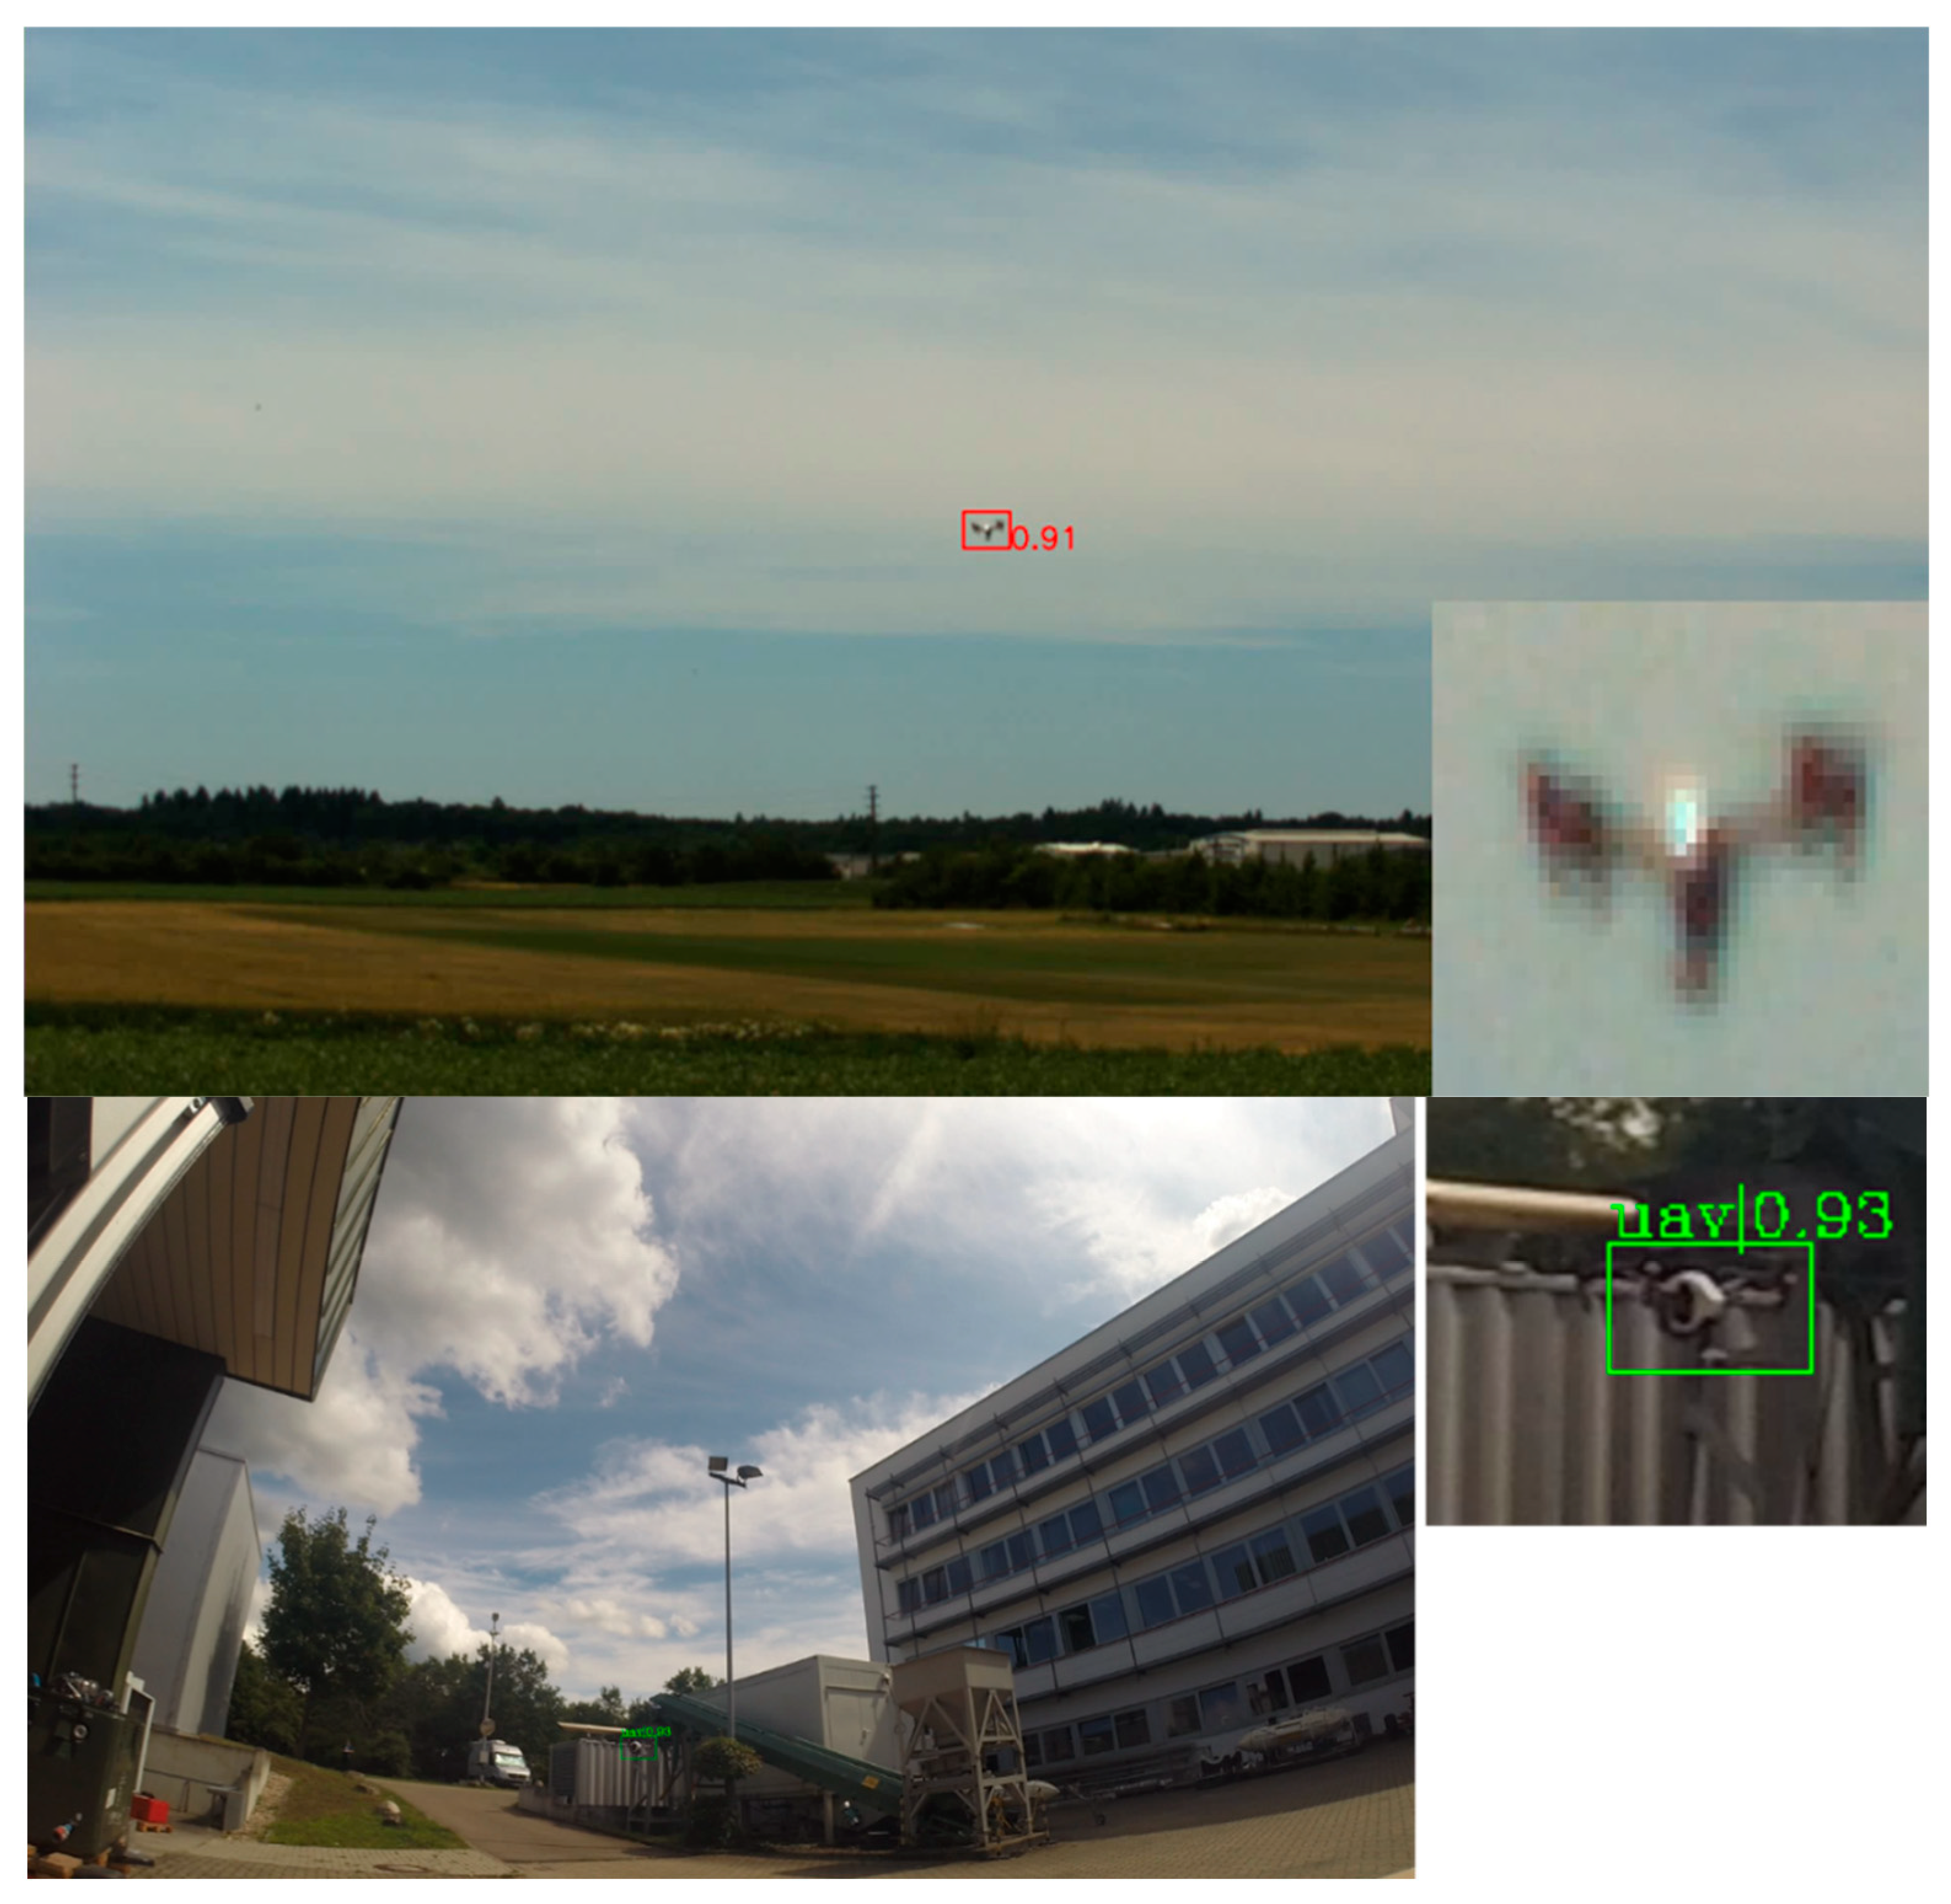
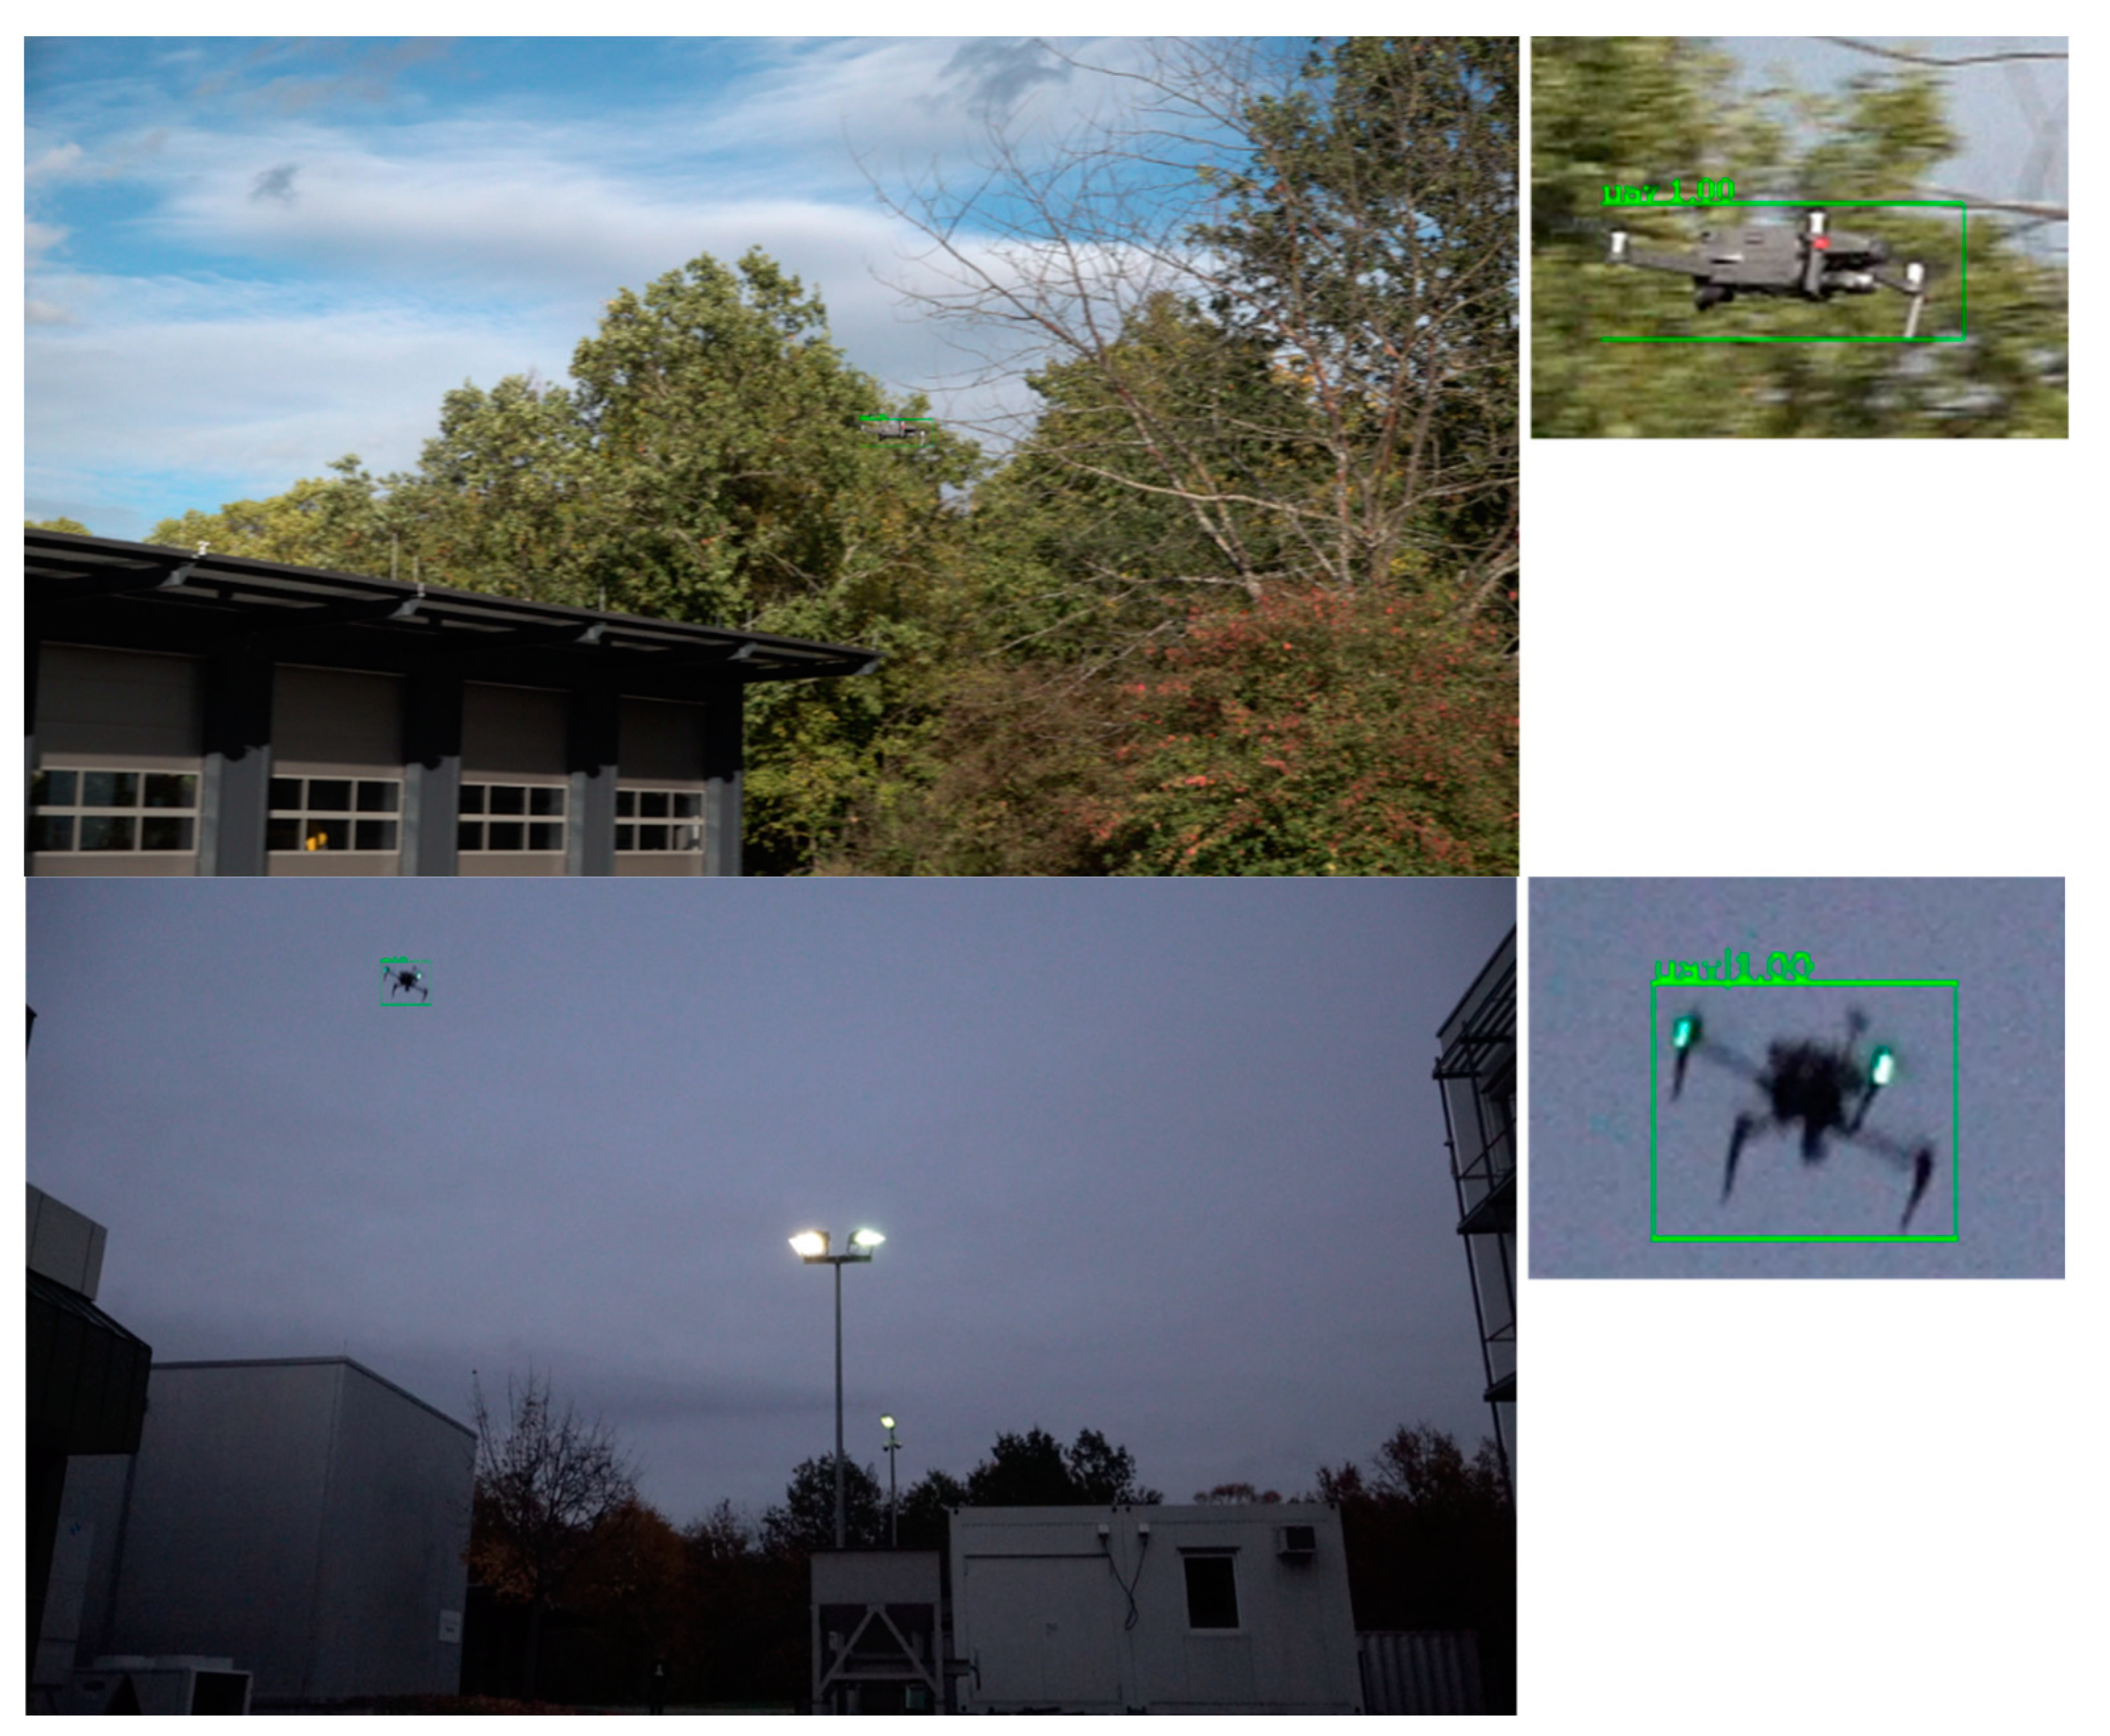
12], but also with own-recorded data, which aimed to robustify the UAV detection against structured background due to vegetation and buildings and also by bad light conditions. The results of the CNN drone detection in various complex environments are illustrated in
Figure 4. Since this step must perform in nearly real time, inference with a TensorRT model and 16-bit floating point was implemented.
Detections with a bounding box of minimum 48 x 48 pixels are forwarded to two CNN-based classifiers [
13,
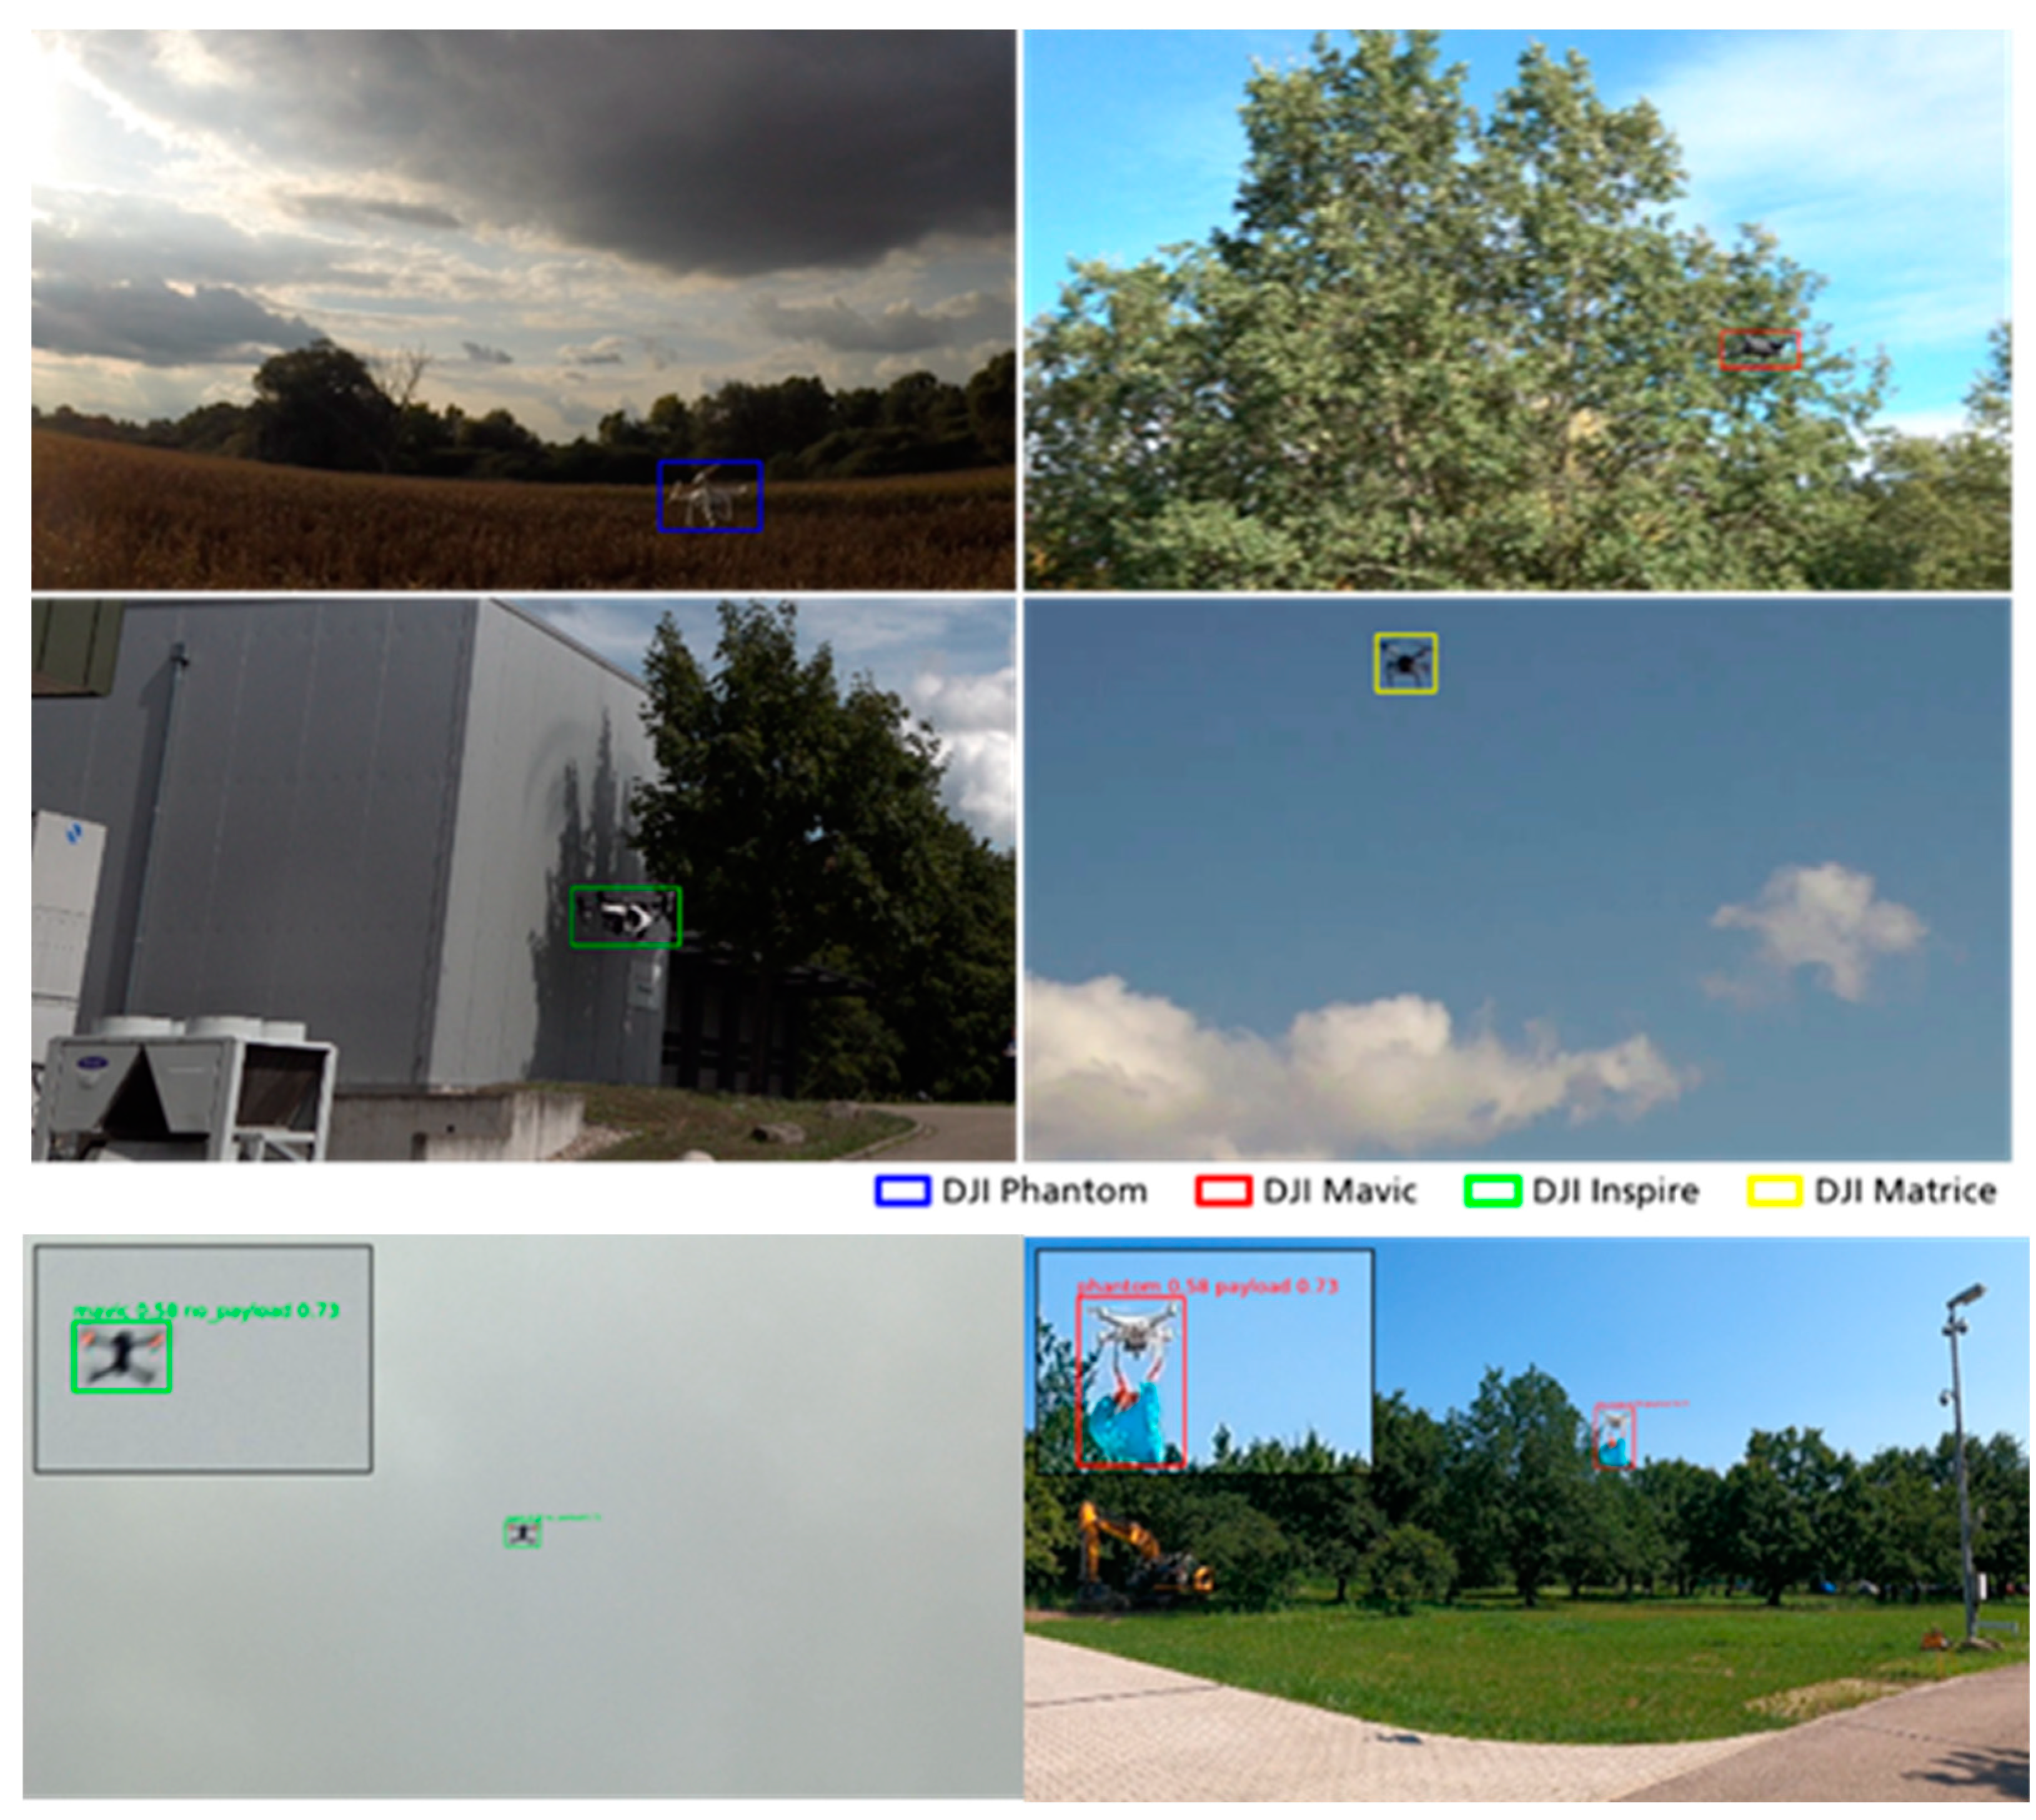
14]. The first one distinguishes between payload and non-payload, while the second classifier differentiates between four UAV models DJI Inspire, DJI Matrice, DJI Mavic and DJI Phantom, as well as background or clutter, respectively. For this purpose, we employ ResNetV1D [
15], a variant of residual neural networks, with 152 layers and use weights pre-trained on ImageNet [
16] for initialization. Both classifiers are trained on the publicly available Drone-vs-Bird Detection Challenge dataset [
12] and own data. For inference, a TensorRT and 16-bit floating point model is used to speed-up both classifiers.
Figure 5 shows examples of UAV type and payload classification results. As one can see, the DJI Mavic drone, flying in front of vegetation, as well as the DJI Inspire, flying in front of a building, are not easy to discover by a human observer.
4.3. Tracking with the PTU camera
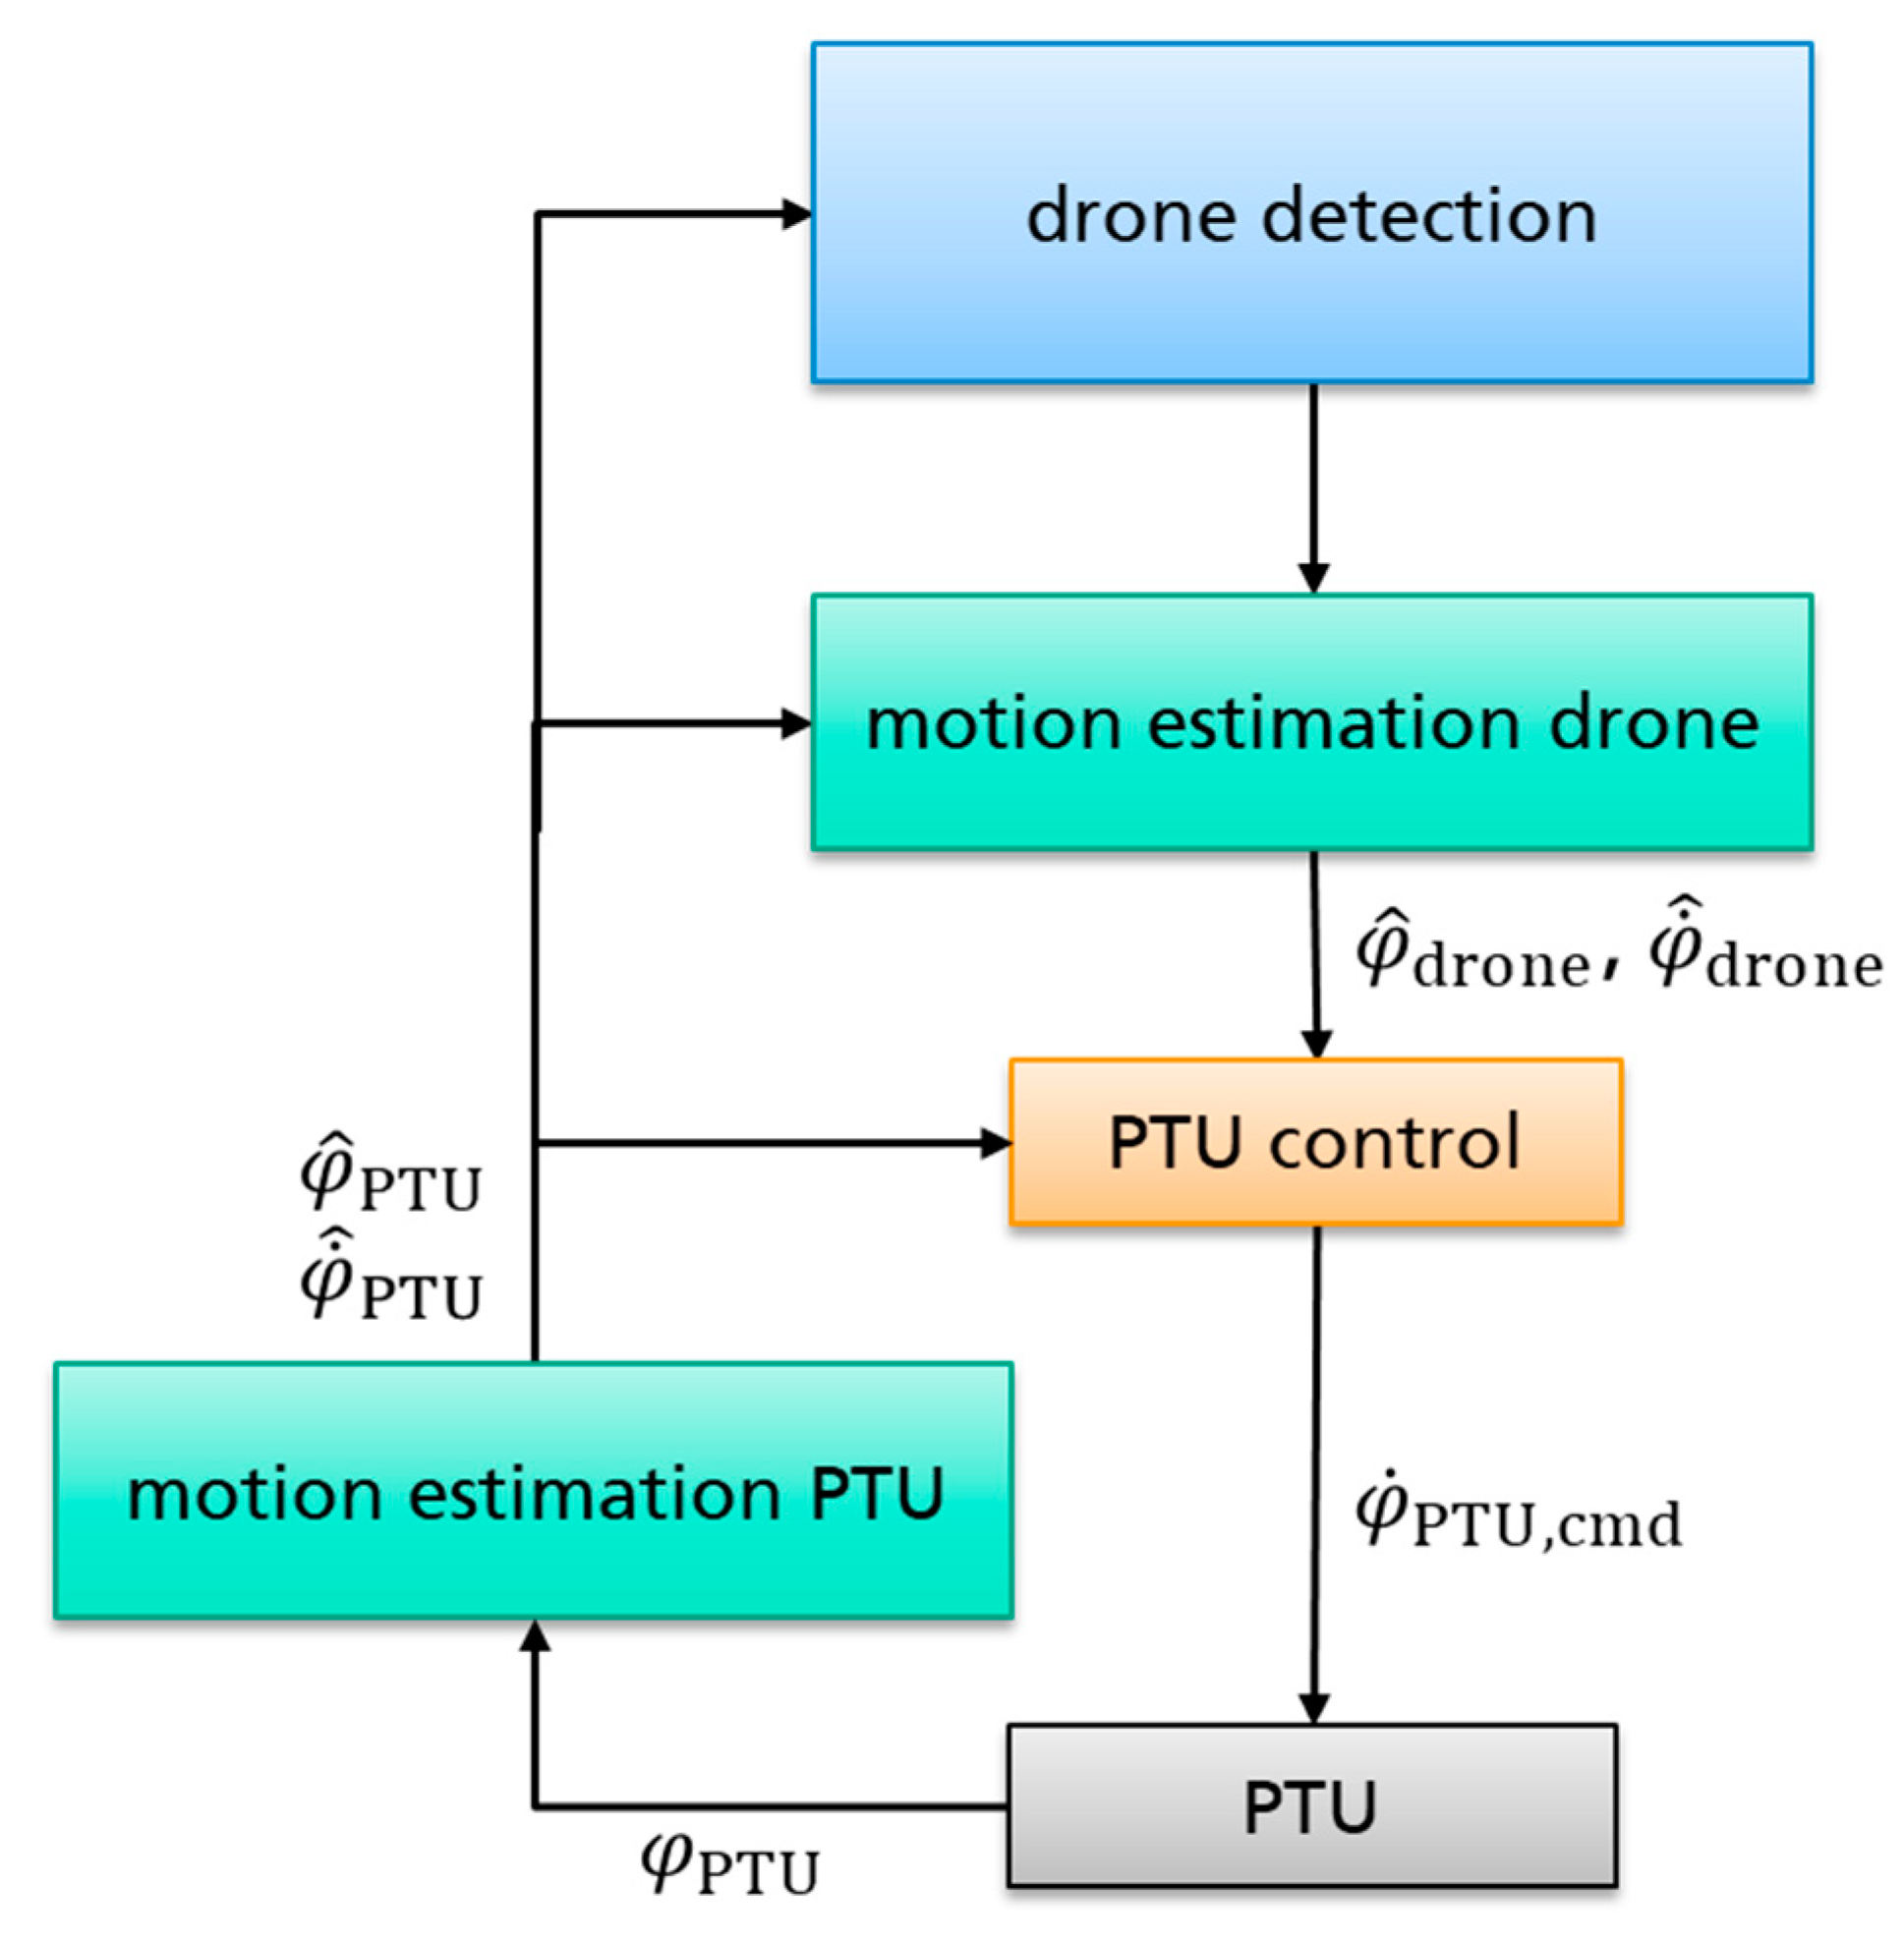
In order to smoothly follow a flying drone with the camera actuated by a PTU, the motion of both drone and PTU should be known as precisely as possible. Therefore, additional motion estimation for the drone and the PTU of the detection camera is utilized for motion prediction and thus for latency compensation. Time stamping of all motion data is performed in order to integrate measurements correctly and process timed motion estimation with prediction.
Figure 6 depicts the processing scheme, starting from the drone detection step in the processing pipeline. Motion estimators for the drone and the PTU respectively provide angular position (
) and angular velocity estimates (
) in PTU coordinates to the PTU control, where
contains azimuth and elevation angles. These values are then utilized by the PTU control component to set the velocity
to actuate the PTU.
In order to assess the latencies and dead times of all the processing steps of the system, an analysis of the respective durations has been conducted. The results are shown in
Table 1. Image acquisition lasts about 80 ms, stemming from the frame grabber which buffers three images. This time period of 80 ms must be therefore subtracted from the time stamp of the recorded image, such that the timestamp corresponds to the image acquisition time. The processing time of the drone detector (cf. Subsection 4.2) lies between 65 ms and 107 ms, depending on the complexity of the scene. Motion estimation and control algorithms perform in about 1 ms. The last part of the process chain is the PTU which induces a dead time of 50 ms for azimuth (pan) and 80 ms for elevation (tilt). Thus, the total latency adds up to more than 250 ms and poses a challenge to the control concept, which shall be well mitigated by the predictions of the motion estimators.
The maneuvers of a drone may follow a quite complex trajectory, varying quickly in both direction and speed. In order to follow such erratic motion patterns, an estimator being able to adapt to various motions is needed. For this purpose, an interacting multiple model (IMM) Kalman filter was chosen [
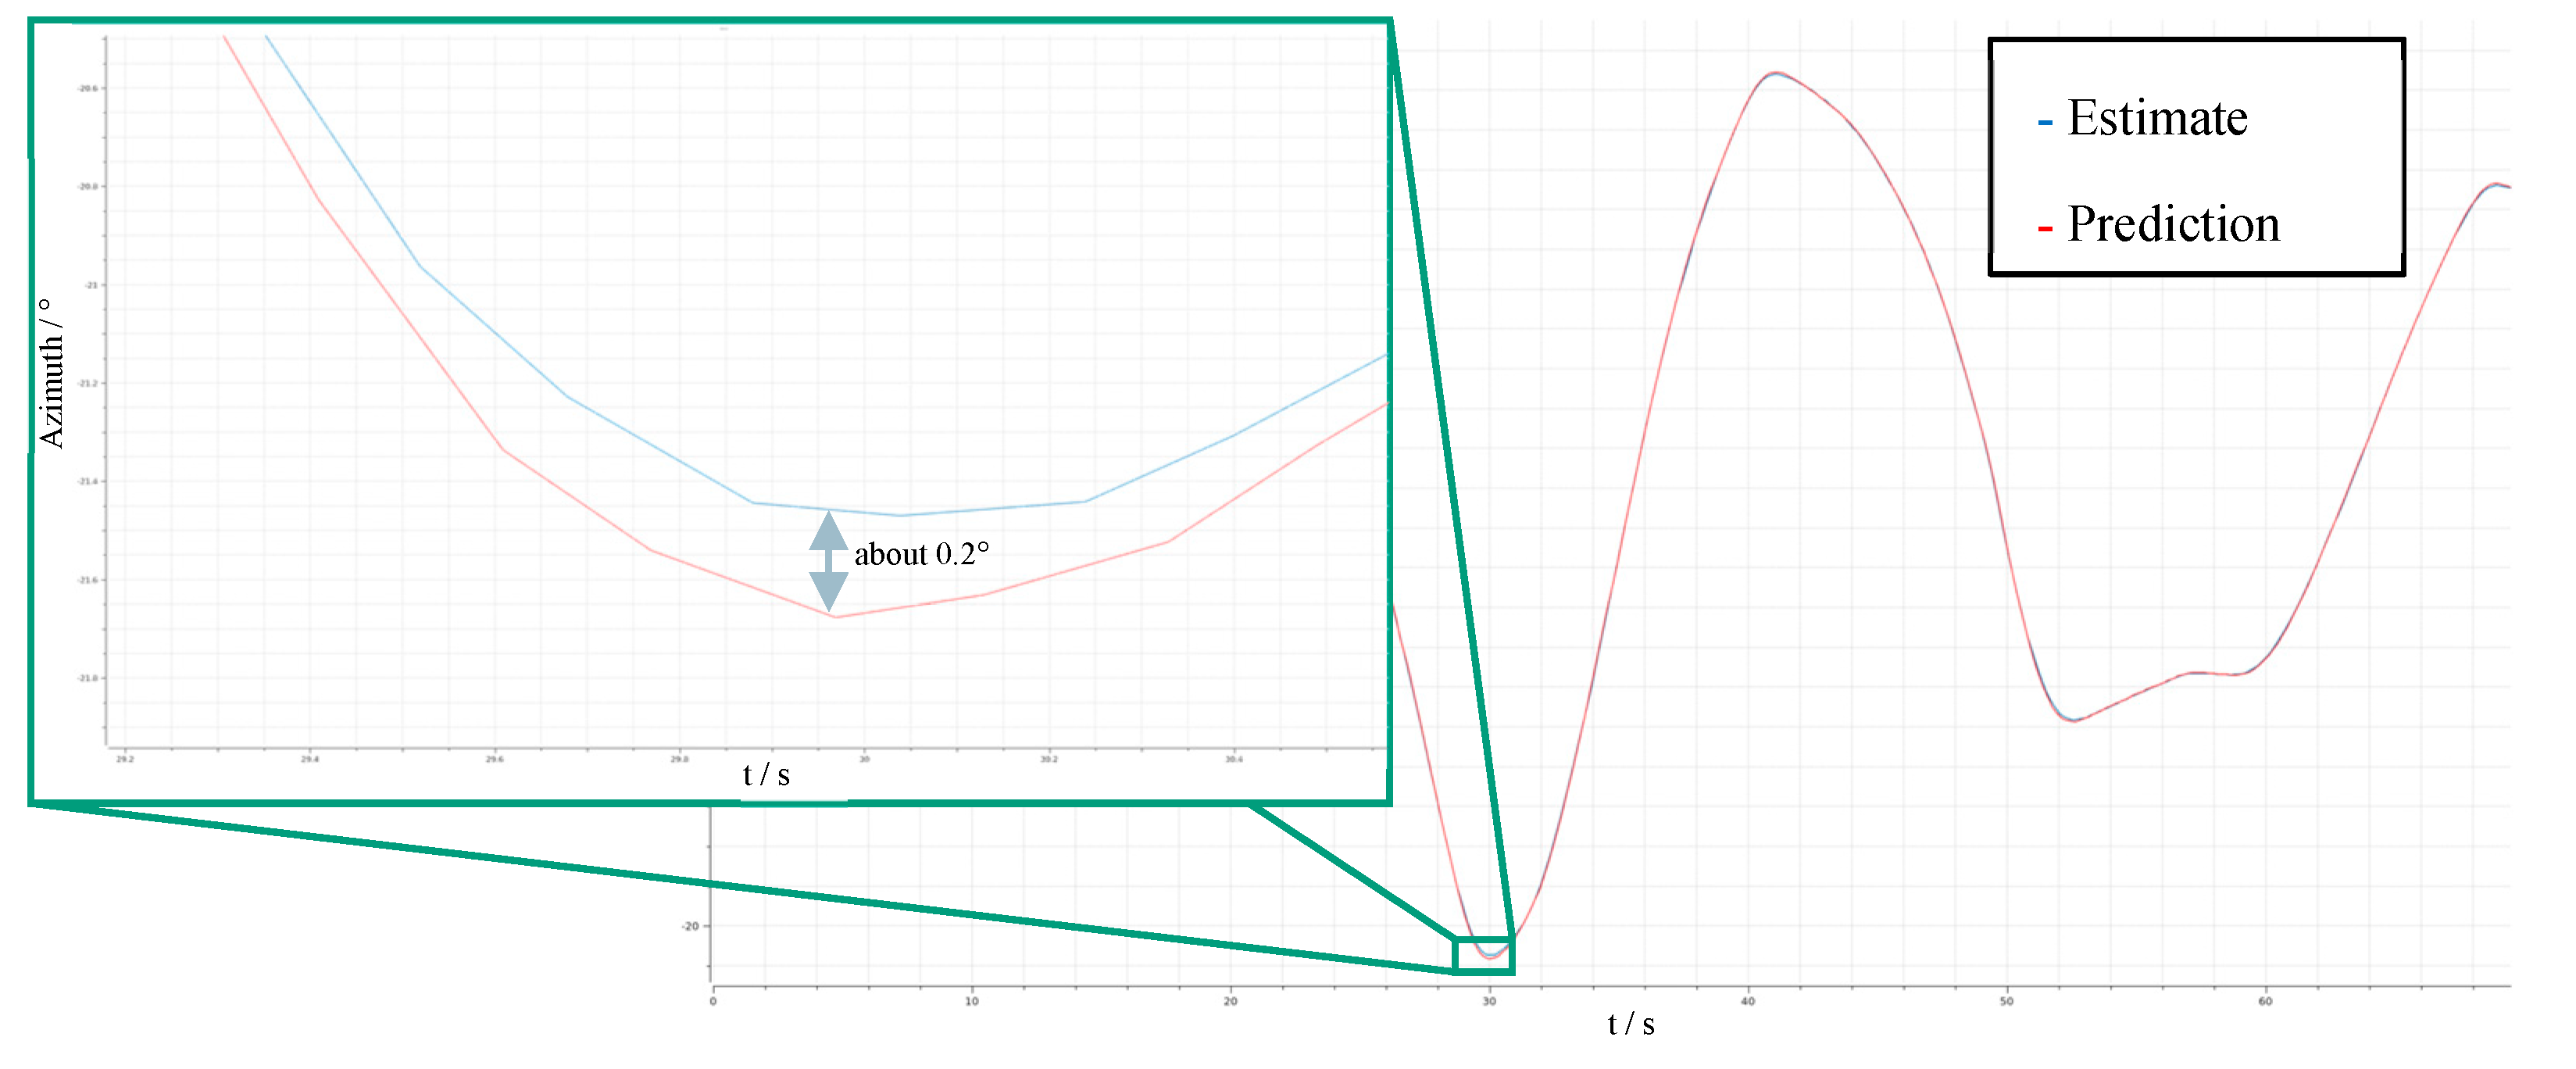
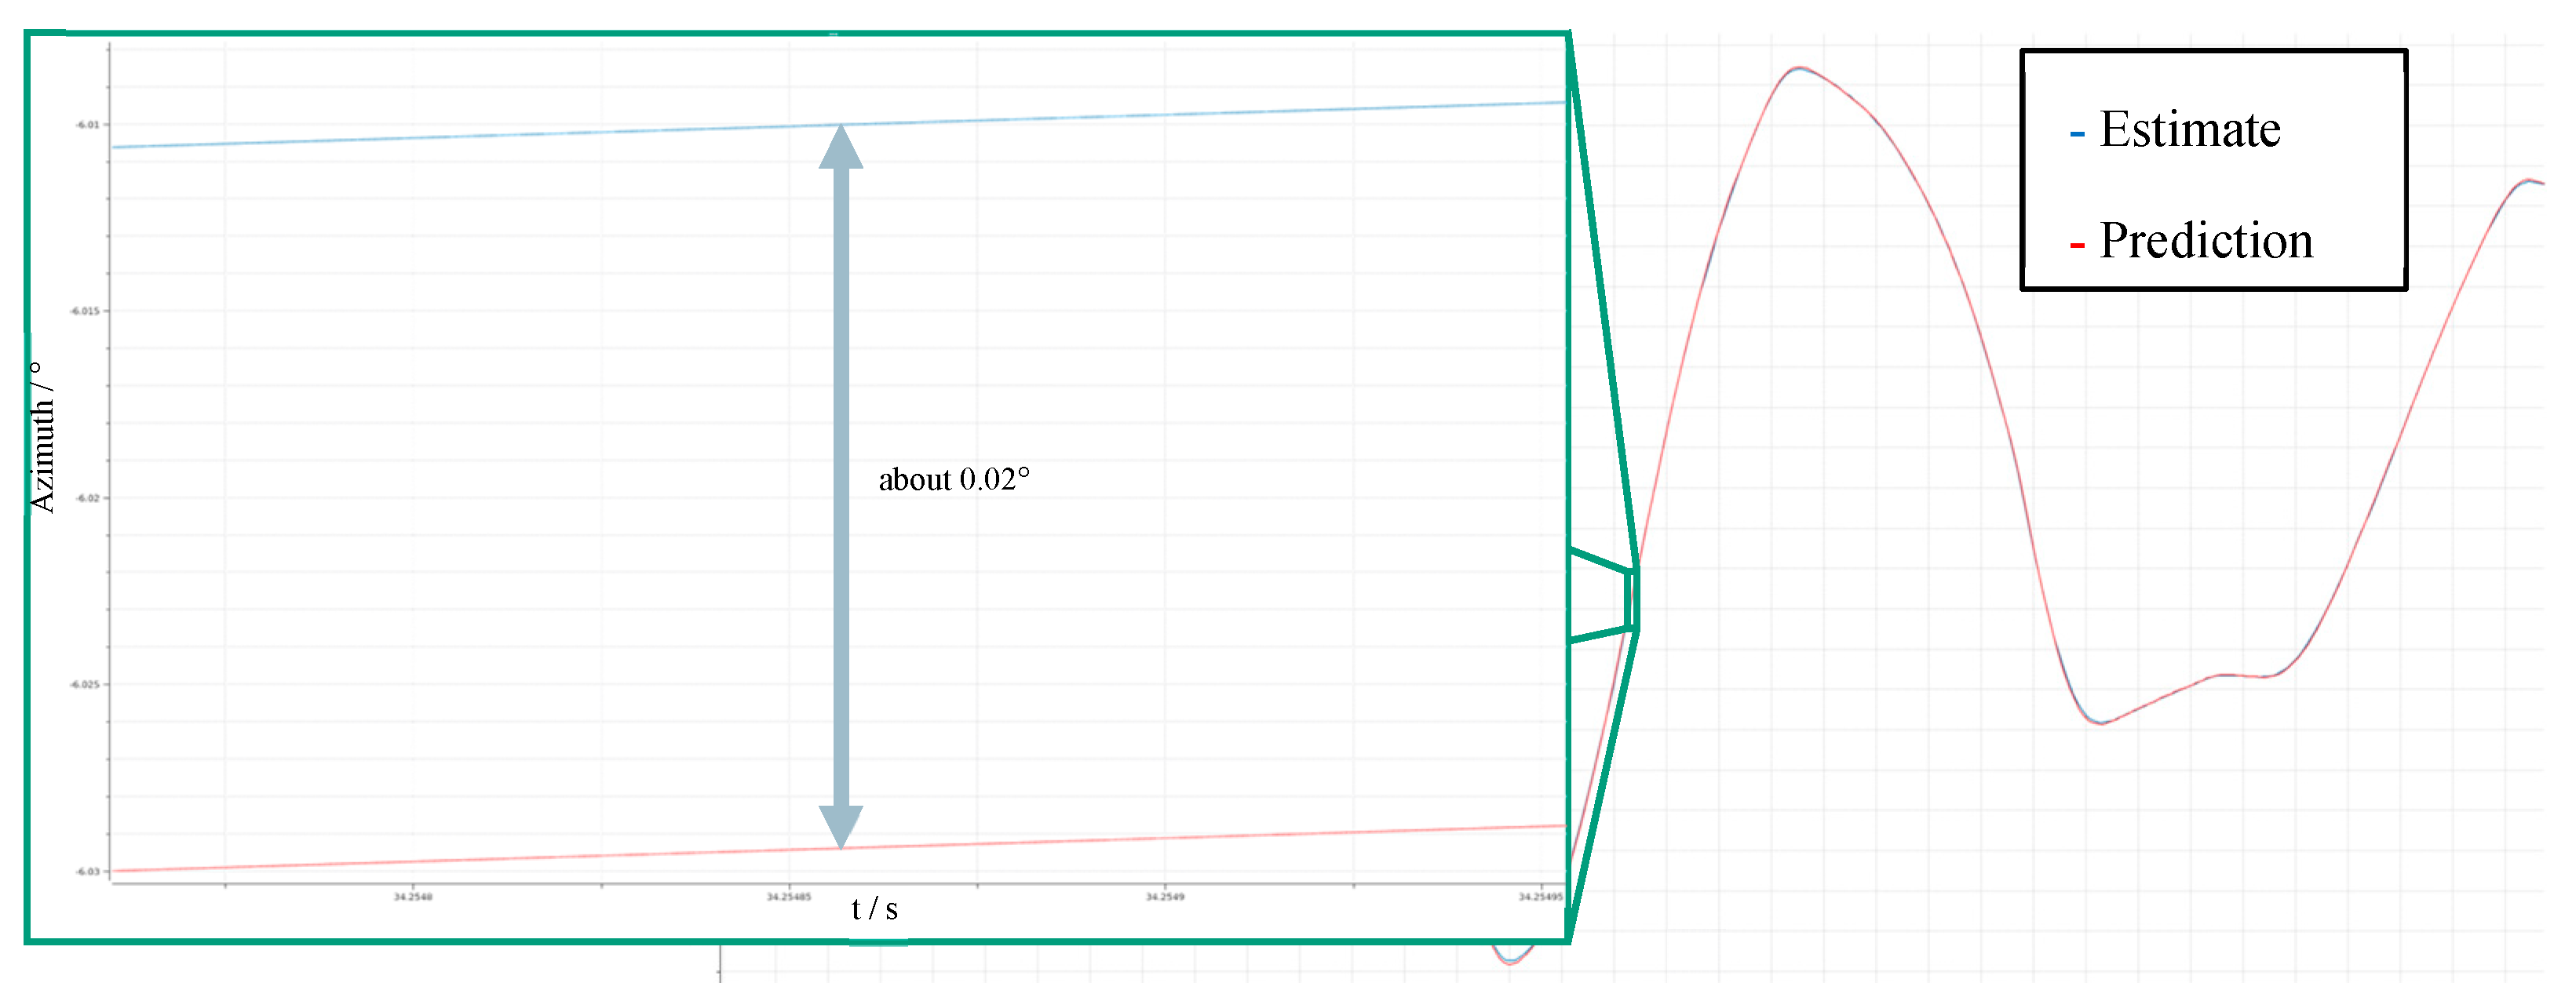
17]. The IMM Kalman filter is capable of tracking different motion models in parallel. One of its main advantages is that no heuristic is required to switch between the models since it outputs a combined estimate by seamlessly blending a weighted mixture of all motion models. The weights are automatically tuned according to the difference between the individual prediction and the updated estimate, i.e., models matching the current maneuvers better, get higher weights. For drone tracking, three models were chosen: constant velocity, constant acceleration and circular motion. Since no ground truth was available for the performance assessment of the drone motion estimator, a comparison was conducted between its prediction and its time aligned corrected estimate. Of course, this corrected estimate cannot be utilized for control, since it is only available later, due to the aforementioned latencies. With a prediction horizon of 250 ms, for transient maneuvers a difference of less than 0.2° (see
Figure 7) and for constant motion a difference of only about 0.02° (see
Figure 8) was achieved. In the figures, the estimate and prediction have been time-aligned for comparison since the estimate is only available with the mentioned delay.
For PTU actuation a PD controller with feedforward control was chosen. Essentially, the control concept is an extension of the P controller with feedforward control as proposed in [
18]. The PD controller is equivalent to a linear quadratic regulator (LQR) [
19] with a first order motion model. The PD controller controls the position and velocity error of the PTU, where the position error is the difference between the predicted estimate of the angular drone position
and the predicted estimate of the angular PTU position. The velocity error is the difference between the predicted estimate of the angular drone velocity
and the predicted estimate of the angular PTU velocity. The feedforward control just receives the angular drone velocity
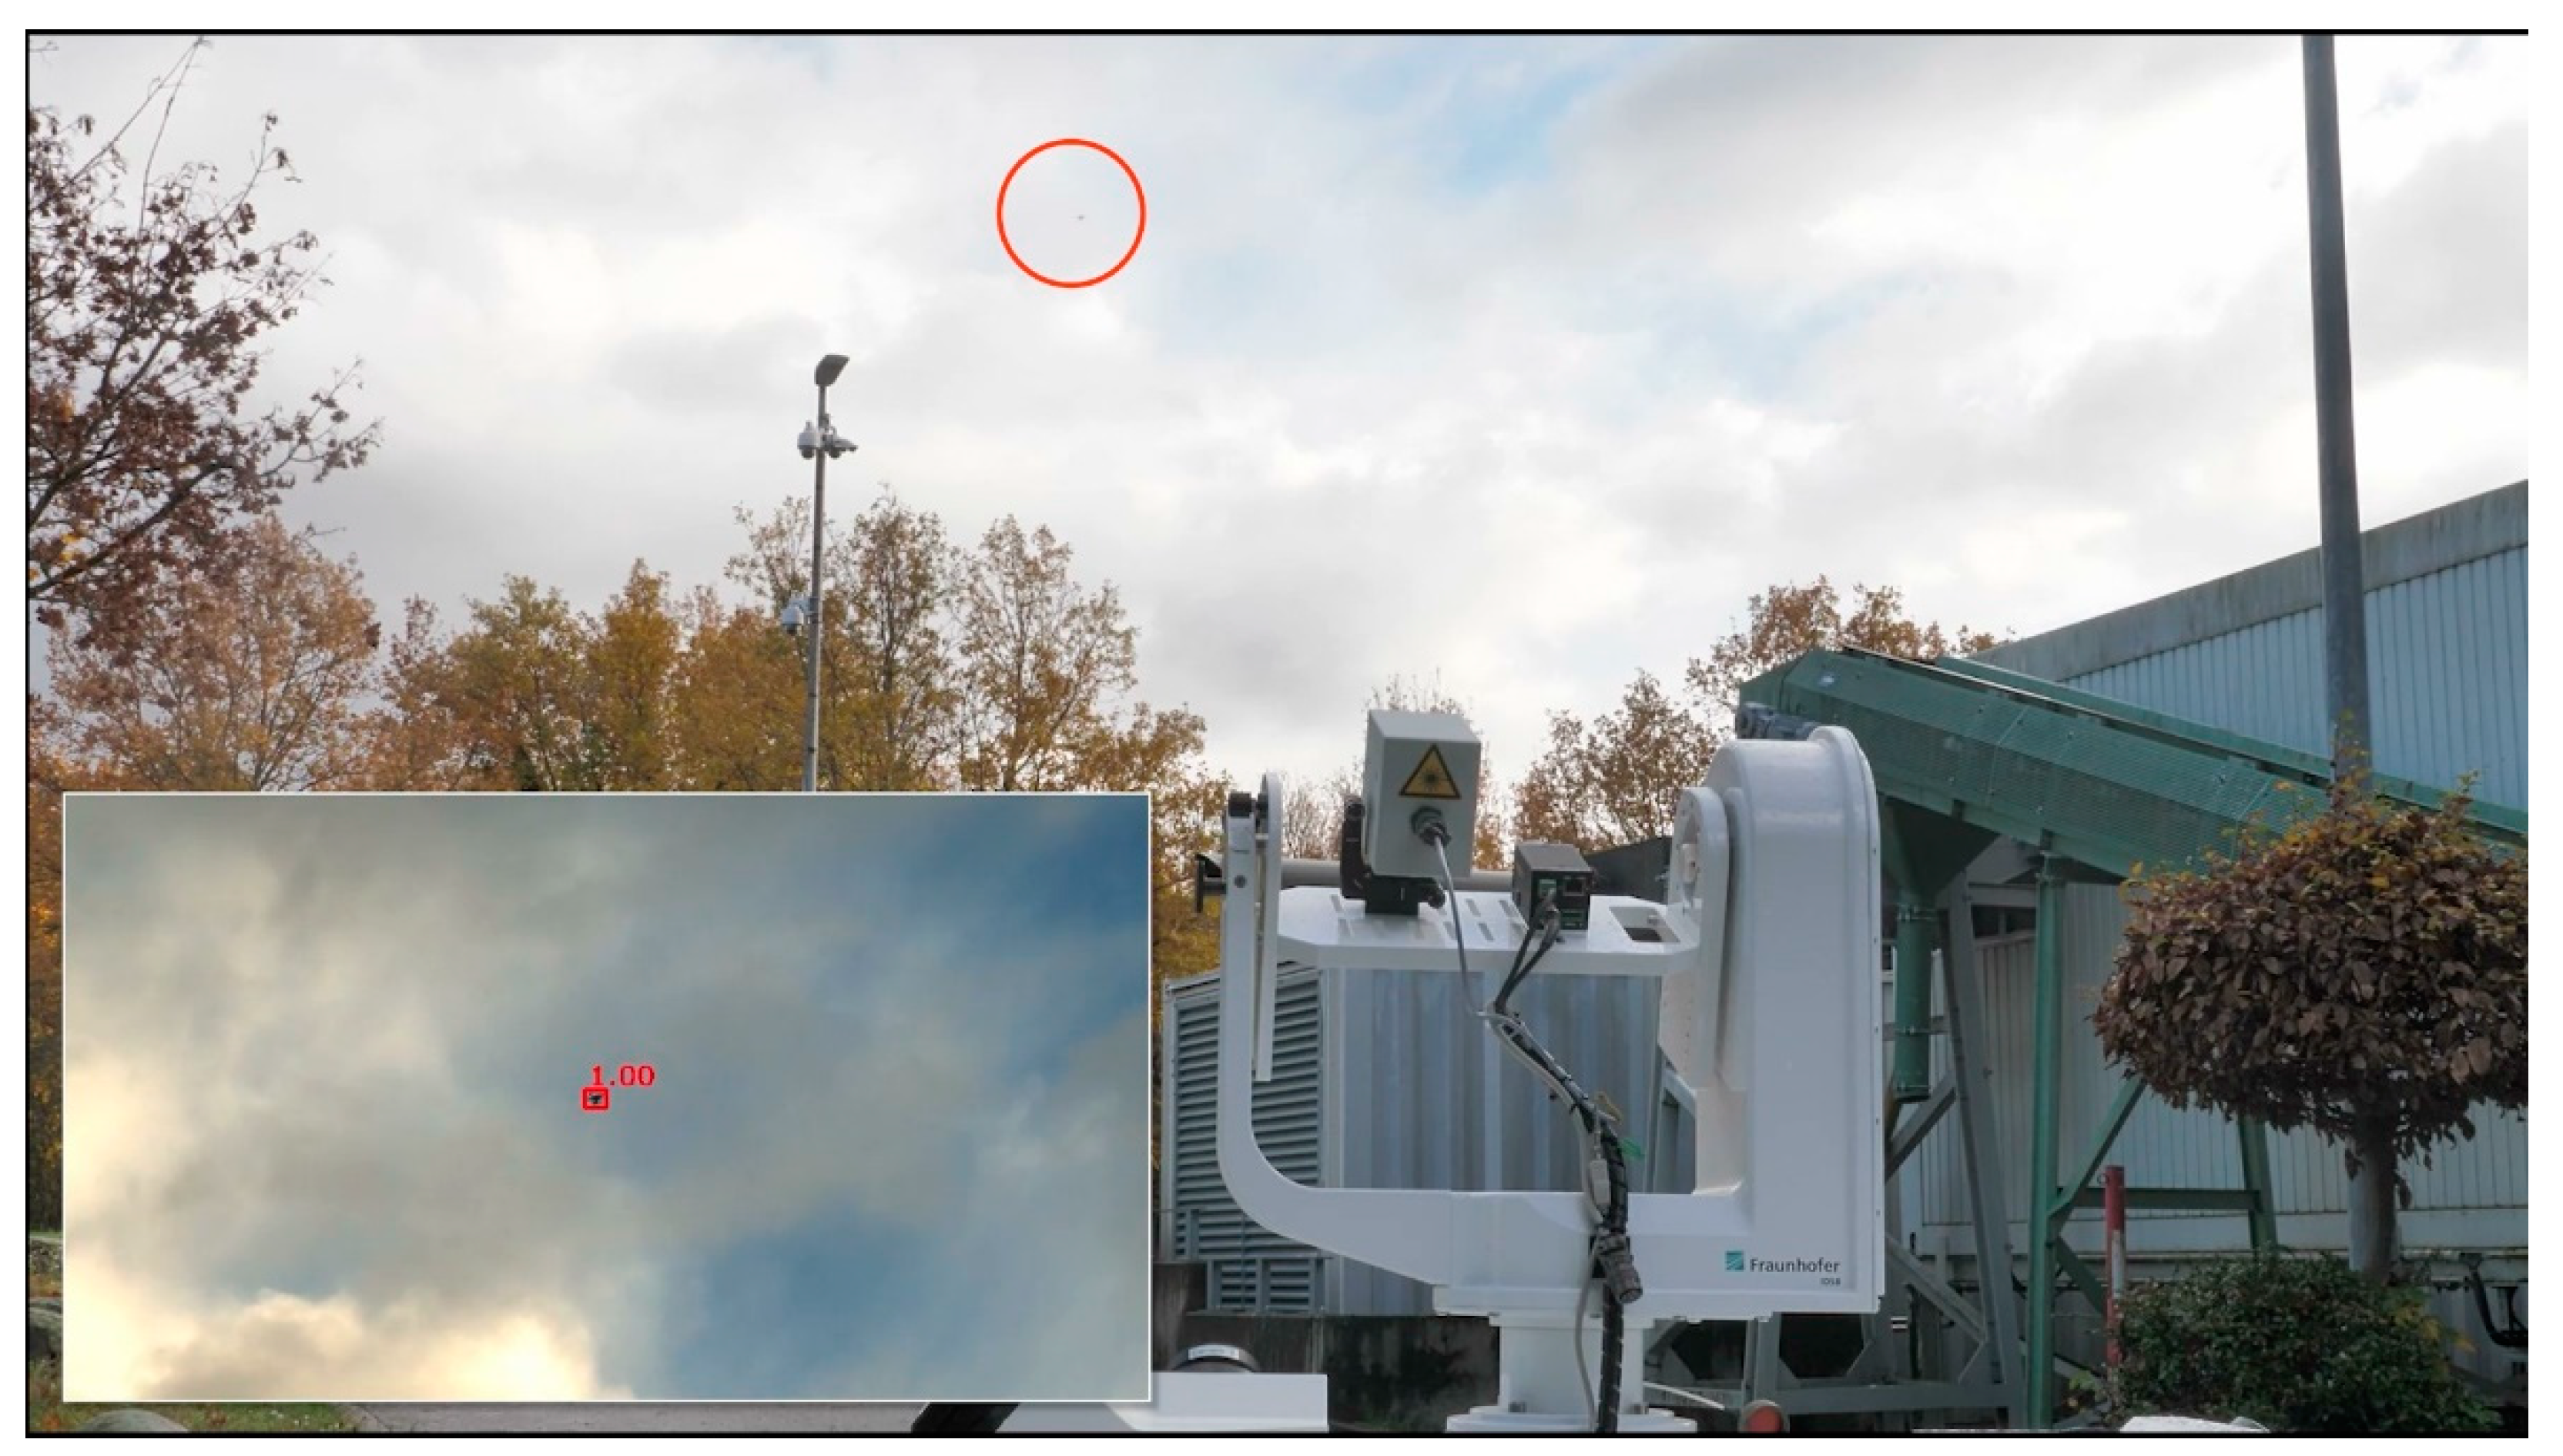
. Thus, processing is conducted on the predicted estimates, i.e., the system latency is compensated for and the requirements on the control speed are reduced. The feedforward control further reduces the dependency of the control on the velocity of the drone. With this control scheme the achieved deviation from the desired value was below 0.2° most of the time with peaks below 0.5°, which equates to less than 3 pixels in the tracking camera. This result was also confirmed during experimental tests by the smooth and precise tracking of the flying drone with the PTU-camera, see
Figure 9.
5. Multisensorial fusion of detections, visualization and assistance function
Since two or more sensors can produce a detection of the same object, it is an important task to fuse the detections. For this purpose, the tracks of the different detections must be fused together by a track-to-track correlation. In our case, both sensor sources (optical and radar) produce tracks, which can be visualized separately. But, when there is an overlap between the sensors’ field of view, the two detections are fused by a Fusion Service.
Central to the Fusion Service is the Gaussian Mixture Probability Hypothesis Density Filter (GM-PHD) [
20,
21,
22]. This filter is scalable and efficient, adeptly handling the uncertainties of both sensor types. By merging data from both sensors, a more accurate and comprehensive representation of the tracked objects is achieved. The input detections must be accompanied by covariance matrices, enabling the Fusion Service to accurately merge the correct objects.
Beyond merely fusing the position of the detection, the optical detection captures additional visual information, such as the drone type and the presence of a payload. The Fusion Service seamlessly integrates this information as well. Consequently, we obtain a fused track, presented using a distinct color scheme. This track also comes with a covariance matrix, which is likewise visualized.
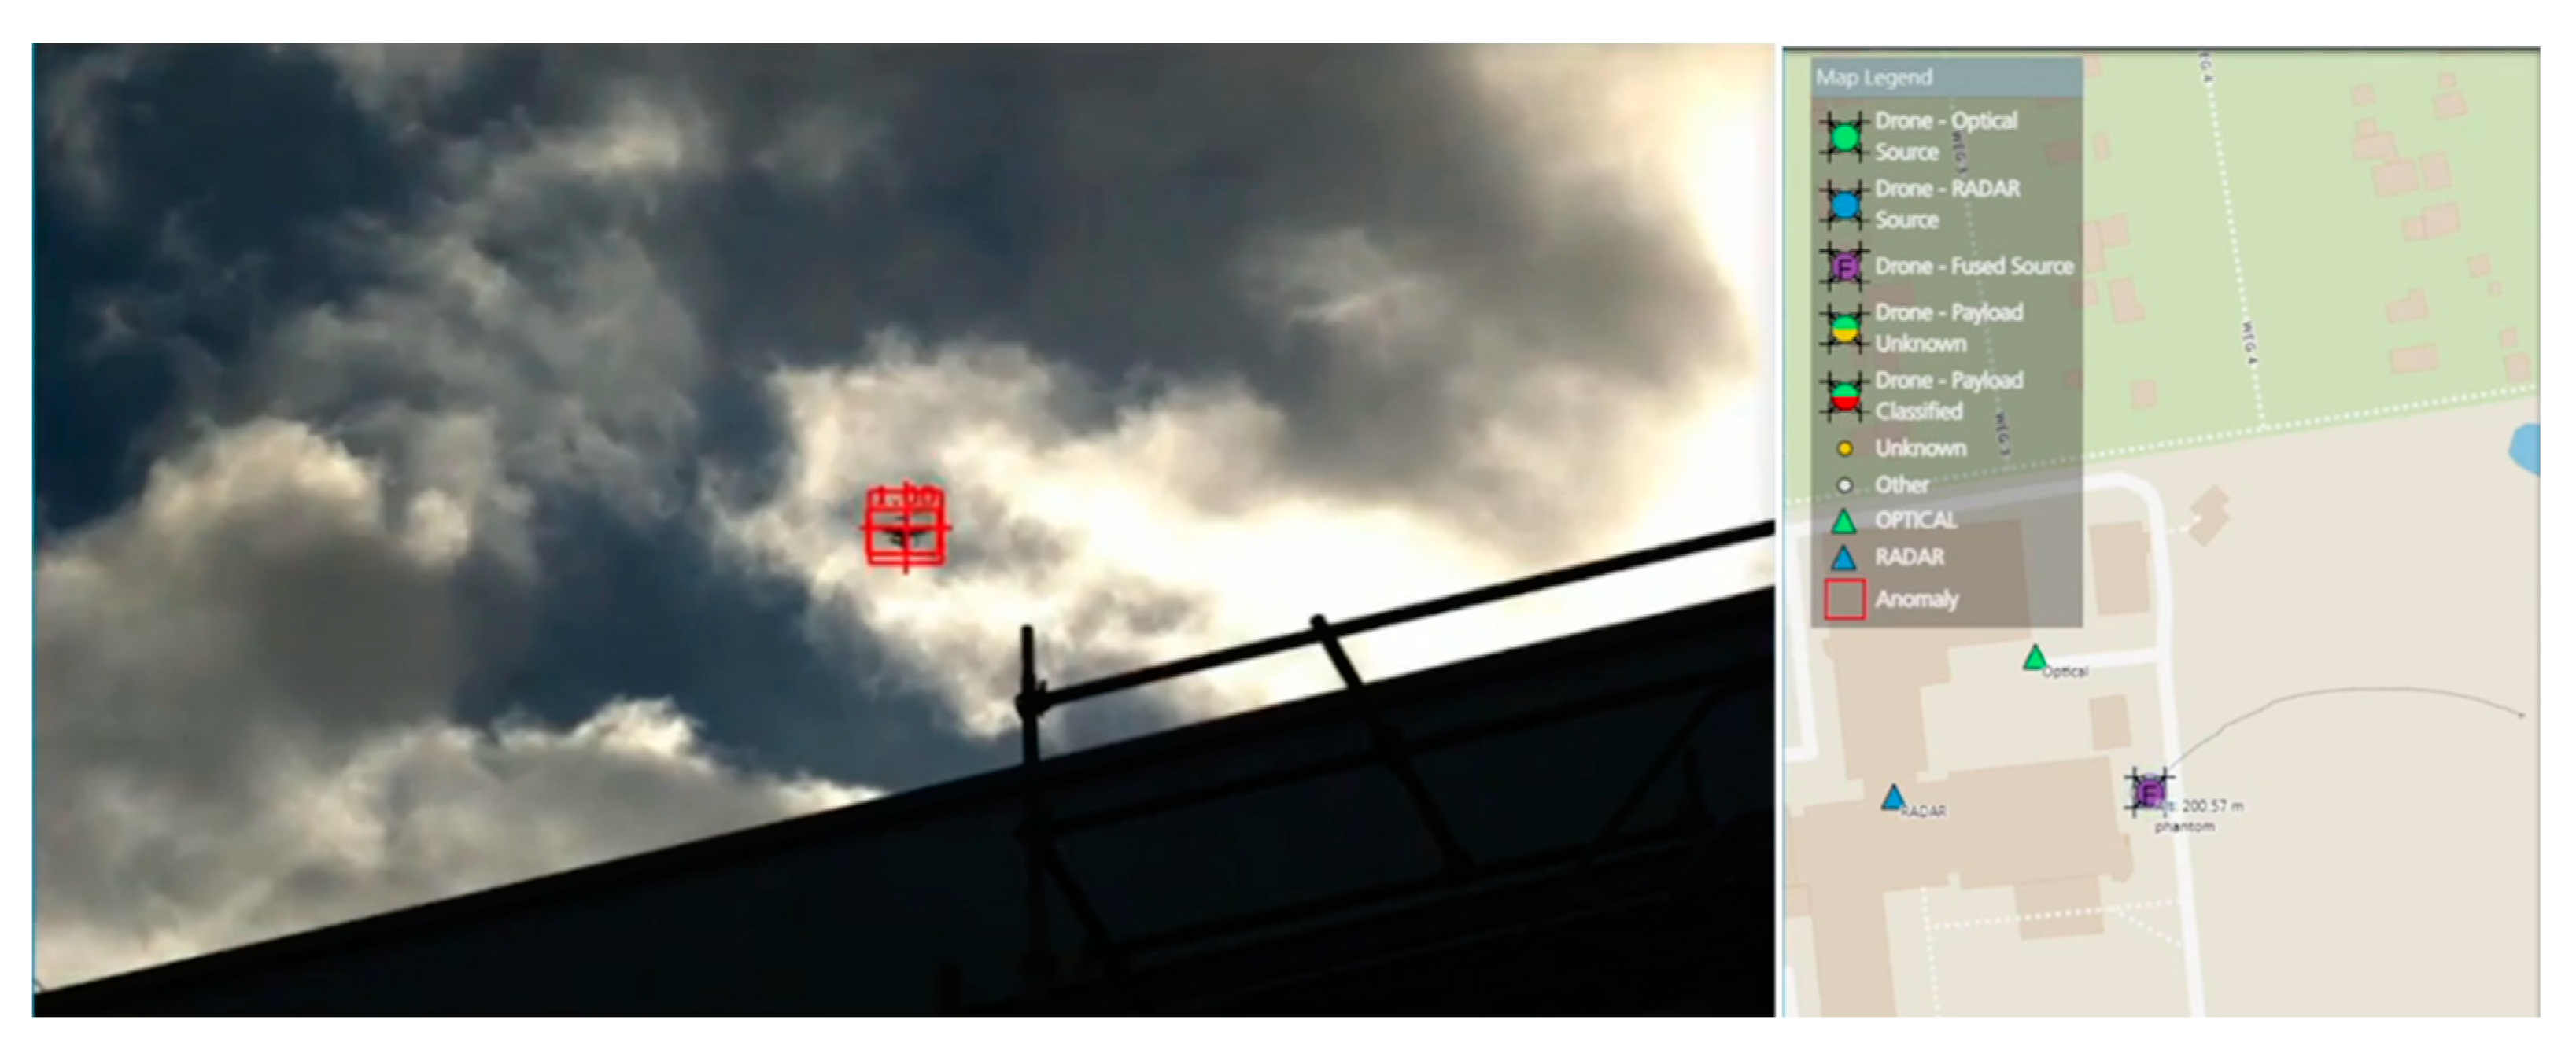
All detections of the radar and optical sensor stations are recorded and visualized on an environmental 2D or 3D Digital Map Table [
23], but for overlapping regions, where both sensors detect drones, the result of the fusion is displayed, see
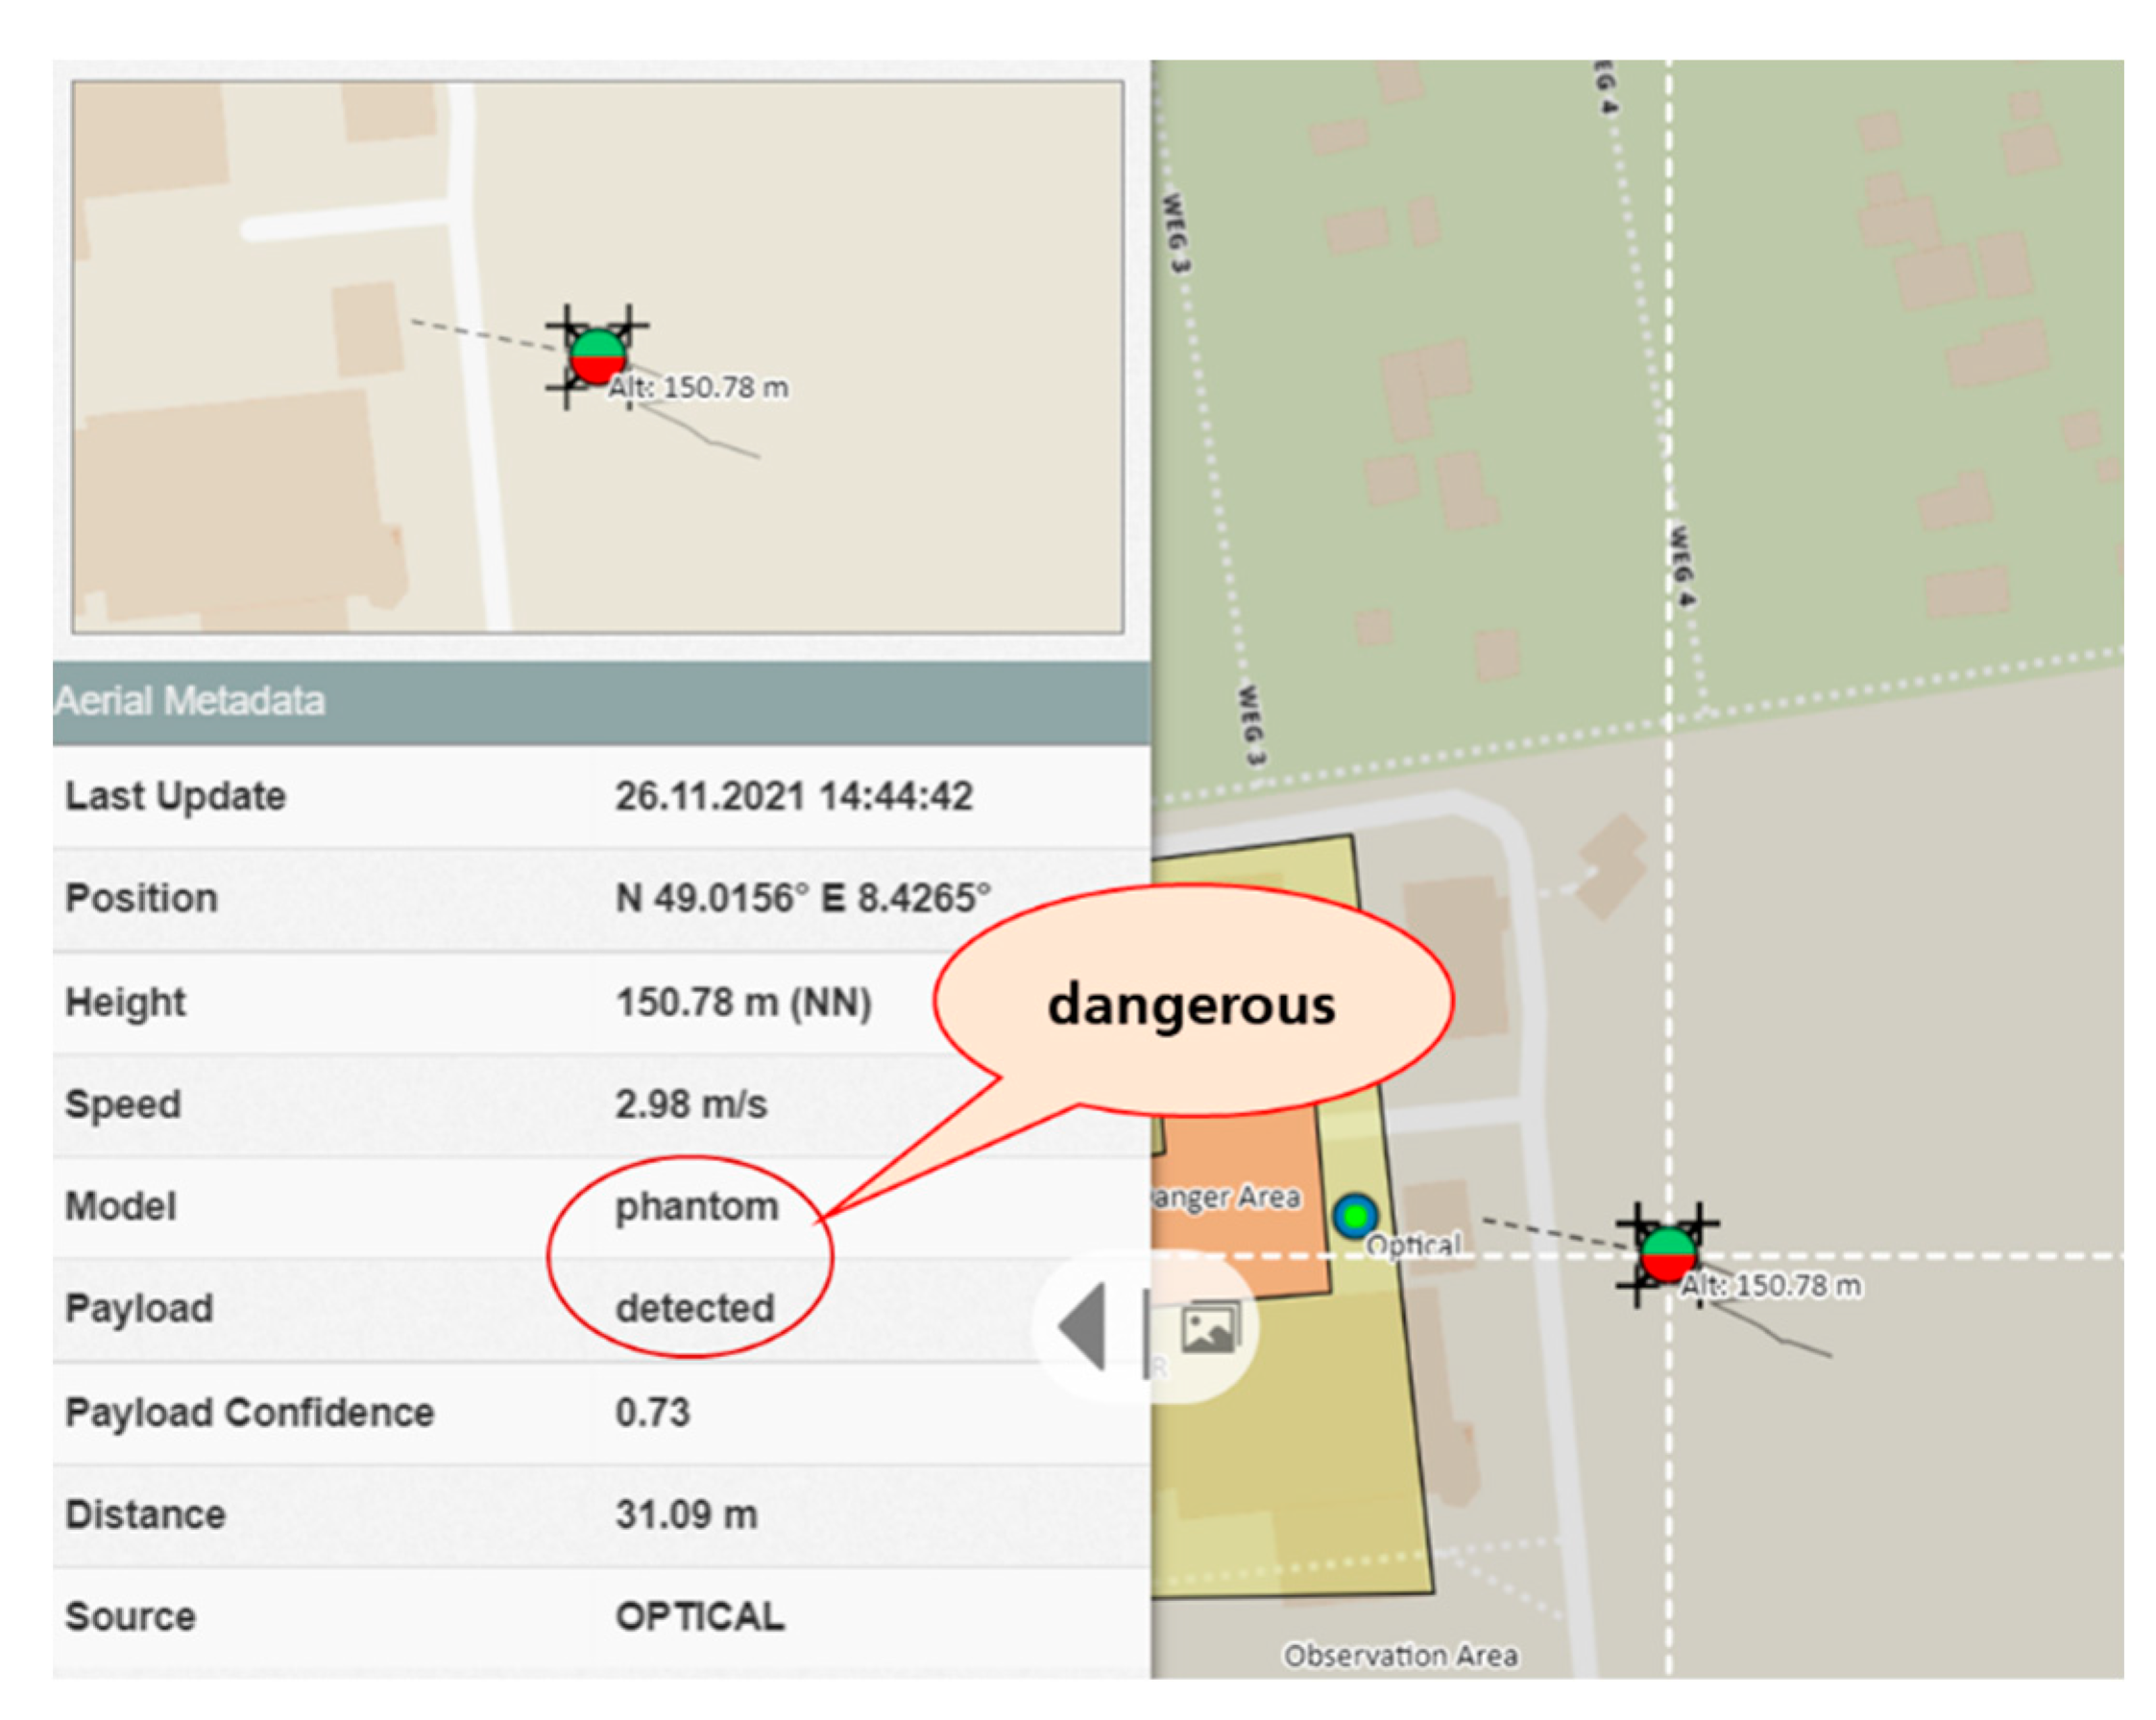
Figure 10. Not only observing the live position of a drone in the world is required for defense measures, but also the indication of a payload or simply the image of the drone helps a human operator to assess the situation of dangerousness, see
Figure 11. Since the detections are stored in a database, they can be replayed any time on the Digital Map Table.
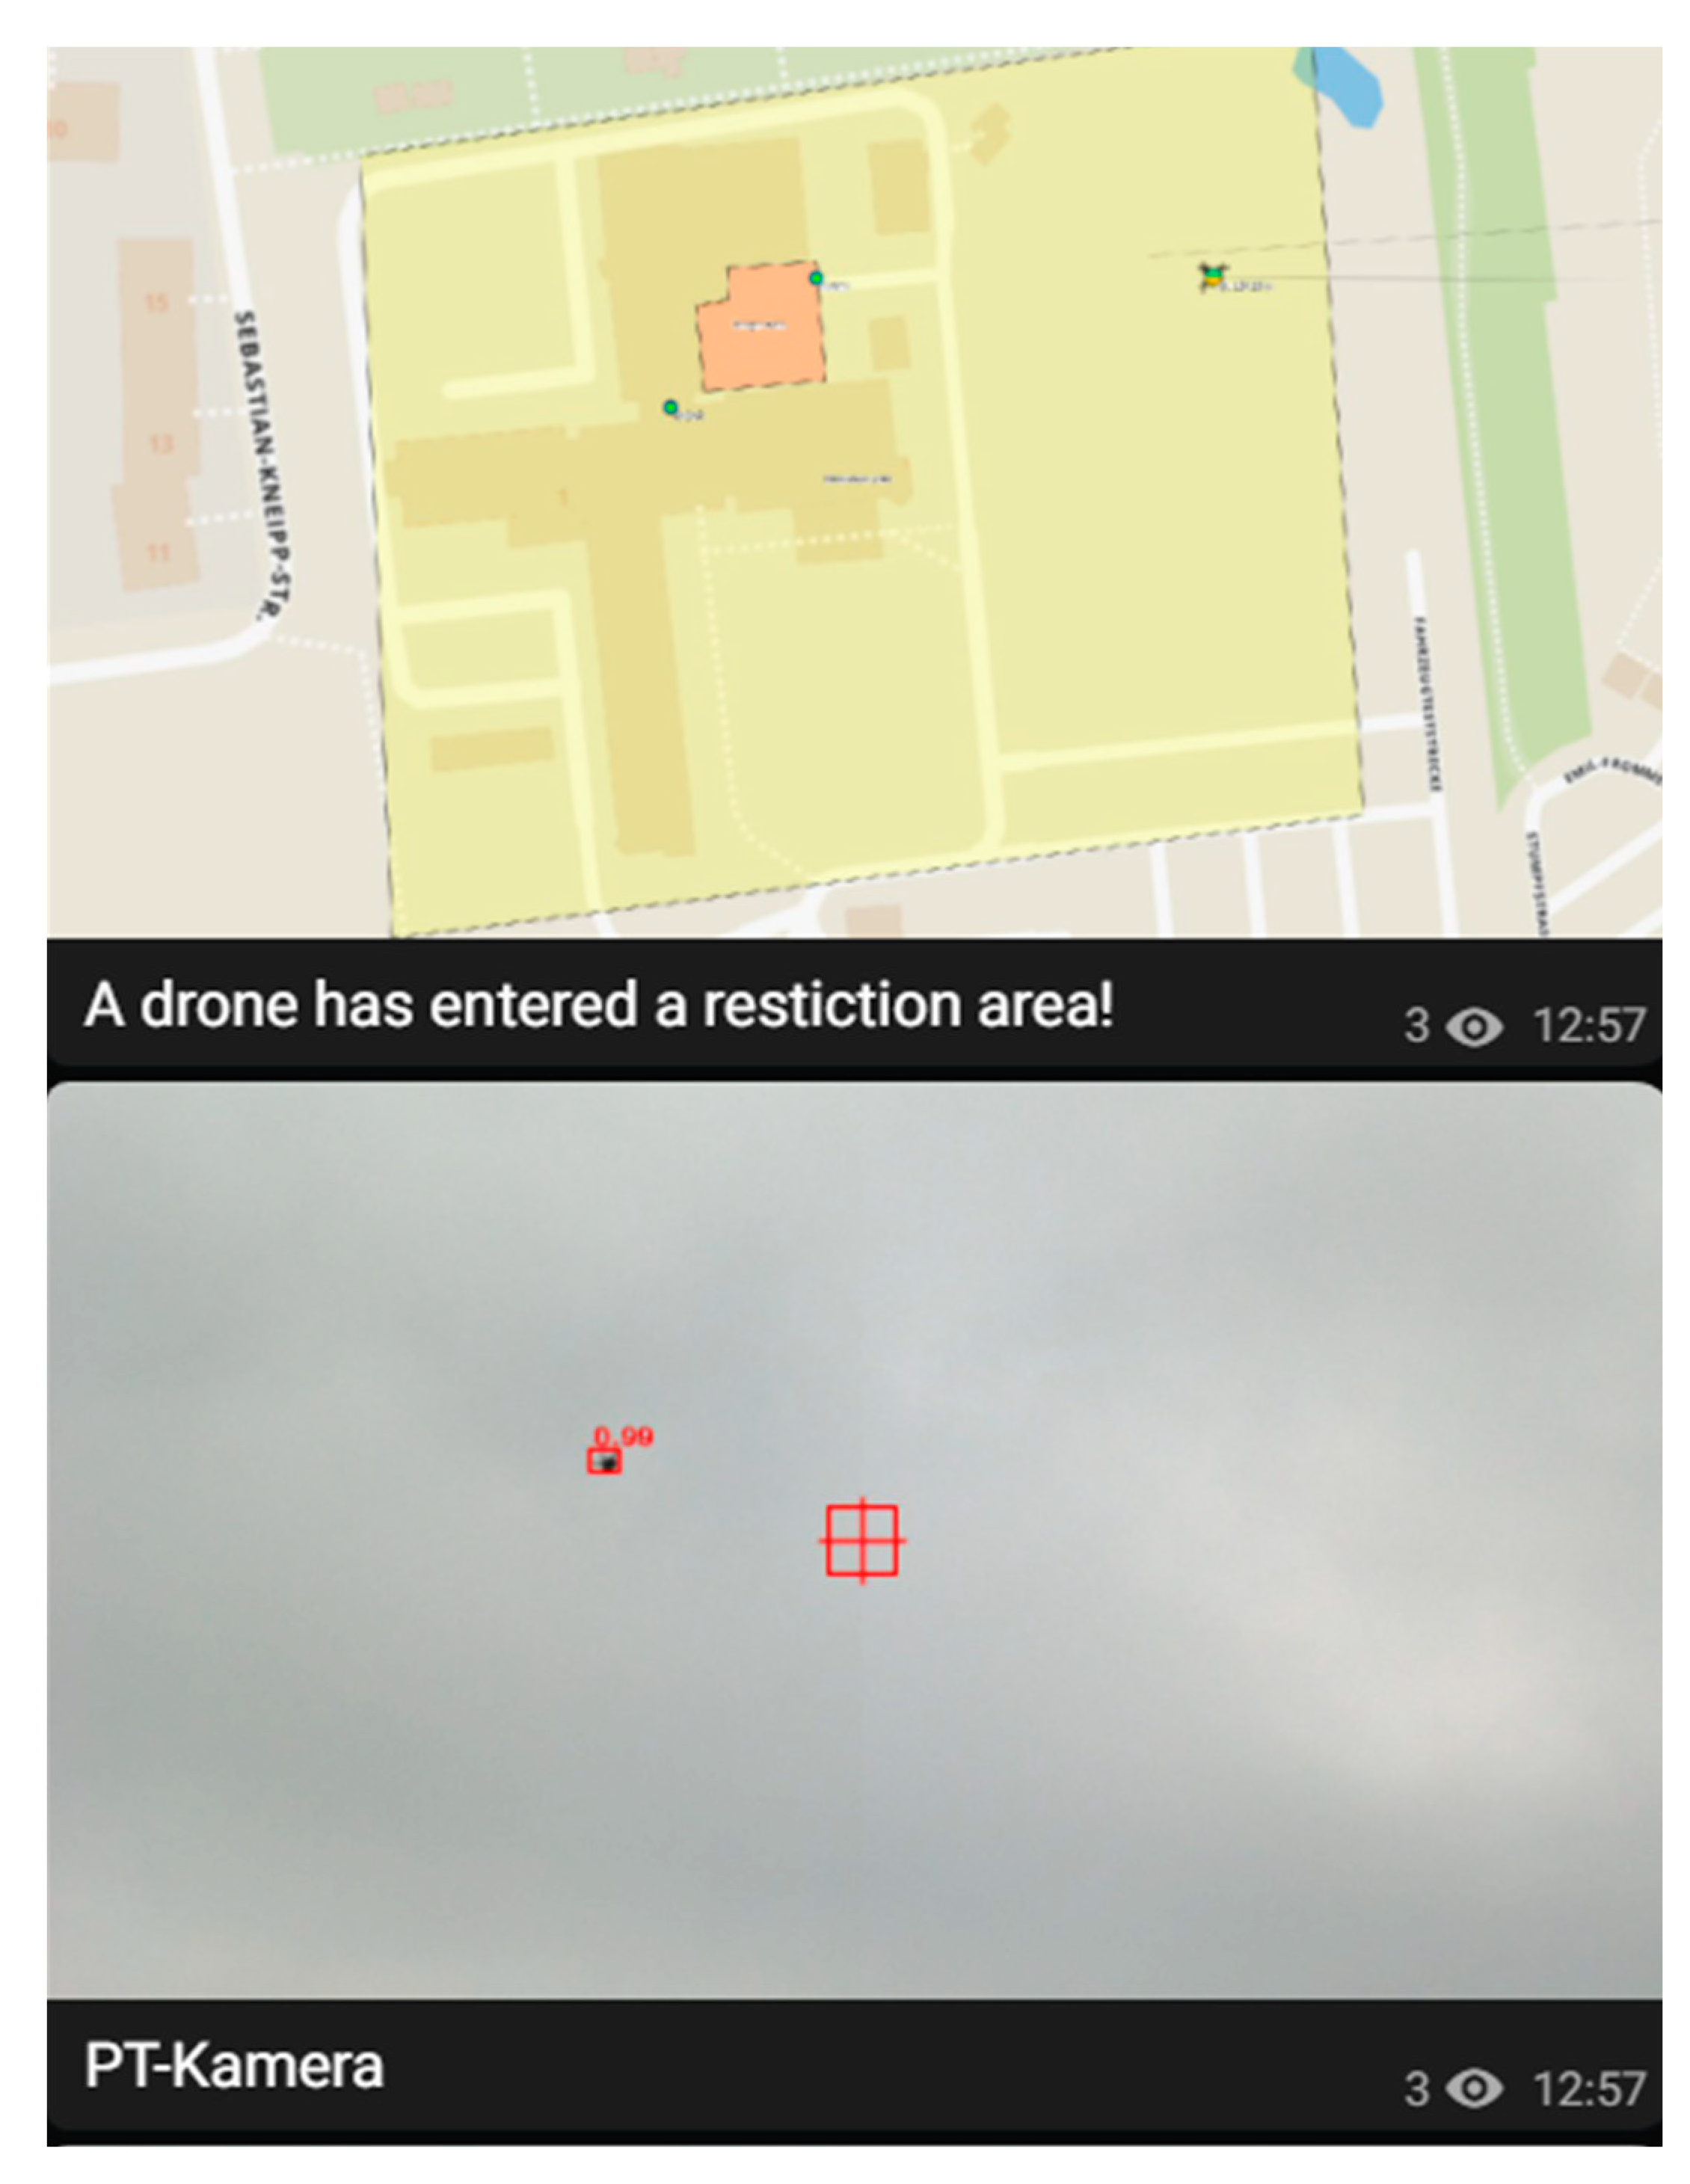
The Digital Map offers also assistance functionality for security personal. By defining a restriction area on the map, an alarm can be automatically generated, when a drone enters this region. The alarm is not only visualized on the Digital Map, but the position and further information about the detected drone along with the image of the situational representation and image of the drone can be also transmitted to a mobile phone of a security person, such that defending operations can be directly initiated. In
Figure 12 an alarm was generated since a drone entered the restricted area, marked yellow on the map.
Figure 10.
Visualization of a fused detection of both radar and optical sensors on the Digital Map Table.
Figure 10.
Visualization of a fused detection of both radar and optical sensors on the Digital Map Table.
Figure 11.
Visualization of a detection on the Digital Map Table along with the visual-based extracted data.
Figure 11.
Visualization of a detection on the Digital Map Table along with the visual-based extracted data.
Figure 12.
Situational representation of an alarm, geographically and visually, on a mobile phone.
Figure 12.
Situational representation of an alarm, geographically and visually, on a mobile phone.
6. Conclusions and outlook
The multisensorial Counter-UAV system MODEAS performs drone detection, image-based classification, multisensorial fusion of detections, situational representation and visualization on a map, as well as alarm generation for intruding drones in restricted areas. Radar and visual optical sensors are used for the long- to short-range early detection, whereas a PTU-system is automatically directed on objects for closer inspection, classification, and tracking with a high-resolution camera. Since early detection performs parallel to PTU-tracking, the system can cope with multiple flying drones as well. Due to the modular and scalable architecture of the system, further sensor stations can be easily integrated, depending on the use case scenario and covering area. Main strengths of the system include the robust CNN-based detection and classification, the precise and smooth tracking with the PTU-camera and the situational representation and assistance functions.
Future works aim to extend the detection and classification to fixed-wing drones and to further increase the detection range of both overview cameras and PTU-camera. Concerning the tracking with the PTU, the overall latency might be reduced by using cameras or frame grabbers without frame buffers. In order to determine more precisely image acquisition time stamps, a GigE camera with PTP (precision time protocol) synchronization could be used. PTP achieves accuracies down to sub-microseconds and the timestamp is exactly taken at the time of image acquisition and not at the time of availability in the computer. Finally, the volume of the system needs to be reduced in order to increase its mobility for transportation.
References
- Business is booming as regulators relax drone laws. Available online: https://www.economist.com/science-and-technology/2021/06/17/business-is-booming-as-regulators-relax-drone-laws (accessed on 12.12.2023).
- Counter drone (C-UAV) systems: Market and technology forecast to 2030. https://www.unmannedairspace.info/counter-uas-systems-and-policies/counter-drone-c-uav-systems-market-and-technology-forecast-to-2030/ (accessed on 12.12.2023).
- MODEAS: Modular drone detection and assistance system. Available online: https://www.iosb.fraunhofer.de/en/projects-and-products/modeas-drone-detection.html (accessed on 12.12.2023).
- A. Schumann, L. Sommer, T. Müller, and S. Voth: An Image Processing Pipeline for Long Range UAV Detection, SPIE Security + Defence, Berlin, Germany, 10-13 September 2018. In Proc. of the SPIE Vol. 10799: Emerging Imaging and Sensing Technologies for Security and Defence III, and Unmanned Sensors, Systems, and Countermeasures, 2018.
- T. Perschke, K. Moren, and T. Müller: Real-Time Detection of Drones at Large Distances with 25 Megapixel Cameras, SPIE Security + Defence, Berlin, Germany, 10-13 September 2018. In Proc. of the SPIE Vol. 10799: Emerging Imaging and Sensing Technologies for Security and Defence III, and Unmanned Sensors, Systems, and Countermeasures, 2018.
- T. Müller: Robust Drone Detection for Day/Night Counter-UAV with Static VIS and SWIR Cameras, SPIE Defense + Commercial Sensing, Anaheim, California, USA, 9-13 April 2017. In Proc. of the SPIE Vol. 10190: Airborne Intelligence, Surveillance, Reconnaissance (ISR) Systems and Applications XIV, 2017.
- T. Müller and B. Erdnüß: Robust Drone Detection with Static VIS and SWIR Cameras for Day and Night Counter-UAV, SPIE Security + Defence, Strasbourg, France, 9-12 September 2019.
- Ren, S.; He, K.; Girshick, R.; Sun, J. Faster R-CNN: Towards real-time object detection with region proposal networks. IEEE Trans. Pattern Anal. Mach. Intell. 2016, 39, 1137–1149.
- T.-Y. Lin, P. Dollár, R. Girshick, K. He, B. Hariharan, and S. Belongie: Feature pyramid networks for object detection, Proc. of the IEEE conference on computer vision and pattern recognition, 2017.
- K. He, X. Zhang, S. Ren, and J. Sun: Deep residual learning for image recognition, Proceedings of the IEEE conference on computer vision and pattern recognition, 2016.
- T.-Y. Lin, M. Maire, S. Belongie, J. Hays, P. Perona, D. Ramanan, P. Dollár, and C.L. Zitnick: Microsoft Coco: Common objects in context, in European conf. on computer vision, 740-755, Springer, 2014.
- A. Coluccia, A. Fascista, A. Schumann, L. Sommer, A. Dimou, D. Zarpalas, F. C. Akyon, et al.: Drone vs-bird detection challenge at ieee avss2021, 17th IEEE International Conference on Advanced Video and Signal Based Surveillance, 2021.
- L. Sommer und A. Schumann: Deep learning based UAV type classification, in Pattern Recognition and Tracking XXXII. Vol. 11735. SPIE, 2021.
- L. Sommer und A. Schumann: Using temporal information for improved UAV type classification, in Artificial Intelligence and Machine Learning in Defense Applications III. Vol. 11870. SPIE, 2021.
- T. He, Z. Zhang, H. Zhang, Z. Zhang, J. Xie, and M. Li: Bag of tricks for image classification with convolutional neural networks, Proc. of the IEEE conf. on computer vision and pattern recog., 2019.
- O. Russakovsky, J. Deng, H. Su, J. Krause, S. Satheesh, S. Ma, Z. Huang, A. Karpathy, A. Khosla, M. Bernstein, et al.: Imagenet large scale visual recognition challenge, Int. Journal of Computer Vision 115(3), 211-252, 2015. [CrossRef]
- A.F. Genovese, “The Interacting Multiple Model Algorithm for Accurate State Estimation of Maneuvering Targets”, Johns Hopkins APL Technical Digest, Vol. 22, No. 4, 2001.
- J. Yang et al., “A Novel Motion-Intelligence-Based Control Algorithm for Object Tracking by Controlling PAN-Tilt Automatically”, Hindawi Mathematical Problems in Engineering, 2019.
- Ph. Tran et al., “Design control system for Pan-Tilt Camera for Visual Tracking based on ADAR method taking into account energy output”, Int. Conf. on Energy Efficiency and Energy Saving in Technical Systems (EEESTS), 2021.
- B. Vo and W. Ma, “The Gaussian Mixture Probability Hypothesis Density Filter,” in IEEE Transactions on Signal Processing, vol. 54, no. 11, pp. 4091-4104, Nov. 2006. [CrossRef]
- D.E. Clark, K. Panta and B. Vo, “The GM-PHD Filter Multiple Target Tracker,” 2006 9th International Conference on Information Fusion, 2006, pp. 1-8. [CrossRef]
- B. Ristic, D. Clark, B. Vo and B. Vo, “Adaptive Target Birth Intensity for PHD and CPHD Filters,” in IEEE Transactions on Aerospace and Electronic Systems, vol. 48, no. 2, pp. 1656-1668, Apr 2012. [CrossRef]
- Fraunhofer IOSB: Digitaler Lagetisch. Available online: https://www.iosb.fraunhofer.de/de/projekte-produkte/digitaler-lagetisch.html (accessed on 12.12.2023).
- A. Lindner; T. Müller; L. Sommer; T. Emter; A. Zube; A. Kröker. Drone detection, recognition and assistance system for C-UAV with optical and radar sensors. STO Proceedings of NATO SET-315 Research Symposium on Detection, Tracking, ID and Defeat of Small UAVs in Complex Environments, Copenhagen, 9.-10. October 2023.
|
Disclaimer/Publisher’s Note: The statements, opinions and data contained in all publications are solely those of the individual author(s) and contributor(s) and not of MDPI and/or the editor(s). MDPI and/or the editor(s) disclaim responsibility for any injury to people or property resulting from any ideas, methods, instructions or products referred to in the content. |
© 2024 by the authors. Licensee MDPI, Basel, Switzerland. This article is an open access article distributed under the terms and conditions of the Creative Commons Attribution (CC BY) license (https://creativecommons.org/licenses/by/4.0/).
