
Submitted:
20 January 2024
Posted:
22 January 2024
You are already at the latest version
Abstract
Langya Henipavirus (LayV) is a new zoonotic Henipavirus reported in 2022. Patients infected by LayV show common cold symptoms, such as fever, fatigue, and cough. Non-fatal cases associated with this virus have been reported in Henan and Shandong provinces in China. Should human-to-human transmission occur, it has the potential to be a pandemic like SARS-CoV-2. LayV is an enveloped negative-sense RNA virus. Its polymerase (encoded by the L gene) is considered a conserved target shared within Henipavirus viruses, allowing for qPCR detection, in which primers play a pivotal role. For the development of a diagnostic kit, we designed three primer sets targeting the L gene and evaluated their detection of plasmids carrying part of the L gene. Primer sets 1 and 2 were found to be suitable for further sensitivity, specificity, and efficiency testing. Both primer sets were able to amplify PCR products in the presence of human saliva, and both the melt curve analysis and gel electrophoresis showed distinct peaks and bands, supporting the specificity of the qPCR primers. Based on standard curve analysis, both primers detected as low as approximately 1000 copies of the L gene. Given the specificity and robustness to work in the presence of saliva, the primers can be used for pandemic-preparedness in LayV detection.
Keywords:
Langya Henipavirus
; primer design
; qPCR
; detection kit
Introduction
Langya Henipavirus (LayV) is a zoonotic Henipavirus reported in 2022 [1]. At the time of writing, 35 cases of febrile illness were associated with this virus in Shandong and Henan province, China [1], with no deaths reported [2]. LayV demonstrates genetic proximity to Mojiang Henipavirus, a strain known for its ability to cause fatal human pneumonia [1]. Considering that some Henipavirus exhibit high mortality rates, it is recommended to monitor the LayV closely [3]. Presently, shrews are suspected to be the primary host of this virus [1] with no known human-to-human transmission reported.
Henipavirus is a genus under Mononegavirus [1], and are enveloped negative-sense RNA viruses with six main function proteins: structural components encompass the matrix protein, fusion glycoprotein, and attachment glycoprotein; whereas non-structural elements encompass the nucleocapsid, phosphoprotein, and polymerase [4]. The non-structural components form a complex in charge of the replication of viral RNA [4]. Polymerase, also known as the multifunctional enzyme monomeric L (L protein), is the biggest protein in all Mononegavirales [5]. The L protein is a single polypeptide, highly conserved in sequence [6], with five major domains of L protein: RNA-dependent RNA polymerization domain (RdRp), capping domain (Cap), connector domain (CD), methyltransferase domain (MT), and C-terminal domain (CTD) [5]. The L protein is not only in charge of the duplication of genomic RNA but also possess transcription activity [5]. Given the its many enzymatic functions, it is a popular target also in Ebolavirus and Rabies virus [7,8]. In this study, we chose the L gene, responsible for encoding the L protein in LayV, as the target for designing primer sets.
LayV infection is characterized by typical cold symptoms, such as fever, cough, fatigue, poor appetite, and muscle pain, with occasional myalgia and nausea. Leucopenia and thrombocytopenia are common, while severe complications such as pneumonia and organ dysfunction were reported in a small proportion of cases [1,9]. In light of LayV infection displaying symptoms similar to other Henipavirus, and considering the potential seriousness of complications seen in the highly pathogenic members of this genus, there is need to monitor LayV infections for human-to-human transmissions [3]. Hence, there is a need to develop a detection method to monitor LayV infections for pandemic prepardedness, as ought to be performed for other zoonotic viruses [10].
Nucleic acid detection was shown to be the gold standard for diagnosis during the recent COVID-19 pandemic given its high sensitivity [11] compared to alternative methods such as antigen rapid tests (ART) [12]. Thus, learning from COVID-19, the best diagnostic for LayV would be qPCR [13].
Primer sets are pivotal components of nucleic acid detection kits. Thus, this study addressed the need to monitor LayV infections by designing three specific primer sets that target a segment of the LayV L gene. The L gene is responsible for encoding the highly conserved L protein of LayV. Two primer sets had demonstrated potential applicability in the development of LayV nucleic acid detection kits.
Materials and Methods
1.1. Synthesis of LayV L gene template
The L gene template sequence was obtained from GenBank (Accession number: OM101125.1), and the initial 540bp of DNA sequence in the L gene was selected as the template. The provided template was inserted into the pUC57 plasmid and transformed into Top10 Escherichia coli [14], followed by processing as previously discussed [15,16].The DNA synthesis was performed by Sangon Biotech (Shanghai, China).
2.2. Design of LayV L gene primer
The selected initial 540bp segment of L gene was selected as the template for primer design. Primer set 1 was designed by Sangong Biotech, primer set 2 and primer set 3 were designed using the Primer3Plus by ourselves [17].

Table 1.
Designed primer sets of target L genes.
| Target | Sequence (5’-3’) | Length (bp) | Product size (bp) | |
| Primer set 1 | L Gene | F1: GATCCGACTCTGAATGATGTCATTG R1: CAGTCAAGCAGTCCACCAAGC |
25 21 |
202 |
| Primer set 2 | L Gene | F2: CGGTTCAGTGAGATTCCATGC R2: TCAGTCAAGCAGTCCACCAAG |
21 21 |
215 |
| Primer set 3 | L Gene | F3: GGCTGTACGGTTCAGTGAGAbR3 : CAGTCCACCAAGCTAGGGTC |
20 20 |
214 |
2.3. Extraction of DNA template
To revive E. coli with the gene template from glycerol freezing, the glycerol culture was streaked on LB solid medium (Qingdao Hope Bio-Technology) without antibiotics [16]. After 24 hours of cultivation at 37°C, a single colony was selected and inoculated into 5mL of LB broth (Qingdao Hope Bio-Technology). The culture was then incubated for 18 hours at 37°C with shaking at 210rpm. Ampicillin was added at a concentration of 100μg/mL for subsequent use. After the culture became turbid, 100μL of the culture was transferred to a new medium containing 5ml of LB broth, and the incubation was continued for another 18 hours under the same conditions. The bacterial culture from the second generation of liquid medium was used for DNA extraction. Plasmid extractions were performed as previously study described [15].
2.4. Preliminary qPCR Assessment
To evaluate the the potential of the candidate primers, a preliminary qPCR assay was employed before more comprehensive testing. Primers demonstrating unsatisfactory performance were excluded in subsequent experiments.
2.5. Assessment of specificity of designed primer
To ensure the specificity of the designed primer sets for the L gene, Primer-BLAST was employed to check whether the primer yielded positive results in humans (Homo sapiens), shrews (Soricidae), bats (Chiroptera), and Mononegavirales [17,18]. During the alignment, it was set to ignore targets with five or more mismatches to the primer by default.
2.6. Determination of copy number
The concentration of the extracted DNA was determined using NanoDrop One (Thermo Fisher Scientific, U.S.A). Given that the plasmid pUC57 used has a known length of 2710 bp, and the selected L gene template is 540 bp, the following formula can be used to calculate the copy number of the extracted DNA:
The determined copy number was used to titrate the qPCR sensitivity.
2.7. Real-time qPCR
Before adding samples to qPCR, DNA was first subjected to a tenfold dilution gradient ranging from 100 to 10-12 using ddH2O. Subsequently, each well was loaded with 5μL of 2× S6 Universal SYBR qPCR Mix (EnzyArtisan, Shanghai, China), 0.2μL of forward primer, 0.2μL of reverse primer, 0.5μL of diluted DNA, and 4.1μL of ddH2O, making a total volume of 10μL. Finally, the 96-well plate containing the samples was centrifuged at 500rpm for 5 minutes.
The qPCR instrument utilizedin in this experiment is the QuantStudioTM 3 Real-Time PCR Instrument (96-well 0.2ml Block, Thermo Fisher Scientific, U.S.A). The experiment type was set to standard curve, and the reaction program was configured based on a previous study: the pre-denaturation phase for 30 seconds at 95°C for one cycle; the denaturation, annealing, and extension phase were for 3 seconds at 95°C, then 10 seconds at 60° for 40 cycles, respectively; the melting curve at 95°C for 15 seconds, then 60 seconds at 60°C, and finally at 95°C for 1 second, similar to previous procedure [19]. All processes were performed in at least three independent replicate experiment, and each replicate was performed in triplicate for both primer sets
2.8. Construction of Standard Curves
Standard curves were constructed to visually represent the relationship between DNA copy number and CT value [20]. Logistic regression analysis was applied to model the observed relationship in the standard curves between the DNA copy number and CT value. The R2 values, calculated from the regression analysis, depicted how well the data fits the model.
2.9. Efficiency Calculation
The efficiency of primer set was calculated using the following formula:
This formula, derived from the slope of the standard curve, provides a quantitative measure of how effectively the PCR reaction doubles the amount of DNA in each cycle.
2.10. Validation of reliability
Validation procedures were implemented to ensure the reliability of the developed qPCR assay in practical application scenarios. Following prior qPCR procedures, the lowest detectable concentration of DNA samples was subjected to qPCR analysis, simulating a real-world detection scenario. The identical qPCR reaction conditions were repeated with 2.0 μL of ddH2O substituted with saliva, emulating a real-world detection scene. This simulation aimed to assess the effect of the saliva on the qPCR sensitivity This saliva experiment was also conducted in triplicates for each primer set.
2. Results
3.1. Preliminary qPCR Assessment
During the preliminary qPCR analysis, the melt curve and standard curve results of primer set 3 were found to be unsatisfactory, leading to its exclusion from further investigation. Primer sets 1 and 2 both exhibited high sensitivity and specificity; therefore, subsequent testing and analyses were performed. The detailed results of the melt curve and standard curve for three primers are shown in Supplementary Figure S1.
3.2. Specificity of designed primers
Primer set 1 was designed by the Sangon Biotech company whereas primer set 2 was designed using online web-tools. To assess the differences in specificity between the two primer sets, Primer-BLAST was employed to predict their reactivity with gene templates of the potential host organisms for LayV. In addition to human genes, templates derived from bats (the host of many Henipaviruses, including LayV), shrews (the host of LayV), and the Mononegavirales order were also investigated for potential reactivity. we first set the programs to ignore targets with five or more mismatches by default. Under this setting, Primer-BLAST did not show any matches with the selected genomes.
To further discover the differences in specificity between the two primer sets, a higher primer specificity stringency was applied. When Primer-BLAST was adjusted to ignore targets with six or more mismatches to the primers, three target templates were identified. Primer Set 2 showed the potential to match gene templates of both Suncus etruscus and Sorex araneus, both belonging to the Soricidae family, as illustrated in Supplementary Figure S2.
3.3. Specificity of qPCR products
Figure 1.
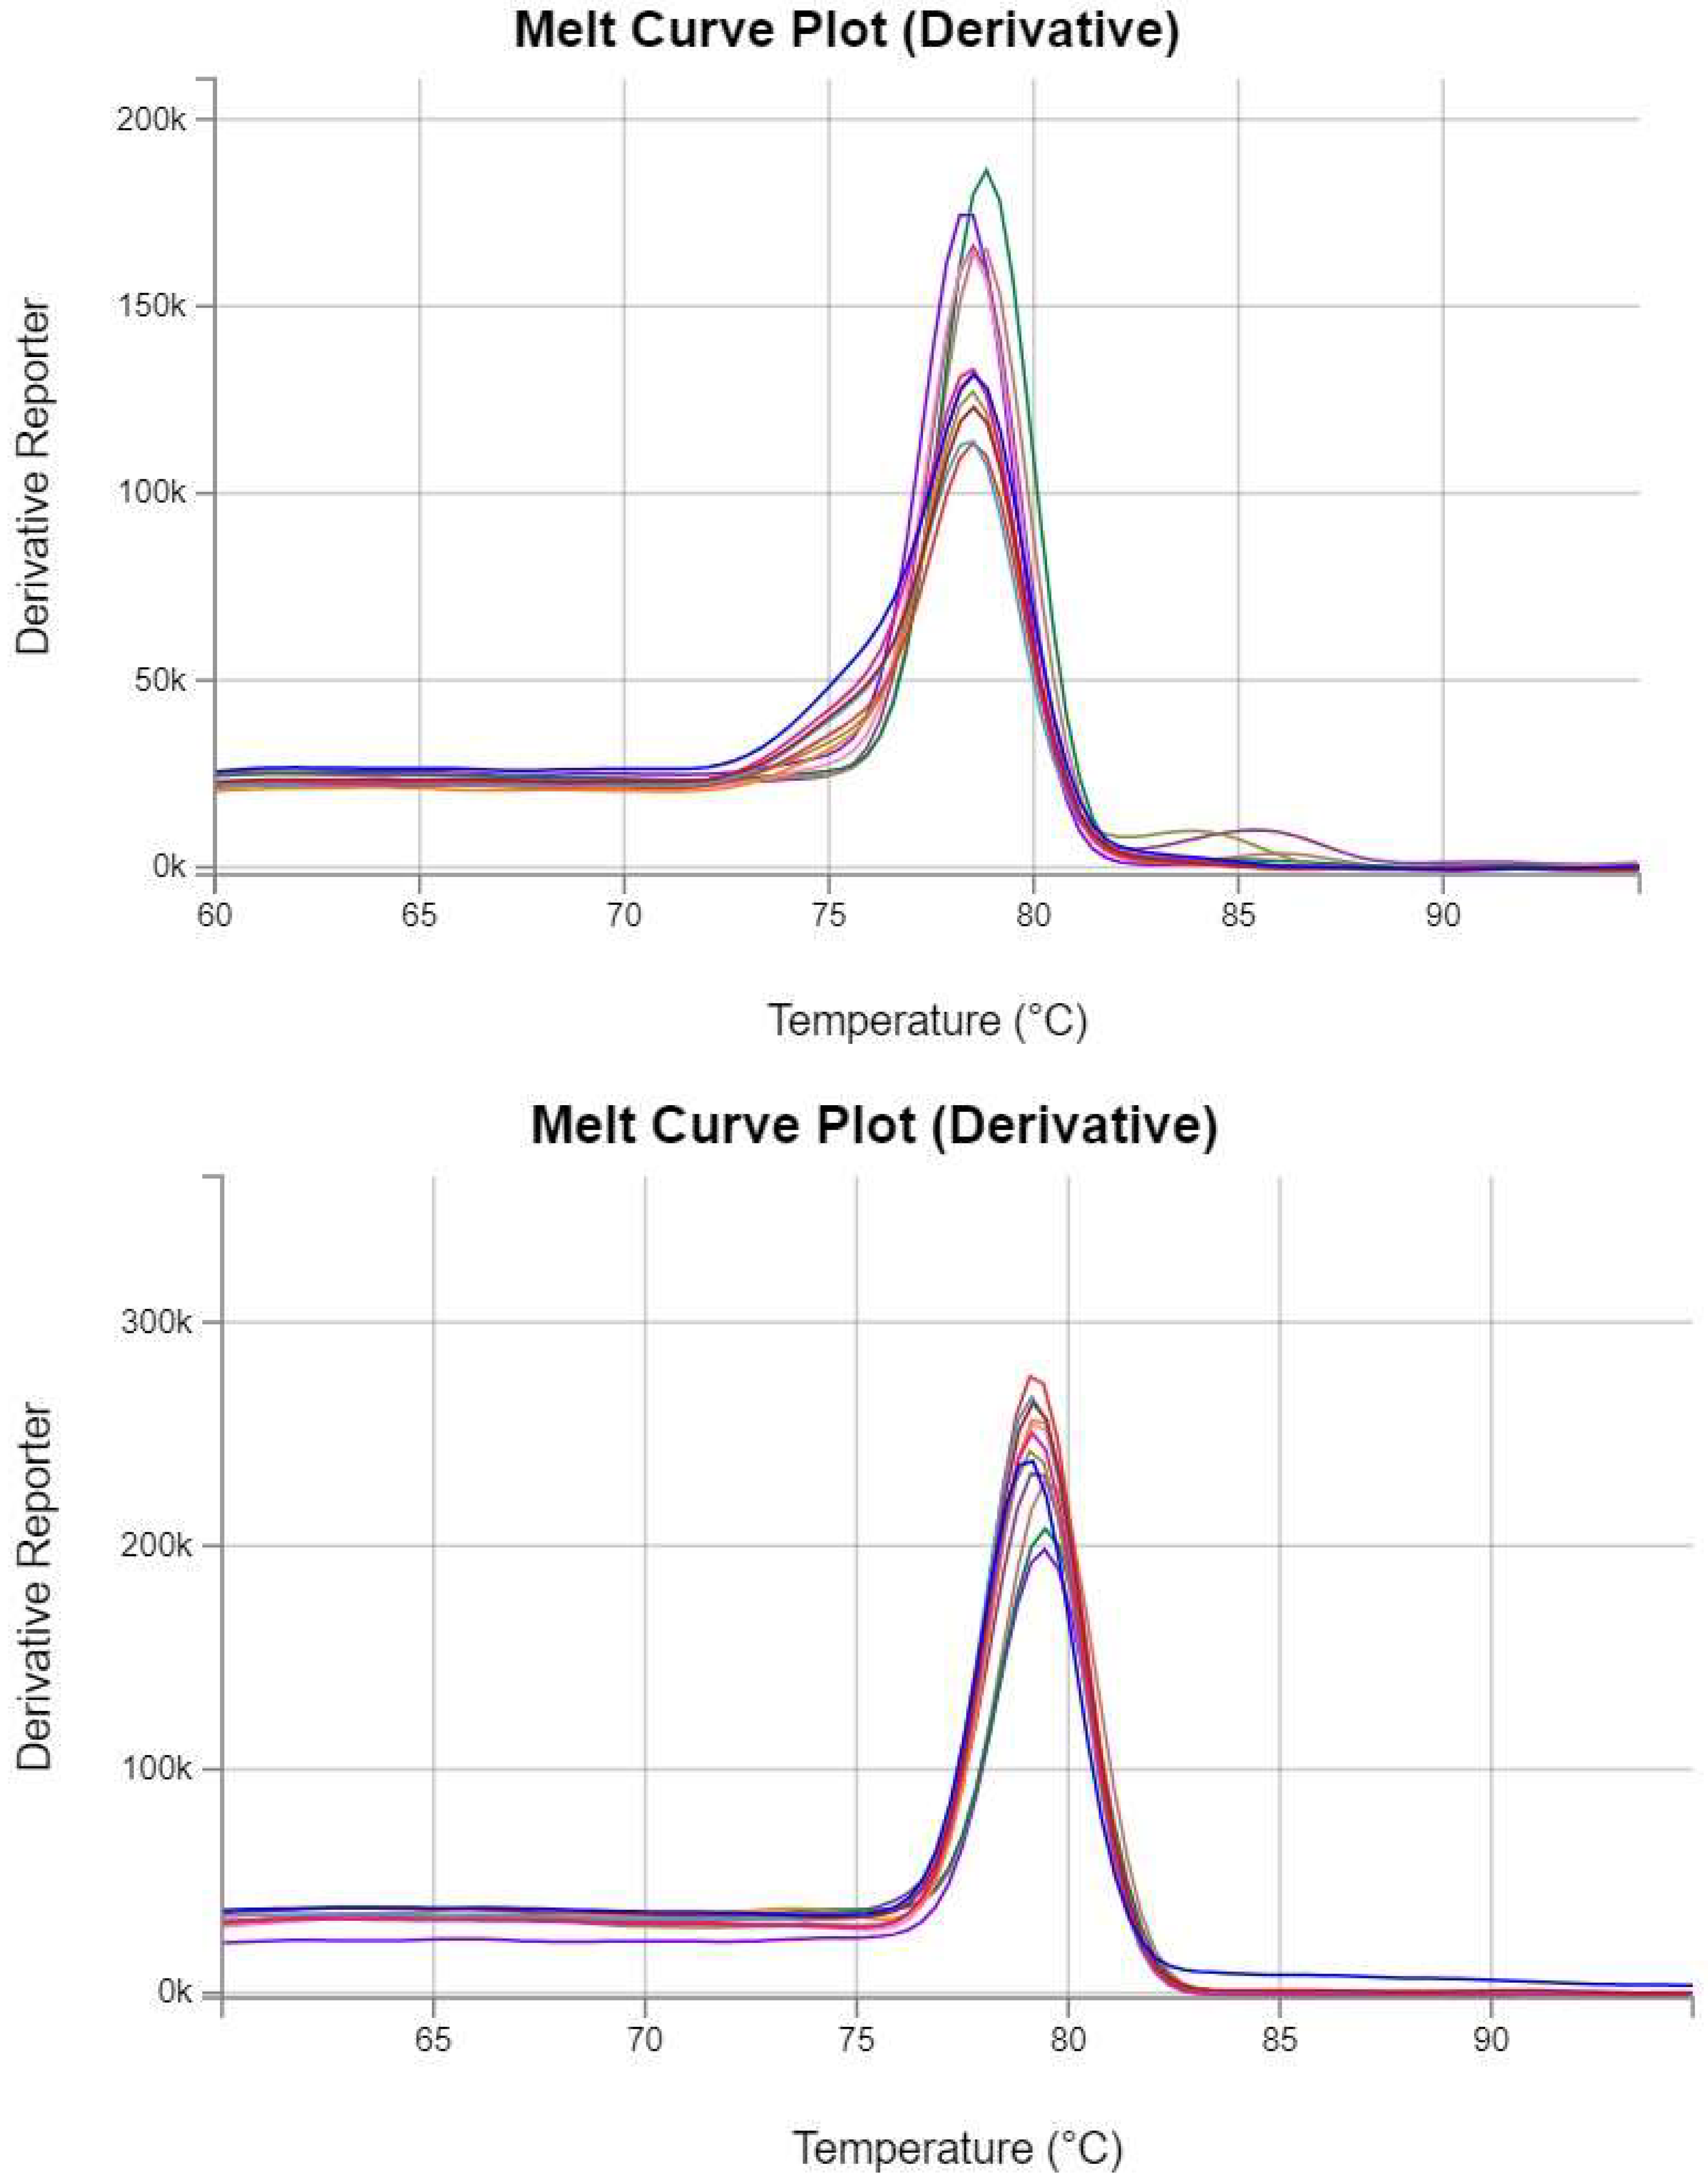
Melt curves for qPCR. (a) Melt curves for Primer set 1 against LayV L gene; (b) Melt curves for Primer set 2 against LayV L gene. Both melt curves exhibited a single sharp peak. Figure 1 represents a randomly selected set of melt curves from one replicate experiment for analysis. All repeated experiments showed consistent results, the detailed results of the repeated experiments are provided in Supplementary Figure S3.
Figure 1.
Melt curves for qPCR. (a) Melt curves for Primer set 1 against LayV L gene; (b) Melt curves for Primer set 2 against LayV L gene. Both melt curves exhibited a single sharp peak. Figure 1 represents a randomly selected set of melt curves from one replicate experiment for analysis. All repeated experiments showed consistent results, the detailed results of the repeated experiments are provided in Supplementary Figure S3.
To further validate the specificity of the designed primer sets in generating a single qPCR product, gel electrophoresis was employed to detect qPCR products. Figure 2 presents the results of a randomly selected set of gel electrophoresis results from one replicate experiment for analysis. All repeated experiments showed consistent results, the detailed results of the repeated experiments are provided in Supplementary Figure S4.
3.4. Standard curve analysis
Standard curves were constructed to evaluate the sensitivity and accuracy of the primer sets. The CT values corresponding to different DNA copy numbers were determined for both primer set 1 and primer set 2.
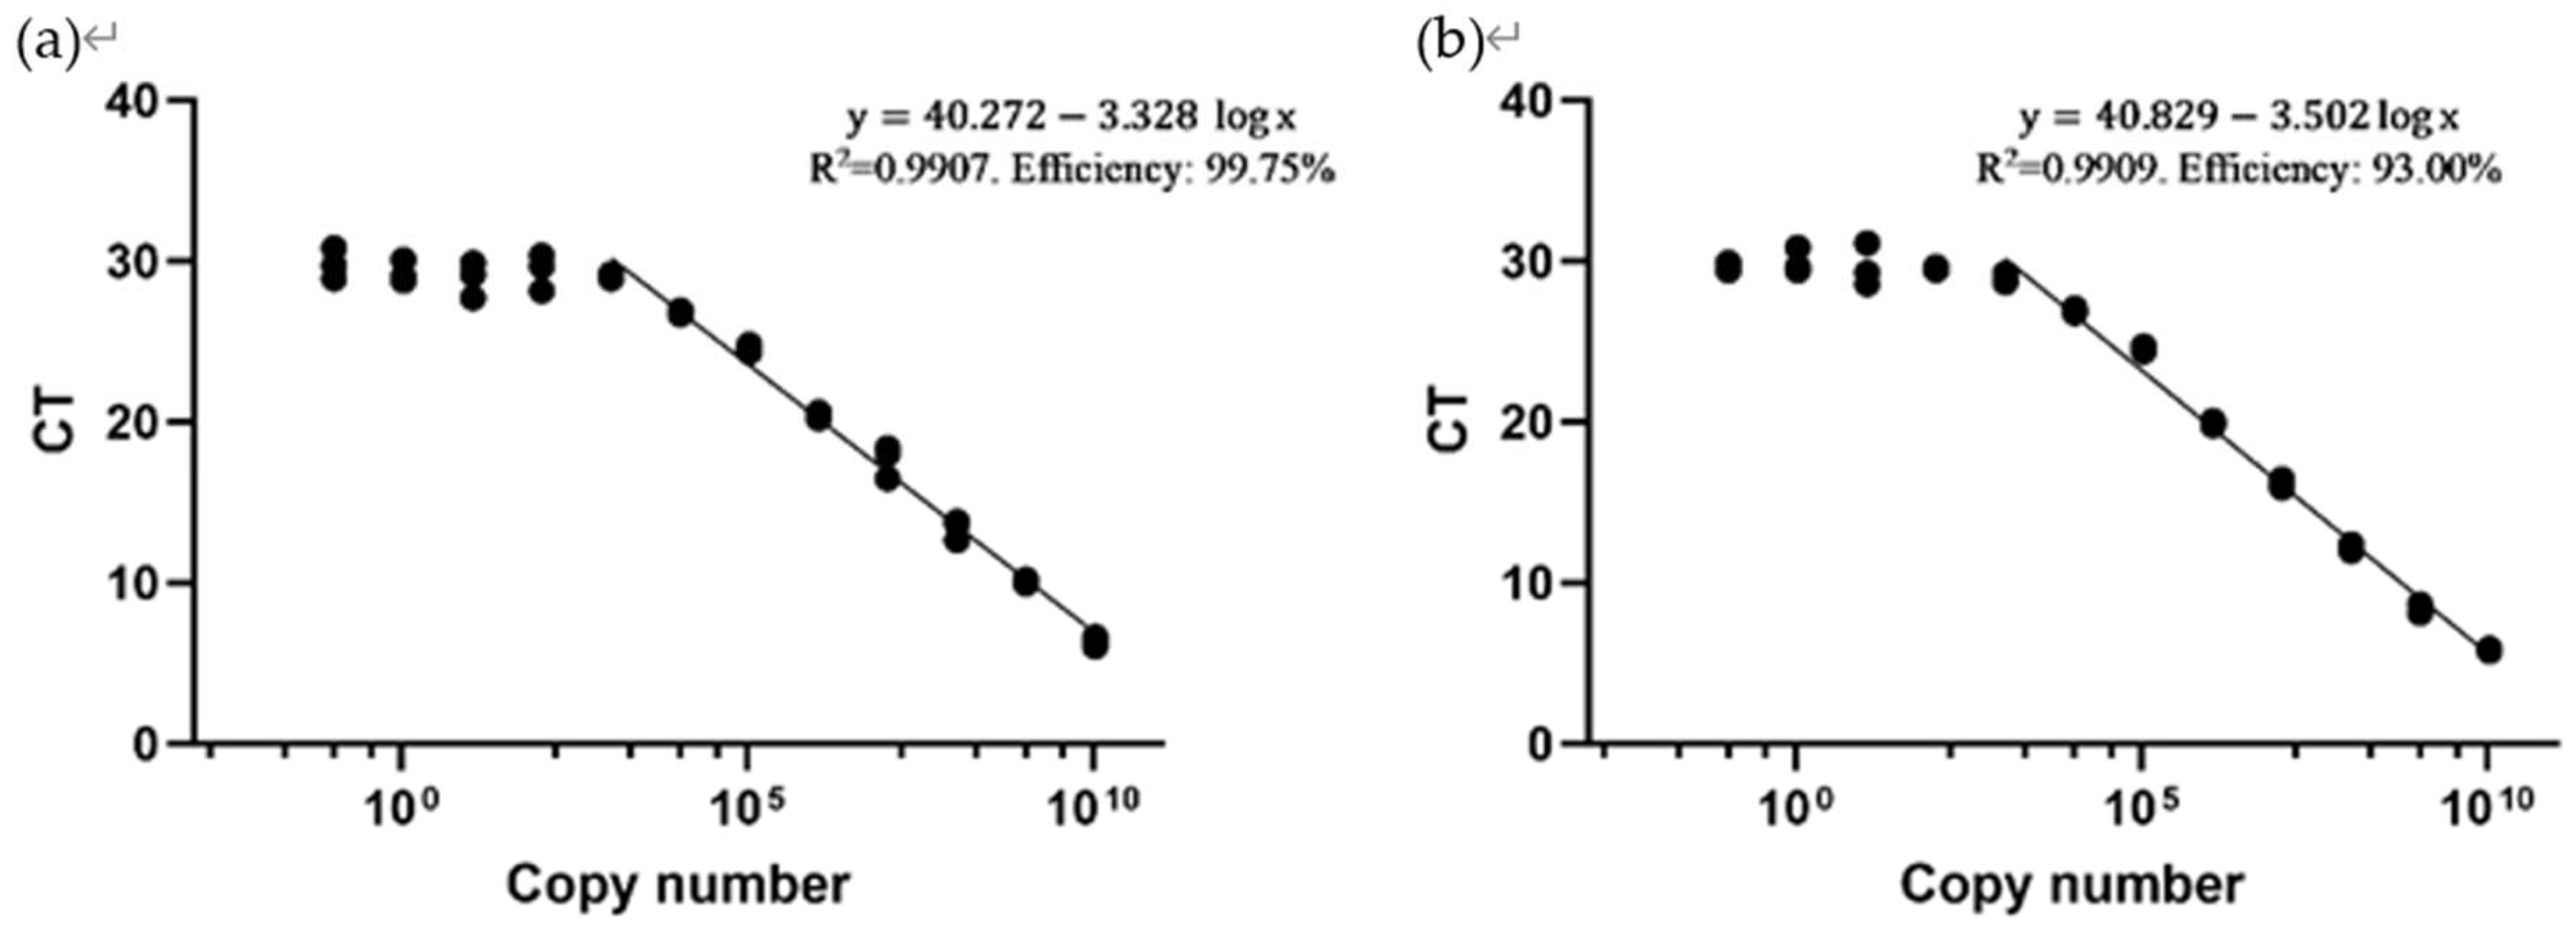
For primer set 1, the CT value ranged from 28.923 (corresponding to 1075 DNA copies) to 6.043 (corresponding to 1.075*10^10 DNA copies). Notably, at lower DNA concentrations, a CT value plateau was observed around 29.5, indicating that primer set 1 requires a minimum DNA copy number of approximately 1000 for amplification and detection.
Similarly, for primer set 2, the CT value spanned from 28.677 (corresponding to 1075 DNA copies) to 5.623 (corresponding to 1.075*10^10 DNA copies). Primer set 2 also demonstrated a CT value plateau near 29.5, suggesting that a minimum DNA copy number of approximately 1000 is required for amplification and detection.
Figure 3.
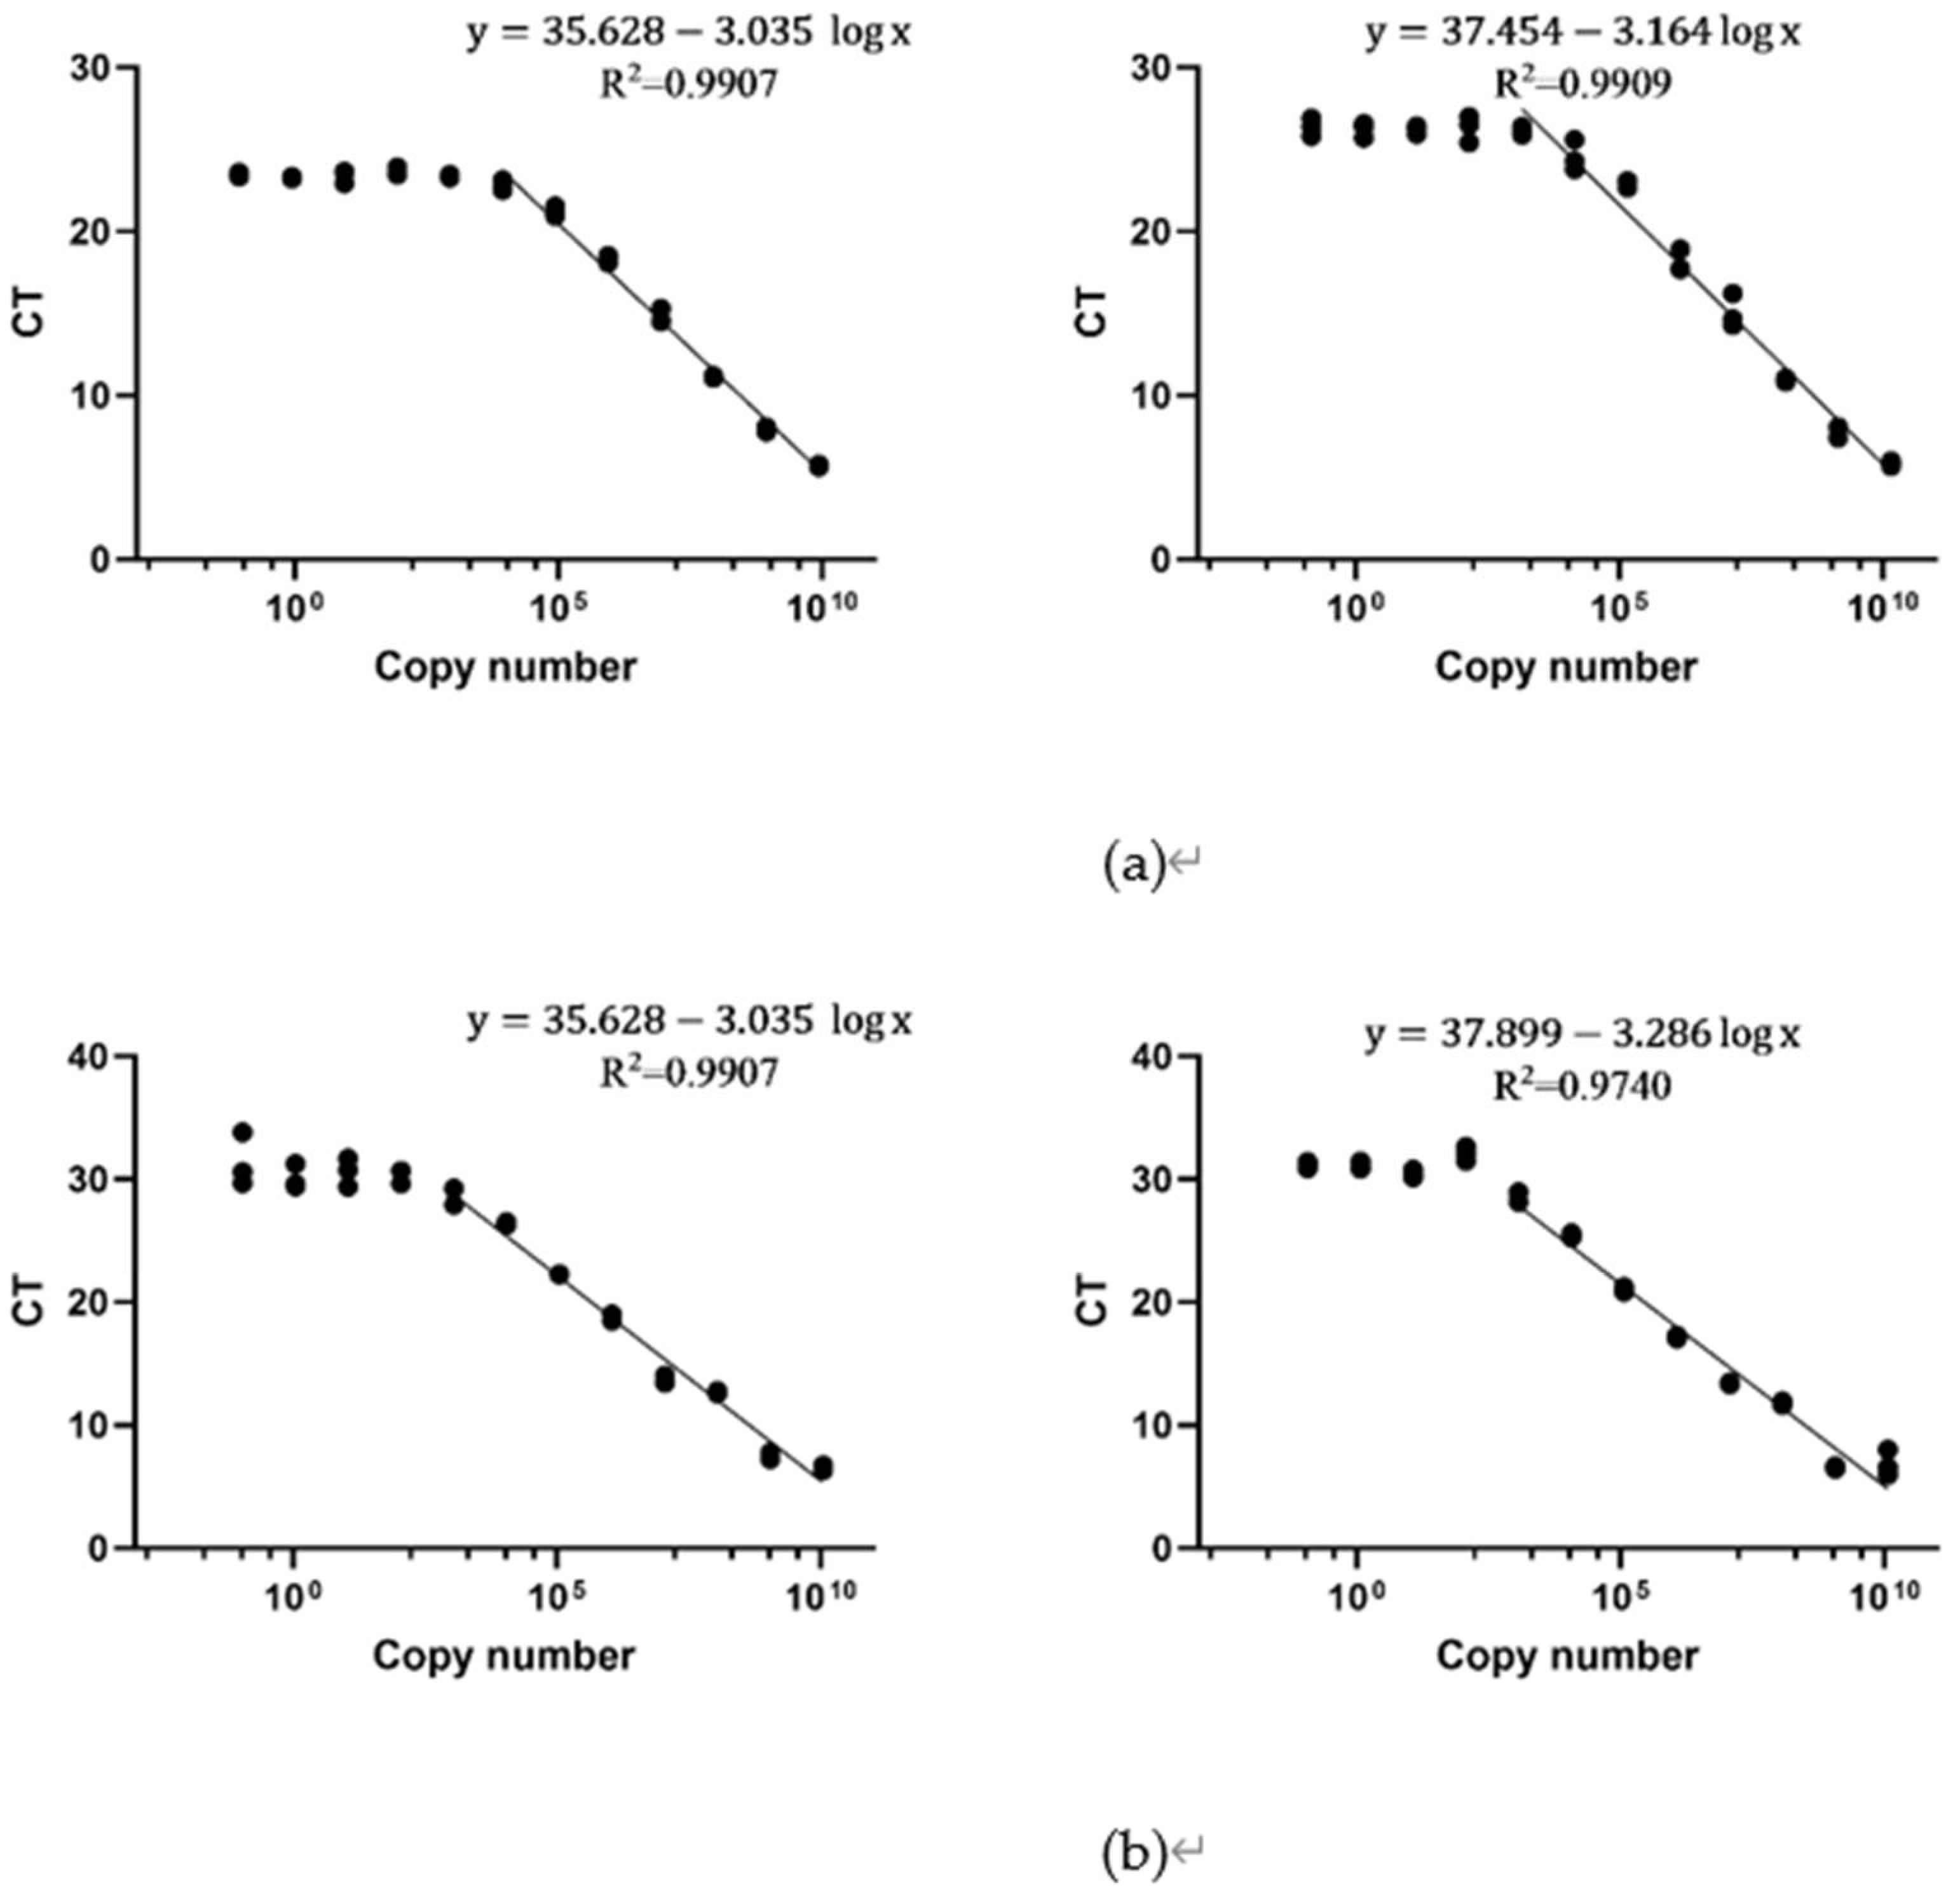
Standard Curves of both primer sets. (a) Standard curve for Primer set 1 against the LayV L gene, showing a logistic regression relationship after a copy number higher than 1000. (b) Standard Curve for Primer set 2 against LayV L gene, showing a logistic regression relationship after a copy number above 1000. The R2 values and calculated efficiencies are shown at the top right corners. The efficiency value was calculated using the formula (2). Figure 3 presents the results of a randomly selected set of standard curve results from one replicate experiment for analysis. All repeated experiments showed similar results, the detailed results of the repeated experiments are provided in Appendix Figure A1.
Figure 3.
Standard Curves of both primer sets. (a) Standard curve for Primer set 1 against the LayV L gene, showing a logistic regression relationship after a copy number higher than 1000. (b) Standard Curve for Primer set 2 against LayV L gene, showing a logistic regression relationship after a copy number above 1000. The R2 values and calculated efficiencies are shown at the top right corners. The efficiency value was calculated using the formula (2). Figure 3 presents the results of a randomly selected set of standard curve results from one replicate experiment for analysis. All repeated experiments showed similar results, the detailed results of the repeated experiments are provided in Appendix Figure A1.
3.5. Validation of reliability
To assess the reliability of the developed qPCR assay in practical diagnostic applications, the assay's performance was evaluated under conditions simulating real-world detection scenes by substituting 2.0 μL of ddH2O with human saliva. The CT values representing the amplification of the target gene, are summarized in Table 2. The CT values were obtained through triplicate analyses for both primer sets. A CT value greater than 30 indicated a failure to amplify the target gene. The results showed successful amplification of the target gene for bothe primer sets in three replicates.
4. Discussion
This study aimed to address the need for an accurate detection method for LayV infections. Specifically, we designed three primer sets for qPCR assay for LayV infections. The results showed that primer set 1 and primer set 2 have the potential to develop detection kits for LayV infections. After preliminary qPCR assessment, primer set 3 was excluded from further investigation. For the remaining two designed primer sets targeting the LayV L gene, the specificity of primer sets was determined by primer-BLAST. When assessing the potential binding of designed primer sets to DNA templates of other species, primer set 2, as indicated in Supplementary Figure S2, showed three potential binding results with the gene sequences of shrews (Soricidae). Based on previous research, shrews in China carrying LayV include Crocidura lasiura and Crocidura shantungensis [1]. Since Primer-BLAST did not provide reference sequences for these two species, the gene sequences of shrews were aligned using the option for the family Soricidae during the alignment process. Therefore, it is currently unknown whether primer set 2 would yield a positive detection for the DNA of the two native Chinese shrew species that may carry LayV. However, considering that both Crocidura lasiura and Crocidura shantungensis belong to the family Soricidae, primer 1 is more recommended when detecting LayV for Soricidae.
Melt curve analysis and gel electrophoresis confirmed the specificity of the qPCR products. Figure 1 and 2 indicate the presence of a single sharp peak in melt curves and a distinct band around 200 bp in gel electrophoresis, substantiating the amplification of the intended target without nonspecific products, validating the specificity of the qPCR assay when using pure plasmid templates. It should be noted that in the initial experiment with primer set 1, additional small peaks were observed in front of the main peaks (see Supplementary Figure S3). These additional peaks only showed up at low concentrations of the template but disappeared when the DNA copy number was over 1,000. It should be noted that primer set 1 has the probability of producing a false positive result through possible primer dimmers compared to primer set 2.
Standard curve analysis demonstrated the sensitivity and efficiency of both primer set 1 and primer set 2 with detectable DNA copy numbers spanning several orders of magnitude. The plateau observed around a CT value of 29.5 suggests the lowest limit for effective detection, approximately 1000 DNA copies (Figure 3). The efficiency was calculated by formula (2), and primer set 1 showed a higher efficiency. The sensitivities of the two primer sets are almost the same. Therefore, both primer sets are capable of detecting the presence of LayV, but primer set 1 has higher efficiency compared to primer set 2.
The validation of the qPCR assay under simulated real-world conditions, substituting ddH2O with saliva, aimed to simulate the variability encountered in practical diagnostic scenarios. The consistently low CT values (below 30) for all triplicate analyses with both primes affirm the reliability and potential utility of detecting LayV in real-world conditions (Table 2).
While the current 1000 copy limit sensitivity is suitable for some cases, the practicality of detecting lower copy numbers may be needed, especially in early-stage infections or situations with low viral loads. Future optimization strategies could be explored involving the optimization of dNTP concentrations, Taq polymerase and reaction volumes. For lower copy number detection, primer concentrations could also be increased, alongside the optimization of Tm, and annealing temperature.
Given the suspected role of shrews as primary hosts for LayV, the specificity of primer sets to shrew genes suggests their potential utility for on-site monitoring in wildlife habitats to better understand the virus's transmission in wild hosts. This could aid in early intervention to prevent zoonotic transmission between humans and animals. However, challenges such as the need for rapid, point-of-care detection in remote locations need to be further addressed.
The current hypothesis for SARS-CoV-2 suggests it is a bat-derived virus to infecting pangolins, eventually spreading to humans and subsequent human-to-human spread through a series of mutations and recombination events [21]. As for the LayV virus, which currently exhibits transmission between humans and animals, there is a potential concern that it might undergo mutations that could enable human-to-human transmission in the future [10,22,23]. Such mutations can lead to primer escapes as well, preventing detection. Thus, there is a need to monitor the LayV mutation rate as well. Nonethless, at the moment, our primers serve as an effective method of early detection. While LayV currently relies on human-animal transmission, the existence of reliable primer sets offers a proactive approach to detect and monitor potential shifts towards human-to-human transmission. This foresighted detection strategy is crucial for timely intervention and containment. In the context of the ongoing pandemic with SARS-CoV-2, the experience highlights the importance of early detection tools. Our primer sets can play a role in proactive surveillance and pandemic prepardness.
5. Conclusion
In conclusion, We initially designed three primers targeting L gene to detect LayV. The preliminary qPCR assessment led to the exclusion of primer set 3, while primer sets 1 and 2 were chose to detailed tested. The qPCR results indicated that primer set 1 and primer set 2 could detect LayV in the presence of biological fluid. Melt curve analysis and gel electrophoresis confirmed the assay's specificity, and standard curve analysis demonstrated the sensitivity and efficiency of both primer sets. While a plateau around a CT value of 29.5 was observed, indicating a minimum detectable DNA copy number of approximately 1,000. This study showed potential applications of two primer sets in LayV monitoring in both human and animal samples, and suggested the need for further optimization for broader field applicability, especially in scenarios with low viral loads. Overall, primer set 1 and primer set 2 offer a valuable tool for early LayV diagnosis, surveillance, and assistance in preventing zoonotic transmission between humans and animals.
Supplementary Materials
The following supporting information can be downloaded at: Preprints.org, Figure S1: Melt curves and standard curves for the preliminary experiments using three primers against the LayV L gene. Figure S2: Primer-BLAST result of the Langya virus L gene primer design when ignoring targets with six or more mismatches.; Figure S3: Melt curves for three replication experiments using both Primer set 1 and Primer set 2 against the Lay L gene. ; Figure S4: Gel electrophoresis of qPCR products of three replication experiments using both Primer set 1, and Primer set 2 against the LayV L gene..
Author Contributions
Conceptualization, S.K.-E.G.; methodology, S.K.-E.G.; validation, H.Z., K.Y., T.J., M.X. and S.D.; visualizat ion, H.Z., K.Y. and T.J.; formal analysis, H.Z. and K.Y.; investigation, H.Z., K.Y., T.J., M.X. and S.D.; resources, S.K.-E.G.; data curation, T.J.; writing—original draft preparation, H.Z., K.Y. and S.K.-E.G.; writing—review and editing, T.J., M.X., S.D. and S.K.-E.G.; supervision, S.K.-E.G.; project administration, S.K.-E.G.; funding acquisition, S.K.-E.G. All authors have read and agreed to the published version of the manuscript.
Funding
The work was covered by the Wenzhou Science and Technology Bureau, Key Lab Program, Wenzhou Municipal Key Laboratory for Applied Biomedical and Biopharmaceutical Informatics, Wenke Jiji (2021) No. 4, to Wenzhou-Kean University.
Institutional Review Board Statement
Not applicable
Informed Consent Statement
Not applicable as the data is from public domain.
Data Availability Statement
The raw data is available upon reasonable request made to the corresponding author.
Conflicts of Interest
The authors declare no conflict of interest.
Appendix A
Figure A1.
Standard curves for each replication experiment. (a) Two additional replication experiments for Primer set 1 against the LayV L gene. (b) Two additional replication experiments for Primer set 2 against the LayV L gene.
Figure A1.
Standard curves for each replication experiment. (a) Two additional replication experiments for Primer set 1 against the LayV L gene. (b) Two additional replication experiments for Primer set 2 against the LayV L gene.
References
- Zhang, X.-A.; Li, H.; Jiang, F.-C.; Zhu, F.; Zhang, Y.-F.; Chen, J.-J.; Tan, C.-W.; Anderson, D.E.; Fan, H.; Dong, L.-Y.; et al. A Zoonotic Henipavirus in Febrile Patients in China. N. Engl. J. Med. 2022, 387, 470–472. [Google Scholar] [CrossRef] [PubMed]
- Centers for Disease Control and Prevention (CDC) CDC Yellow Book 2024: Health Information for International Travel; Nemhauser, J.B., Ed.; Oxford University Press, 2023; ISBN 978-0-19-757094-4.
- Chakraborty, S.; Chandran, D.; Mohapatra, R.K.; Islam, M.A.; Alagawany, M.; Bhattacharya, M.; Chakraborty, C.; Dhama, K. Langya Virus, a Newly Identified Henipavirus in China - Zoonotic Pathogen Causing Febrile Illness in Humans, and Its Health Concerns: Current Knowledge and Counteracting Strategies – Correspondence. Int. J. Surg. 2022, 105, 106882. [Google Scholar] [CrossRef] [PubMed]
- Broder, C.C.; Wong, K.T. Henipaviruses. In Neurotropic Viral Infections: Volume 1: Neurotropic RNA Viruses; Reiss, C.S., Ed.; Springer International Publishing: Cham, 2016; pp. 45–83. ISBN 978-3-319-33133-1. [Google Scholar]
- Liang, B. Structures of the Mononegavirales Polymerases. J. Virol. 2020, 94, 10–1128. [Google Scholar] [CrossRef] [PubMed]
- Rockx, B.; Winegar, R.; Freiberg, A.N. Recent Progress in Henipavirus Research: Molecular Biology, Genetic Diversity, Animal Models. Antiviral Res. 2012, 95, 135–149. [Google Scholar] [CrossRef] [PubMed]
- Martin, B.; Coutard, B.; Guez, T.; Paesen, G.C.; Canard, B.; Debart, F.; Vasseur, J.-J.; Grimes, J.M.; Decroly, E. The Methyltransferase Domain of the Sudan Ebolavirus L Protein Specifically Targets Internal Adenosines of RNA Substrates, in Addition to the Cap Structure. Nucleic Acids Res. 2018, 46, 7902–7912. [Google Scholar] [CrossRef] [PubMed]
- Santos Katz, I.S.; Dias, M.H.; Lima, I.F.; Chaves, L.B.; Ribeiro, O.G.; Scheffer, K.C.; Iwai, L.K. Large Protein as a Potential Target for Use in Rabies Diagnostics. Acta Virol. 2017, 61, 280–288. [Google Scholar] [CrossRef] [PubMed]
- Carbonaro, G. Langya: What We Know about the Potentially Fatal Virus Found in China. Available online: https://www.euronews.com/next/2022/08/10/langya-virus-new-animal-to-human-layv-virus-being-monitored-in-china (accessed on 5 January 2024).
- Yeo, J.Y.; Gan, S.K.-E. Peering into Avian Influenza A(H5N8) for a Framework towards Pandemic Preparedness. Viruses 2021, 13, 2276. [Google Scholar] [CrossRef] [PubMed]
- Cassedy, A.; Parle-McDermott, A.; O’Kennedy, R. Virus Detection: A Review of the Current and Emerging Molecular and Immunological Methods. Front. Mol. Biosci. 2021, 8. [Google Scholar] [CrossRef] [PubMed]
- Nah, C.; Wu, W.; Gan, S.K.-E.; Wong, S.W.-G. ‘Antigen Rapid Test’ Image-Processing Based Machine Learning Algorithm for ART Buddy. Sci. Phone Apps Mob. Devices 2022, 8, 1–12. [Google Scholar] [CrossRef]
- CDC Healthcare Workers. Available online: https://www.cdc.gov/coronavirus/2019-ncov/hcp/testing-overview.html (accessed on 6 January 2024).
- Chan, W.-T.; Verma, C.S.; Lane, D.P.; Gan, S.K.-E. A Comparison and Optimization of Methods and Factors Affecting the Transformation of Escherichia Coli. Biosci. Rep. 2013, 33, e00086. [Google Scholar] [CrossRef] [PubMed]
- JunJie Poh, S.K.G. The Determination of Factors Involved in Column-Based Nucleic Acid Extraction and Purification. J. Bioprocess. Biotech. 2014, 04. [Google Scholar] [CrossRef]
- Thean, R.K.-R.; Ong, D.X.-Y.; Heng, Z.S.-L.; Gan, S.K.-E.; Yeo, J.Y. To Plate or to Simply Unfreeze, That Is the Question for Optimal Plasmid Extraction. J. Biomol. Tech. JBT 2021, 32, 57–62. [Google Scholar] [CrossRef] [PubMed]
- Ye, J.; Coulouris, G.; Zaretskaya, I.; Cutcutache, I.; Rozen, S.; Madden, T.L. Primer-BLAST: A Tool to Design Target-Specific Primers for Polymerase Chain Reaction. BMC Bioinformatics 2012, 13, 134. [Google Scholar] [CrossRef] [PubMed]
- Tusnády, G.E.; Simon, I.; Váradi, A.; Arányi, T. BiSearch: Primer-Design and Search Tool for PCR on Bisulfite-Treated Genomes. Nucleic Acids Res. 2005, 33, e9. [Google Scholar] [CrossRef] [PubMed]
- Ling, W.-L.; Ng, Y.-L.; Wipat, A.; Lane, D.P.; Gan, S.K.-E. The Quantification of Antibody Elements and Receptors Subunit Expression Using qPCR: The Design of VH, VL, CH, CL, FcR Subunits Primers for a More Holistic View of the Immune System. J. Immunol. Methods 2020, 476, 112683. [Google Scholar] [CrossRef] [PubMed]
- Budianto, I.-H.; Wong, C.-F.; Nguyen, P.-V.; Gan, S.K.-E. StanXY: Standard Curve App for Android. Sci. Phone Apps Mob. Devices 2015, 1, 2. [Google Scholar] [CrossRef]
- Shi, Y.; Wang, G.; Cai, X.; Deng, J.; Zheng, L.; Zhu, H.; Zheng, M.; Yang, B.; Chen, Z. An Overview of COVID-19. J. Zhejiang Univ. Sci. B 2020, 21, 343–360. [Google Scholar] [CrossRef]
- Yeo, J.Y.; Koh, D.W.-S.; Yap, P.; Goh, G.-R.; Gan, S.K.-E. Spontaneous Mutations in HIV-1 Gag, Protease, RT P66 in the First Replication Cycle and How They Appear: Insights from an In Vitro Assay on Mutation Rates and Types. Int. J. Mol. Sci. 2020, 22, 370. [Google Scholar] [CrossRef] [PubMed]
- Yeo, J.Y.; Goh, G.-R.; Su, C.T.-T.; Gan, S.K.-E. The Determination of HIV-1 RT Mutation Rate, Its Possible Allosteric Effects, and Its Implications on Drug Resistance. Viruses 2020, 12, 297. [Google Scholar] [CrossRef] [PubMed]
Figure 2.
Gel electrophoresis of the qPCR amplifying products of both primer sets (a) Gel electrophoresis result for Primer set 1 against LayV L gene; (b) Gel electrophoresis result for Primer set 2 against LayV L gene. Figure 2 presents the results demonstrating that the products of both primers have a size of approximately 200 bp, with no other visible products.
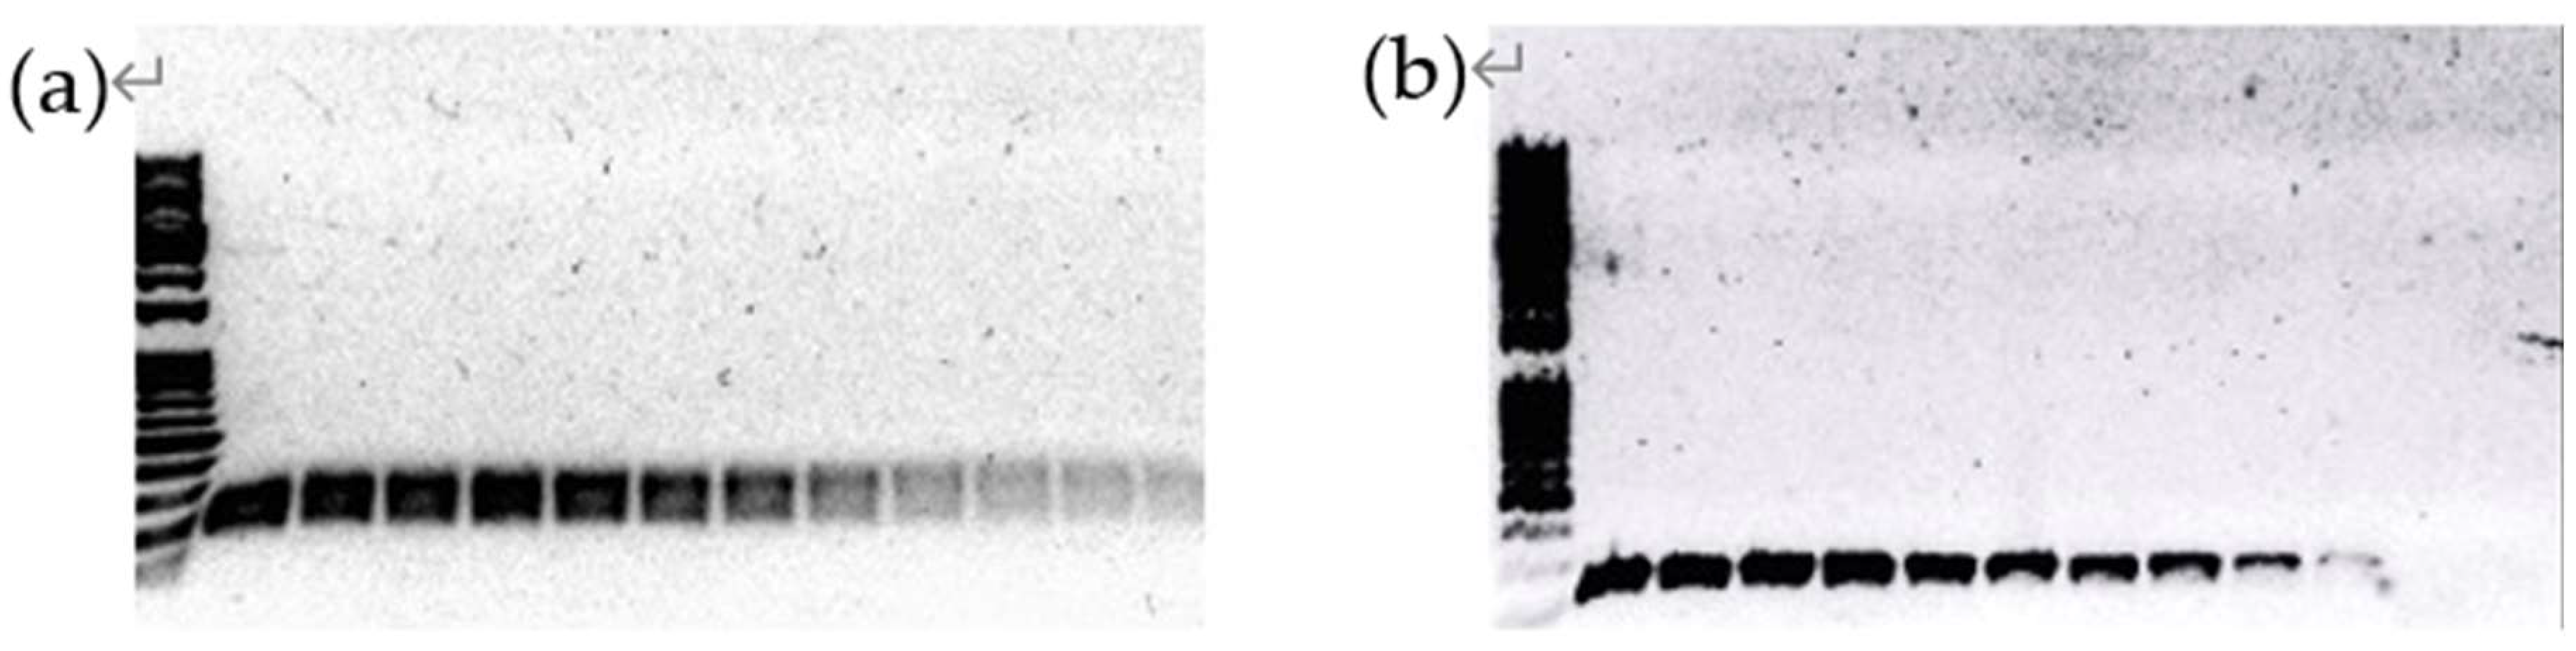
Table 2.
Validation of qPCR Assay Under Simulated Real-World Detection Scene. All samples exhibited CT values below 30 for both primer set 1 and primer set 2, indicative of successful amplification of the target gene.
Table 2.
Validation of qPCR Assay Under Simulated Real-World Detection Scene. All samples exhibited CT values below 30 for both primer set 1 and primer set 2, indicative of successful amplification of the target gene.
| Copy number | CT | |
| 23.454 |
||
| Primer set 1 | 1000 | 25.359 |
| 27.217 | ||
| 25.883 | ||
| Primer set 2 | 1000 | 26.967 |
| 25.907 |
Disclaimer/Publisher’s Note: The statements, opinions and data contained in all publications are solely those of the individual author(s) and contributor(s) and not of MDPI and/or the editor(s). MDPI and/or the editor(s) disclaim responsibility for any injury to people or property resulting from any ideas, methods, instructions or products referred to in the content. |
© 2024 by the authors. Licensee MDPI, Basel, Switzerland. This article is an open access article distributed under the terms and conditions of the Creative Commons Attribution (CC BY) license (http://creativecommons.org/licenses/by/4.0/).
Copyright: This open access article is published under a Creative Commons CC BY 4.0 license, which permit the free download, distribution, and reuse, provided that the author and preprint are cited in any reuse.


