Preprint
Article

Ethiopian Cement Plants: Examining Emissions and Their Impact on Community Well-Being

Altmetrics

Downloads

321

Views

95

Comments

0

Submitted:

02 January 2024

Posted:

18 January 2024

You are already at the latest version

Alerts
Abstract
In the realm of cement production, clinker-producing factories emerge as both energy and material-intensive entities, emitting a substantial array of primary pollutants into the environment compared to their non-clinker producing counterparts. Our study delves into Ethiopian clinker-producing cement factories, unraveling the concentration of primary pollutants and their repercussions on neighboring communities. Venturing beyond mere statistics, we meticulously measured particulate matter (PM2.5 and PM10) and gaseous emissions (CO2, N2O, SO2) at various units within the cement factories and in nearby residential areas. The findings reveal an ambient air quality riddled with concern; PM2.5 levels ranged from 137 to 814 μg/m3, PM10 from 195 to 886 μg/m3 within the cement factories, and PM2.5 (113 to 196 μg/m3) and PM10 (125 to 453 μg/m3) in the adjacent village. Alarmingly, these particulate matter emissions exceeded the limits set by Ethiopian ambient air quality guidelines (150 μg/m3). Unraveling the health implications, respiratory diseases were notably high among individuals aged 25 to 60, followed closely by those aged 6 to 24. In contrast, the age groups 0–5 and > 61 exhibited lesser susceptibility, as infants and the elderly spent more time at home, thus reducing exposure to emissions. Our study underscores the urgent need for legal measures, calling for the establishment of buffer zones between cement factories and settlements. This proactive step, if enforced, holds the promise of mitigating cement particulate emissions and safeguarding the well-being of communities residing in proximity to these industrial giants.
Keywords: 
Subject: Environmental and Earth Sciences  -   Environmental Science

1. Introduction

In Ethiopia, the cement industry stands out as a rapidly expanding and prioritized sector. The surge in cement demand is attributed to the development of major projects such as the Grand Renaissance Dam, various industrial parks, sugar factories, and the construction of highway and railway networks [1]. The cement production process involves several stages, encompassing quarrying, crushing, raw milling, blending, and kiln burning to produce clinker [2,3]. Chemical emissions primarily arise from the calcination of calcium carbonate (CaCO3) and magnesium carbonate (MgCO3) during these operations [4]. Subsequently, clinker is ground with gypsum and other additives to produce a finely particulate powder known as cement [2,3]. Given the energy-intensive nature of cement production, it poses a significant potential source of various pollutants, including particulate matter (PM2.5 and PM10), nitrous oxide (N2O), sulfur dioxide (SO2), carbon dioxide (CO2), carbon monoxide (CO), and a small quantity of volatile organic compounds (VOCs) [5].
In contrast to other gas pollutants, CO2 emissions in the cement industry significantly surpass those originating from the combustion of fossil fuels and the limestone calcination process. Approximately 50% of the emitted CO2 stems from fuel combustion, with the remaining half arising from the conversion of raw materials during the calcination process [4,6]. The clinker producing cement factories were more energy and material intensive than non-clinker producing cement industries. Because of this, a significant number of primary pollutants are emitted to the environment than non-clinker producing cement industry. Diseases such as tuberculosis, chronic bronchitis, chest discomfort, cardiovascular diseases, asthma attacks [7,8], and various cancers [9] are frequently reported in clinker-producing cement industries. Dust emissions in cement manufacturing plants, particularly during cleaning tasks, exceed those observed on construction sites, exacerbating health issues among vulnerable populations [10]. Cement emissions contribute to cardiovascular and respiratory morbidity and mortality [11].
Non-communicable diseases (NCDs) have emerged as a significant health concern worldwide, accounting for approximately 57 million deaths globally per year (Organization 2006). Among these, 36 million (63%) succumbed to cardiovascular diseases, cancer, respiratory diseases, diabetes, as well as asthma and chronic obstructive pulmonary disease (COPD), contributing to 4.2 million deaths. Occupation-related respiratory diseases, which include asthma and COPD, account for 10-20% of all registered work-related diseases and affect up to 50% of workers in high-risk sectors such as dust-generating works, typically mining and construction [12].
Annisa et al. (2021) investigated particulate matter (PM) emissions from a private cement industry in Maros regency, Indonesia [13]. Total suspended particulates (TSP) were sampled at five locations, revealing concentrations ranging from 18.48 μg/m3 to 133.24 μg/m3. The study identified that the maximum value exceeded acceptable levels, and non-carcinogenic risks from TSP inhalation were generally low, except at location 3. The findings led to the conclusion that cement plant emissions may pose potential health impacts, emphasizing the necessity for measures to mitigate TSP exposure in Maros regency [13]. Zeleke et al. (2011) also embarked on a pioneering one-year study to assess respiratory function, chronic symptoms, and lung changes among cement workers in Ethiopia [8]. Covering two cement factories, the study involved 262 total dust measurements on 105 randomly selected workers. Cleaners experienced a substantial geometric mean dust exposure of 432 mg/m3, with prevalent chronic respiratory symptoms. The study underscores the urgent need for preventive measures to mitigate the impact of high cement dust exposure on workers' respiratory health.
In a related study, Gizaw et al. (2016) revealed a significant prevalence of chronic respiratory symptoms (62.9%) among workers at Dejen cement factory in West Central Ethiopia. The study identified specific rates for various symptoms, including chronic cough (24.5%), chronic wheezing (36.9%), chronic phlegm (24.5%), chronic shortness of breath (38.6%), and chest pain (21.0%) [14]. Notably, the occurrence of these symptoms was associated with factors such as sex, age, education level, exposure to cement mill, burner, clinker, work experience, training on occupational safety, smoking, and pre-existing chronic respiratory disease. These findings underscore the immediate necessity for stringent regulations and their effective enforcement within the cement industry to mitigate occupational exposure to dust and respiratory hazards. Furthermore, it emphasizes the imperative for additional research to explore the prolonged health impacts of cement production on communities residing in close proximity to these factories. It is crucial to note that the existing Ethiopian industry expansion strategy lacks standardized measures for precautionary risk prevention and control mechanisms [15].
The investigation by Beketie et al. (2022) at Mugher cement factory disclosed PM2.5 emissions within the plant (120–973 μg/m3) and nearby areas, including Cuba Sefer (106–198 μg/m3), Mokoda (56–111 μg/m3), and Rejii (46–91 μg/m3). Mugher's PM10 levels ranged from 140–998 μg/m3, while neighboring areas like Cuba Sefer, Mokoda, and Rejii exhibited lower ranges [16]. The study highlighted the cement industry's impact on air quality within a 3 to 4km radius (Bank 2003). In the same study emissions of pollutants at different sites in the vicinity of the Mugher cement factory such as Adadasodolbe, Dalotta, Inchini, and Ilu Warebo located at 10, 15, 17, and 25 km respectively, from the Mugher cement factories were analyzed. Furthermore, the age group of the respondents categorized in the age group of young (≤ 14 years), adult (15–60 years), and old (≥ 60 years) were addressed. But, a compressive study on assessments of emission pollutants emitted from clinker producing cement factories at various distances as a national level was not calculated. Similarly, the prevalence effect of particulate matters for the disaggregation age group of infants (0-5), young (5-24), middle age group (25-60) and old age group (>61) for clinker producing cement factories of the country were not studied in detail.
This study aims to fill this gap by providing a comprehensive analysis encompassing all clinker-producing cement factories in Ethiopia (Dangote, National, Derba, Habesha, Kuyu, Ethio, and Pioneer) and the six health centers within a radius of 2 to 40km from these factories. The investigation evaluates primary pollutants and gases emitted from these factories, assessing air quality both inside and outside. Additionally, clinical records from nearby health centers are surveyed to explore potential associations between respiratory and cardiovascular cases and cement primary pollutant emissions.

2. Methodology

2.1. Description of the study area

The study area for this research was limited to local clinker-producing cement industries in Ethiopia, including Derba Cement plant, National Cement Share Company, Mugher Cement Enterprise, Ethio Cement P.L.C, Dangote Cement plant, Habesha Cement, and Pioneers Cement Share Company. Among these, the Derba Cement Plant stands out, strategically positioned 70 km north of Addis Ababa, boasting impressive daily capacities of 5,600 tonnes of clinker recovery and 7,000 tonnes of finished product. A significant player, the National Cement Share Company, situated 515 km from Addis Ababa in the Dire Dawa Administrative Region, commands production capacities ranging from 150 to 400 mt per day, with an average daily output of 300 mt of clinker, translating to 1.2 million tonnes of cement per year. Mugher Cement Enterprise, located approximately 90 km northwest of Addis Ababa, emerges as a key industry player, operating at an elevation of about 2450 m above sea level. This powerhouse exhibits a daily clinker production capacity of 5,000 tonnes, delivering a diversified product range including Ordinary Portland Cement (OPC), Portland Pozzolana Cement (PPC), and Pozzolana Cement (PC). Another significant contributor, Ethio Cement P.L.C, showcases its prowess with a clinker production capacity of 540,000 tonnes per year and a raw material capacity of 648,000 tonnes per year. In a collaborative venture between an Ethiopian investor and West African Cement SA (WACEM), this enterprise churns out quality ordinary Portland Cements (OPC) and Portland Pozzolana Cement.
Further enriching the Ethiopian cement industry landscape, the Dangote Cement Plant emerges as a testament to substantial investment, standing near Muger town, 87 km from Addis Ababa in the West Shewa zone. Currently producing a composition of 60% (32.5-grade cement) and 40% (42.5-grade cement), this plant represents an investment of $500 million. The Habesha Cement Production Plant, strategically located in Oromia regional state, Welmera Woreda, Holeta town, excels with a daily clinker production capacity of 3,000 tonnes and 4,500 tonnes of Portland Pozzolana Cement (PPC), contributing a significant 1.4 million tonnes per year at full operation. Pioneers Cement Share Company, positioned 515 km from Addis Ababa in the Dire Dawa administrative region, further enriches the Ethiopian cement landscape, situated at an elevation of about 1250 m above sea level. Finally, the Kuyu Cement Factory, nestled in North Shewa near Garbaguracha in Oromia regional state, adds to the diverse array of cement manufacturing facilities (Figure 1).
This comprehensive exploration covers not only the major clinker-producing cement factories, but also extends its reach to the six health centers located within a radius of 2 to 40 km from these cement giants. In addition to this expansive coverage, the study delves into the nuanced details, assessing primary pollutants and gases emitted from all clinker-producing cement factories. This meticulous examination seeks to uncover the intricate interplay between air quality inside and outside these cement facilities and the potential prevalence effects on the residents of neighboring communities. To augment the findings, exploration into clinical records of respiratory and cardiovascular cases from a nearby health center aims to unravel any possible relationships with cement primary pollutant emissions. This holistic approach not only spotlights the significance of each industry player but also emphasizes the broader impact on the health and well-being of the surrounding communities.

2.2. Data collection

2.2.1. Ambient air quality data

The study area focused on local clinker-producing cement industries in Ethiopia, including Derba, National, Mugher, Ethio, Dangote, Habesha, Pioneers, and Kuyu cement plants. The pollutants were measured in the mill, coal crusher, storage, and loading room units of the selected cement industries, as well as in nearby villages, including Sire Berga, Gatira Nabe, Sago, and Bekata. Additionally, samples were measured in four control sites, namely San-baro, Qore sena, Fite, and Haro Lemana, located 10–40 km away from the factories, to observe the effect of distance on pollutant emissions. The methodology used to select the nearby villages for data collection was based on a review of the literature [10,13,16,17]. Different scholars have used numerous distance radii from the factories to select nearby villages for data collection and disease incident analysis. For instance, previous studies have measured samples in control sites located 10–25 km away from the factories to observe the effect of distance on gaseous and particulate matter emissions [16,17]. The parameters of air quality monitored in the selected sites included particulate matter (PM2.5, PM10), nitrous oxide (N2O), sulfur dioxide (SO2), and carbon dioxide (CO2). Air pollutant measurements were conducted from August 1, 2021, to January 30, 2022, in the morning from 9 to 11 a.m. and in the afternoon from 2 to 5 p.m., for five consecutive days at all sites. The particulate matter was measured using Aeroqual PM2.5 and PM10 sensor heads, with a detection range between 0 and 999.9 μg/m3 and a detection limit of 0.1 μg/m3. N2O, SO2, and CO2 were measured using gas sensors Aeroqual series 500 monitors (S-500).
The study aimed to provide a comprehensive assessment of the emission pollutants from these factories and their impact on the health of nearby communities. It also aimed to analyze the prevalence of particulate matters for different age groups, including infants (0-5), young (5-24), middle-aged (25-60), and old age group (>61). The research was conducted in six health centers located within a radius of 2 to 40 km from the cement factories. The study area was selected based on the need for a comprehensive assessment of the impact of clinker-producing cement factories on the environment and human health in Ethiopia.

2.2.2. Clinical data

Clinical data were obtained from Itaya (2015-2021), Reji (2015-2021), Karkaresa (2017-2021), Olonkomii (2017-2021), Enchini health centre (2015-2021), and Enchiny primary Hospital (2016-2021) and divided into case and control groups. Patients in the case group were those with respiratory disorders who were evaluated and classified according to age groups. The controls were disorders unrelated to the respiratory system. Patients from afar (Sanbaro, Qore Sena, Fite, and Haro Lemana) were considered.

2.3. Analysis methods

2.3.1. Pollutant Air Quality Index (AQI)
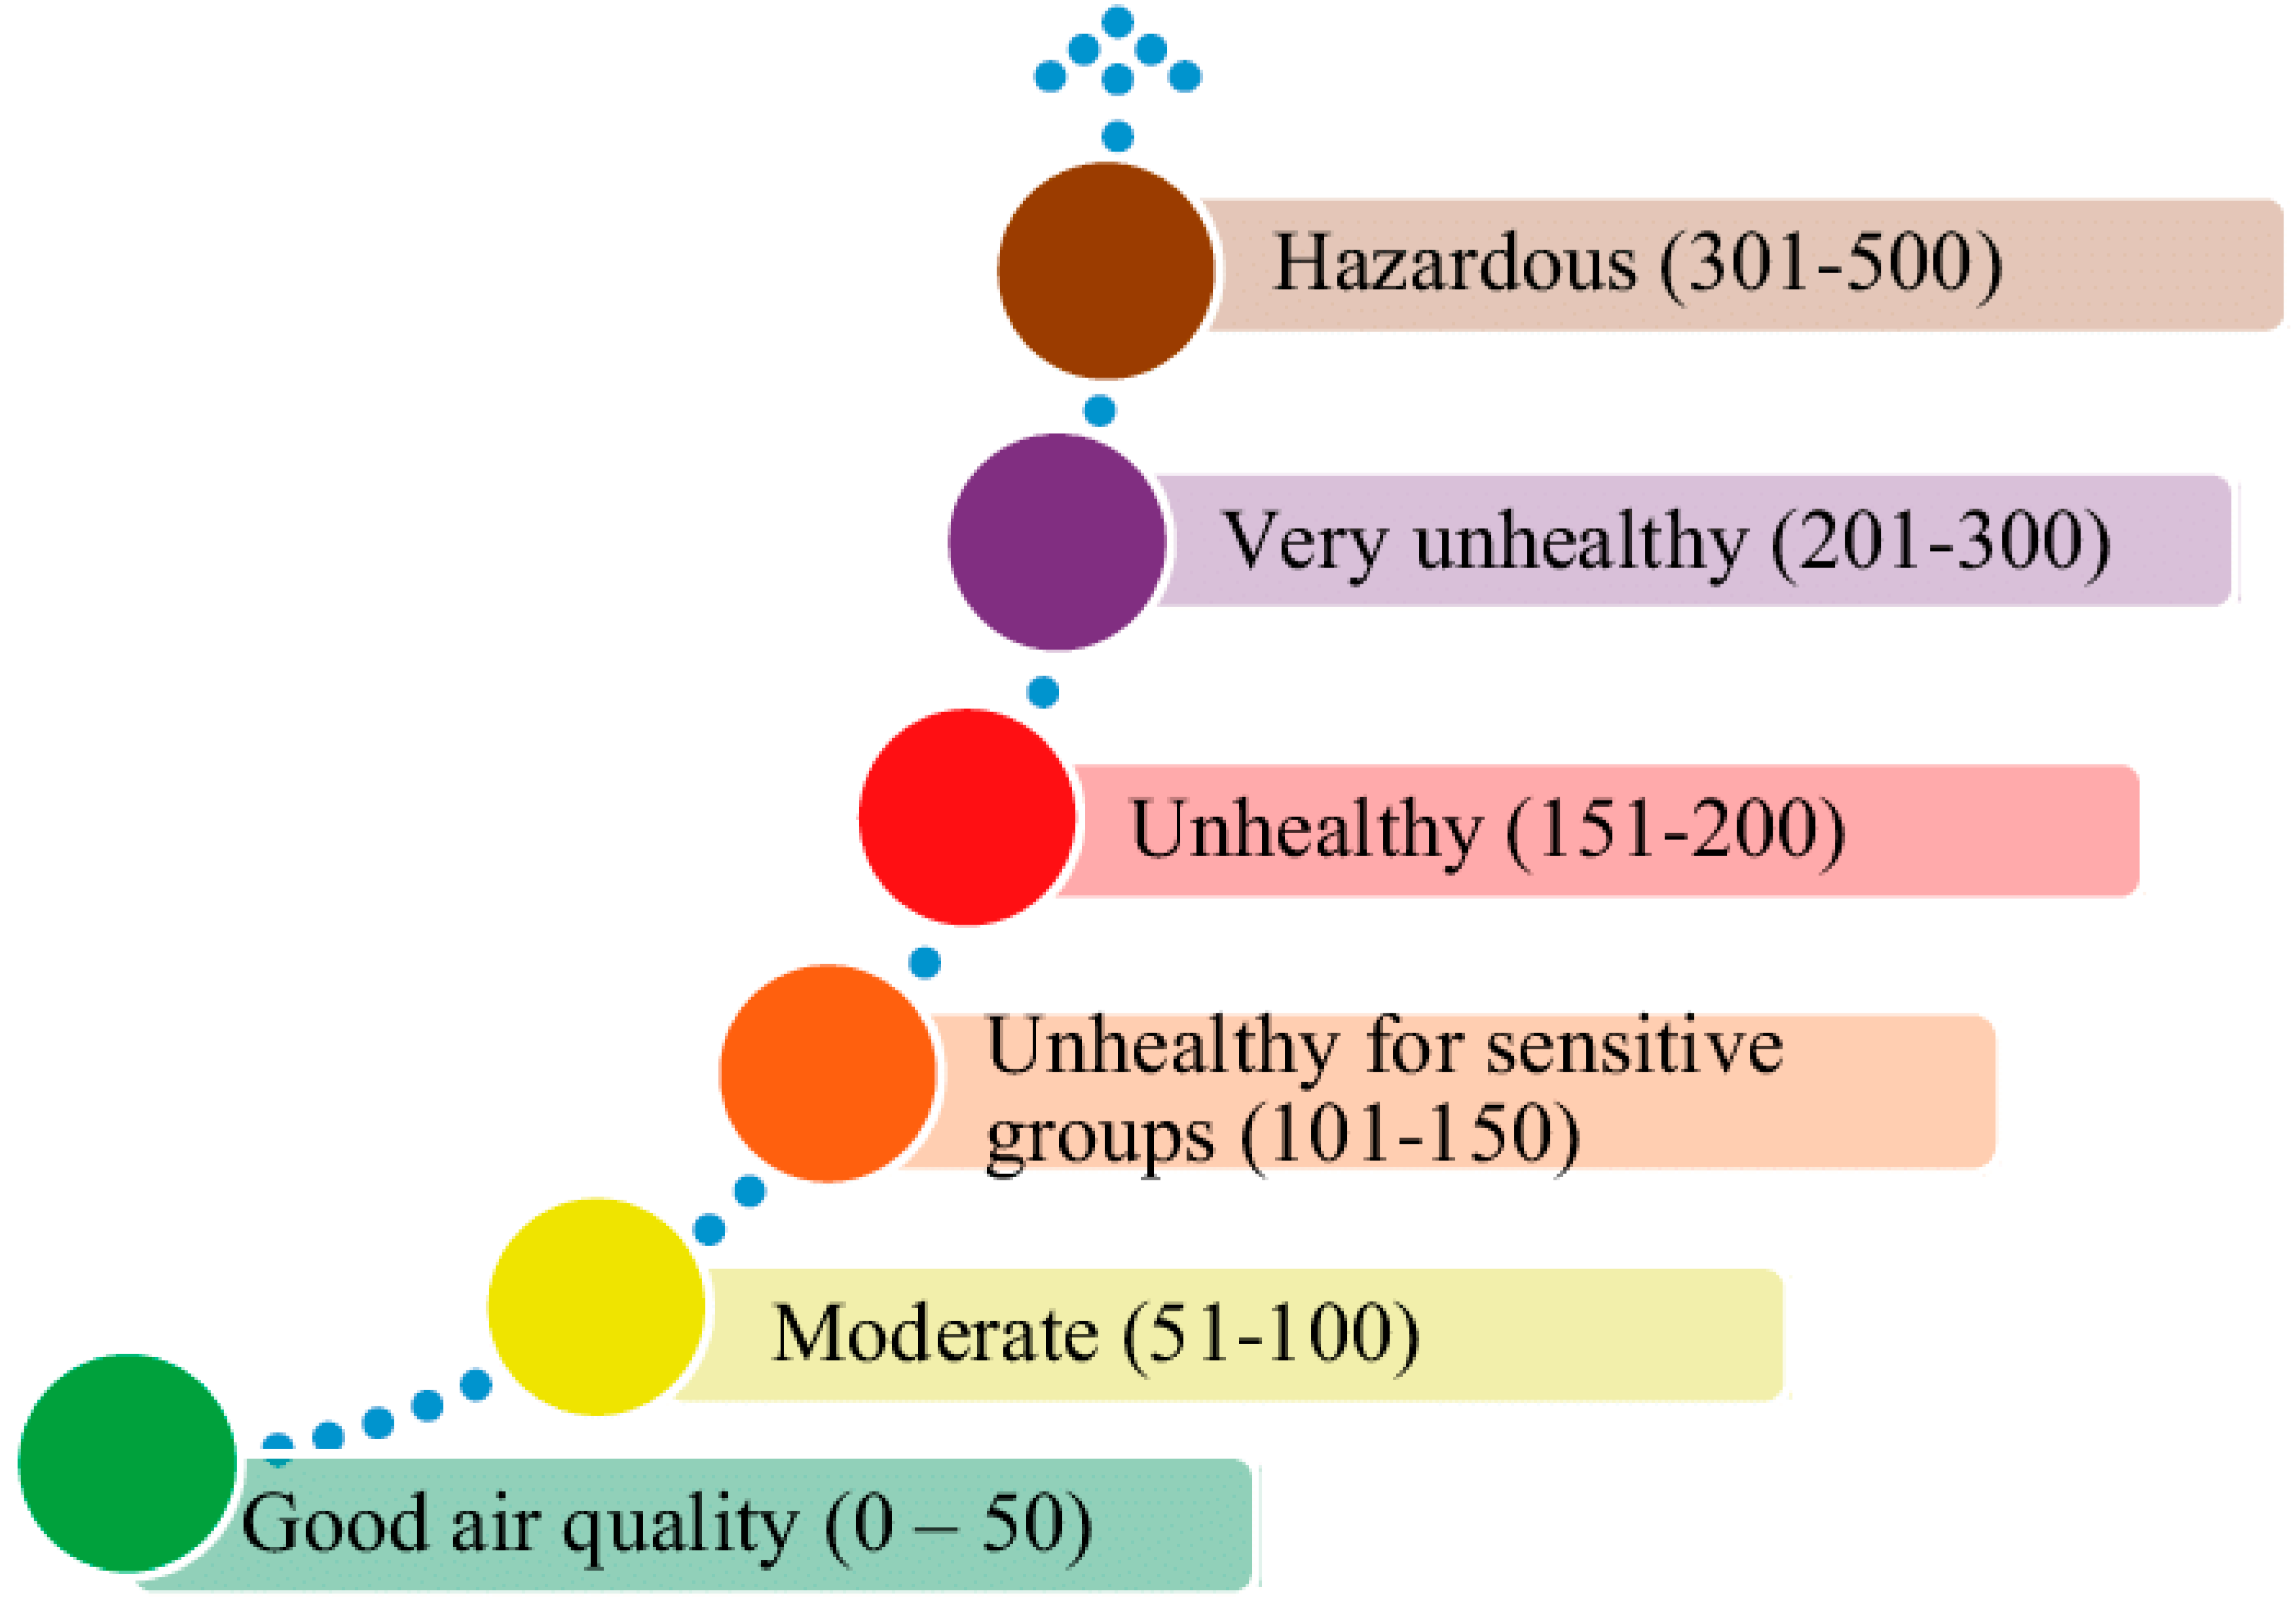
The Air Quality Index (AQI) is a scale ranging from 0 to 500, providing a measure of air pollution and associated health risks [18]. A higher AQI indicates greater pollution and increased health concerns, with values over 300 signifying hazardous conditions. An AQI value of 50 or below signifies good air quality, while values above 100 are considered unsatisfactory and pose health risks. The AQI is categorized into six levels, each associated with specific health concerns, and color-coded for easy community awareness.
Figure 2. Air Quality Index Basics for Ozone and Particle Pollution [18].
Preprints 95240 g002
Continuous real-time sampling of ambient air was conducted four times daily—once in the morning and thrice in the afternoon. Subsequently, the acquired data were averaged to derive pollutant emissions, and the averages for each session (morning and afternoon) were recorded separately. This method facilitated ongoing monitoring of air quality, enabling a comprehensive assessment of pollutant levels in the surrounding environment. The AQI is computed as follows:
A Q I P o l l u t a n t = P o l l u t a n t   d a t a   r e a d i n g S t a n d a r d X 10
The AQI pollutant corresponds to the AQI values for PM2.5 and PM10 emissions. The pollutant data readings represent emissions measured during morning and afternoon sessions. The standard for PM2.5 is considered equal to the PM10 standard, which is set at 150 μg/m3 [19].

2.3.2. Relationship between exposure to emission and health outcome

Air pollution has been associated with various adverse health effects in early human life, encompassing respiratory, cardiovascular, mental, and perinatal disorders, potentially leading to infant mortality or chronic diseases later in life [20,21,22]. This study employed a case-control study design to analyze the relationship between exposure and health outcomes, leveraging specific advantages of case-control studies compared to other designs. Cases, individuals with the outcome, and controls, those without the outcome, were identified. Respondents' ages were categorized into infant (0-5), young (6-24), middle-aged (25-60), and old (≥ 61) years. Due to the small proportion of the old and infant age groups, only the young and middle-aged groups were considered for odds ratio calculation. Cases and controls were sourced from clinical records, with the case group comprising individuals with respiratory diseases in villages near a cement factory (Sire Berga, Gatira Nabe, Sago, and Bekata), and controls representing those with non-respiratory diseases. Patients from more distant areas (San-baro, Qore Sena, Fite, and Haroo Lemana) were included. Particulate matter and gaseous pollutants were measured in these locations, excluding smokers from the case group. The sample size was determined using Slovene's formula, a random sampling technique. The odds ratio (OR) was utilized to estimate the strength of the association between exposure and outcome in case-control studies.
O d d s   R a t i o   ( O R ) = O d d s   o f   e x p o s u r e   a m o n g   c a s e s O d d s   o f   e x p o s u r e   a m o n g   c o n t r o l s
The relative risk provides insight into the increased likelihood of exposed individuals developing cases compared to unexposed individuals. In contrast, the odds ratio is a ratio of two odds. It's important to note that the relative risk is a ratio of two probabilities, where risk represents the likelihood of the outcome of interest among all possible outcomes and it is computed as [23]:
R e l a t i v e   R i s k   ( R R ) = N o . o f   e x p o s e d   c a s e s / N o   o f   u n e x p o s e d   c s s e s N o . o f   e x p o s e d   c o n t r o l e / N o   o f u n e x p o s e d   c o n t r o l s

2.4. Statistical analysis

The assessment of primary pollutant was studded by collecting primary data of particulate matter (PM2.5 and PM10) and gaseous compound emitted from the factory. The data was collected using a portable Aeroqual Series-500 Gas Sensor of CO2, N2O and SO2 for individual pollutants by changing the sensor for each gas. At the Factory site sampling points was selected and four distances from the pollution source points 10km, 20km, 30km and 40km based on the review literature.
At each sampling locations, monitoring was conducted between 8:00am - 9:00am; 12:00am – 1:00pm, and 2:00pm – 3:00pm. This monitoring was taken for 3 consecutive days in four directions in the month of winter season of 2022 following the measurement guideline. Data that shows the types of disease recorded in selected health center for Karkaresa and olonkom five years data; Reji, Itaya and Enchini helth center seven years data were collected from around these cement industries. This data was desegregated as age group of 0 to 5 year (infant), 6 to 24 year (school age), 25 to 60 year (young) and more than 61 years (old) were considered. Moreover, the data were desegregated as male and female.
To enhance statistical power, a ratio of two controls per case was employed, following the approach outlined by Hennessy et al. (1999) [24]. Therefore, for this study, out of the 4768 samples available, 2528 (with 1003, 39.68% female) were designated for the case group and 2240 (with 1104, 50.7% female) for the control group in Reji Health Center. Similarly, 2726 samples were allocated for the case group and 2042 for the control group in Enchini Health Center, 2330 for case and 2438 for control in Enchini Primary Hospital, 520 for case and 4248 for control in Olonkom Health Center, 920 for case and 3848 for control in Karkaressa Health Center, and 1345 for case and 3423 for control in Itaya Health Center. Notably, smokers were excluded from the analysis. The study aimed to assess the association between exposure to emissions from cement plants and the heightened risk of hospital admission for respiratory cases among workers and communities residing near these facilities, with the odds ratio serving as a key metric..

3. Results and discussion

3.1. The PM2.5 and PM10 concentration

Table 1 presents a detailed analysis of the mean particulate matter (PM2.5 and PM10) emissions in various production rooms of different cement factories, with distinct sampling times (morning and afternoon) and locations, including Dangote, Kuyu, National, Ethio, Derba, Pioneer, and Habesha. In the Mill Room, morning PM2.5 values range from 598.9 to 736.6 μg/m3, with Dangote exhibiting the highest morning concentration, and afternoon values range from 698.1 to 736.6 μg/m3. For PM10, morning values range from 607.2 to 812.4 μg/m3, with National recording the highest morning concentration (815.3 μg/m3), and afternoon values range from 723.9 to 923 μg/m3. Coal Crushing operations display varying concentrations, with morning PM2.5 values ranging from 123.4 to 161.1 μg/m3 and afternoon values ranging from 143.1 to 176.1 μg/m3. For PM10, morning values range from 199.5 to 204.1 μg/m3, and afternoon values range from 189.6 to 298.2 μg/m3.
The Storage Room exhibits morning PM2.5 values from 199.9 to 216.3 μg/m3, with National presenting the highest morning concentration (216.3 μg/m3), and afternoon values range from 149.8 to 165.8 μg/m3. For PM10, morning values range from 633.5 to 777.1 μg/m3, with National displaying the highest morning concentration (777.1 μg/m3), and afternoon values range from 633.3 to 687.1 μg/m3. In the Loading Room, morning PM2.5 values range from 123.5 to 144.3 μg/m3, with Pioneer exhibiting the highest morning concentration (144.3 μg/m3), and afternoon values range from 129.8 to 143.2 μg/m3. For PM10, morning values range from 215.2 to 569 μg/m3, with Pioneer recording the highest morning concentration (569 μg/m3), and afternoon values range from 394 to 569 μg/m3.
The study reveals that particulate matter concentrations in all production rooms exceeded both international standards (PM2.5: 10 μg/m3, PM10: 20 μg/m3) and national standards (PM2.5 = PM10 = 150 μg/m3), indicating elevated levels beyond recommended limits, potentially posing health risks to workers. These findings underscore the pressing need for effective measures to mitigate air pollution and protect worker health. The study's reliance on specific numerical data and comparisons to established standards enhances its reliability and significance in addressing air quality concerns in industrial settings, aligning with broader efforts in air quality monitoring and the assessment of particulate matter concentrations in various industrial environments.

3.2. Gaseous concentration

Similarly, the gaseous concentration analysis, as outlined in Table 2, meticulously examines the mean emissions of CO2, N2O, and SO2 within diverse production process rooms across cement factories. Remarkably, the concentrations of these pollutants consistently remained below the permissible limits stipulated by both Ethiopian standards (N2O = 2000 mg/m3, SO2 = 1000 mg/m3, and CO2 = 9000 mg/m3) and international standards (N2O: 200 μg/m3 and SO2: 500 μg/m3). In the Mill Room, CO2 exhibited morning values ranging from 339.8 to 570.1, with Dangote recording the highest morning concentration, while afternoon values ranged from 325.6 to 588.6 mg/m3. N2O morning values spanned from 1.99 to 4.66, with Dangote showcasing the highest morning concentration, and afternoon values ranged from 3.78 to 4.66 mg/m3. SO2 morning values ranged from 0.2101 to 1.11 mg/m3, with Dangote having the highest morning concentration, and afternoon values ranged from 0.98 to 1.05 mg/m3. For the Coal Crasher, CO2 morning values ranged from 238.7 to 274.8 mg/m3, with National exhibiting the highest morning concentration, and afternoon values ranged from 266.5 to 274.8 mg/m3. N2O morning values varied from 2.89 to 4.61 mg/m3, with Dangote having the highest morning concentration, and afternoon values ranged from 3.76 to 4.52. SO2 morning values ranged from 0.499 to 0.662 mg/m3, with Dangote having the highest morning concentration, and afternoon values ranged from 0.76 to 0.85 mg/m3.
In the Storage Room, CO2 morning values ranged from 339.4 to 401 mg/m3, with National recording the highest morning concentration, and afternoon values ranged from 397.8 to 401 mg/m3. N2O morning values ranged from 1.87 to 2.79 mg/m3, with Dangote exhibiting the highest morning concentration, and afternoon values ranged from 1.8 to 2.32 mg/m3. SO2 morning values ranged from 0.199 to 0.32 mg/m3, with National having the highest morning concentration, and afternoon values ranged from 0.149 to 0.498 mg/m3. Within the Loading Room, CO2 morning values ranged from 354.6 to 365.2 mg/m3, with Dangote showcasing the highest morning concentration, and afternoon values ranged from 255.8 to 264 mg/m3. N2O morning values varied from 6.78 to 8.56 mg/m3, with Dangote having the highest morning concentration, and afternoon values ranged from 6.78 to 8.32 mg/m3. SO2 morning values ranged from 0.558 to 1.22 mg/m3, with National having the highest morning concentration, and afternoon values ranged from 1.1231 to 1.187 mg/m3.
The consistently low emissions of CO2, N2O, and SO2 across all production rooms underscore compliance with stringent environmental regulations. Notably, the higher concentration of CO2 compared to N2O and SO2 in all data collection rooms warrants attention. These findings provide critical insights for evaluating the environmental impact of cement production and upholding adherence to rigorous air quality standards, contributing valuable information to the broader discourse on sustainable industrial practices.

3.3. Emissions of pollutants

PM2.5 measurements indicated diverse concentrations among various cement plants, with the Dangote cement plant ranging from 104.8 to 657.6 μg/m3, Kuyu cement plant from 159 to 655 μg/m3, National cement plant from 137 to 656 μg/m3, Ethio cement plant from 141 to 663 μg/m3, Derba cement plant from 137 to 667 μg/m3, Pioneer cement plant from 137 to 814 μg/m3, and Habesha cement plant from 140 to 266 μg/m3. Conversely, Gatira Nabe, Saggo, Sire Berga, and Bekata reported lower values ranging from 188 to 196 μg/m3, 150–152 μg/m3, 167–189 μg/m3, and 113–120 μg/m3, respectively. Similarly, PM10 values exhibited variation among different cement plants, with Dangote cement plant ranging from 195 to 665 μg/m3, Kuyu cement plant from 304 to 765 μg/m3, National cement plant from 227 to 874 μg/m3, Ethio cement plant from 274 to 886 μg/m3, Derba cement plant from 252 to 849 μg/m3, Pioneer cement plant from 245 to 862 μg/m3, and Habesha cement plant from 251 to 868 μg/m3. Conversely, Gatira Nabe, Saggo, Sire Berga, and Bekata reported values between 172 and 181 μg/m3, 234–342 μg/m3, 215–453 μg/m3, and 125–263 μg/m3, respectively.
Ambient air quality concerning both PM2.5 and PM10 exceeded Ethiopian ambient air quality guidelines (EPA, 2003) in all cement plants and nearby areas, including Gatira Nabe, Saggo, and Sire Berga. Contrastingly, gaseous pollutants like nitrogen dioxide, sulfur dioxide, and carbon dioxide remained within acceptable limits at all sites. In accordance with the AQI classification, the mill area demonstrated hazardous conditions for both PM2.5 and PM10 emissions. Furthermore, the storage, loading, and coal crusher areas were identified as high-risk zones for workers. Among nearby villages, Gatira Nabe was particularly flagged for health risks. The study underscores a correlation between PM pollutant emissions, health impacts, and proximity to factory units, indicating that emissions increased with closeness. This finding is consistent with prior research [5,25], which consistently emphasized an inverse relationship between PM and distance from the factory.
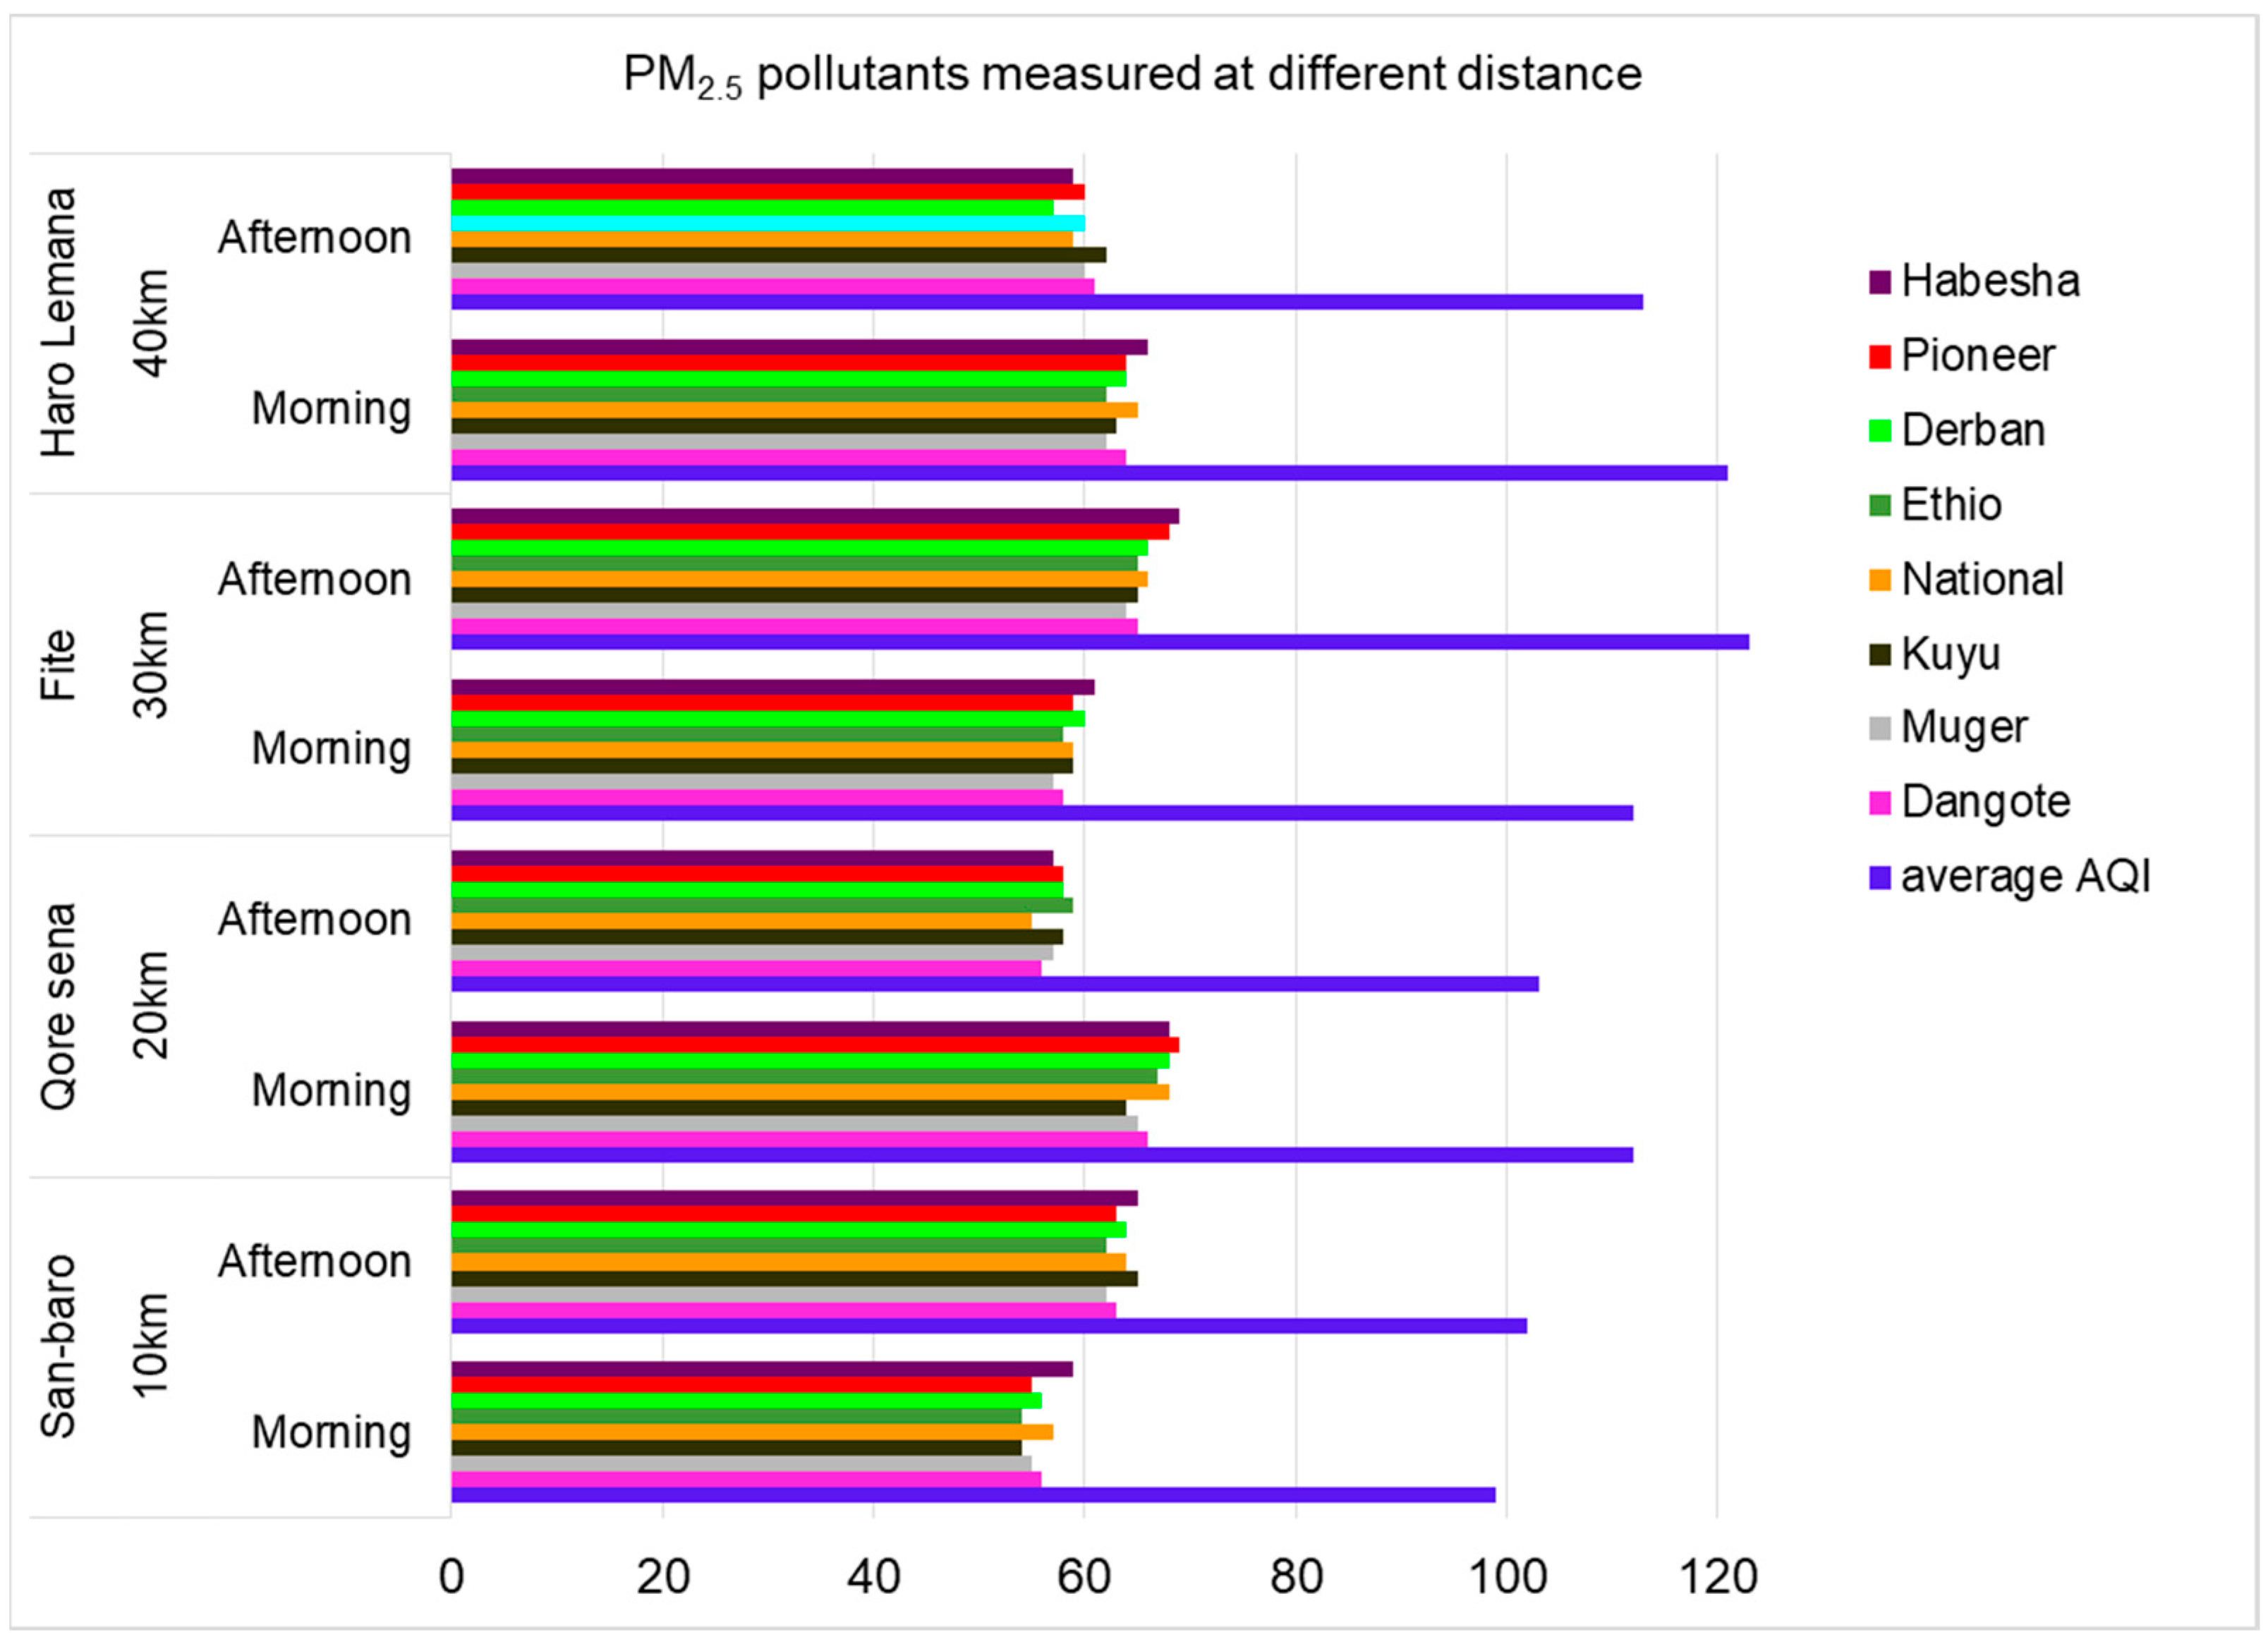
The emission profiles of pollutants in different production process rooms within the proximity of Dangote cement factory and Muger cement factory (Sanbaro, Qore Sena, Fite, and Haro Lemana) located at distances of 10, 20, 30, and 40 km from both factories were scrutinized (Figure 2). Gaseous emissions across all cement industries were minimal, while particulate matter emissions surpassed permissible standards. Mean emissions of PM2.5 and PM10 pollutants varied across production rooms, with milling rooms exhibiting higher concentrations, followed by storage and loading, particularly for PM10. This emphasizes increased worker exposure in the milling room, while workers in loading and storage rooms were also impacted by particulate matter. Notably, pollutant concentrations decreased with greater distance from the factories, indicating heightened exposure for communities in closer proximity (Figure 2).
Figure 2. Mean emissions of PM2.5 (μg/m3) pollutants measured at different distance.
Preprints 95240 g003
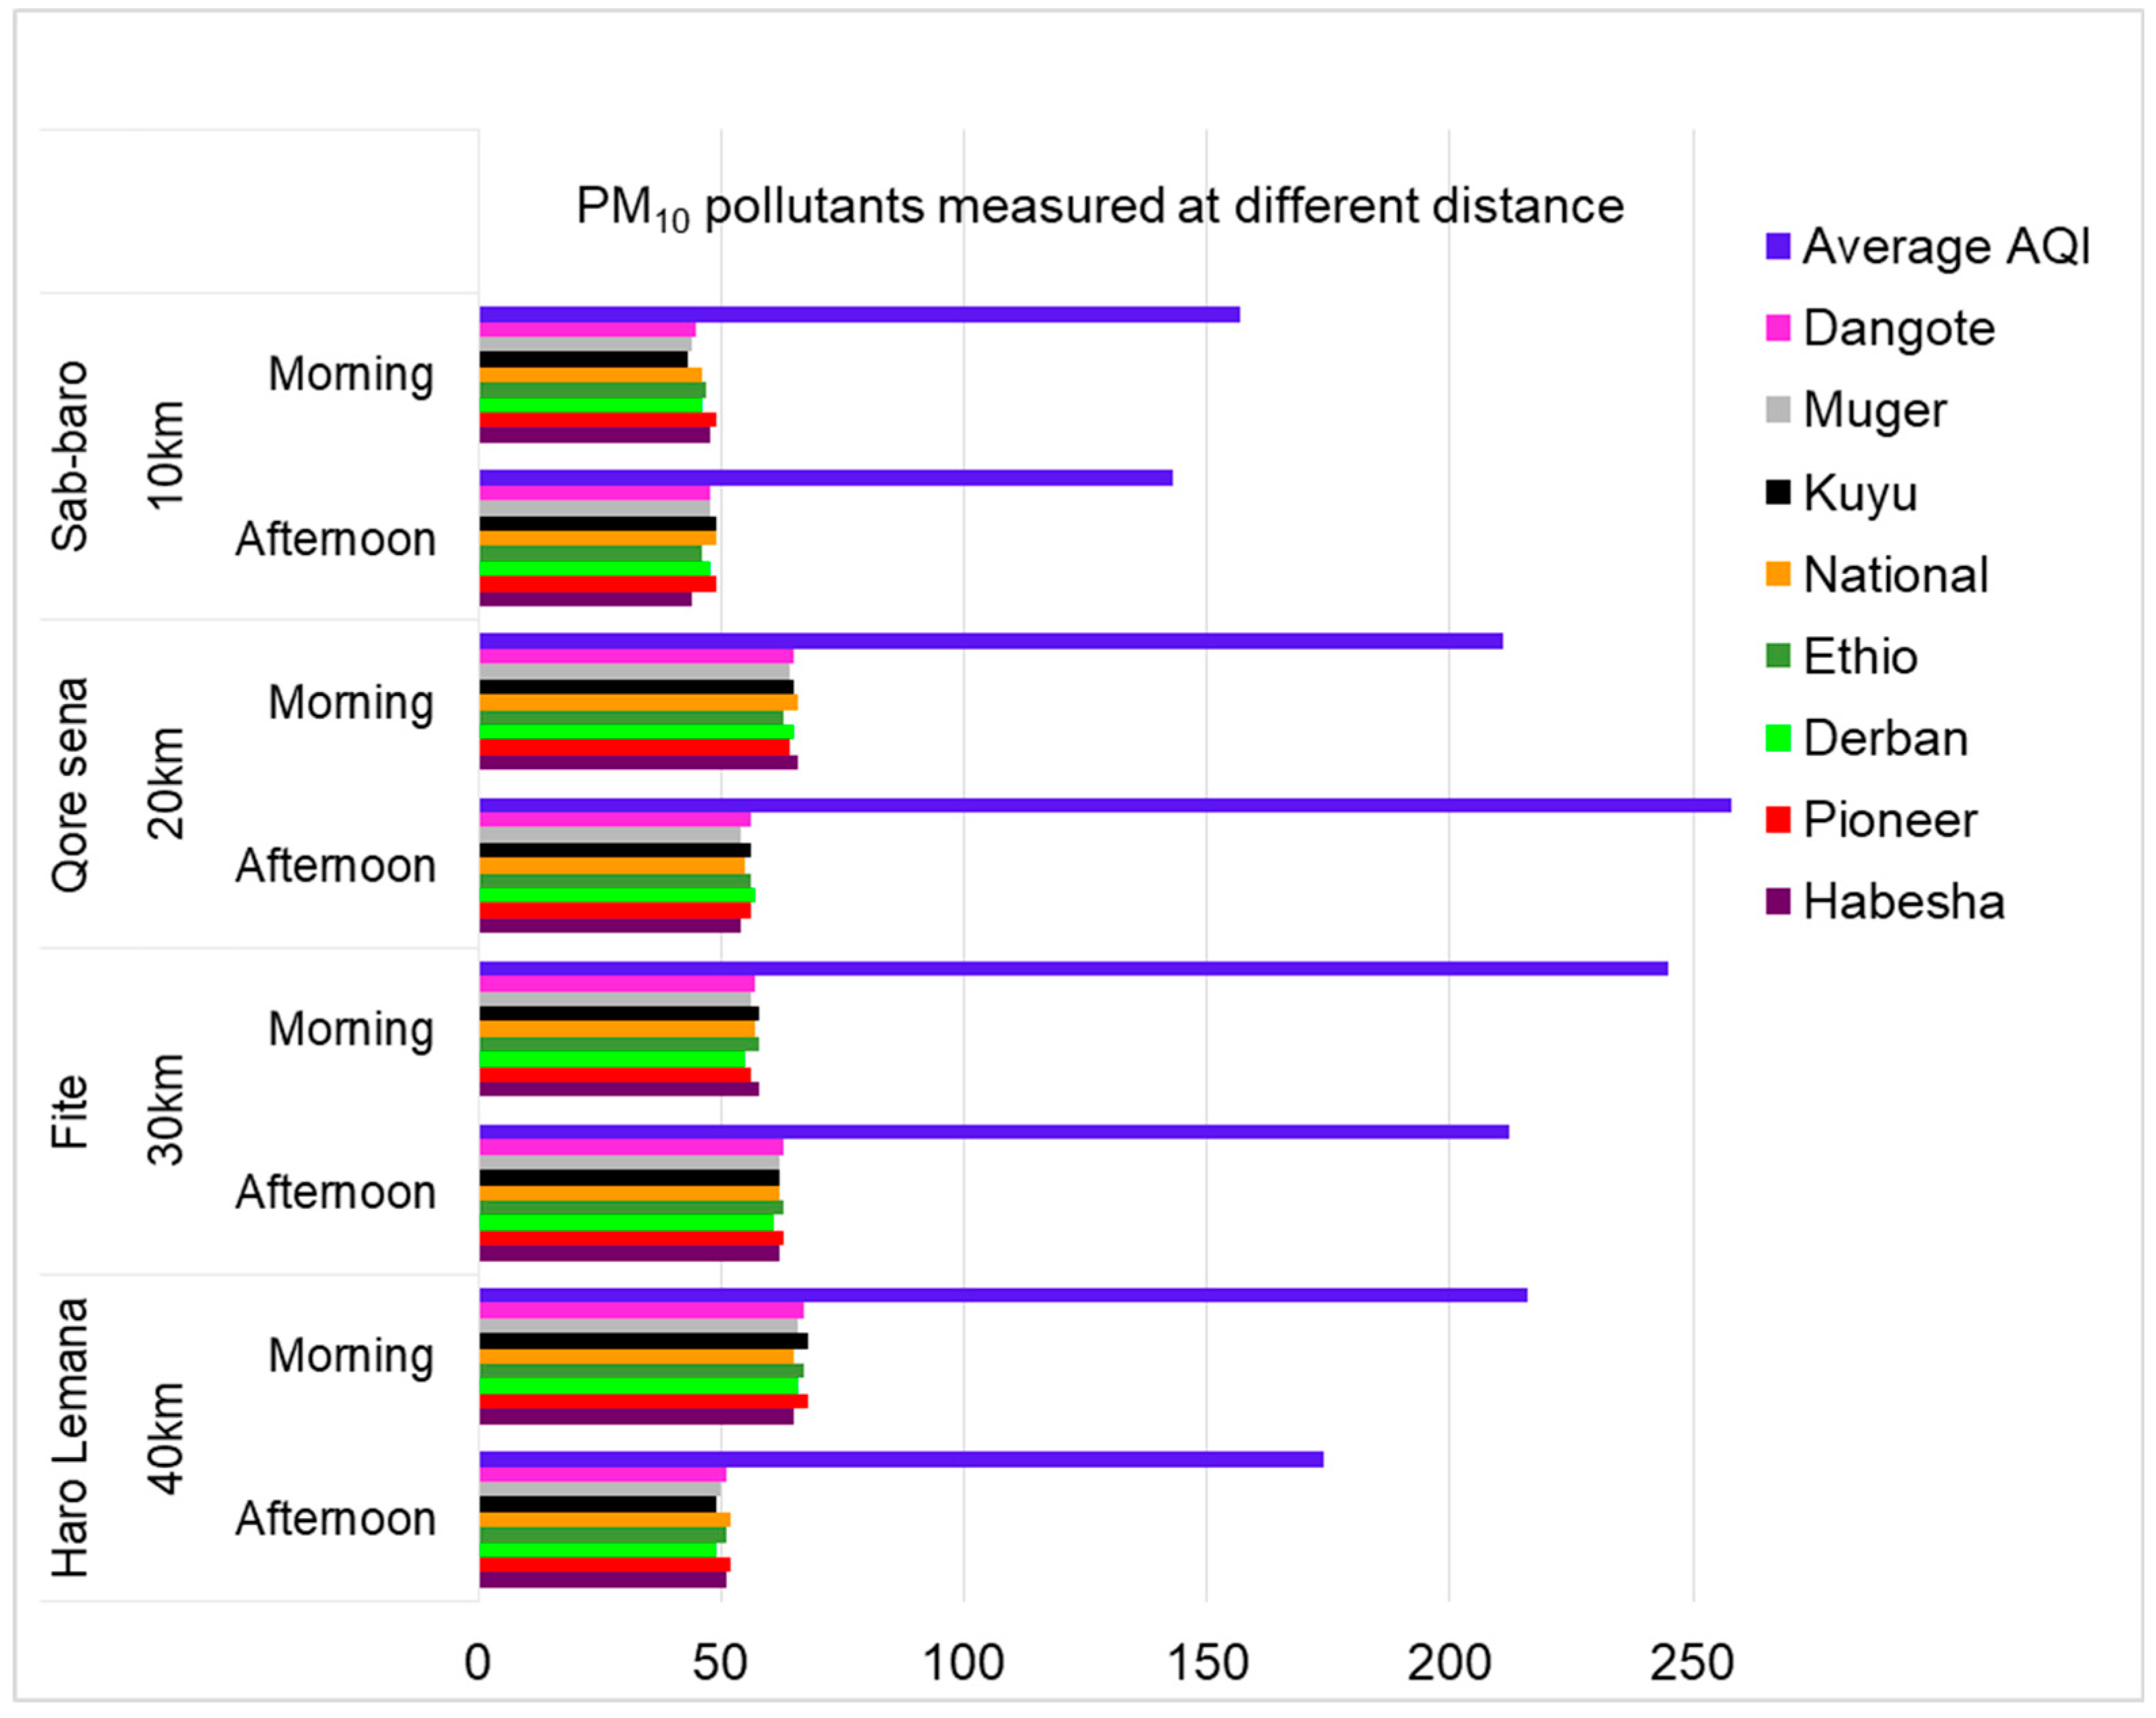
The concentration of PM10 μg/m3 measured at different distance of site were decreasing, when the site of data collection was far-away from the cement factories, that show the community living around the factories were more affected by this particulate matter than those community living at far distance (Figure 3).
The concentration of CO2 was observed to be high across the selected study areas and distances from the cement factories, while the concentrations of both SO2 and N2O were comparatively low in all cement factories. The data presented in Table 3 details the mean emissions of CO2, N2O, and SO2 measured at varying distances from the cement factories, providing insights into the pollutant concentrations during morning and afternoon sampling durations. For a distance of 10 km, the morning CO2 values ranged from 399 to 419 mg/m3, with Dangote having the highest morning concentration, and afternoon values ranged from 499 to 522 mg/m3. N2O morning values spanned from 1.143 to 1.312 mg/m3, with Derba exhibiting the highest morning concentration, and afternoon values ranged from 1.324 to 1.562 mg/m3. SO2 morning values ranged from 0.234 to 0.324 mg/m3, with Derba having the highest morning concentration, and afternoon values ranged from 0.394 to 0.455 mg/m3.
At a distance of 20 km, the morning CO2 values ranged from 433 to 463 mg/m3, with Pioneer having the highest morning concentration, and afternoon values ranged from 309 to 332 mg/m3. N2O morning values spanned from 2.21 to 2.36 mg/m3, with Habesha exhibiting the highest morning concentration, and afternoon values ranged from 3.35 to 3.52 mg/m3. SO2 morning values ranged from 0.4665 to 0.5753 mg/m3, with Habesha having the highest morning concentration, and afternoon values ranged from 0.3987 to 0.5532 mg/m3. For a distance of 30 km, the morning CO2 values ranged from 269 to 288 mg/m3, with National having the highest morning concentration, and afternoon values ranged from 425 to 453 mg/m3. N2O morning values spanned from 1.18 to 1.3 mg/m3, with National exhibiting the highest morning concentration, and afternoon values ranged from 1.22 to 1.32 mg/m3. SO2 morning values ranged from 0.2325 to 0.3015 mg/m3, with National having the highest morning concentration, and afternoon values ranged from 0.2124 to 0.3015 mg/m3. At a distance of 40 km, the morning CO2 values ranged from 255 to 288 mg/m3, with National having the highest morning concentration, and afternoon values ranged from 266 to 282 mg/m3. N2O morning values spanned from 1.89 to 2.34 mg/m3, with Pioneer exhibiting the highest morning concentration, and afternoon values ranged from 2.698 to 3.01 mg/m3. SO2 morning values ranged from 0.29 to 0.42 mg/m3, with National having the highest morning concentration, and afternoon values ranged from 0.49 to 0.58 mg/m3.
Remarkably, the concentrations of CO2, N2O, and SO2 at all distances from the cement factories were consistently below the permissible limits set by Ethiopian standards (Table 3). This finding suggests that the cement factories are operating within the prescribed environmental standards, particularly concerning gaseous pollutant emissions. The study provides valuable insights into the spatial distribution of these pollutants, emphasizing the need for continued monitoring and adherence to environmental regulations in cement production processes.
Numerous research endeavors have explored the connection between wind conditions and the release of air pollutants, establishing a direct relationship [26]. The dispersion of pollutants is notably contingent on factors such as wind speed and direction, with wind dynamics playing a pivotal role in determining the spread of gaseous pollutants [27,28]. Wind speed and direction emerge as critical parameters that significantly impact the diffusion of pollutants, as they facilitate the transportation of varying quantities of pollutants [29].

3.4. Health effects

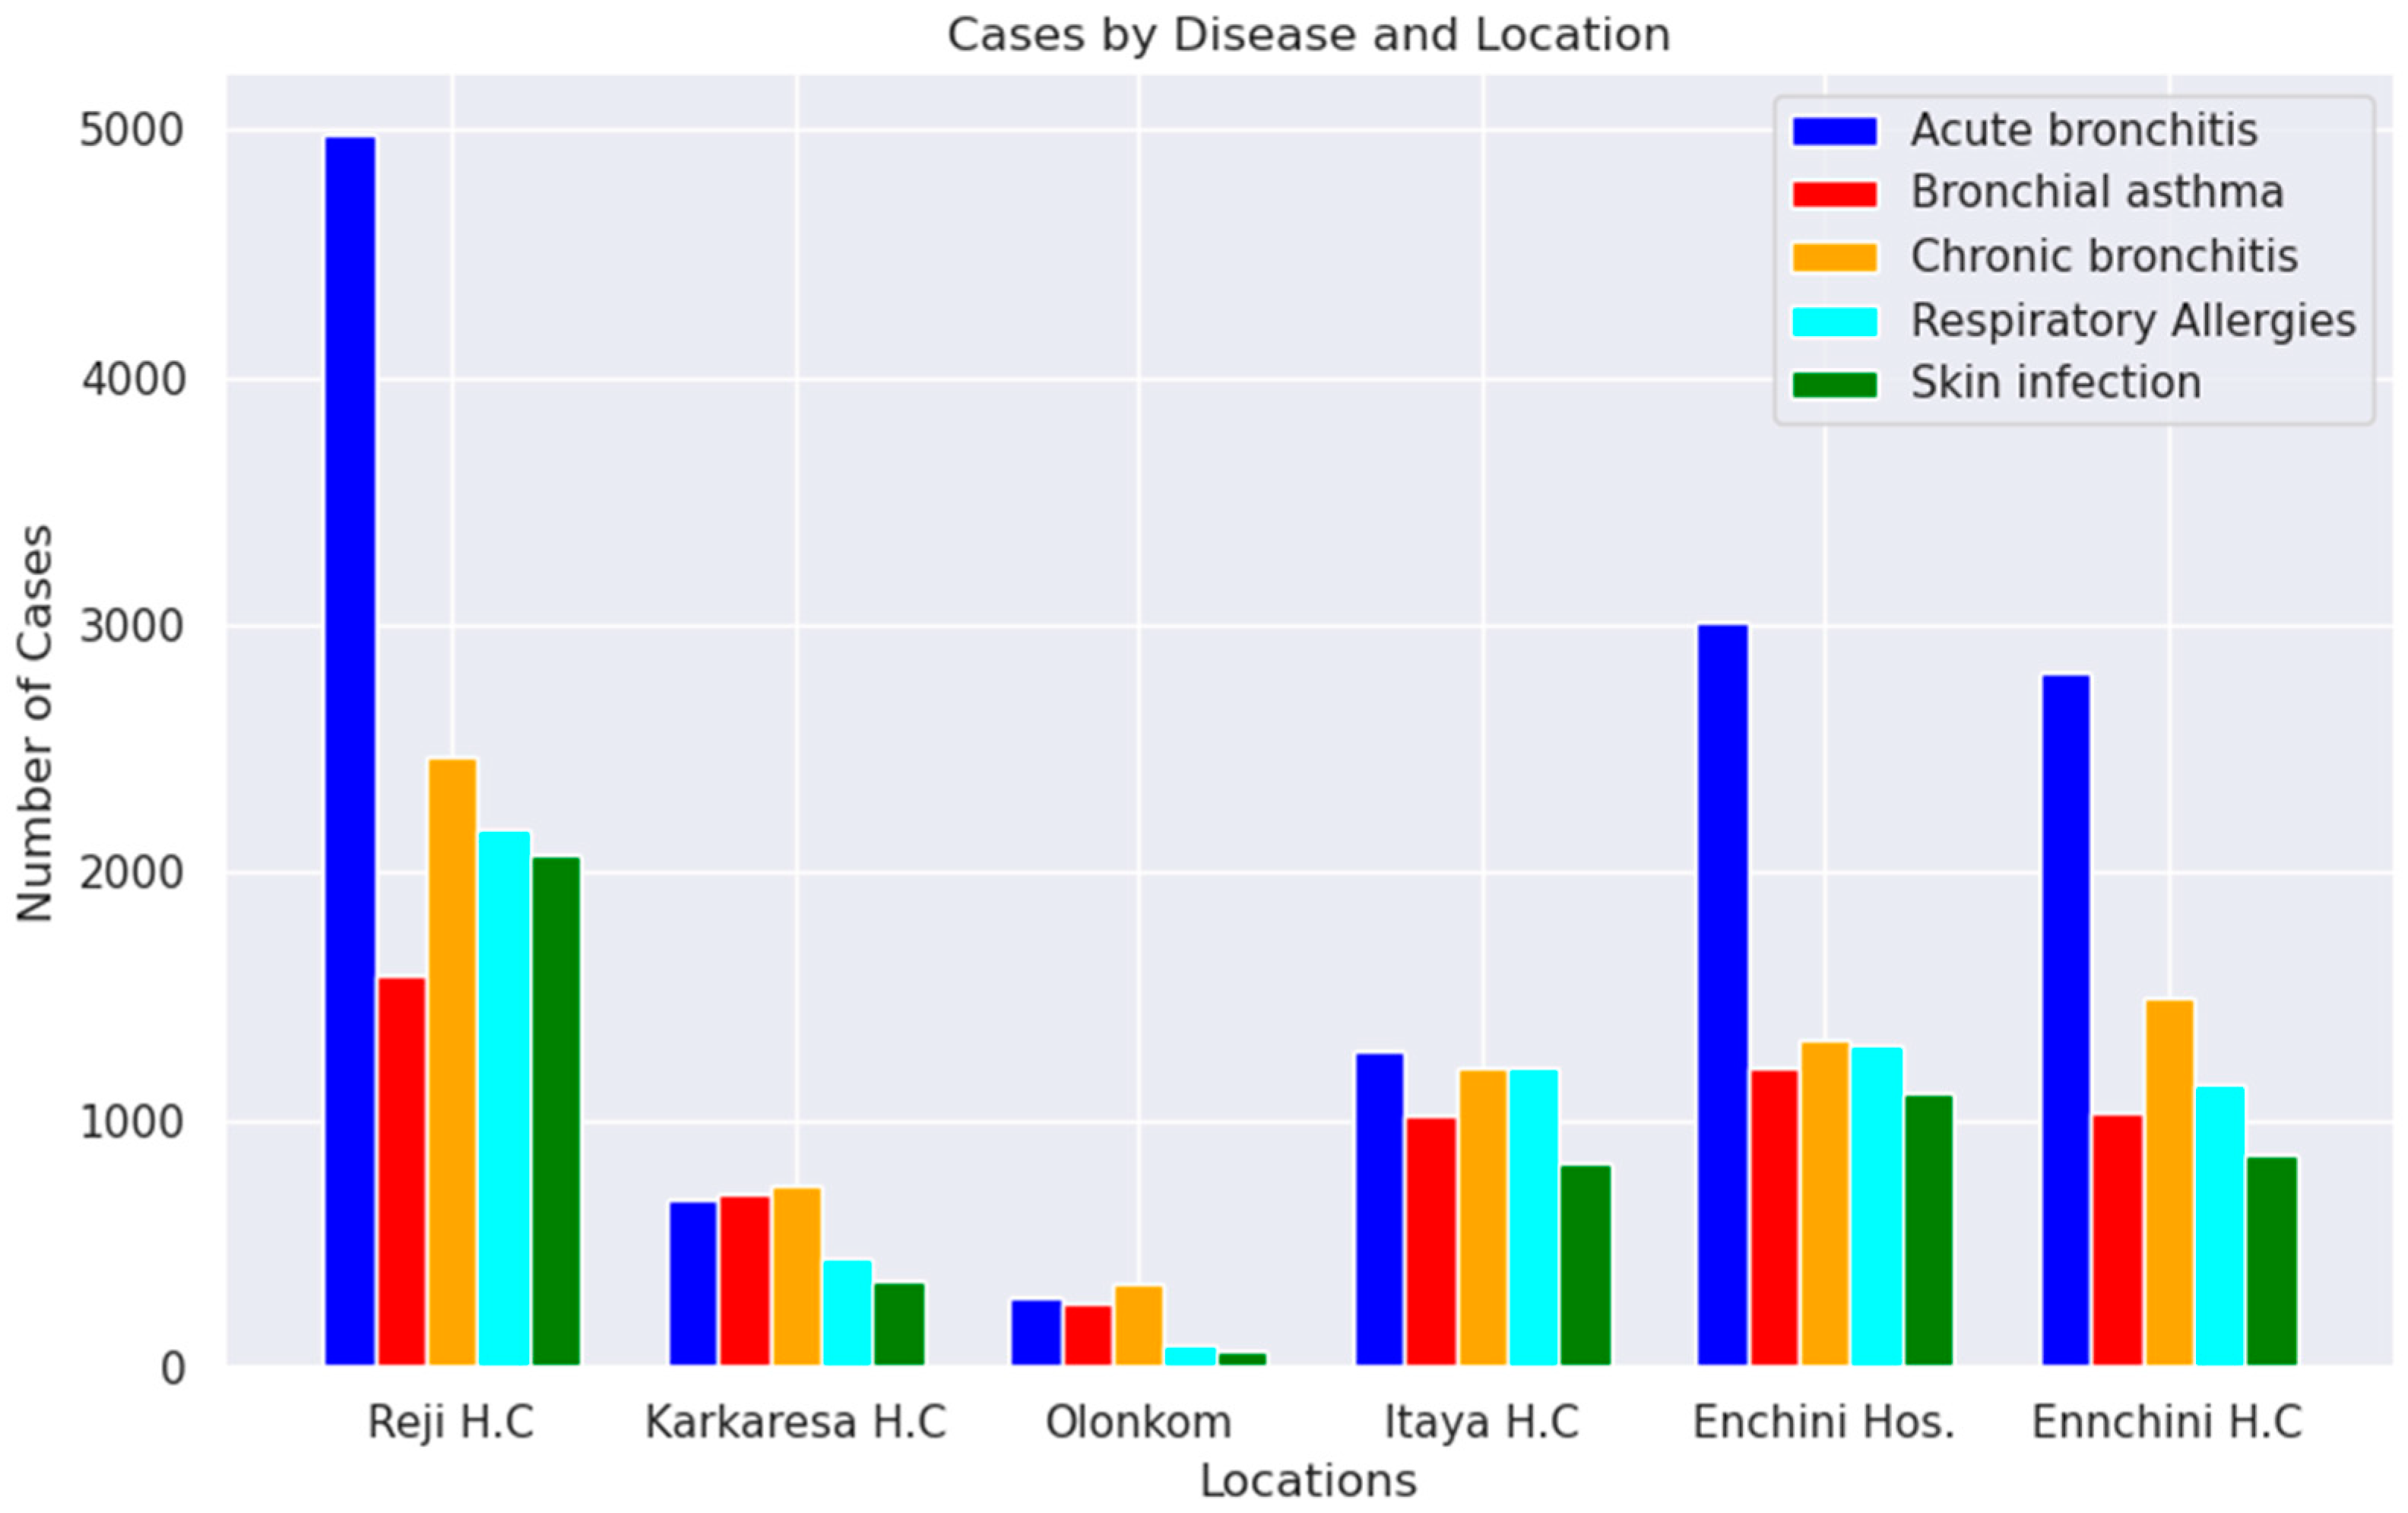
Patients with various illnesses across diverse distances from all selected health centers indicate that those in proximity to cement factories exhibit a higher incidence of diverse diseases. Conversely, health centers situated farther from cement factories report a lower prevalence of respiratory diseases. This highlights the influence of distance on the observed co-occurrence of different diseases across various health centers. As the distance from health centers to cement factories increases, there is a noticeable decrease in the number of patients with diverse respiratory conditions recorded at each health center (Figure 4).
The prevalence of respiratory diseases across various age groups and health centers reveals distinct patterns, emphasizing the influence of both age and proximity to cement factories. Notably, the age group of 25-60 consistently exhibited the highest prevalence of diseases across all health centers, followed by the age group of 6-24. Conversely, the other two age groups showed a lower susceptibility to these diseases (Table 4). This observation emphasizes the significant impact of age on disease prevalence. Furthermore, the number of recorded patients in health centers varied based on both their geographical location and distance from the cement factories. Health centers located in close proximity to the cement plants reported a significantly higher number of patients compared to those situated farther away. Specifically, Reji Health Center, located 2 km from both Muger and Dangote cement factories, recorded the highest number of patients for all prevalent diseases. This trend was followed by Enchini health center and Enchini primary hospital, situated 5 km from Dangote and 10 km from Muger. The association between health center location and disease prevalence is evident, highlighting the direct impact of proximity to cement factories on community health (Table 4).
Table 4 provides a detailed breakdown of respiratory allergy diseases categorized under different age groups across various health centers in the year 2022. The data indicates that the prevalence of bronchial asthma, chronic bronchitis, skin infection, acute bronchitis, and respiratory allergies follows a consistent trend across age groups and health center locations. The total number of cases for each disease type is highest in the age group of 25-60, emphasizing the vulnerability of individuals within this demographic to respiratory diseases. These findings contribute valuable insights into the complex interplay of age, geographical location, and industrial proximity in influencing respiratory health. The direct correlation between disease prevalence and proximity to cement factories highlights the need for targeted public health interventions and emphasizes the importance of considering both age and environmental factors in health management strategies. This research contributes to the broader understanding of the intricate relationship between industrial activities, age-specific susceptibility, and community health outcomes.
Table 4. Respiratory allergies diseases categorized under different age groups in 2022 of all health centers.
Types of disease Age groups Reji H.C Itaya H.C Enchini H.C Olonkom H.C Karkaresa H.C Enchini P. Hospital
Bronchial asthma 0 to 5 4 1 2 3
6 to 24 38 18 27 7 12 30
25 to 60 274 98 155 43 73 134
> 61 10 5 11 1 2 7
Total 326 122 195 51 87 174
Chronic bronchitis 0 to 5 5 2 7 3 5
6 to 24 254 189 287 58 125 198
25 to 60 312 165 380 69 113 270
> 61 9 7 7 5 4 8
Total 580 363 681 132 245 481
Skin infection 0 to 5 3 2 2 2 6
6 to 24 176 79 178 23 55 144
25 to 60 187 89 201 19 67 187
> 61 3 4 5 1 2 4
Total 369 174 386 45 124 341
Acute bronchitis 0 to 5 5 3 9 2 4 6
6 to 24 550 325 652 121 178 598
25 to60 357 145 454 65 103 389
> 61 20 15 18 5 10 15
Total 932 488 1133 193 295 1008
Respiratory allergies 0 to 5 2 1 3 2 4
6 to 24 116 87 123 40 67 128
25 to 60 198 109 204 54 97 189
> 61 5 2 3 2 3 5
Total 321 198 331 99 169 326
This study primarily centers on five prominent infectious and respiratory diseases: acute bronchitis, bronchial asthma, chronic bronchitis, respiratory allergies, and skin infection. The investigation involved surveying clinical data gathered from Reji, Itaya, and Enchini health centers spanning the years 2015 to 2021. Additionally, data was collected from Karkaresa and Olonkomiii health centers for the period of 2017 to 2021, along with Enchini Primary Hospital data from 2016 to 2021. Acute bronchitis emerged as a significant respiratory ailment affecting these communities, with chronic bronchitis and respiratory allergies following suit. A study by Nkhama et al. (2017) [5] revealed an association between particulate matter (PM) and respiratory symptoms in Chilanga, Zambia.
The study delved into the impact of PM emissions on diseases across age groups, highlighting that individuals aged 25 to 60 were the most significantly affected, closely followed by the age group of 6 to 24. In contrast, the age groups of 0–5 and > 61 were less susceptible to these diseases. Notably, the infant age group (0-5) and the elderly group experienced comparatively lower exposure to PM emission-related diseases, likely due to limited participation in cement factory activities and reduced mobility away from their residences. It is evident that the health of school-age individuals, the middle-aged population, and the active segment of the community residing near the factory are at greater risk of adverse impacts from PM emissions. Similar findings have been reported by other researchers, including Zhang, Jiao et al. (2018) [28] and Beketie, Angessa et al. (2022) [16].

3.5. Exposure differences between cases and controls

To enhance statistical power, a case-to-control ratio of two controls per case was employed, resulting in a sample size of 4768. The distribution across various health centers included 2528 cases and 2240 controls in Reji Health Centre, 2726 cases and 2042 controls in Enchini Health Centre, 2330 cases and 2438 controls in Enchini Primary Hospital, 520 cases and 4248 controls in Olonkomii Health Centre, 920 cases and 3848 controls in Karkaressa Health Centre, and 1345 cases and 3423 controls in Itaya Health Centre, excluding smokers [24]. The formula n = N / (1 + N(e)2) was applied to determine the sample size, with n representing the number of samples, N the total population, and e the margin of error set at 0.05 for a 95% confidence level.
The exposure results among cases and controls, including unexposed cases and controls, are presented in Table 4. The categories denote individuals subject to or free from exposure to cement plant emissions. Each health center's total sample size is indicated, along with calculated risk, odds, relative risk (RR), and odds ratio (OR) values. In Reji Health Centre, with 2528 cases and 2240 controls out of a total sample of 4768, the risk of respiratory ailments was 0.53, indicating a noteworthy association between exposure and outcome. The odds ratio (OR) of 3.23 signifies a substantial likelihood of health issues among the exposed group compared to controls. Similar patterns emerge in Enchini Health Centre, where the risk and odds ratio values are 0.57 and 3.8, respectively, suggesting a significant association.
Contrastingly, Olonkomii Health Centre displays a lower risk of 0.1 and an odds ratio of 0.34, indicating a comparatively lower impact of exposure. Enchini Primary Hospital exhibits a risk of 0.49 and an odds ratio of 2.71, portraying an intermediate level of association between exposure and respiratory outcomes. Karkaresa Health Centre and Itaya Health Centre demonstrate risk values of 0.19 and 0.28, respectively, with odds ratios of 0.69 and 1.11, indicating a varying impact on health outcomes. The Control group, consisting of 1253 cases and 3570 controls out of a total sample of 5012, exhibits a risk of 0.25 and an odds ratio of 0.35.
Table 4. The result of exposure among cases and controls with unexposed cases and unexposed controls.
Name of Health centre Exposed Unexposed Total sample Risk Odds RR OR
Reji Health centre 2528 2240 4768 0.53 1.13 2.12 3.23
Enchini Health centre 2726 2042 4768 0.57 1.33 2.28 3.8
Olonkomii Health centre 520 4248 4768 0.1 0.12 0.4 0.34
Enchini P. Hospital 2330 2438 4768 0.49 0.95 1.96 2.71
Karkaresa Health centre 920 3848 4768 0.19 0.24 0.76 0.69
Itaya Health centre 1345 3423 4768 0.28 0.39 1.12 1.11
Control 1253 3570 5012 0.25 0.35
RR=Relative Risk, OR=Odds Ratio.
The Relative Risk (RR) and Odds Ratio (OR) values offer insights into the strength of association between exposure to cement plant emissions and the occurrence of respiratory cases across different health centers, providing valuable information for public health and environmental management. The obtained odds ratios signify a substantial risk to workers and communities residing in proximity to cement factories, indicating a significant association with the increased risk of hospital admissions for respiratory cases.

4. Conclusion and Recommendations

The cement industry in Ethiopia plays a substantial role in the emission of various air pollutants. This study reveals a heightened prevalence of respiratory symptoms among both cement factory workers and the surrounding communities. The increased prevalence is attributed to exposure to particulate matter from cement production. Measurements of particulate matter (PM2.5 and PM10) and gases (CO2, N2O, and SO2) were conducted in different units of Dangote, Kuyu, Nation, Ethio, Derba, Pioneer, and Habesha cement factories, as well as in nearby villages (Sire Berga, Gatira Nabe, Saga, and Bekata) and distant areas (Sanbaro, Qore Sena, Fite, and Haro Lemana) from the factories. Particulate matter emissions from all factory units exceeded the Ethiopian ambient air quality guidelines, while gaseous pollutants remained within permissible levels at all sites.
Nearby villages exhibited the highest particulate matter emissions, although all sites had lower gas pollutant levels compared to both WHO and Ethiopian ambient air quality guidelines. An examination of clinical records of residents in proximity to cement factories revealed a significant impact on the young and middle-aged populations, leading to acute and chronic bronchitis resulting from respiratory allergies. Infants (0-5) and the elderly were less exposed to PM emission-related diseases, as they are less likely to participate in cement factory activities and tend to stay closer to home. Disease occurrences varied among health centers, highlighting the need for comprehensive health monitoring.
To address these issues, it is recommended that measures be implemented, including controlling cement particulate emissions, establishing buffer zones between cement factories and settlements, continuous monitoring, and legal enforcement. Government entities should take proactive steps to ensure the well-being of communities living in proximity to cement factories.

Funding

Not available.

Acknowledgments

The authors thank all cement factories and health centers staffs for their support in giving data, residents of the area who support and shared their perceptions, as well as those who helped us in giving comments and who offered help through various stages of the study.

Conflicts of Interest

The authors declare that there are no conflicts of interest.

References

  1. Dure Mulatu, Lulit Habte, Ji-Whan Ahn, The Cement Industry in Ethiopia, J. Energy Eng. 27 (n.d.) 68–73. [CrossRef]
  2. Julius Mwaiselage, Magne Bråtveit, Bente E Moen, Yohana Mashalla, Respiratory symptoms and chronic obstructive pulmonary disease among cement factory workers, Scand J Work Env. Health. 4 (2005) 316–23. [CrossRef]
  3. Z.K. Zeleke, B.E. Moen, M. Bråtveit, Cement dust exposure and acute lung function: A cross shift study, BMC Pulm. Med. 10 (2010) 19. [CrossRef]
  4. E. Worrell, L. Price, N. Martin, C. Hendriks, L.O. Meida, C ARBON D IOXIDE E MISSIONS FROM THE G LOBAL C EMENT I NDUSTRY, Annu. Rev. Energy Environ. 26 (2001) 303–329. [CrossRef]
  5. E. Nkhama, M. Ndhlovu, J. Dvonch, M. Lynam, G. Mentz, S. Siziya, K. Voyi, Effects of Airborne Particulate Matter on Respiratory Health in a Community near a Cement Factory in Chilanga, Zambia: Results from a Panel Study, Int. J. Environ. Res. Public. Health. 14 (2017) 1351. [CrossRef]
  6. S.A. Abdul-Wahab, Impact of fugitive dust emissions from cement plants on nearby communities, Ecol. Model. 195 (2006) 338–348. [CrossRef]
  7. S. Aydin, S. Aydin, G. Croteau, Í. Sahin, C. Citil, Ghrelin, Nitrite and Paraoxonase/Arylesterase Concentrations in Cement Plant Workers, J. Med. Biochem. 29 (2010) 78–83. [CrossRef]
  8. Z.K. Zeleke, B.E. Moen, M. Bråtveit, Lung function reduction and chronic respiratory symptoms among workers in the cement industry: a follow up study, BMC Pulm. Med. 11 (2011) 50. [CrossRef]
  9. S. Peters, Y. Thomassen, E. Fechter-Rink, H. Kromhout, Personal exposure to inhalable cement dust among construction workers, J. Phys. Conf. Ser. 151 (2009) 012054. [CrossRef]
  10. C. Ciobanu, I.A. Istrate, P. Tudor, G. Voicu, Dust Emission Monitoring in Cement Plant Mills: A Case Study in Romania, Int. J. Environ. Res. Public. Health. 18 (2021) 9096. [CrossRef]
  11. Stewart, R., et al., The Global Burden of Disease: Generating Evidence, Guiding Policy-European Union and European Free Trade Association Regional Edition, nstitute for Health Metrics and Evaluation, Seattle, WA: IHME., 2013. https://www.healthdata.org/research-analysis/library/global-burden-disease-generating-evidence-guiding-policy-european-union.
  12. S. Mendis, S. Davis, B. Norrving, Organizational Update: The World Health Organization Global Status Report on Noncommunicable Diseases 2014; One More Landmark Step in the Combat Against Stroke and Vascular Disease, Stroke. 46 (2015). [CrossRef]
  13. A.U. Rauf, A. Mallongi, A. Daud, M. Hatta, W. Al-Madhoun, R. Amiruddin, S.A. Rahman, A. Wahyu, R.D.P. Astuti, Community Health Risk Assessment of Total Suspended Particulates near a Cement Plant in Maros Regency, Indonesia, J. Health Pollut. 11 (2021) 210616. [CrossRef]
  14. Z. Gizaw, B. Yifred, T. Tadesse, Chronic respiratory symptoms and associated factors among cement factory workers in Dejen town, Amhara regional state, Ethiopia, 2015, Multidiscip. Respir. Med. 11 (2016) 13. [CrossRef]
  15. V. Etyemezian, M. Tesfaye, A. Yimer, J. Chow, D. Mesfin, T. Nega, G. Nikolich, J. Watson, M. Wondmagegn, Results from a pilot-scale air quality study in Addis Ababa, Ethiopia, Atmos. Environ. 39 (2005) 7849–7860. [CrossRef]
  16. K.T. Beketie, A.T. Angessa, T.T. Zeleke, D.Y. Ayal, Impact of cement factory emission on air quality and human health around Mugher and the surrounding villages, Central Ethiopia, Air Qual. Atmosphere Health. 15 (2022) 347–361. [CrossRef]
  17. O. Oguntoke, A.E. Awanu, H.J. Annegarn, Impact of cement factory operations on air quality and human health in Ewekoro Local Government Area, South-Western Nigeria, Int. J. Environ. Stud. 69 (2012) 934–945. [CrossRef]
  18. A.T. Teologo, E.P. Dadios, R.G. Baldovino, R.Q. Neyra, I.M. Javel, Air Quality Index (AQI) Classification using CO and NO2 Pollutants: A Fuzzy-based Approach, in: TENCON 2018 - 2018 IEEE Reg. 10 Conf., IEEE, Jeju, Korea (South), 2018: pp. 0194–0198. [CrossRef]
  19. WHO, WHO Ambient Air quality database, (2023). https://www.who.int/data/gho/data/themes/air-pollution/who-air-quality-database.
  20. D. Zmirou, Traffic related air pollution and incidence of childhood asthma: results of the Vesta case-control study, J. Epidemiol. Community Health. 58 (2004) 18–23. [CrossRef]
  21. C.-Y. Chen, H.-J. Hung, K.-H. Chang, C.Y. Hsu, C.-H. Muo, C.-H. Tsai, T.-N. Wu, Long-term exposure to air pollution and the incidence of Parkinson’s disease: A nested case-control study, PLOS ONE. 12 (2017) e0182834. [CrossRef]
  22. G.J. Holst, C.B. Pedersen, M. Thygesen, J. Brandt, C. Geels, J.H. Bønløkke, T. Sigsgaard, Air pollution and family related determinants of asthma onset and persistent wheezing in children: nationwide case-control study, BMJ. (2020) m2791. [CrossRef]
  23. C. Andrade, Understanding Relative Risk, Odds Ratio, and Related Terms: As Simple as It Can Get: (Clinical and Practical Psychopharmacology), J. Clin. Psychiatry. 76 (2015) e857–e861. [CrossRef]
  24. S. Hennessy, W.B. Bilker, J.A. Berlin, B.L. Strom, Factors Influencing the Optimal Control-to-Case Ratio in Matched Case-Control Studies, Am. J. Epidemiol. 149 (1999) 195–197. [CrossRef]
  25. G. Rolph, A. Stein, B. Stunder, Real-time Environmental Applications and Display sYstem: READY, Environ. Model. Softw. 95 (2017) 210–228. [CrossRef]
  26. F.H. Schmidt, C.A. Velds, On the relation between changing meteorological circumstances and the decrease of the sulphur dioxide concentration around Rotterdam, Atmospheric Environ. 1967. 3 (1969) 455–460. [CrossRef]
  27. A.K. Gorai, F. Tuluri, P.B. Tchounwou, S. Ambinakudige, Influence of local meteorology and NO2 conditions on ground-level ozone concentrations in the eastern part of Texas, USA, Air Qual. Atmosphere Health. 8 (2015) 81–96. [CrossRef]
  28. B. Zhang, L. Jiao, G. Xu, S. Zhao, X. Tang, Y. Zhou, C. Gong, Influences of wind and precipitation on different-sized particulate matter concentrations (PM2.5, PM10, PM2.5–10), Meteorol. Atmospheric Phys. 130 (2018) 383–392. [CrossRef]
  29. J. Wang, S. Ogawa, Effects of Meteorological Conditions on PM2.5 Concentrations in Nagasaki, Japan, Int. J. Environ. Res. Public. Health. 12 (2015) 9089–9101. [CrossRef]
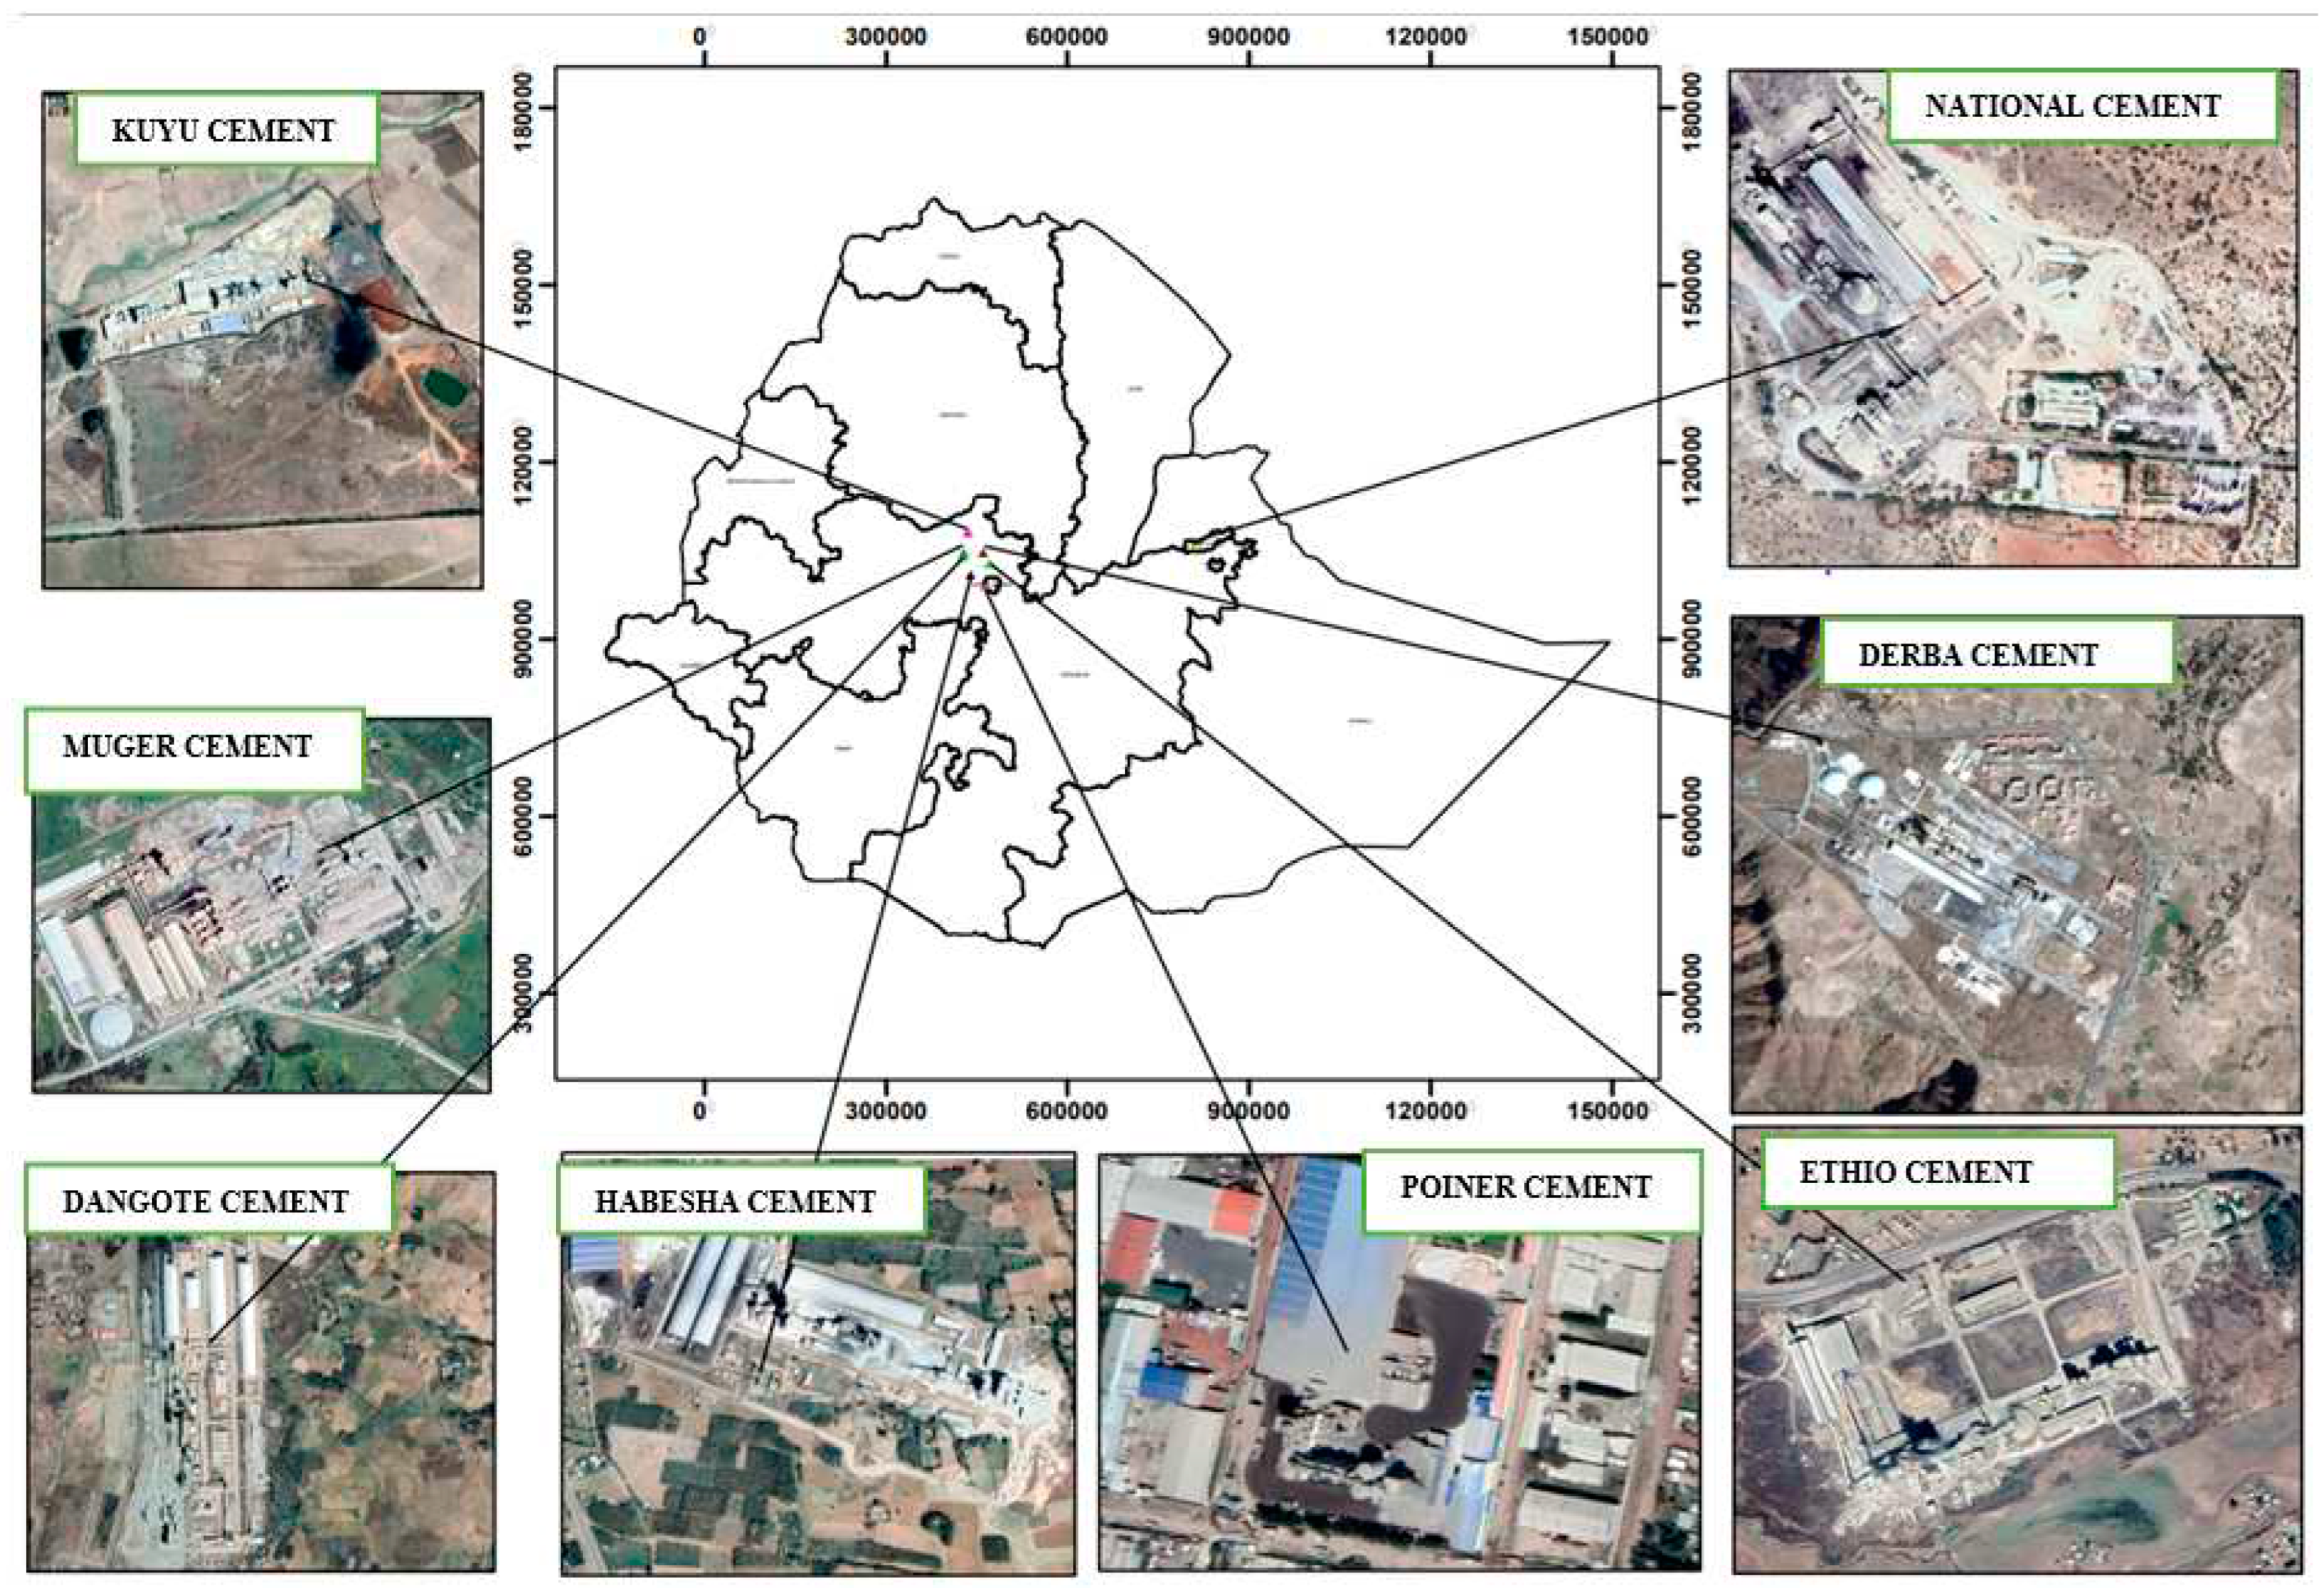
Figure 1. Description of the cement factories in the study area.
Preprints 95240 g001
Figure 3. Mean emissions of PM10 μg/m3 pollutants measured at different distant.
Preprints 95240 g004
Figure 4. Patients record with different diseases for different years of all health centers. D=Dangote, M=Muger, H.C=Health Center.
Preprints 95240 g005
Table 1. Mean emission of PM2.5 and PM10 μg/m3 pollutants measured at different production room.
Sample room Pollutant (μg/m3)
Sampling time
Name of cement factories
Dangote Kuyu National Ethio Derba Pioneer Habesha
Mill PM2.5 Morning 617.2 599.7 611.3 613.7 611.9 613.1 598.9
Afternoon 698.1 711.2 699.7 712.8 723.7 714.5 736.6
PM10 Morning 607.2 707 815.3 827.7 799.5 814.2 812.4
Afternoon 723.9 823.4 933 943.9 898.3 908.9 923
Coal crushing PM2.5
Morning 123.4 154.3 143.1 165.4 159.4 155.8 161.1
Afternoon 158.2 164.4 146.8 159.3 163.2 176.1 154.2
PM10 Morning 199.5 223.2 199.5 253.4 213.6 210.3 204.1
Afternoon 189.6 384.5 254.4 294.3 289.4 279.5 298.2
storage PM2.5
Morning 216.3 209.7 199.9 213.5 212.4 216.2 213.8
Afternoon 165.8 158.2 153.6 149.8 165.3 159.4 156.3
PM10 Morning 654.8 764.4 724.1 764.5 732.6 765.2 777.1
Afternoon 553.4 673.1 633.5 633.3 654.2 687.1 686.3
loading PM2.5
Morning 123.5 136.4 140.2 143.3 137.2 144.3 140.2
Afternoon 143.1 143.2 132.5 138.6 138.5 129.8 140.2
PM10 Morning 215.2 345.4 335.0 325.6 321.1 327.3 323.2
Afternoon 392.8 369 561 467 565 394 569
Table 2. Mean emission of CO2, N2O and S2O mg/m3 pollutants measured at different production room.
Sample room Pollutant (mg/m3) sampling time Name of cement factories
Dangote Kuyu National Ethio Derba Pioneer Habesha

Mill
CO2 Morning 353.2 342.4 339.8 341.2 350.3 325.6 343.1
Afternoon 543.6 564.5 567.2 569.3 568.9 588.6 570.1
N2O Morning 1.99 2.65 2.75 2.87 2.65 2.59 2.45
Afternoon 3.78 4.21 4.65 4.66 3.89 3.89 4.43
SO2 Morning 0.31 0.282 0.282 0.2101 0.321 0.2861 0.2651
Afternoon 1.02 0.99 1.11 1.03 1.04 0.98 1.05
Coal crasher CO2 Morning 245.5 267.4 238.7 255.1 242.5 247.4 243.6
Afternoon 269.8 278.3 266.5 269.3 268.9 269.6 274.8
N2O Morning 2.89 4.3 4.26 4.43 4.23 4.01 4.61
Afternoon 3.76 4.5 3.89 4.52 3.97 4.32 3.98
SO2 Morning 0.499 0.612 0.652 0.662 0.644 0.578 0.547
Afternoon 0.81 0.81 0.76 0.85 0.78 0.83 0.78
Storage CO2 Morning 342.7 354.1 342.4 354.3 345 355.2 339.4
Afternoon 400.01 387.8 401 398.6 397.8 400 398.9
N2O Morning 1.87 2.75 2.87 2.62 2.23 2.17 2.79
Afternoon 1.8 2.02 2.23 2.32 2.21 2.09 2.21
SO2 Morning 0.32 0.213 0.311 0.269 0.269 0.199 0.267
Afternoon 0.161 0.163 0.152 0.149 0.161 0.498 0.155
Loading CO2 Morning 361.2 365.2 363.2 354.6 360.1 362.1 363.4
Afternoon 259.6 255.8 264 259.8 258.3 263.1 262.2
N2O Morning 7.9 8.23 8.56 7.99 8.15 7.69 8.32
Afternoon 6.78 6.99 7.12 6.96 7.65 6.98 7.89
SO2 Morning 0.71 0.712 0.558 0.692 0.597 0.655 0.697
Afternoon 1.22 1.213 1.187 1.1732 1.1658 1.1231 1.1761
Table 3. Mean emissions of CO2, N2O and SO2 mg/m3 pollutants measured at different distant.
Sample distance (km) Pollutant (mg/m3) Duration Name of cement factories
Dangote muger Kuyu National Ethio Derba Pioneer Habesha
10 C2O Morning 399 410 410 411 407 413 419 415
Afternoon 512 513 513 499 512 417 522 509
N2O Morning 1.143 1.234 1.234 1.198 1.312 1.288 1.197 1.213
Afternoon 1.324 1.324 1.324 1.387 1.322 1.562 1.423 1.399
SO2 Morning 0.255 0.324 0.324 0.323 0.288 0.313 0.234 0.254
Afternoon 0.432 0.419 0.419 0.455 0.394 0.432 0.423 0.435
20 CO2 Morning 437.9 445 445 437.1 439 463 433 429
Afternoon 299.8 326 326 317 309 324 332 324
N2O Morning 2.23 2.22 2.22 2.21 2.32 2.26 2.34 2.36
Afternoon 3.36 3.35 3.35 3.51 3.48 3.52 3.45 3.43
SO2 Morning 0.522 0.4982 0.4982 0.5332 0.4897 0.5332 0.4665 0.5753
Afternoon 0.5321 0.4887 0.4887 0.5123 0.3987 0.5532 0.5234 0.5023
30 CO2 Morning 283 276 276 269 277 288 279 274
Afternoon 453 435 435 444.1 428 447 431 425
N2O Morning 1.18 1.21 1.21 1.18 1.3 1.19 1.3 1.29
Afternoon 1.29 1.32 1.32 1.28 1.29 1.28 1.28 1.22
SO2 Morning 0.2325 0.3015 0.3015 0.2413 0.2432 0.2421 0.2635 0.2432
Afternoon 0.2654 0.2543 0.2543 0.2341 0.2124 0.2543 0.2534 0.2543
40 CO2 Morning 255 288 288 268 266 255 264 267
Afternoon 266 278 278 276 272 282 278 270
N2O Morning 2.01 2.21 2.21 1.89 2.02 2.34 2.25 2.02
Afternoon 2.765 2.965 2.965 2.786 2.698 3.01 2.772 2.973
SO2 Morning 0.37 0.42 0.42 0.37 0.35 0.29 0.38 0.39
Afternoon 0.54 0.49 0.49 0.53 0.54 0.49 0.58 0.56
Disclaimer/Publisher’s Note: The statements, opinions and data contained in all publications are solely those of the individual author(s) and contributor(s) and not of MDPI and/or the editor(s). MDPI and/or the editor(s) disclaim responsibility for any injury to people or property resulting from any ideas, methods, instructions or products referred to in the content.
Copyright: This open access article is published under a Creative Commons CC BY 4.0 license, which permit the free download, distribution, and reuse, provided that the author and preprint are cited in any reuse.
Prerpints.org logo

Preprints.org is a free preprint server supported by MDPI in Basel, Switzerland.

Subscribe

© 2024 MDPI (Basel, Switzerland) unless otherwise stated