Submitted:
07 January 2024
Posted:
18 January 2024
You are already at the latest version
Abstract
Keywords:
1. Introduction
2. Mathematical Equations of the Proposed Membrane-Fouling Model
2.1. Model Development
-
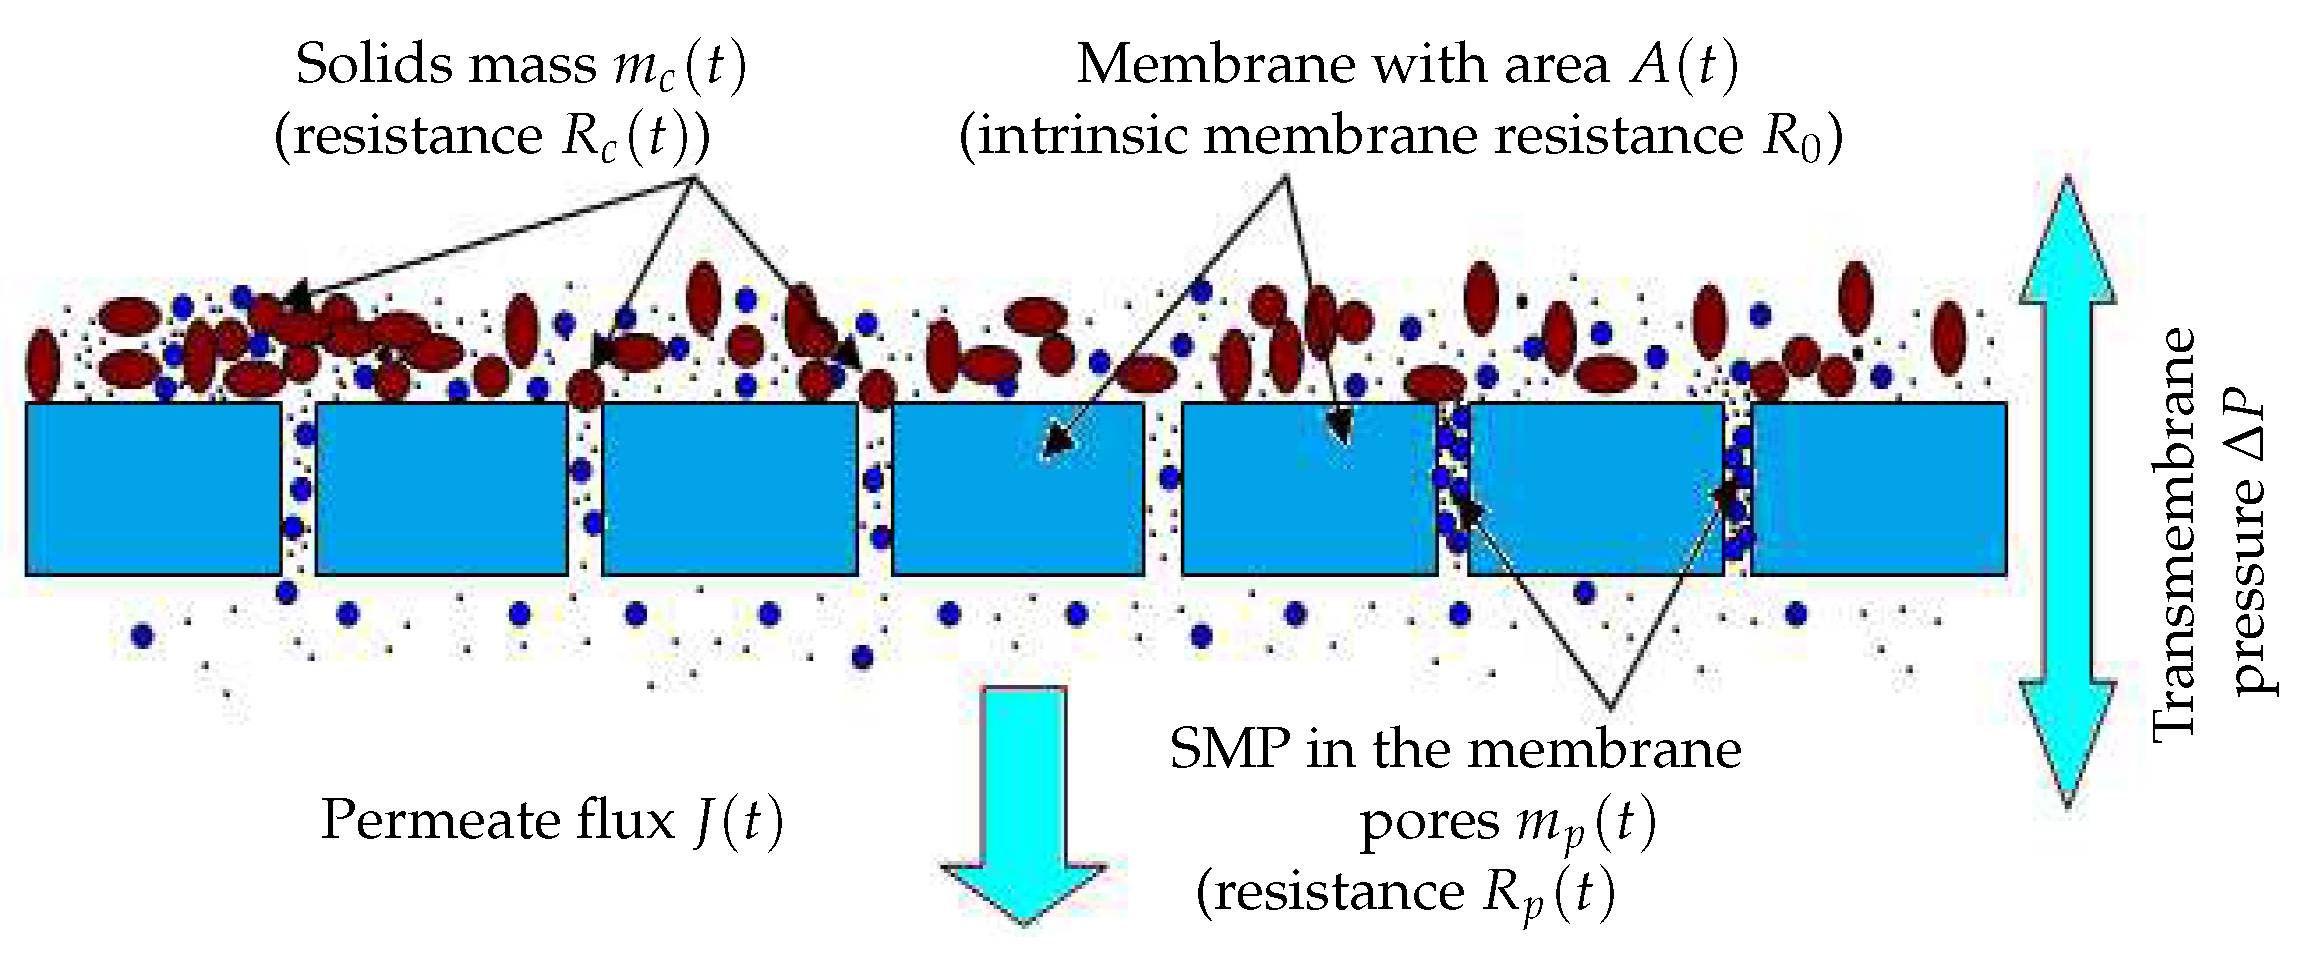
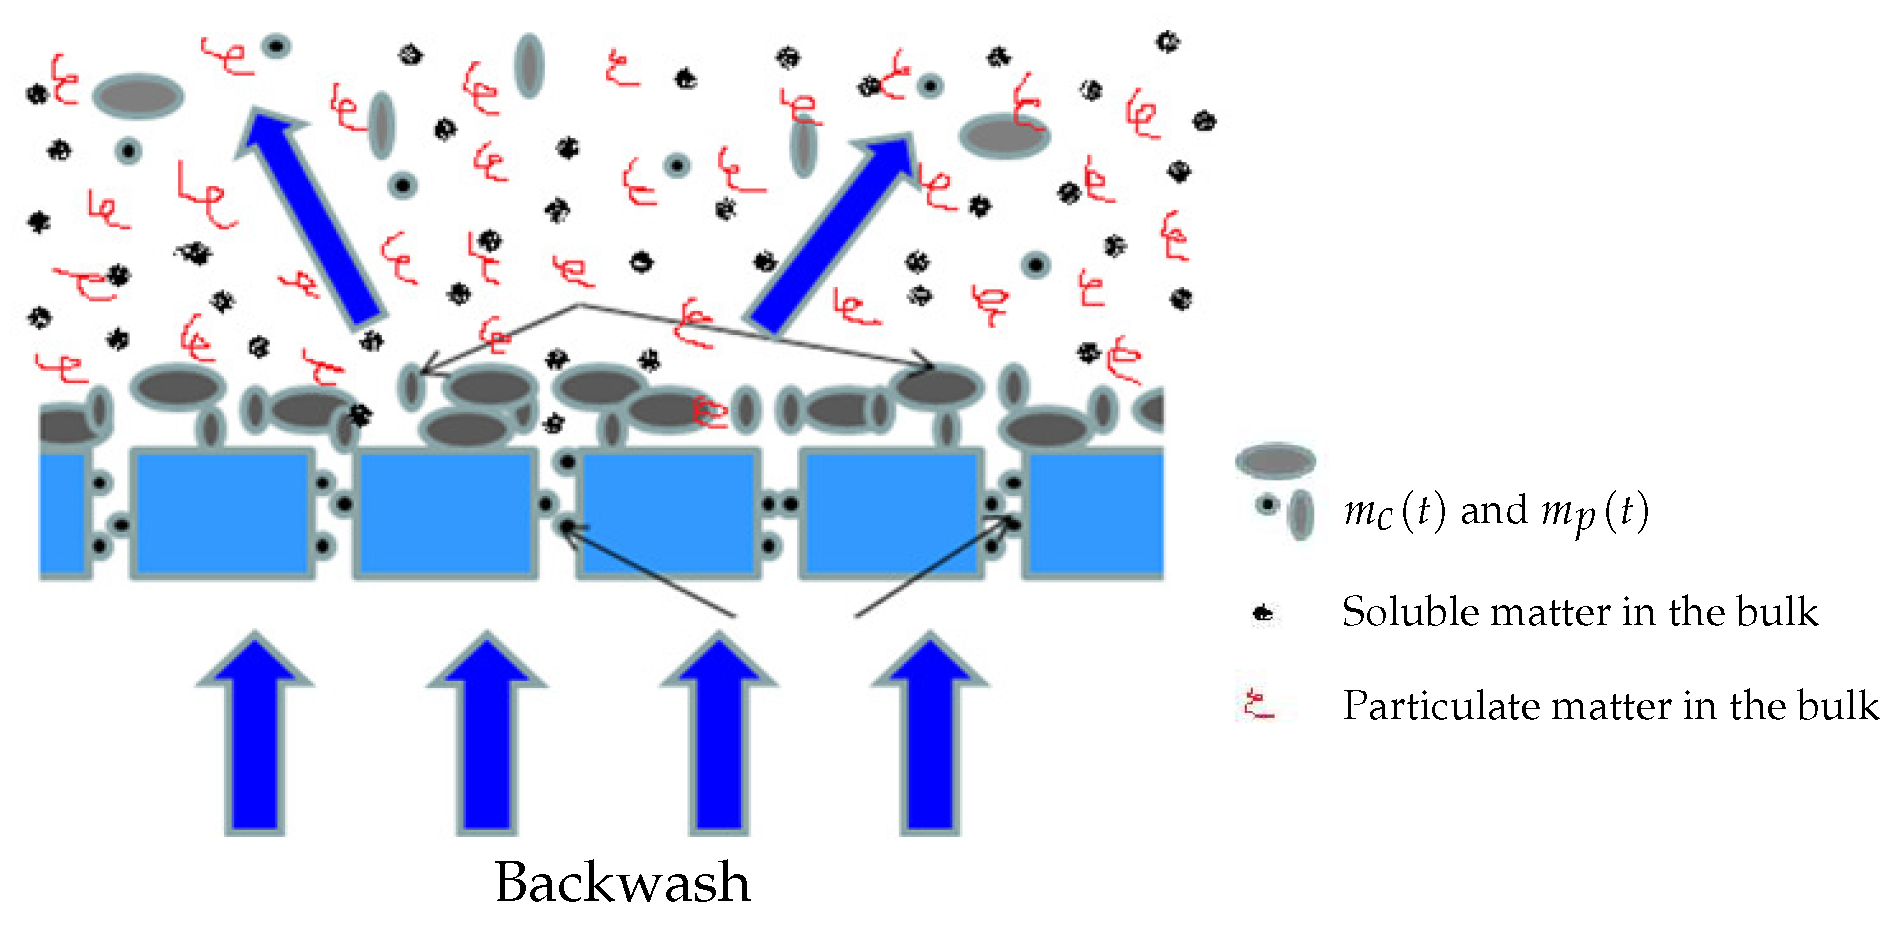
Fouling mechanismsIt is well known that the fouling dynamics is different depending on the fouling mode considered, namely pore constriction, cake formation, complete blocking and intermediate blocking [19]. In our simple model, we consider only the two main membrane fouling mechanisms, as defined in [18] (see Figure 1):
- –
- The first one is caused by the mass of solids which attach onto the membrane surface also called cake formation or cake fouling. According to the particles concentration and solids attachment rate, particles are retained leading to a decrease of the filtering area of the membrane.
- –
- The second is due to the mass of particles retained inside the membrane pores as SMP, called hereafter pore constriction. Their size may be smaller than the pore sizes and they are known to progressively clog the membrane pores. This phenomenon typically reduces the porous area of the membrane.
-
Models of membrane resistance and membrane areaand are typically dependent on masses and , respectively, and are modeled by (3) (adapted from [13]):with and the specific resistances and () the porous area which is a fraction of the total useful surface area A, (see Figure 2 for a flat sheet membrane for instance).Contrary to several literature studies on fouling modeling, we consider that the total filtering membrane surface area , is not constant during a filtration period nor after several filtration/cleaning cycles: it is described by (4) in a very general way as a decreasing function of and :with the initial membrane surface and and parameters used to model the contribution of and to the surface reduction. Such a function is well adapted if we assume that the total useful filtration area is composed of two parts: a filtering surface and a porous surface. If increases, then the porous surface decreases leading to the total loss of even if the cake fouling is not yet significant. Likewise, if increases then the filtering surface decreases because attached particles may prevent the flux to circulate freely, even if the pores clogging fouling reaches its equilibrium or if it is not yet significant. In short, the membrane surface decreases when and/or increase (mathematically, tends to zero as and/or tend to infinity).The function (4) is also able to model the fact that the initial filtering surface is not totally recovered after a backwash or a chemical cleaning. Theoretically, in equation (4), if and when we operate the MBR plant for the first time, or after each perfect backwash of the membrane, then the area is equal to its initial value . However, in practice, after each membrane backwash or cleaning, there is small remaining quantities of and which are not detached, causing progressively an irreversible fouling effect. On the long term, the surface continuously decreases, leading to the membrane degeneration.
-
Models of attached solids on the membrane surface and blocked SMP into poresBoth compounds and have their own dynamics: they increase during the filtration phase and decrease during the relaxation (or backwash) phase. Since it is assumed that the mixed liquor is homogeneous, we assume that all soluble components (, and SMP) and particulate components (, ) may contribute, at different degrees, to the membrane fouling by cake formation (solids attachment). Thus, the dynamic of the mass can be described by (5):where , and are weighting parameters used to model the contribution and the rate of each variable to the cake formation. In practice, they must be adjusted using calibration data (see the experimental results Section 4).The membrane has a selective rejection: particulate components (biomass) and large solute compounds (as macro-molecules of SMP) are totally retained by the membrane (their size being supposed to be greater than the pores diameter), while part of the solute components (substrates and a fraction of SMP) go through the membrane without retention (their size is assumed to be smaller than the pores diameter). We propose the following dynamic model (6) for the pores clogging by :where is a parameter used to calibrate the rate of pores clogging, by the fraction of SMP leaving the bioreactor, while is used to model the contribution of others solute substrates to the pores clogging.On the other hand, no back-diffusion of and to the bulk solution is considered: we assume it is negligible with respect to the remaining attached and blocked matter.
-
Additional hypothesis: There is no biomass growth on the membrane surface and detached solids do not affect matter concentration in the bulk liquidFor simplicity, we assume that the biological growth of the attached biomass on the membrane (as well as in the pores) is neglected. This hypothesis is justified by the fact that backwash or relaxation periods arise quite often. In addition, we assume that if there are detached quantities of and during relaxation, which return into the bioreactor, they can be neglected with respect to their corresponding concentrations in the bulk liquid (see Figure 3). In many operated MBR, detached matter by backwash is not returned into the reaction medium and is rejected elsewhere. Finally, both fouling mechanisms are considered to be partially irreversible, but at different degrees i.e, fouling by pores clogging is more irreversible than fouling by cake formation.
2.2. Fouling Model for the Filtration Phase
2.3. Fouling Model for the Relaxation (or Backwash) Phase
3. Simulation Results
3.1. Coupling the Membrane Fouling Model with the AM2b Model
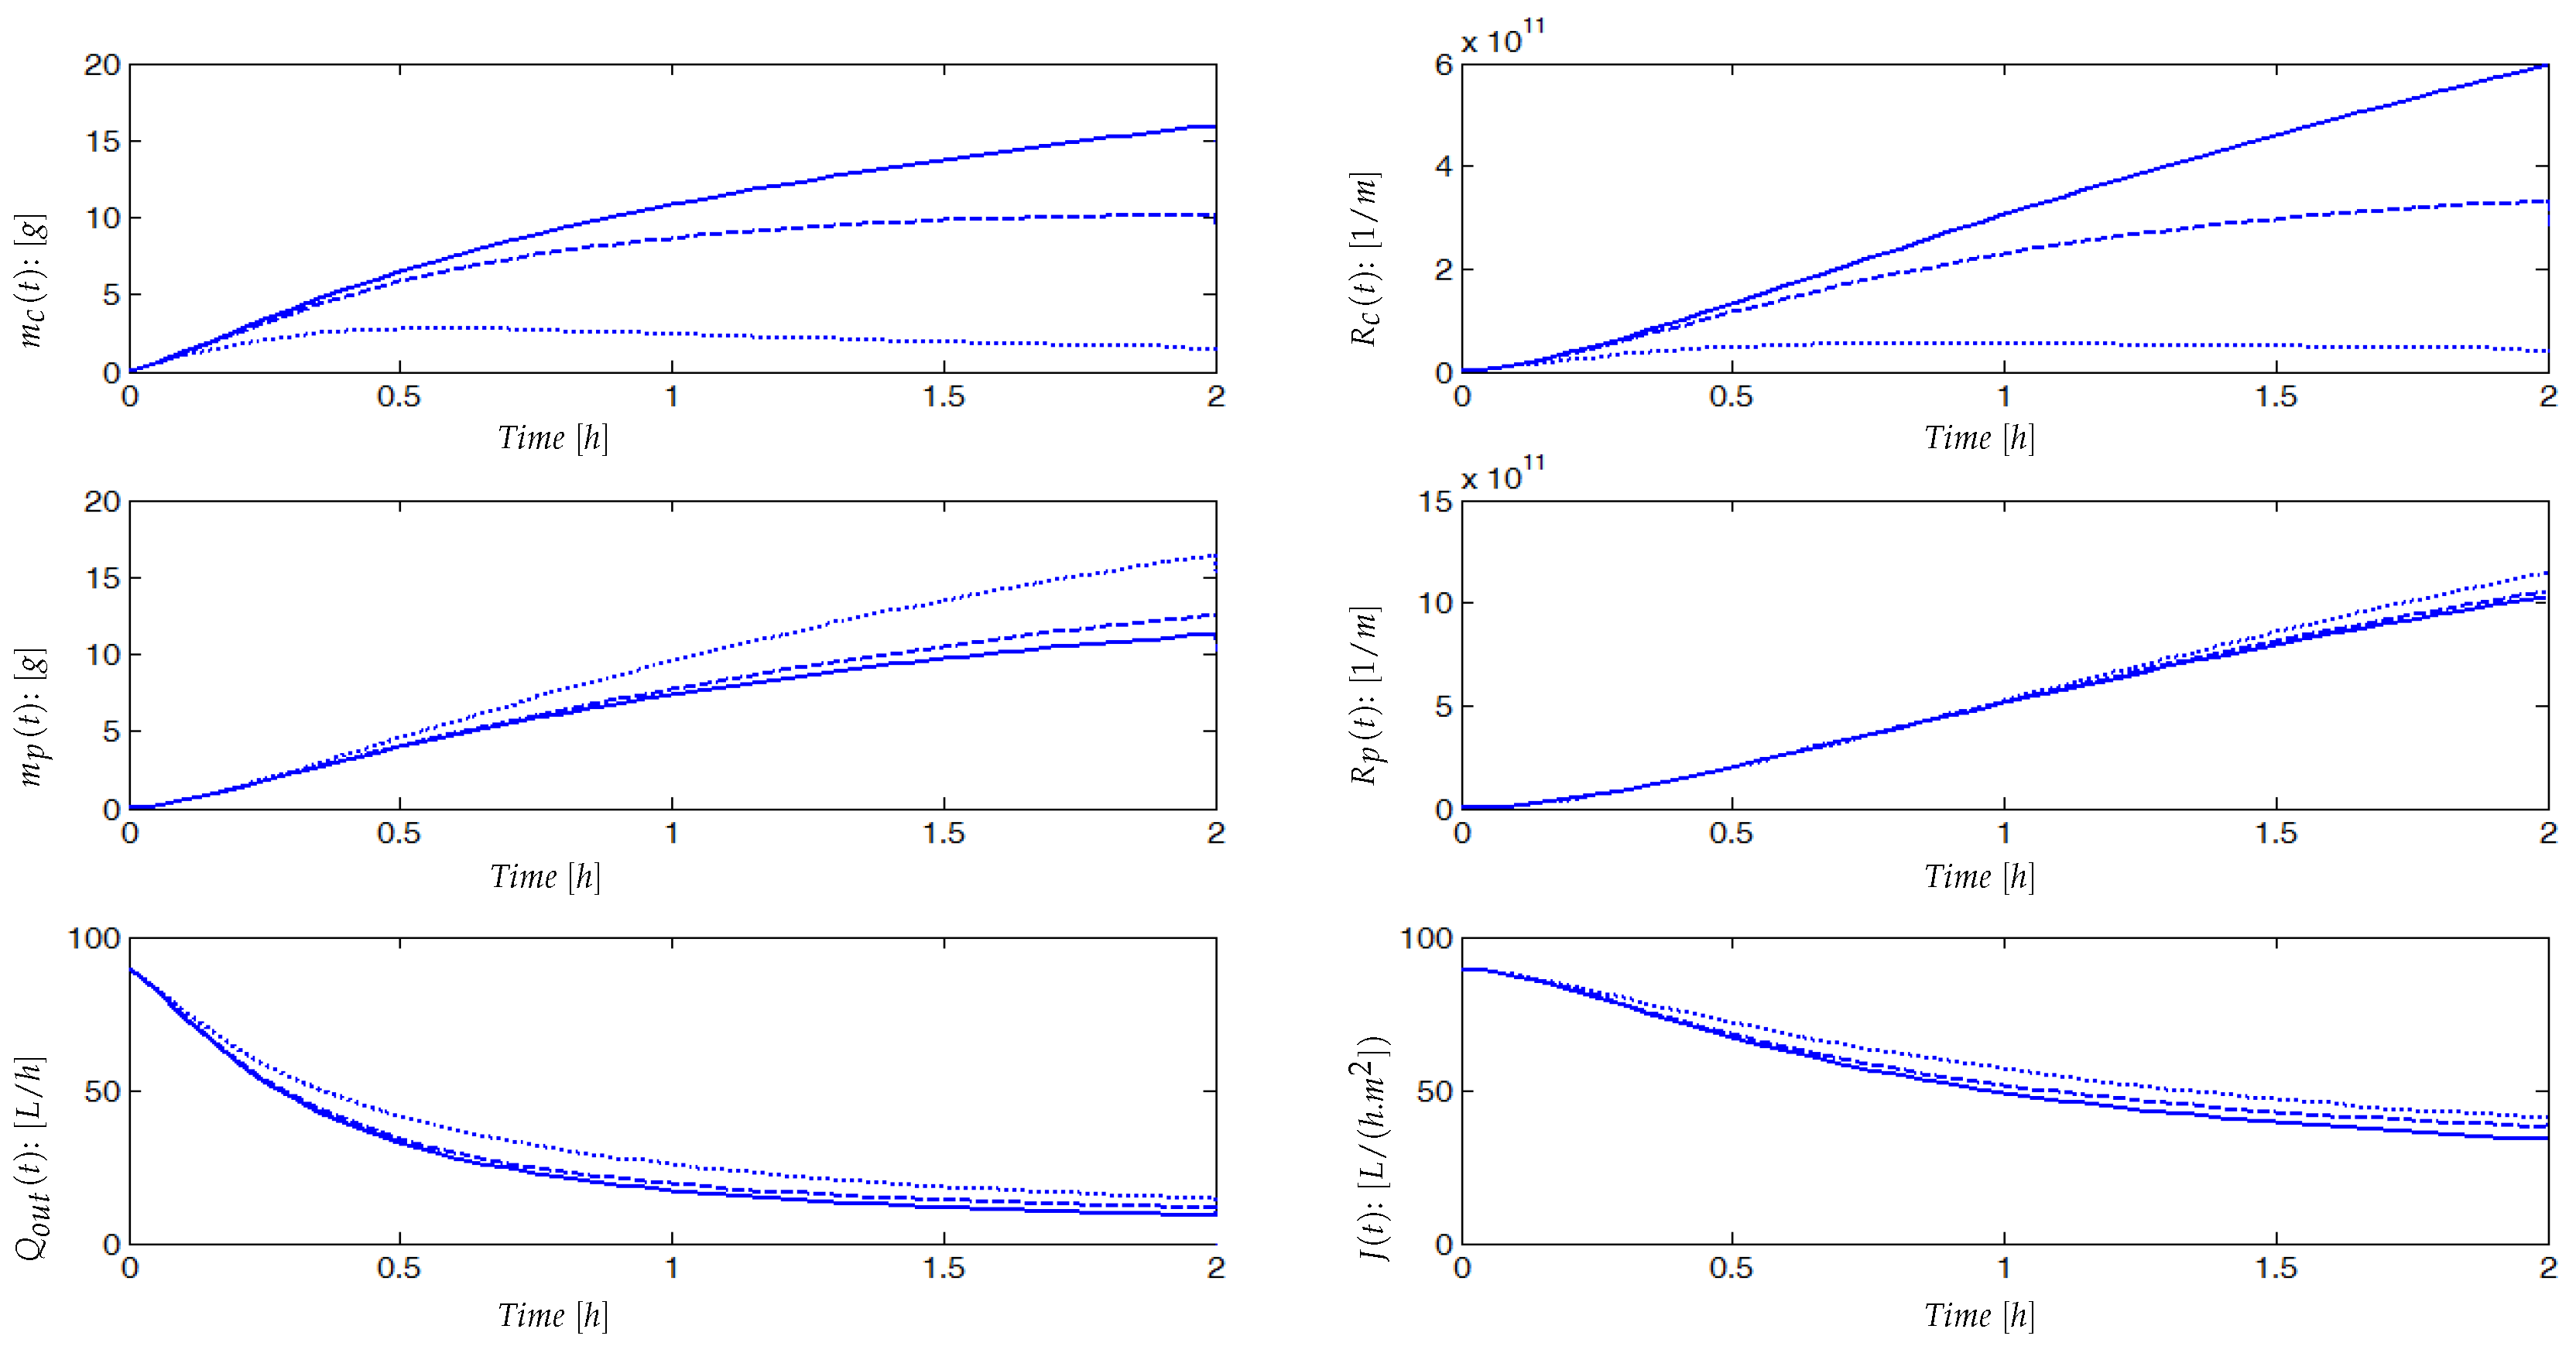
3.2. Investigating the Qualitative Behavior of the Model
4. Experimental Results
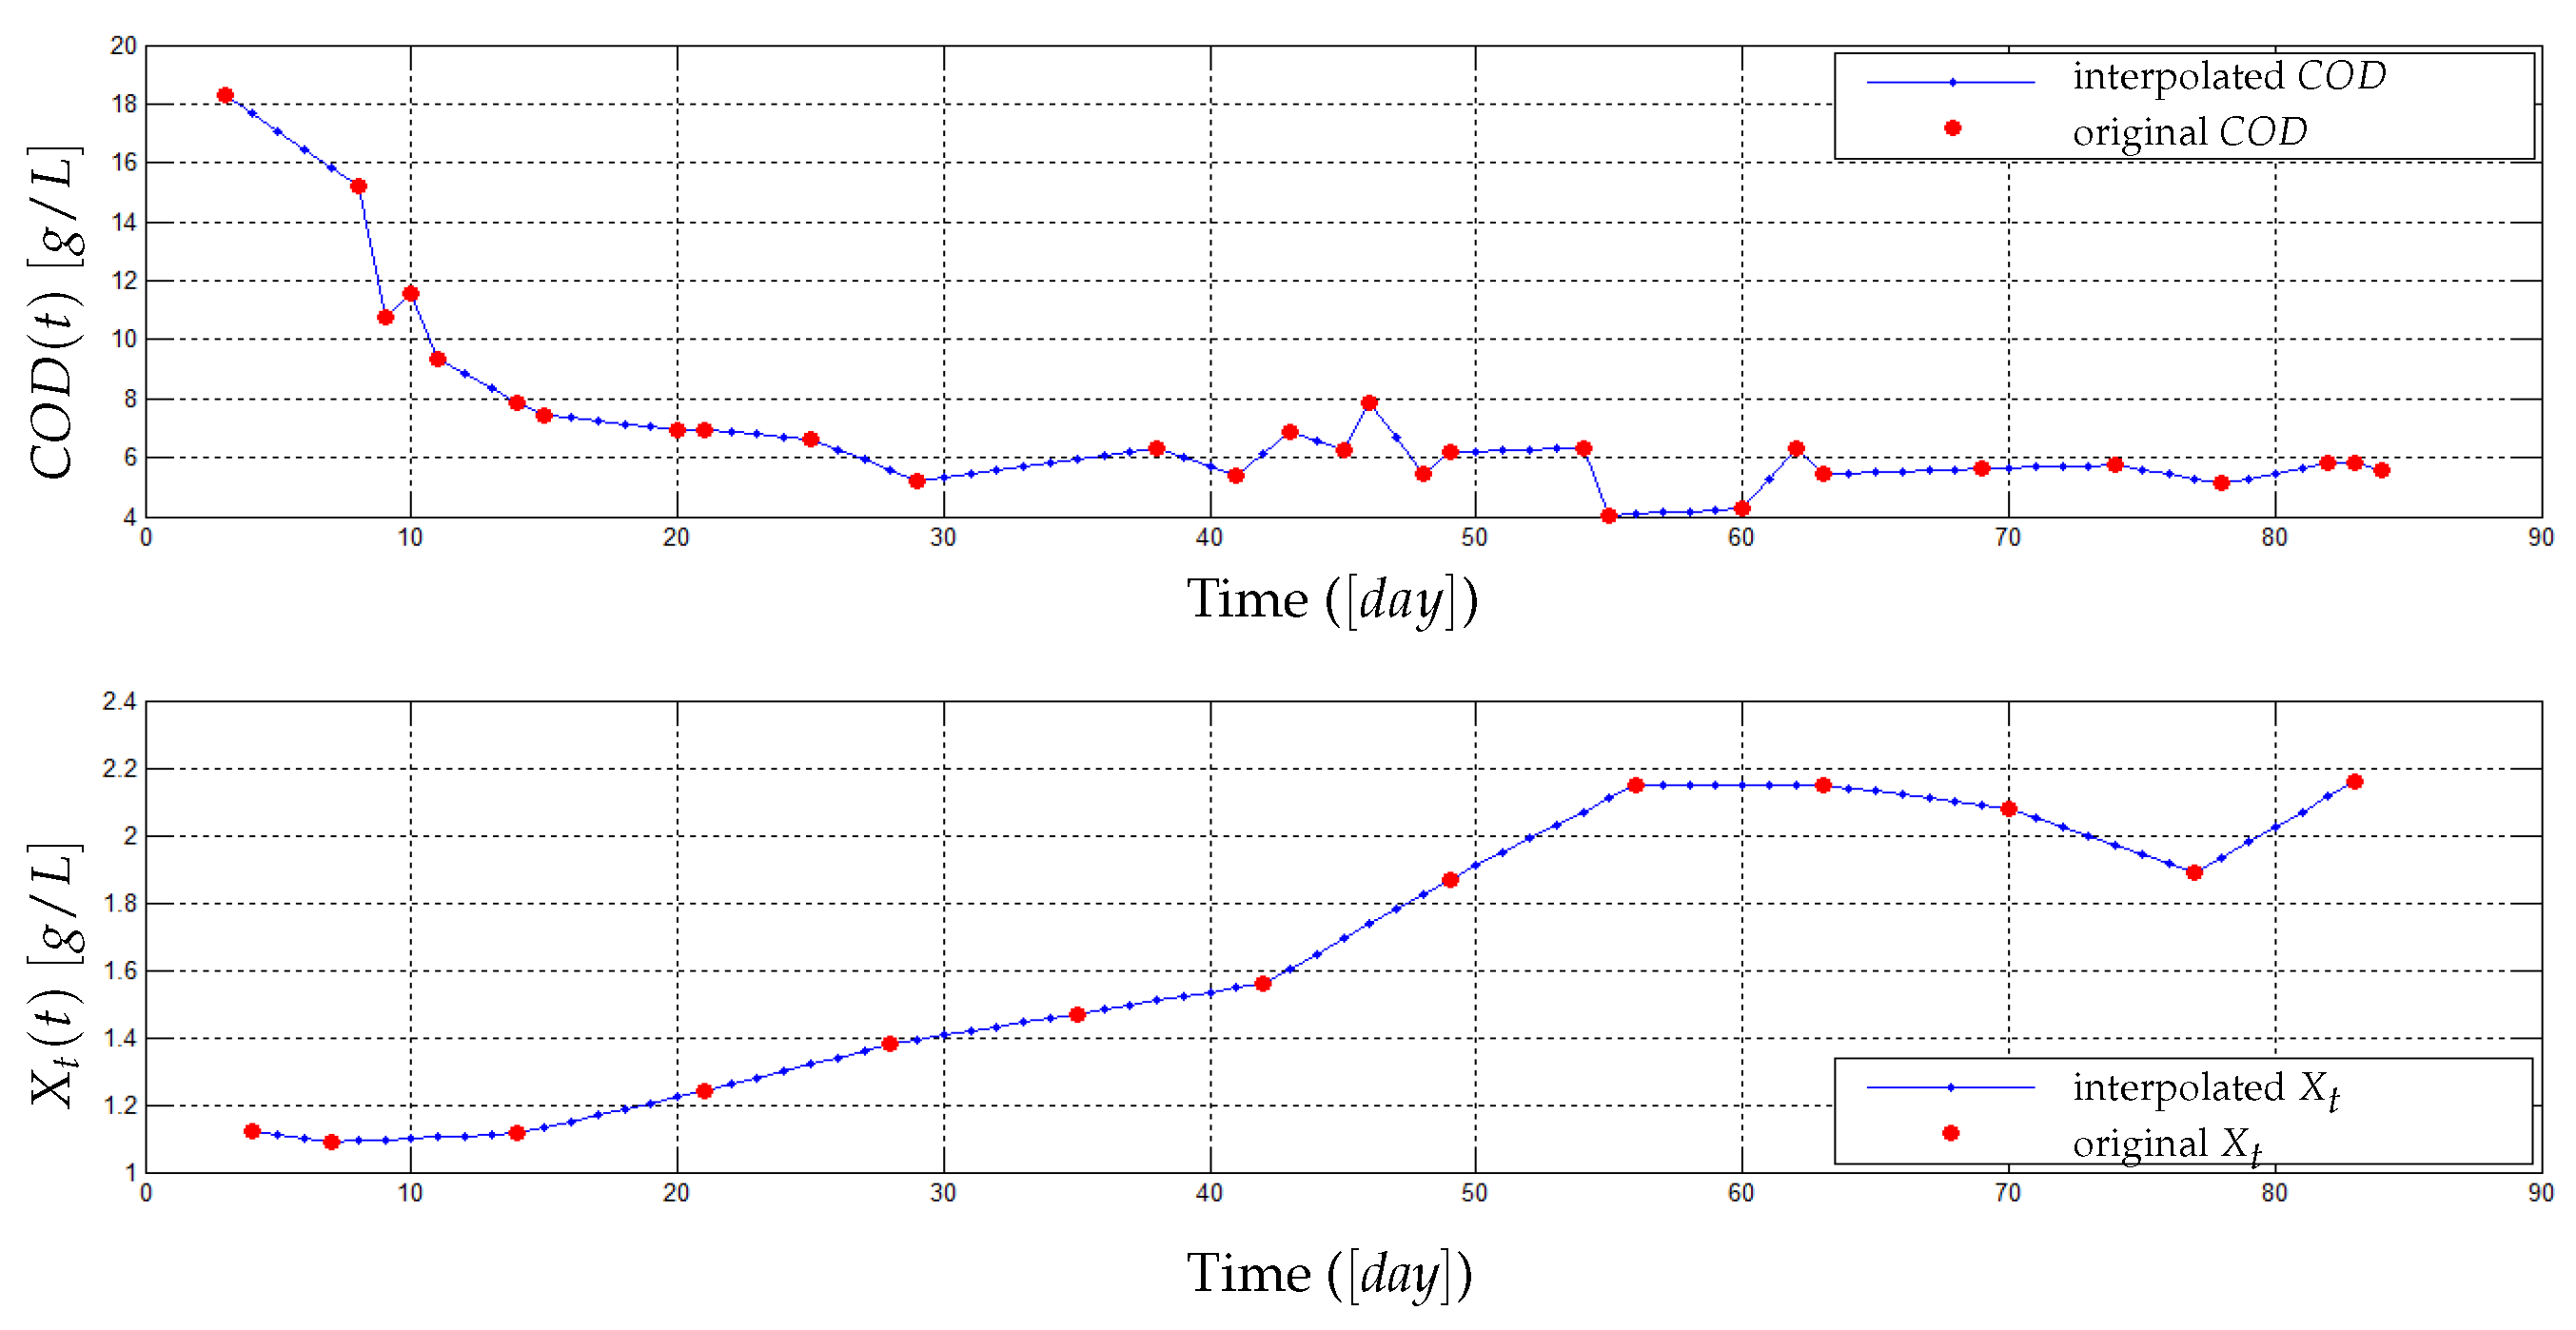
4.1. Pilot Plant (AnMBR) and Data Used for the Model Validation
4.2. Experimental Identification and Validation of the Fouling Model
4.2.1. Parameters Estimation Procedure
4.2.2. Results and Discussion
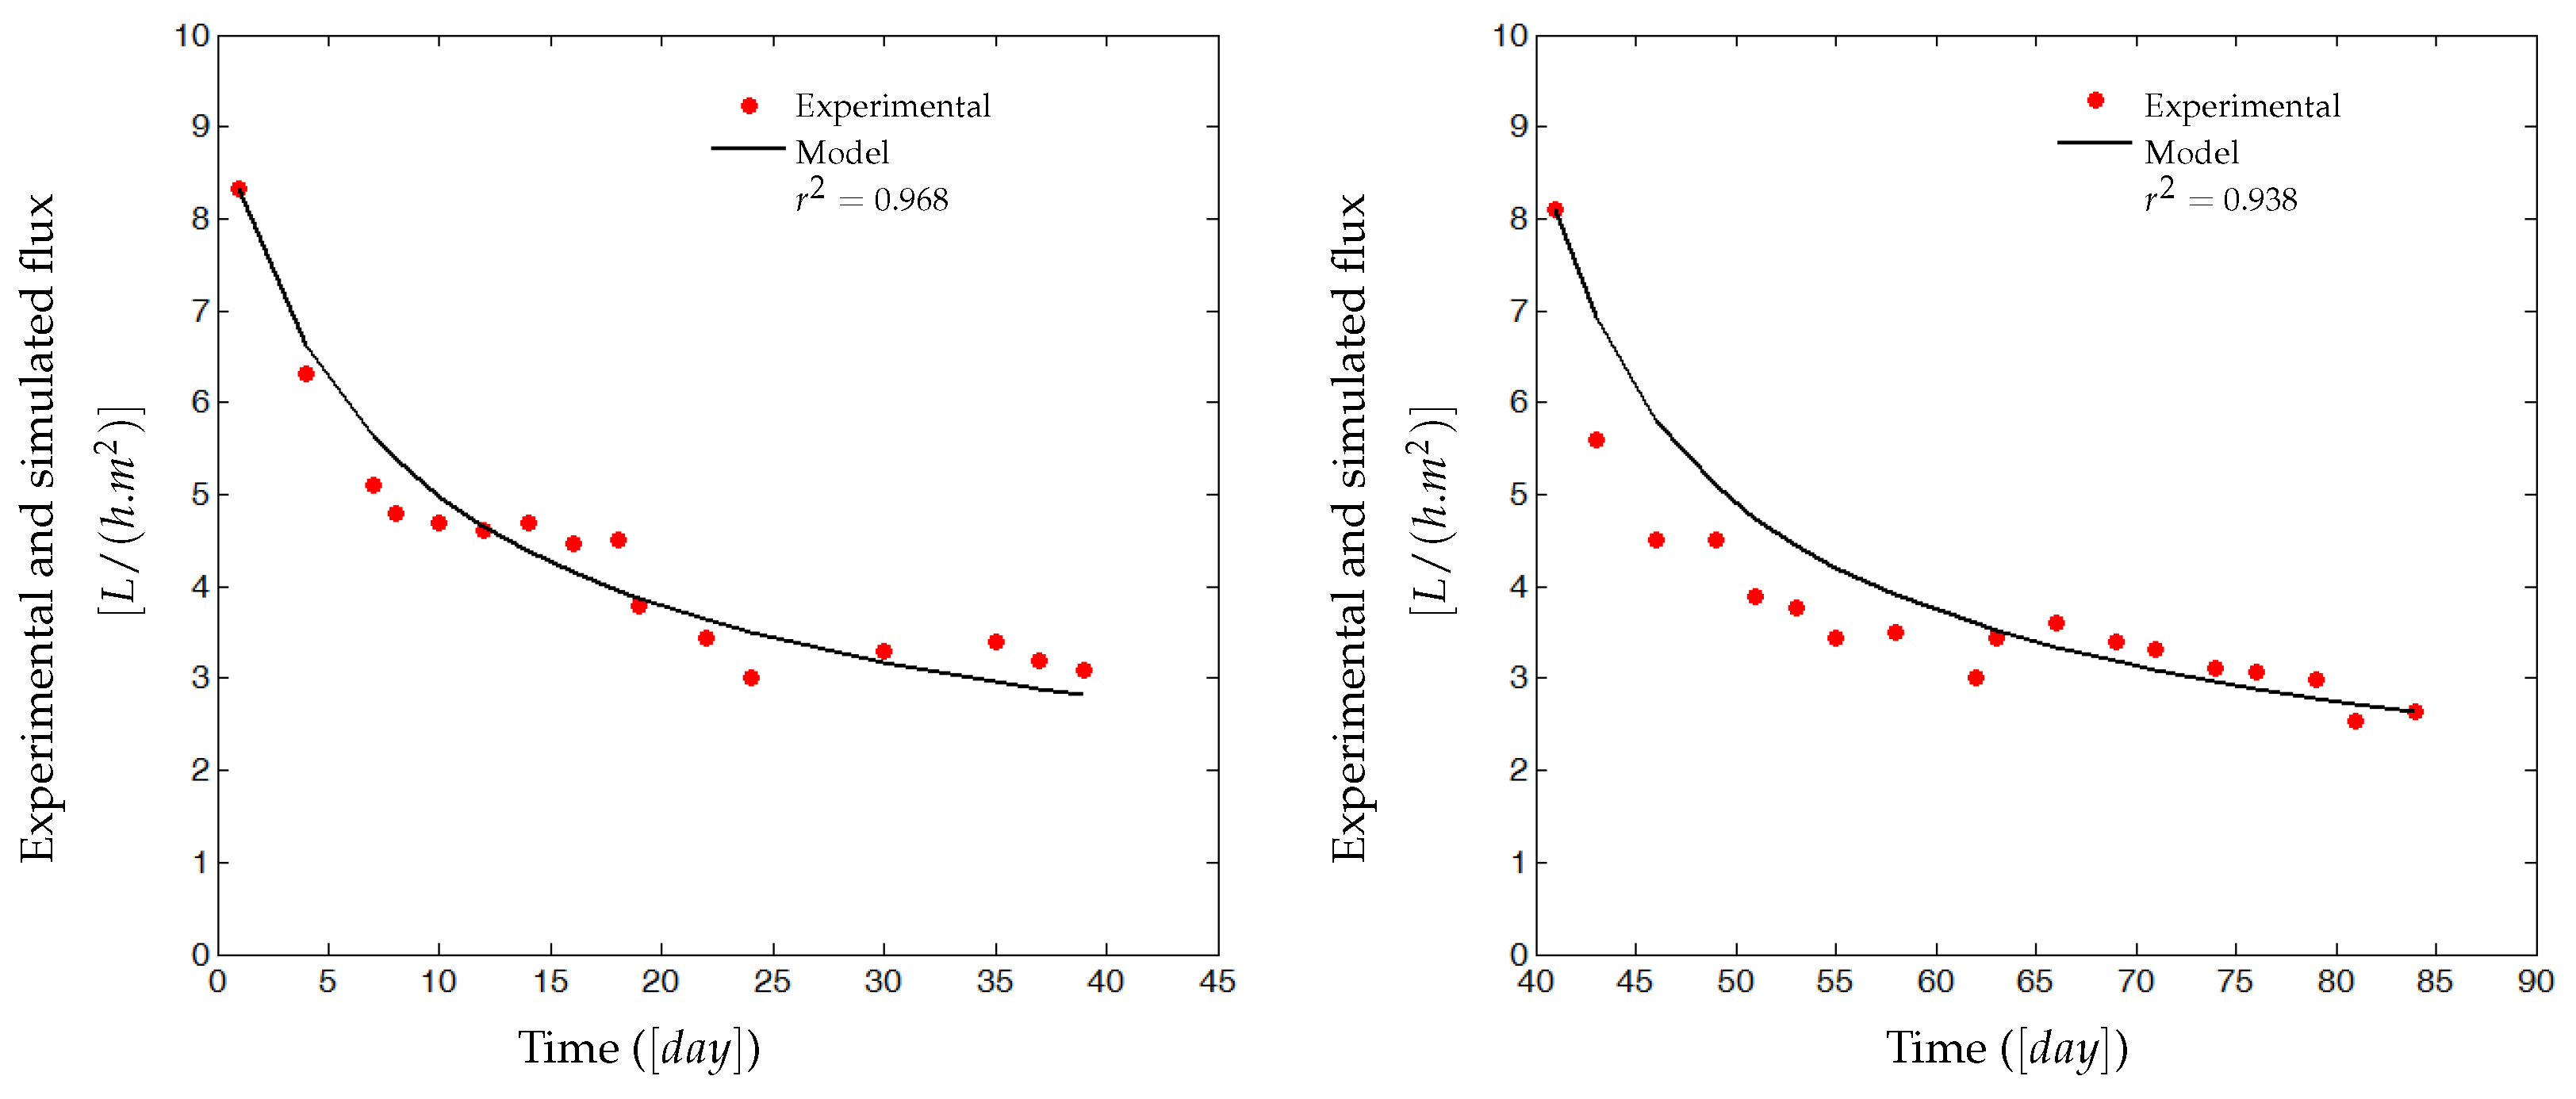
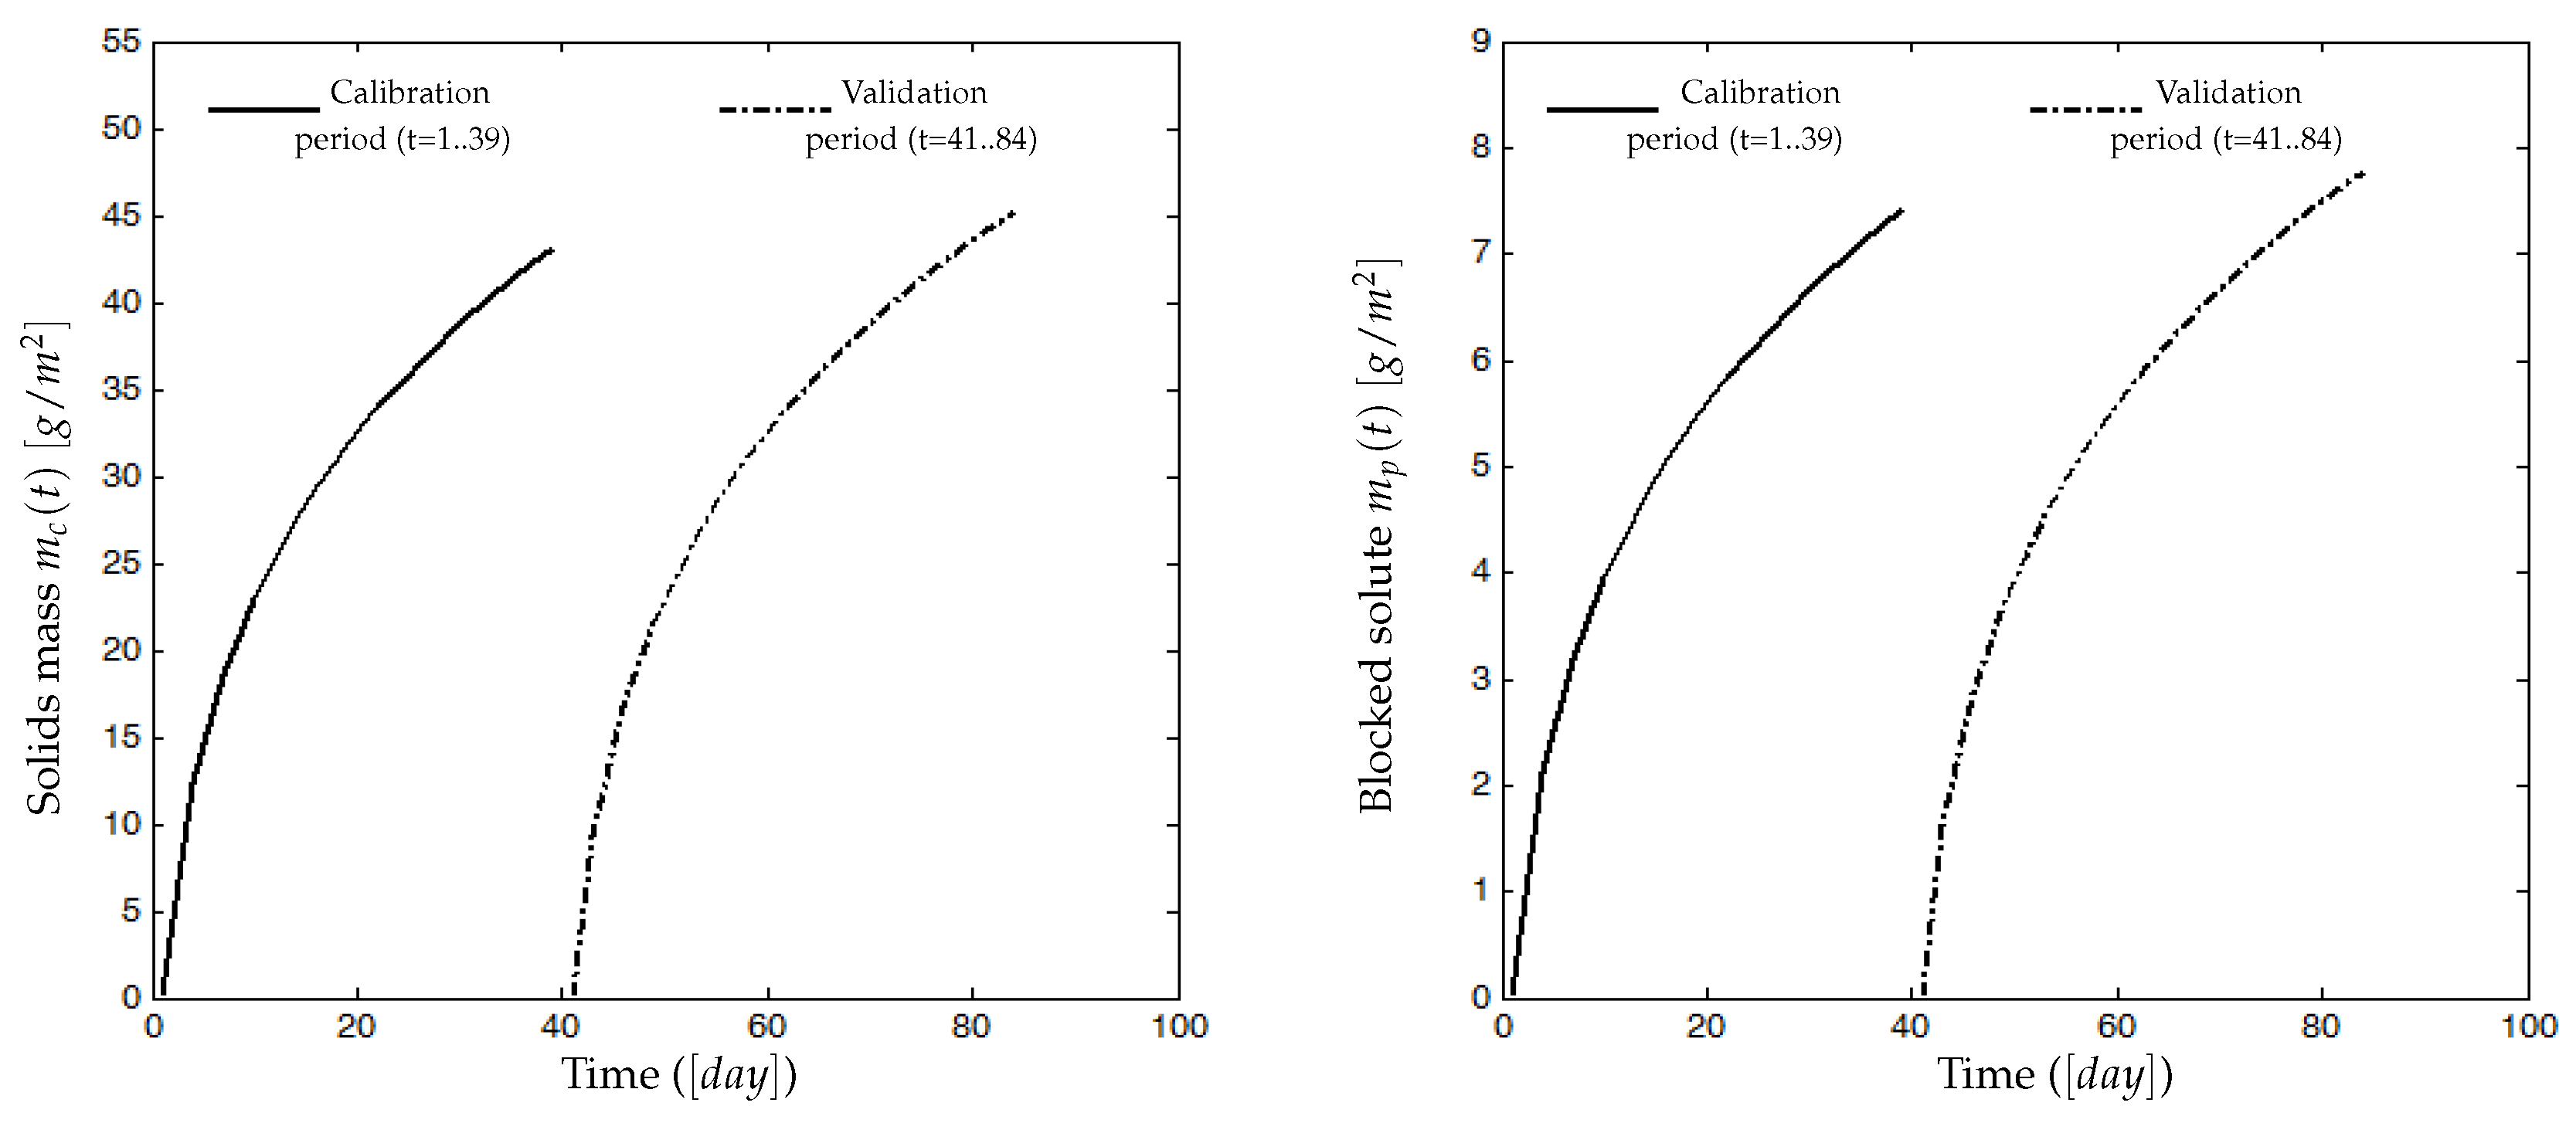
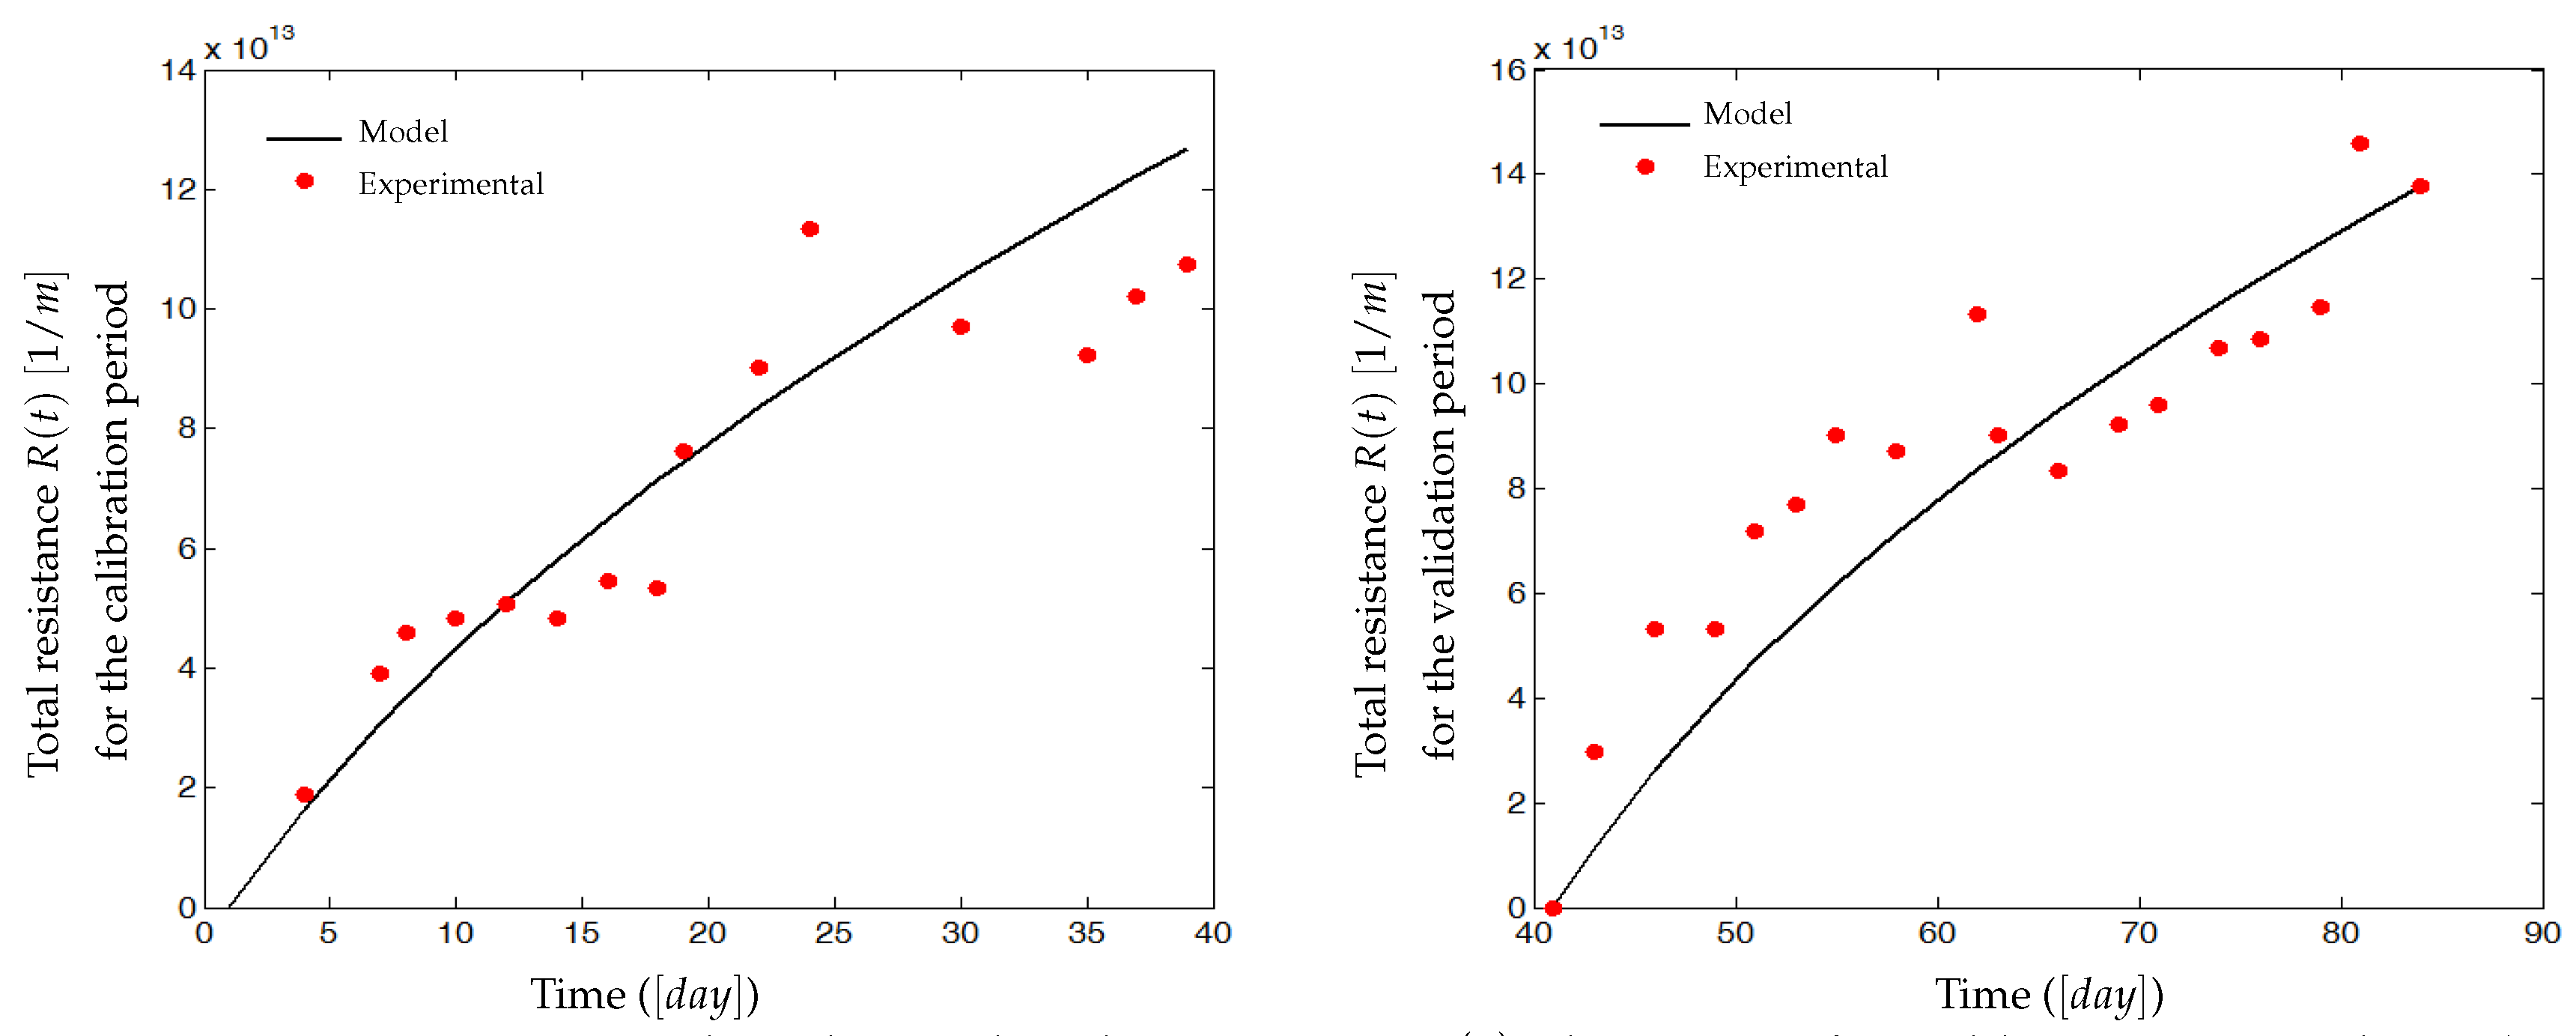
5. Discussions, Open Questions and Perspectives on the Process Control Using the Proposed Model
- What parameters mainly influence membrane fouling? This is basically a modeling question, and,
- How minimizing fouling (filtering conditions)? which can be seen as a control problem as soon as a model describing the fouling dynamics is available.
- Gas sparging: It consists in injecting bubbles (air for aerobic process or biogas for anaerobic systems) for membrane scouring in order to limit attachment and promote detachment of matter by shear forces. This control parameter is however costly because it consumes energy.
- Intermittent filtration: MBR is operated in alternating filtration/relaxation cycles. This functioning mode allows the detachment of matter responsible for the reversible fouling.
- Backwash: It must be used for short time compared with filtration time to detach matter involved in irreversible fouling and it is costly because it also needs energy.
5.1. Influence of Gas Sparging
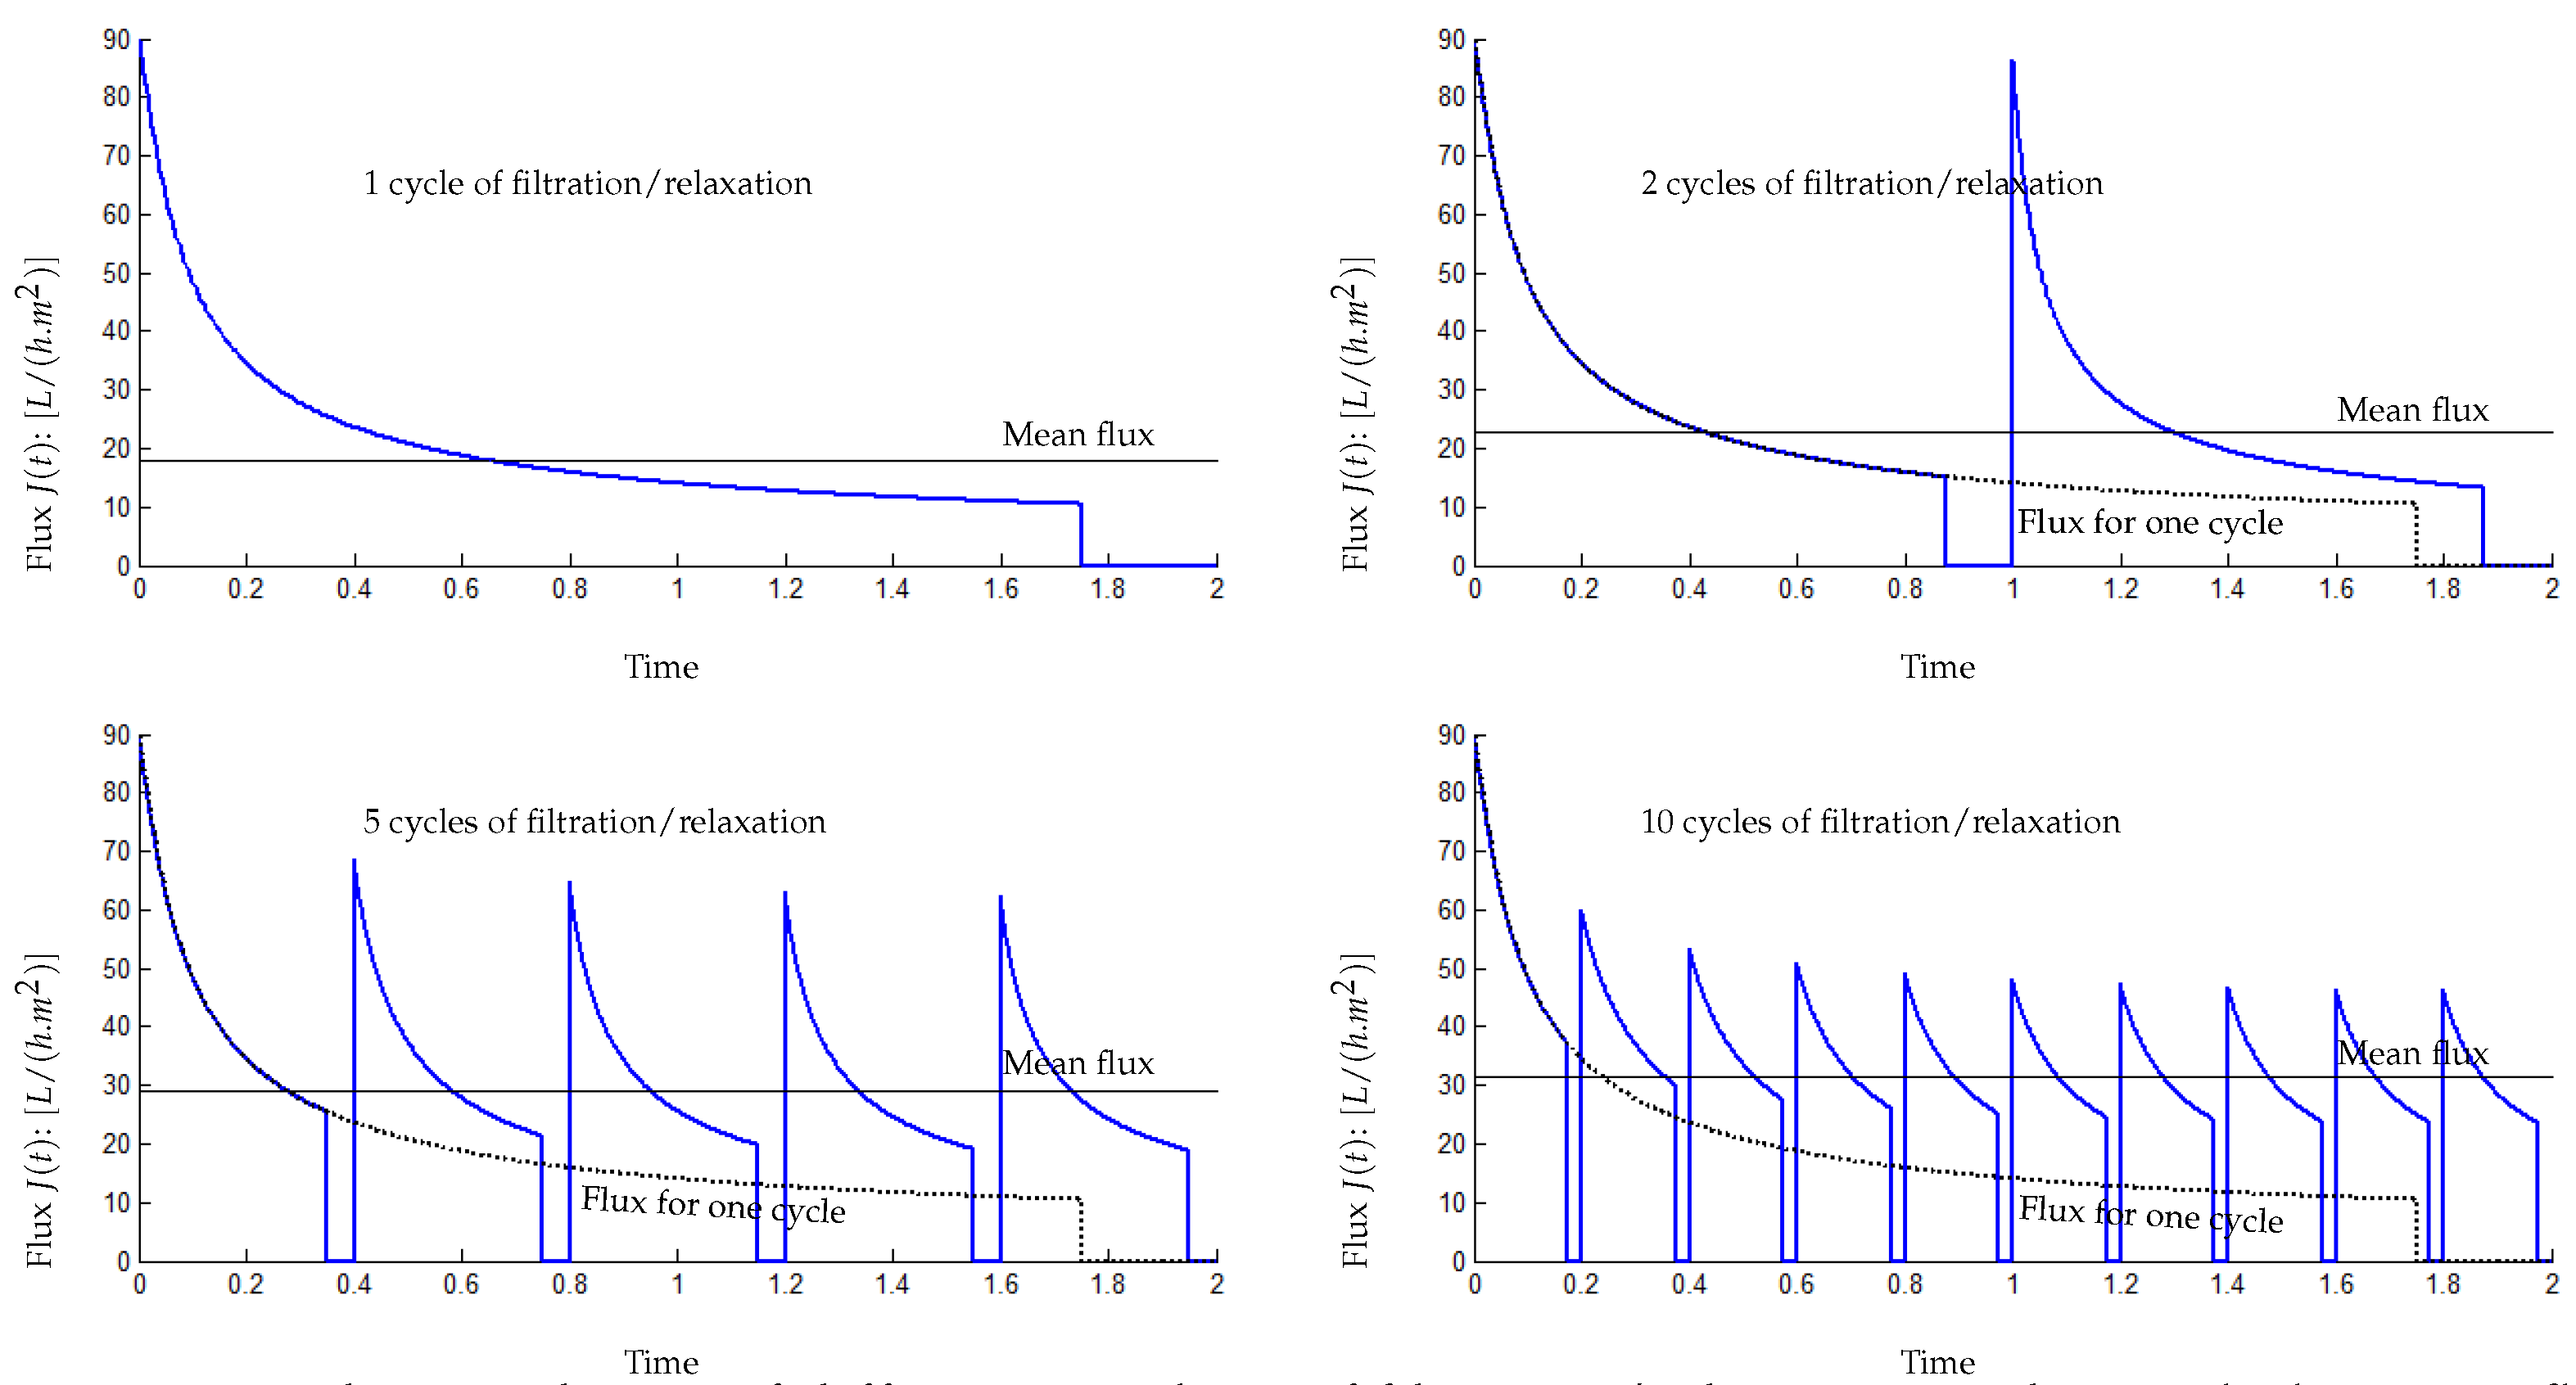
5.2. Influence of the Number of Filtration/Relaxation (Backwash) Cycles per Time Unit
- for 1 cycle of filtration/relaxation: , and ,
- for 2 cycles of filtration/relaxation: , and ,
- for 5 cycles of filtration/relaxation: , and ,
- for 10 cycles of filtration/relaxation: , and .
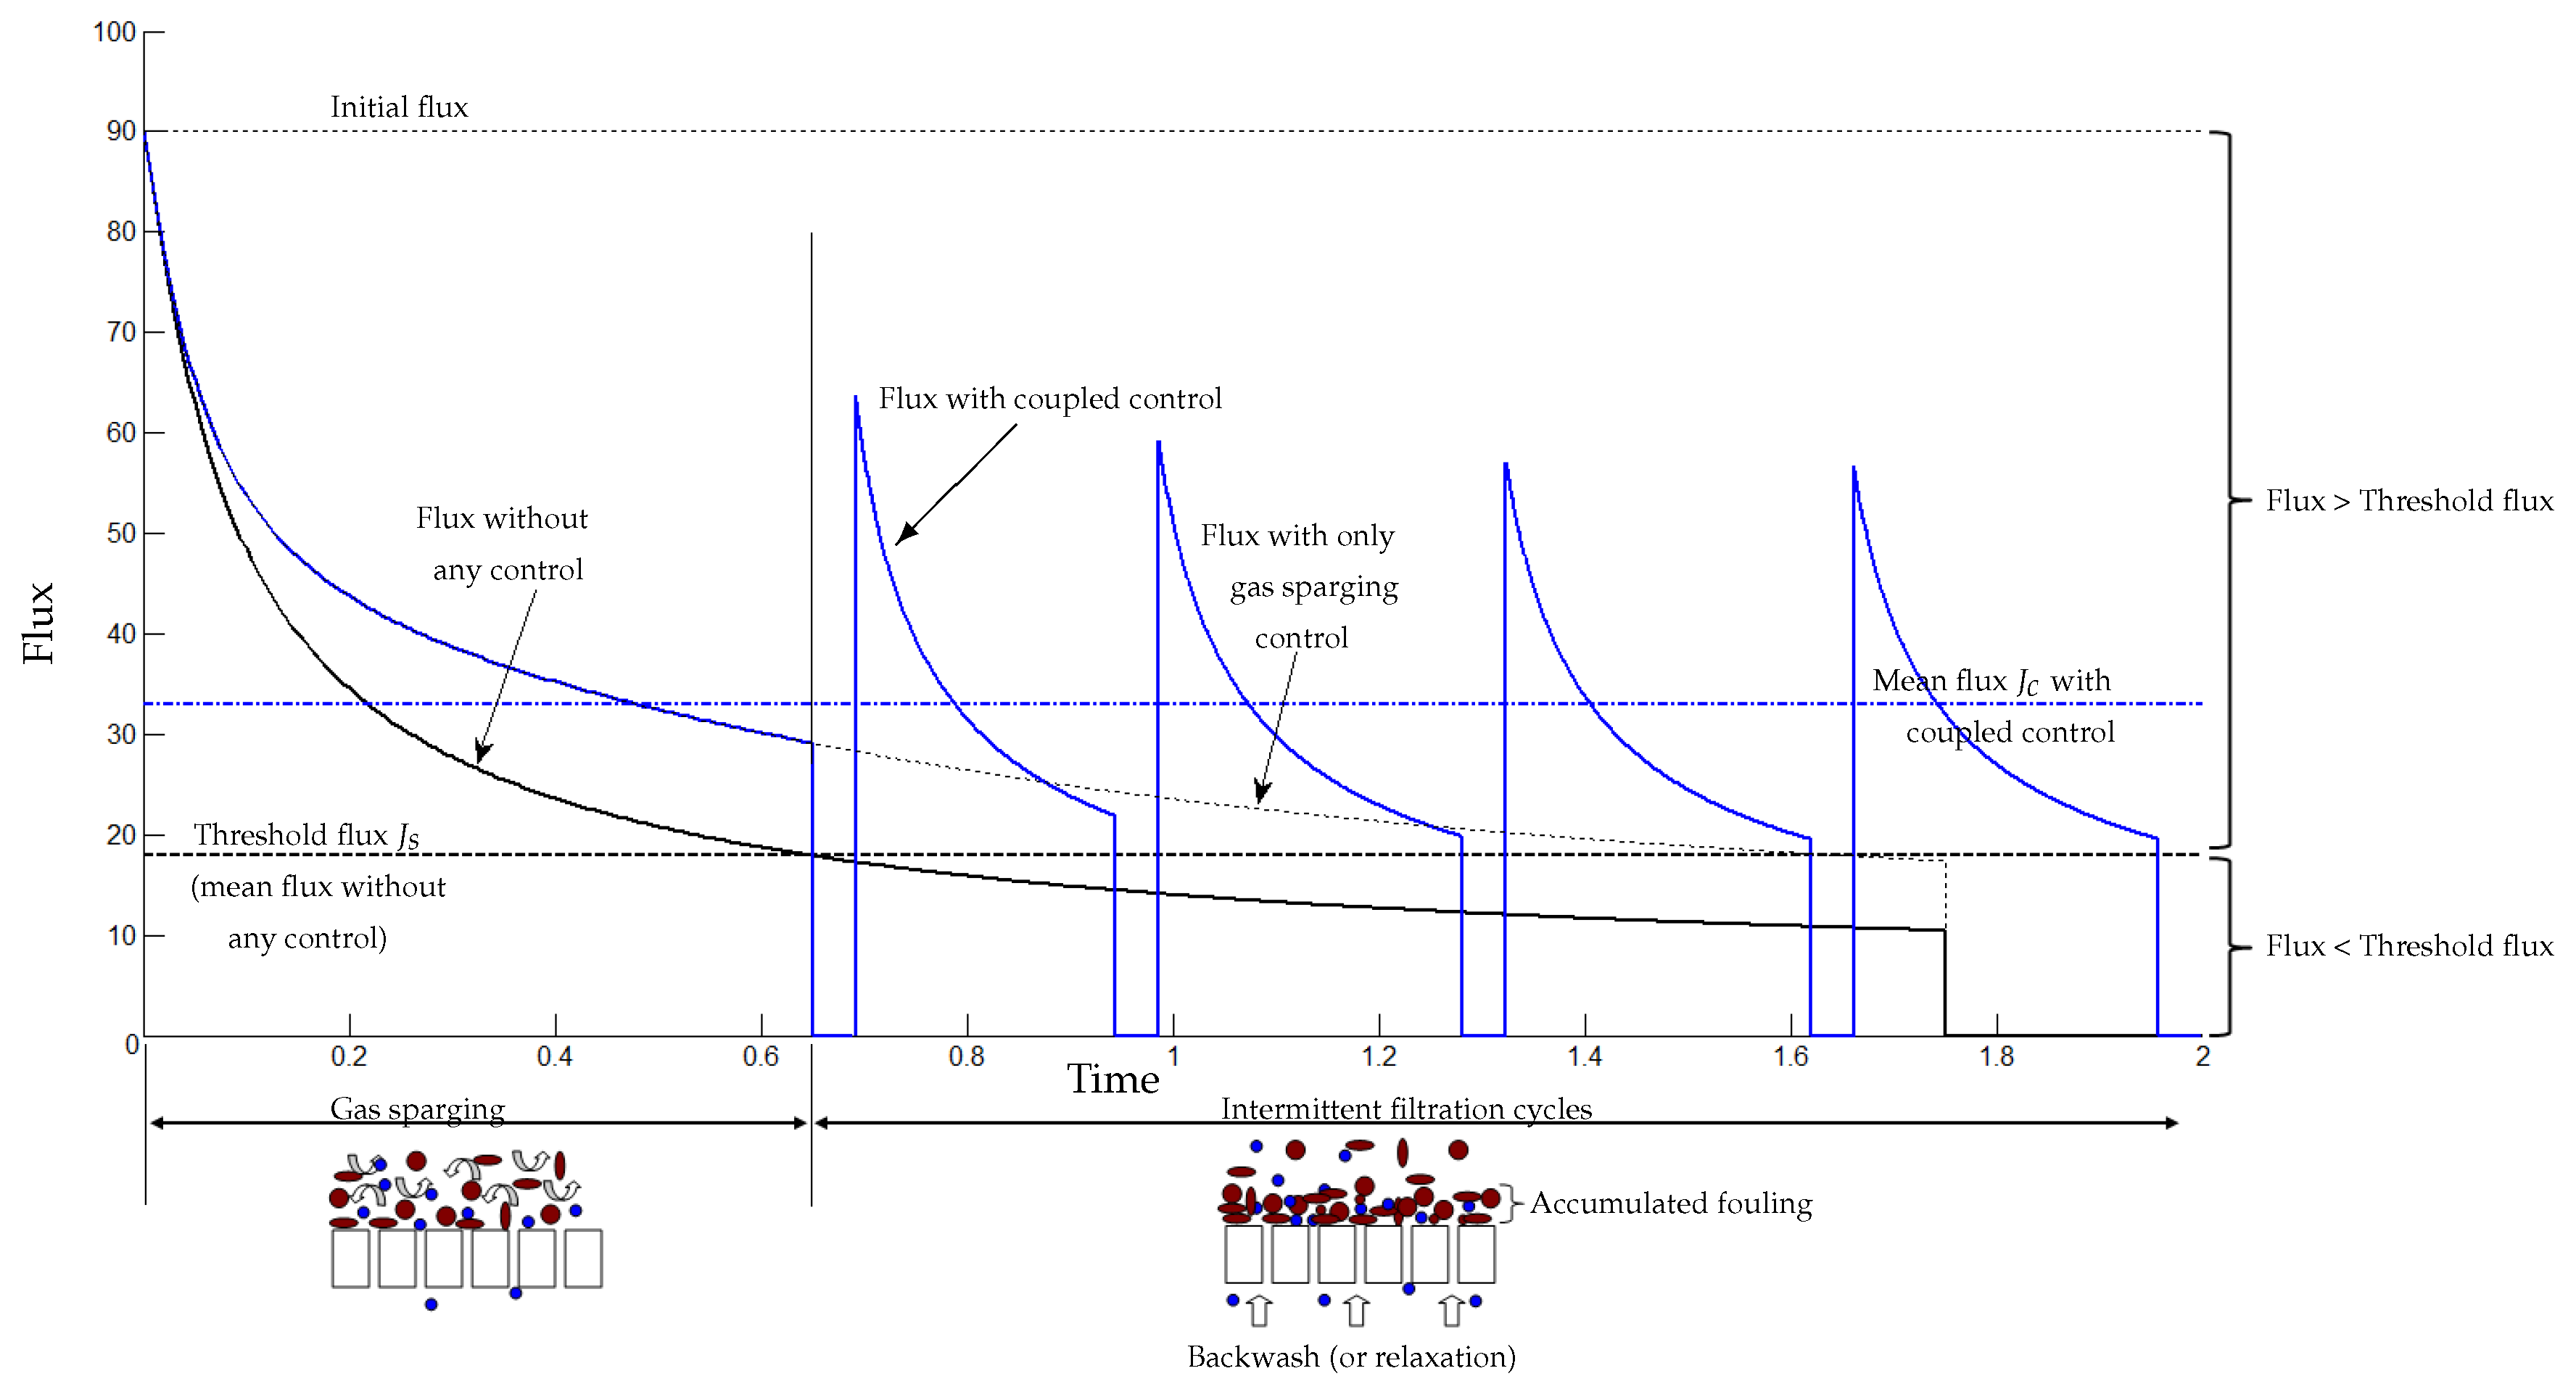
5.3. Coupling Sparging Gas and Intermittent Filtration Controls
- Gas sparging is used to detach the matter deposited on the membrane: this phenomenon occurs at the beginning of the filtration (fouling is soft and not yet dense). Here, one should control the gas sparging intensity, which may depend on different parameters as the mixed liquor characteristics, the concentration of soluble and particulate matters, ...
- Intermittent relaxation is used to detach a denser fouling (strong), which can occur after an enough long functioning time. These control parameters (typically the number and frequency of filtration/relaxation (backwash) cycles) may depend on the fouling characteristics as its irreversibility, its thickness...
6. Conclusion
Author Contributions
Funding
Institutional Review Board Statement
Informed Consent Statement
Data Availability Statement
Acknowledgments
Conflicts of Interest
Appendix A. Parameters Values Used in Simulations
| Parameter | Meaning | Value | Unit | Reference |
|---|---|---|---|---|
| specific resistance of the sludge | 5e14 | |||
| specific resistance of the sludge | 1e13 | |||
| SMP fraction leaving the bioreactor | 0.6 | − | [12] | |
| SMP fraction blocked into the pores | to be estimated | − | ||
| and blocked into the pores | smaller than () | − | [12] | |
| parameter to normalize units | 10 | |||
| parameter to normalize units | 10 | |||
| the permeate viscosity | 0.001 | |||
| detachment rate of during relaxation phase | 25 | − | ||
| detachment rate of during relaxation phase | 25 | − | ||
| transmembrane pressure | 1.5 | [33] | ||
| initial membrane surface | 1 | [33] | ||
| yield degradation of by | 40 | − | [12] | |
| yield production of from | 0.6 | − | [12] | |
| yield production of from | 3 | − | [12] | |
| yield production of from | 1.3 | − | [12] | |
| fraction of attached onto the membrane | to be estimated | |||
| fraction of attached onto the membrane | to be estimated | |||
| fraction of attached onto the membrane | to be estimated | |||
| fraction of and reinjected into the bulk during cleaning operation | 0.001 | |||
| fraction of and reinjected into the bulk during cleaning operation | 0.01 | |||
| fraction of reinjected into the bulk during cleaning operation | 0.001 | |||
| yield degradation of by | 25 | − | [11] | |
| yield production of from | 15 | − | [11] | |
| yield degradation of by | 16.08 | − | [11] | |
| decay rate of the biomass | 0.2 | |||
| decay rate of the biomass | 0.18 | |||
| half-saturation constant associated with | 10 | |||
| half-saturation constant associated with | 5 | |||
| inhibition constant associated with | 15 | |||
| K | half-saturation constant associated with | 3 | [12] | |
| maximum acidogenic biomass growth rate on | 1.2 | [11] | ||
| maximum methanogenic biomass growth rate on | 1.5 | [11] | ||
| maximum acidogenic biomass growth rate on | 0.14 | [12] | ||
| the input flow of the bioreactor | varying | |||
| the output flow of the bioreactor | varying | |||
| the withdraw flow from the bioreactor | 1.5 | |||
| intrinsic membrane resistance | 1.11e13 (estimated from ) | |||
| the input concentration of | 90 | |||
| the input concentration of | 20 | |||
| V | the volume of the bioreactor | 50 | [33] |
References
- Amin, M.; Taheri, E.; Fatehizadeh, A.; Rezakazemi, M.; Aminabhavi, T. Anaerobic membrane bioreactor for the production of bioH2: Electron flow, fouling modeling and kinetic study. Chemical Engineering Journal 2021, 426, 130–716. [Google Scholar] [CrossRef]
- A., O.; R., K.G.; T., K.; S., M.; D., N. Development of a dynamic model for effective mitigation of membrane fouling through biogas sparging in submerged anaerobic membrane bioreactors (SAnMBRs). Journal of Environmental Management 2022, 323, 116–151.
- Henze, M. Activated sludge models ASM1, ASM2, ASM2d and ASM3; Vol. 9, IWA publishing, 2000. [Google Scholar]
- Batstone, D.J.; Keller, J.; Angelidaki, I.; Kalyuzhnyi, S.; Pavlostathis, S.; Rozzi, A.; Sanders, W.; Siegrist, H.a.; Vavilin, V. The IWA anaerobic digestion model no 1 (ADM1). Water Science and technology 2002, 45, 65–73. [Google Scholar] [CrossRef]
- Spagni, A.; Ferraris, M.; Casu, S. Modelling wastewater treatment in a submerged anaerobic membrane bioreactor. Journal of Environmental Science and Health, Part A 2015, 50, 325–331. [Google Scholar] [CrossRef]
- Le-Clech, P.; Chen, V.; Fane, T.A. Fouling in membrane bioreactors used in wastewater treatment. Journal of membrane science 2006, 284, 17–53. [Google Scholar] [CrossRef]
- Ng, A.N.; Kim, A.S. A mini-review of modeling studies on membrane bioreactor (MBR) treatment for municipal wastewaters. Desalination 2007, 212, 261–281. [Google Scholar] [CrossRef]
- Meng, F.; Chae, S.R.; Drews, A.; Kraume, M.; Shin, H.S.; Yang, F. Recent advances in membrane bioreactors (MBRs): membrane fouling and membrane material. Water research 2009, 43, 1489–1512. [Google Scholar] [CrossRef] [PubMed]
- Teng, J.; Shen, L.; Xu, Y.; Chen, Y.; Wu, X.L.; He, Y.; Chen, J.; Lin, H. Effects of molecular weight distribution of soluble microbial products (SMPs) on membrane fouling in a membrane bioreactor (MBR): Novel mechanistic insights. Chemosphere 2020, 248, 126–013. [Google Scholar] [CrossRef]
- Mannina, G.; Ni, B.J.; Makinia, J.; Harmand, J.; Alliet, M.; Brepols, C.; Ruano, M.; Robles, A.; Heran, M.; Gulhan, H.; others.. Biological processes modelling for MBR systems: A review of the state-of-the-art focusing on SMP and EPS. Water research 2023, 120–275.
- Bernard, O.; Hadj-Sadok, Z.; Dochain, D.; Genovesi, A.; Steyer, J.P. Dynamical model development and parameter identification for an anaerobic wastewater treatment process. Biotechnology and bioengineering 2001, 75, 424–438. [Google Scholar] [CrossRef]
- Benyahia, B.; Sari, T.; Cherki, B.; Harmand, J. Anaerobic membrane bioreactor modeling in the presence of Soluble Microbial Products (SMP)–the Anaerobic Model AM2b. Chemical Engineering Journal 2013, 228, 1011–1022. [Google Scholar] [CrossRef]
- Lee, Y.; Cho, J.; Seo, Y.; Lee, J.; Ahn, K. Modeling of submerged membrane bioreactor process for wastewater treatment. Desalination 2002, 146, 451–457. [Google Scholar] [CrossRef]
- Li, X.; Wang, X. Modelling of membrane fouling in a submerged membrane bioreactor. Journal of Membrane Science 2006, 278, 151–161. [Google Scholar] [CrossRef]
- Meng, F.; Zhang, H.; Li, Y.; Zhang, X.; Yang, F. Application of fractal permeation model to investigate membrane fouling in membrane bioreactor. Journal of Membrane Science 2005, 262, 107–116. [Google Scholar] [CrossRef]
- Saroj, D.; Guglielmi, G.; Chiarani, D.; Andreottola, G. Subcritical fouling behaviour modelling of membrane bioreactors for municipal wastewater treatment: The prediction of the time to reach critical operating condition. Desalination 2008, 231, 175–181. [Google Scholar] [CrossRef]
- Ognier, S.; Wisniewski, C.; Grasmick, A. Membrane bioreactor fouling in sub-critical filtration conditions: a local critical flux concept. Journal of membrane Science 2004, 229, 171–177. [Google Scholar] [CrossRef]
- Hermia, J. Constant pressure blocking filtration laws-application to power law non-Newtonian fluids. Trans IChemE 1982, 60, 183–187. [Google Scholar]
- Charfi, A.; Ben Amar, N.; Harmand, J. Analysis of fouling mechanisms in anaerobic membrane bioreactors. Water Research 2012, 46(8), 2637–50. [Google Scholar] [CrossRef] [PubMed]
- Ho, J.; Sung, S. Effects of solid concentrations and cross-flow hydrodynamics on microfiltration of anaerobic sludge. Journal of Membrane Science 2009, 345, 142–147. [Google Scholar] [CrossRef]
- Charfi, A.; Harmand, J.; Ben Amar, N.; Grasmick, A.; Heran, M. Deposit membrane fouling: influence of specific cake layer resistance and tangential shear stresses. Water Science and Technology 2014, 70(1), 40–46. [Google Scholar] [CrossRef]
- Charfi, A.; Harmand, J.; Yang, Y.; Ben Amar, N.; Heran, M.; Grasmick, A. Soluble microbial products and suspended solids influence in membrane fouling dynamics and interest of punctual relaxation and/or backwashing. Journal of Membrane Science 2015, 475, 156–166. [Google Scholar] [CrossRef]
- Charfi, A.; Park, E.; Aslam, M.; Kim, J. Particle-sparged anaerobic membrane bioreactor with fluidized polyethylene terephthalate beads for domestic wastewater treatment: Modelling approach and fouling control. Bioresource technology 2018, 258, 263–269. [Google Scholar] [CrossRef] [PubMed]
- Zarragoitia-González, A.; Schetrite, S.; Alliet, M.; Jáuregui-Haza, U.; Albasi, C. Modelling of submerged membrane bioreactor: Conceptual study about link between activated slugde biokinetics, aeration and fouling process. Journal of membrane science 2008, 325, 612–624. [Google Scholar] [CrossRef]
- Di Bella, G.; Mannina, G.; Viviani, G. An integrated model for physical-biological wastewater organic removal in a submerged membrane bioreactor: Model development and parameter estimation. Journal of membrane Science 2008, 322, 1–12. [Google Scholar] [CrossRef]
- Wintgens, T.; Rosen, J.; Melin, T.; Brepols, C.; Drensla, K.; Engelhardt, N. Modelling of a membrane bioreactor system for municipal wastewater treatment. Journal of Membrane science 2003, 216, 55–65. [Google Scholar] [CrossRef]
- Liang, S.; Song, L.; Tao, G.; Kekre, K.; Seah, H. A modeling study of fouling development in membrane bioreactors for wastewater treatment. Water environment research 2006, 857–863. [Google Scholar] [CrossRef] [PubMed]
- Robles, A.; Ruano, M.; Ribes, J.; Seco, A.; Ferrer, J. A filtration model applied to submerged anaerobic MBRs (SAnMBRs. Journal of membrane science 2013, 444, 139–147. [Google Scholar] [CrossRef]
- Robles, A.; Ruano, M.; Ribes, J.; Seco, A.; Ferrer, J. Mathematical modelling of filtration in submerged anaerobic MBRs (SAnMBRs): Long-term validation. Journal of Membrane Science 2013, 446, 303–309. [Google Scholar] [CrossRef]
- Pimentel, G.; Vande Wouwer, A.; Harmand, J.; Rapaport, A. Design, analysis and validation of a simple dynamic model of a submerged membrane bioreactor. Water research 2015, 70, 97–108. [Google Scholar] [CrossRef]
- Robles, A.; Ruano, M.; Charfi, A.; Lesage, G.; Heran, M.; Harmand, J.; Seco, A.; Steyer, J.P.; Batstone, D.; Kim, J. ; others.. A review on anaerobic membrane bioreactors (AnMBRs) focused on modelling and control aspects. Bioresource technology 2018, 270, 612–626. [Google Scholar] [CrossRef]
- Charfi, A.; Aslam, M.; Lesage, G.; Heran, M.; Kim, J. Macroscopic approach to develop fouling model under GAC fluidization in anaerobic fluidized bed membrane bioreactor. Journal of Industrial and Engineering Chemistry 2017, 49, 219–229. [Google Scholar] [CrossRef]
- Saddoud, A.; Ellouze, M.; Dhouib, A.; Sayadi, S. Anaerobic membrane bioreactor treatment of domestic wastewater in Tunisia. Desalination 2007, 207, 205–215. [Google Scholar] [CrossRef]
- Zayen, A.; Mnif, S.; Aloui, F.; Fki, F.; Loukil, S.; Bouaziz, M.; Sayadi, S. Anaerobic membrane bioreactor for the treatment of leachates from Jebel Chakir discharge in Tunisia. Journal of hazardous materials 2010, 177, 918–923. [Google Scholar] [CrossRef] [PubMed]
- Barker, D.; Stuckey, D. A review of soluble microbial products (SMP) in wastewater treatment systems. Water Ressources 1999, 33, 3063–3082. [Google Scholar] [CrossRef]
- Barker, D.; Stuckey, D. Modeling of soluble microbial products in anaerobic digestion: The effect of feed strength and composition. Water environment research 2001, 73, 173–184. [Google Scholar] [CrossRef] [PubMed]
- Aquino, S.; Stuckey, D. Soluble microbial products formation in anaerobic chemostats in the presence of toxic compounds. Water research 2004, 38, 255–266. [Google Scholar] [CrossRef] [PubMed]
- Mannina, G.; Cosenza, A. The fouling phenomenon in membrane bioreactors: assessment of different strategies for energy saving. Journal of Membrane Science 2013, 444, 332–344. [Google Scholar] [CrossRef]
- Jeison, D.; van Lier, J. Cake formation and consolidation: main factors governing the applicable flux in anaerobic submerged membrane bioreactors (AnSMBR) treating acidified wastewaters. Separation and Purification Technology 2007, 56, 71–78. [Google Scholar] [CrossRef]
- Skouteris, G.; Hermosilla, D.; López, P.; Negro, C.; Blanco, Á. Anaerobic membrane bioreactors for wastewater treatment: a review. Chemical Engineering Journal 2012, 198, 138–148. [Google Scholar] [CrossRef]
- Meng, F.; Yang, F.; Shi, B.; Zhang, H. A comprehensive study on membrane fouling in submerged membrane bioreactors operated under different aeration intensities. Separation and Purification Technology 2008, 59, 91–100. [Google Scholar] [CrossRef]
- Mohammadi, T.; Kohpeyma, A.; Sadrzadeh, M. Mathematical modeling of flux decline in ultrafiltration. Desalination 2005, 184, 367–375. [Google Scholar] [CrossRef]
- Wu, B.; Kitade, T.; Chong, T.; Uemura, T.; Fane, A. Role of initially formed cake layers on limiting membrane fouling in membrane bioreactors. Bioresource technology 2012, 118, 589–593. [Google Scholar] [CrossRef] [PubMed]
- Kalboussi, N.; Harmand, J.; Ben Amar, N.; Ellouze, F. A comparative study of three membrane fouling models: Towards a generic model for optimization purposes. Proceedings of CARI 2016, 2016, 16–26. [Google Scholar]

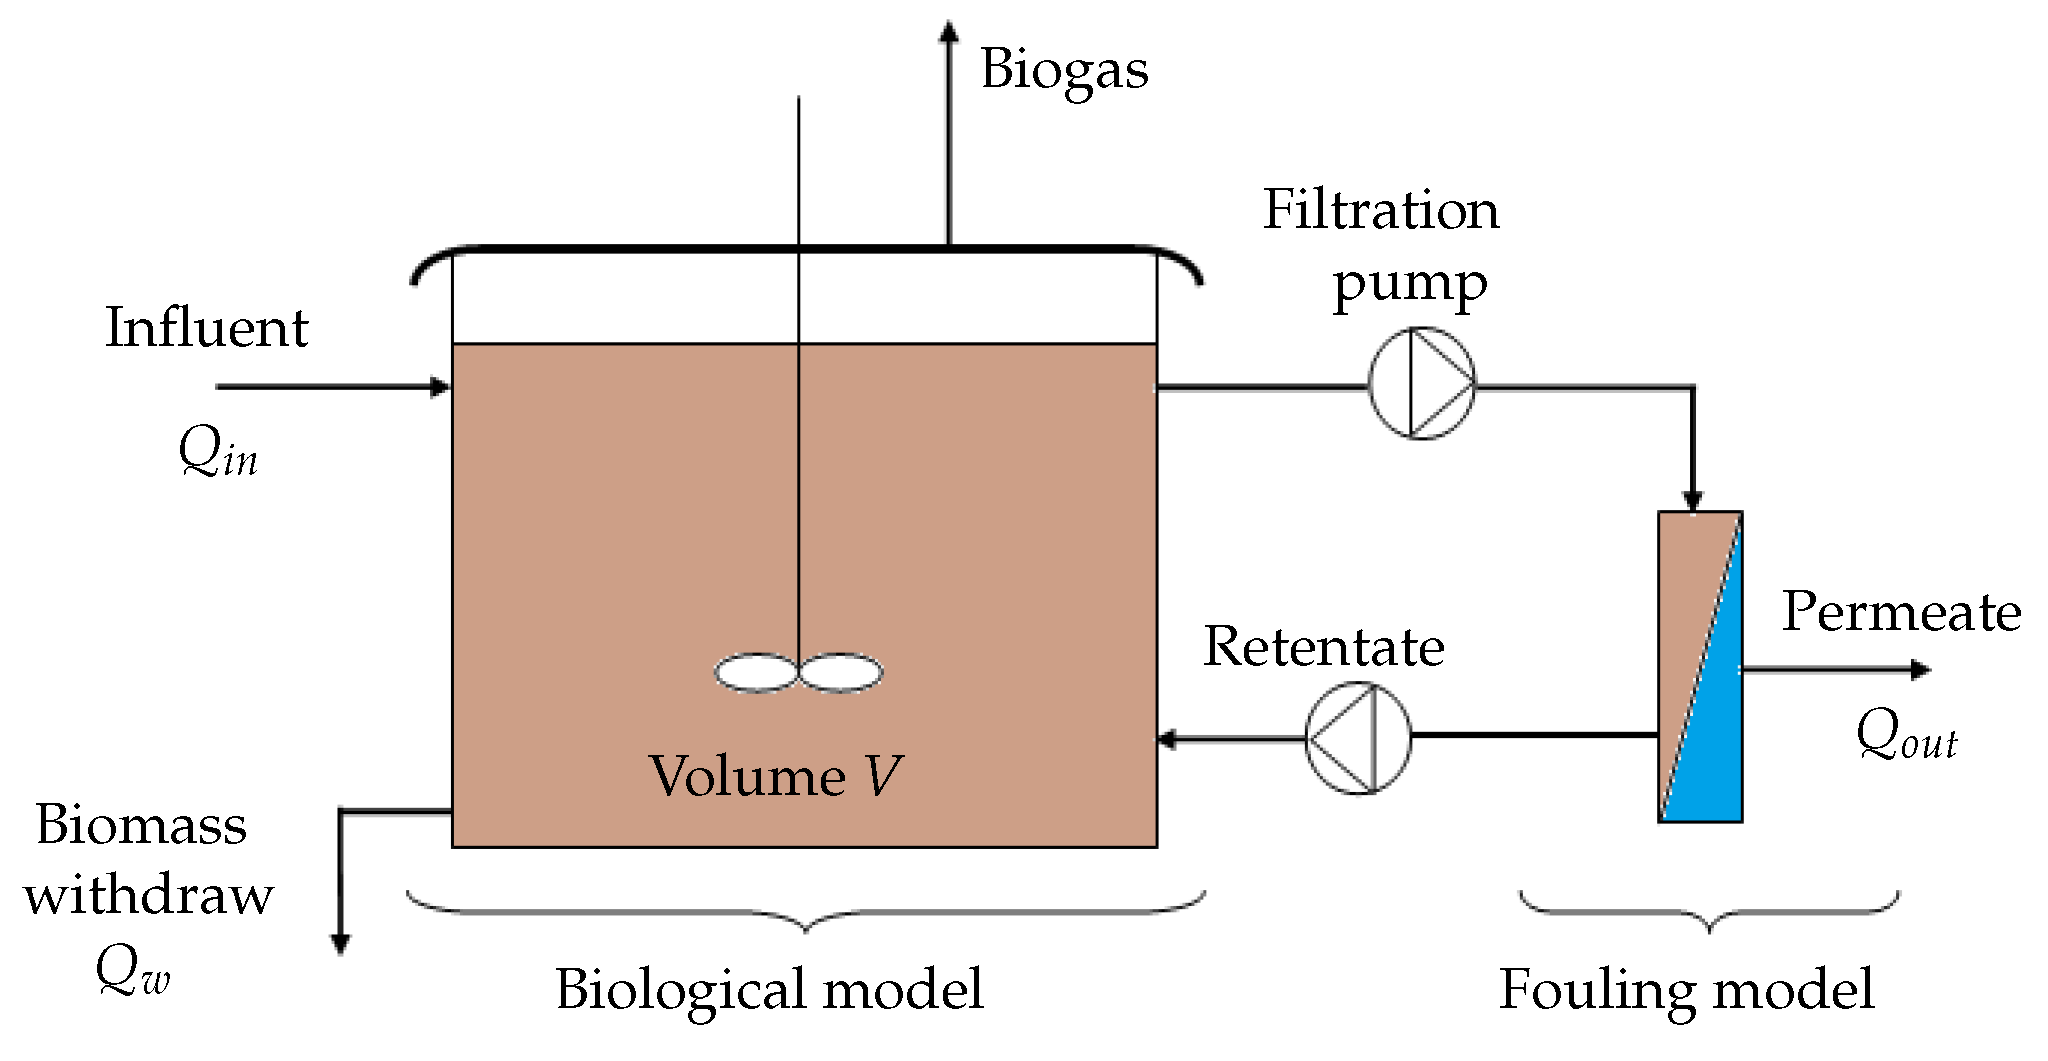
 ) ; 0.4 (
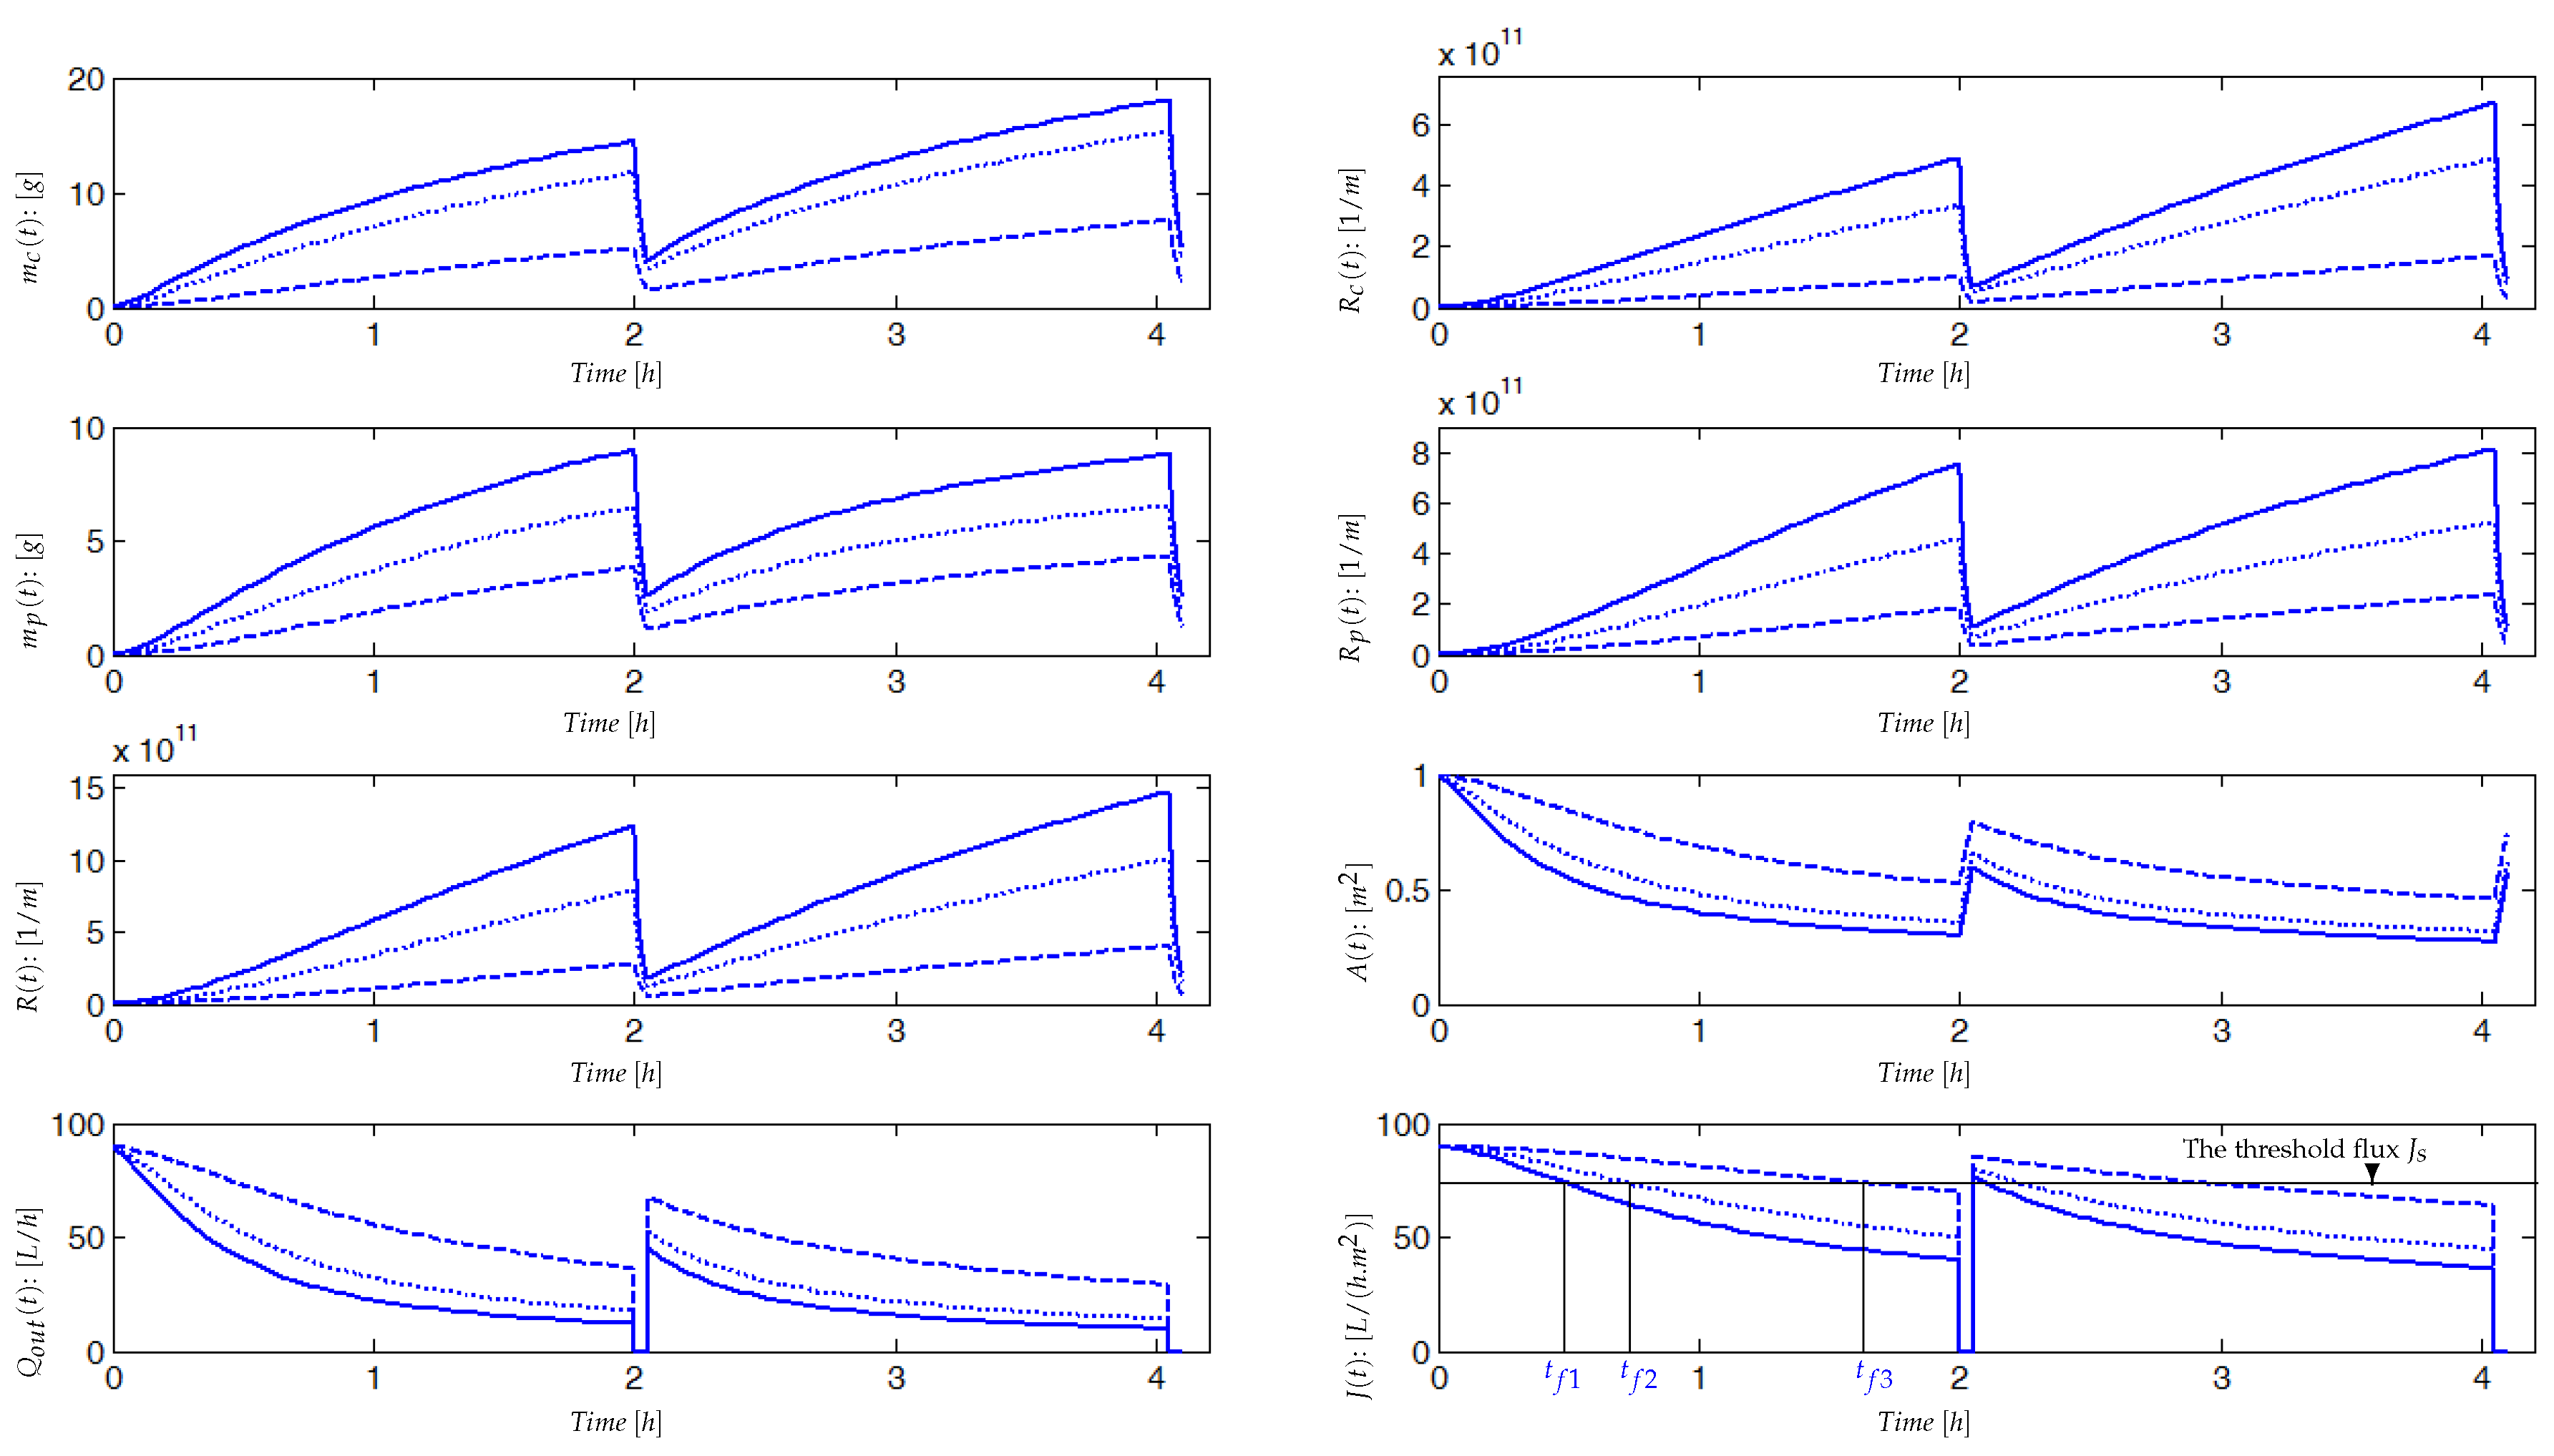
 ) ; 0.7 (
 ).
).
 ) ; 0.4 (
 ) ; 0.7 (
 ).
).
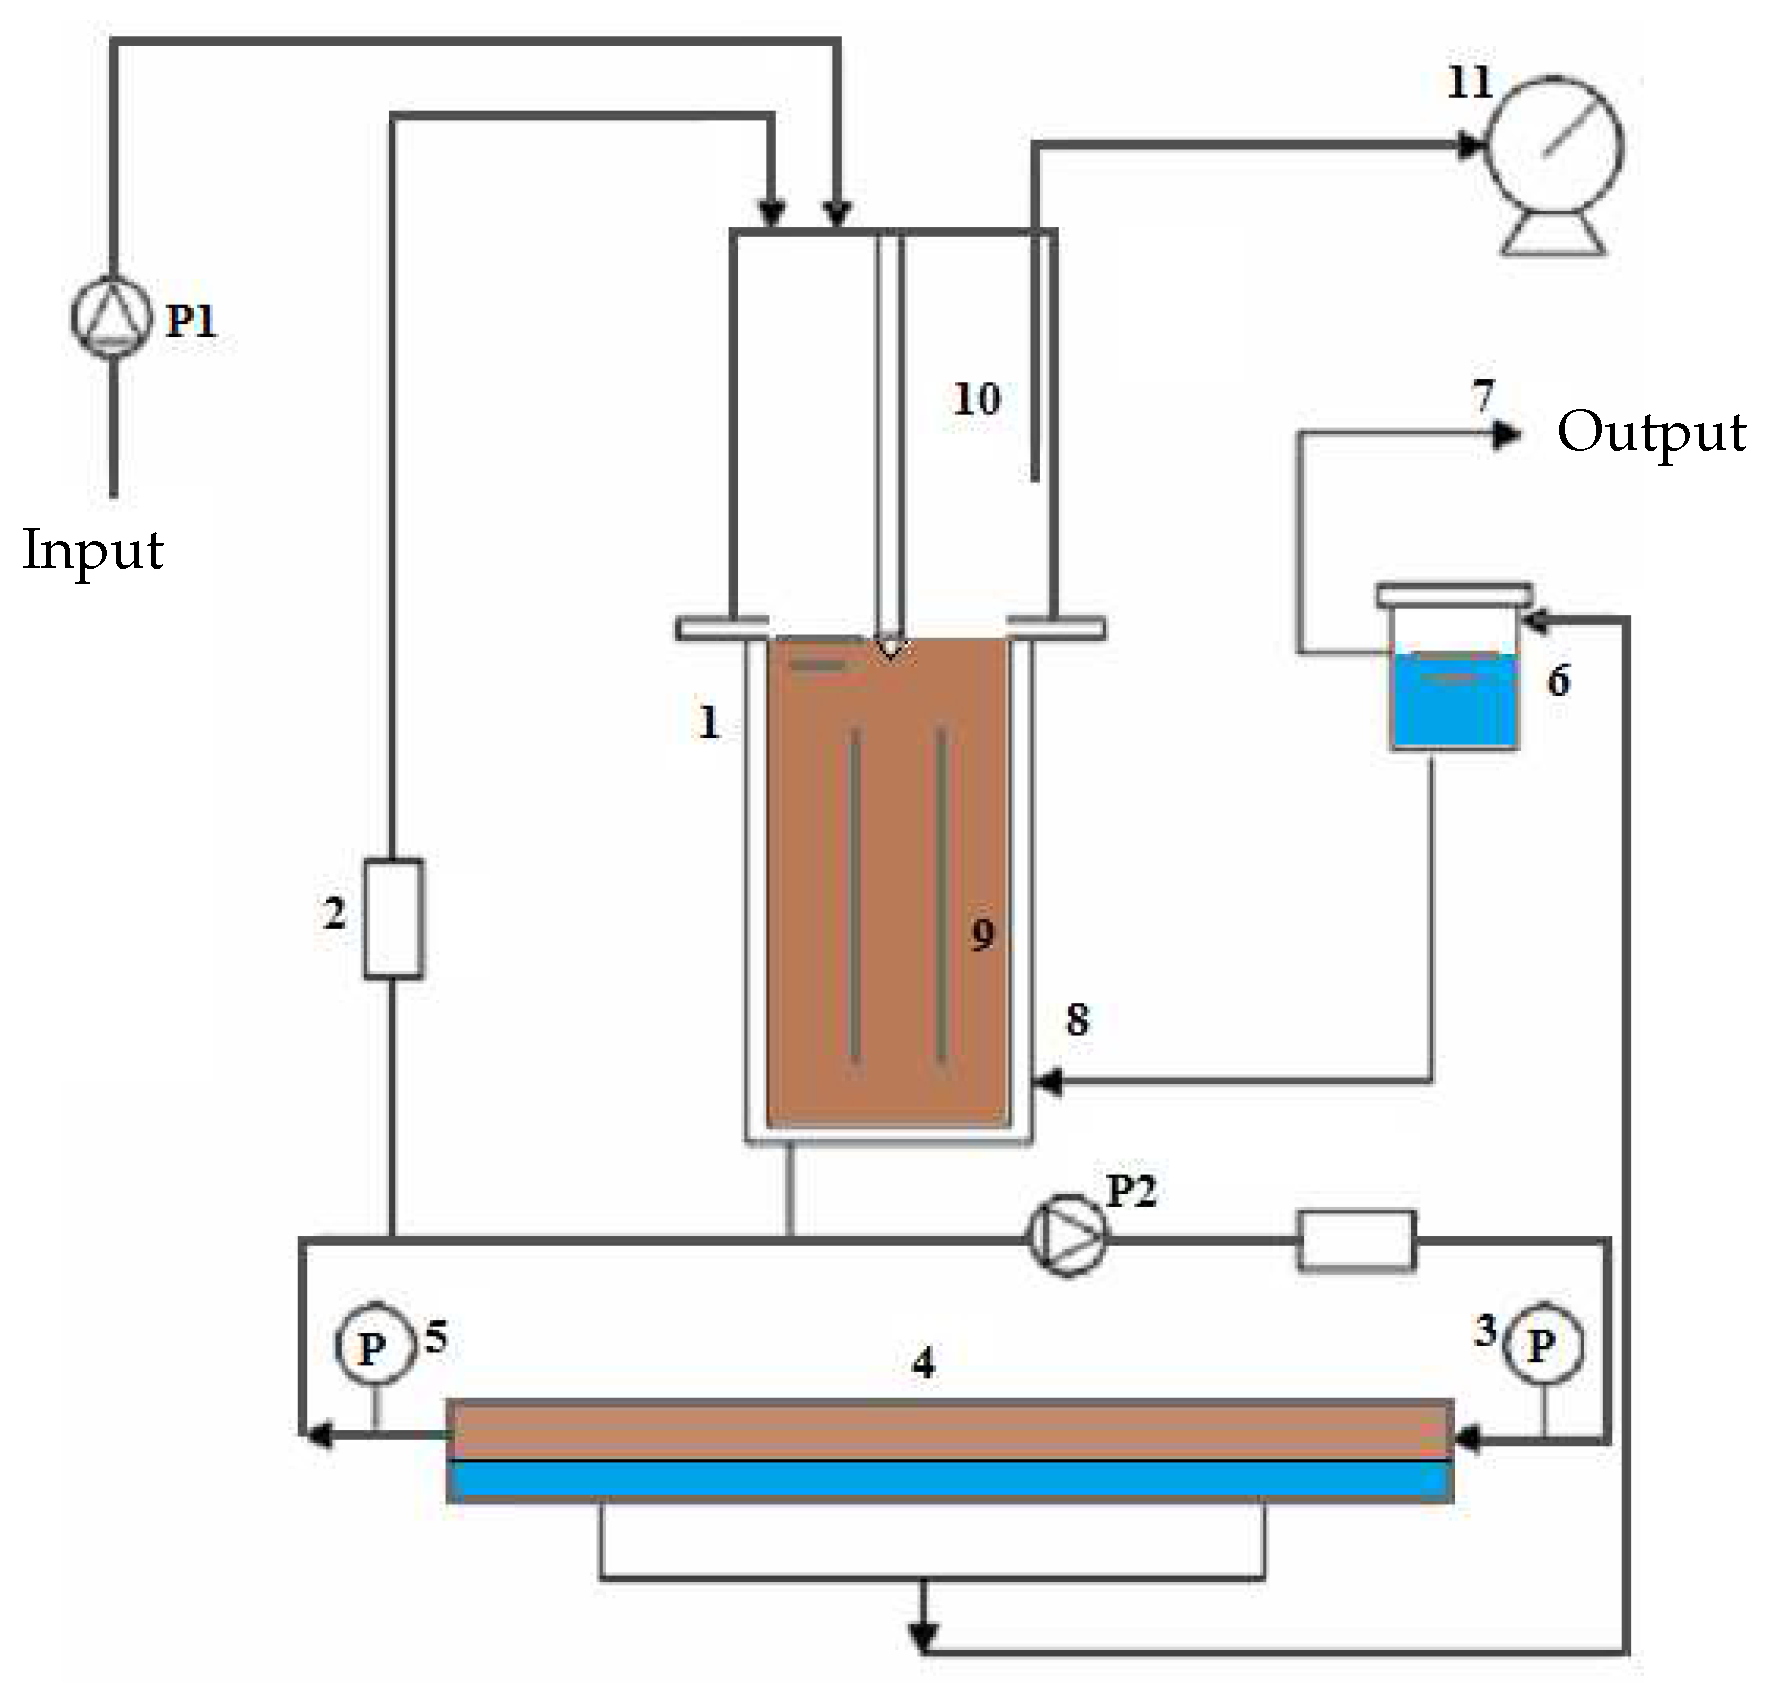

| Parameter | |||
| Value | 0.7 | 10 | 10 |
| Unit | − |
| Parameter | ||||
| Value | 0.1970 | 0.1116 | 0.9720 | 0.3999 |
Disclaimer/Publisher’s Note: The statements, opinions and data contained in all publications are solely those of the individual author(s) and contributor(s) and not of MDPI and/or the editor(s). MDPI and/or the editor(s) disclaim responsibility for any injury to people or property resulting from any ideas, methods, instructions or products referred to in the content. |
© 2024 by the authors. Licensee MDPI, Basel, Switzerland. This article is an open access article distributed under the terms and conditions of the Creative Commons Attribution (CC BY) license (http://creativecommons.org/licenses/by/4.0/).


