1. Introduction
Weaning, a common and obligatory husbandry practice, is recognized to be one of the most critical phases in the modern swine industry [
1]. Recently, piglets are weaned at 19–25 days to increase sow reproductive efficiency, thus improving annual productivity [
2]. However, this early weaning, linked with immature digestive and immune organs [
3], injury of the gastrointestinal barrier, and a decline in metabolism [
4], poses substantial physiological, environmental, and social stressors for piglets, including abrupt separation from their mothers, exposure to unfamiliar piglets, establishment of a new social hierarchy, different housing conditions, and changes in feed sources [
2,
5]. Piglets, during this phase, are exposed to the risk of severe diarrhea, digestion, intestinal absorption, growth retardation, and even death, which usually cause enormous economic losses to the swine industry [
6,
7].
Hence, in diets for weaned piglets, a variety of antibiotics and chemical growth promoters, including zinc oxide (ZnO) and copper oxide (CuO), have been explored to improve piglets’ health [
8]. Yet, the indiscriminate use of antibiotics has increased bacteria resistant to their effects, representing a significant threat to the health of animals and humans [
9]. Likewise, zinc and copper oxide at pharmacological doses [
10] are phased out by the European Commission as a veterinary instrument in the entire union; their use is currently regulated in other countries due to their potency as heavy metal contaminants in the environment and the issue of resistance to certain bacteria [
11,
12,
13]. Thus, prohibiting antibiotics, zinc, and copper oxide in piglet diets poses a significant challenge for the swine industry. This situation has spawned researchers' interest in exploring and developing new natural alternatives possessing efficient properties to maintain the gut health of piglets during weaning, thereby further supporting animal performance [
14,
15]. Among these natural alternatives, tannin, a secondary plant metabolite, holds immense potential.
Tannin, an astringent group of polyphenolic compounds [
16] of high molecular weight [
17], mainly existing in a wide variety of plants, are classified into hydrolysable tannins (HTs) and condensed tannins (CTs) based on their chemical structure [
18,
19]. Condensed tannins are polymers of flavin-3-ols, flavin-4-diols, or related flavanol residues linked via carbon-carbon bonds [
20]. Hydrolysable tannins, conversely, are heterogeneous groups of natural polyphenolic compounds, water-soluble, widely found in vegetable feedstuffs, and can be extracted from the wood of trees [
21]. The unique structures and mechanisms of tannins provide beneficial effects of their antimicrobial, antioxidant, and radical scavenging, antidiarrhea, anticancerogenic, and anti-inflammatory activities in weaned pigs [
9,
22]. Recent studies demonstrated that basal diet supplemented with tannins could improve health status and animal performance and positively affect small intestine morphometric traits in monogastric animals [
23,
24,
25].
Remarkably, in weaned piglets, heterogeneous results have been reported on the effects of dietary tannins to enhance growth performance and antioxidant status in the blood, modulate intestinal microbiota, and decrease the incidence of diarrhea during the post-weaning period [
17,
22,
23,
26,
27,
28,
29,
30,
31,
32,
33]. According to Huang, et al. [
34], the chemical characteristics of tannins could be related to these inconsistent results, which can compromise the palatability, digestibility, and protein use of feed. Thus, rendering the results obtained to date heterogeneous and inconclusive, probably as a consequence of discrepancy among studies regarding the feeding conditions, age of the piglets, the type of tannins (HTs or CTs), source of tannins, the dosage of tannins, and duration of tannins supplementation [
23,
34,
35]. Therefore, it has become imperative to investigate and control the source of heterogeneity as a critical attribute in developing tannin-containing products to enhance the growth performance, serum antioxidant capacity, and serum health indices of weaned piglets.
Few studies presented in the literature have reviewed tannin supplementation in improving livestock's productive performance and health status [
35,
36,
37,
38,
39,
40,
41,
42,
43,
44], with the majority adopting a narrative approach. However, none of these reviews focused on weaned piglets using a meta-analytic method. Meta-analysis (MA), according to Higgins and Green [
45], is a statistical method used to combine results from the relevant studies, and the resultant larger sample size provides more excellent reliability (precision) of the estimates of any treatment effect. Additionally, the heterogeneity sources among the diverse related studies can be explored using MA, which helps obtain additional information about the variability of the observed outcomes in response to a specific treatment [
45]. Although the MA use in animal nutritional studies is gaining momentum, its utilisation in weaned piglets tannin supplementation is scarce. Hence, we hypothesized that tannin supplementation to the basal diet would positively modify the productive performance, serum antioxidant status, and immune indices of piglets. Therefore, this meta-analysis aimed to evaluate the effect of dietary supplementation with tannins on weaned piglets’ growth performance, serum antioxidant capacity, and serum immune status. We further explored the heterogeneity of the outcomes by meta-regression analysis to identify the percentage of variation explained by the regression model.
2. Materials and Methods
2.1. Literature Search and Study Selection
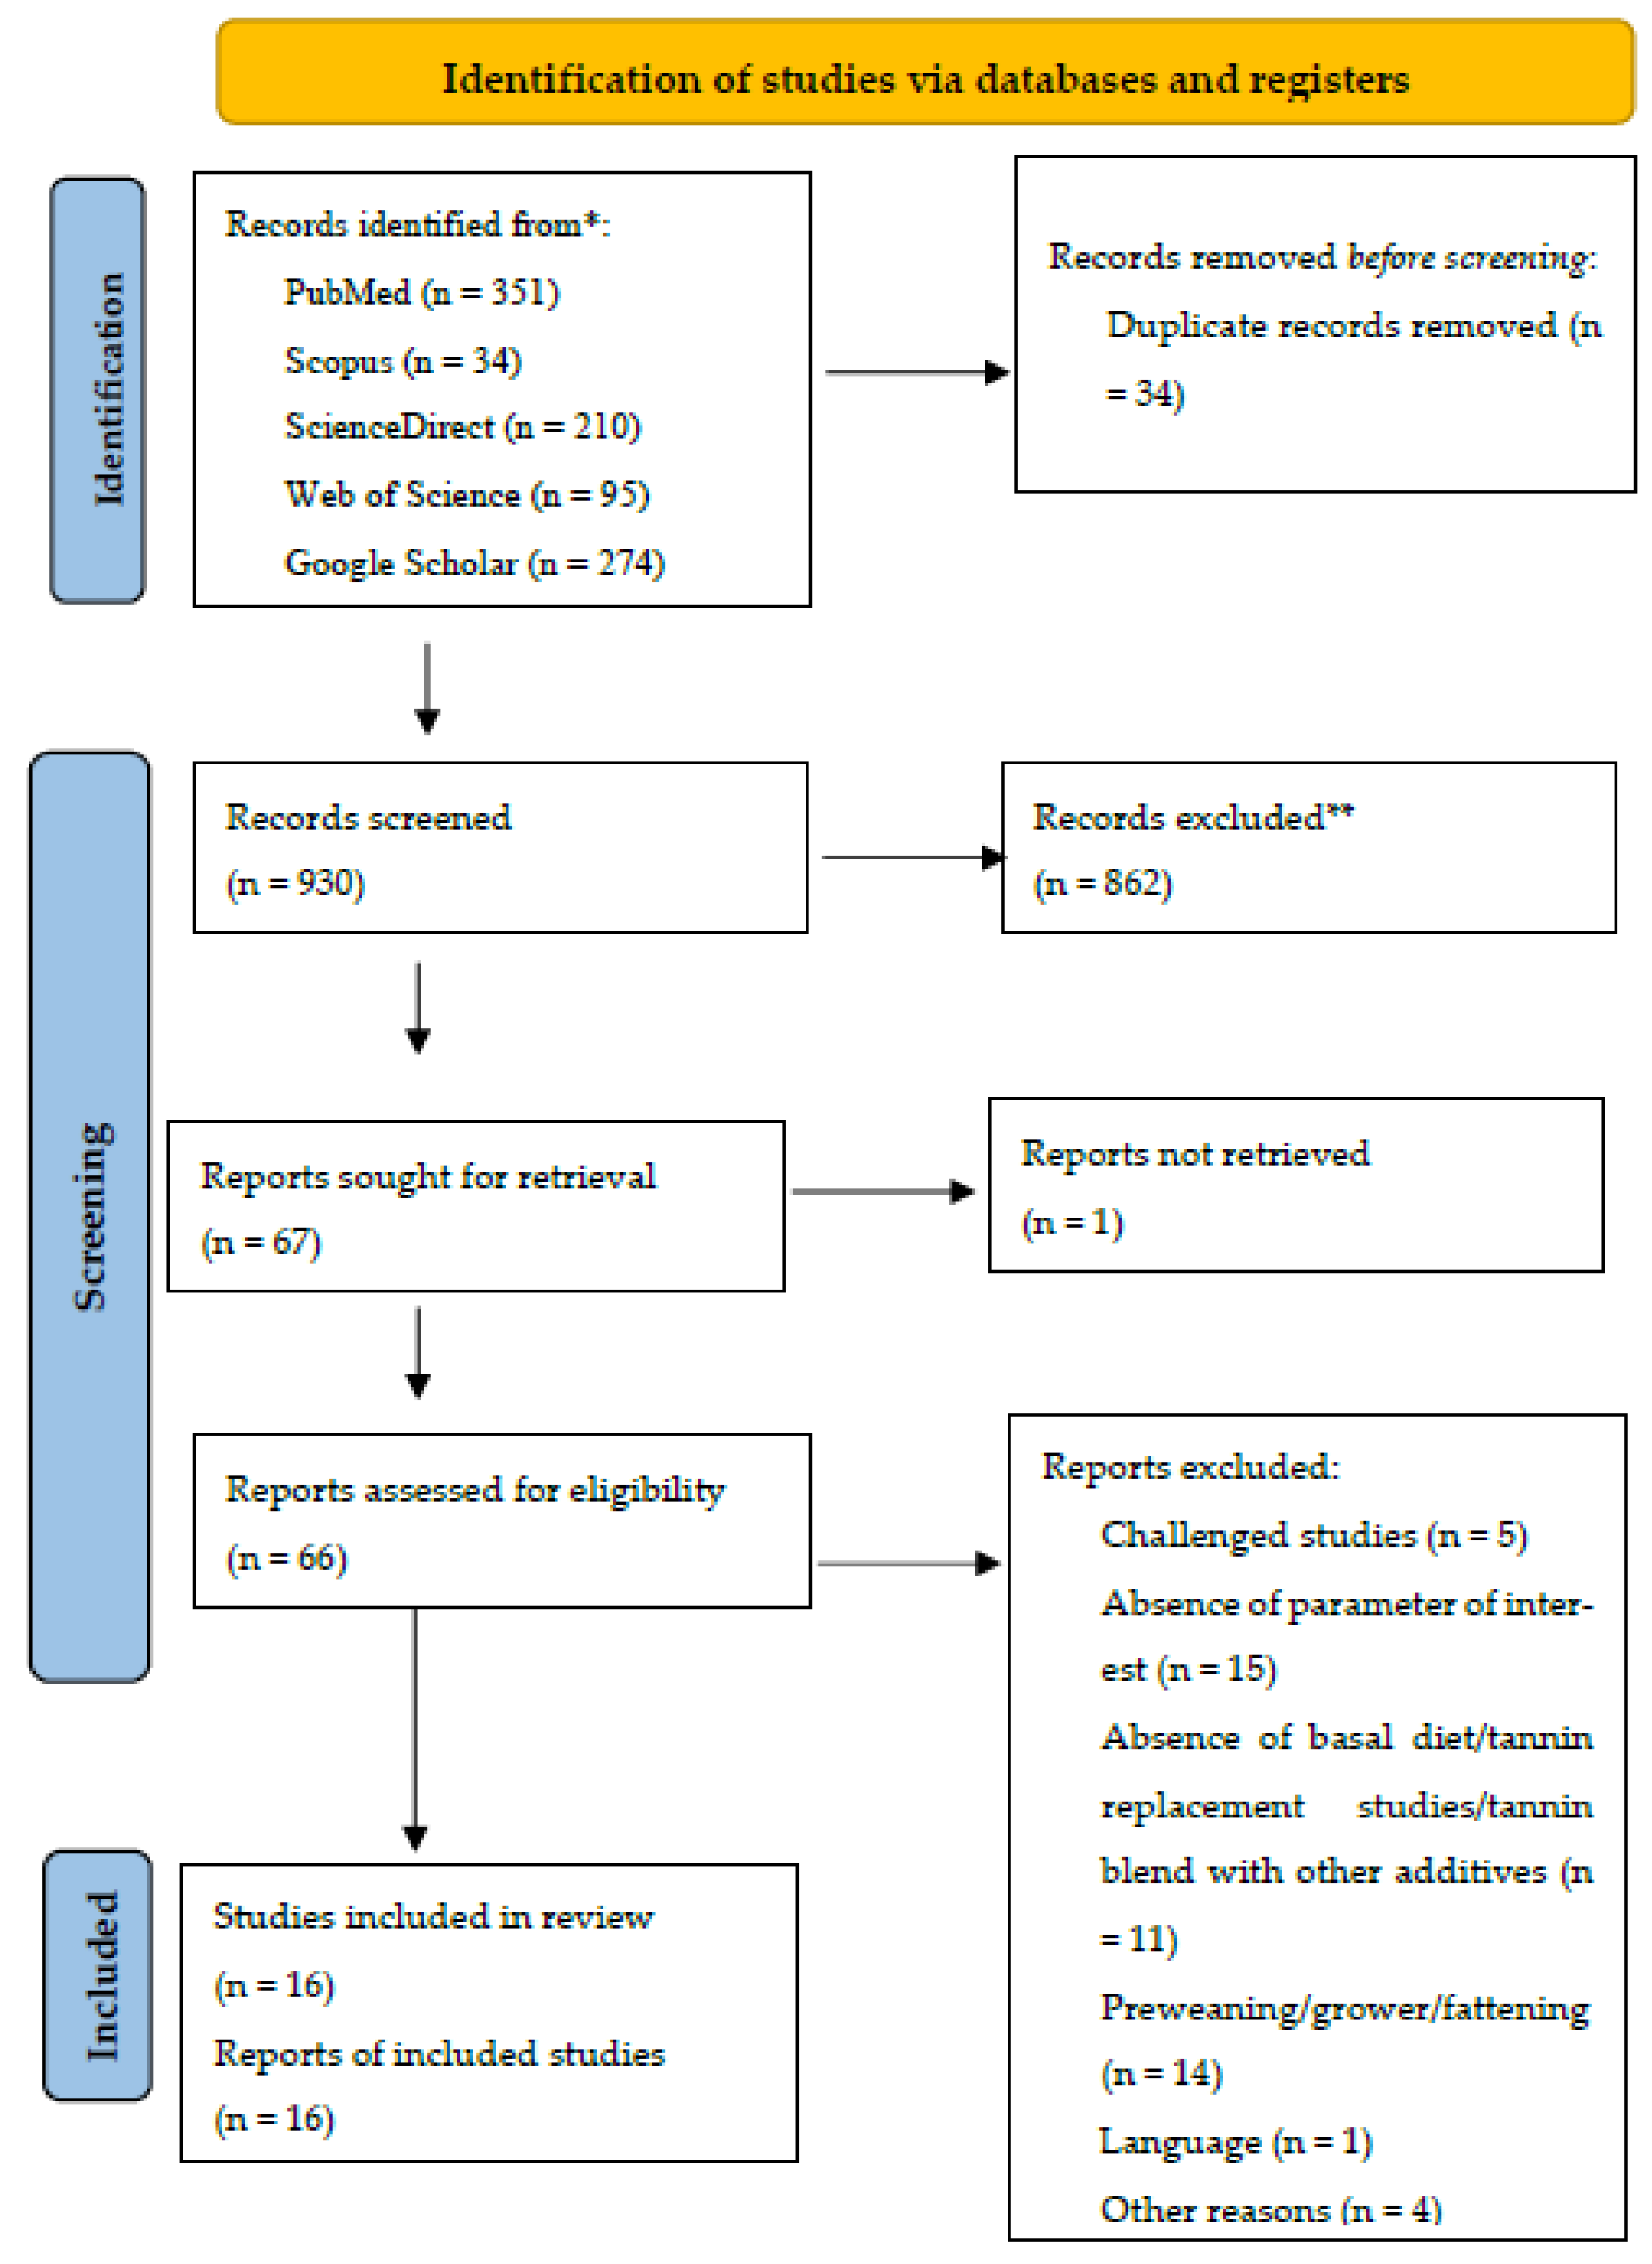
This meta-analysis follows the Preferred Reporting Items for Systematic Reviews and Meta-Analysis (PRISMA) updated guidelines [
46] for identifying, selecting, choosing, and including information, as shown in Figure 1.
Figure 1.
Systematic literature search and selection process. The PRISMA diagram details the applied search and selection process of this study.
Figure 1.
Systematic literature search and selection process. The PRISMA diagram details the applied search and selection process of this study.
To identify studies that evaluated the effects of tannin supplementation on productive performance, antioxidant status, and immune indices of weaned piglets, a comprehensive literature search in the scientific databases of Web of Science (accessed on 20 October 2023), Scopus (accessed on 20 October 2023), ScienceDirect (accessed on 20 October 2023), PubMed (accessed on 20 October 2023), and Google Scholar (accessed on 20 October 2023) was carried out. The search was limited to the results of papers published between 2010 and 2023. In all the databases, the keywords “tannin,” “condensed tannins,” “hydrolysable tannin,” “weaned pig*,” “growth,” “antioxidant status,” and “immune indices” were used.
2.2. Inclusion and Exclusion Criteria
Search results from the five databases were pooled in Zotero (Version 6.0.30), and then duplicate publications were removed. The records remaining were screened through a two-step process, as previously described by other authors [
41,
47]. First, a screening was performed using title and abstract, excluding review papers, stimulated studies
(in vitro), and studies not including weaned pigs/piglets. Papers that passed the title and abstract screening were assessed for eligibility in the second step based on the inclusion and exclusion criteria of the meta-analysis. Inclusion criteria: (1) peer-reviewed journal article published in English; (2) studies involving basal diet supplemented with tannins; (3) studies on crossbred weaned pigs; (4) studies with the allotment of weaned pigs randomized; (5) studies with the quantification of tannin doses; (6) studies that reported means of the control and experimental group with variability measures (standard deviation or standard error of mean) and sample size, and (7) studies that reported the parameters of interest. The exclusion criteria included (1) challenged studies, (2) studies with pre- and post-weaning pigs, (3) studies with tannin fed as a replacement ingredient in the diet of weaned pigs, and (4) studies with tannin combined/blended with probiotics/prebiotics/organic acids or other additives.
2.3. Data Extraction
Two main categories of data were extracted from the eligible studies. The study characteristics: author, year, country, breed/strain, age at weaning, supplementation duration, tannin type, source, number of piglets, and average initial weight were extracted from each study. The response variables were in three categories. The growth performance category included average daily feed intake (ADFI), average daily gain (ADG), final body weight (FBW), and feed conversion ratio (FCR). The antioxidant parameters included: glutathione peroxidase (GSH-Px), superoxide dismutase (SOD), catalase (CAT), malondialdehydes (MDA), and total antioxidant capacity (T-AOC). The third category, immune indices, included immunoglobulin A (IgA), immunoglobin G (IgG), and immunoglobin M (IgM). The mean, standard deviation, or standard error of all outcomes corresponding to tannin and control groups were extracted from each study. Each treatment was considered a separate trial for studies including more than one treatment. The data extracted from eligible studies was compiled using an electronic form created in Microsoft Excel (Microsoft Corp., Redmond, WA, USA).
2.4. Study Quality Assessment
Two researchers independently assessed the study quality using Cochrane Collaboration’s Systematic Review Center for Laboratory Animal Experimentation’s (SYRCLE) Risk of Bias (RoB) tool for animal studies [
48]. The assessment items included random sequence generation (selection bias), baseline characteristics (selection bias), allocation concealment (selection bias), random housing (performance bias), blinding of participants and personnel (performance bias), random outcome assessment (detection bias), incomplete outcome data (attrition bias), selective reporting (reporting bias), and other bias. Discussions settled the disagreements on assessment with a third researcher.
2.5. Statistical Analysis
2.5.1. Meta-Analysis
All the statistical analysis were performed using the R software (version 4.3.1, The R Foundation for Statistical Computing, 2023-06-16 ucrt) using the “meta” and “metafor” packages. The means of the experimental units (control and treatment) were registered as continuous result data. The response variables were analysed through the standardized mean difference (SMD), also called effect size (ES), in which the difference between the means of the experiment and control was standardized using the standard deviation (SD) of the groups with and without tannins. The random-effects model was used to estimate the effect size, 95% confidence interval (CI), and statistical significance for each trait since it is more conservative than the fixed-effects model [
49,
50]. SMD values of < 0.2, 0.2 < SMD < 0.7, and > 0.7 indicated small, moderate, and high effects, respectively [
51,
52]. Eleven meta-analyses (global studies) were run separately for each response variable studied, growth performance (ADFI, ADG, FBW, and FCR); antioxidant parameters (GSH-Px, SOD, CAT, MDA, and T-AOC) and immune indices (IgA, IgG, and IgM). The effect sizes of each experimental unit comparing tannin impacts were calculated for each outcome variable with Hedges’ g. A p-value of SMD less than 0.05 was considered statistically significant.
2.5.2. Heterogeneity Assessment
The effect size heterogeneity was measured using Cochran’s Q test and the
I2 (percentage of variation) statistics. Heterogeneity between-study variability was assessed using values ranging from 0 to 100% (
I2 < 25% = low heterogeneity, 25% ≤
I2 ≤50% = moderate heterogeneity, 50% ≤
I2 <75% = high heterogeneity, 75% ≤
I2 ≤100% = very high heterogeneity) [
45]. Sub-group analysis and meta-regression are necessary to determine the sources of heterogeneity further when the studies had a substantial heterogeneity (
I2 >50%) [
45].
2.5.3. Meta-ANOVA and Meta-Regression
Meta-ANOVA (sub-group analysis) tests were conducted to compare the effects of the tannin sources (chestnut, quebracho, carob pods, gallnut microencapsulated tannic acid, gallnut tannic acid, grape seed proanthocyanidins, and chestnut and quebracho blend). Meta-regression analysis was conducted using effect sizes (SMD) for each outcome (PSMD <0.05, I2 >50%, n ≥10) as the dependent variable to examine heterogeneity sources of meta-analysis with tannin dosage (mg/kg), supplementation duration (days), and piglets age at weaning (days) of piglets as a covariate.
2.5.4. Publication Bias
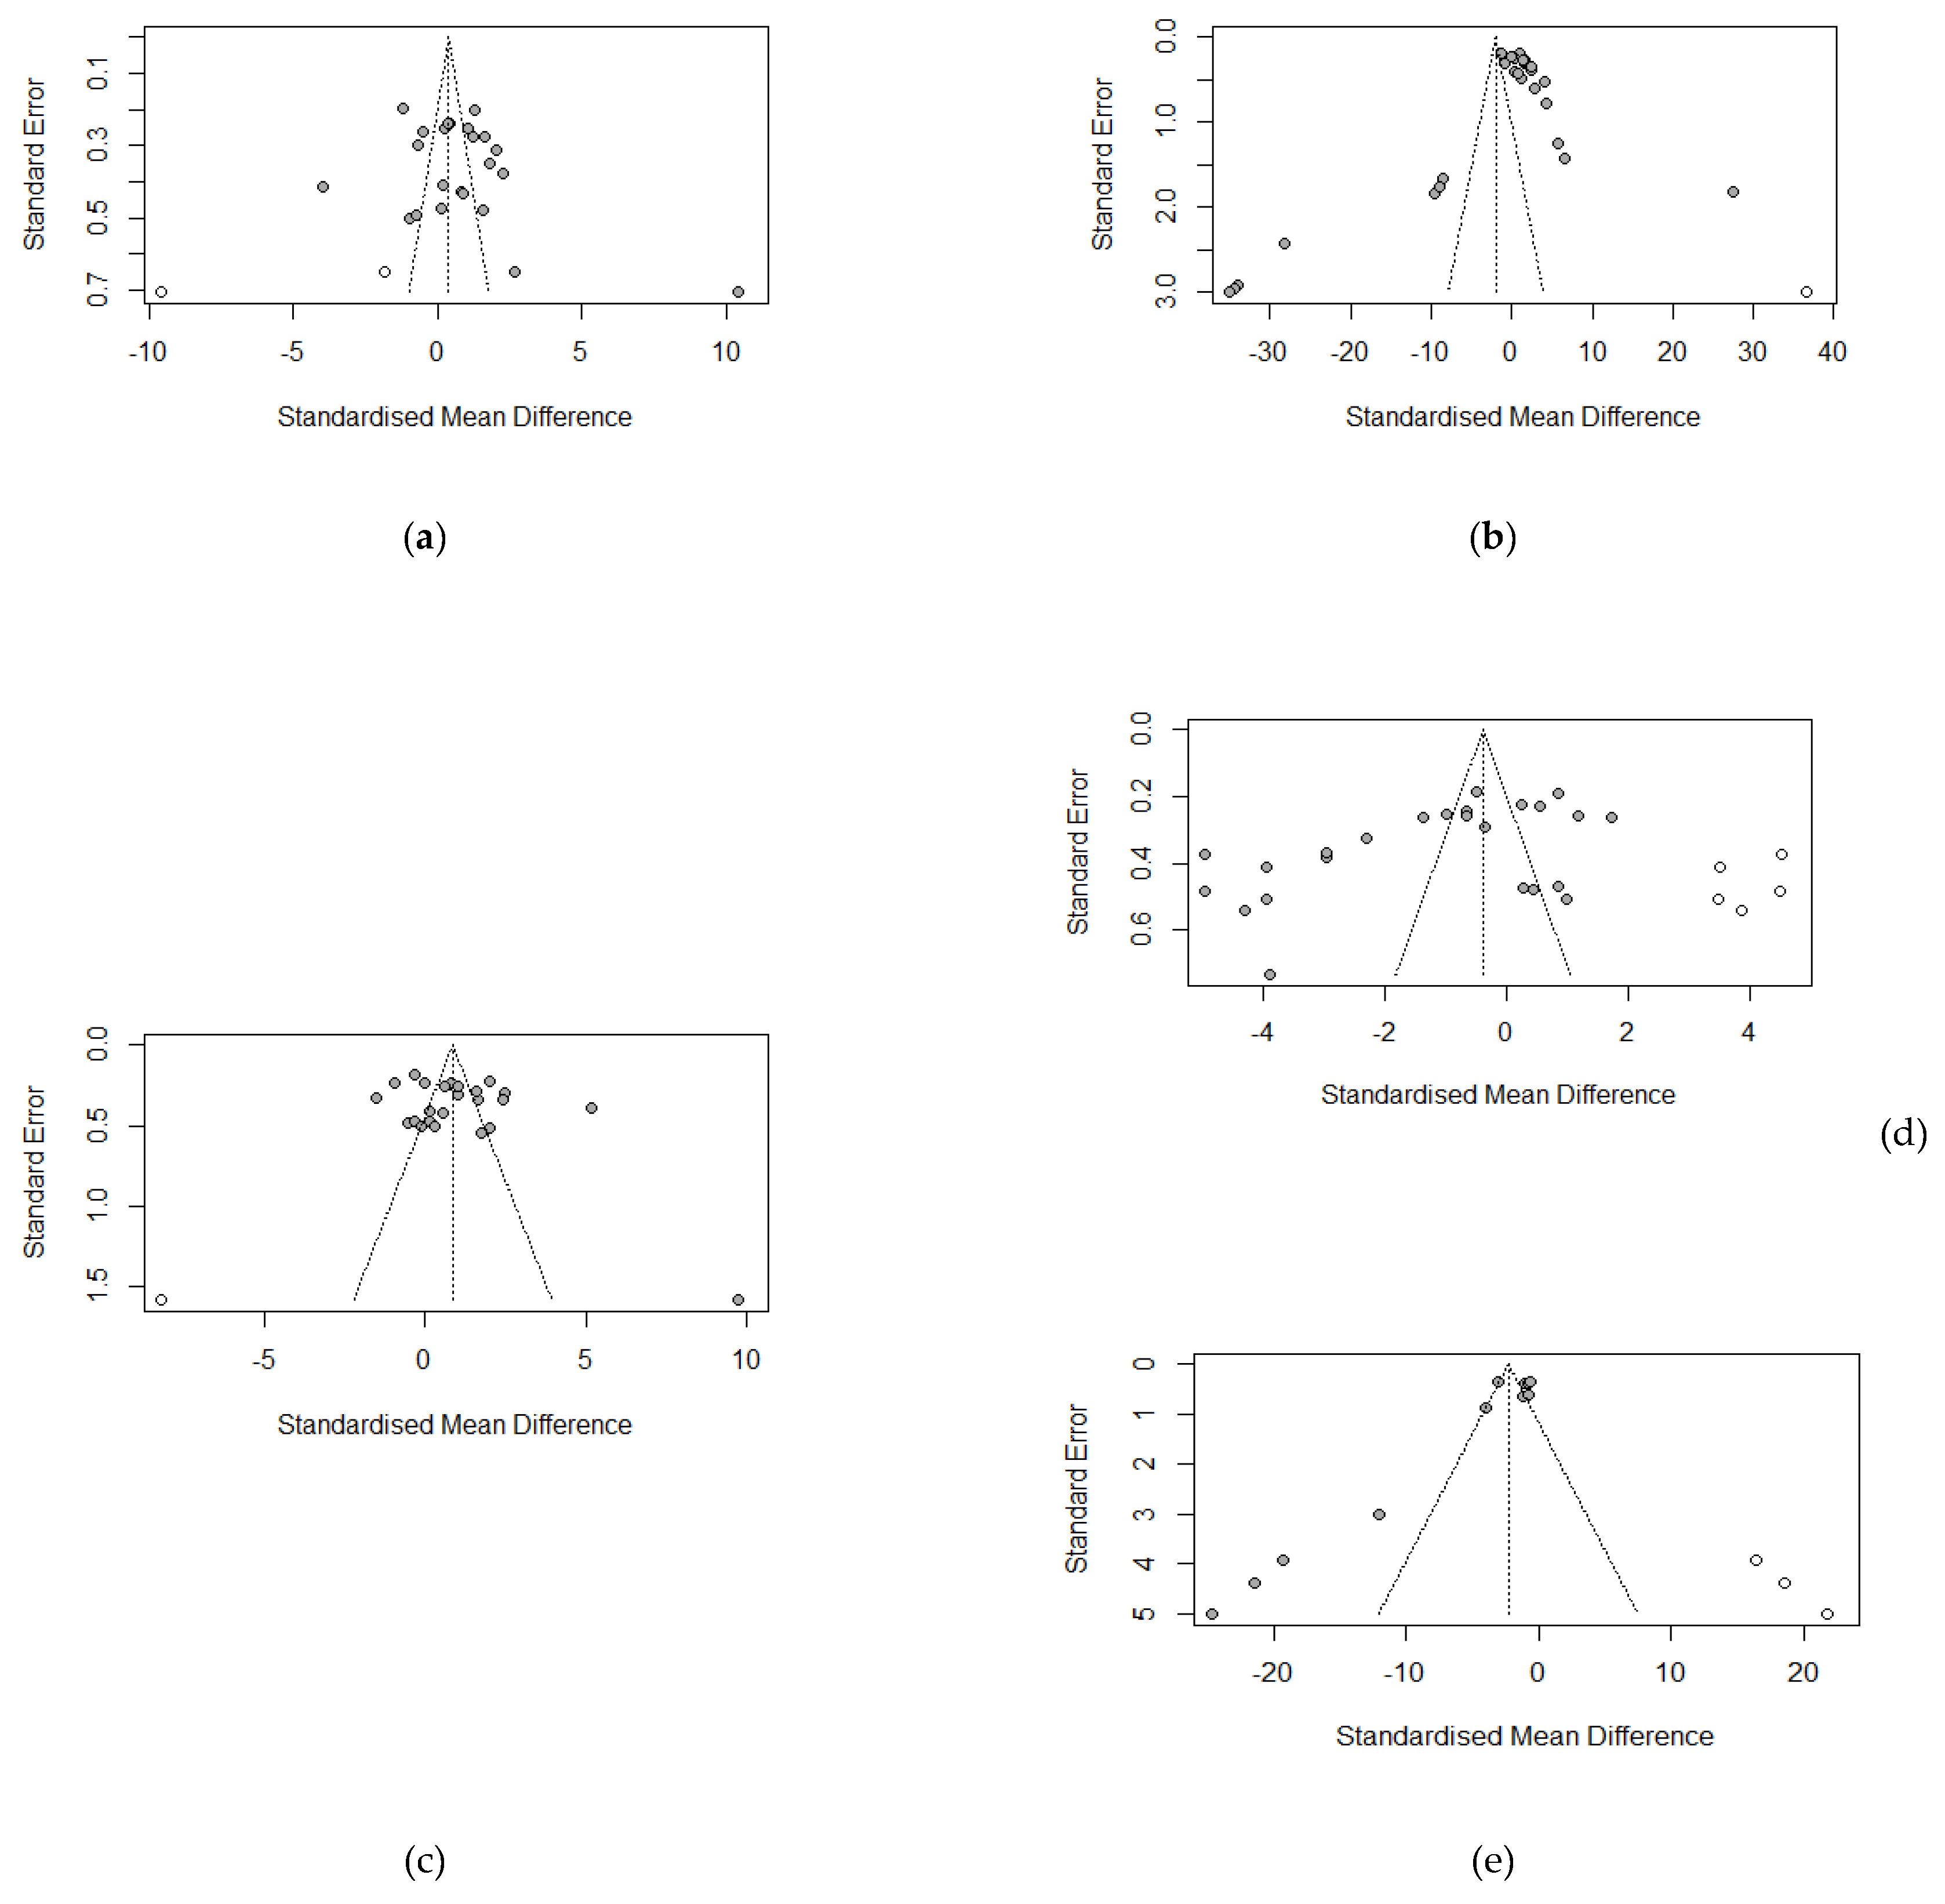
Publication bias was analysed to confirm the study results' validity and assess the risk of bias in individual studies. The funnel plots were drawn to visualize the bias, and Egger’s linear test was performed to evaluate the publication bias accurately with numerical data [
53]. Tests to assess publication bias can be achieved when the variable to be considered is at least ten studies and when significant heterogeneity (Q) is detected with
p ≤ 0.50 because it may lead to false-positive claims [
54]. Consequently, funnel plots and Egger’s test were only performed for variables that met the criteria above. In cases where statistical evidence of publication bias was found, Duval and Tweedie's “trim-and-fill” method was used to estimate the number of possible missing observations [
55].
3. Results
3.1. Dataset and Study Characteristics
The strategy, process, and results of our literature search are shown in Figure 1. A total of 964 articles were identified from PubMed, Scopus, ScienceDirect, Web of Science, and Google Scholar for screening. In our screening process, duplicates and ineligible papers were removed, with a final 16 papers included in our review. Finally, 16 papers were registered for data extraction and meta-analysis. The 16 papers were divided into 31 experiments because some studies had several tannin supplementation levels (treatments). An experiment was defined as the control diet associated with one tannin supplementation level. The summary characteristics of the primary studies (16 papers) included in the meta-analysis are shown in
Table 1.
The studies included in this present meta-analysis were conducted in 7 different countries, predominantly in China (50%), Greece (12.5%), and Germany (12.5%). The average weaned age of piglets (crossbreds) was 25 days, with a minimum of 21 days and a maximum of 35 days, while the experimental duration varied between 14 and 55 days. In addition, the average weight of piglets ranged between 5.99 and 10.70 Kg. Regarding the type of tannins, most of the studies in this meta-analysis supplemented condensed tannins, which constituted 50%. In contrast, hydrolysable tannins were 43.75%, and a blend of condensed and hydrolysable tannins was 6.25%. Regarding the source of tannins supplemented, 18.75% of the studies used chestnut and grape seed proanthocyanidins individually, followed by gallnut tannin acids and GMTA, which were 12.50%, respectively. In addition, grape pomace constituted 12.50%, whereas grape extract, carob pods, blend (Ch/Qu), and quebracho were 6.25%, respectively. The included studies supplemented the tannins in a dosage ranging from 40-12500 mg/kg.
3.2. Assessment of Risk of Bias
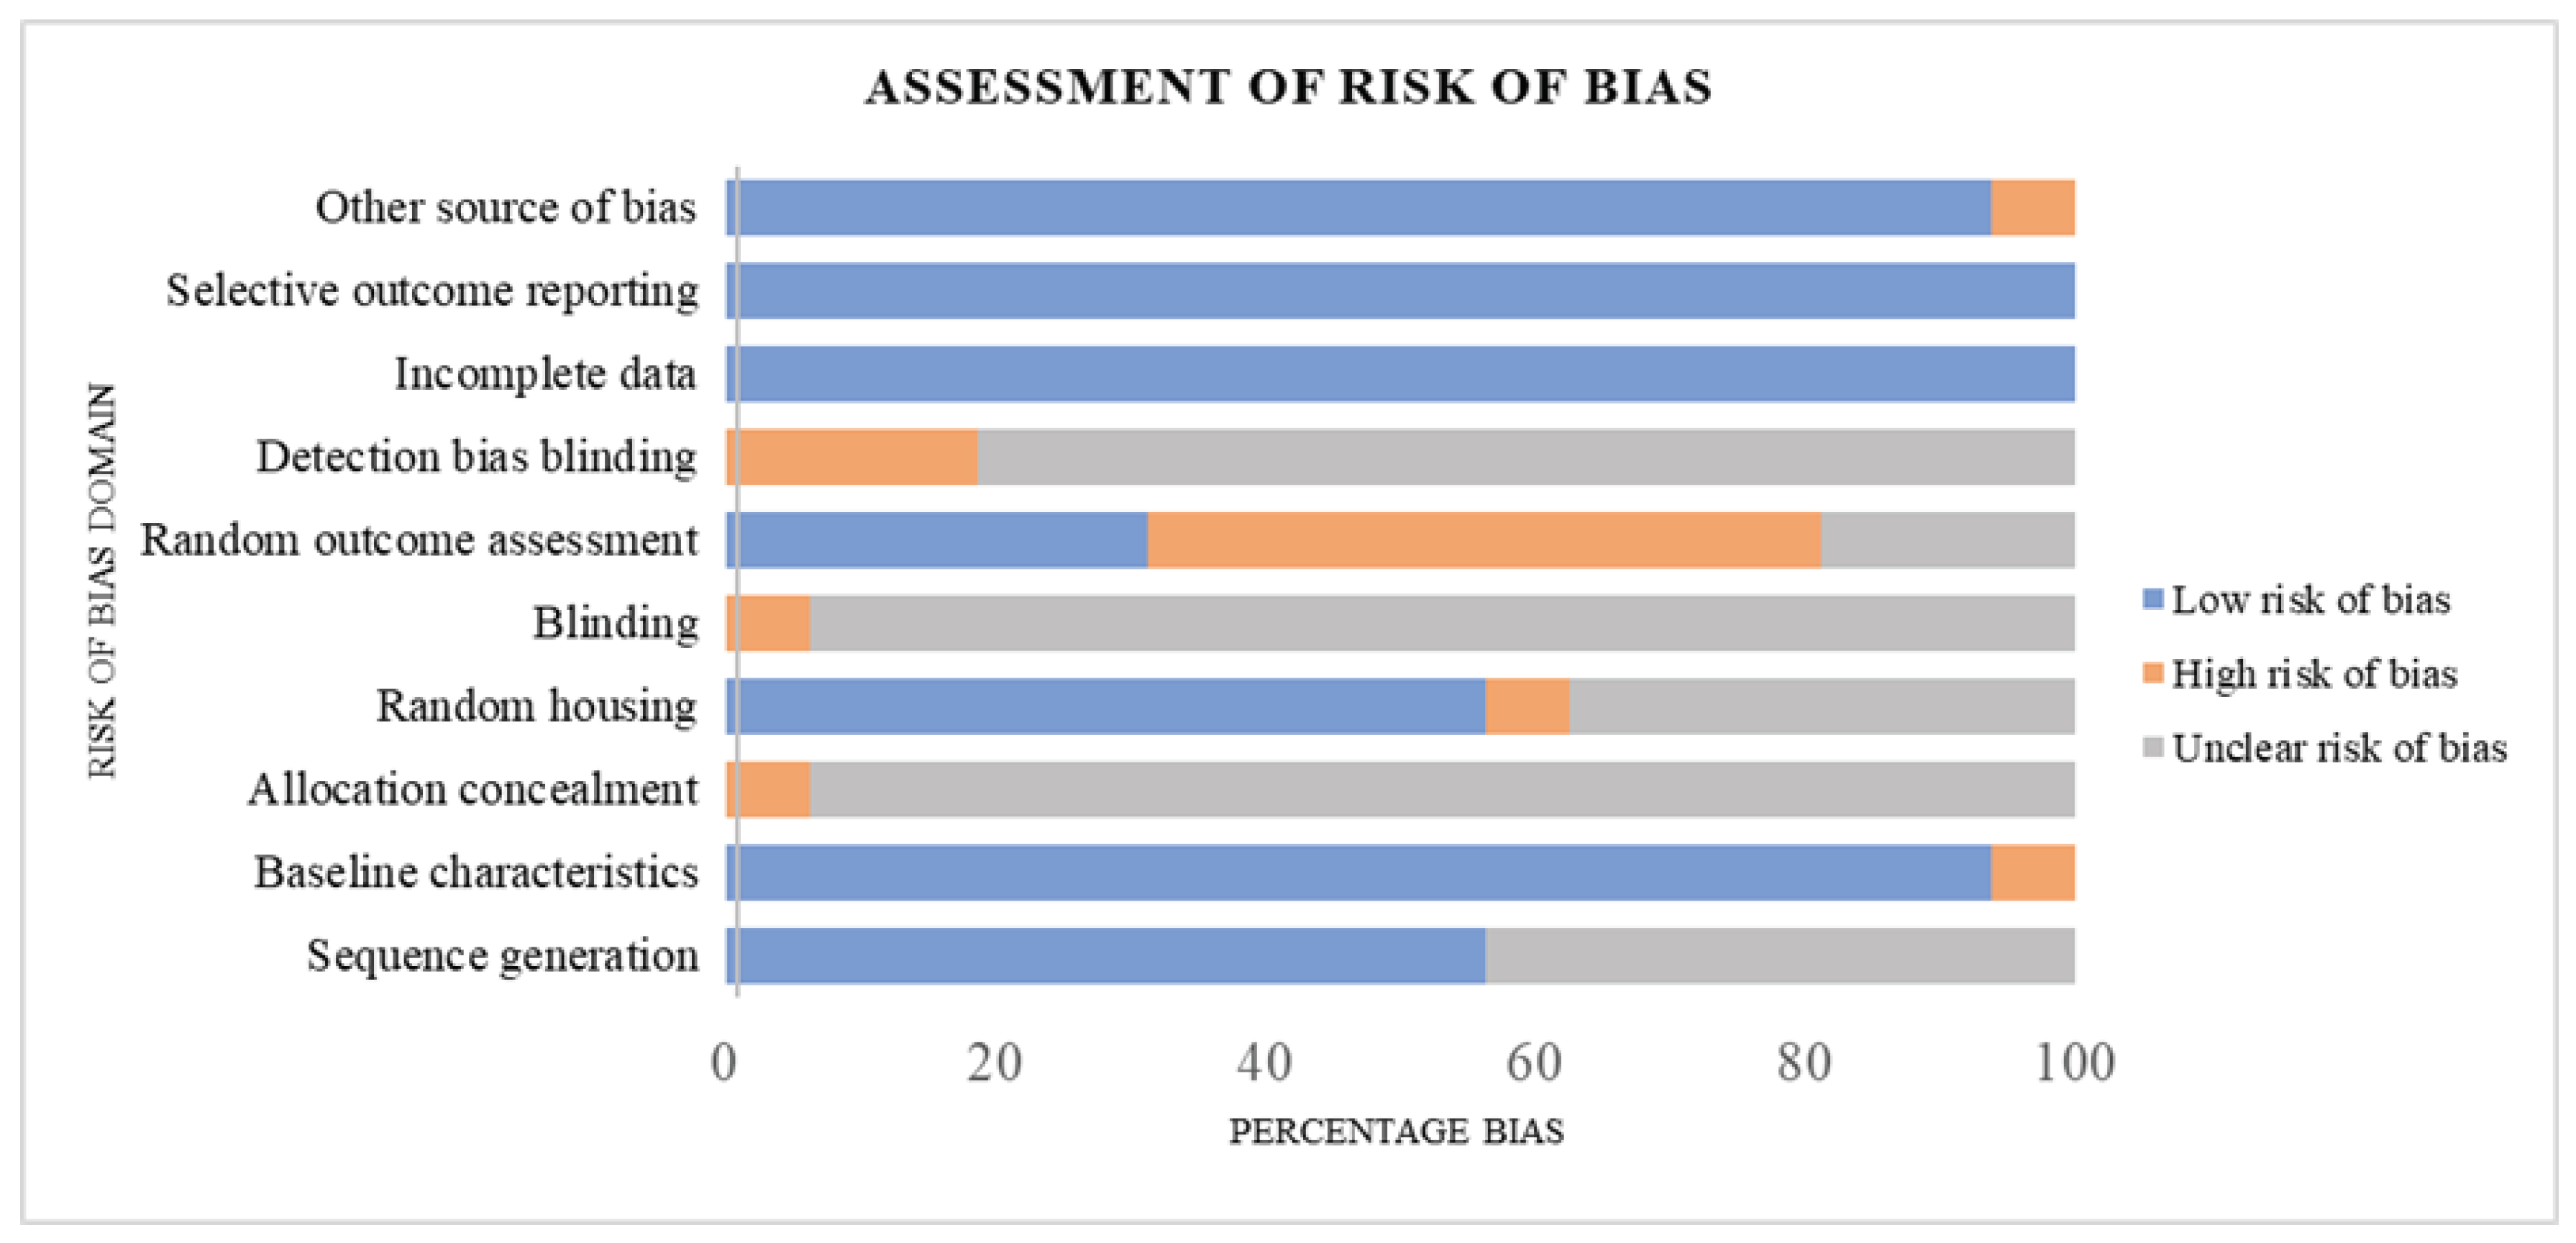
Figure 2 presents the risk of bias classification for the studies included in our meta-analysis based on Cochrane Collaboration’s SYRCLE Risk of Bias tool for animal studies.
Figure 1.
Study Quality Assessment.
Figure 1.
Study Quality Assessment.
Regarding selection bias, out of the 16 included studies, 9 (56.25%) reported a low risk of bias, whereas 43.80% were assessed as unclear risk of bias for the sequence generation domain. Likewise, the majority (93.75%) of the studies were judged as low risk bias, though 6.25% were of high risk of bias corresponding to their baseline characteristics. In contrast, for allocation concealment, the majority (93.75%) of the included studies showed an unclear risk of bias, with just 6.25% constituting a high risk of bias. Considering the performance domain of risk of bias assessment, 56.25%, 37.50%, and 6.25% of the studies presented a low, unclear, and high risk of bias concerning random housing. With no low risk of bias reported concerning the blinding of caregivers, the included studies showed a 93.75% unclear risk of bias, whereas 6.25% were judged as having a high risk of bias. Regarding the detection bias of the included studies, random outcome assessment was adjudged as the domain with the highest proportion of increased risk of bias (50.00%) in our meta-analysis. On the other hand, blinding of outcome assessors, another domain of detection bias, showed 18.75% and 81.25% low and unclear bias, respectively. For both attrition and reporting bias, the studies of our meta-analysis were all judged to present a 100% low risk of bias. In our included studies, 93.75% and 6.25%, respectively, were deemed to have a low and unclear risk of bias for other sources of bias. In summary, the 16 eligible studies in our meta-analysis had approximately 53% low risk of bias, 37% unclear risk of bias, and 10% constituting a high risk of bias.
3.3. Meta-Analysis
3.3.1. Growth Performance
The effects of tannin supplementation on the growth performance of weaned piglets are summarized using random-effect models of meta-analysis.
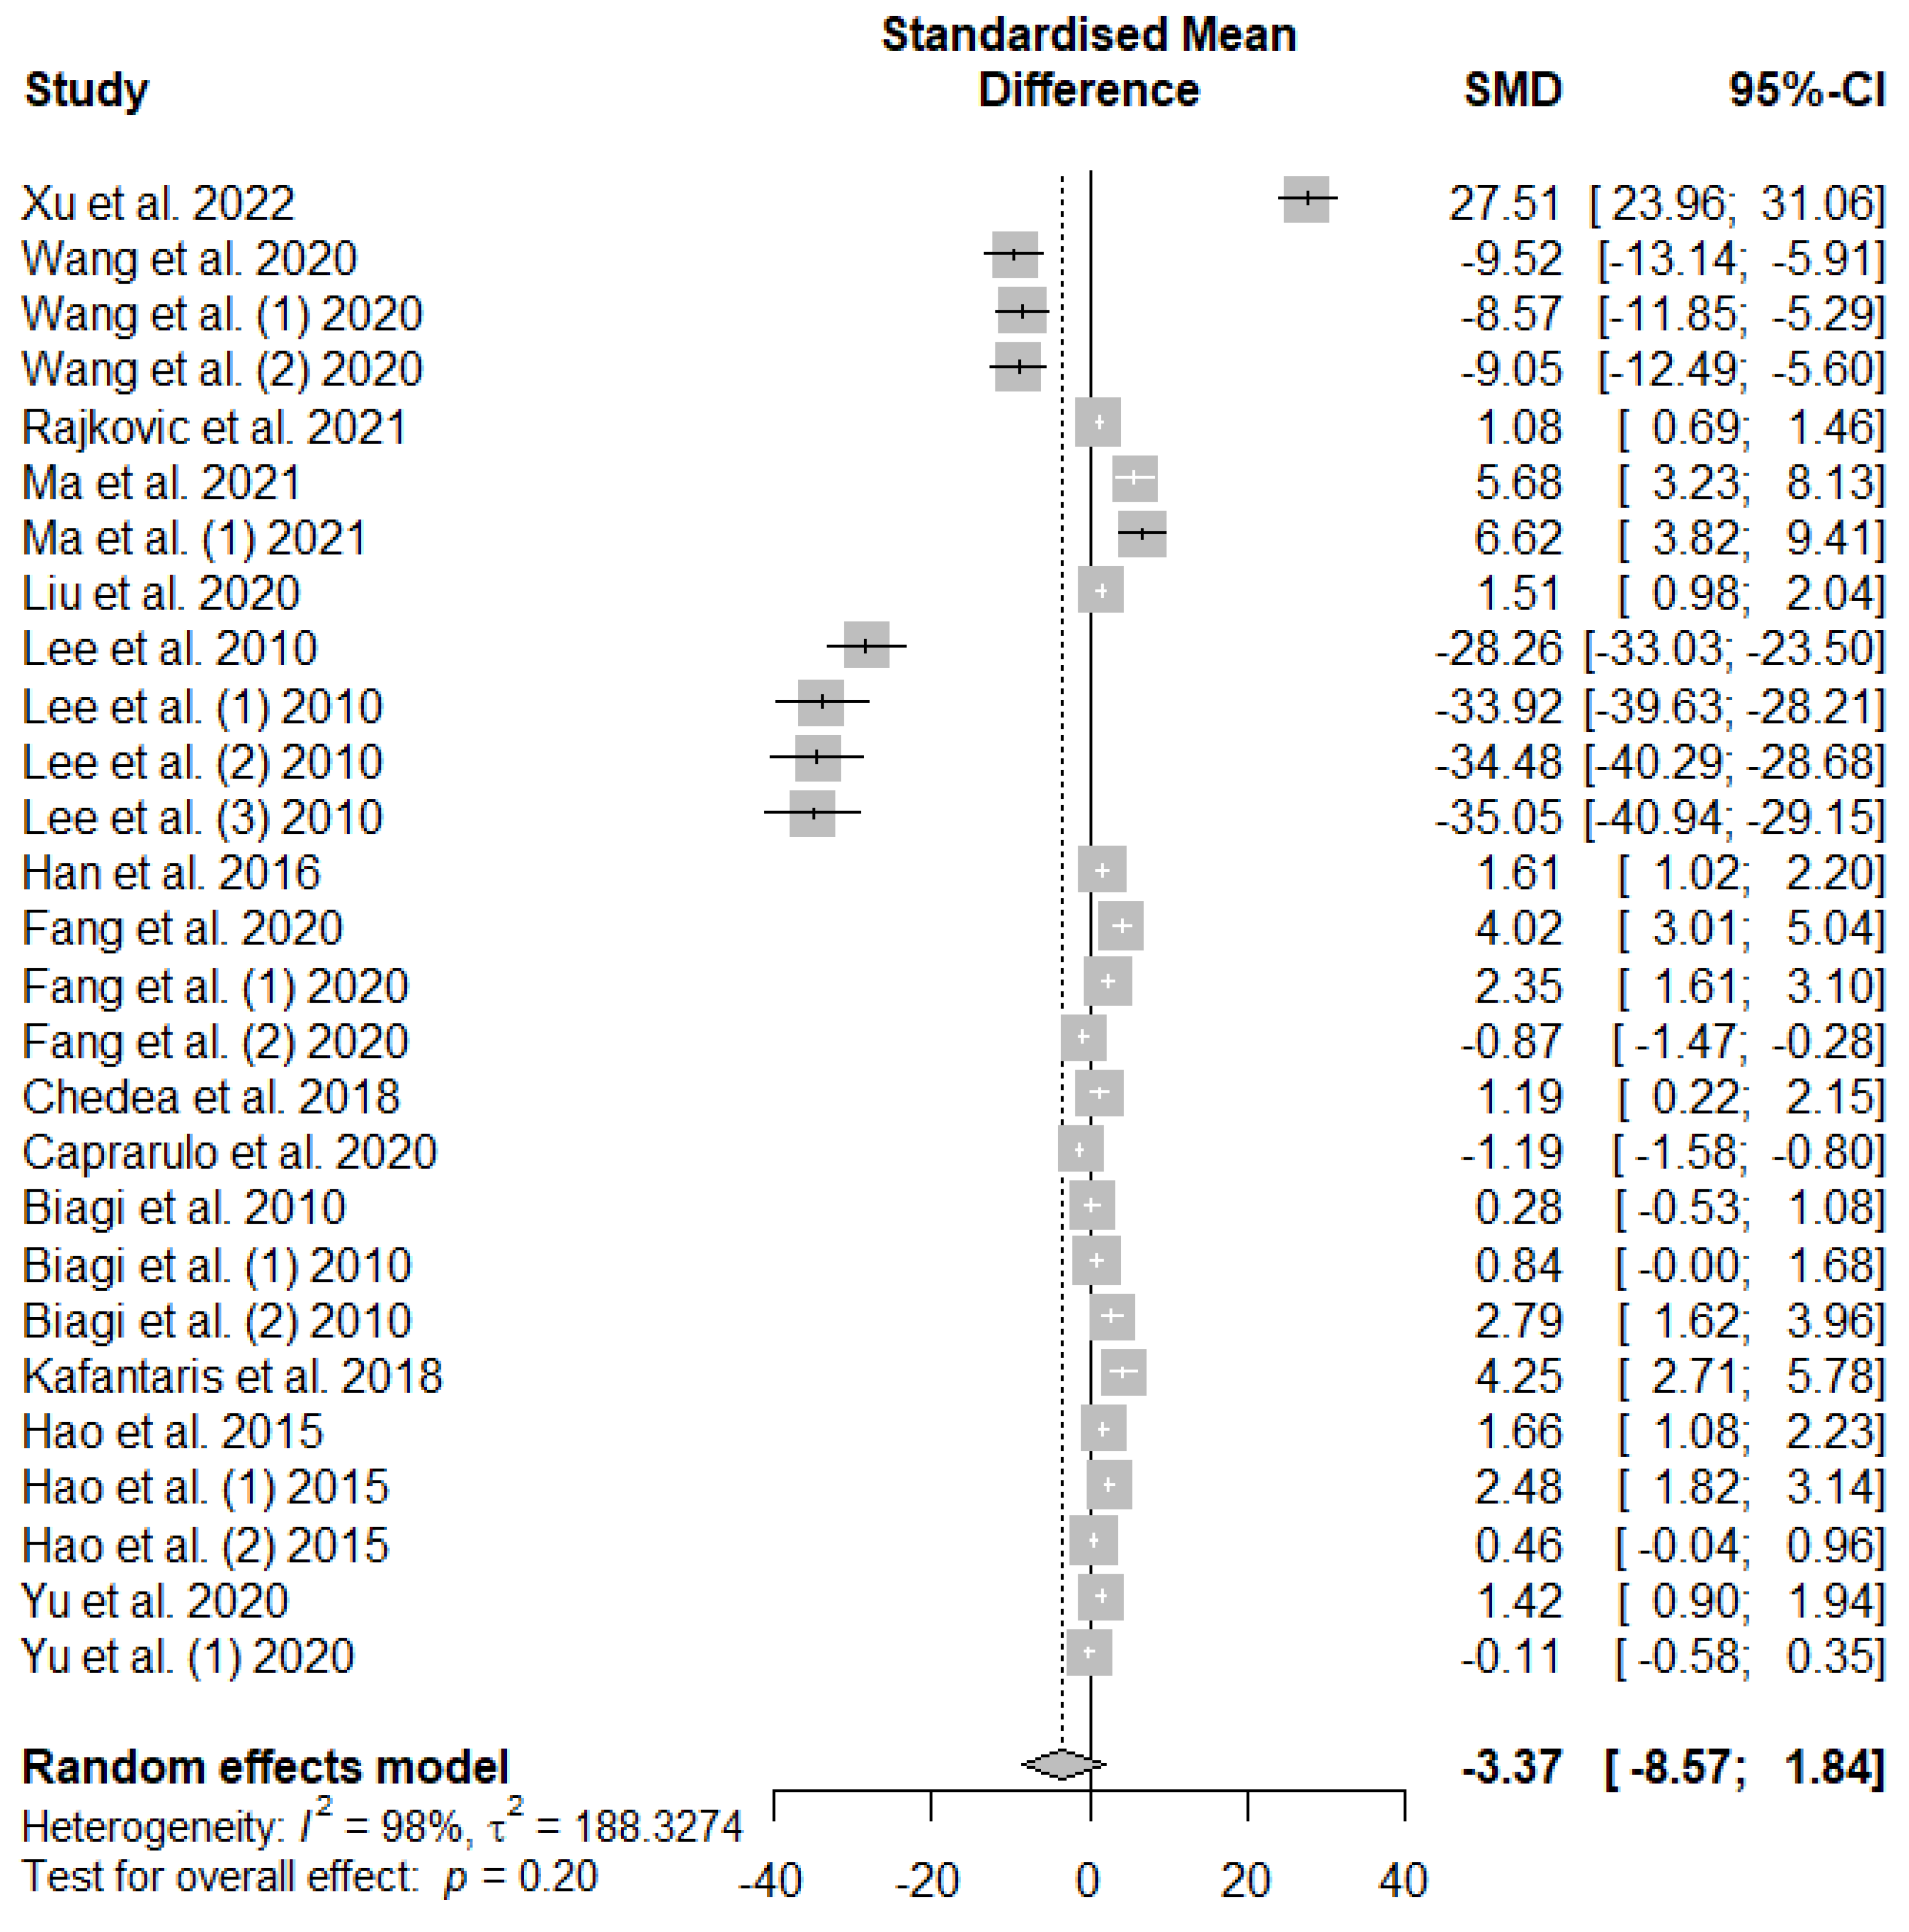
Figure 2 summarizes the meta-analysis on the impact of tannin supplementation on the average daily gain (ADG) of weaned piglets. A non-significant decreasing effect (
PSMD = 0.20) of tannins supplementation in weaned piglets was observed for ADG.
Figure 2.
Forest plot of the effect size or standardized mean difference and 95% confidence interval of tannins on weaned piglets' average daily gain (ADG). The solid vertical black line represents the mean difference of zero or no effect. Points to the left of the solid vertical black line represent a reduction in ADG, while points to the right of the solid line indicate an increase in ADG.
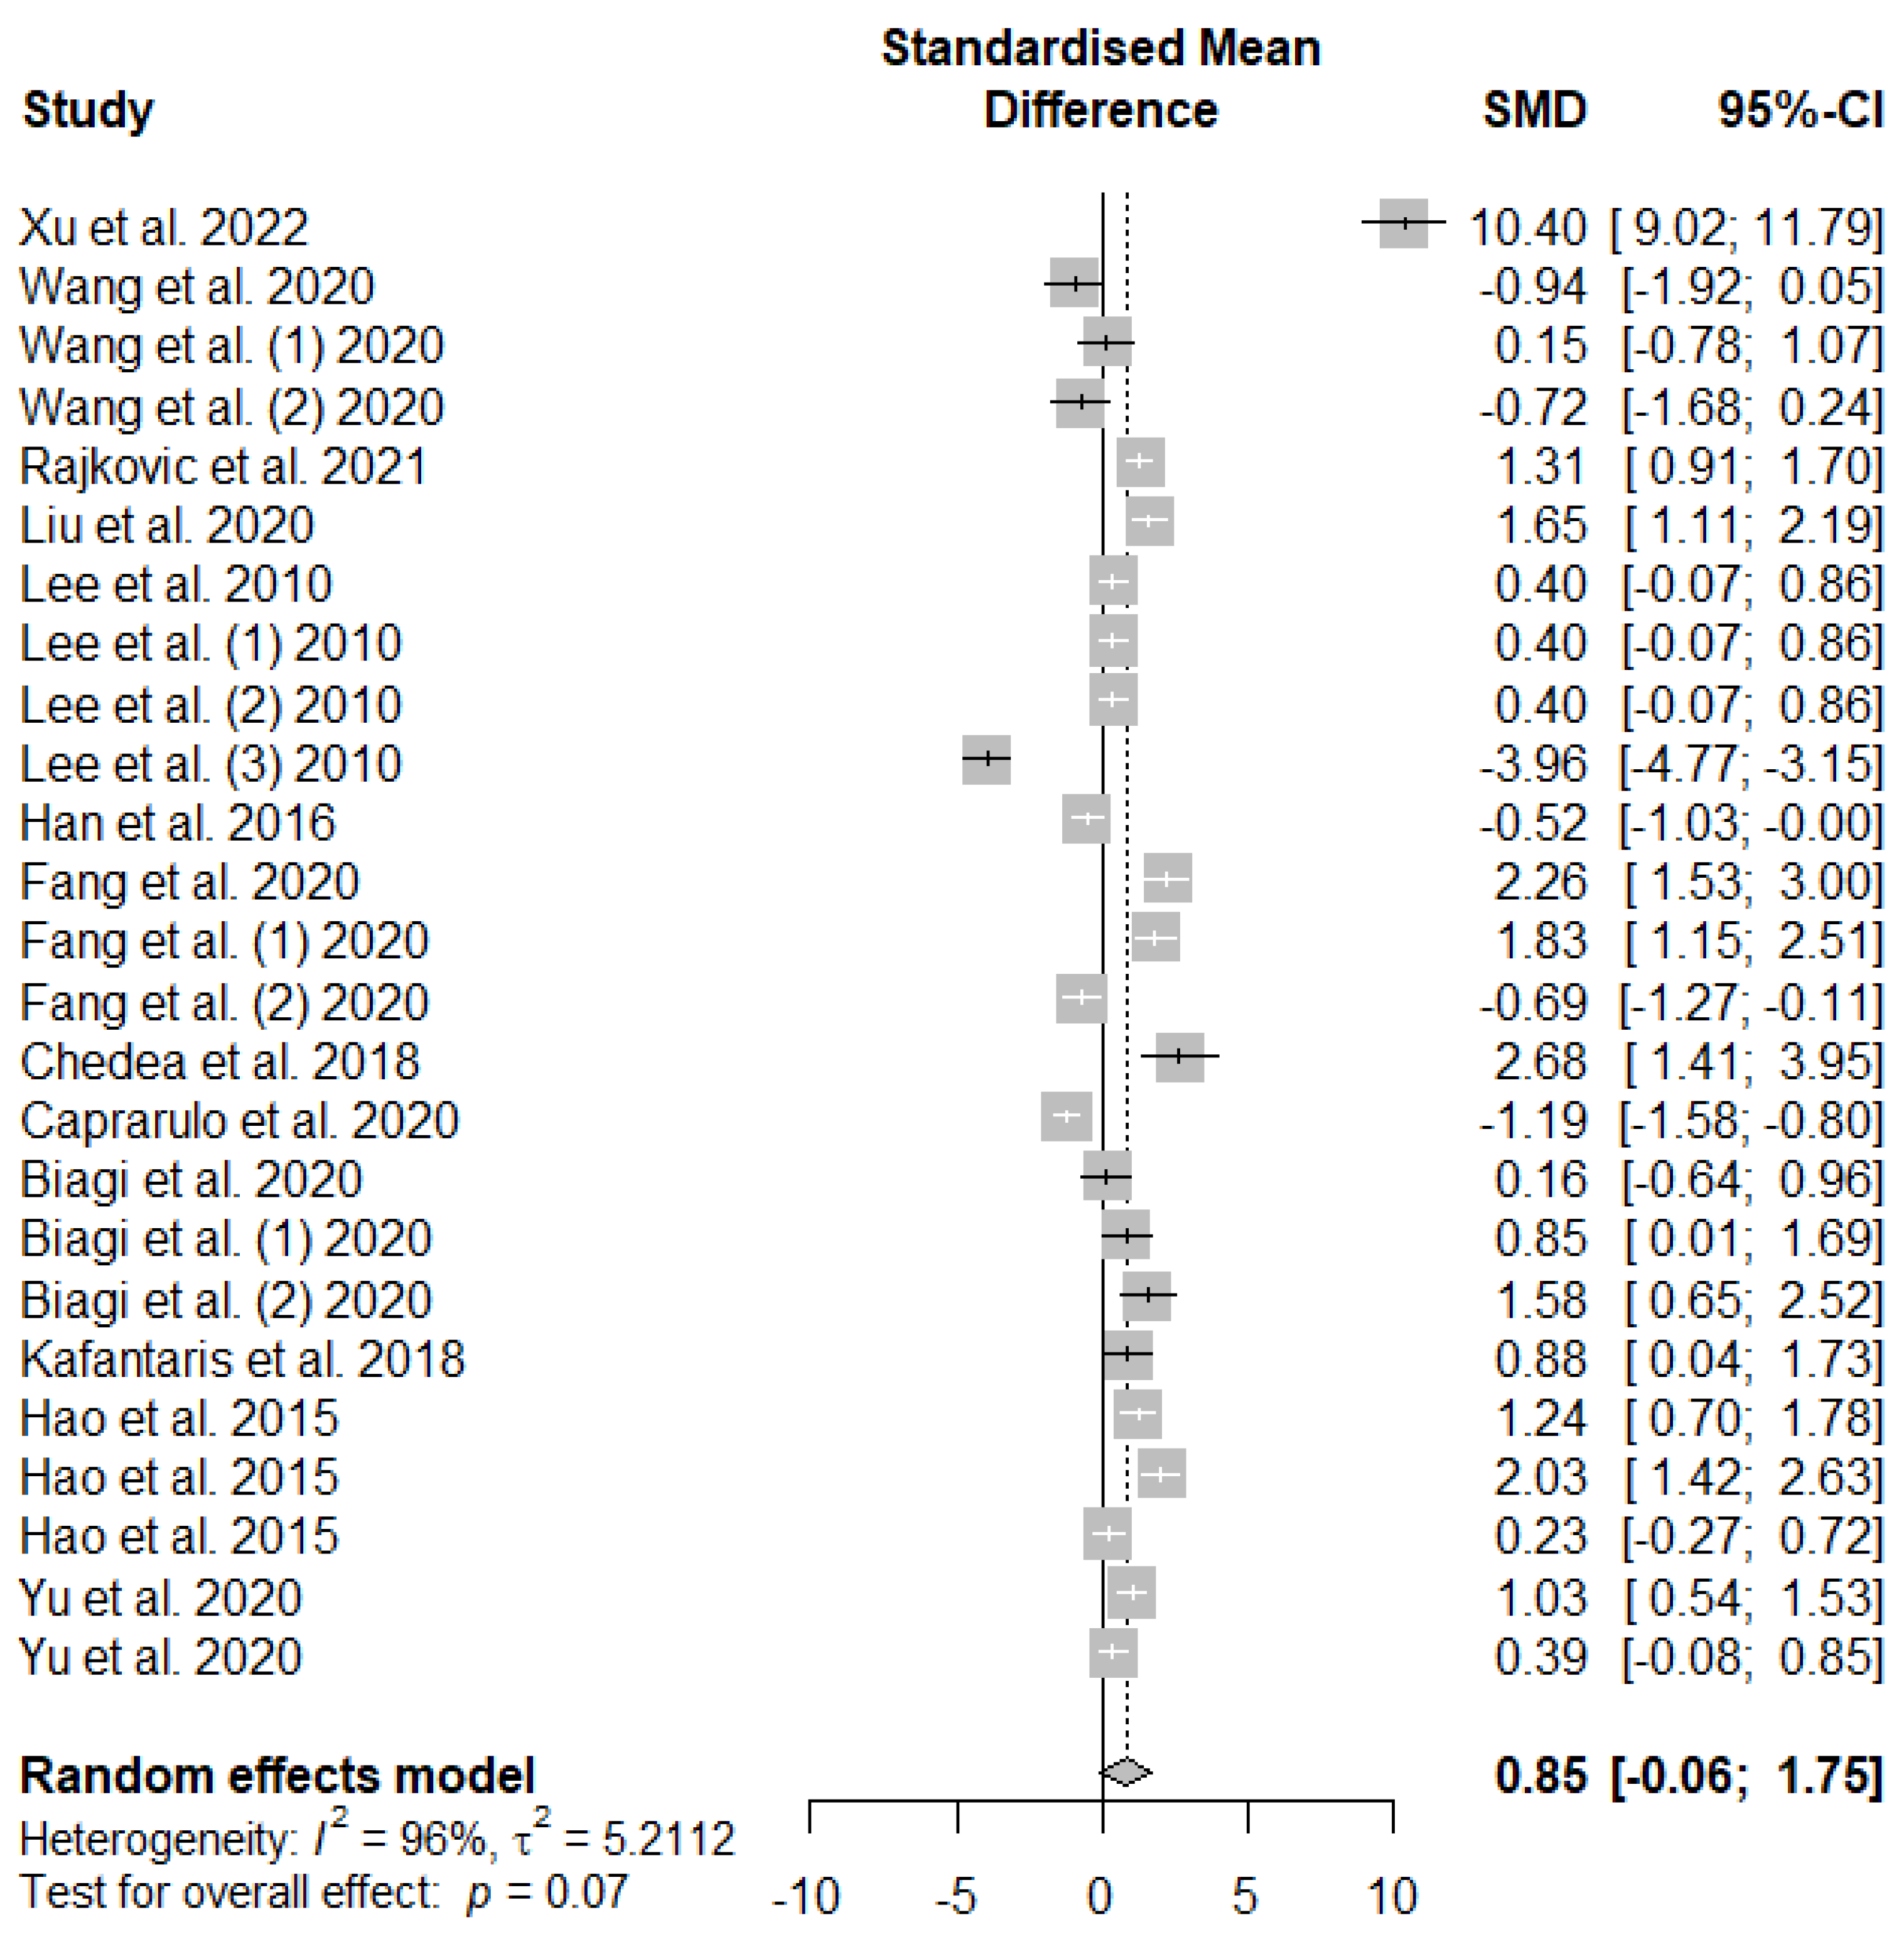
The summary of the meta-analysis on the effects of tannin supplementation on the average daily feed intake (ADFI) of weaned piglets is shown in
Figure 3. Supplementation with tannins did not significantly (
PSMD = 0.07) affect weaned piglets ADFI.
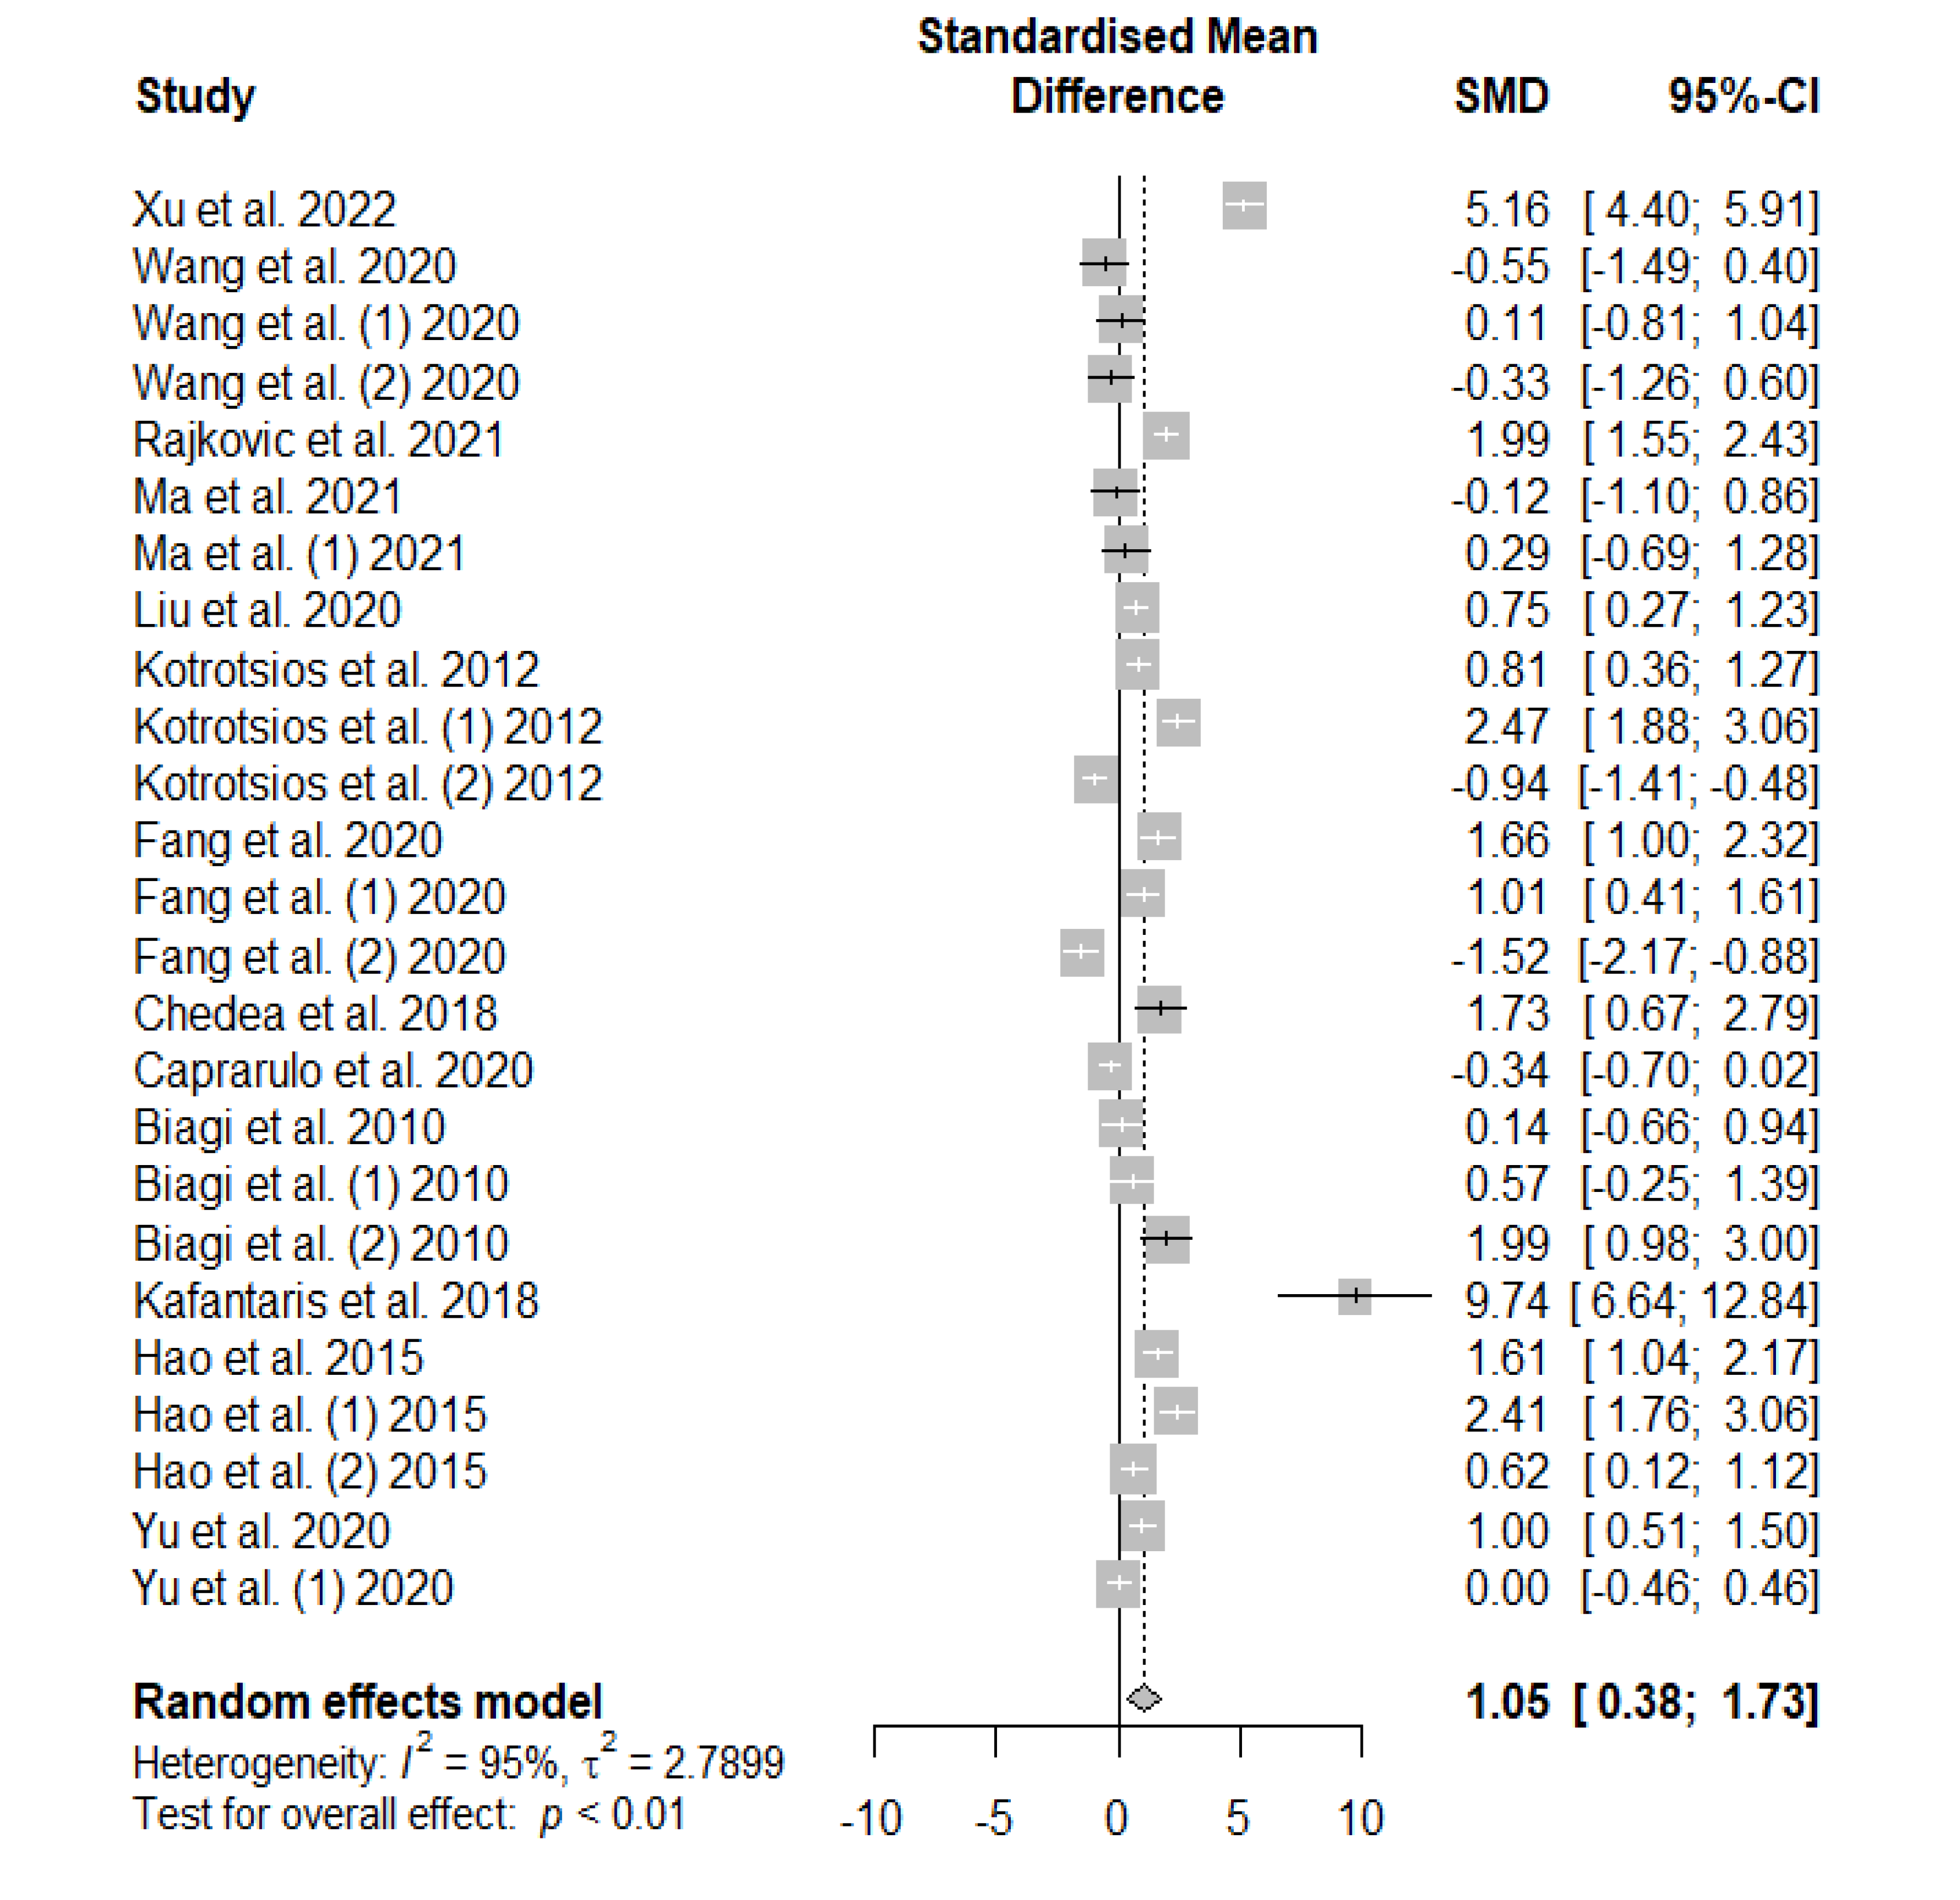
Figure 4 summarizes the meta-analysis on the effects of tannin supplementation on the final body weight (FBW) of weaned piglets. Tannin supplementation significantly increased FBW (SMD = 1.05,
PSMD < 0.01,
I2 = 95%), denoting a high tannin treatment effect (SMD > 0.70).
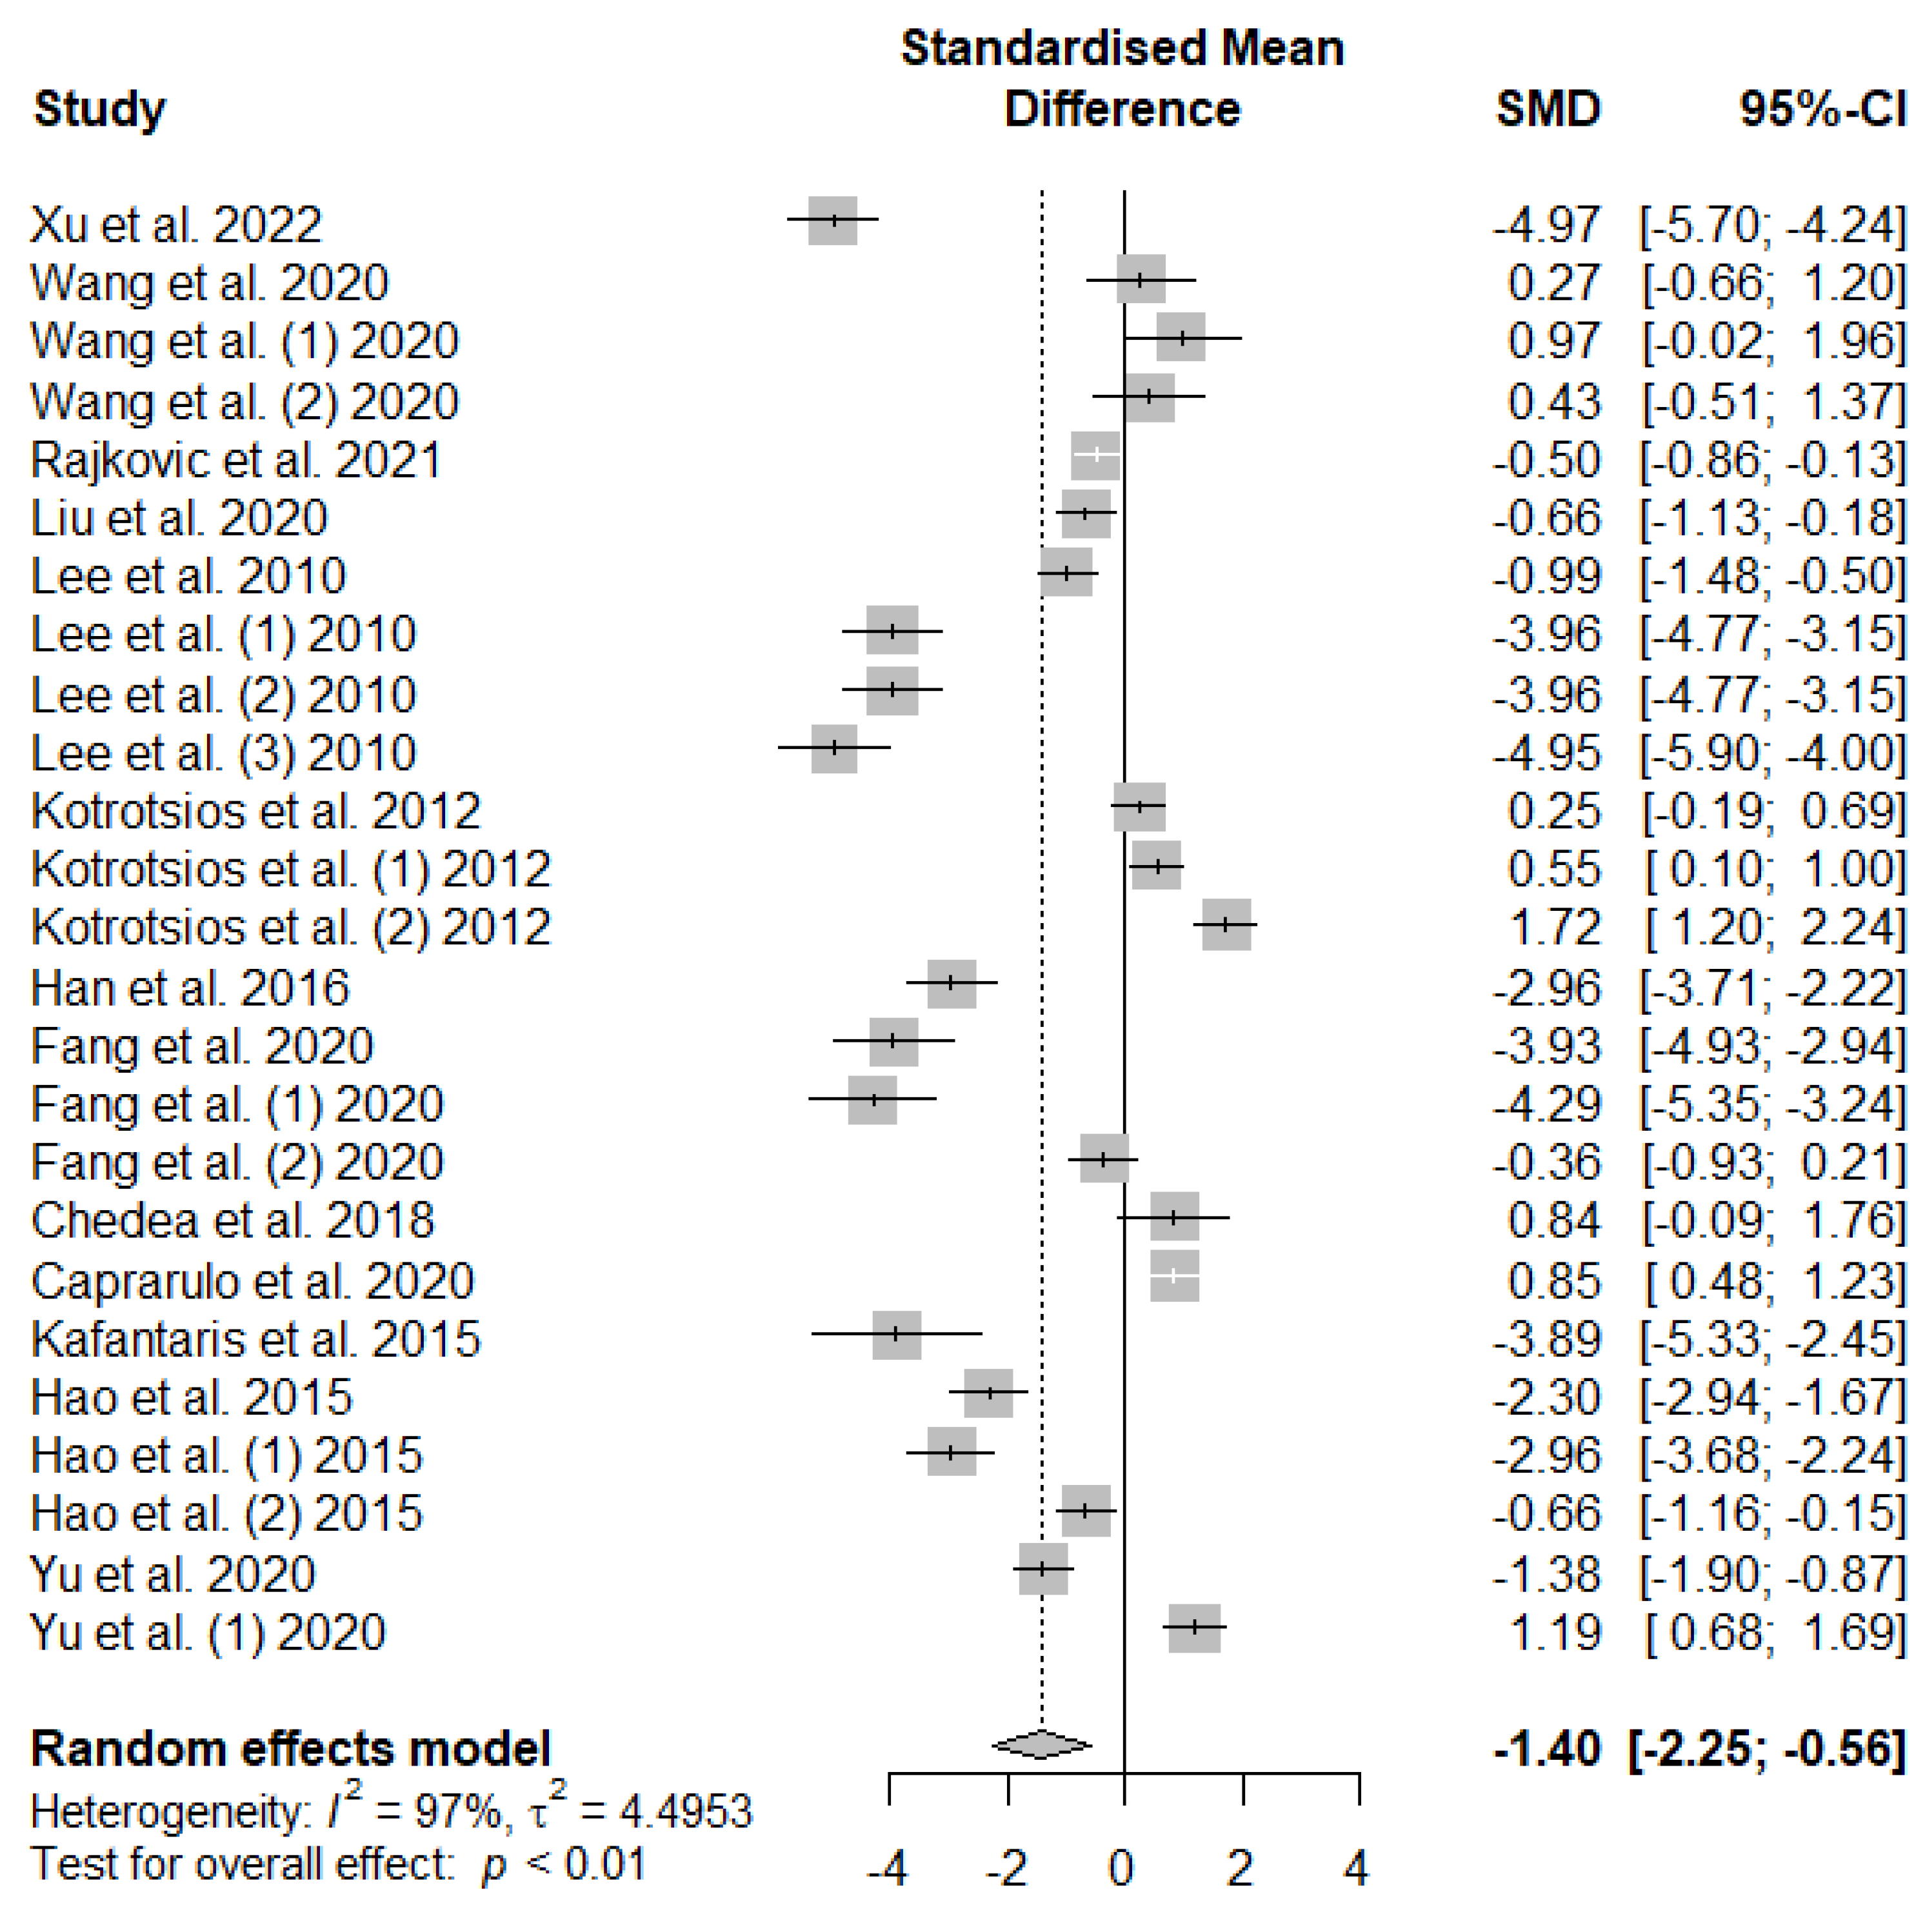
Figure 5 presents the effect of tannin supplementation on the feed conversion ratio (FCR) of weaned piglets. Supplementing the basal diets of weaned piglets with dietary tannins significantly decreased (SMD = -1.40,
PSMD < 0.01,
I2 = 97%), signifying a high (SMD > 0.70) tannins treatment effect.
3.3.2. Serum Antioxidant Parameters
Dietary tannins supplementation effects on weaned piglets’ serum antioxidant indices are summarized using random-effect models of meta-analysis.
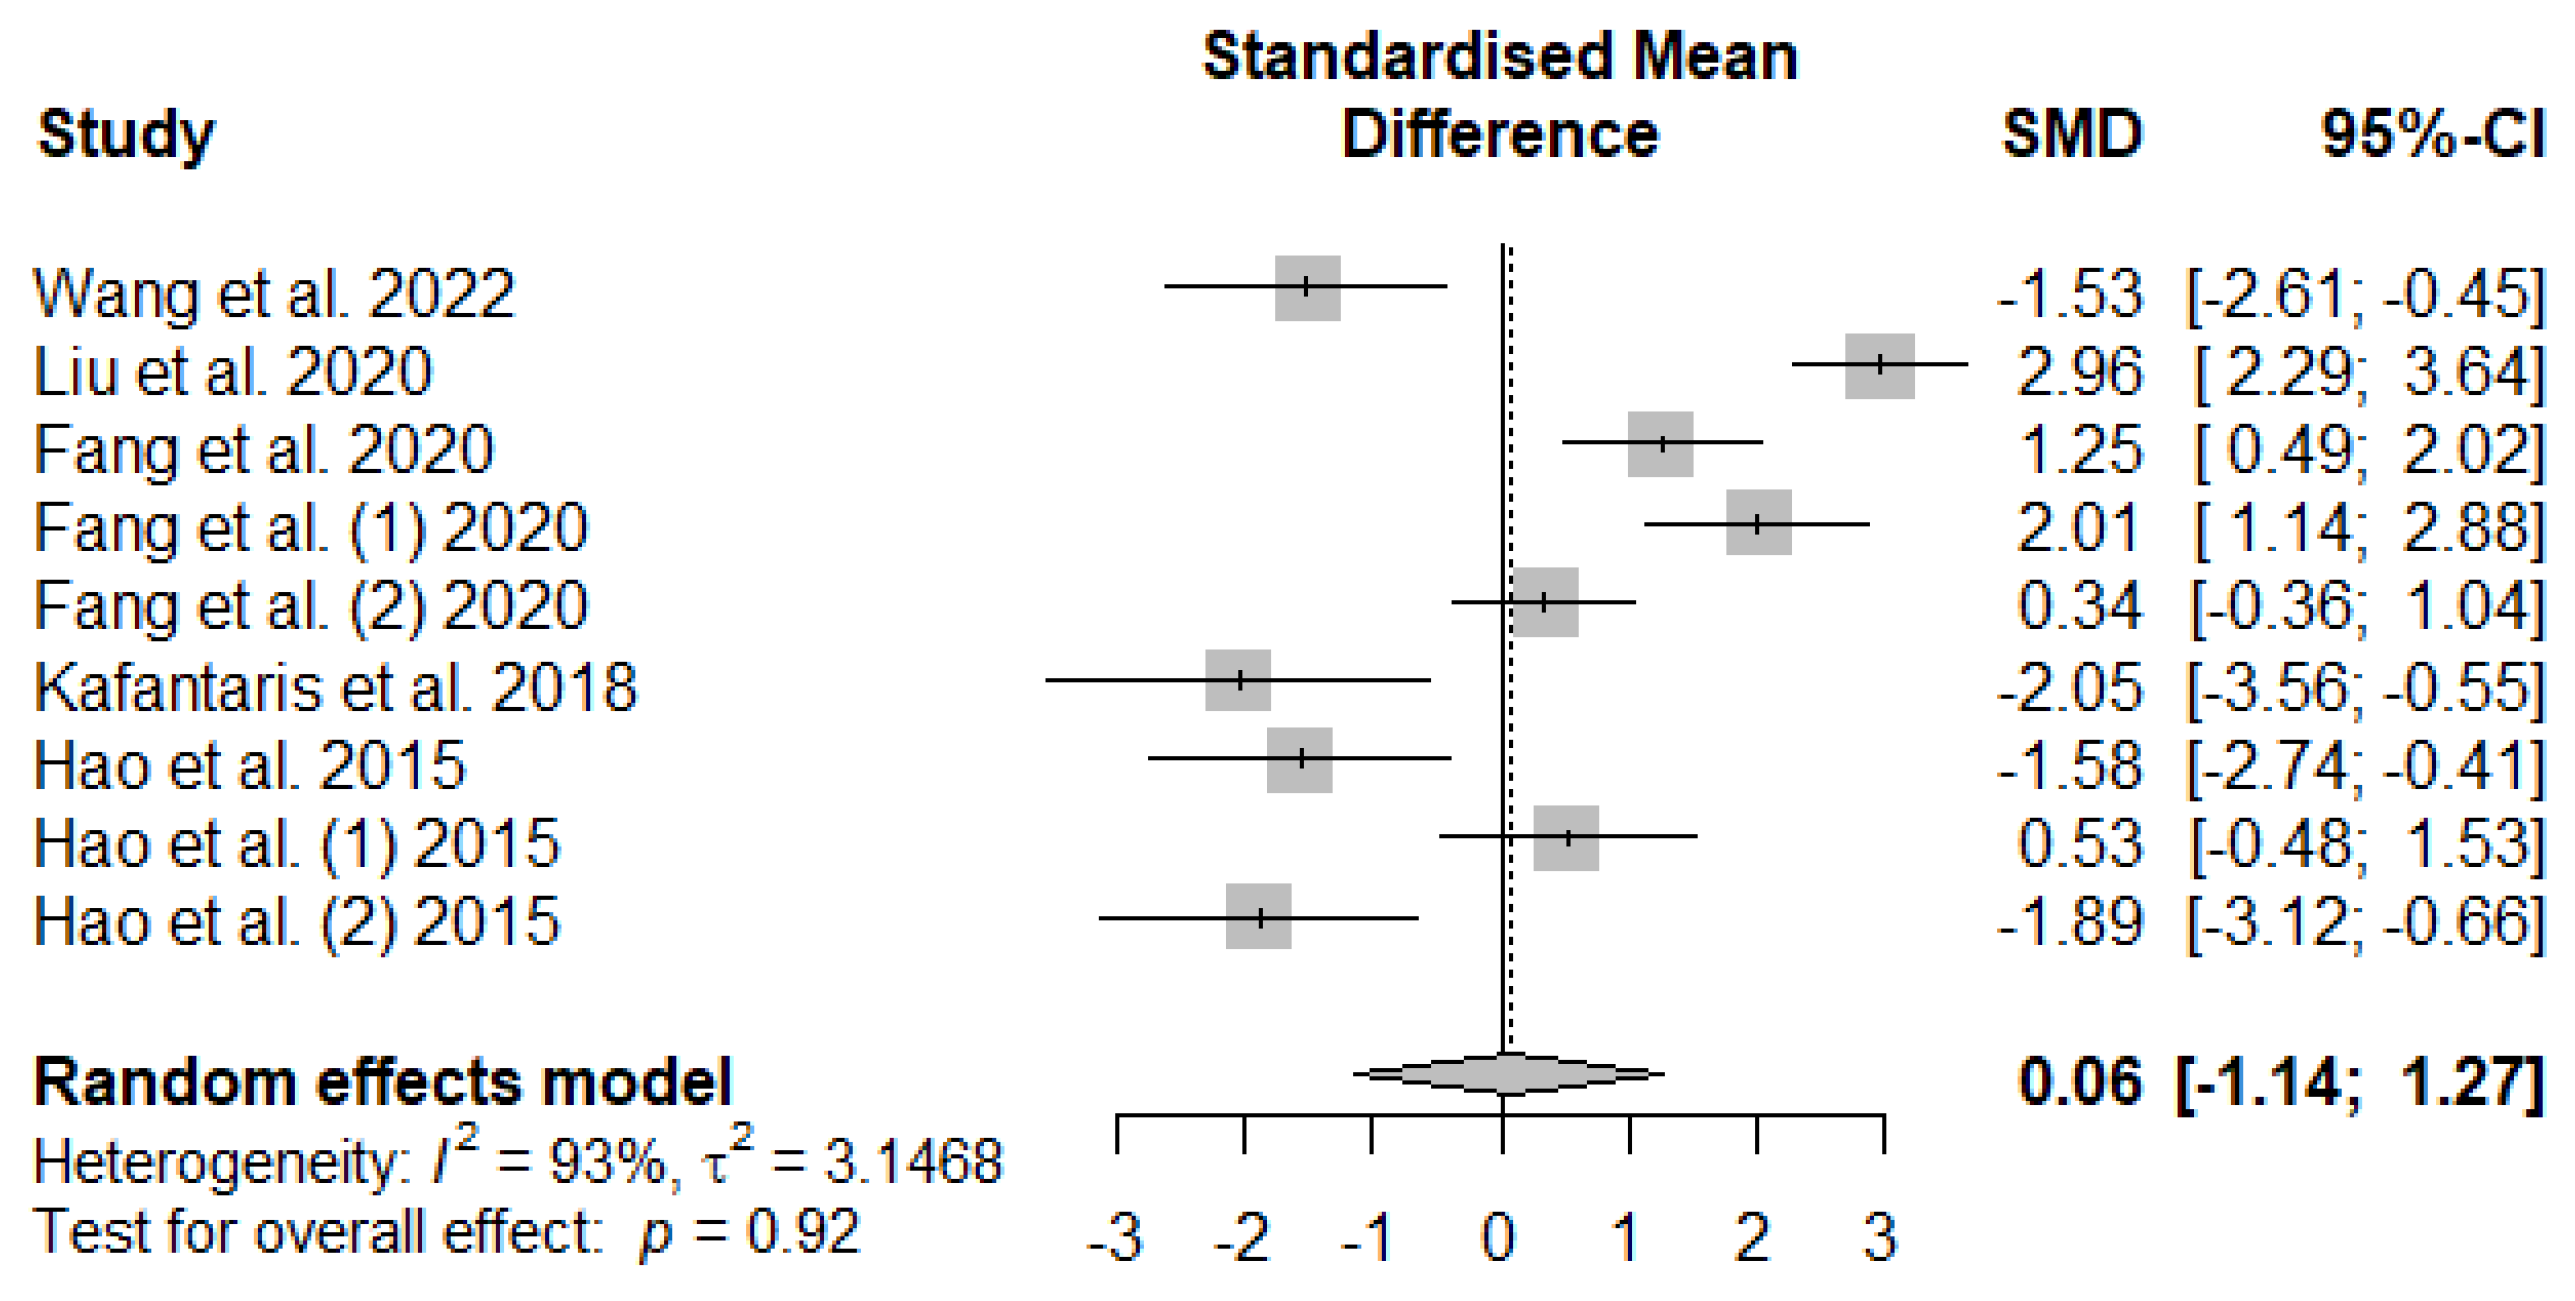
Figure 6 illustrates the summary of the meta-analysis on the impact of tannin supplementation on the serum catalase (CAT) of weaned piglets. There was no significant (
PSMD = 0.92) effect of tannin supplementation on serum CAT.
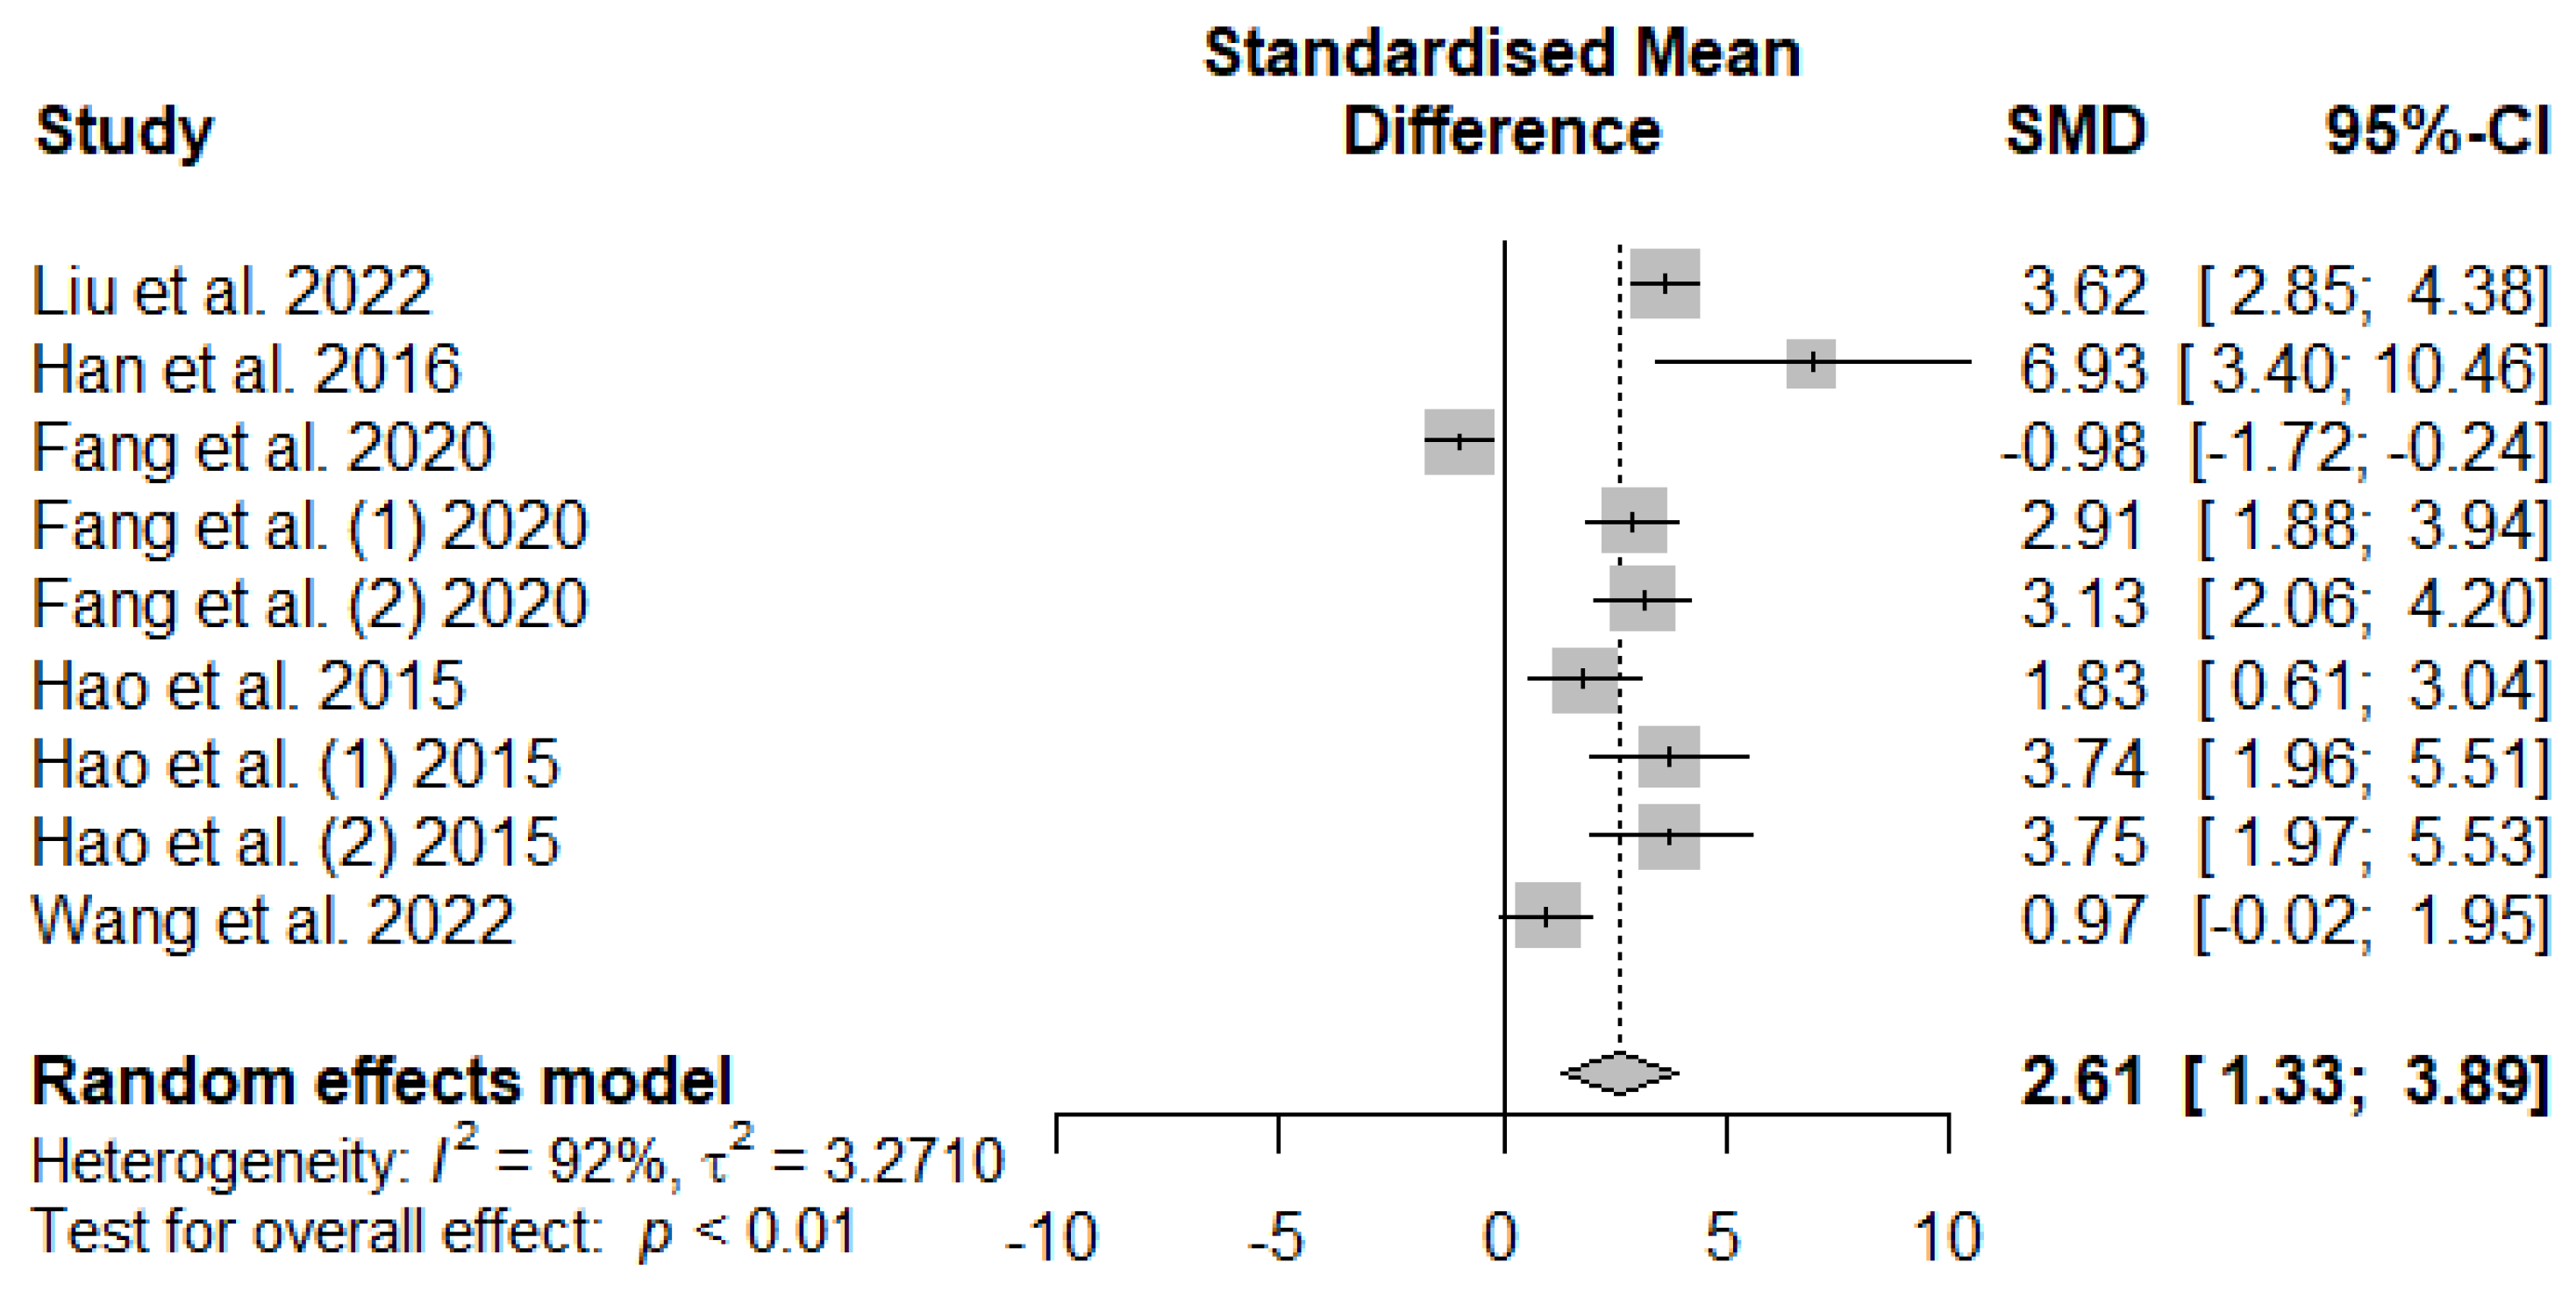
Figure 7 presents the effect of tannin supplementation on weaned piglets' serum superoxide dismutase (SOD). Supplementing the basal diets of weaned piglets with tannins significantly increased (SMD = 2.61,
PSMD < 0.01
, I2 = 92%), suggesting a high (SMD > 0.70) tannins treatment effect.
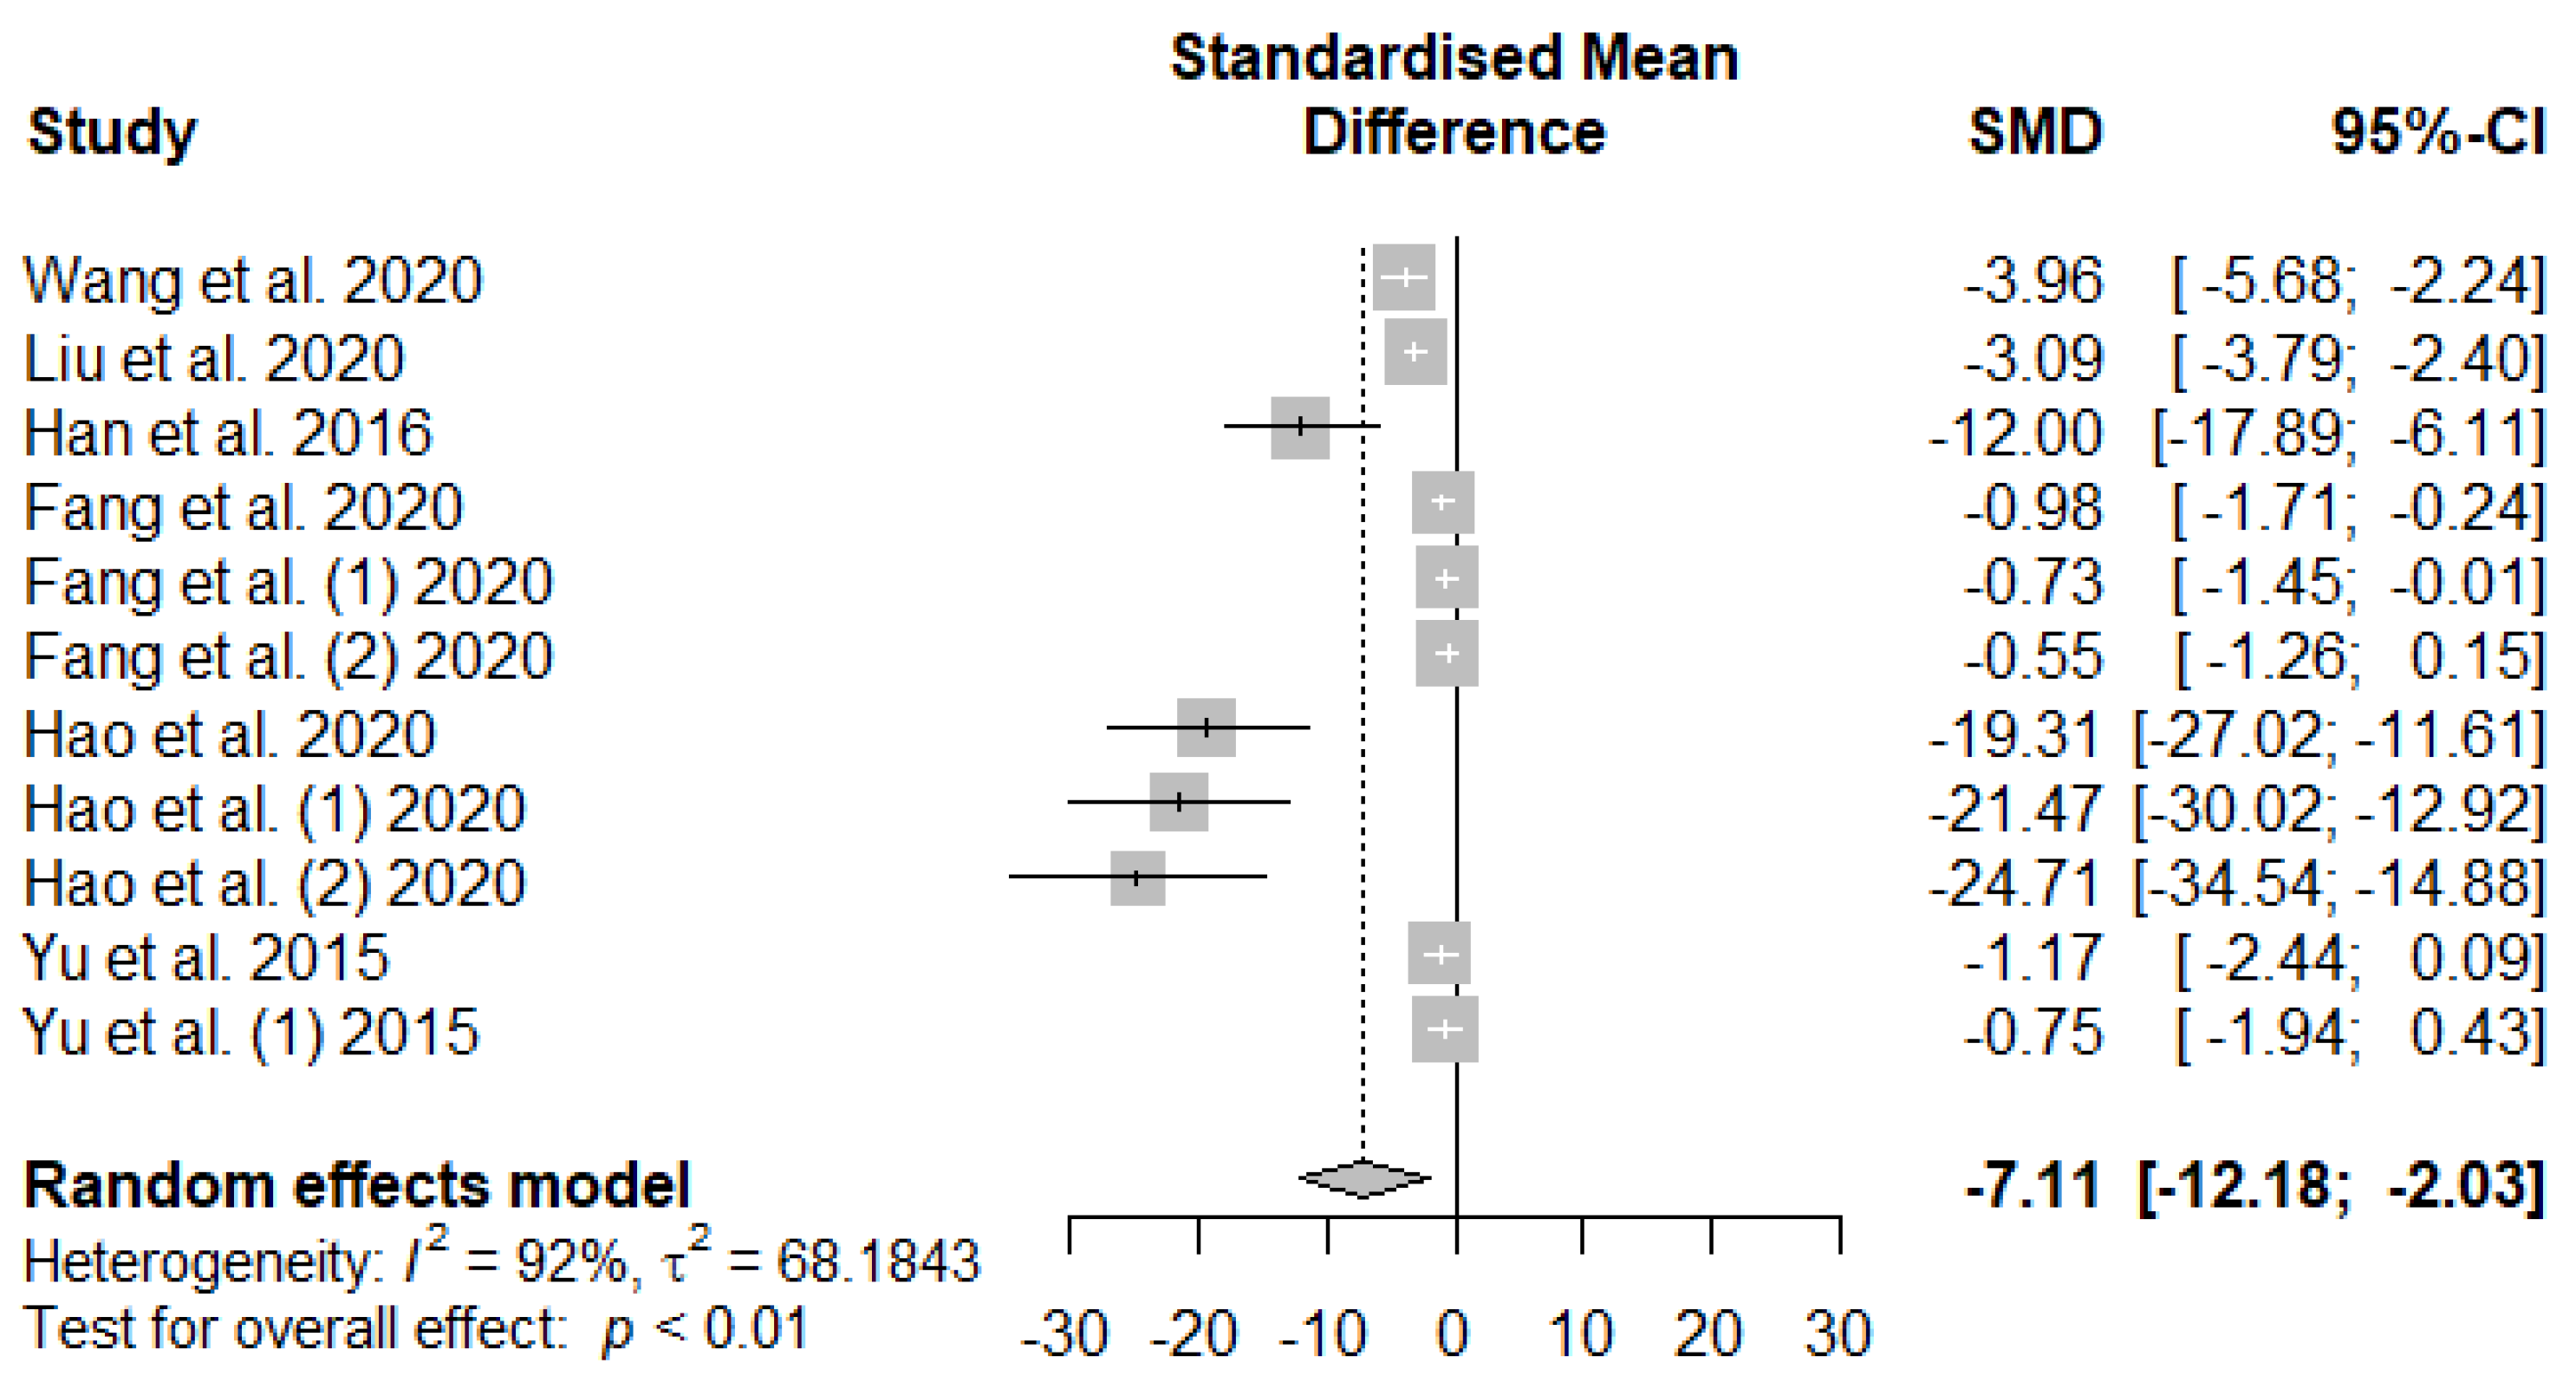
The summary of the meta-analysis on the effects of tannin supplementation on weaned piglets’ serum malondialdehydes (MDA) is shown in
Figure 8. The overall effect of the analysis indicated a significant decreasing impact (SMD = -7.11,
PSMD < 0.01,
I2 = 92%) of tannins when supplemented to the basal diet of weaned piglets. The effect size suggests a high tannin effect (SMD > 0.70) on serum MDA.
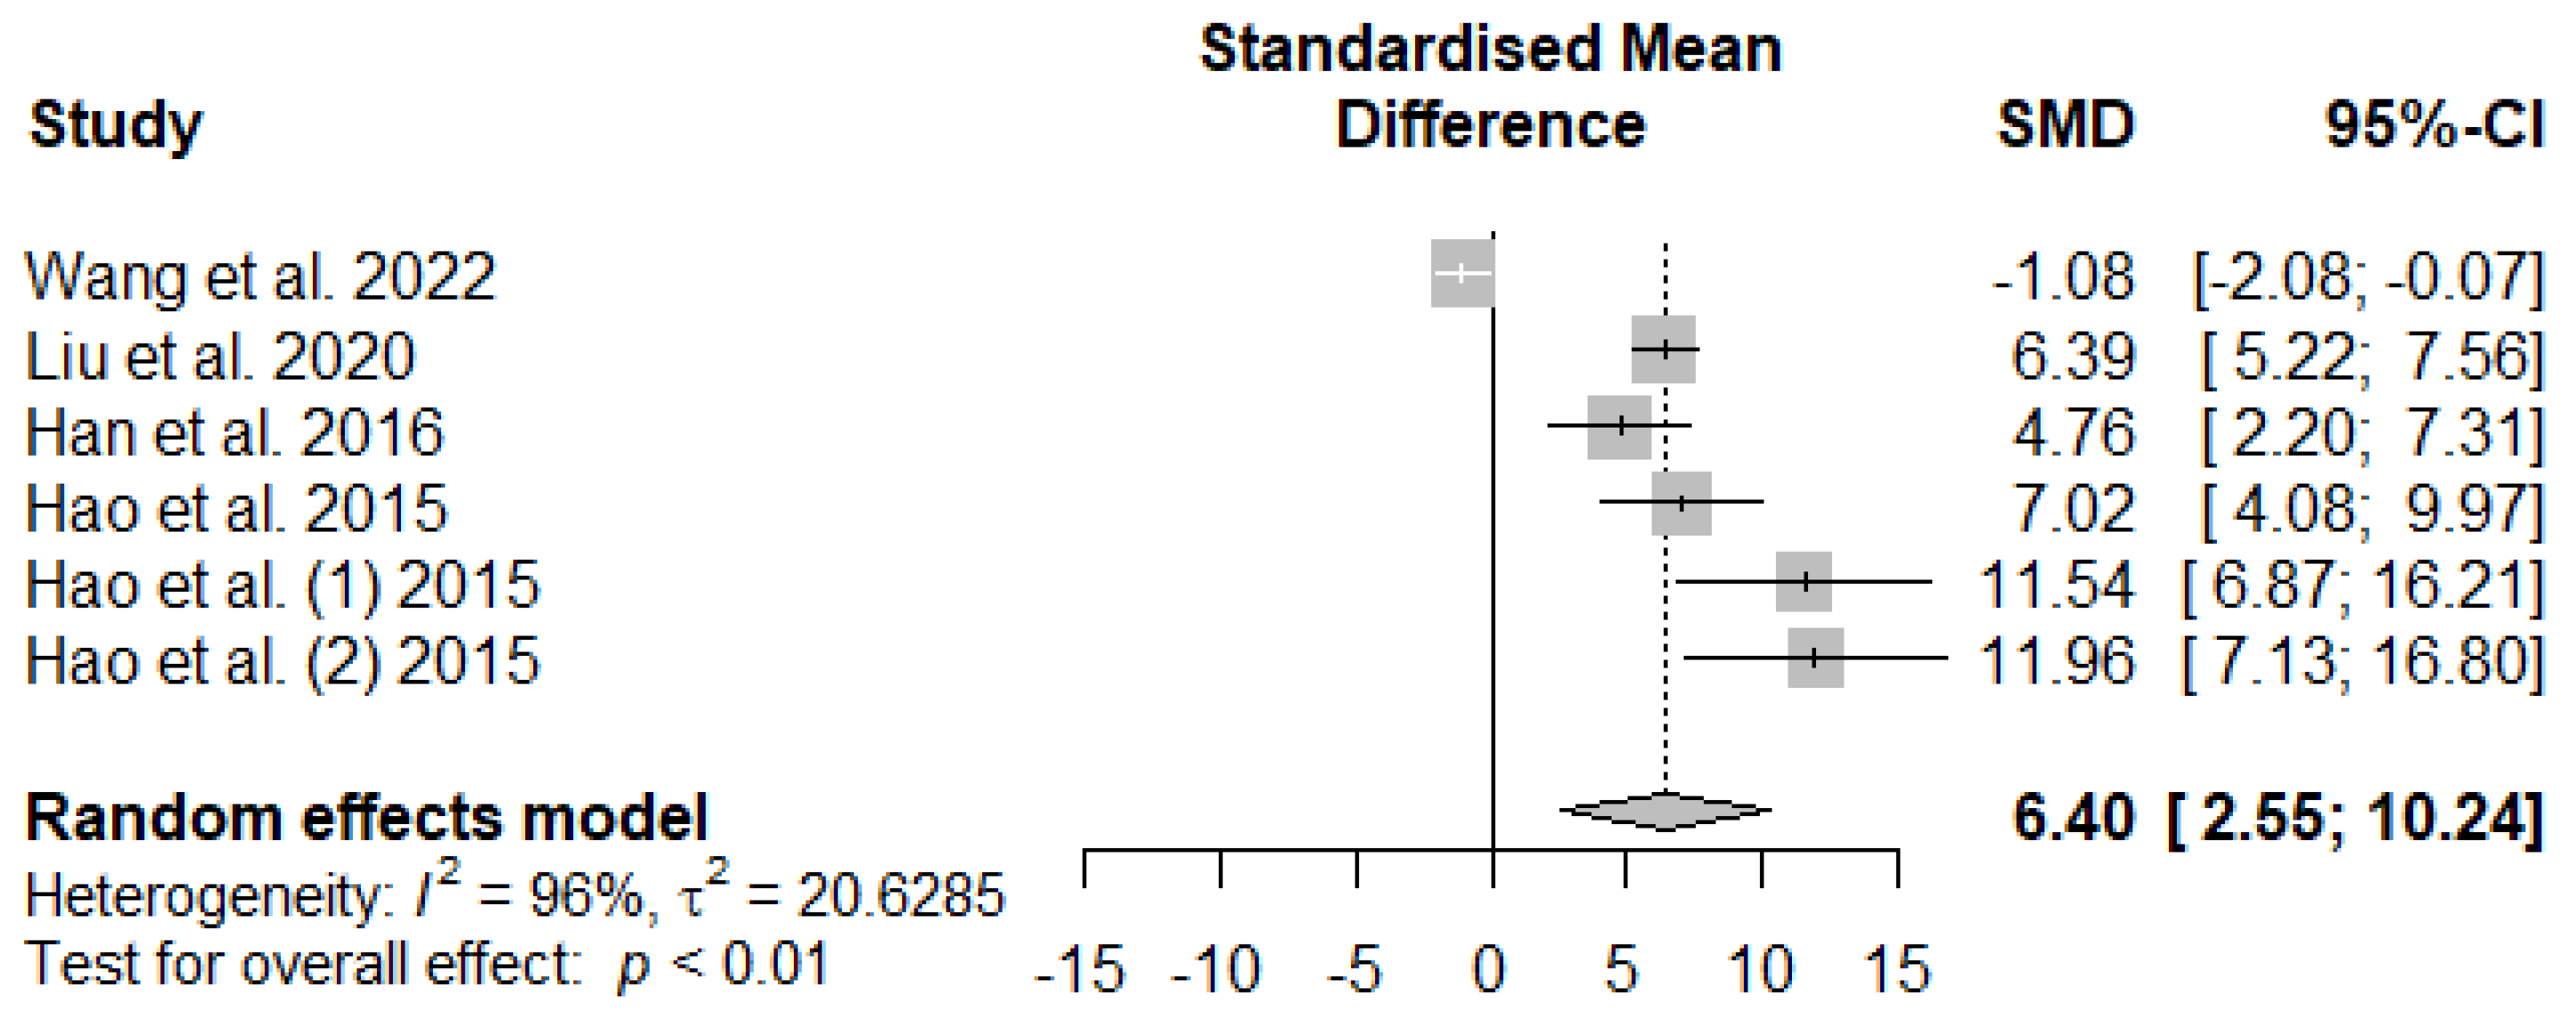
Figure 9 illustrates the summary meta-analysis effects of supplemented tannins on weaned piglets’ serum glutathione peroxidase (GSH-Px). The overall impact of the analysis indicated a significant increase in the effect (SMD = 6.40,
PSMD = 0.01, I2 = 96%) of tannins supplementation. The effect size (SMD > 6.40) reveals that tannins highly affect serum GSH-Px.
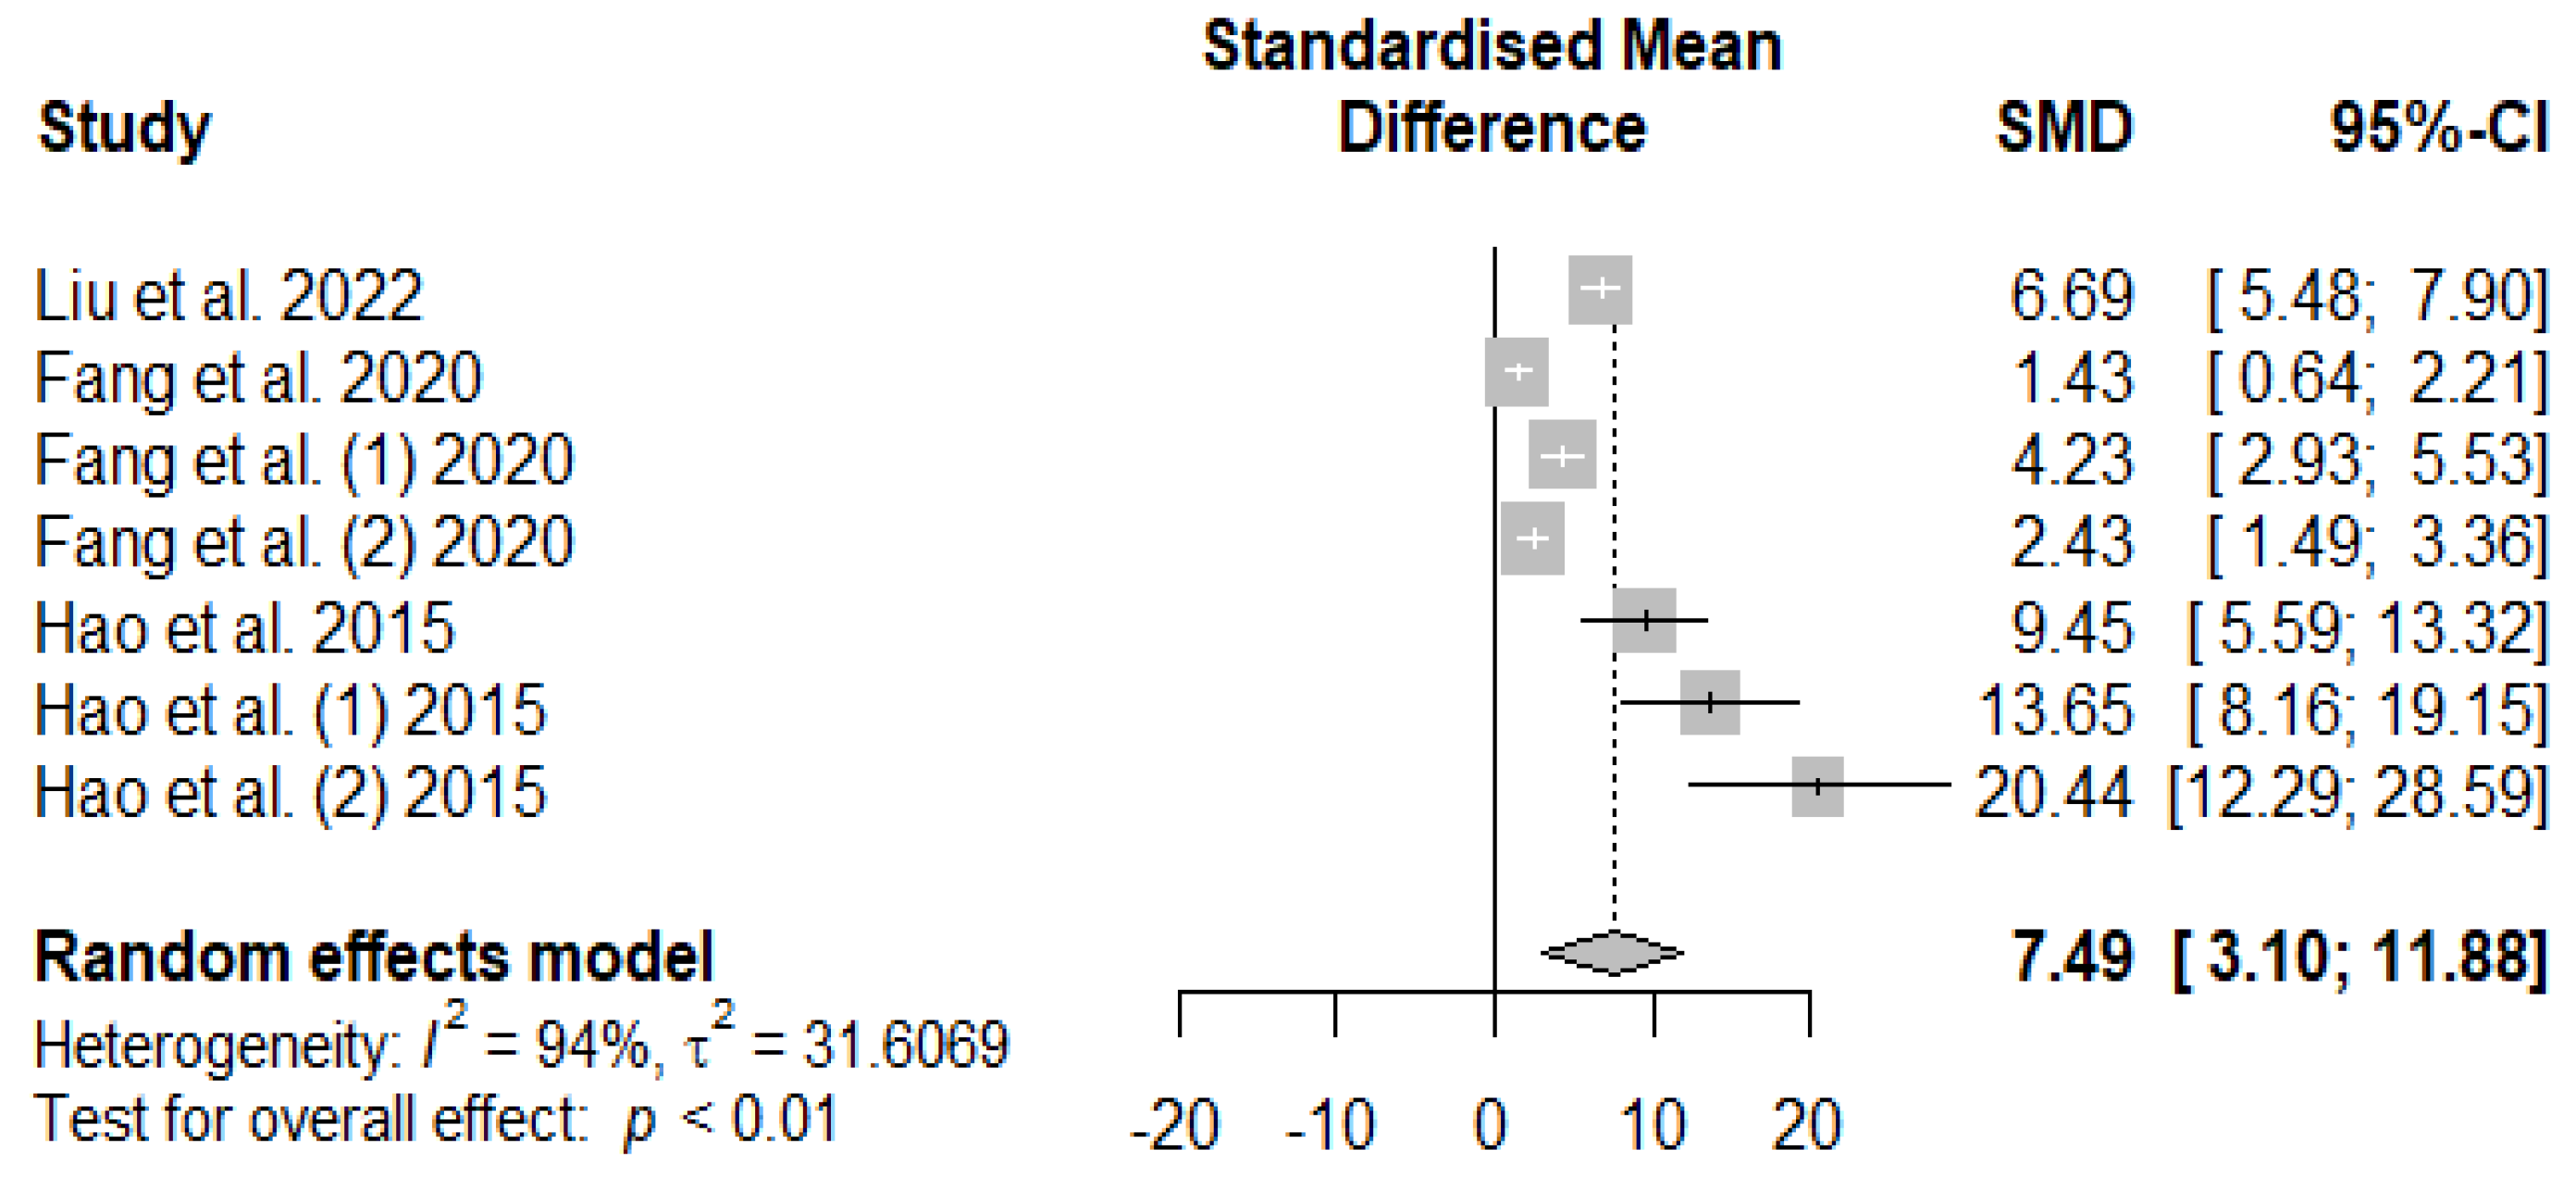
The summary of the meta-analysis on the effects of tannin supplementation on weaned piglets’ serum total antioxidant capacity (T-AOC) is shown in
Figure 10. The overall impact of the analysis revealed a significantly increased effect (SMD = 7.49,
PSMD < 0.01,
I2 = 94%) of tannins when supplemented to the basal diet of weaned piglets. The effect size (SMD > 0.70) can be considered a high tannin effect on serum T-AOC.
3.3.3. Immune Indices
The influence of supplementing tannins on weaned piglets’ serum immune indices is summarized using random-effect models of meta-analysis.
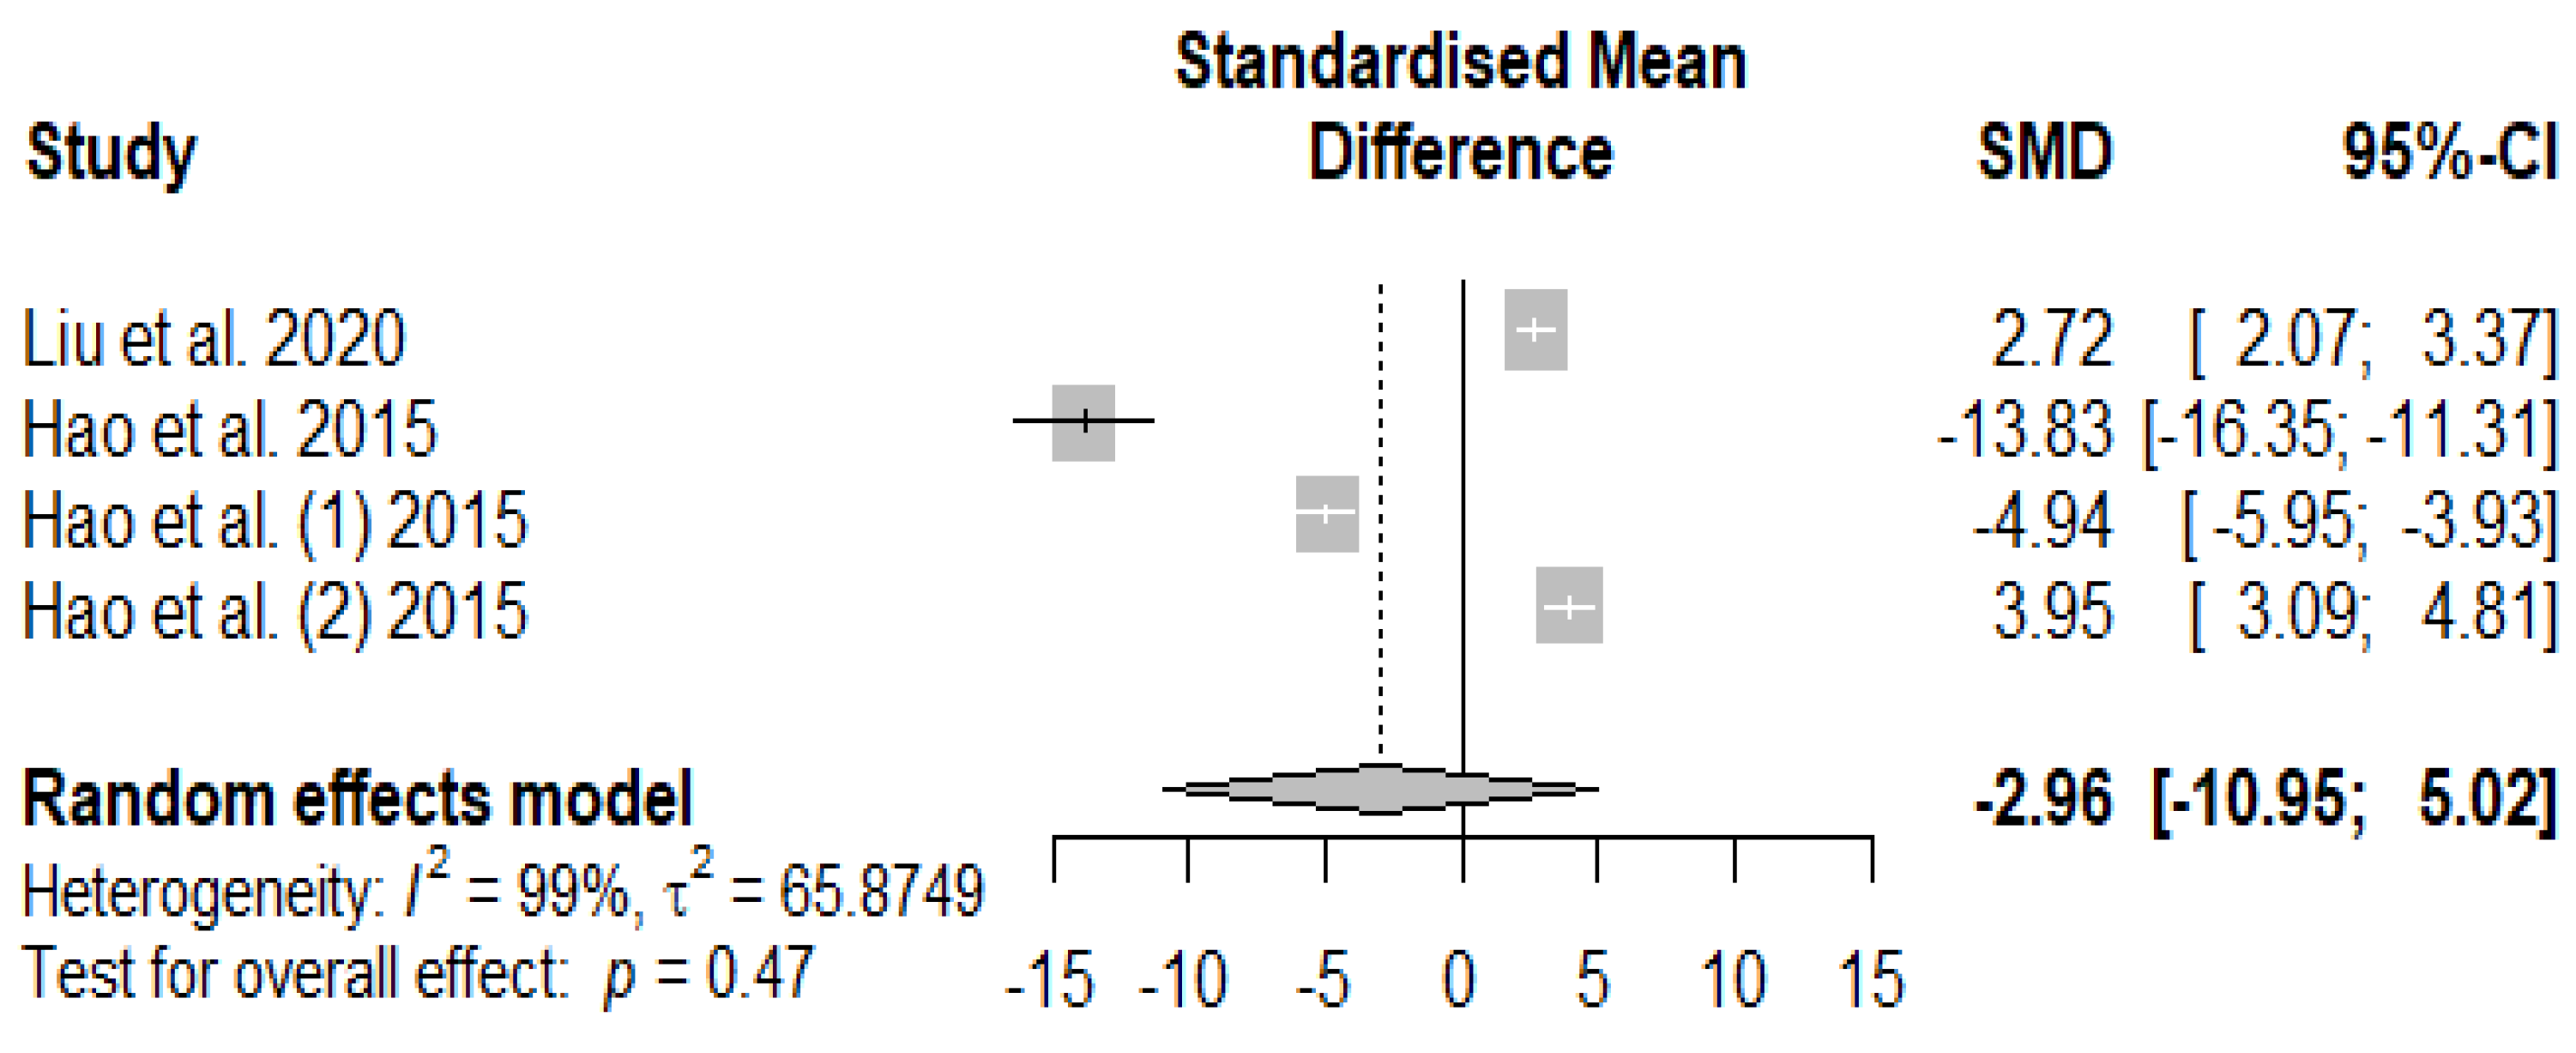
Figure 11 presents the overall effects of supplemented tannins on weaned piglets' immunoglobin A (IgA). A non-significant decreasing effect (
PSMD = -2.96) was observed for IgA.
The summary of the meta-analysis on the effects of tannin supplementation on weaned piglets’ serum immunoglobin M (IgM) is shown in
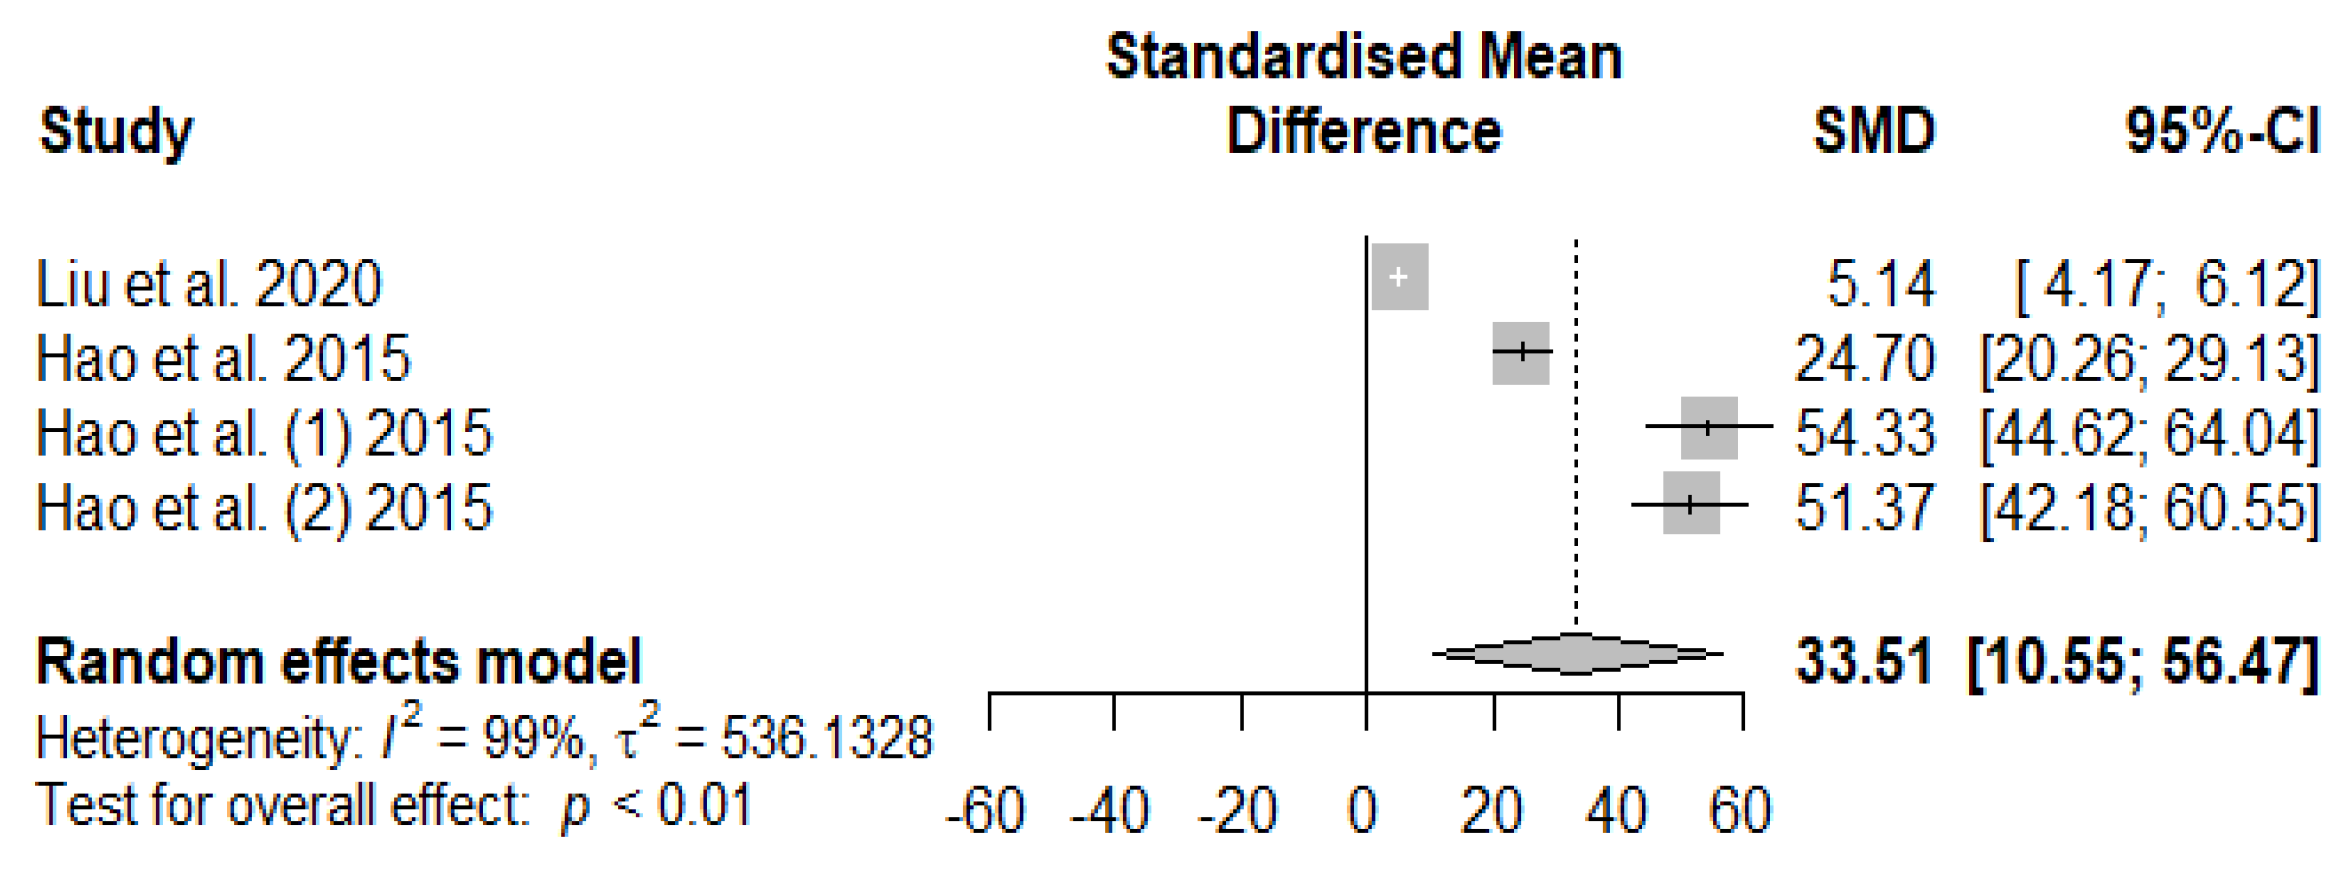
Figure 12. The overall impact of the analysis revealed a significantly increased effect (SMD = 33.51,
PSMD < 0.01,
I2 = 99%) of tannins when supplemented with the basal diet of weaned piglets. The effect size (SMD > 0.70) can be considered a high tannin effect on serum IgM.
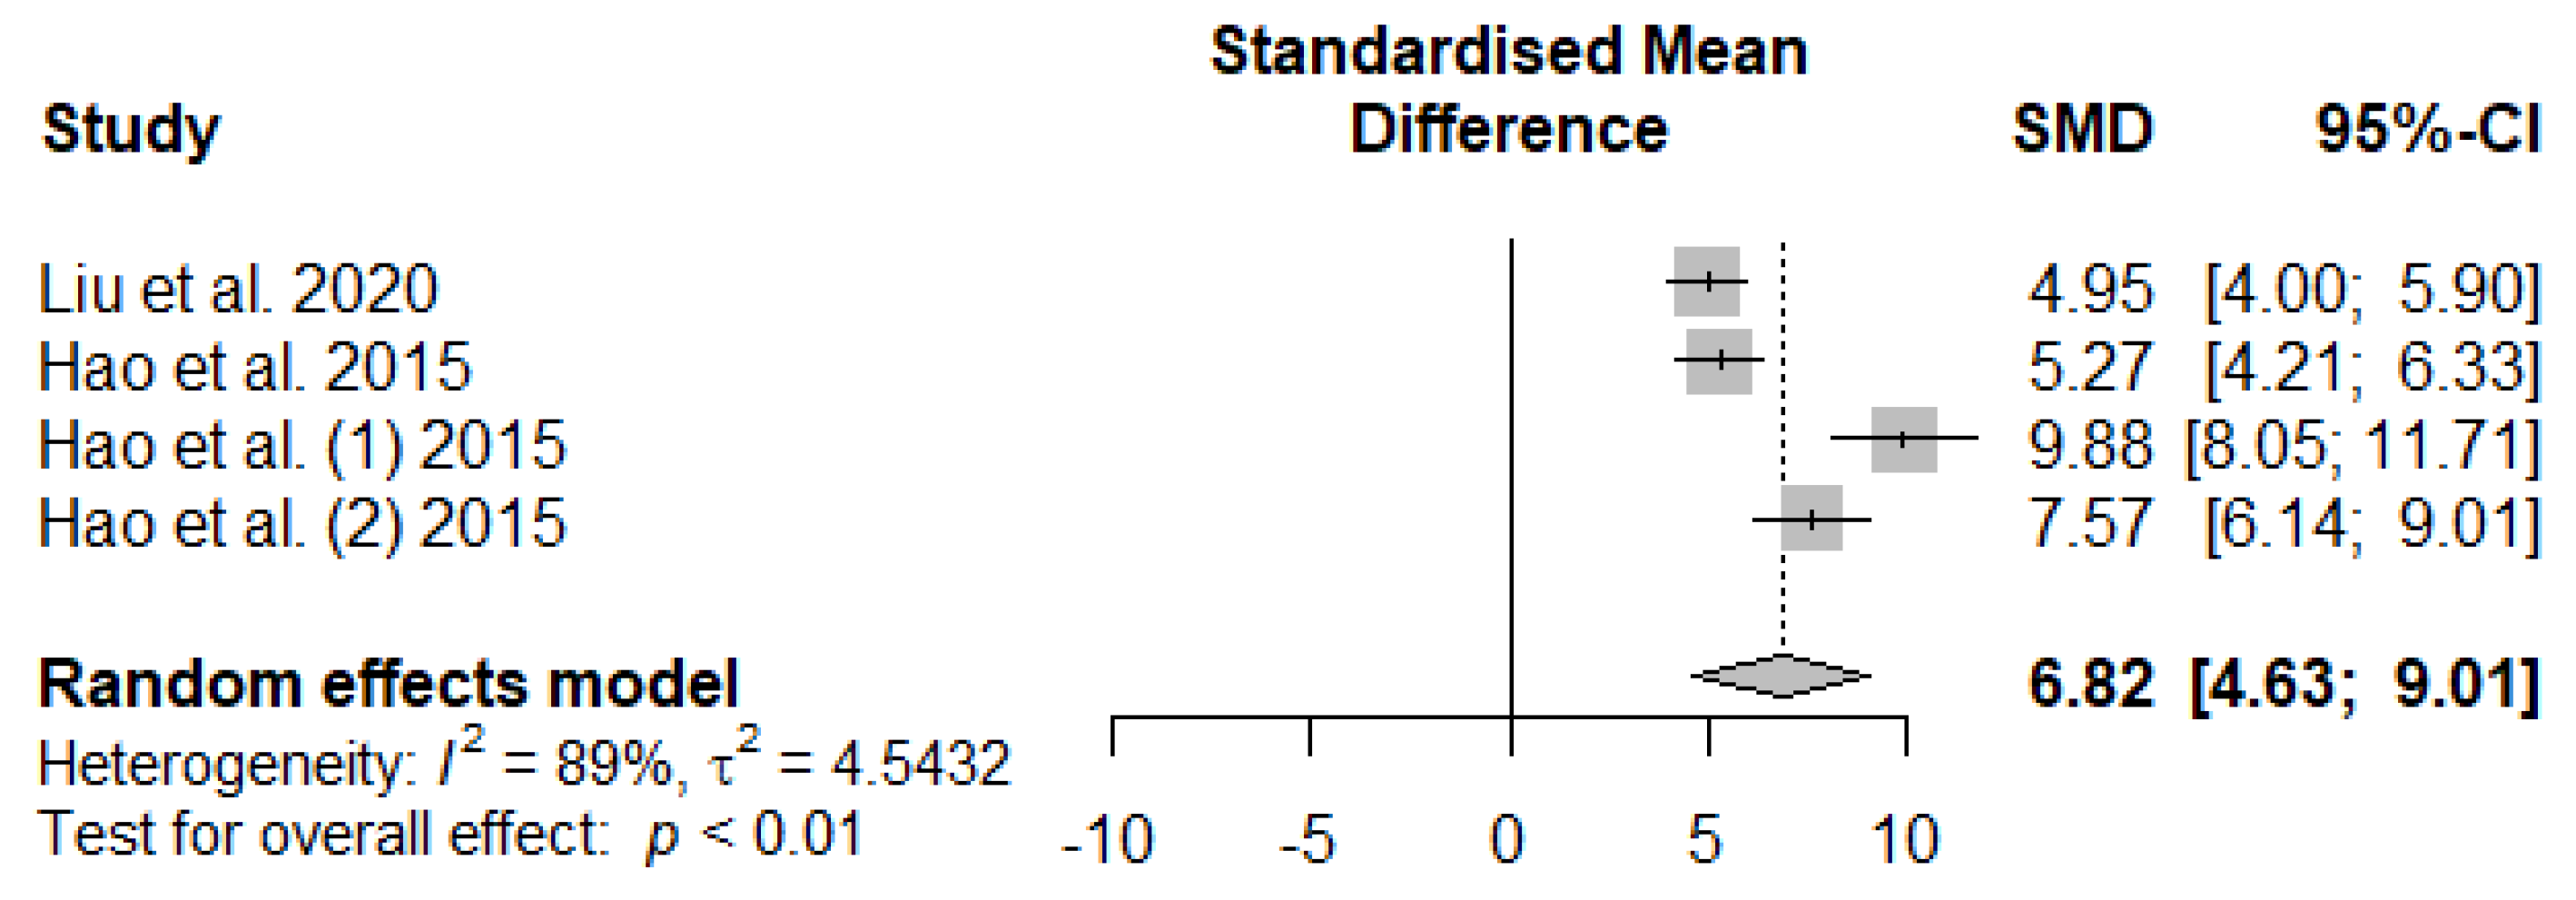
Figure 13 summarizes the meta-analysis on the effects of tannin supplementation on the immunoglobin G (IgG) of weaned piglets. Tannin supplementation significantly increased IgG (SMD = 6.82,
PSMD < 0.01,
I2 = 89%), indicating a high tannin treatment effect (SMD > 0.70).
3.4. Meta-ANOVA and Meta-Regression
3.4.1. Meta-ANOVA (Subgroup Analysis)
Subgroup analysis, also known as moderator analysis, was performed to test the hypothesis that some tannin sources yield higher effects than others (i.e., studies in our meta-analysis do not stem from one overall population), assuming that they fall into different subgroups and each subgroup has its actual overall effect. Although all parameters assessed in our meta-analysis yielded
I2 ≥ 75%, subgroup analysis were only performed for growth performance parameters (
k ≥ 10). Borenstein, et al. [
62], 2015 mention, as a general rule of thumb, that subgroup analysis only makes sense when the meta-analysis contains at least 𝐾 = 10 studies. Table 3 presents the outcome of tannins source subgroup analysis on average daily feed intake (ADFI), average daily gain (ADG), final body weight (FBW), and feed conversion ratio (FCR). Using the value of 𝑄 to determine if the subgroup differences are significant enough not to be explainable by sampling error alone, the observed value of 𝑄 was substantially more significant than the expected one, indicating that there is a significant difference (
p < 0.0001) in the actual effect sizes between subgroups.
Regarding weaned piglets’ ADFI, supplementation of chestnut, grape extract, grape seed proanthocyanidins (GSP), grape pomace, and gallnut tannic acid had a positive effect, with chestnut recording the highest increasing effect (SMD = 2.9020) follow by grape extract (SMD = 1.3074) and grape seed proanthocyanidins (SMD = 0.8966) respectively. Conversely, the gallnut microencapsulated tannic acids (SMD = -0.5921) and chestnut and quebracho blend (SMD = -1.1924) adversely affected ADFI. Similarly, weaned piglets’ ADG increased when tannins were sourced from chestnut (SMD = 6.4894), grape extract (SMD = 1.0764), grape seed proanthocyanidins (SMD = 1.6444), grape pomace (SMD = 2.6567), quebracho (SMD = 6.0871) and gallnut tannic acid (SMD = 0.6481). Chestnut again registered the optimum increasing effect on ADG. In contrast, ADG was decreased by gallnut microencapsulated tannic acid and chestnut and quebracho blend (Table 3), with GMTA having a considerable influence. The final body weight increased in weaned piglets supplemented with grape pomace (SMD = 5.5956), grape extract (SMD = 1.9873), chestnut (SMD = 1.7184), GSP (SMD = 0.9624), carob pods (SMD = 0.7726), gallnut tannic acid (SMD = 0.4981), and quebracho (SMD = 0.0868), but depressed when chestnut and quebracho blend (SMD = -0.3416) and GMTA (SMD = -0.2500) were supplemented. Unlike in ADFI, ADG, and FBW, the source of the tannins showed an opposite trend in piglets’ feed conversion ratio (FCR). Piglets’ FCR decreased with supplementation of chestnut (SMD = -2.8044), GSP (SMD = -2.4528), GMTA (SMD = -1.7433), grape pomace (SMD = -1.4908), grape extract (-0.4968), and gallnut tannic acid (SMD = -0.0982), but increased with chestnut and quebracho blend (SMD = 0.8517) and carob pods (SMD = 0.8295). Although very high heterogeneities (75% ≤I2 ≤100%) were detected among the growth outcomes in our global studies (meta-analysis), it was revealed from the subgroup analysis that the chestnut subgroup contributed the most to the heterogeneity.
Table 2.
Meta-ANOVA of the association between tannins source and growth-measured outcomes.
Table 2.
Meta-ANOVA of the association between tannins source and growth-measured outcomes.
| Variable |
Random effect model |
Heterogeneity |
| |
|
|
95% CI |
|
|
|
|
|
|
p-value |
| |
k |
SMD |
Lower |
Upper |
I2
|
τ2
|
τ |
Q |
df |
|
| ADFI, g/day |
|
|
|
|
|
|
|
|
|
|
| Chestnut (Ch) |
5 |
2.9020 |
-0.7572 |
6.5612 |
97.6 |
17.1981 |
4.1471 |
90.69 |
6 |
< 0.0001 |
| GMTA |
7 |
-0.5921 |
-1.7603 |
0.5761 |
94.3 |
2.3387 |
1.5293 |
|
|
|
| Grape extract |
1 |
1.3074 |
0.9121 |
1.7027 |
-- |
-- |
-- |
|
|
|
| GSP |
7 |
0.8966 |
-0.0135 |
1.8067 |
93.8 |
1.4162 |
1.1901 |
|
|
|
| Grape pomace |
2 |
1.7150 |
-0.0379 |
3.4680 |
81.2 |
1.3052 |
1.1425 |
|
|
|
| Ch/Qu |
1 |
-1.1924 |
-1.5816 |
-0.8031 |
-- |
-- |
-- |
|
|
|
| Gallnut tannic acid |
2 |
0.7042 |
0.0700 |
1.3383 |
71.3 |
0.1494 |
0.3866 |
|
|
|
| ADG, g/day |
|
|
|
|
|
|
|
|
|
|
| Chestnut |
5 |
6.4894 |
-3.6569 |
16.6357 |
98.2 |
133.1920 |
11.5409 |
140.33 |
7 |
< 0.0001 |
| GMTA |
7 |
-22.5090 |
-32.1307 |
-12.8873 |
96.8 |
162.8086 |
12.7596 |
|
|
|
| Grape extract |
1 |
1.0764 |
0.6928 |
1.4601 |
-- |
-- |
-- |
|
|
|
| Quebracho (Qu) |
2 |
6.0871 |
4.2437 |
7.9306 |
0.0 |
0 |
0 |
|
|
|
| GSP |
7 |
1.6444 |
0.5049 |
2.7839 |
94.7 |
2.2453 |
1.4984 |
|
|
|
| Grape pomace |
2 |
2.6567 |
-0.3419 |
5.6553 |
90.9 |
4.2610 |
2.0642 |
|
|
|
| Ch/Qu |
1 |
-1.1924 |
-1.5816 |
-0.8031 |
-- |
-- |
-- |
|
|
|
| Gallnut tannic acid |
2 |
0.6481 |
-0.8556 |
2.1518 |
94.6 |
1.1142 |
1.0556 |
|
|
|
| Final Body Weight, Kg |
|
|
|
|
|
|
|
|
|
|
| Chestnut |
5 |
1.7184 |
-0.0760 |
3.5128 |
96.6 |
4.0292 |
2.0073 |
77.54 |
8 |
< 0.0001 |
| GMTA |
3 |
-0.2500 |
-0.7892 |
0.2892 |
0.0 |
0 |
0 |
|
|
|
| Grape extract |
1 |
1.9873 |
1.5476 |
2.4269 |
-- |
-- |
-- |
|
|
|
| Quebracho |
2 |
0.0868 |
-0.6090 |
0.7826 |
0.0 |
0 |
0 |
|
|
|
| Carob pods |
3 |
0.7726 |
-1.1539 |
2.6992 |
97.6 |
2.8320 |
1.6829 |
|
|
|
| GSP |
6 |
0.9624 |
-0.1213 |
2.0461 |
94.2 |
1.7380 |
1.3183 |
|
|
|
| Grape pomace |
2 |
5.5956 |
-2.2497 |
13.4409 |
95.6 |
30.6831 |
5.5392 |
|
|
|
| Ch/Qu |
1 |
-0.3416 |
-0.7021 |
0.0190 |
-- |
-- |
-- |
|
|
|
| Gallnut tannic acid |
2 |
0.4981 |
-0.4853 |
1.4816 |
88.2 |
0.4443 |
0.6666 |
|
|
|
| FCR |
|
|
|
|
|
|
|
|
|
|
| Chestnut |
2 |
-2.8044 |
-7.0268 |
1.4179 |
98.9 |
9.1831 |
3.0304 |
54.46 |
7 |
< 0.0001 |
| GMTA |
7 |
-1.7433 |
-3.5702 |
0.0836 |
96.6 |
5.8898 |
2.4269 |
|
|
|
| Grape extract |
1 |
-0.4968 |
-0.8603 |
-0.1333 |
-- |
-- |
-- |
|
|
|
| Carob pods |
3 |
0.8295 |
-0.0430 |
1.7020 |
89.7 |
0.5374 |
0.7331 |
|
|
|
| GSP |
7 |
-2.4528 |
-3.5728 |
-1.3328 |
94.3 |
2.1331 |
1.4605 |
|
|
|
| Grape pomace |
2 |
-1.4908 |
-6.1186 |
3.1371 |
96.6 |
10.7723 |
3.2821 |
|
|
|
| Ch/Qu |
1 |
0.8517 |
0.4775 |
1.2259 |
-- |
-- |
-- |
|
|
|
| Gallnut tannic acid |
2 |
-0.0982 |
-2.6187 |
2.4223 |
98.0 |
3.2399 |
1.8000 |
|
|
|
3.4.2. Meta-Regression
Like the subgroup analysis, meta-regression analysis was only performed for growth-measured outcomes (k ≥ 10). Borenstein
, et al. [
62] mention that this guideline may also be applied to meta-regression models but should not be considered an iron-clad rule. Therefore, the present meta-analysis only applied meta-regression to GMTA, GSP, chestnut, and carob pods. To investigate what caused the patterns of heterogeneity in our data, three meta-regressions with tannins source dosage, supplementation duration, and piglets’ age as predictors were performed. Tannins source dosage effects on piglets’ growth performance parameters are displayed in
Table 3. The results of the meta-regression models indicated a non-significant (
p > 0.05) tannins source effect for ADG, FBW, and FCR except for grape seed proanthocyanidins, which significantly decreased ADFI (Estimate = -0.0118, TM = 4.7277,
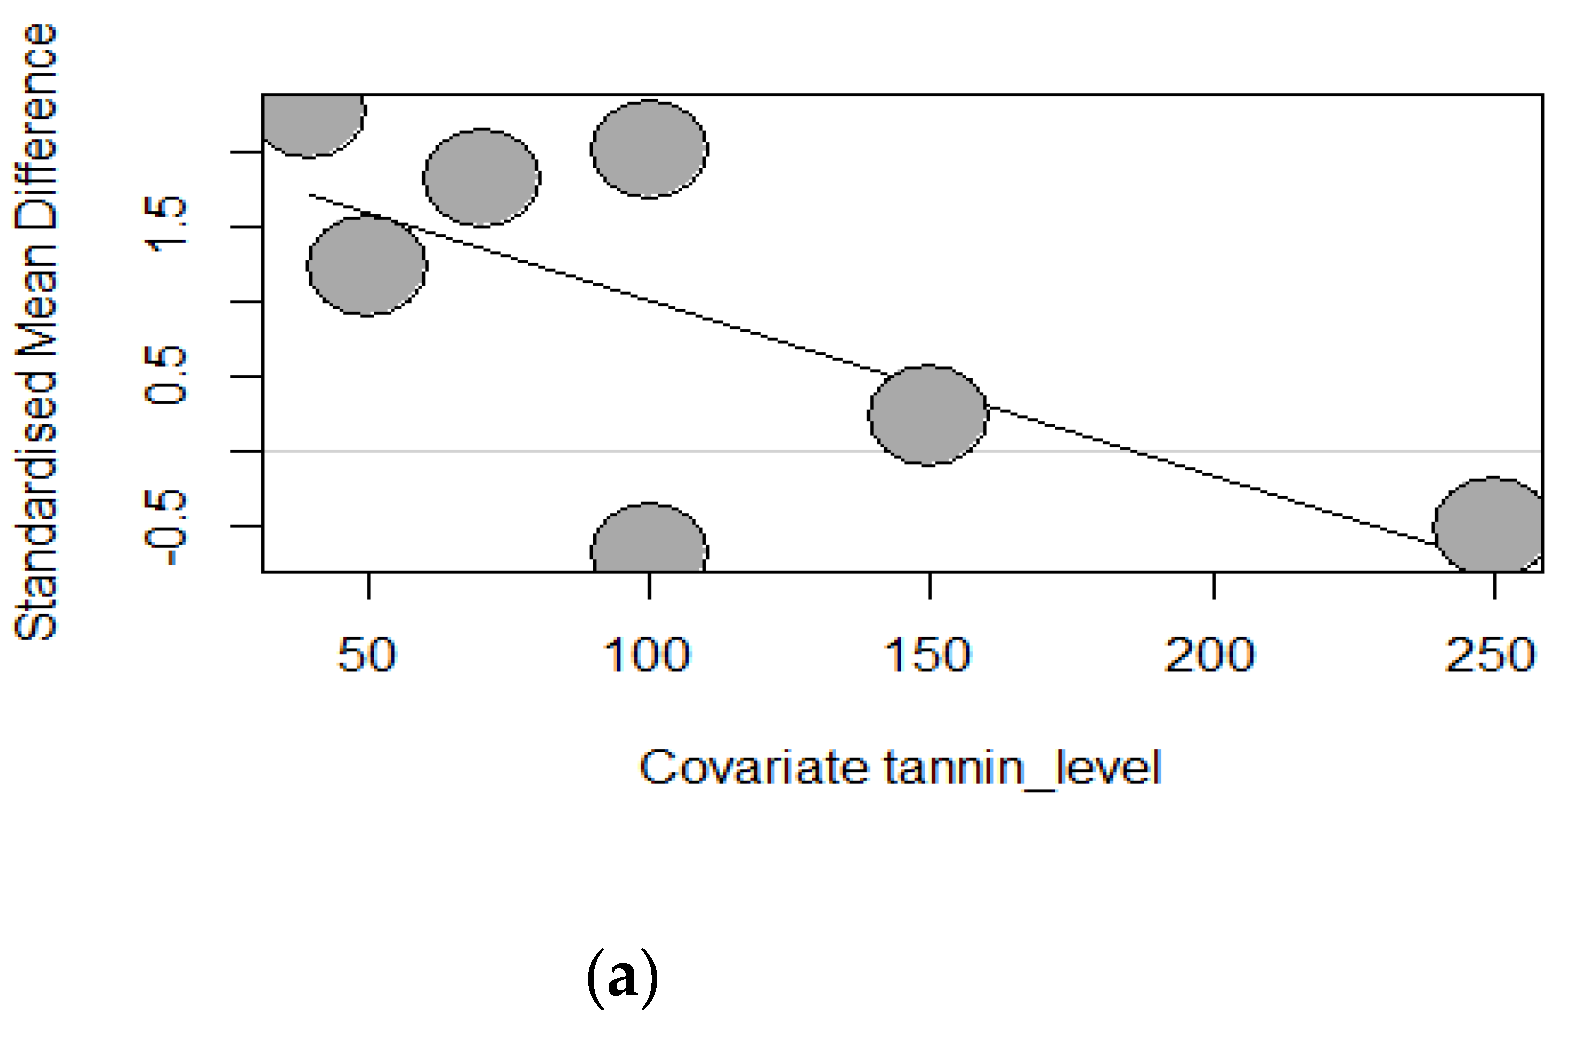
p = 0.0297). The dosage of GSP supplementation explained 40.74% of the observed heterogeneity for ADFI. This observation is highlighted by the bubble plot (
Figure 14), showing a significant negative impact of GSP due to its increasing dosage (40-250 mg/kg).
Table 4 presents the meta-regression of tannins source supplementation duration effects on the growth performance of weaned piglets. Except for ADFI, significant correlation results were found for ADG (
p < 0.0001), FBW (
p < 0.0001), and FCR (
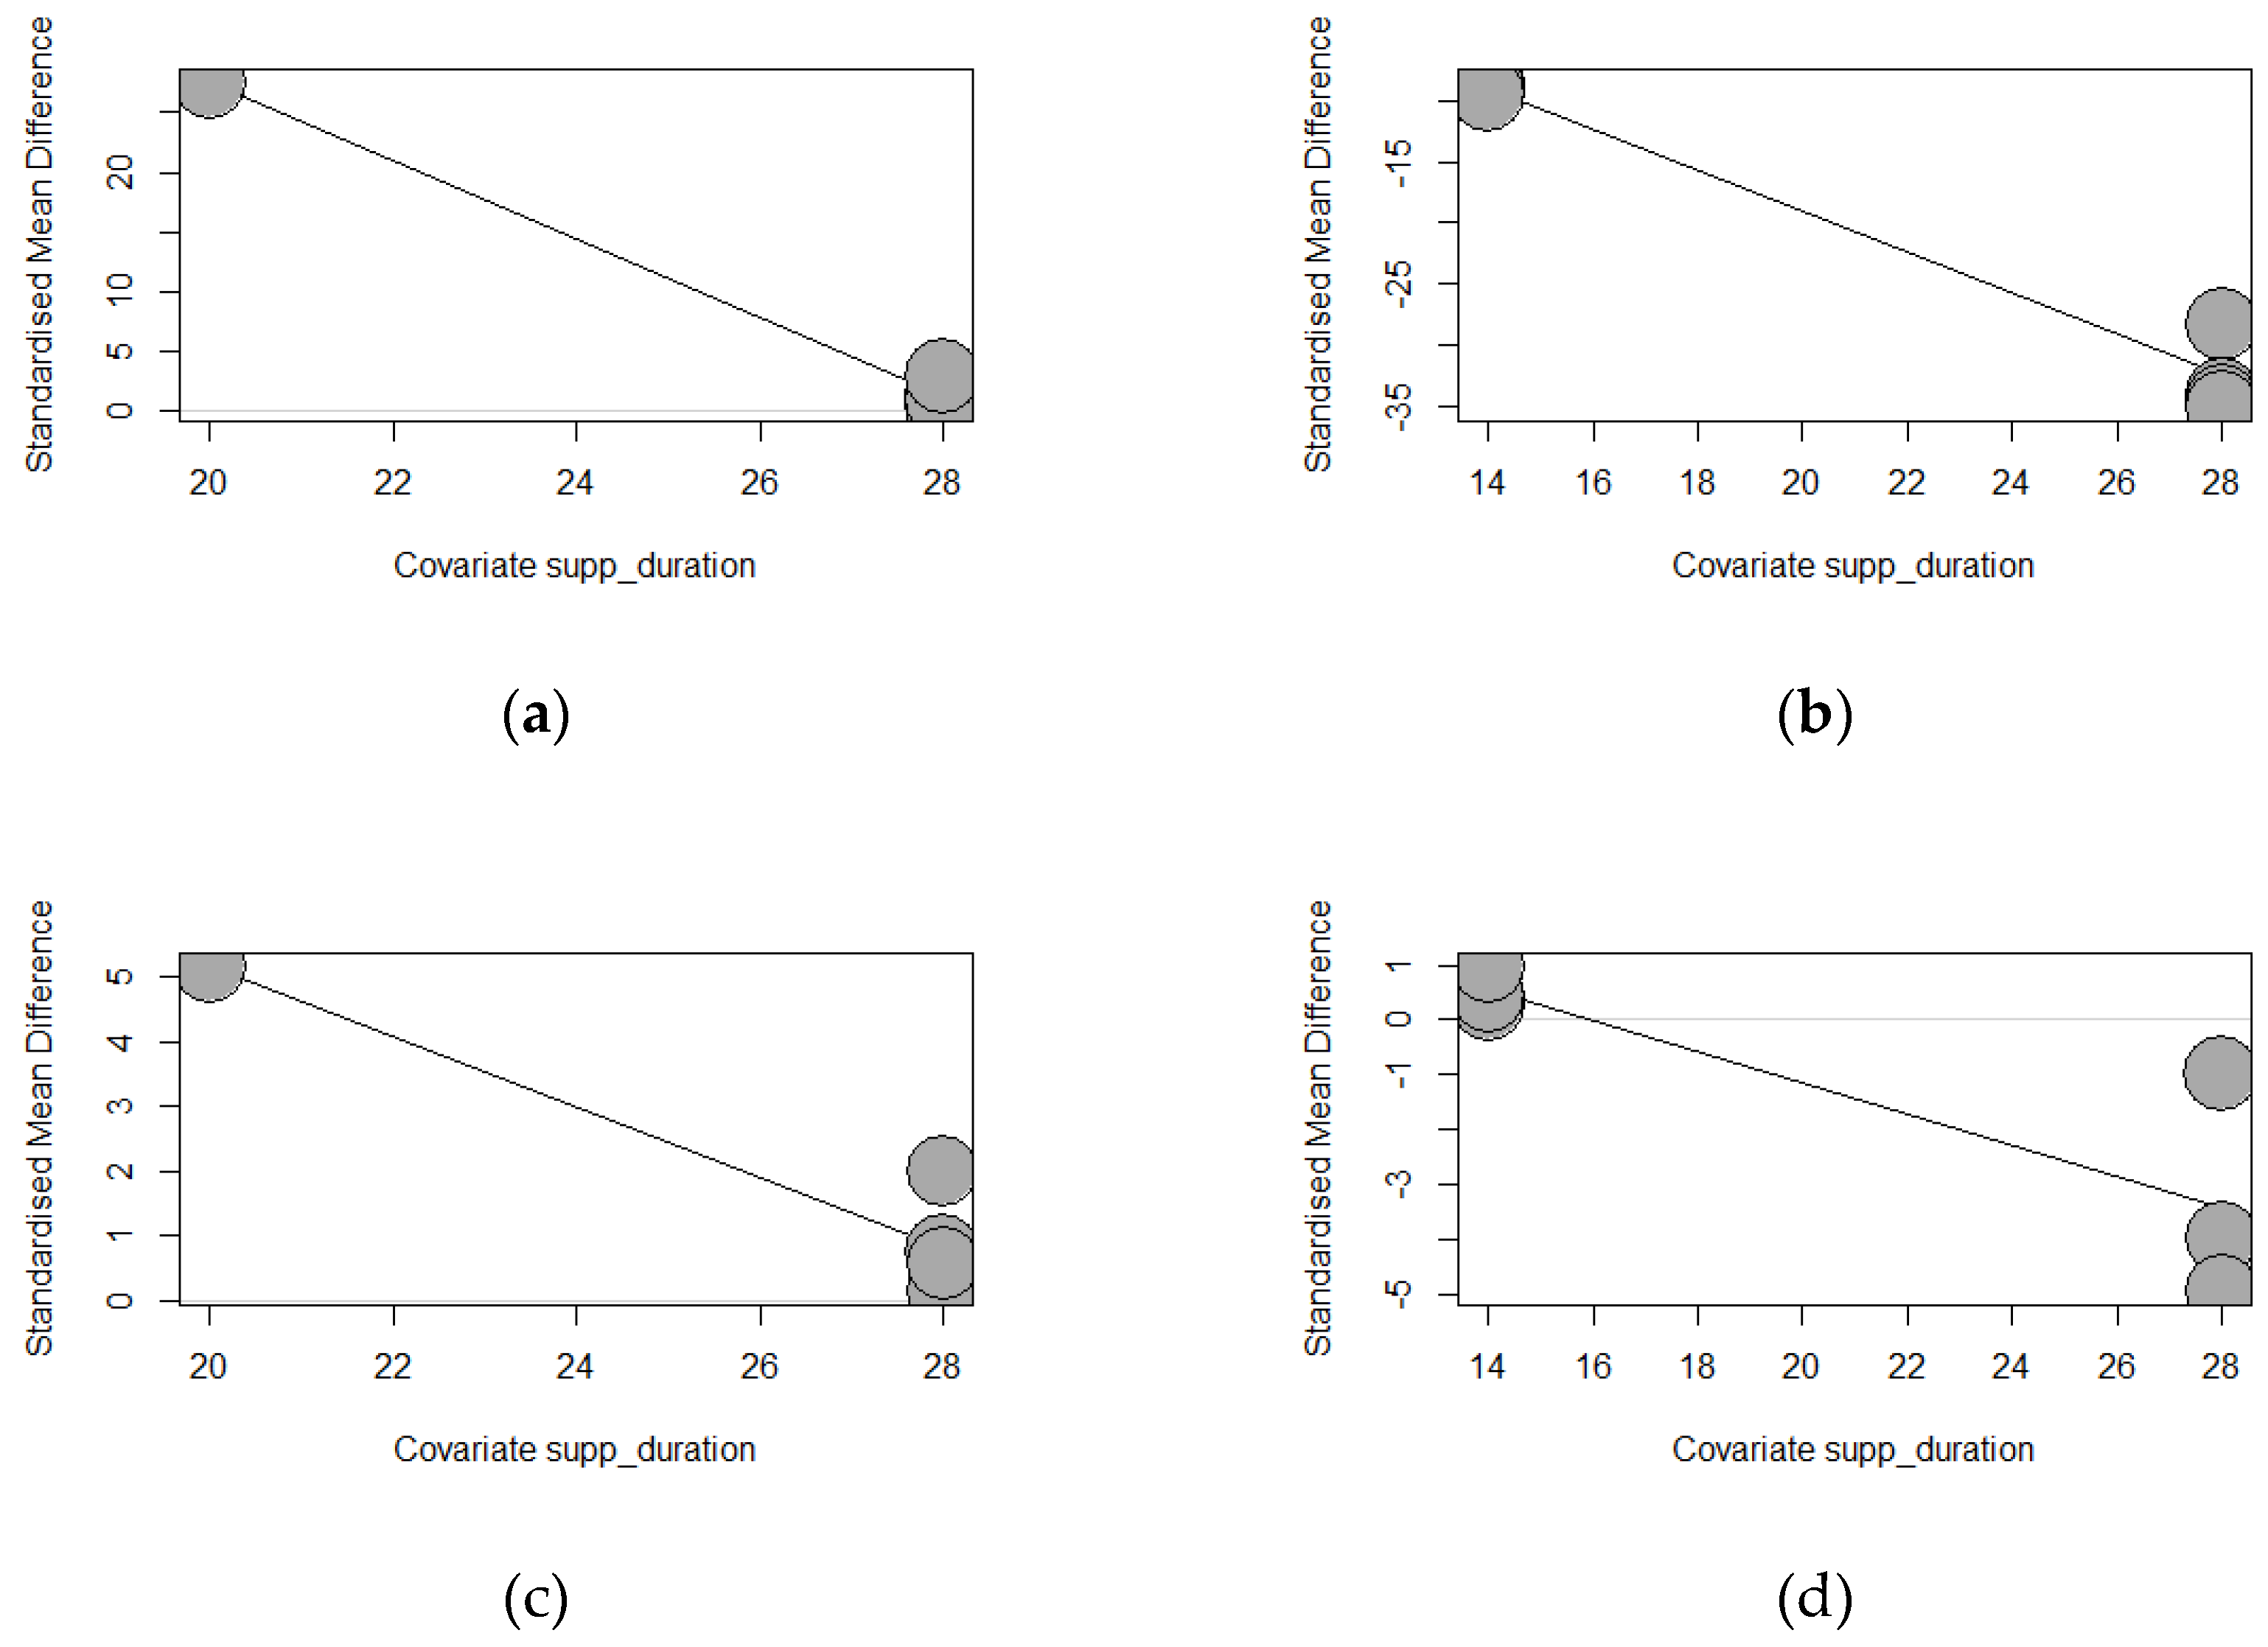
p = 0.0002). Longer exposure of chestnut (Estimate = -3.2762, TM 158.2981) and GMTA (Estimate = -1.6715, TM = 183.7752) significantly decreased ADG. The duration of GMTA supplementation explained the observed heterogeneity thoroughly (100%), whereas the chestnut supplementation duration explained 99.40%. Similarly, increasing the supplementation duration of chestnuts reduced the final body weight (Estimate = -1.6715, TM = 183.7752,
p < 0.0001) of weaned piglets. Longer chestnut supplementation explained the observed heterogeneity thoroughly (100%). Equally, GMTA supplementation for a longer duration significantly lowered the FCR (Estimate = -0.2836, TM = 13.6825,
p = 0.0002) of weaned piglets, explaining 69.89% of the observed heterogeneity for FCR. The significant results recorded for ADG, FBW, and FCR according to the duration of supplementation are highlighted by the bubble plots in
Figure 15.
Table 5 shows the meta-regressions of piglets’ age effects on the tannic source and growth-measured outcomes association. The covariate piglets’ age had no significant relationship (
p > 0.05) with ADFI, ADG, FBW, and FCR.
Figure 16 shows the funnel plots assessment of publication bias for growth parameters (ADFI, ADG, FBW, FCR) and malondialdehydes (serum antioxidant index) via the grey data points. The funnel plots indicated no evidence of asymmetry (publication bias) for ADFI (
p = 0.1908), ADG (
p = 0.2340), and FBW (
p = 0.1912), which was confirmed by Egger’s linear test for publication bias (
Table 6). However, FCR and MDA, on the other hand, showed evidence of asymmetry. These results were confirmed by Egger’s linear regression test (
Table 6) for FCR (bias = -9.8262,
p = 0.0031) and MDA (bias = -4.3594,
p = 0.0048).
5. Conclusions
The present meta-analysis evaluated the effect of dietary supplementation with tannins on weaned piglets’ growth performance, serum antioxidant capacity, and serum immune status. Supplementing tannins reduces average daily gain but improves average daily feed intake, final body weight, and feed conversion ratio. The enhancement of weaned piglets’ productive performance contribution by tannins depends on the source, dosage, and duration of exposure. Likewise, dietary supplementation with tannins effectively reduces malondialdehydes. Still, it elevates the levels of glutathione peroxidase, catalase, superoxide dismutase, and total antioxidant capacity in the serum, which, in general, could be a reliable oxidative stress alleviation nutritional strategy. The evidence of the meta-analysis also indicates a tannin reduction effect in immunoglobin A, while immunoglobin G and M are elevated. Supplementing weaned piglets’ diet with tannins, particularly with chestnut and grape seed proanthocyanidins, could be a reliable nutritional strategy for improving and sustaining gut health, which could translate into mitigating diarrhea occurrences. With the pronounced effect of chestnut and grape seed proanthocyanidins on weaned piglets’ performance, further investigation of their dosage-duration of exposure interaction response would be fascinating.
Author Contributions
Conceptualization, EN.; methodology, EN.; software, EN., and JICPD.; validation, EN. and JICPD.; formal analysis, EN. and JICPD.; investigation, EN.; resources. EN. FH. and JICPD.; writing—review and editing, EN. JICPD. And N-JC.; visualization, EN., JICPD., FH., IC., BC. and N-JC.; supervision, N-JC.; project administration, EN., IC., BC. and N-JC. All authors have read and agreed to the published version of the manuscript.
Figure 3.
Forest plot of the effect size or standardized mean difference and 95% confidence interval of tannins on weaned piglets' average daily feed intake (ADFI). The solid vertical black line represents the mean difference of zero or no effect. Points to the left of the solid vertical black line represent a reduction in ADFI, while points to the right of the solid line indicate an increase in ADFI.
Figure 4.
Forest plot of the effect size or standardized mean difference and 95% confidence interval of tannins on weaned piglets final body weight (FBW). The solid vertical black line represents the mean difference of zero or no effect. Points to the left of the solid vertical black line represent a reduction in FBW, while points to the right of the solid line indicate an increase in FBW.
Figure 5.
Forest plot of the effect size or standardized mean difference and 95% confidence interval of tannins on weaned piglets final body weight (FCR). The solid vertical black line represents the mean difference of zero or no effect. Points to the left of the solid vertical black line represent a reduction in FCR, while points to the right of the solid line indicate an increase in FCR.
Figure 6.
Forest plot of the effect size or standardized mean difference and 95% confidence interval of tannins on weaned piglets’ serum catalase (CAT). The solid vertical black line represents the mean difference of zero or no effect. Points to the left of the solid vertical black line represent a reduction in CAT, while points to the right of the solid line indicate an increase in CAT.
Figure 7.
Forest plot of the effect size or standardized mean difference and 95% confidence interval of tannins on weaned piglets’ serum superoxide dismutase (SOD). The solid vertical black line represents the mean difference of zero or no effect. Points to the left of the solid vertical black line represent a reduction in SOD, while points to the right of the solid line indicate an increase in SOD.
Figure 8.
Forest plot of the effect size or standardized mean difference and 95% confidence interval of tannins on weaned piglets’ serum malondialdehydes (MDA). The solid vertical black line represents the mean difference of zero or no effect. Points to the left of the solid vertical black line represent a reduction in MDA, while points to the right of the solid line indicate an increase in MDA.
Figure 9.
Forest plot of the effect size or standardized mean difference and 95% confidence interval of tannins on weaned piglets’ serum glutathione peroxidase (GSH-Px). The solid vertical black line represents the mean difference of zero or no effect. Points to the left of the solid vertical black line represent a reduction in GSH-Px, while points to the right of the solid line indicate an increase in GSH-Px.
Figure 10.
Forest plot of the effect size or standardized mean difference and 95% confidence interval of tannins on weaned piglets’ serum total antioxidant capacity (T-AOC). The solid vertical black line represents the mean difference of zero or no effect. Points to the left of the solid vertical black line represent a reduction in T-AOC, while points to the right of the solid line indicate an increase in T-AOC.
Figure 11.
Forest plot of the effect size or standardized mean difference and 95% confidence interval of tannins on weaned piglets’ serum immunoglobin A (IgA). The solid vertical black line represents the mean difference of zero or no effect. Points to the left of the solid vertical black line represent a reduction in IgA, while points to the right of the solid line indicate an increase in IgA.
Figure 12.
Forest plot of the effect size or standardized mean difference and 95% confidence interval of tannins on weaned piglets’ serum immunoglobin M (IgM). The solid vertical black line represents the mean difference of zero or no effect. Points to the left of the solid vertical black line represent a reduction in IgM, while points to the right of the solid line indicate an increase in IgM.
Figure 13.
Forest plot of the effect size or standardized mean difference and 95% confidence interval of tannins on weaned piglets’ serum immunoglobin M (IgG). The solid vertical black line represents the mean difference of zero or no effect. Points to the left of the solid vertical black line represent a reduction in IgG, while points to the right of the solid line indicate an increase in IgG.
Figure 14.
GSP dosage effect o on ADFI (a) Showing a decreasing trend of ADFI’s standardized mean difference following the increasing dosage of GSP supplementation.
Figure 14.
GSP dosage effect o on ADFI (a) Showing a decreasing trend of ADFI’s standardized mean difference following the increasing dosage of GSP supplementation.
Figure 15.
Showing a decreasing trend of standardized mean difference following the increasing dosage of tannins supplementation duration on weaned piglets’ growth performance.: (a) Chestnut impact on ADG; (b) GMTA impact on ADG. (c) Chestnut impact on FBW; (d) GMTA impact on FCR.
Figure 15.
Showing a decreasing trend of standardized mean difference following the increasing dosage of tannins supplementation duration on weaned piglets’ growth performance.: (a) Chestnut impact on ADG; (b) GMTA impact on ADG. (c) Chestnut impact on FBW; (d) GMTA impact on FCR.
Figure 16.
Funnel plots assessment for publication bias on weaned piglets’ growth outcomes and serum malondialdehydes: (a) ADFI; (b) ADG; (c) FBW; (d) FCR; (e) MDA.
Figure 16.
Funnel plots assessment for publication bias on weaned piglets’ growth outcomes and serum malondialdehydes: (a) ADFI; (b) ADG; (c) FBW; (d) FCR; (e) MDA.
Table 1.
Summary characteristics of studies included in the meta-analysis.
Table 1.
Summary characteristics of studies included in the meta-analysis.
| Author (Year) |
Weaned age (days) |
Suppl. Duration (days) |
Tannin Type1
|
Tannin Source2
|
Average Weight (Kg) |
Tannin Dosage (mg/kg) |
Parameters of Analysis3
|
| Xu et al [56] |
28 |
20 |
HT |
Chestnut |
8.6 |
1500 |
FBW, ADFI, ADG, FCR |
| Wang et al [33] |
21 |
14 |
HT |
GMTA |
5.99 ± 0.13 |
500, 1000, 1500 |
FBW, ADFI, ADG, FCR |
| Wang et al [57] |
21 |
14 |
HT |
GMTA |
5.99 ± 0.13 |
1000 |
GSH-Px, SOD, CAT, MDA |
| Rajkovic et al [15] |
23 |
56 |
CT |
Grape extract |
6.9 ± 0.1 |
148 |
FBW, ADFI, ADG, FCR |
| Ma et al [32] |
28 |
20 |
CT |
Quebracho |
- |
2000, 3000 |
FBW, ADG |
| Liu et al [58] |
28 |
28 |
HT |
Chestnut wood |
7.81 ± 0.99 |
1000 |
FBW, ADFI, ADG, FCR, T-AOC, SOD, GSH-Px, CAT, MDA, IgA, IgG, IgM |
| Lee et al [31] |
21 |
28 |
HT |
G. tannic Acid |
6.485 ± 0.66 |
125, 250, 500, 1000 |
ADFI, ADG, FCR |
| Kotrotsios et al [30] |
30 |
55 |
CT |
Carob Pods |
- |
75000, 100000,125000 |
FCR |
| Han et al [59] |
28 |
28 |
CT |
GSP |
9.3 ± 0.5 |
250 |
ADFI, ADG, FCR, SOD, GSH-Px, MDA |
| Fang et al [27] |
28 |
28 |
CT |
GSP |
8.4 ± 0.17 |
40, 70, 100 |
FBW, ADFI, ADG, FCR, T-AOC, SOD, GSH-Px, CAT, MDA |
| Chedea et al [60] |
21 |
36 |
CT |
Grape Pomace |
10.70 ± 0.8 |
50000 |
FBW, ADFI, ADG, FCR |
| Caprarulo et al [26] |
35 |
40 |
HT/CT |
Blend (Ch/Qu) |
- |
12500 |
FBW, ADFI, ADG, FCR |
| Biagi et al [22] |
28 |
28 |
HT |
Chestnut wood |
8.23 ± 0.93 |
1130, 2250, 4500 |
FBW, ADFI, ADG |
| Kafantaris et al [29] |
21 |
30 |
CT |
Grape Pomace |
6.49 ± 0.66 |
90000 |
FBW, ADFI, ADG, FCR, GSH-Px, CAT |
| Hao et al [28] |
21 |
28 |
CT |
GSP |
6.99 ± 0.11 |
50, 100, 150 |
FBW, ADFI, ADG, FCR, T-AOC, SOD, GSH-Px, CAT, MDA, IgA, IgG, IgM |
| Yu et al [61] |
21 |
28 |
HT |
G. tannic acid |
6.6 ± 0.27 |
1973.09, 12004.84 |
FBW, ADFI, ADG, FCR, MDA |
Table 3.
Meta-regression of tannins source dosage effects on growth measured outcomes.
Table 3.
Meta-regression of tannins source dosage effects on growth measured outcomes.
| Variablea
|
Model Results |
Heterogeneityb
|
| |
|
|
|
95% CIb
|
TM |
Mixed Model Effects |
| |
Estimate |
SEb
|
p-value |
Lower |
Upper |
QM |
τ2
|
τ |
I2(%) |
R2
|
| ADFI |
|
|
|
|
|
|
|
|
|
|
| GSP |
-0.0118 |
0.0054 |
0.0297 |
-0.0224 |
-0.0012 |
4.7277 |
0.8393 |
0.9161 |
90.27 |
40.74 |
| GMTA |
-0.0015 |
0.0013 |
0.2556 |
-0.0040 |
0.0011 |
1.2923 |
2.1981 |
1.4826 |
95.53 |
6.01 |
| ADG |
|
|
|
|
|
|
|
|
|
|
| Chestnut |
-0.0013 |
0.0046 |
0.7806 |
-0.0103 |
0.0077 |
0.0776 |
174.7742 |
13.2202 |
99.88 |
0.00 |
| GMTA |
0.0136 |
0.0102 |
0.1799 |
-0.0063 |
0.0335 |
1.7983 |
142.6673 |
11.9443 |
96.53 |
12.37 |
| GSP |
-0.0071 |
0.0090 |
0.4322 |
-0.0247 |
0.0106 |
0.6169 |
2.4329 |
1.5598 |
95.82 |
0.00 |
| FBW |
|
|
|
|
|
|
|
|
|
|
| Chestnut |
0.0001 |
0.0008 |
0.8811 |
-0.0015 |
0.0017 |
0.0224 |
5.3567 |
2.3145 |
97.57 |
0.00 |
| GSP |
-0.0113 |
0.0158 |
0.4733 |
-0.0422 |
0.0196 |
0.5143 |
1.9417 |
1.3935 |
95.15 |
0.00 |
| GMTA |
0.0002 |
0.0007 |
0.7497 |
-0.0011 |
0.0015 |
0.1018 |
0.00 |
0.00 |
0.00 |
0.00 |
| Carob pods |
-0.0000 |
0.0001 |
0.5469 |
-0.0001 |
0.0001 |
0.3628 |
4.1985 |
2.0490 |
98.17 |
0.00 |
| FCR |
|
|
|
|
|
|
|
|
|
|
| GMTA |
0.0015 |
0.0022 |
0.4800 |
-0.0027 |
0.0057 |
0.4989 |
6.4586 |
2.5414 |
97.33 |
0.00 |
| GSP |
0.0047 |
0.0091 |
0.6079 |
-0.0132 |
0.0226 |
0.2633 |
2.4616 |
1.5690 |
95.18 |
0.00 |
Table 4.
Meta-regression of tannins source supplementation duration effects on growth measured outcomes.
Table 4.
Meta-regression of tannins source supplementation duration effects on growth measured outcomes.
| Variablea
|
Model Results |
Heterogeneityb
|
| |
|
|
|
95% CI |
TM |
Mixed Model Effects |
| |
Estimate |
SE |
p-value |
Lower |
Upper |
QM |
τ2
|
τ |
I2(%) |
R2
|
| ADFI |
|
|
|
|
|
|
|
|
|
|
| GMTA |
-0.0113 |
0.0945 |
0.9048 |
-0.1965 |
0.1739 |
0.0143 |
2.8266 |
1.6813 |
96.63 |
0.00 |
| ADG |
|
|
|
|
|
|
|
|
|
|
| Chestnut |
-3.2762 |
0.2604 |
<.0001 |
-3.7866 |
-2.7659 |
158.2981 |
0.8039 |
0.8966 |
83.26 |
99.40 |
| GMTA |
-1.6715 |
0.1233 |
<.0001 |
-1.9132 |
-1.4299 |
183.7752 |
0.00 |
0.00 |
0.00 |
100.00 |
| FBW |
|
|
|
|
|
|
|
|
|
|
| Chestnut |
-1.6715 |
0.1233 |
<.0001 |
-1.9132 |
-1.4299 |
183.7752 |
0.00 |
0.00 |
0.00 |
100.00 |
| FCR |
|
|
|
|
|
|
|
|
|
|
| GMTA |
-0.2836 |
0.0767 |
0.0002 |
-0.4339 |
-0.1333 |
13.6825 |
1.7732 |
1.3316 |
91.34 |
69.89 |
Table 5.
Meta-regression of piglets’ age effects on tannic source and growth measured outcomes association.
Table 5.
Meta-regression of piglets’ age effects on tannic source and growth measured outcomes association.
| Variablea
|
Model Results |
Heterogeneityb
|
| |
|
|
|
95% CIb
|
TM |
Mixed Model Effects |
| |
Estimate |
SEb
|
p-value |
Lower |
Upper |
QM |
τ2
|
τ |
I2(%) |
R2
|
| ADFI |
|
|
|
|
|
|
|
|
|
|
| GSP |
-0.0650 |
0.1437 |
0.6509 |
0.1437 |
0.2166 |
0.2048 |
1.6443 |
1.2823 |
94.85 |
0.00 |
| ADG |
|
|
|
|
|
|
|
|
|
|
| GSP |
0.0308 |
0.1837 |
0.8669 |
-0.3292 |
0.3908 |
0.0281 |
2.7213 |
1.6496 |
96.22 |
0.00 |
| FBW |
|
|
|
|
|
|
|
|
|
|
| GSP |
-0.1648 |
0.1565 |
0.2923 |
-0.4716 |
0.1419 |
1.1091 |
1.7038 |
1.3053 |
94.76 |
1.97 |
| FCR |
|
|
|
|
|
|
|
|
|
|
| GSP |
-0.1249 |
0.1722 |
0.4682 |
-0.4624 |
0.2126 |
0.5263 |
2.3496 |
1.5329 |
94.70 |
0.00 |
Table 6.
Egger’s linear regression test for publication bias.
Table 6.
Egger’s linear regression test for publication bias.
| Items |
Bias |
SEa
|
t-value |
dfa
|
p-value |
| Growth Performance |
|
|
|
|
|
| Average Daily Feed Intake |
4.1020 |
3.0431 |
1.35 |
23 |
0.1908 |
| Average Daily Gain |
-2.7391 |
2.2461 |
-1.22 |
25 |
0.2340 |
| Final Body Weight |
3.3762 |
2.5073 |
1.35 |
23 |
0.1912 |
| Feed Conversion Ratio |
-9.8262 |
2.9735 |
-3.30 |
23 |
0.0031 |
| Serum Antioxidant Indices |
|
|
|
|
|
| MDA |
-4.3594 |
1.1747 |
-3.71 |
9 |
0.0048 |
Table 7.
Corrected Publication Bias of Tannins Source Effect on Weaned Piglets’ Performance and Health Indices.
Table 7.
Corrected Publication Bias of Tannins Source Effect on Weaned Piglets’ Performance and Health Indices.
| Items |
dfb |
Random Effects Model |
Heterogeneityb |
| |
|
Effect Size |
p-value |
Q(p-value) |
I2 (%) |
τ2
|
| Growth Performance |
|
|
|
|
|
|
| Average Daily Feed Intake |
26 |
0.3874 |
0.5039 |
772.74(< 0.0001) |
96.6 |
8.9005 |
| Average Daily Gain |
27 |
-2.0114 |
0.4911 |
1344.43(< 0.0001) |
98.0 |
236.7790 |
| Final Body Weight |
25 |
0.8494 |
0.0517 |
0.0517(< 0.0001) |
94.7 |
4.6938 |
| Feed Conversion Ratio |
30 |
-0.3920 |
0.4478 |
1415.83(< 0.0001) |
97.9 |
8.1086 |
| Serum Antioxidant Indices |
|
|
|
|
|
|
| MDA |
13 |
-2.2764 |
0.5254 |
181.67 (< 0.0001) |
92.8 |
171.0610 |
| T-SOD |
11 |
1.8200 |
0.0075 |
125.98 (< 0.0001) |
91.3 |
4.7714 |
| CAT |
11 |
1.0790 |
0.1289 |
191.54 (< 0.0001) |
94.3 |
5.7435 |
| GSH-Px |
8 |
2.6767 |
0.2590 |
174.24 (< 0.0001) |
95.4 |
47.3510 |
| T-AOC |
9 |
3.2990 |
0.2666 |
141.13 (< 0.0001) |
93.6 |
82.6910 |
| Immune Indices |
|
|
|
|
|
|
| IgA |
4 |
0.9356 |
0.8530 |
485.39(< 0.0001) |
99.2 |
126.7149 |
| IgG |
4 |
5.7818 |
< 0.0001 |
51.91(< 0.0001) |
92.3 |
9.2207 |
| IgM |
5 |
9.0259 |
0.6023 |
448.01(< 0.0001) |
98.9 |
1783.7486 |
