1. Introduction
β-Glucans are polymers of D-glucose that consisted of various glycosidic linkages including β-(1,3), β-(1,3)/(1,4), β-(1,3)/(1,6), and β (1,4) bonds [
1,
2]. They are widely distributed in many natural sources such as bacteria, yeast, mushrooms, and higher plants [
3,
4,
5]. Fungal β (1,3), (1,6) glucan is the major cell wall component of fungi, mushroom and yeast, which displays several biological activities such as anti-inflammation, reduction and control of blood glucose and anti-osteoarthritis [
6,
7,
8]. Interestingly, it also possesses a biological activity against osteoporosis, which resulting from an imbalance in bone metabolism characterized by an excessive osteoclast-bone resorption over osteoblast-bone formation. Currently, the attenuation of osteoclastogenesis has been considered an effective therapeutic strategy for osteoporosis.
Osteoclastogenesis is the complex process that involves differentiation and proliferation of precursor cells of myeloid origin to multinucleated mature osteoclast. This multistep process requires M-CSF and RANK ligand (RANKL). M-CSF is essential for the proliferation and survival of osteoclast precursors, whereas RANKL is required for osteoclast differentiation and function [
9,
10,
11]. Interaction of RANKL with RANK receptor stimulates adapter protein tumour necrosis factor receptor-related factor 6 (TRAF6), which enhances many downstream signalling cascades, including the nuclear factor kappa-light-chain-enhancer of activated B cells (NFƘB), mitogen-activated protein kinase (MAPK), c-Jun N-terminal kinase (JNKs), and calcium calmodulin pathways [
12]. Among these signalling pathways, the RANKL-induced NFƘB pathway serves as a pivotal mechanism for osteoclastogenesis. NF-ƘB1/2 double-deleted (dKO) mice display extensive osteoporosis due to unsuccessful osteoclast formation [
13,
14]. During NFƘB activation, the p50:P65 dimer, a subunit of NFƘB, is activated and transported into the nucleus to promote the expression of nuclear factor of activated T cell c1 (NFATc1), a major osteoclast modulator that participates in the regulation of various osteoclastogenesis-related genes such as tartrate-resistant acid phosphatase (TRAP), cathepsin K (CTK), and matrix metallopeptidase 9 (MMP-9) [
15,
16,
17].
Many studies have reported the inhibitory effect of fungal β (1,3), (1,6) glucan on osteoclastogenesis. Polycan, a β (1,3), (1,6) glucan from
Aureobasidium pullulans SM-2001, protects bone deterioration and increases the bone formation rate in ovariectomized mice [
18]. Hara et al. (2021) reported that β (1,3), (1,6) glucan from
Pleurotus citrinopileatus inhibited RANKL-induced osteoclast differentiation by supressing TRAP-positive cells [
19]. Moreover, glucan from baker's yeast (
Saccharomyces cerevisiae) attenuated the RANKL-induced osteoclastogenesis via the inhibition of NFATc1 and cFOS [
20].
However, the high molecular weight of natural β glucans is one limitation of their wide spread use [
21,
22,
23]. The proper structure, degree of branching, molecular weight, and solubility effect biological properties [
24,
25]. Previous studies revealed the relationship between molecular weight and bioactivities, indicating that size reduction and water-solubilization are beneficial for the improvement of β-glucan activities such as anti-inflammatory bone resorption activity of low molecular-weight (LMW) curdlan, (1,3)-β-Glucan [
26], anti-inflammatory and antioxidative potential in rats’ colon of LMW oat β-Glucan [
27] and stimulating interleukin-8 activity in the inflammatory-immune system of small (1, 3), (1, 6)-β-glucan from
Ophiocordyceps dipterigena [
28].
Therefore, various methods have been employed for reducing the molecular weight of β-glucan including chemical (acid hydrolysis), ultrasonic disruption, thermal degradation, radiation, and enzymatic methods [
29,
30]. Enzymatic modification has been wildly used to ameliorate the functional characteristics of β-glucan because of its specifications and recyclablilty [
31,
32]. The mechanism of enzymatic degradation is cutting off the polysaccharide backbone to small specific oligosaccharide fragments. In addition, a previous study reported the high specification of β-1,3 glucanase to digest the β-l,3-glycosidic bond of β-glucan into dextrin or oligosaccharide [
33].
Our previous study indicated that
Hevea β-1,3-glucanase isozymes could specifically hydrolyse the particulate β-(1,3), (1,6) glucan from edible grey oyster mushroom to obtain a
Pleurotus sajor-caju glucanoligosaccharide (Ps-GOS), which is a smaller chain, has a lower molecular weight, and has a higher water solubility. Furthermore, we also examined the effect of Ps-Gos on the preosteoblastic MC3T3-E1 cell line, a bone formation cell, and results showed that Ps-GOS enhanced the proliferation, differentiation, and mineralization of MC3T3-E1 osteoblasts via the BMP-2/Runx2/MAPK/Wnt/β-catenin signalling pathway [
34]. Nonetheless, the effect of Ps-GOS on osteoclastogenesis has not been reported. Therefore, we aimed to investigate the biological activities and underlying molecular mechanisms of Ps-GOS on RANKL-induced osteoclastogenesis in the preosteoclastic RAW 264.7 cell line.
3. Discussion
β-Glucan molecules display difference in size, structure, and ability to modulate immunological factor responses. To enhance their pharmaceutical efficacy, many chemical, physical, and enzymatic methods have been conducted. Enzymatic modification has played a major role in modification of functional characteristics of polysaccharides for the purpose of depolymerization, de-esterification and debranching. Previous studies also reported that β-glucanase could effectively reduce the molecular weight of β-glucans and enhance the solubility, functionality and bioactivity [
31,
35]. Duan et al. (2008) revealed that β-1,3 glucanase has high specificity to depolymerize β-1, 3 glucan extracted from yeast (
Trichoderma strain LE02); the obtained β-glucan had a molecular mass greater than 30 kDa and better water solubility [
36].
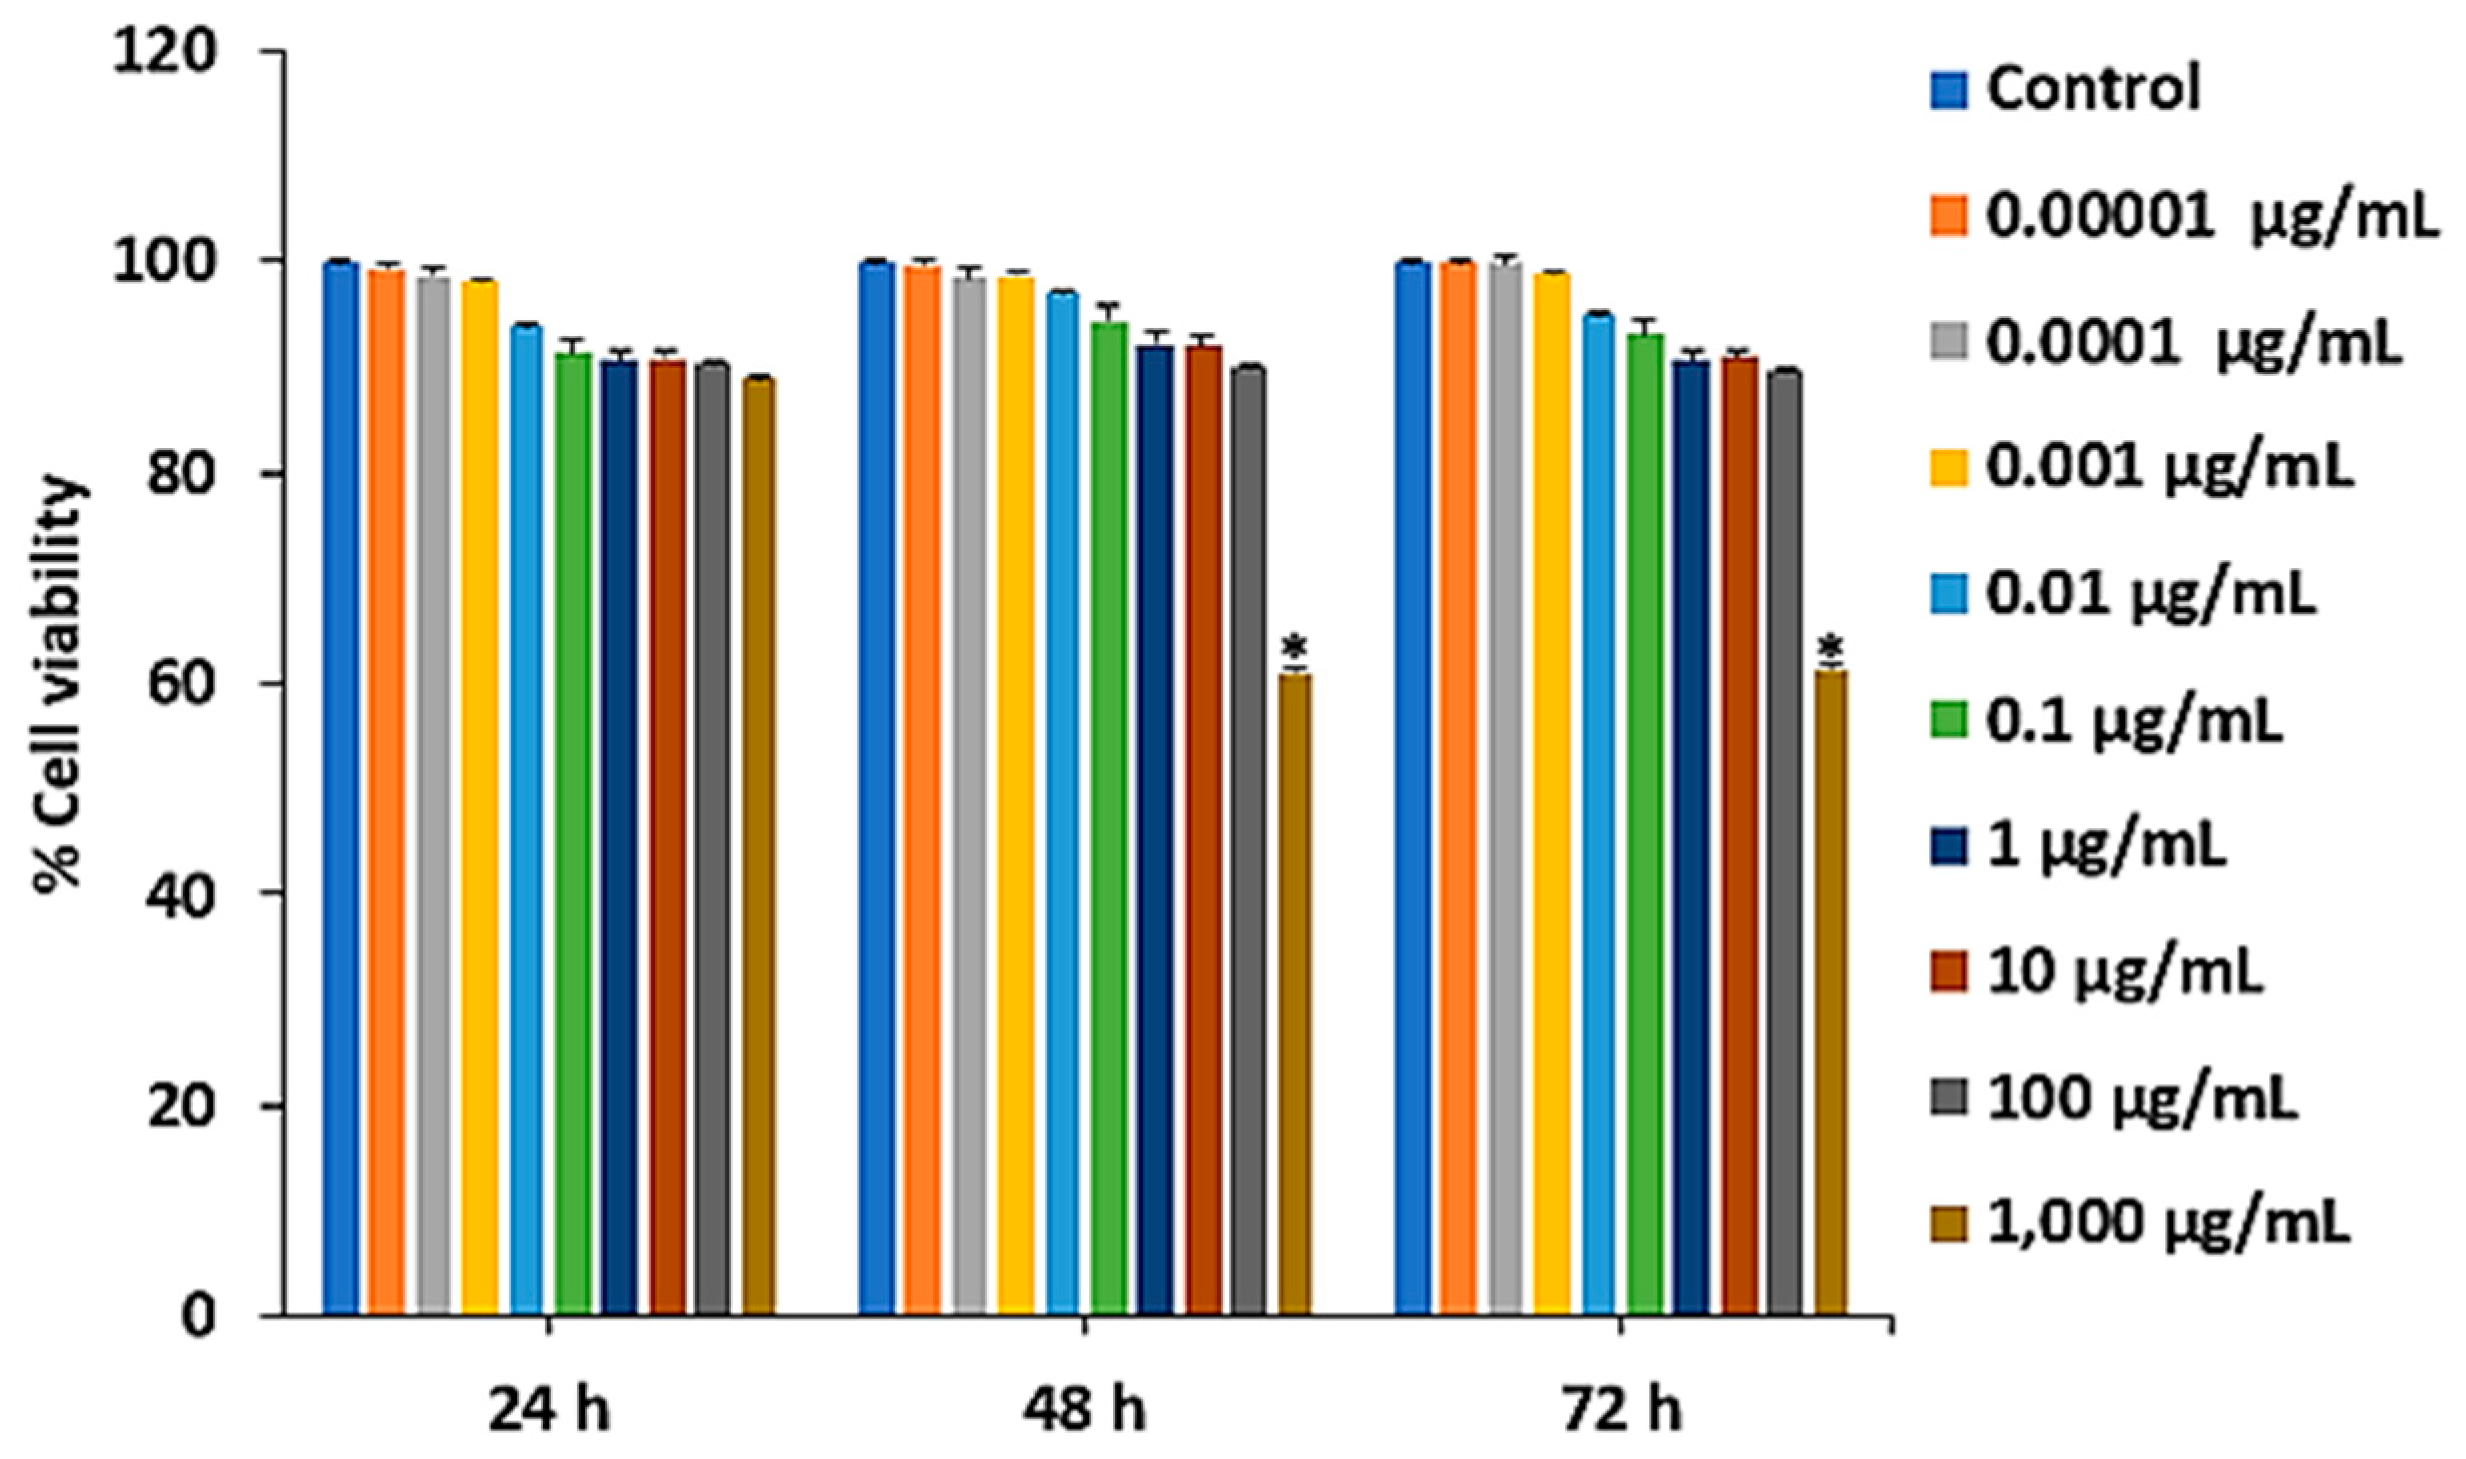
Our previous study utilized Hevea β-1,3-glucanase for the enzymatic hydrolysis of Pleurotus sajor-caju β-glucans to obtain a smaller molecular weight and higher water solubility of β-glucan oligosaccharides, Ps-GOS, which exhibits an osteoblast-bone formation enhancing activity To evaluate the potential of Ps-GOS for osteoporosis prevention, alleviation, or treatment, this study aimed to investigate the inhibitory effect of Ps-GOS against osteoclastogenesis in pre-osteoclastic RAW 264.7 cells. The result revealed that Ps-GOS effectively prevented osteoporosis and is non-cytotoxic to pre-osteoclastic RAW 264.7 cells at concentrations ranging from 0.01 ng/mL to 100 µg/mL, as it did not exhibit a significant effect on cell viability at 24, 48, and 72 h.
TRAP or acid phosphatase 5 (ACP5) is the prime histochemical marker of mature osteoclasts. It plays a vital role in resorption of skeleton phosphoproteins such as sialoproteins and osteopontin [
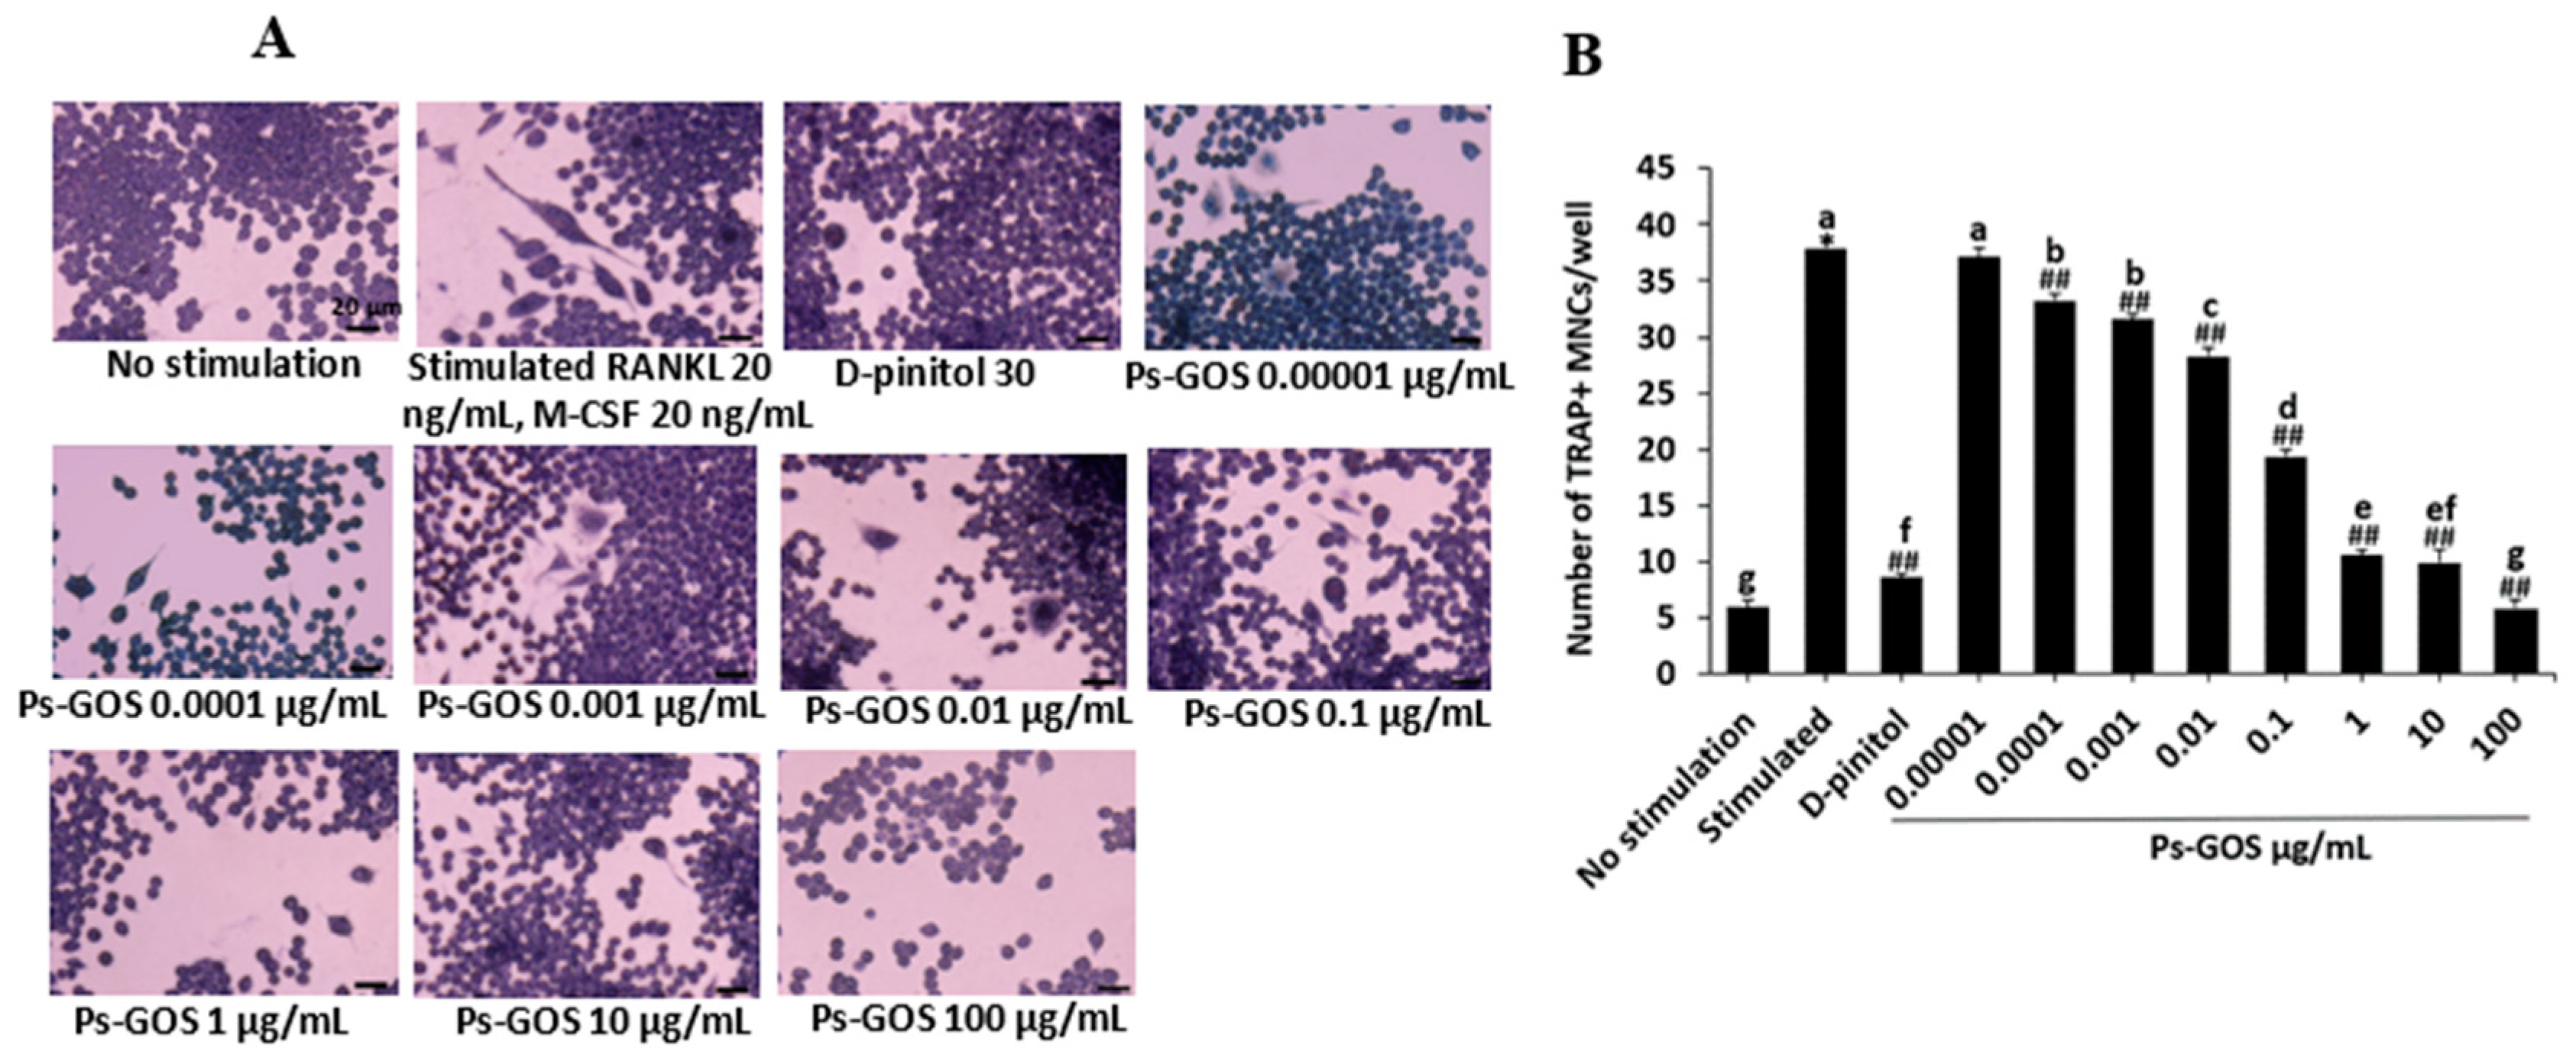
37,
38]. The effect of Ps-GOS on osteoclast fusion and formation was demonstrated by the presence of TRAP-positive MNCs. We observed a large number of TRAP-positive cells in the RANKL-induced group. Moreover, Ps-GOS treatment remarkably reduced the number of TRAP-positive cells in a dose-dependent manner, suggesting that Ps-GOS inhibited the formation and fusion of mature osteoclasts, and it may also suppress the bone resorptive efficacy. This is similar to a previous study showing that β-glucans from
Pleurotus citrinopileatus inhibited RANKL-induced osteoclast formation by diminishing TRAP-positive cells [
19].
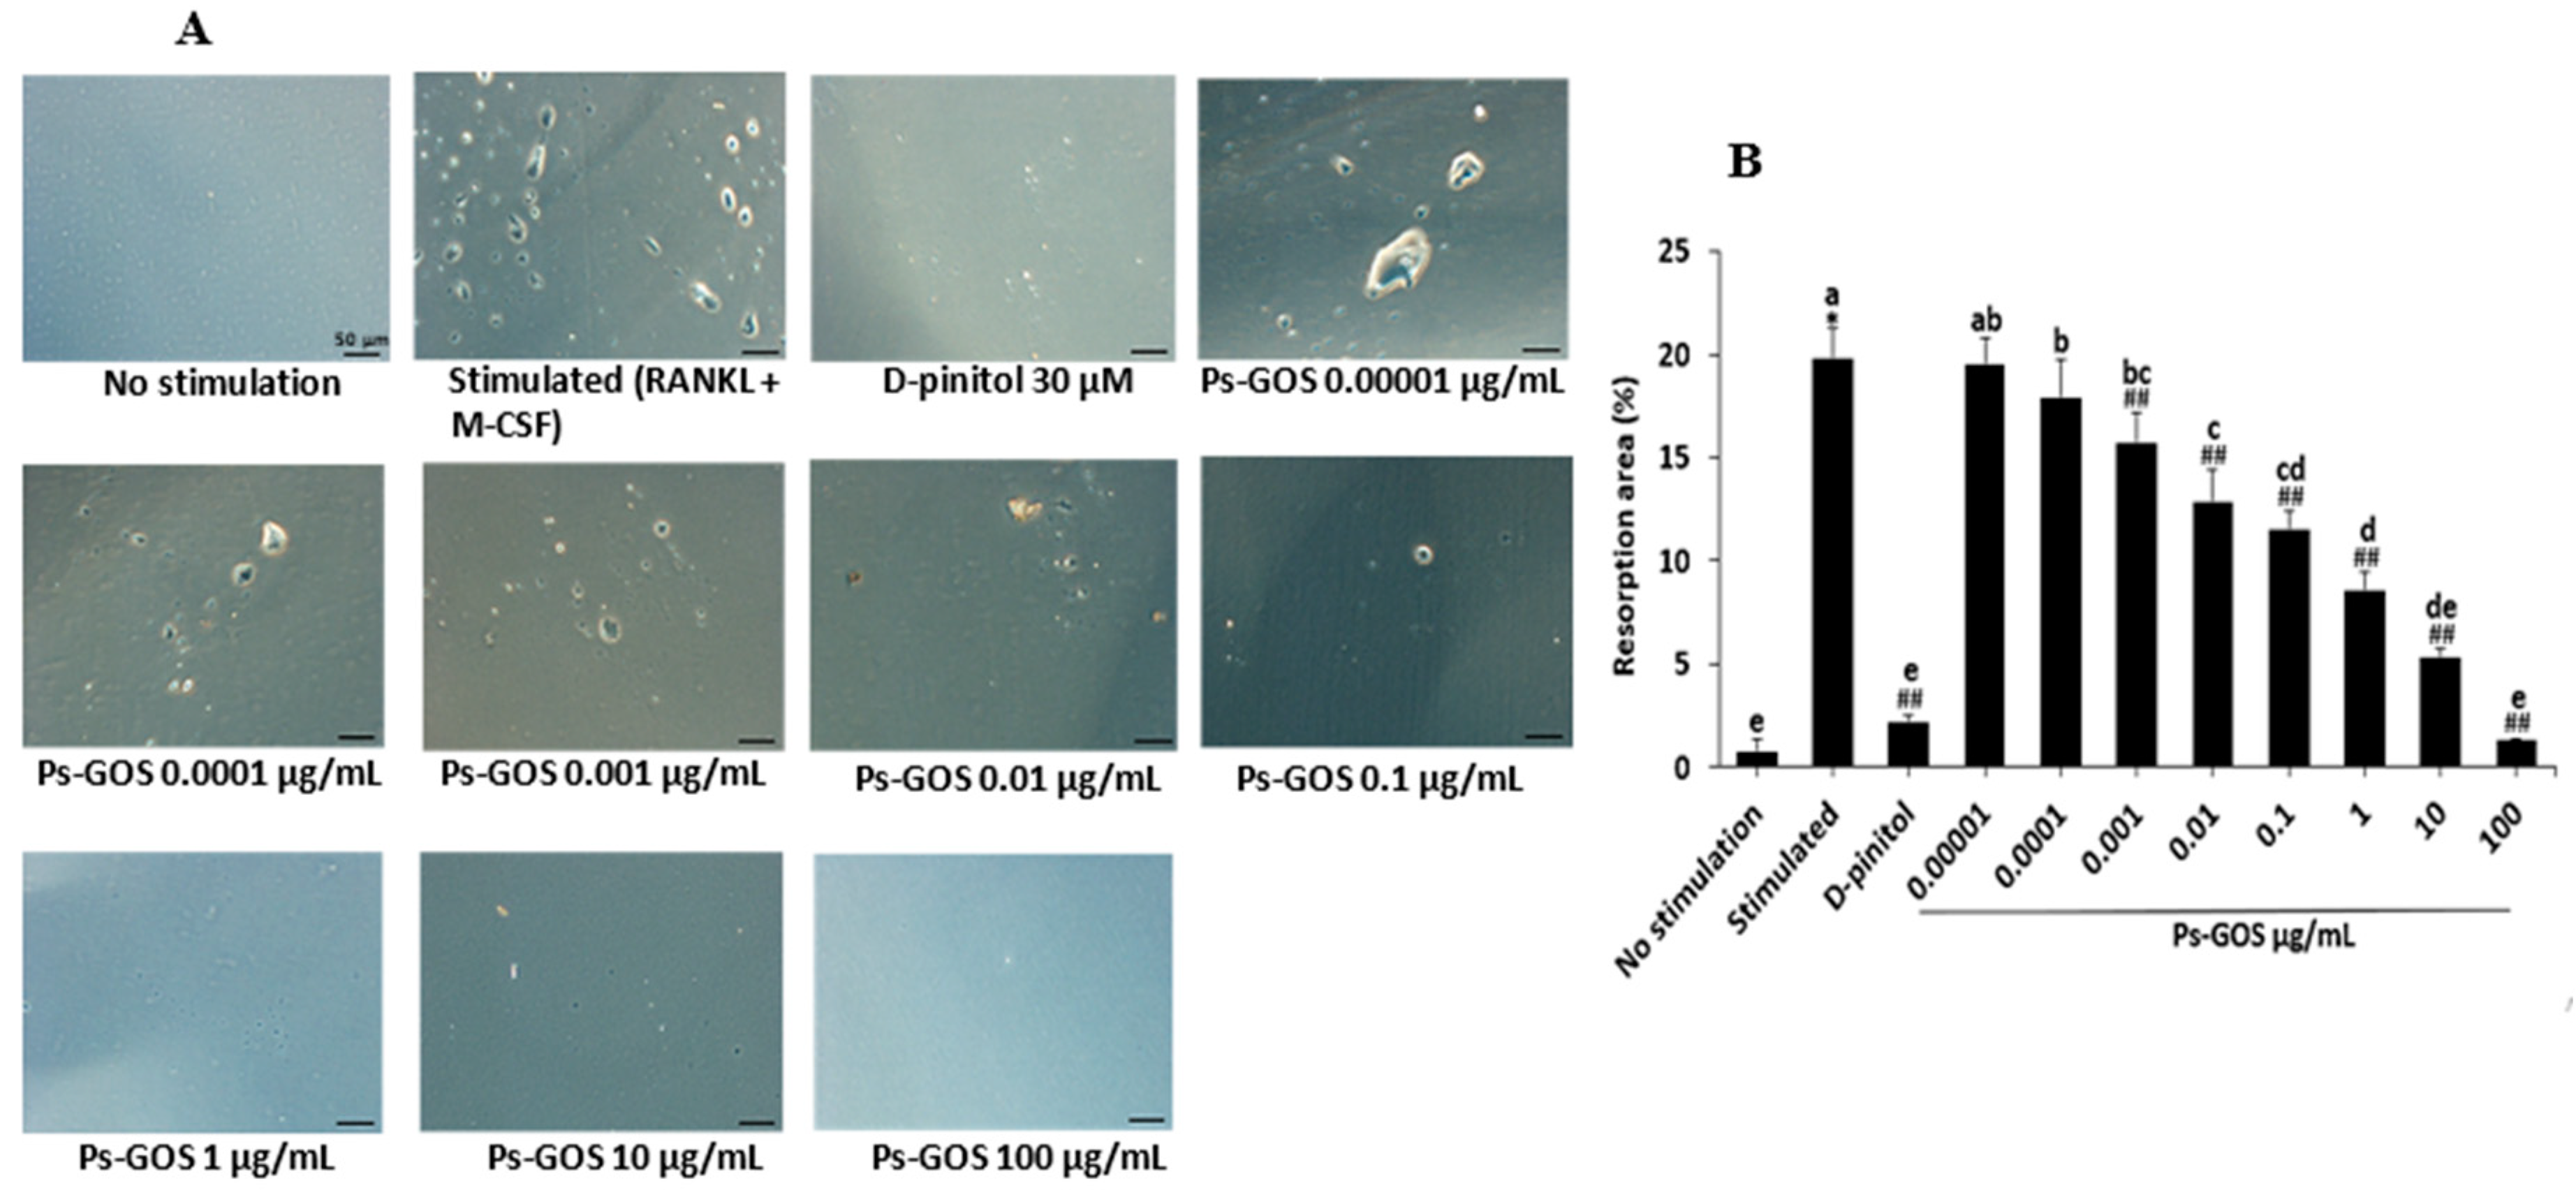
Additionally, bone resorption, a unique ability of osteoclasts, was also observed in the RANKL-stimulated group. The resorption areas were decreased when treated with a low concentration of Ps-GOS. Saliently, the highest Ps-GOS dosage-treated group showed almost empty well surfaces. These findings suggested that Ps-GOS has a suppressive effect on not only osteoclast multinucleated cell formation but also their bone resorption ability. As demonstrated previously,
S. cerevisiae β-glucan may have an inhibitory effect on bone resorption in the
in vivo animal models [
39].
During osteoclast differentiation, RANKL-induced NFκB was identified as an essential transduction pathway for stimulating osteoclastogenic transcription factors [
40]. The up-regulation of NFκB requires the activation and nuclear translocation of its subunit NFκB-P65 [
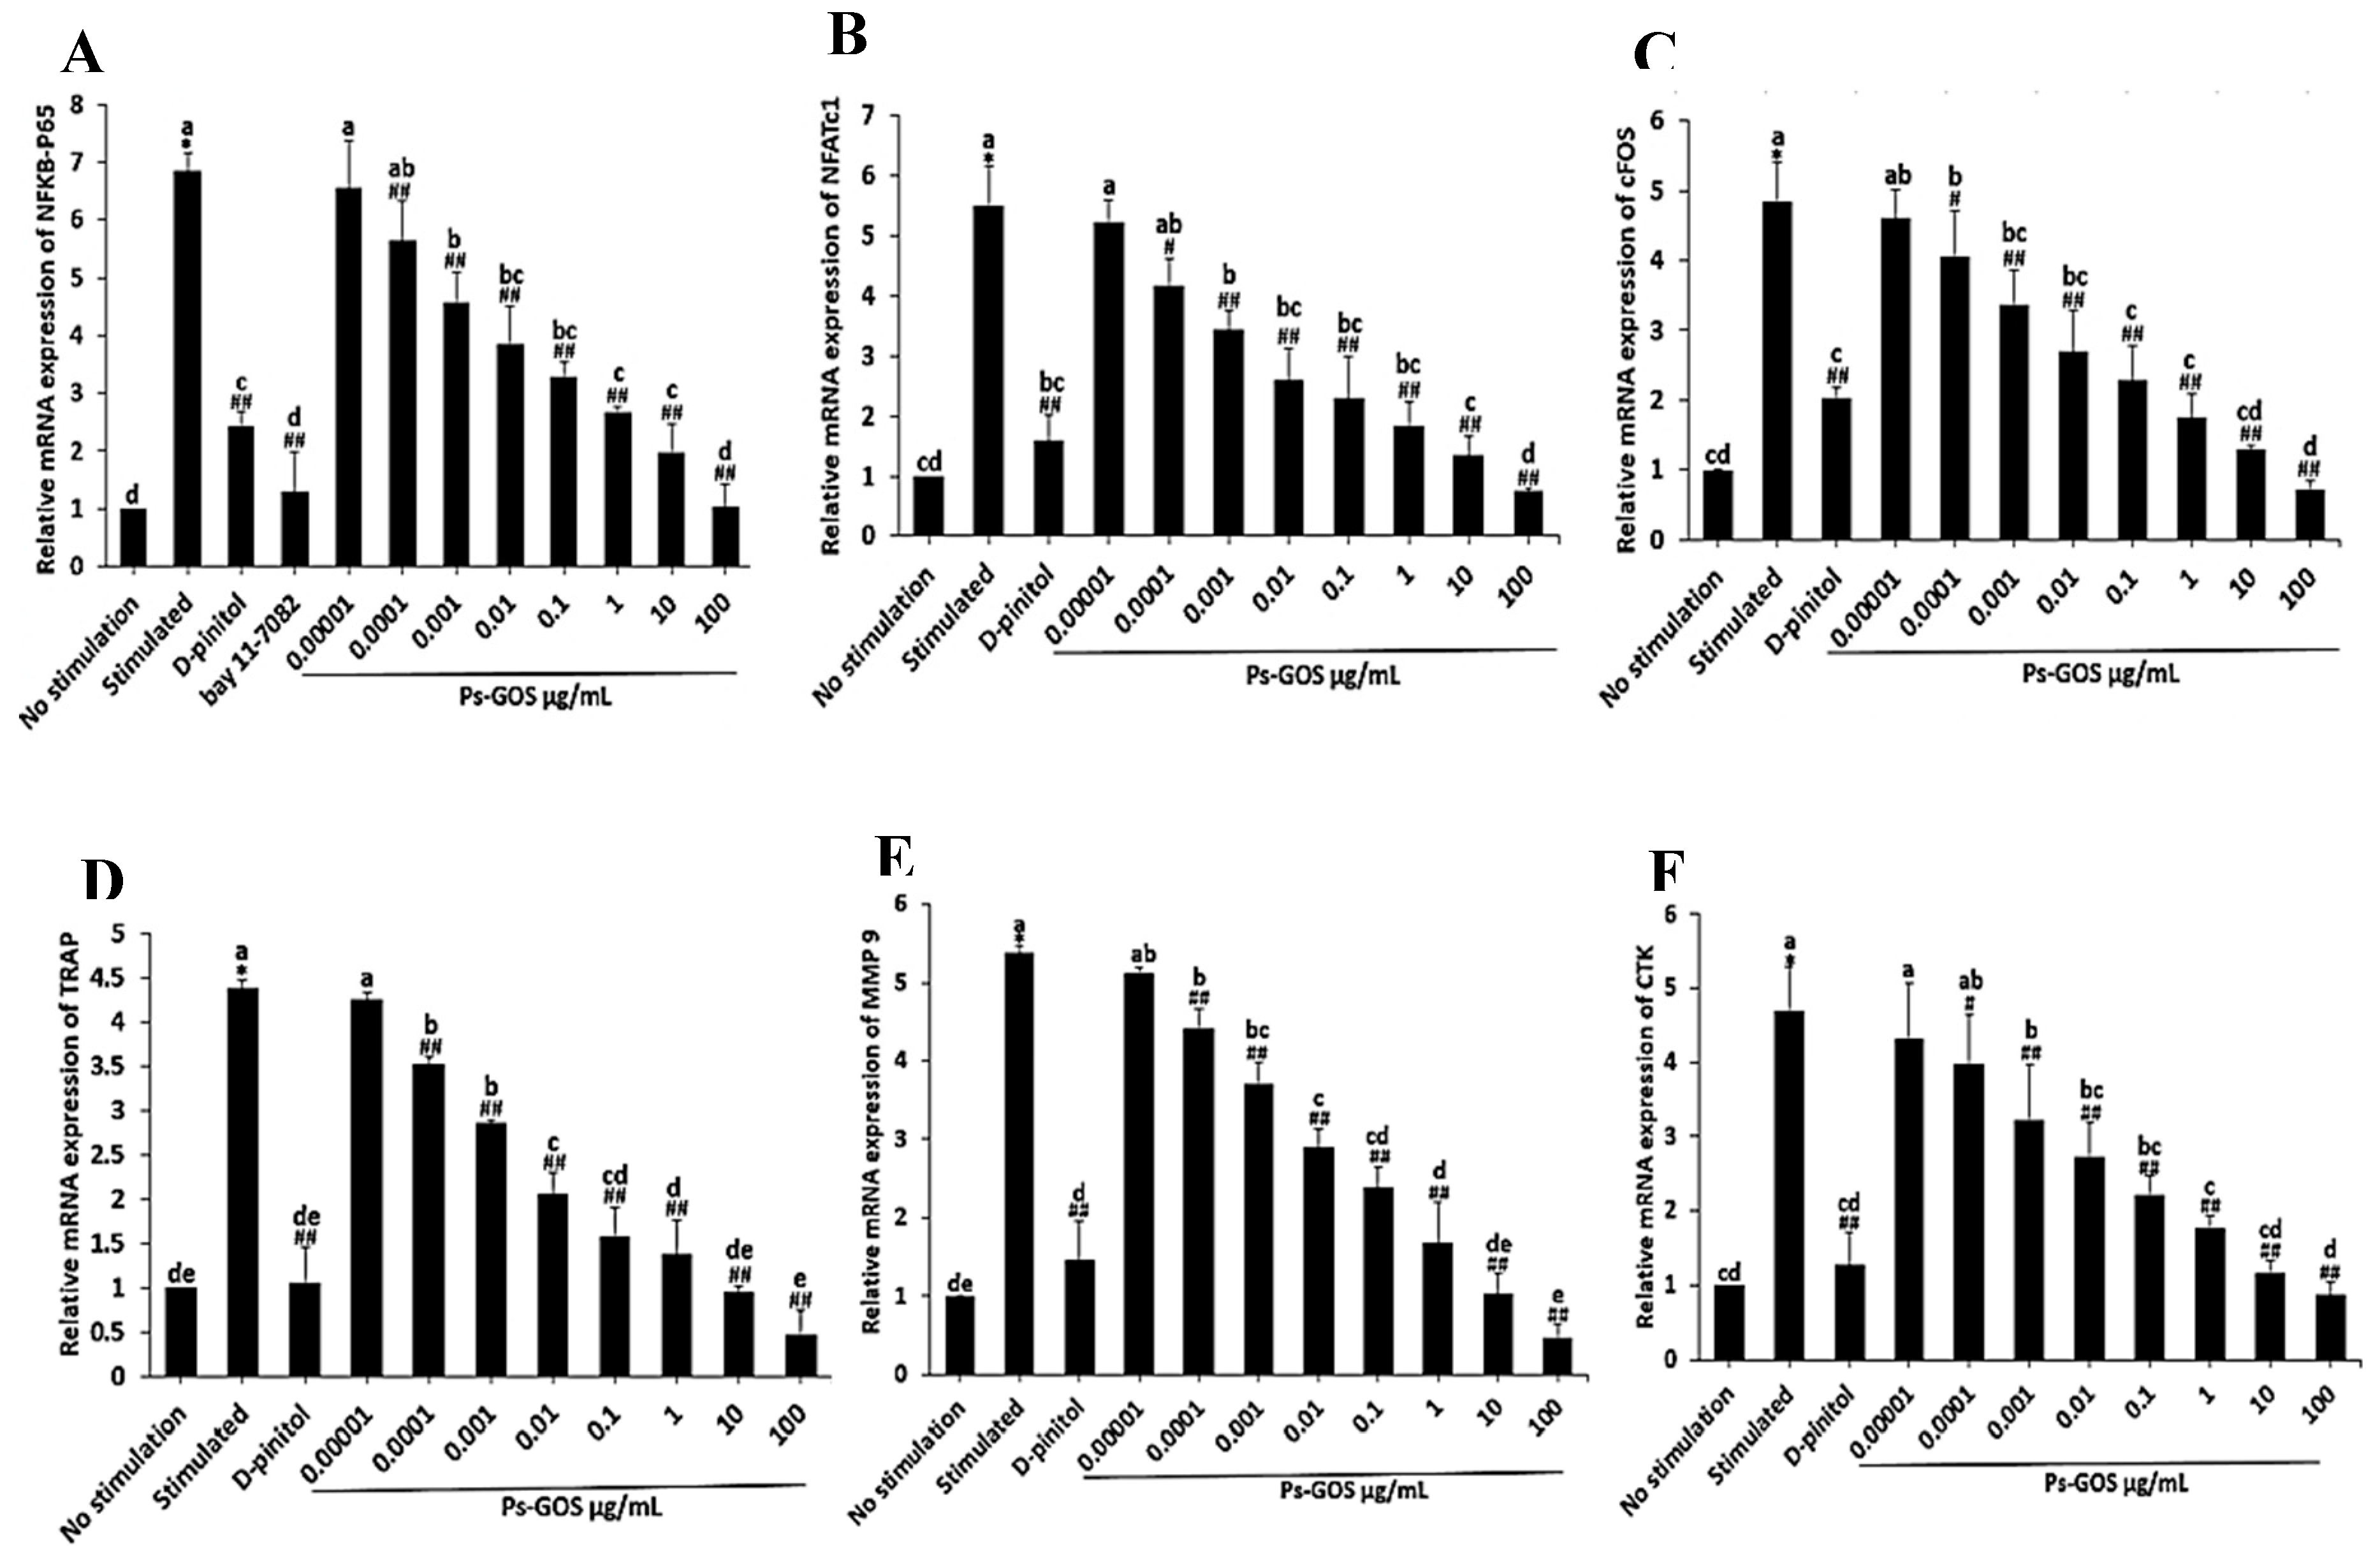
41]. Thus, to confirm the effect of Ps-GOS on RANKL-induced NFκB expression, we assessed the expression of NFκB-P65 at both the mRNA and protein levels. We found that RANKL activated NFκB-P65 expression compared with no stimulation, while Ps-GOS treatment effectively suppressed the expression of NFκB-P65 at both the transcriptional and translational levels. To further validate the inhibitory effect of Ps-GOS, cells were treated with BAY11-7082, an NFκB-P65 inhibitor. As expected, NFκB-P65 expression was suppressed by its inhibitor, and the results were consistent with those observed after Ps-GOS treatment.
Furthermore, the effects of Ps-GOS on cFOS and NFATc1, the major modulators of the osteoclast development, were also evaluated. NFATc1 is a widely known to regulate several osteoclastogenesis-related genes, including TRAP, CTK, MMP-9, and the calcitonin receptor; however, the activation of NFATc1 requires the essential cooperator c-FOS [
42]. In our present study, we found that Ps-GOS inhibited the expression of NFATc1 and cFOS, which may consequently attenuate the expression of osteoclastogenesis-related genes. This was consistent with recent work showing that glucan from baker's yeast (
Saccharomyces cerevisiae) inhibited RANKL-induced osteoclastogenesis via the suppression of NFATc1 and cFOS [
20]. A previous in vivo study revealed the osteoporotic bone phenotype in NFATc1-deficient mice due to a defect in osteoclast differentiation [
43]. Moreover, cFos-null mice developed osteopetrosis owing to the absence of osteoclast lineage commitment [
44]. All of this evidence suggests that the activation of NFκB and c-FOS is required for the recruitment of NFATc1 [
45,
46].
The stimulation of NFATc1 in osteoclast precursors contributes to the ability of mature osteoclasts by governing the osteoclast-specific genes [
42,
47]. As mentioned, TRAP digests phosphoproteins [
37,
38], MMP-9 is a gelatinase that promotes osteoclast differentiation [
48,
49], and CTK possesses the crucial ability to digest organic matrix such as collagen type I [
50]. The reduction of proteolytic enzymes, including TRAP, MMP-9, and CTK, is considered a determinant of osteoclast-resorption activity and was observed in the present study.
The RANK/RANKL/osteoprotegerin (OPG) axis play a role in regulating bone remodelling and osteoclastogenesis. RANKL and OPG are generated by osteoblasts [
51]. Binding of RANKL to RANK activates osteoclast differentiation, while OPG, a decoy receptor, interferes with RANK/RANKL interaction resulting in the suppression of osteoclastogenesis [
52,
53]. Since RANK is the initial signal transmitter activating many subsequent osteoclast signalling cascades, we, therefore, detected the effect of Ps-GOS on RANKL-induced RANK expression. Interestingly, the stimulated group demonstrated a marked increased RANK expression. Moreover, Ps-GOS treatment markedly reduced this increase in a dose-dependent manner, which may imply the inhibition of RANK/RANKL interaction and subsequent essential modulators that are obligatory for osteoclasts. Supporting this, the expression of master transcription factors, such as NFATc1 and cFOS, and their down-stream molecules, such as TRAP, CTK, and MMP-9, were significantly decreased. This further indicated the suppressive effect of Ps-GOS on osteoclast differentiation and function.
To the best of our knowledge, this study is the first to report that low molecular weight and high water soluble Ps-GOS suppresses osteoclast differentiation and bone resorption, which are accompanied by the inhibition of TRAP, CTK, and MMP-9 expression through the attenuation of the RANK/NFκB/cFOS/NFATc1 pathway. Our study is consistent with several reports demonstrating inhibitory effects of β-glucans from various sources, including glucan from baker’s yeast and curdlan (low MW), on osteoclast differentiation via the suppression of NFATc1 and activation and RANKL expression [
20,
26,
54].
Together with our previous study findings, we established the stimulatory effect of Ps-GOS on osteoblast proliferation, differentiation, and mineralization. Ps-GOS acts as a potential modulator of bone homeostasis by enhancing osteoblast-bone formation and suppressing osteoclast-bone resorption. Thus, it can be developed as a candidate for the treatment or prevention of osteoporosis.
5. Materials and Methods
5.1. Materials
Dulbecco's Modified Eagle's Medium (DMEM, No. 11965092) and cell culture reagents were obtained from Gibco (Grand Island, NY, USA). D-pinitol (No. 441252-100MG), and the TRAP staining kit (No 387A-1KT) was purchased from Sigma Aldrich (St. Louis, MO, USA). Recombinant RANKL (No. 462-TEC-010) and M-CSF (No. 416-ML-010) were purchased from R&D Systems (Minneapolis, MN, USA). All specific primers were synthesized by Macrogen (Seoul, Korea). Antibodies for NFATc1 (No. 8032S), cFOS (No. 2250S), NFκB-P65 (No. 8242S), P-NFκB-P65 (No. 3033S), and β-actin (No. 4970S) were obtained from Cell Signaling Technology (Danvers, MA, USA). Antibodies for RANK (No. sc-390655) was provided by Santa Cruz Biotechnology (Dallas, TX, USA). Ps-GOS was received from the Center for Natural Rubber Latex Biotechnology Research and Innovation Development; its extraction and purification method was detailed in a previous study [
34]. All other reagents and solvents used were supplied by a local company and were of analytical grade.
5.2. Cell Culture and Mature Osteoclast Induction
The murine RAW264.7 cell line was obtained from American Type Culture Collection (ATCC, Manassas, VA, USA), which has been widely used as a cell model for studying osteoclastogenesis. They have special characteristics such as being readily accessible, sensitive and quick to differentiate into active osteoclasts. They demonstrate homogenization of osteoclast progenitors, and are easily cultured and passed [
55]. The cell was cultured in completed DMEM medium (10% fetal bovine serum (FBS), streptomycin (100 µg/mL) and penicillin (100 units/mL)) at 37 °C and 5% CO
2. To induce mature osteoclasts formation, the cells were treated with RANKL (20 ng/mL) and M-CSF (20 ng/mL) for 5 days. The cultured media will be changed every 2 days.
5.3. Cell Viability Assay
To examine effect of Ps-GOS on cell viability, RAW 264.7 cells at a density of 5 × 10³ cells/well were seeded onto a 96-well plate. After cell attachment (overnight incubation), the cells were then incubated with various doses of Ps-GOS (0.00001, 0.0001, 0.001, 0.01, 0.1, 1, 10, 100, and 1,000 µg/ml) for 24, 48, and 72 h. After incubation, the 3-(4,5-dimethylthiazol-2-yl)-2,5-diphenyltetrazolium bromide (MTT) assay was performed. Then, formazan was dissolved in 50 mL of dimethyl sulfoxide (DMSO). Finally, we detected the optical density (OD) of each well using a microplate reader at 570 nm (Bio-tek Instruments, Winooski, VT, USA).
5.4. Osteoclast Differentiation Assay
TRAP staining was conducted to evaluate the effect of Ps-GOS on osteoclast differentiation. First, the cells (1.4 × 10³ cells/well) were seeded in a 96-well plate and divided into the following 4 groups: 1. No stimulation: cells were incubated in DMEM medium alone, 2. Stimulated: cells were cultured in DMEM medium + 20 ng/mL M-CSF and 20 ng/mL RANKL, 3. Experiment group: cells were incubated with Ps-Gos (0.00001 – 100 µg/ml) + 20 ng/mL M-CSF and 20 ng/mL RANKL, and 4. Positive control: cells were treated with 30 µM D-pinitol + 20 ng/mL M-CSF and 20 ng/mL RANKL. After 5 days of incubation, the cells were fixed with 4% paraformaldehyde and stained with the TRAP staining kit according to the manufacturer’s instructions. TRAP-positive multinucleated cells containing at least three nuclei were counted as mature osteoclasts using a light microscope (Olympus, Tokyo, Japan).
5.5. Pit Formation Assay
To evaluate the effect of Ps-GOS on bone resorptive activity, RAW 264.7 cells (1.4 × 10³ cells/well) were seeded onto Osteo Assay surface 96-well plates (No. CLS3988, Corning osteoassay, Ariz, USA) and divided into 4 group as described in Osteoclast differentiation assay. After 7 days of treatment, the cells were incubated for 5 mins with bleach solution (10%) and washed with distilled water. Finally, the pit formation areas were observed using a light microscope (Olympus, Tokyo, Japan) and analysed with Image J software (National Institutes of Health, Bethesda, USA).
5.6. Quantitative Real-Time Polymerase Chain Reaction (qRT-PCR)
RAW 264.7 cells were plated (1 × 10
5 cells/well) into 6-well plates and distributed into the following 5 groups: 1. No stimulation: cells were incubated in DMEM medium alone, 2. Stimulated: cells were cultured in DMEM medium + 20 ng/mL M-CSF and 20 ng/mL RANKL, 3. Experiment group: cells were incubated with Ps-Gos (0.00001 – 100 µg/ml) + 20 ng/mL M-CSF and 20 ng/mL RANKL, 4. Positive control: cells were treated with 30 µM D-pinitol + 20 ng/mL M-CSF and 20 ng/mL RANKL, and 5. NFƘB-P65 inhibitor: cells were treated with 2.5 µM BAY11-7082 + 20 ng/mL M-CSF and 20 ng/mL RANKL. After 3 days of treatment, total RNA was separated using TRIzol reagent (No. 15596026, Thermo Fisher Scientific Inc., Waltham, UT, USA) according to the manufacturer's indications. Subsequently, cDNA was synthesized by reverse transcription. qRT-PCR was carried out using 5x HOT FIREPol®Blend master mix (No. 04-27-00125, Solis Biodyne, Tartu, Estonia), using the following protocol: 95
oC for 15 min for initial denaturation of template cDNA, 40 cycles of denaturation (94
oC for 15 s), annealing (57
oC for 30 s) and final elongation (72
oC for 30 s). The specific primers are displayed in
Table 1. and the expression of the housekeeping gene
GAPDH was used for normalization. Relative mRNA expression of osteoclastogenic marker genes was calculated by the 2
−ΔΔCt method [
20].
5.7. Western Blot Analysis
To examine osteoclastogenic protein expression affected by Ps-GOS, RAW 264.7 cells (5 × 10⁵ cells/well) were plated onto a 6-well plate and divided into the 5 group mentioned in the qRT-PCR assay section. After incubation for 3 days, the cells were lysed with radioimmunoprecipitation assay (RIPA, No. 89900) buffer containing a phosphatase inhibitor cocktail (No. 78420) and proteinase inhibitor cocktail (No. 87786, Thermo Fisher Scientific Inc., Waltham, UT, USA), and consequently, concentrations of protein were measured using a bicinchoninic acid protein assay kit (BCA) (No. 23225, Thermo Fisher Scientific Inc., Waltham, UT, USA). An equal amount of protein was loaded onto a 12% acrylamide gel and separated using sodium dodecyl sulfate-polyacrylamide gel electrophoresis (SDS-PAGE). Separated samples were then electrotransferred to polyvinylidene difluoride membranes (No. IPVH85R, Millipore, Jaffrey, NH, USA). Then, membranes were incubated for 1 h with 5% non-fat dried milk for blocking of non-specific and incubated with a specific primary antibody (1:1,000; Cell Signaling Technology) at 4 °C overnight with continuous shaking, followed by washing with tris-buffered saline with Tween 20 (TBST) three times, and incubated with horseradish peroxidase-conjugated secondary antibodies (1:5,000; N0. 7074S, Cell Signaling Technology) for 1 h. The signals were developed using an ECL Substrate Kit (No. 32209) and then exposed to an X-ray film (No. 34089, Thermo Fisher Scientific Inc., Waltham, UT, USA). The films were scanned and analysed using Image J software.
5.8. Immunofluorescence Staining
RAW 264.7 cells were plated in a chambered coverslip (18 wells) at a density of 2 × 10⁴ cells/well and separated into the following 4 groups: 1. No stimulation: cells were incubated in DMEM medium alone, 2. Stimulated: cells were cultured in DMEM medium + 20 ng/mL M-CSF and 20 ng/mL RANKL, 3. Experiment group: cells were incubated with Ps-Gos (0.00001 – 100 µg/ml) + 20 ng/mL M-CSF and 20 ng/mL RANKL, and 4. Positive control: cells were treated with 30 µM D-pinitol + 20 ng/mL M-CSF and 20 ng/mL RANKL. After incubation for 24 h, cells were fixed with 4% paraformaldehyde and permeabilized with 0.1% Triton X-100 (No. 39487, Cell Signaling Technology, Danvers, MA). After blocking with 5% goat serum (S26-100ML, Sigma Aldrich), they were incubated with the primary anti-mouse RANK antibody (1: 500; sc-390655, Santa Cruz Biotechnology) at 4 °C overnight with shaking. Subsequently, the cells were incubated with a secondary antibody (1:200; No. sc-516141, Santa Cruz Biotechnology) for 3 h and counterstained with 4′,6-diamidino-2-phenylindole (DAPI) (No. 4083, Cell Signaling Technology, Danvers, MA) for 5 mins. Finally, mounting medium was carefully added to preserve the fluorescence signal, and photographs were taken with a fluorescence microscope (Olympus, Tokyo, Japan). The fluorescence intensity was analysed with Image J software.
5.9. Statistical Analysis
All data are displayed as mean ± standard error of mean (SEM) of a triplicated experiment. Each experiment was independently performed and resulted in similar results. Results were analysed by SPSS 23 statistical software (SPSS Inc., Chicago, IL, USA). Statistical differences were compared by one-way analysis of variance (ANOVA) followed by Tukey's and Duncan’s multiple range test. In all cases, P < 0.05 was considered statistically significant.
Authors Contribution
Conceptualization, Methodology, Investigation, Project administration, Data curation, Writing – original draft, P.R.; Methodology, Investigation, Project administration, Data curation, Writing – review & editing, A.A; Validation, Formal analysis, Writing – review & editing, C.S.; Resources, Supervision, R.W.; Resources, Supervision, Conceptualization, Methodology, Investigation, Project administration, Data curation, Validation, Funding acquisition, Writing – review & editing, T.W. All authors read and approved the final manuscript.
Figure 1.
Effect of Ps-GOS on RAW 264.7 cell viability. Cells were treated with various dosages of Ps-GOS for (A) 24, (B) 48, and (C) 72 h, and cell viability was examined using the MTT assay. Data are shown as mean ± SEM of three experiments that were independently performed. *P < 0.05 or **P < 0.01 compared to untreated control cells.
Figure 2.
Effect of Ps-GOS on formation of multinucleated osteoclast induced by RANKL. (A) RAW 264.7 cells were seeded onto a 96-well plate (1.4 × 10³ cells/well) and separated into 4 groups: 1. No stimulation: cells were incubated in DMEM medium alone, 2. Stimulated: cells were cultured in DMEM medium + 20 ng/mL M-CSF and 20 ng/mL RANKL, 3. Experiment group: celles were incubated with Ps-Gos (0.00001 – 100 µg/ml) + 20 ng/mL M-CSF and 20 ng/mL RANKL, and 4. Positive control: cells were treated with 30 µM of D-pinitol + 20 ng/mL M-CSF and 20 ng/mL RANKL. TRAP staining was conducted after day 5 of incubation. (B) Number of TRAP-positive cells/well. (C) TRAP-positive cells/area that contained three nuclei or more were counted. Results are shown as mean ± SEM of triplicated experiments that were independently performed. The columns that present different letters were significantly different at P < 0.05.
Figure 3.
Effect of Ps-GOS on osteoclastic bone-resorptive activity. RAW 264.7 cells were plated onto Osteo Assay 96-well plates and divided to the 4 groups as previously described. After 7 days, the pit formation assay was carried out. (A) Resorption pits were observed using a light microscope (scale bar = 50 μm). (B) The analysed images and (C) percentage of resorption area were quantified using Image J software. Data are shown as mean ± SEM of three experiments that were independently performed. The columns that present different letters were significantly different at P < 0.05.
Figure 4.
Ps-GOS suppressed mRNA expression of osteoclastogenic transcription factor genes. RAW 264.7 cells were seed onto 6-well plates and divided into 5 groups: 1. No stimulation: cells were incubated in DMEM medium alone, 2. Stimulated: cells were cultured in DMEM medium + 20 ng/mL M-CSF and 20 ng/mL RANKL, 3. Experiment group: cells were incubated with Ps-Gos (0.00001 – 100 µg/ml) + 20 ng/mL M-CSF and 20 ng/mL RANKL, 4. Positive control: cells were treated with 30 µM D-pinitol + 20 ng/mL M-CSF and 20 ng/mL RANKL, and 5. NFƘB-P65 inhibitor: cells were treated with 2.5 µM of BAY11-7082 + 20 ng/mL M-CSF and 20 ng/mL RANKL. After 3 days of incubation, the mRNA level of (A) NFκB-P65, (B) NFATc1, (C) cFOS, (D) TRAP, (E) MMP-9, and (F) CTK were evaluated using qRT-PCR. Data are shown as mean ± SEM of three experiments that were independently performed. The columns that present different letters were significantly different at P < 0.05.
Figure 5.
Ps-GOS down-regulated protein expression of NFκB-P65 and its down-stream molecules. RAW 264.7 cells were seeded onto 6-well plates and divided to 5 groups: 1. No stimulation: cells were incubated in DMEM medium alone, 2. Stimulated: cells were cultured in DMEM medium + 20 ng/mL M-CSF and 20 ng/mL RANKL, 3. Experiment group: cells were incubated with Ps-Gos (0.00001 – 100 µg/ml) + 20 ng/mL M-CSF and 20 ng/mL RANKL, 4. Positive control: cells were treated with 30 µM D-pinitol + 20 ng/mL M-CSF and 20 ng/mL RANKL, and 5. NFƘB-P65 inhibitor: cells were treated with 2.5 µM BAY11-7082 + 20 ng/mL M-CSF and 20 ng/mL RANKL. After treatment, western blot was carried out to examine expression of (A) NFκB-P65 and P-NFκB-P65, (B) NFATc and cFOS and (C), (D), (E), (F) their signal intensity were quantified using Image J software. Data are shown as mean ± SEM of three experiments that were independently performed. The columns that present different letters were significantly different at P < 0.05.
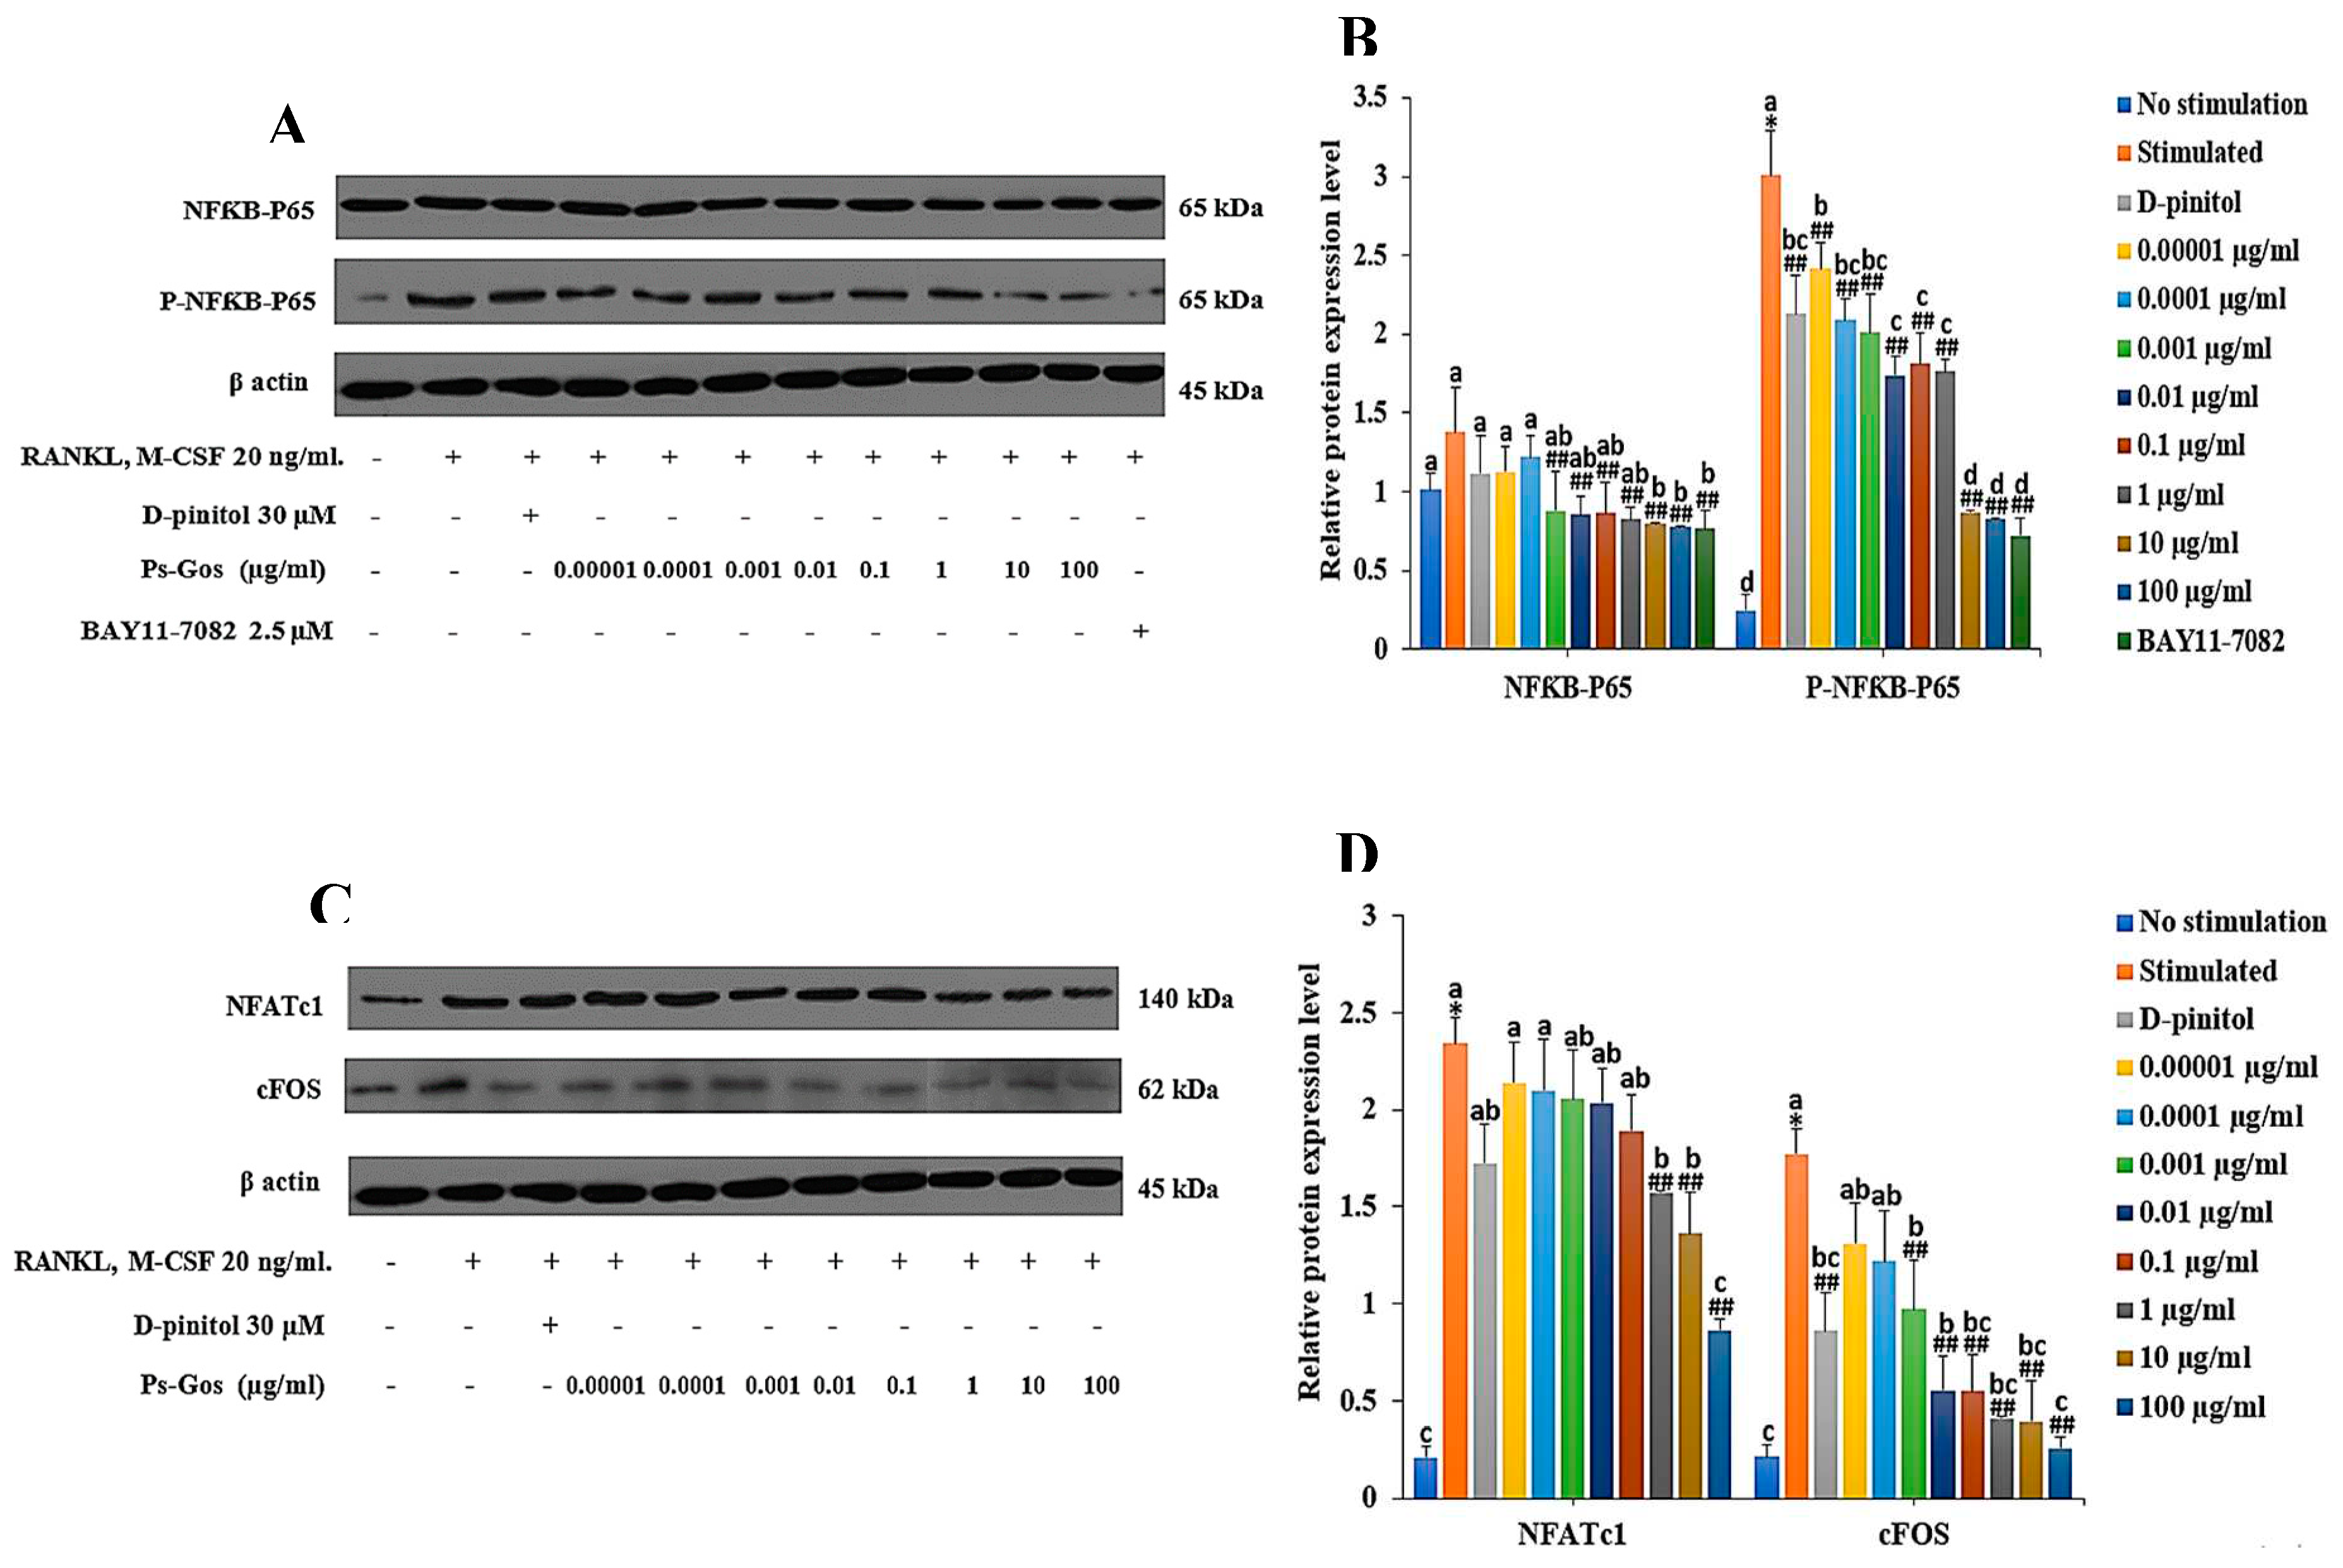
Figure 6.
Ps-GOS significantly suppressed RANKL-induced RANK expression. RAW 264.7 cells were plated in chambered coverslip (18 wells) and separated to 4 groups: 1. No stimulation: cells were incubated in DMEM medium alone, 2. Stimulated group: cells were cultured in DMEM medium + 20 ng/mL M-CSF and 20 ng/mL RANKL, 3. Experiment group: cells were incubated with Ps-Gos (0.00001 – 100 µg/ml) + 20 ng/mL M-CSF and 20 ng/mL RANKL, 4. Positive control: cells were treated with 30 µM D-pinitol + 20 ng/mL M-CSF and 20 ng/mL . After 24 h of incubation, an immunofluorescence assay was carried out. (A) Fluorescence in the treated cells was captured using a fluorescence microscope (20 × magnification) and (B) analysed using Image J software. Data are shown as mean ± SEM of three experiments that were independently performed. The columns that present different letters were significantly different at P < 0.05.
Table 1.
Primer sequences of qRT-PCR.
Table 1.
Primer sequences of qRT-PCR.
| Gene |
Sequence |
GenBank Accession No. |
| NF-κB-P65 |
F: TCACCGGCCTCATCCACAT |
XM_006531694.4 |
| R: TGGCTAATGGCTTGCTCCAG |
| NFATc1 |
F: CACACACCCCGCATGTCA |
NM_001164110.1 |
| R: CGGGCCGCAAAGTTTCTC |
| TRAP |
F: TGGATTCATGGGTGGTGCTG |
XM_006509946.3 |
| R: CGTCCTCAAAGGTCTCCTGG |
| c-Fos |
F: AGCTCCCACCAGTGTCTACC |
NM_010234.3 |
| R: TCACCGTGGGGATAAAGTTGG |
| Cathepsin K |
F: AGTAGCCACGCTTCCTATCC |
NM_007802.4 |
| R: GAGAGGCCTCCAGGTTATGG |
| MMP-9 |
F: CTCTGCTGCCCCTTACCAG |
NM_013599.5 |
| R: CACAGCGTGGTGTTCGAATG |
| GAPDH |
F: AGGTCGGTGTGAACGGATTTG |
XM_036165840.1 |
| R:TGTAGACCATGTAGTTGAGGTCA |
