Submitted:
17 January 2024
Posted:
18 January 2024
You are already at the latest version
Abstract
Keywords:
1. Introduction
2. Radon production, transport and gas migration
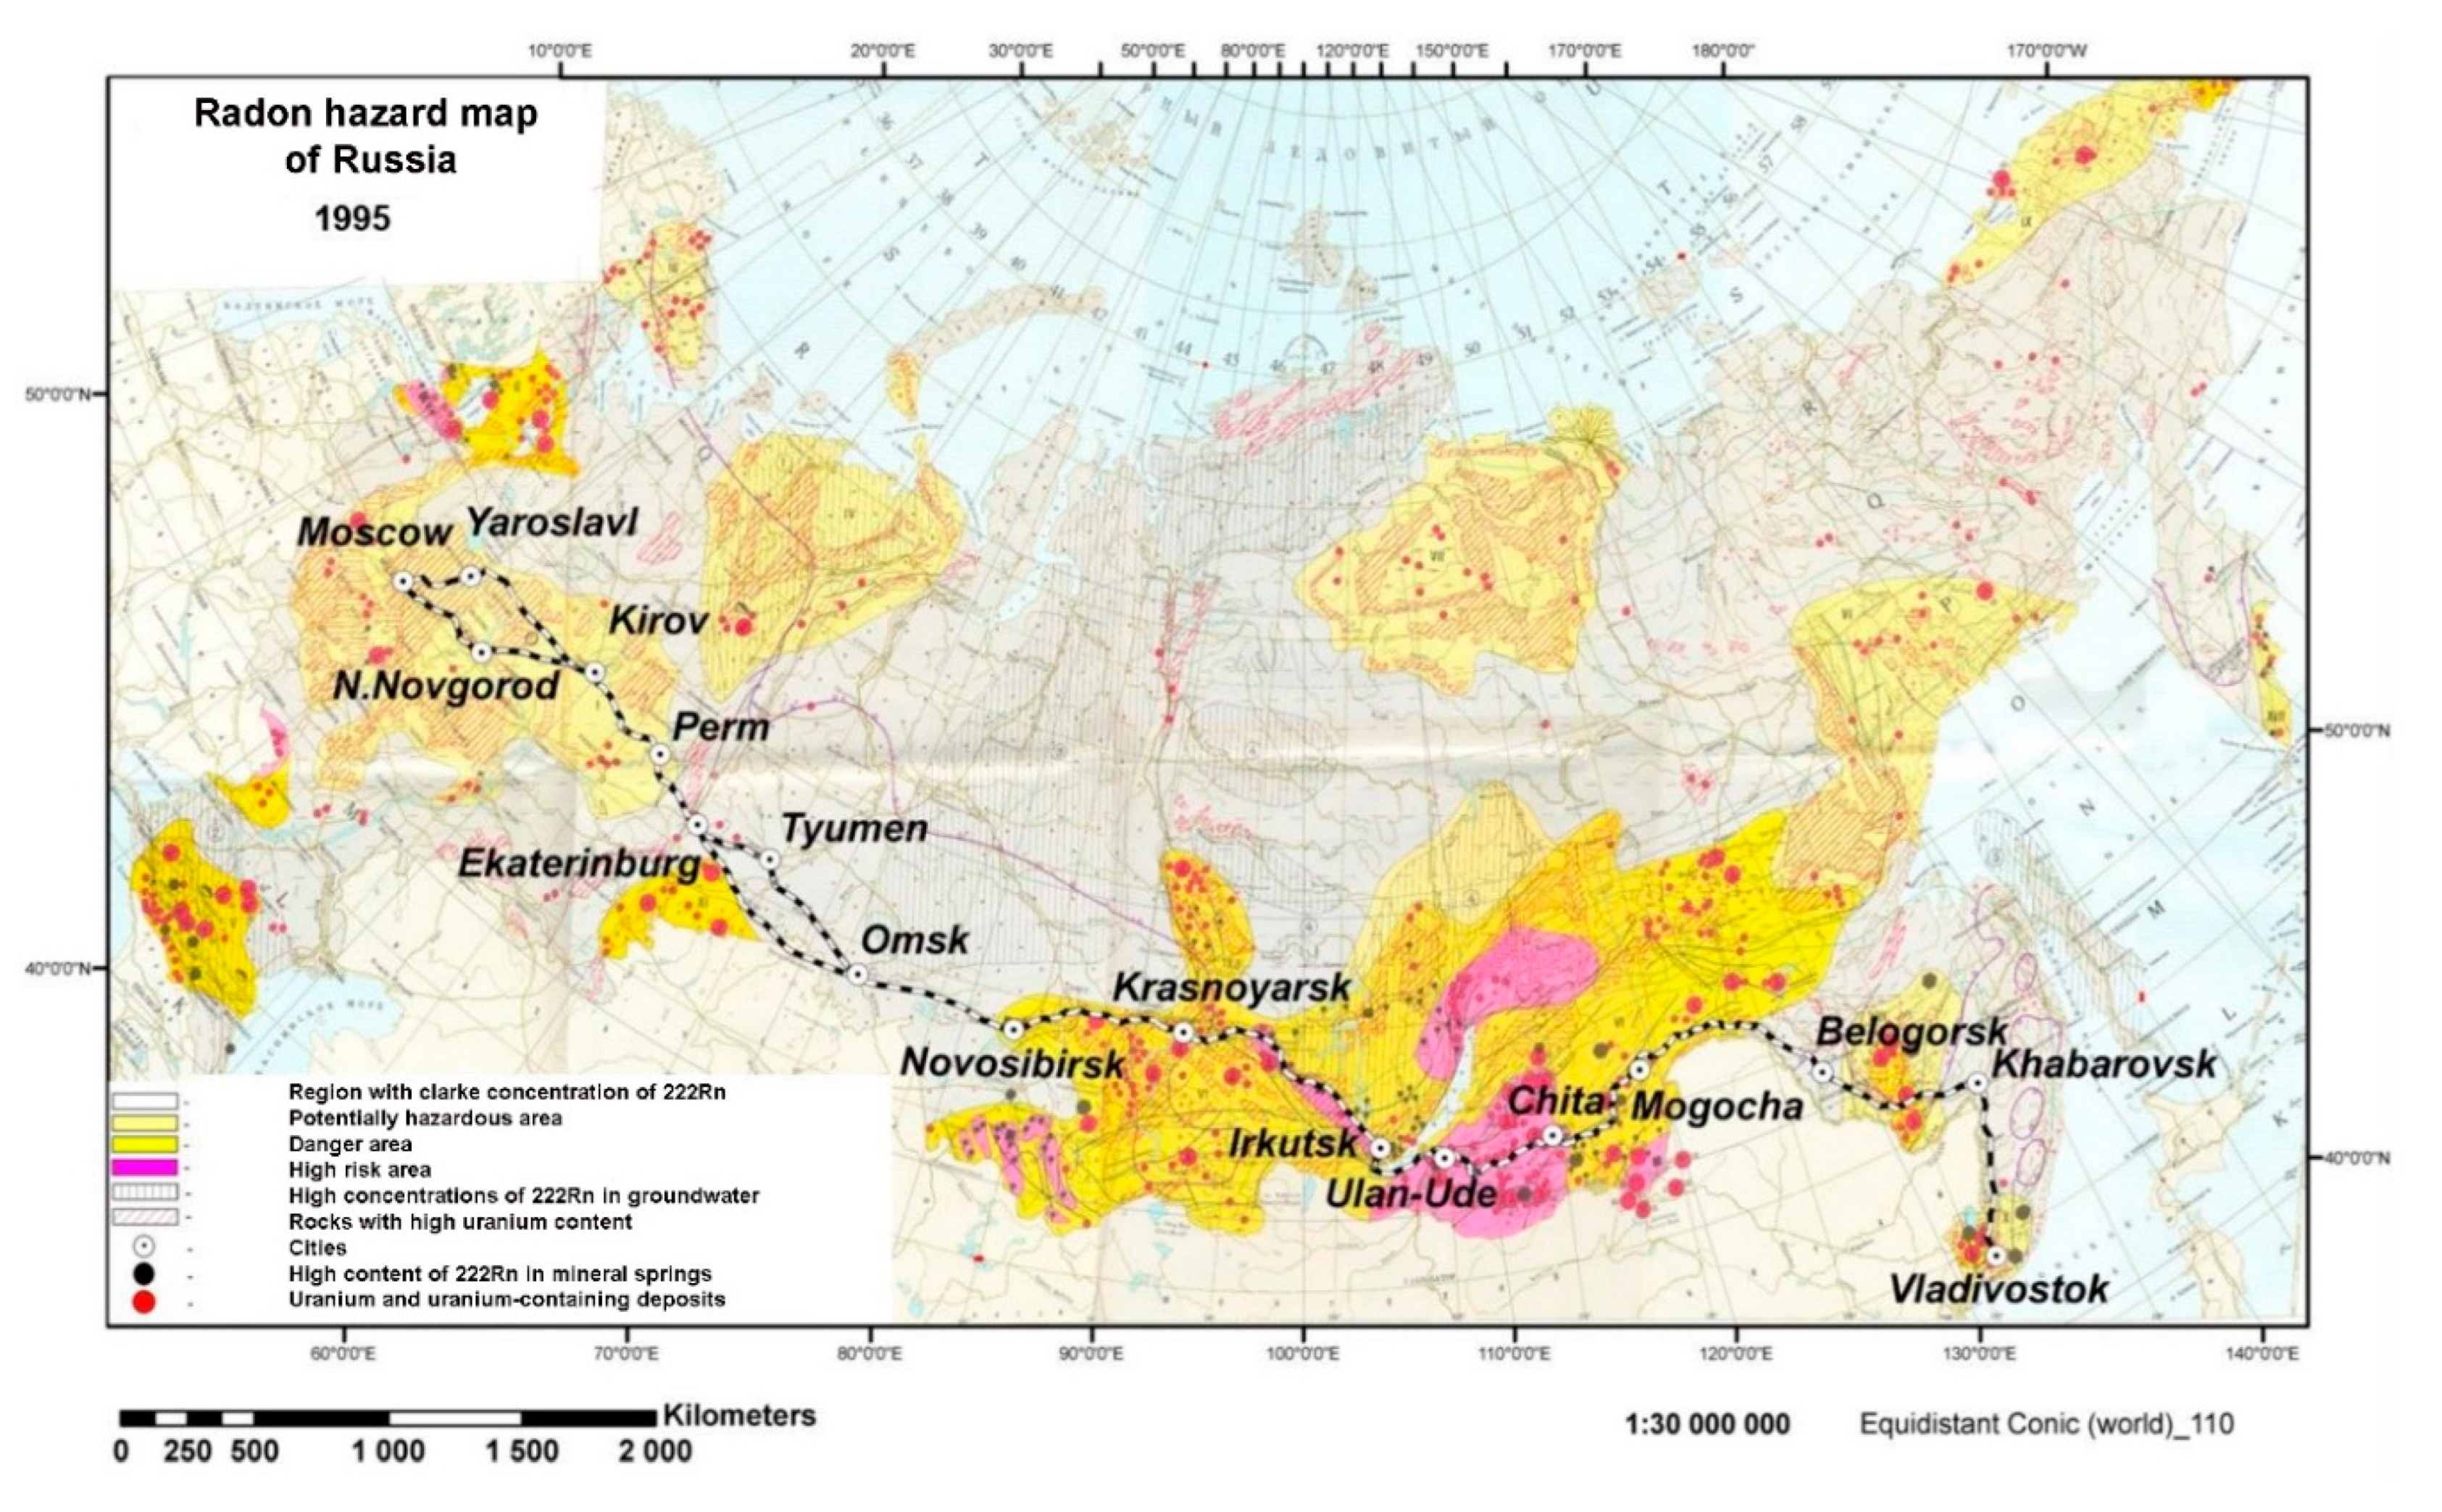
3. Multifactor sources of the radon variability
- Various sources of radon (surface layer and deep sources, local anomalies)
- Ways for bringing radon to the surface (diffusion, radon transport by geogas and fluids)
- Place and environment where measurements are taken (underground, in soil, in water, on the surface indoors, on an open surface)
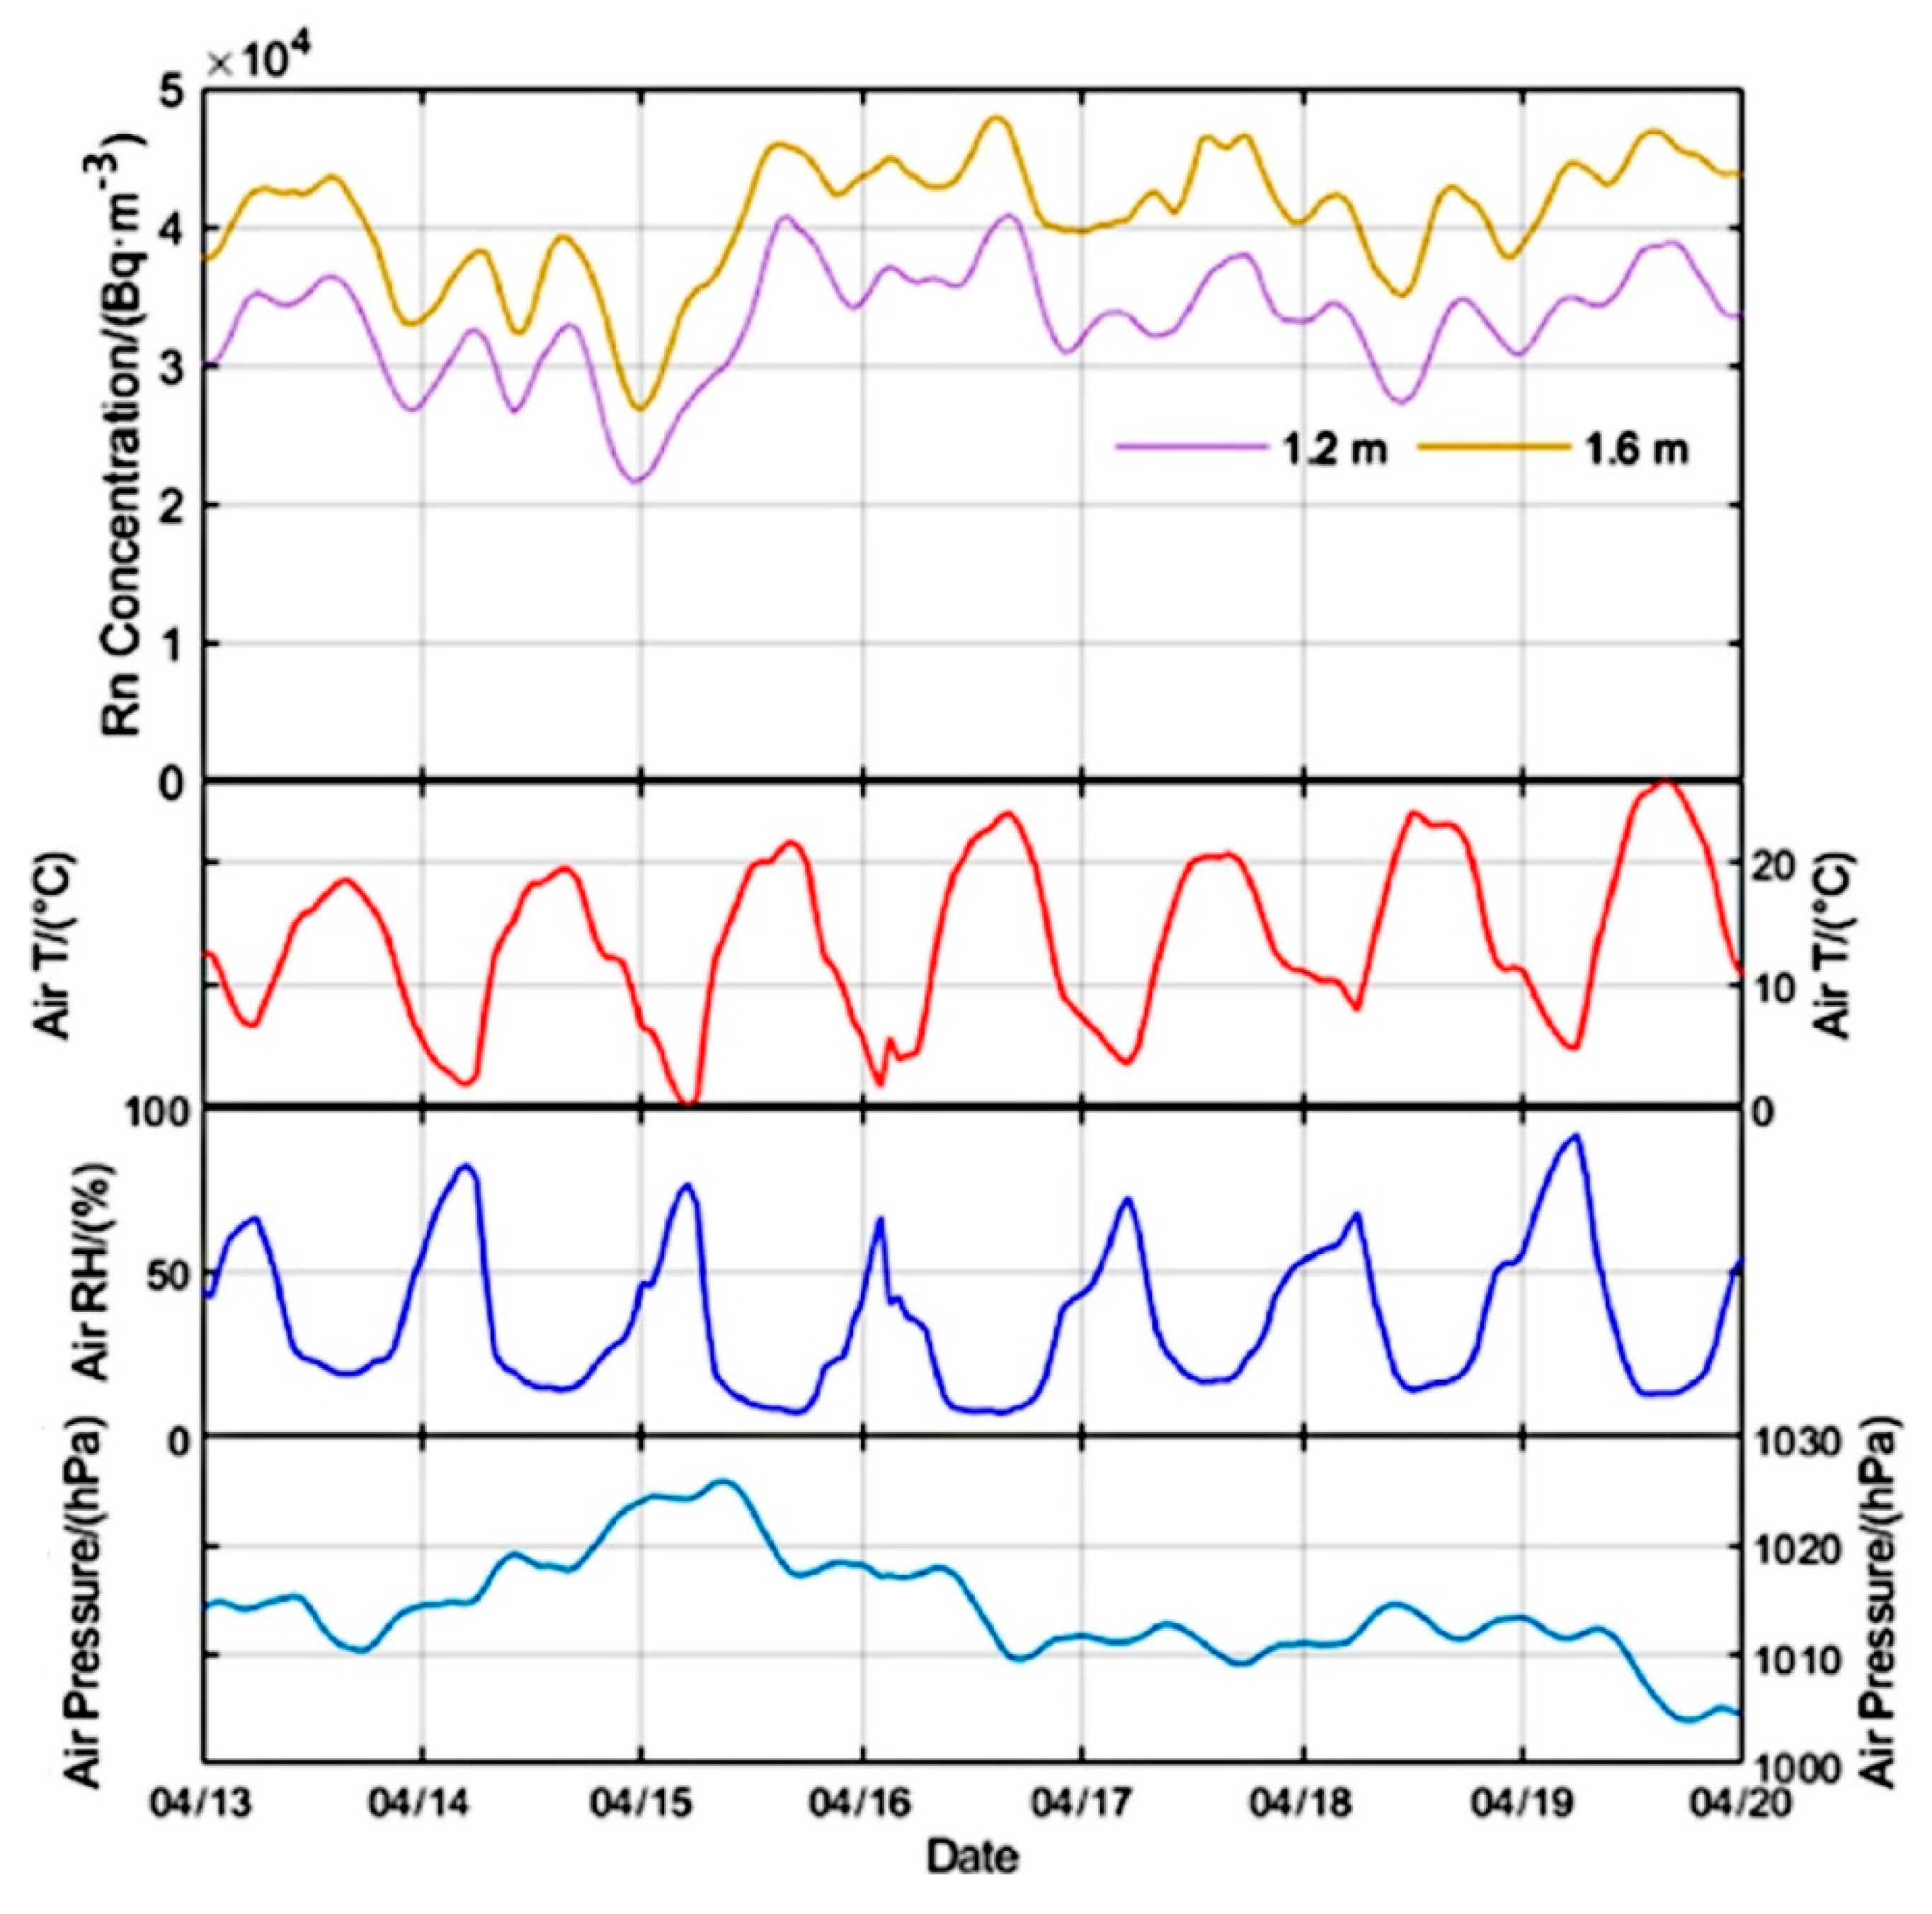
- Atmospheric influences (air humidity, air temperature, atmospheric pressure, air movements – advection and convection)
- Gravitational deformations (diurnal tides, monthly and seasonal variations)
- Method of measurement (alpha sensors, gamma sensors, gamma spectrometers)
- Seismically quiet and seismically active regions
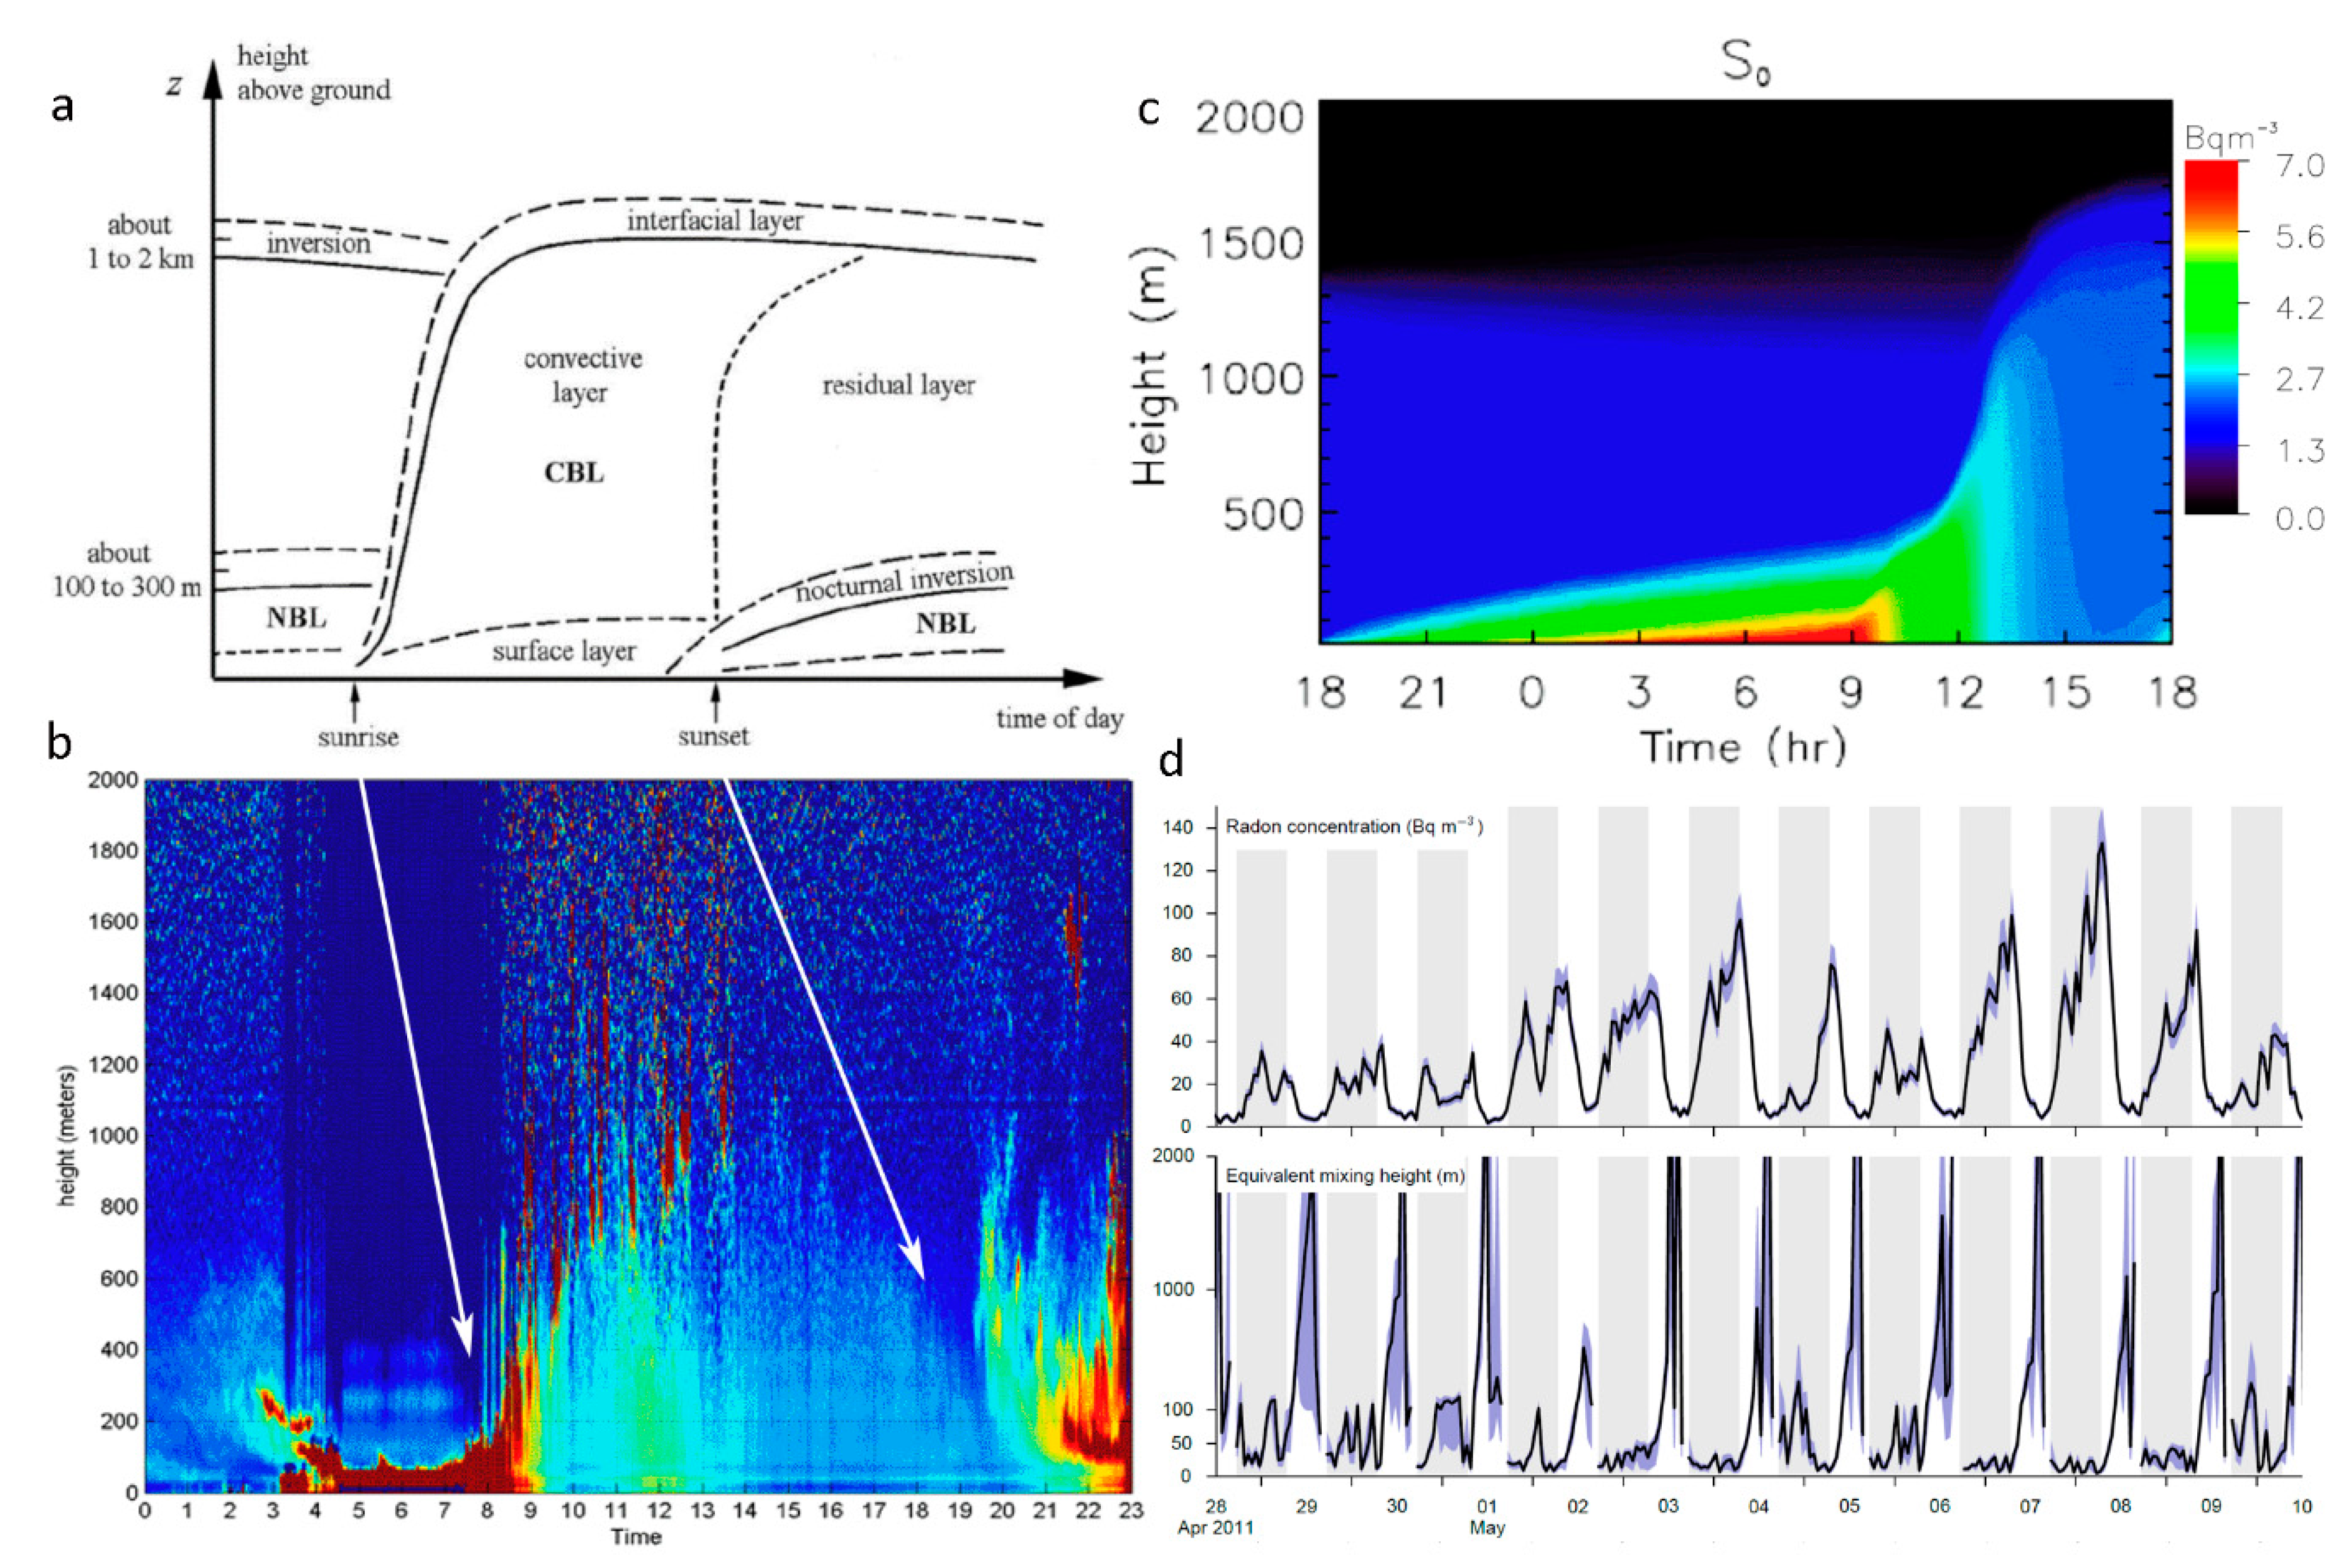
3.1. Daily radon variations
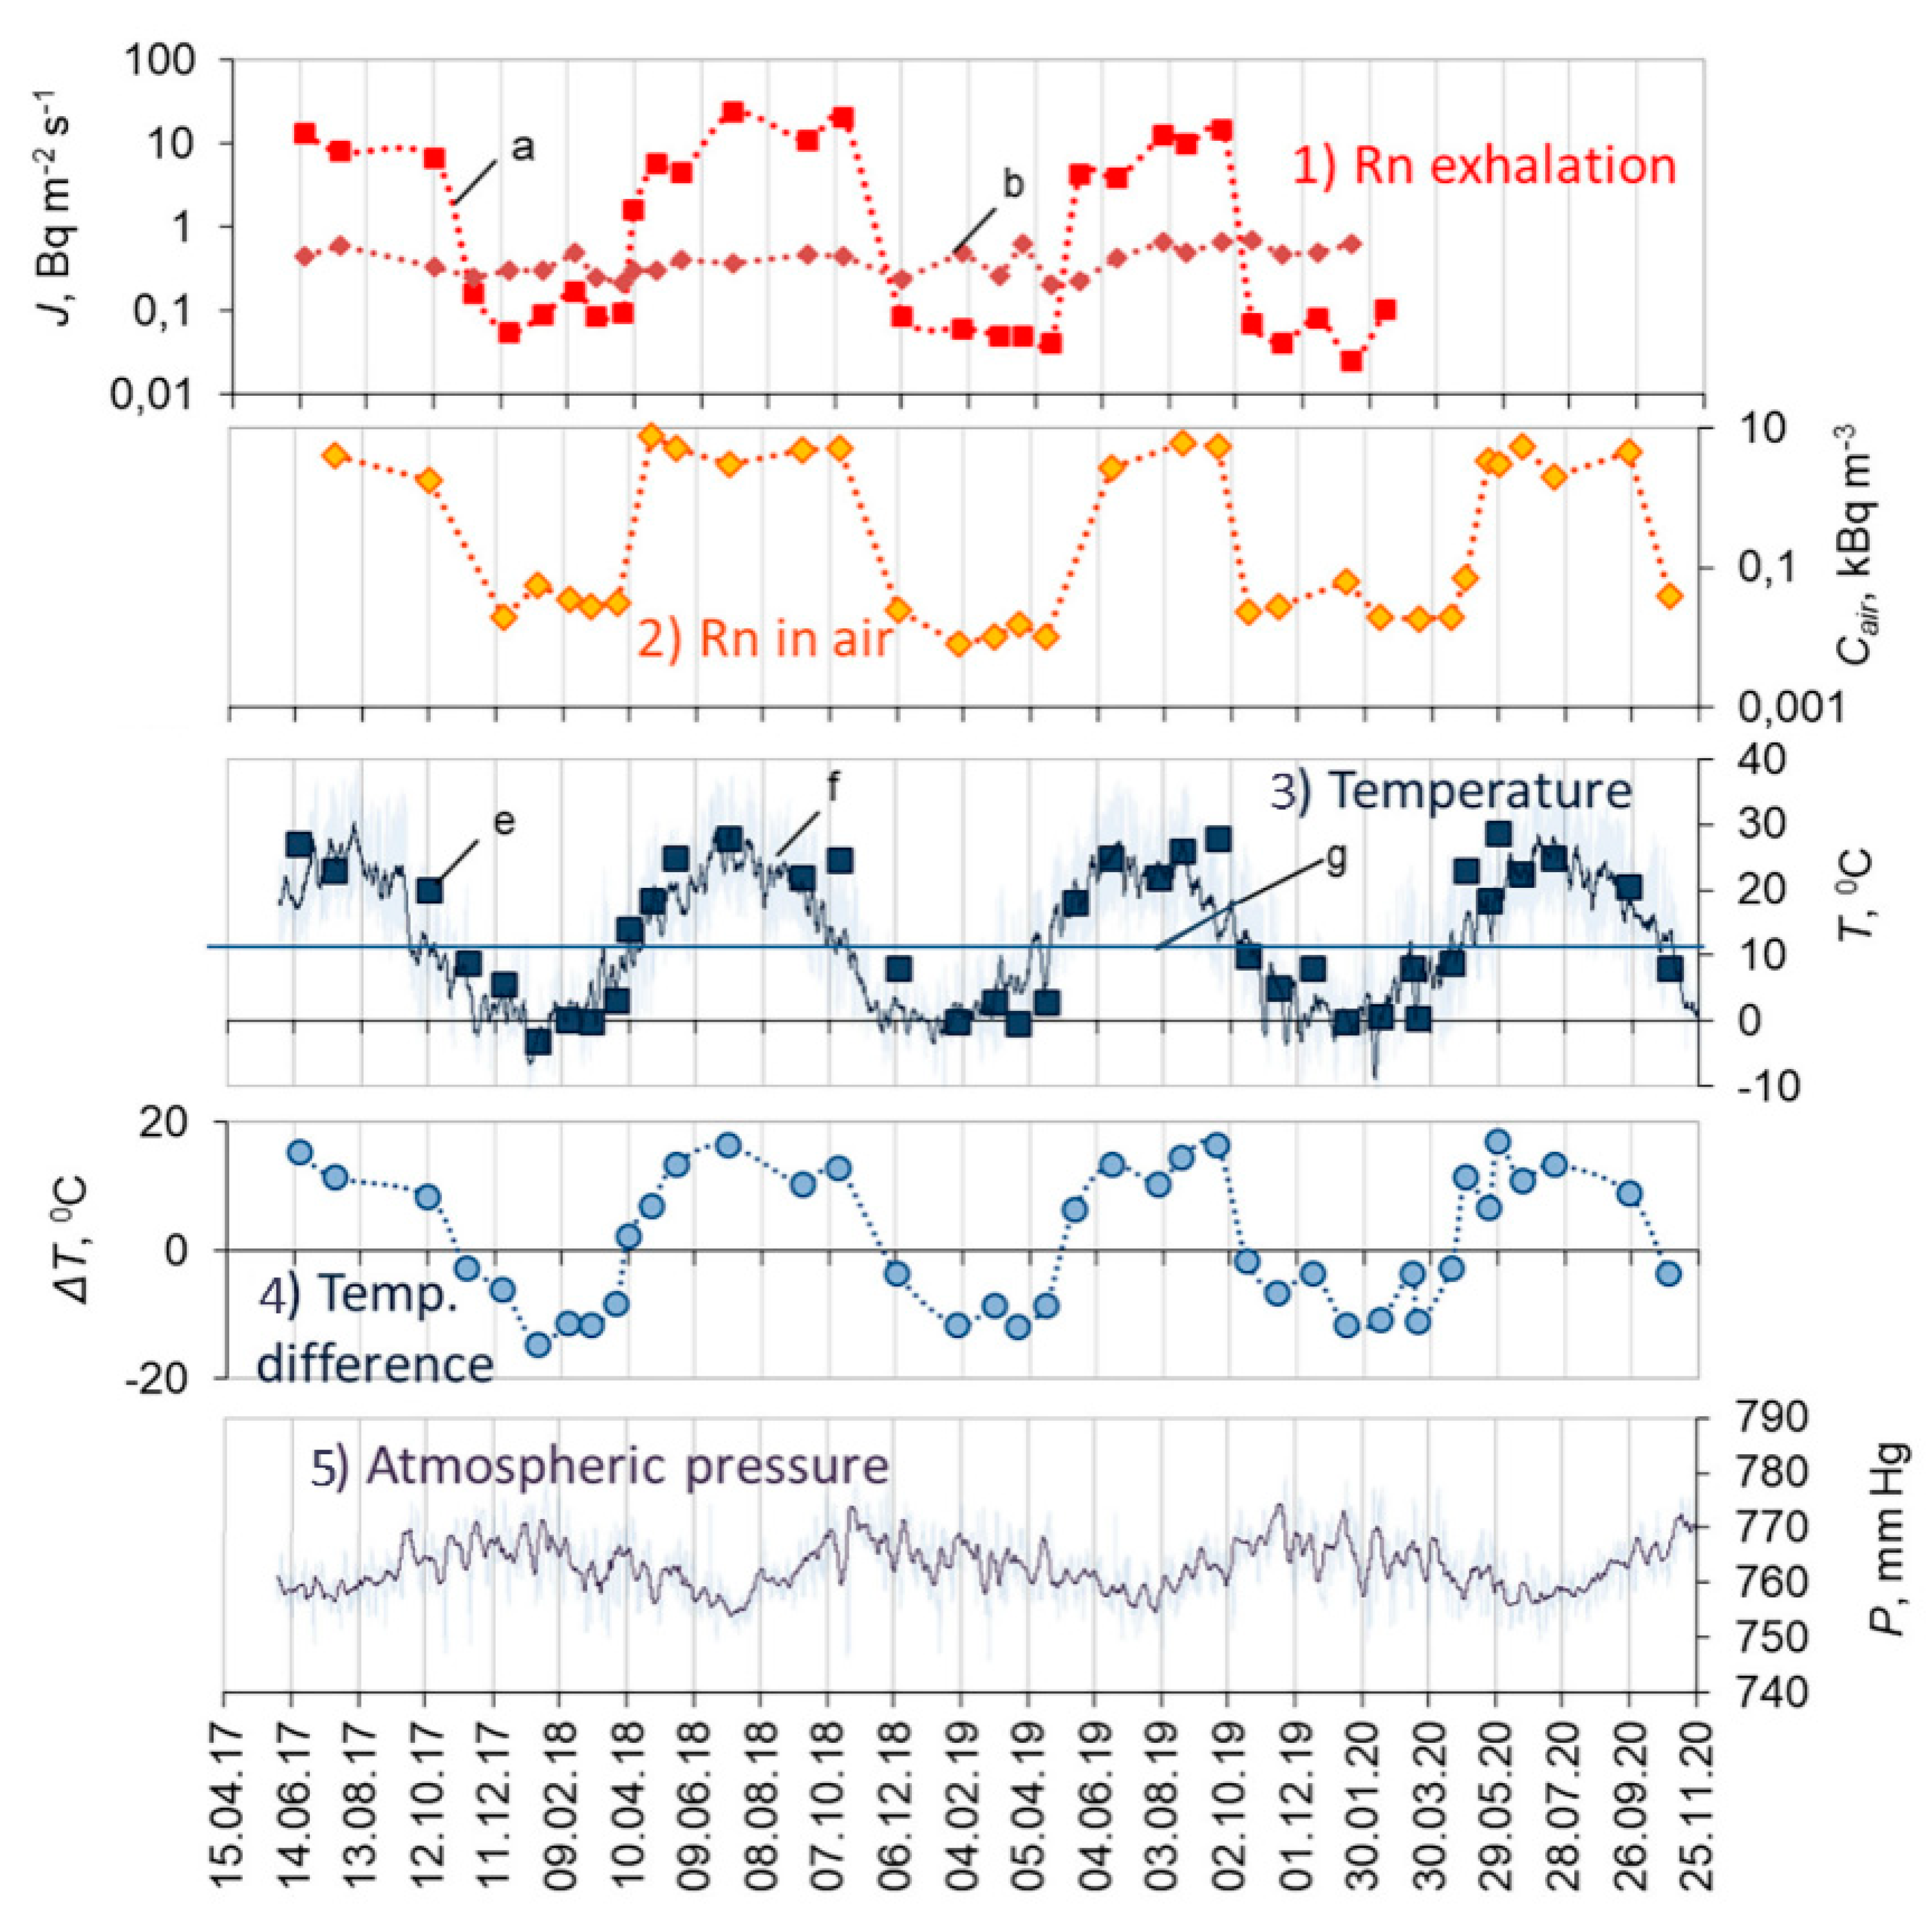
3.2. Seasonal radon variations
- Radon within a rock media (as measured by gamma detectors) is driven by the surface temperature gradient to a depth of 100 m, with the same daily cycle, and a specific time lag.
- Radon in the measuring air space of open boreholes (as measured by alpha detectors) is driven by pressure. It varies in anti-correlation with the intra-seasonal pressure waves and the semi-daily pressure periodicity.
3.3. Radon variations and solar activity
3.4. How to measure radon
3.5. How to distinguish the soil and tectonic origin radon
4. Radon as diagnostic means and an earthquake precursor
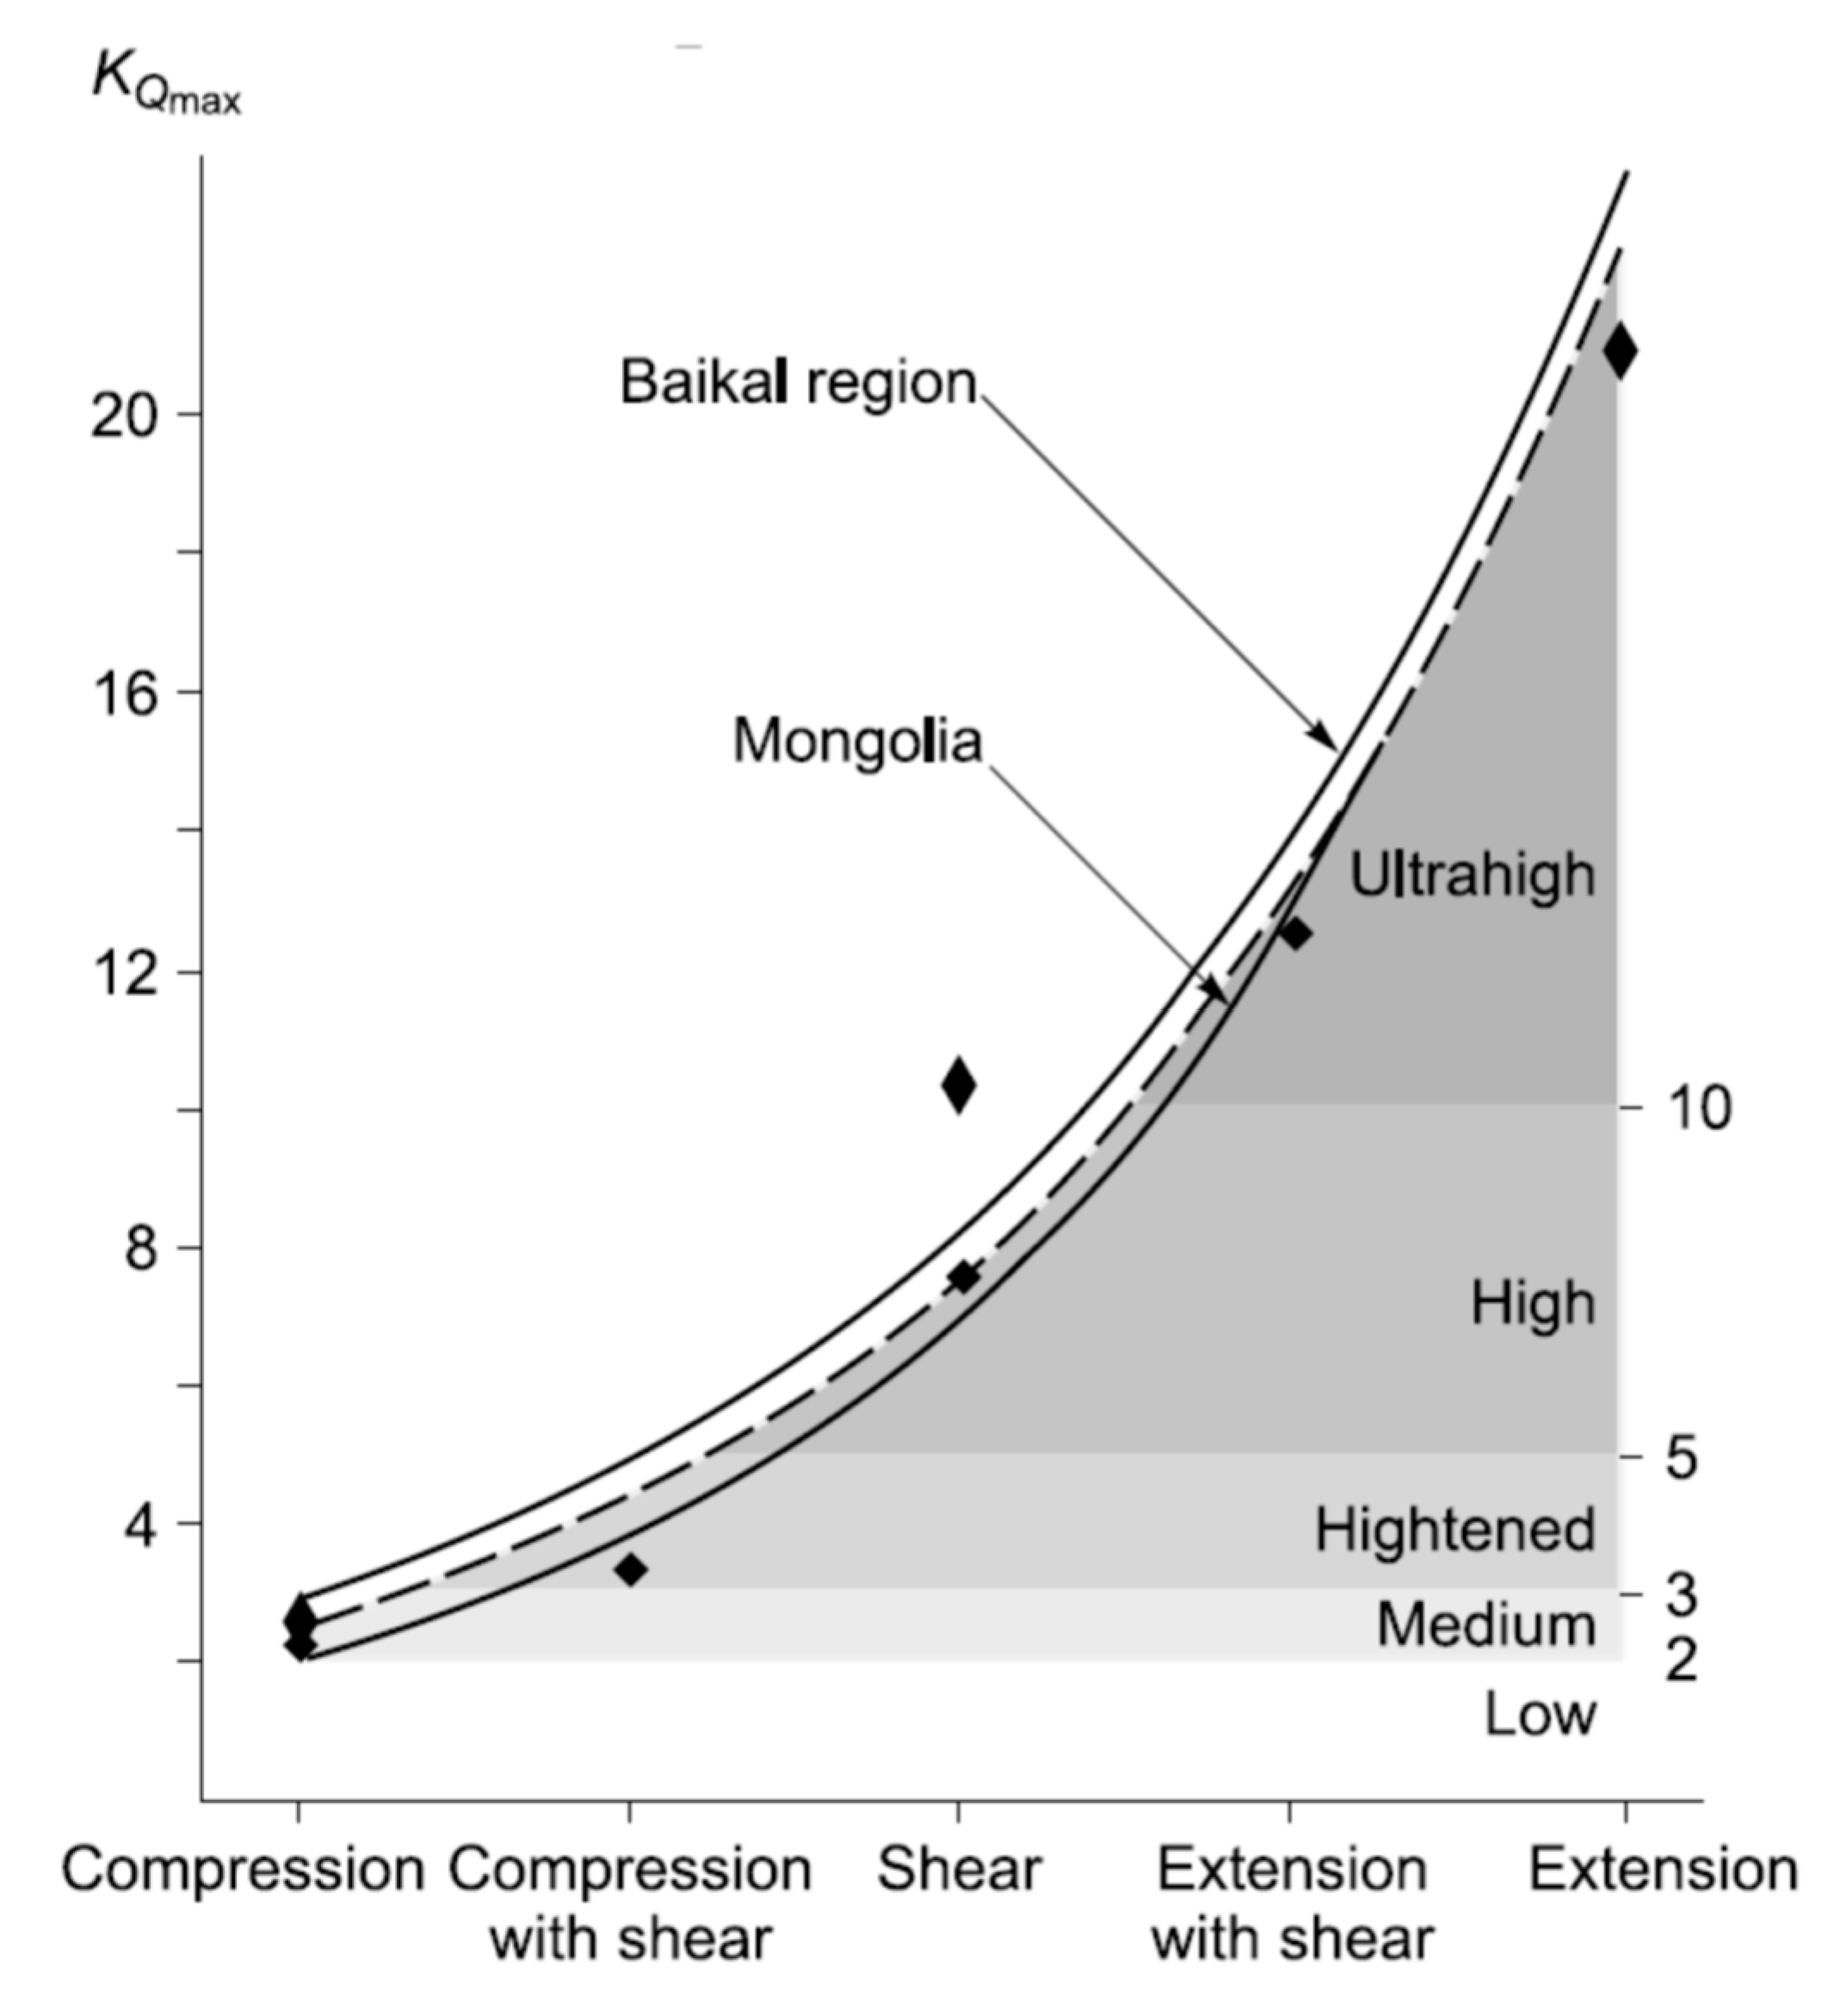
4.1. Radon activity as measure of tectonic stress
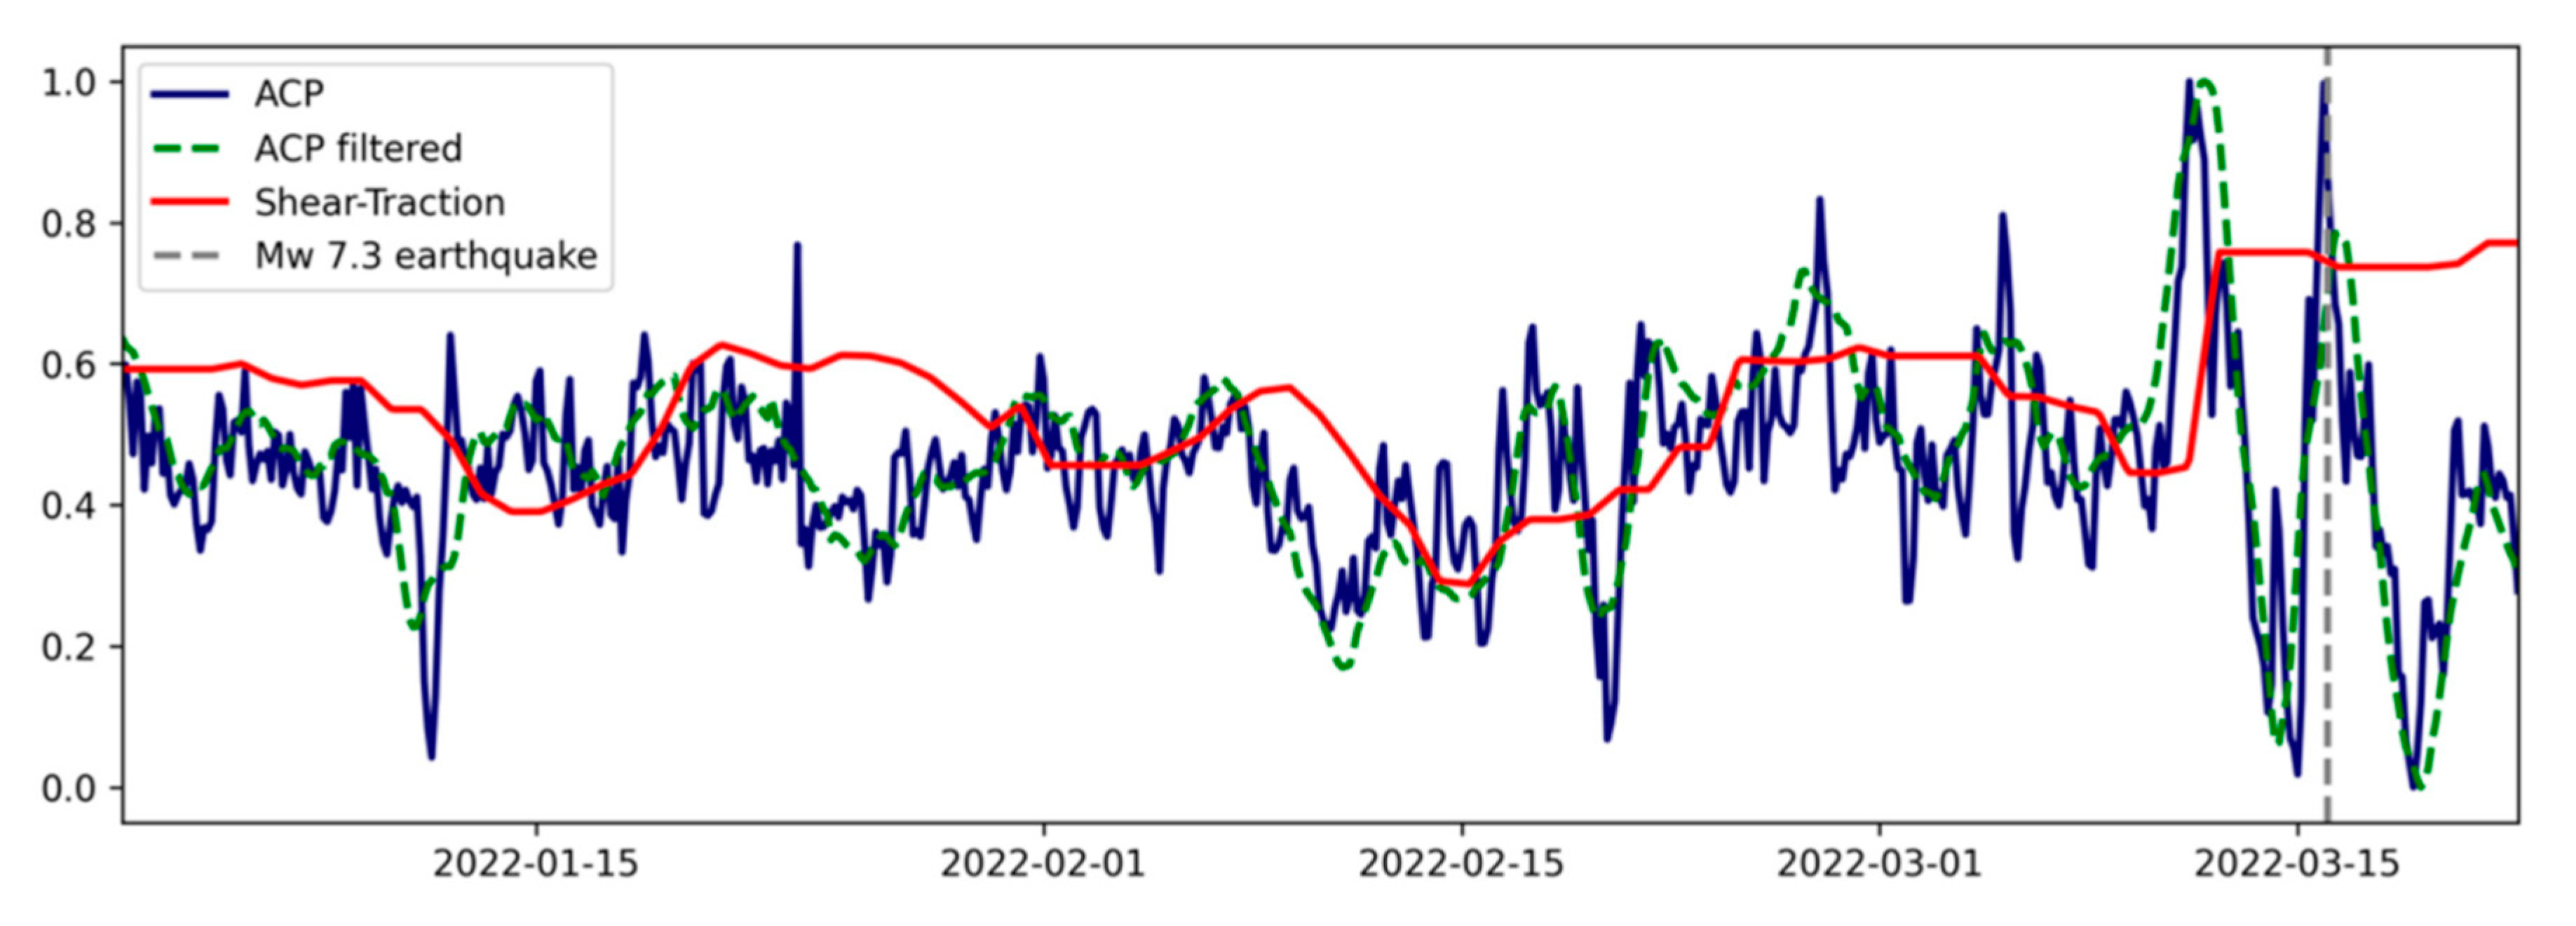
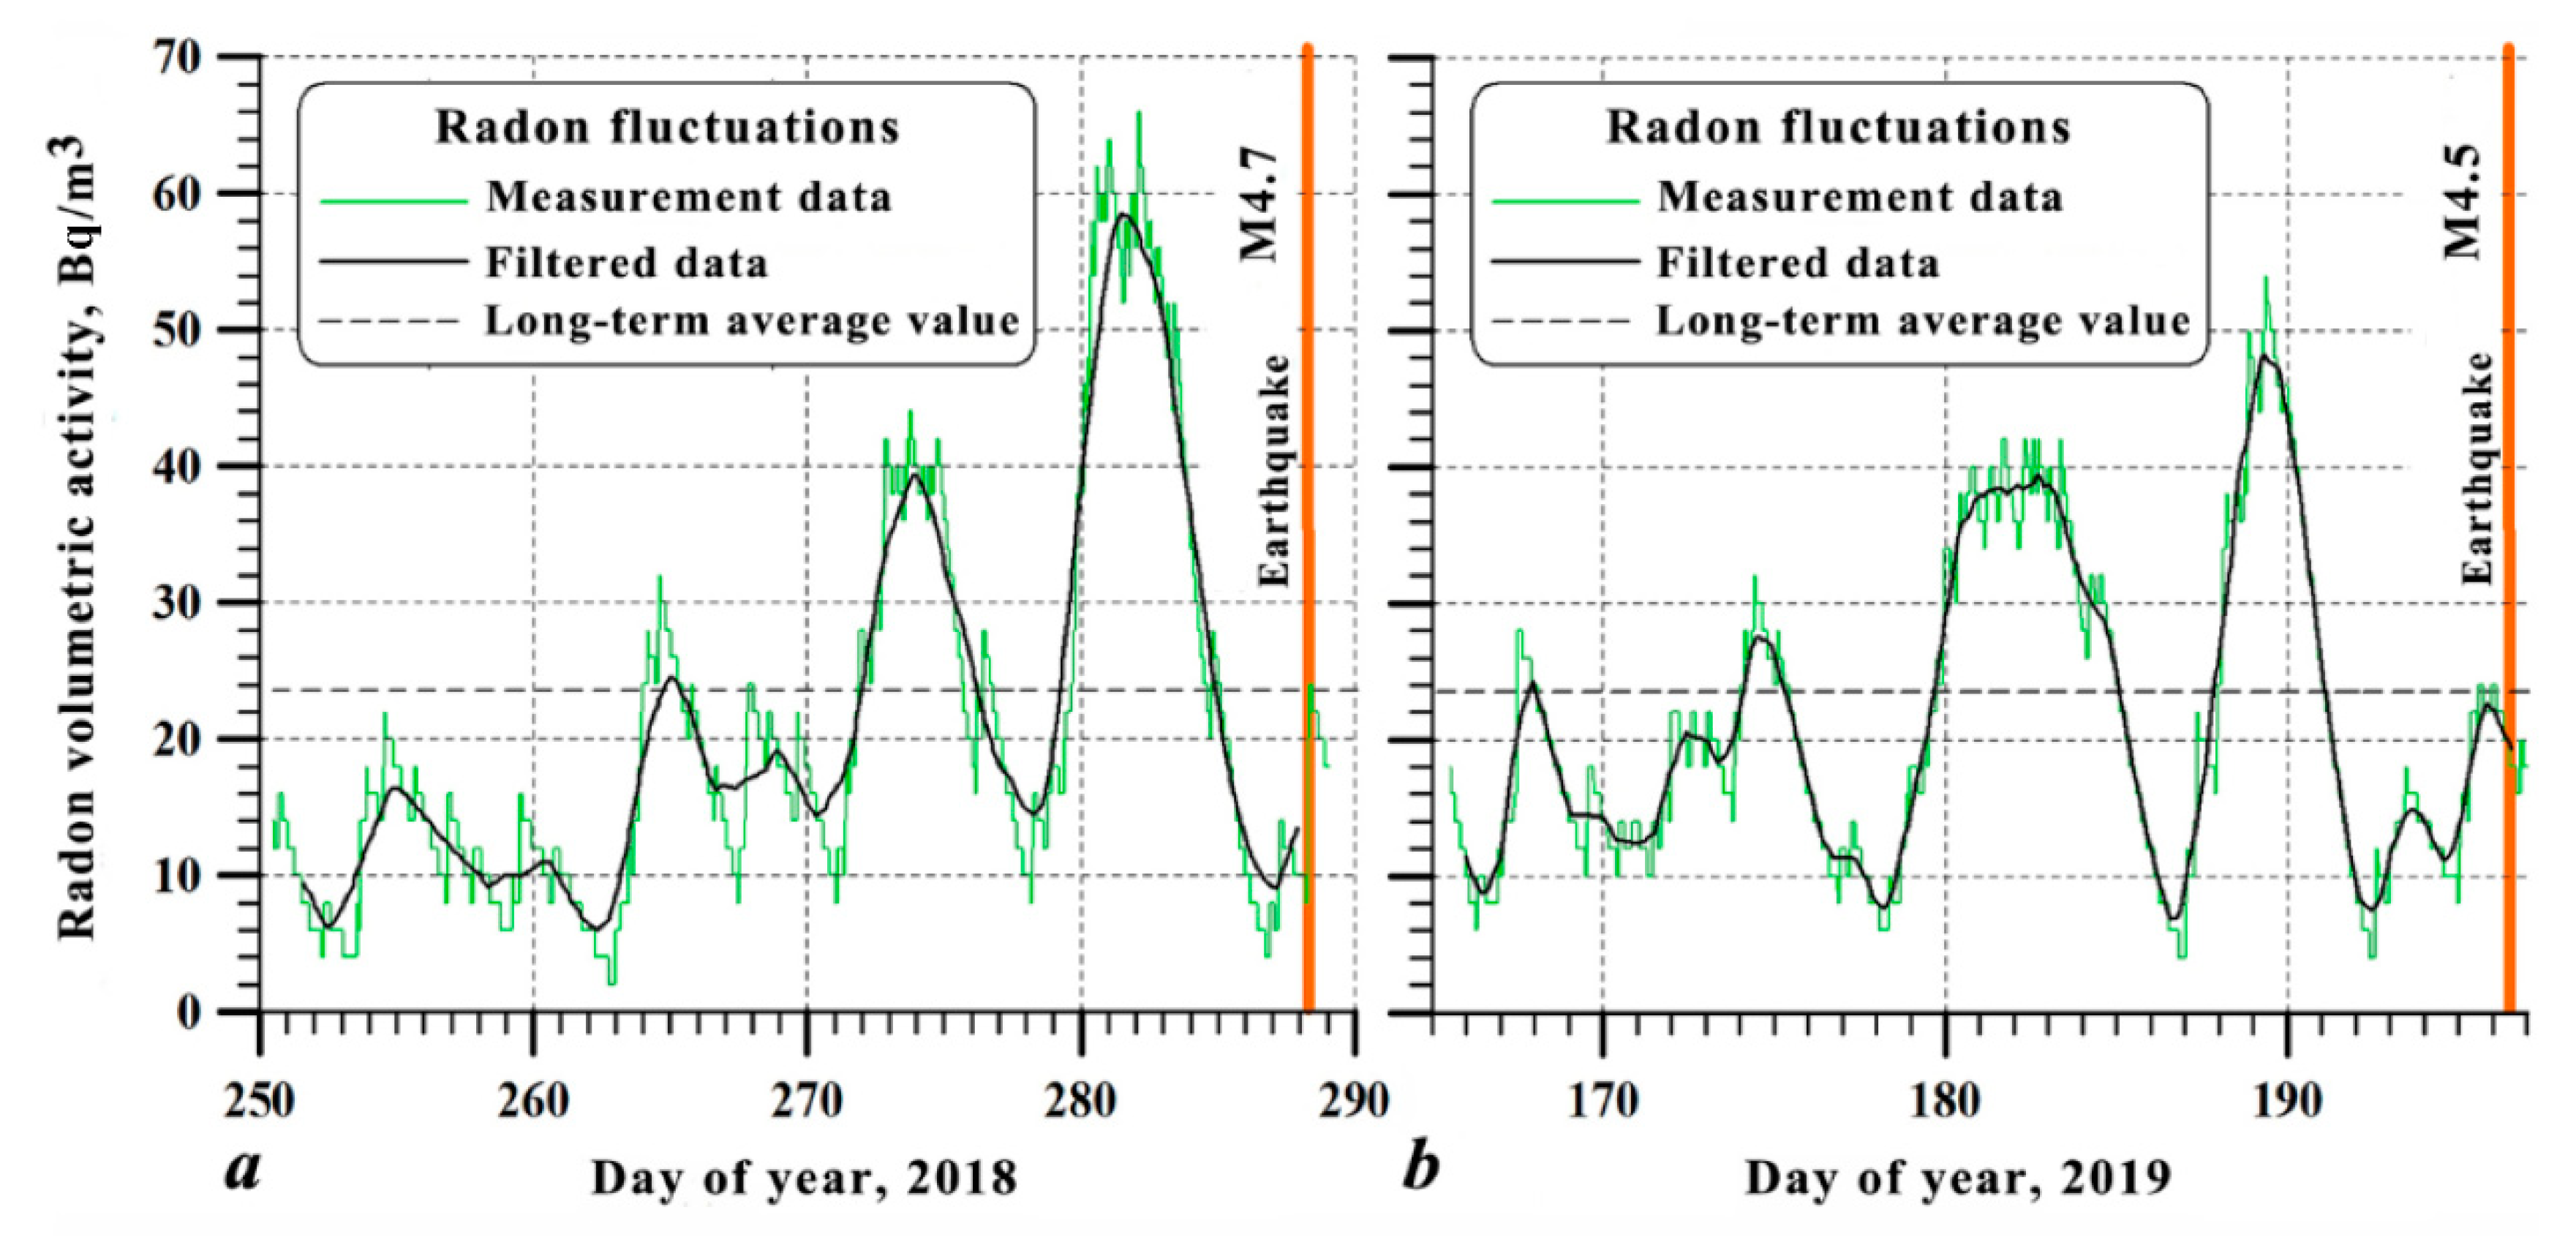
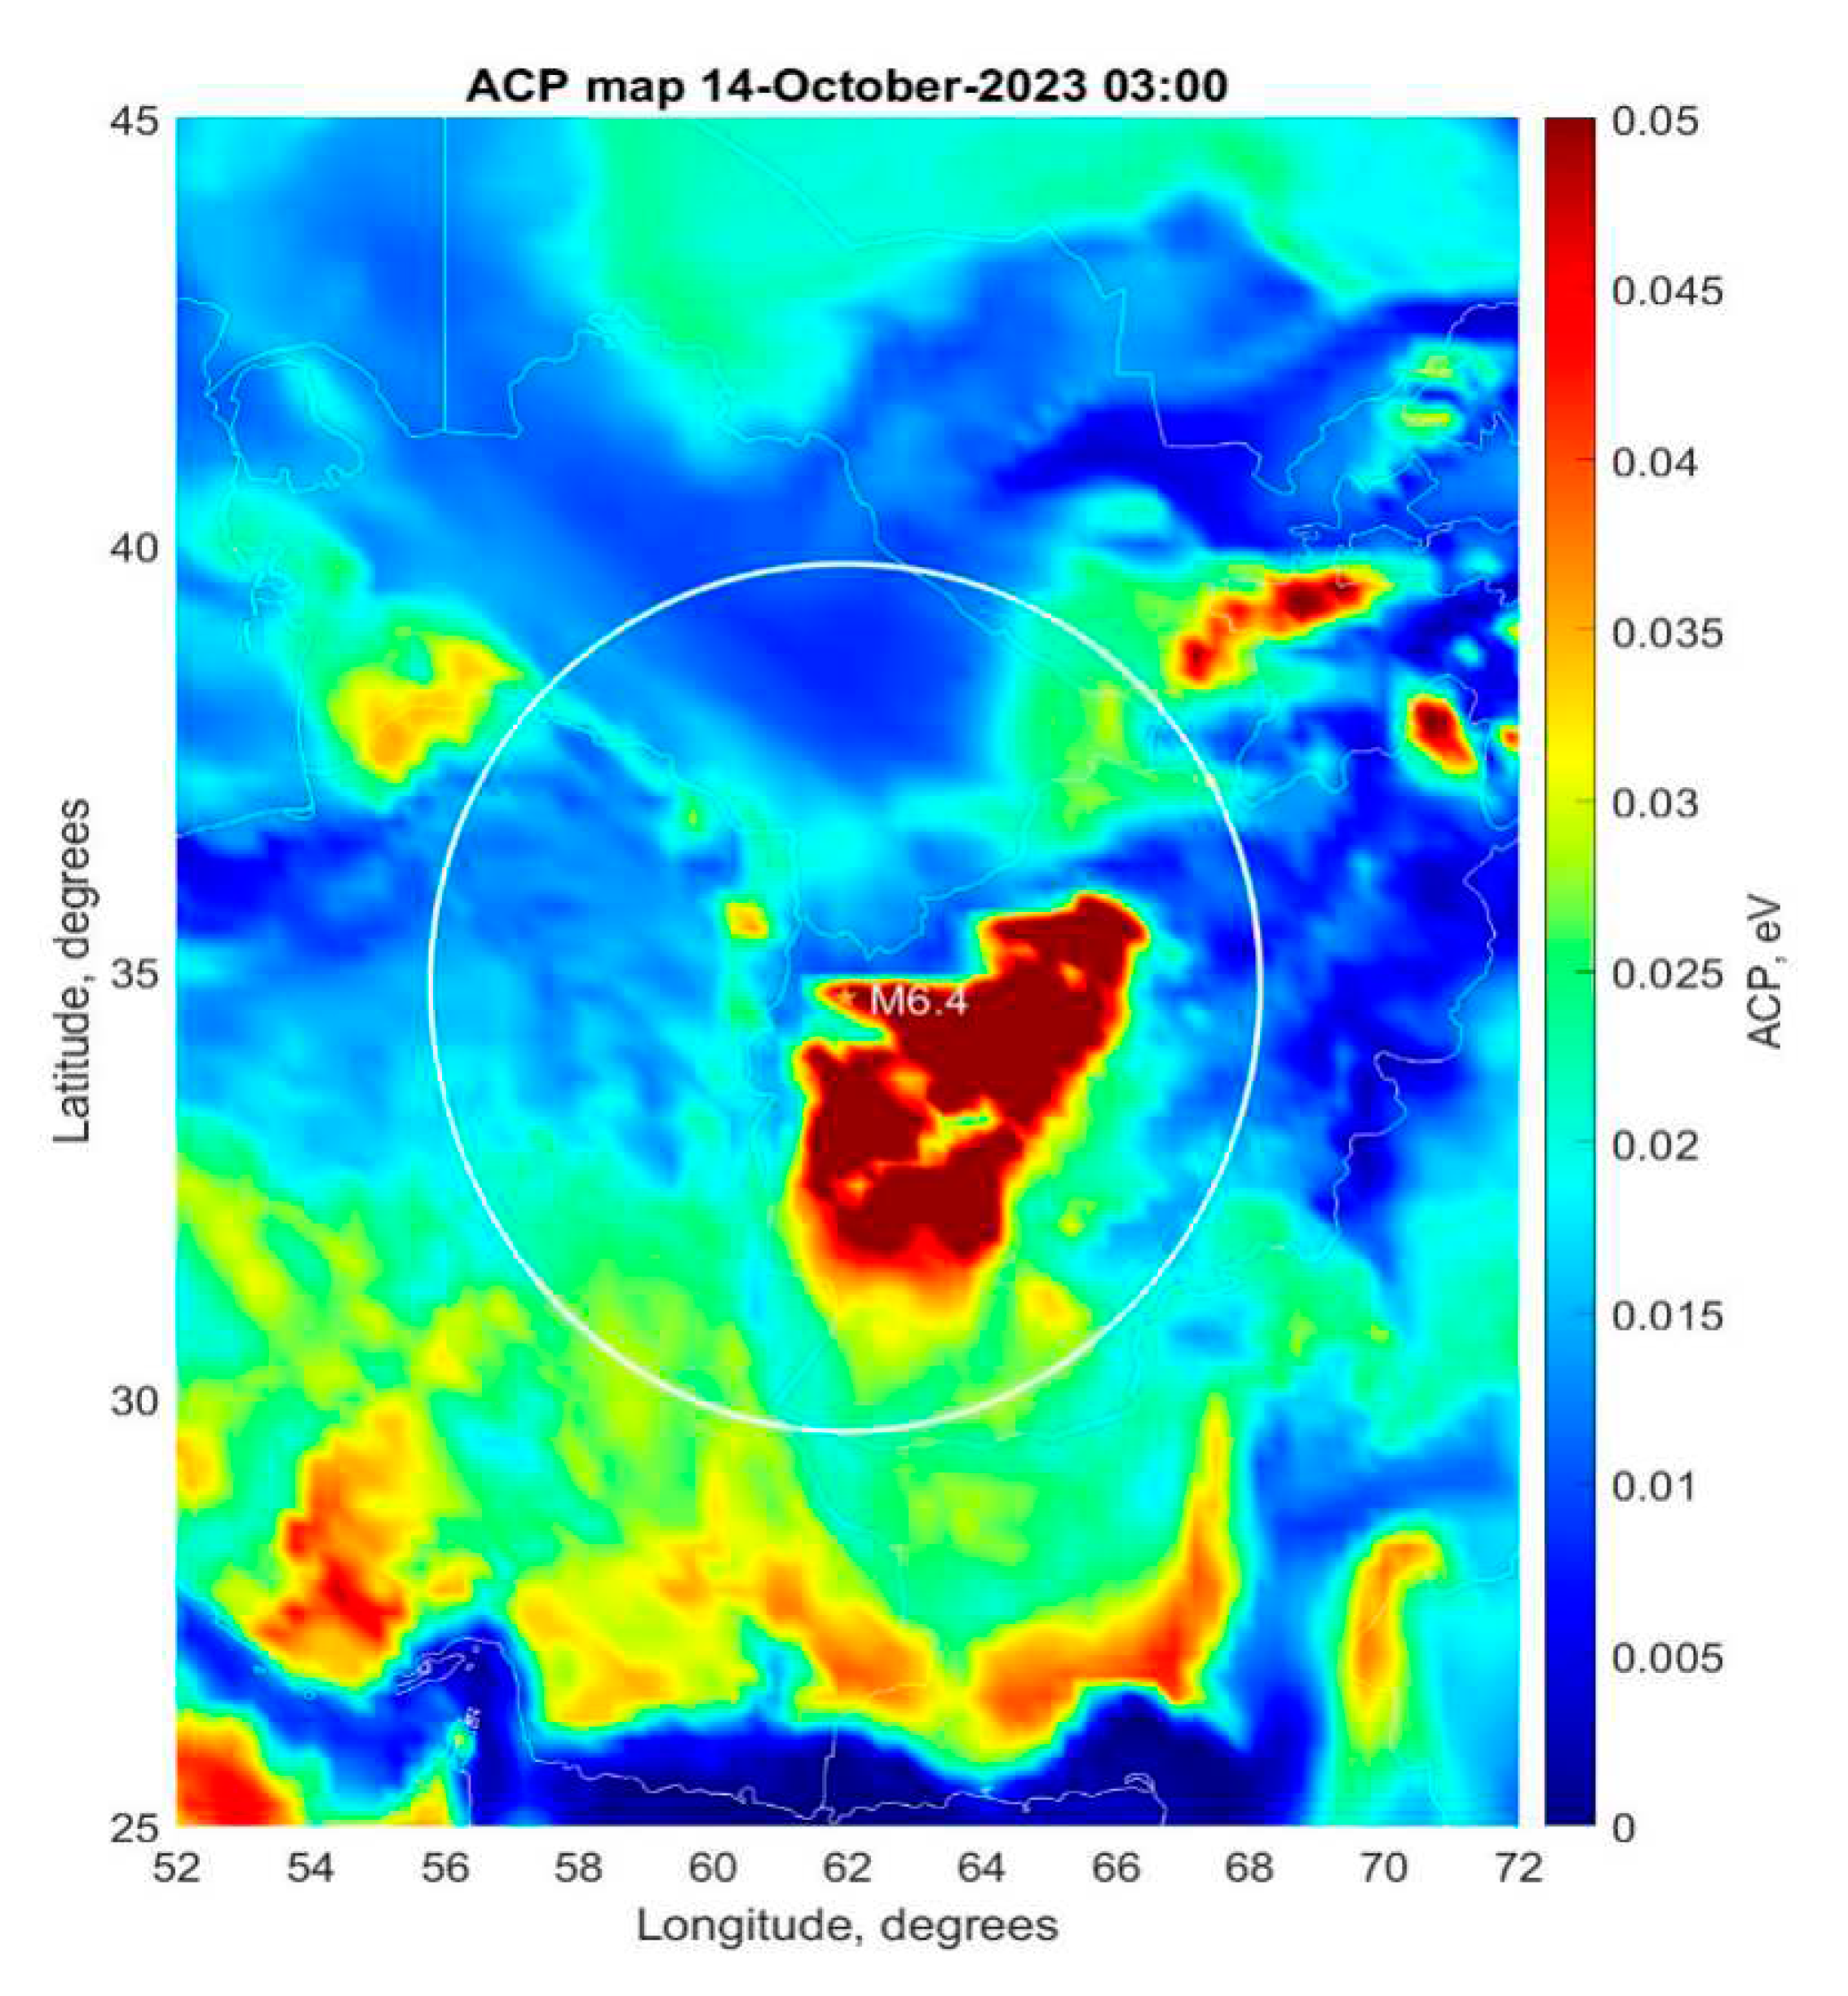
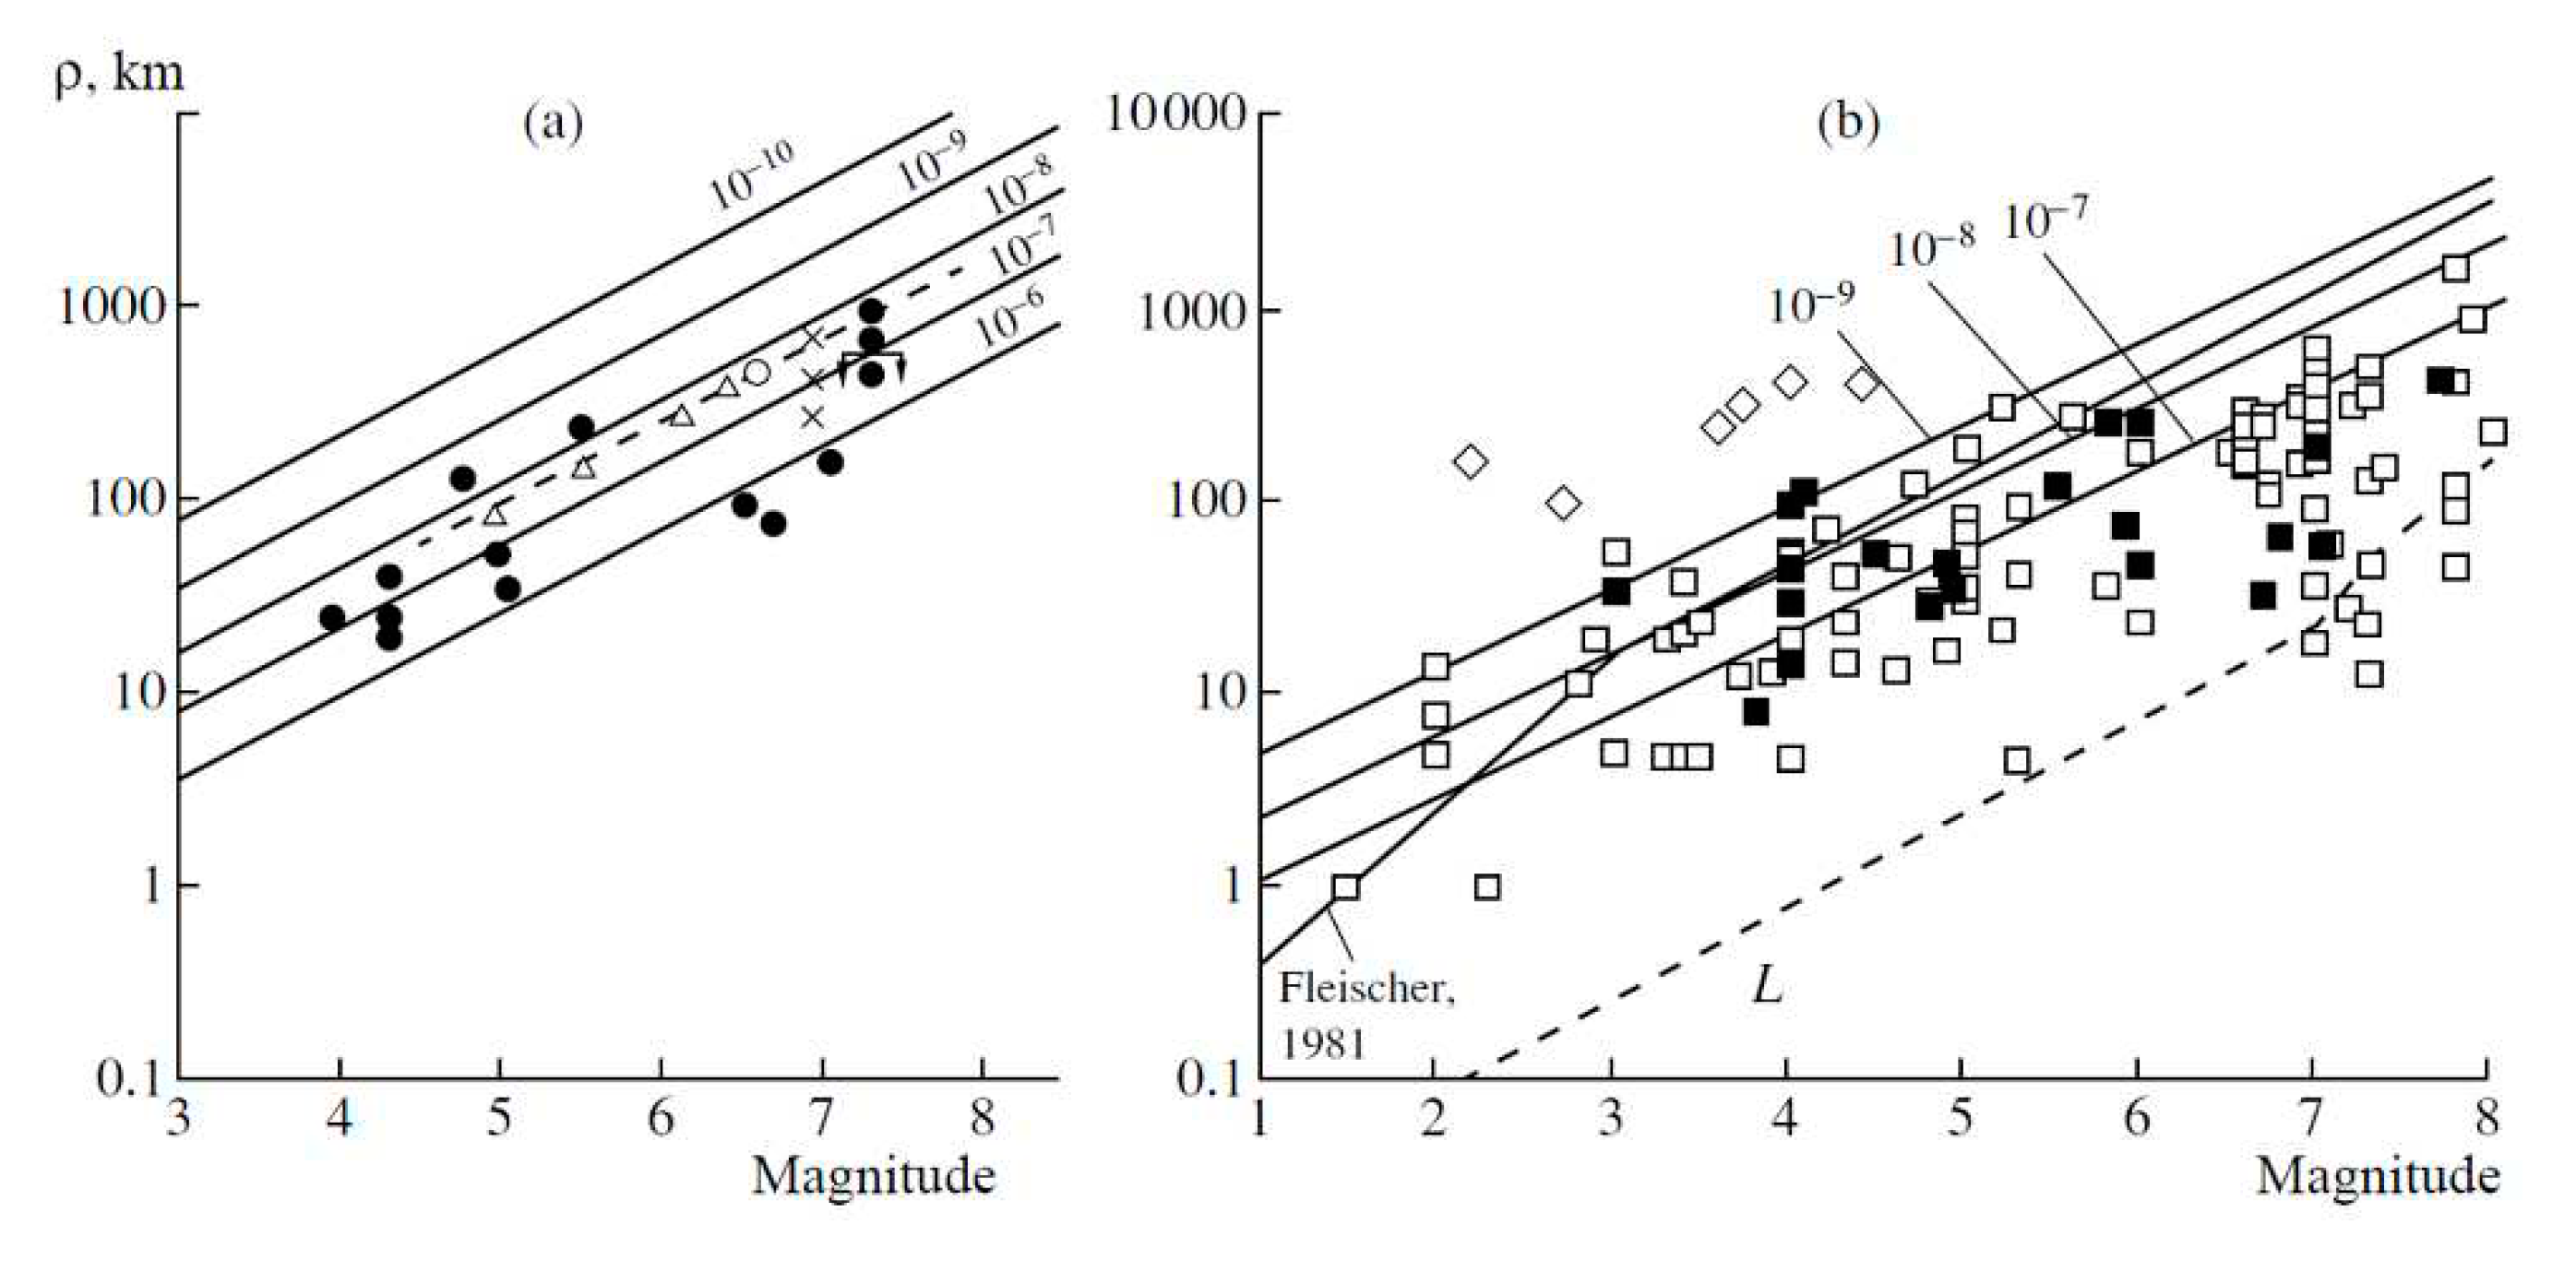
4.2. Radon as earthquake precursor
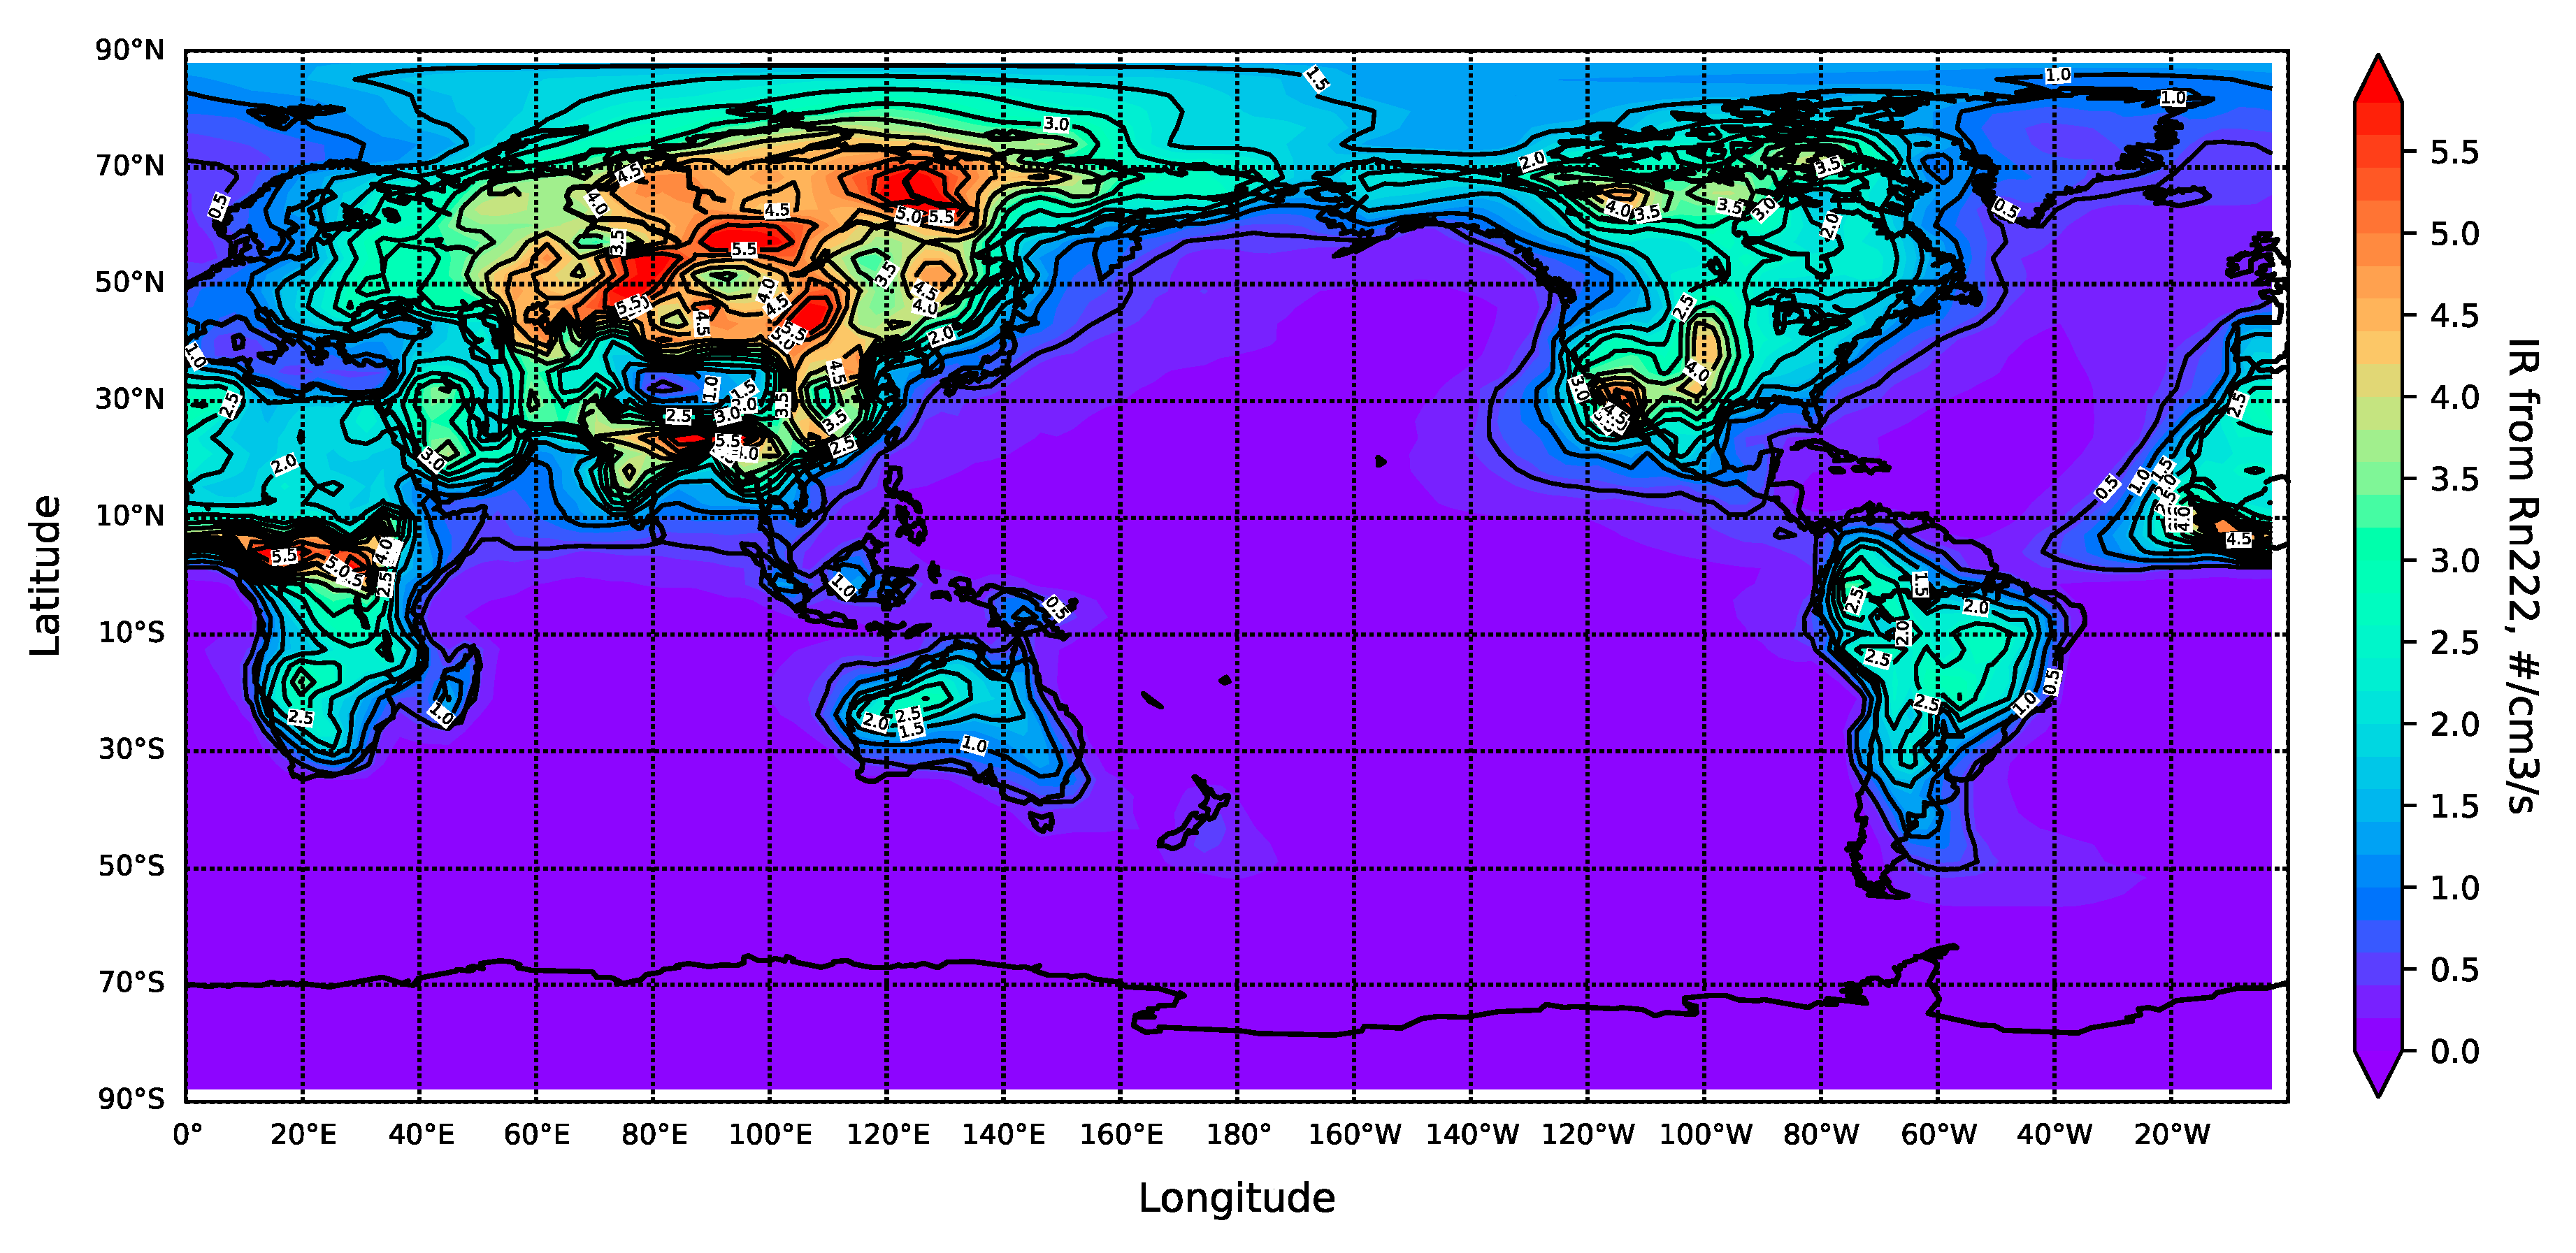
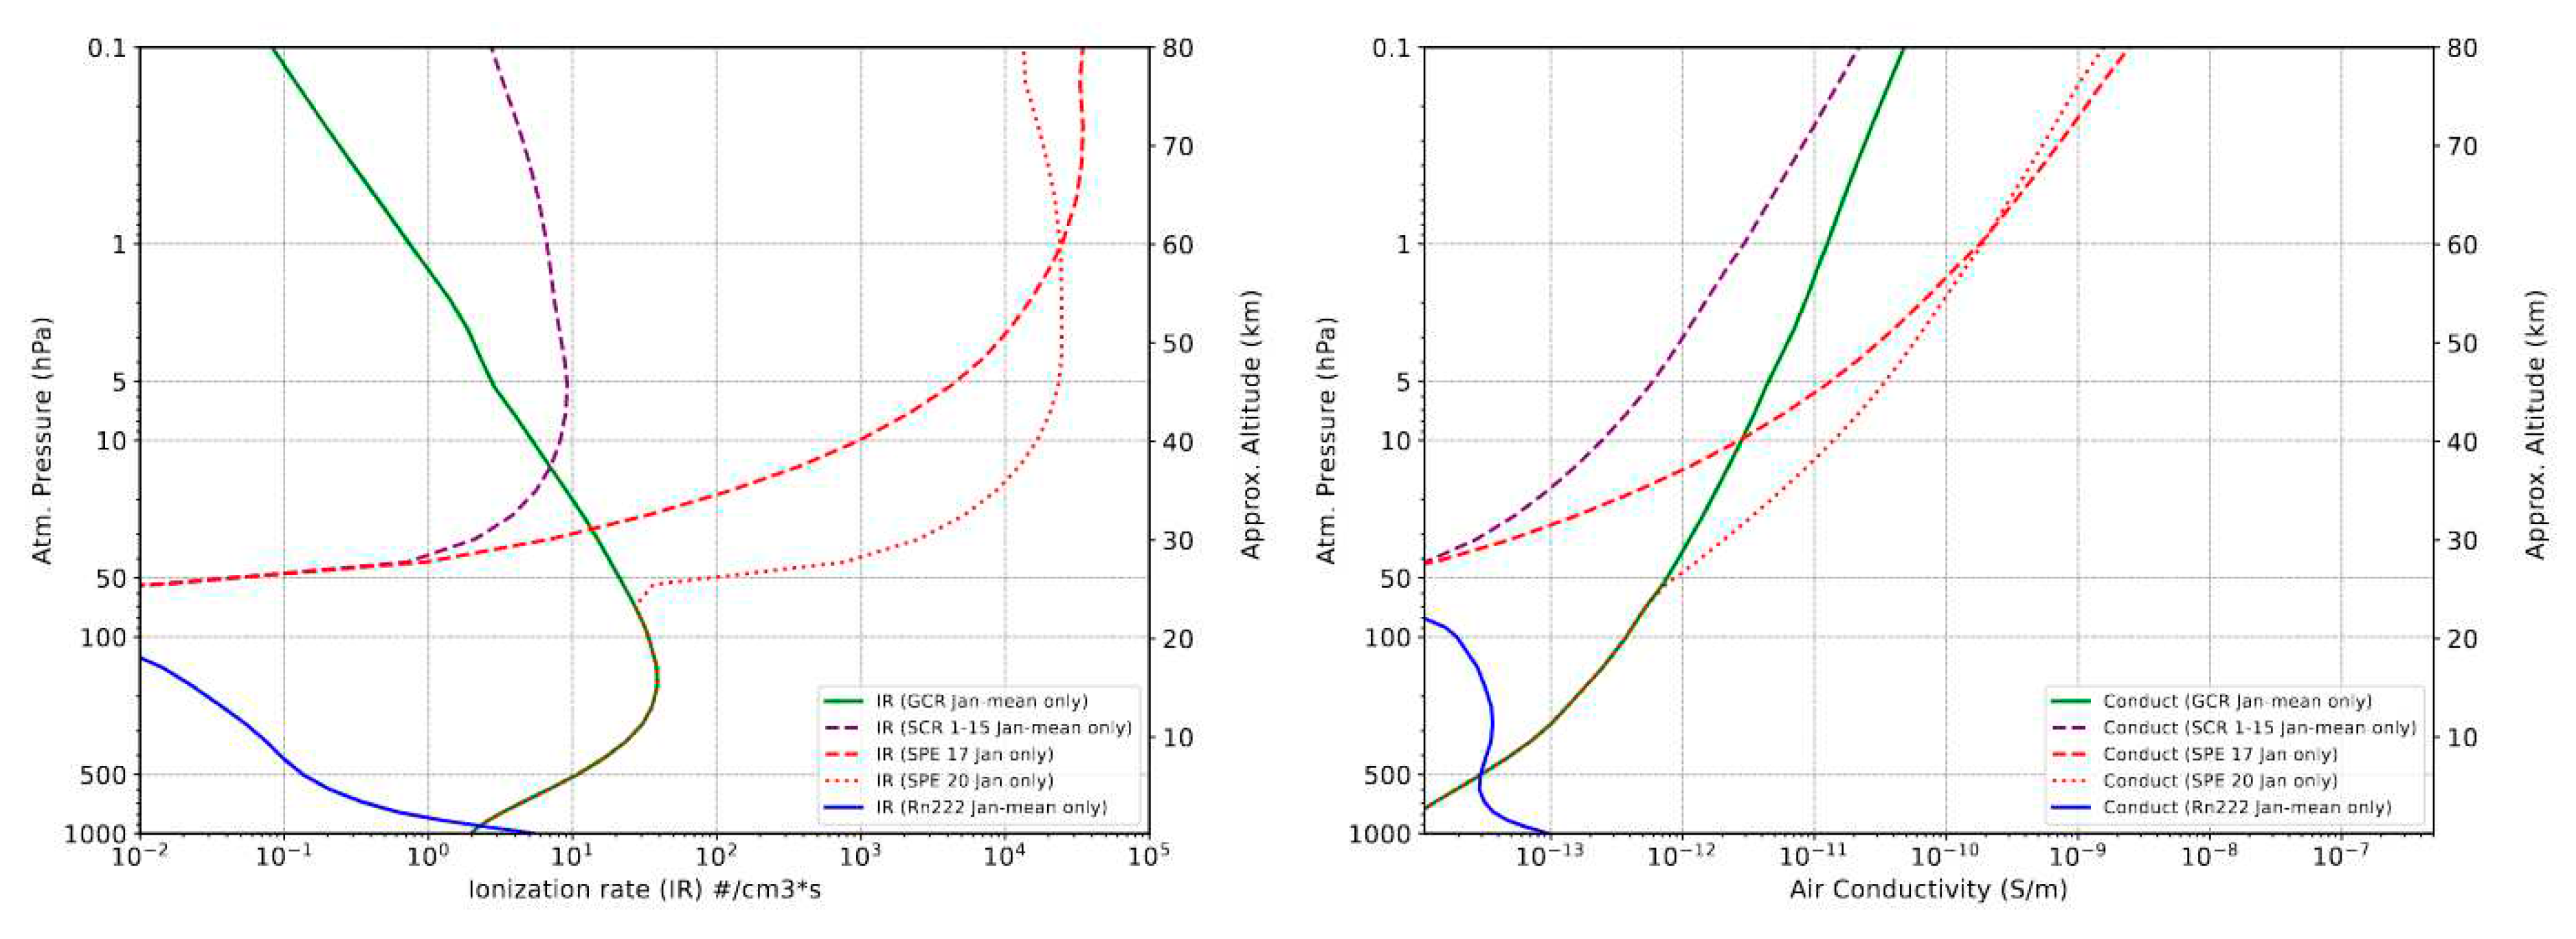
5. Radon as a component of Global Electric Circuit
6. Conclusions
- Meteorological effects depend not only on the pure variations of meteorological parameters but from methodology and location of radon measurements (pumping effect), difference of outside and inside (where the sensor installed) temperatures
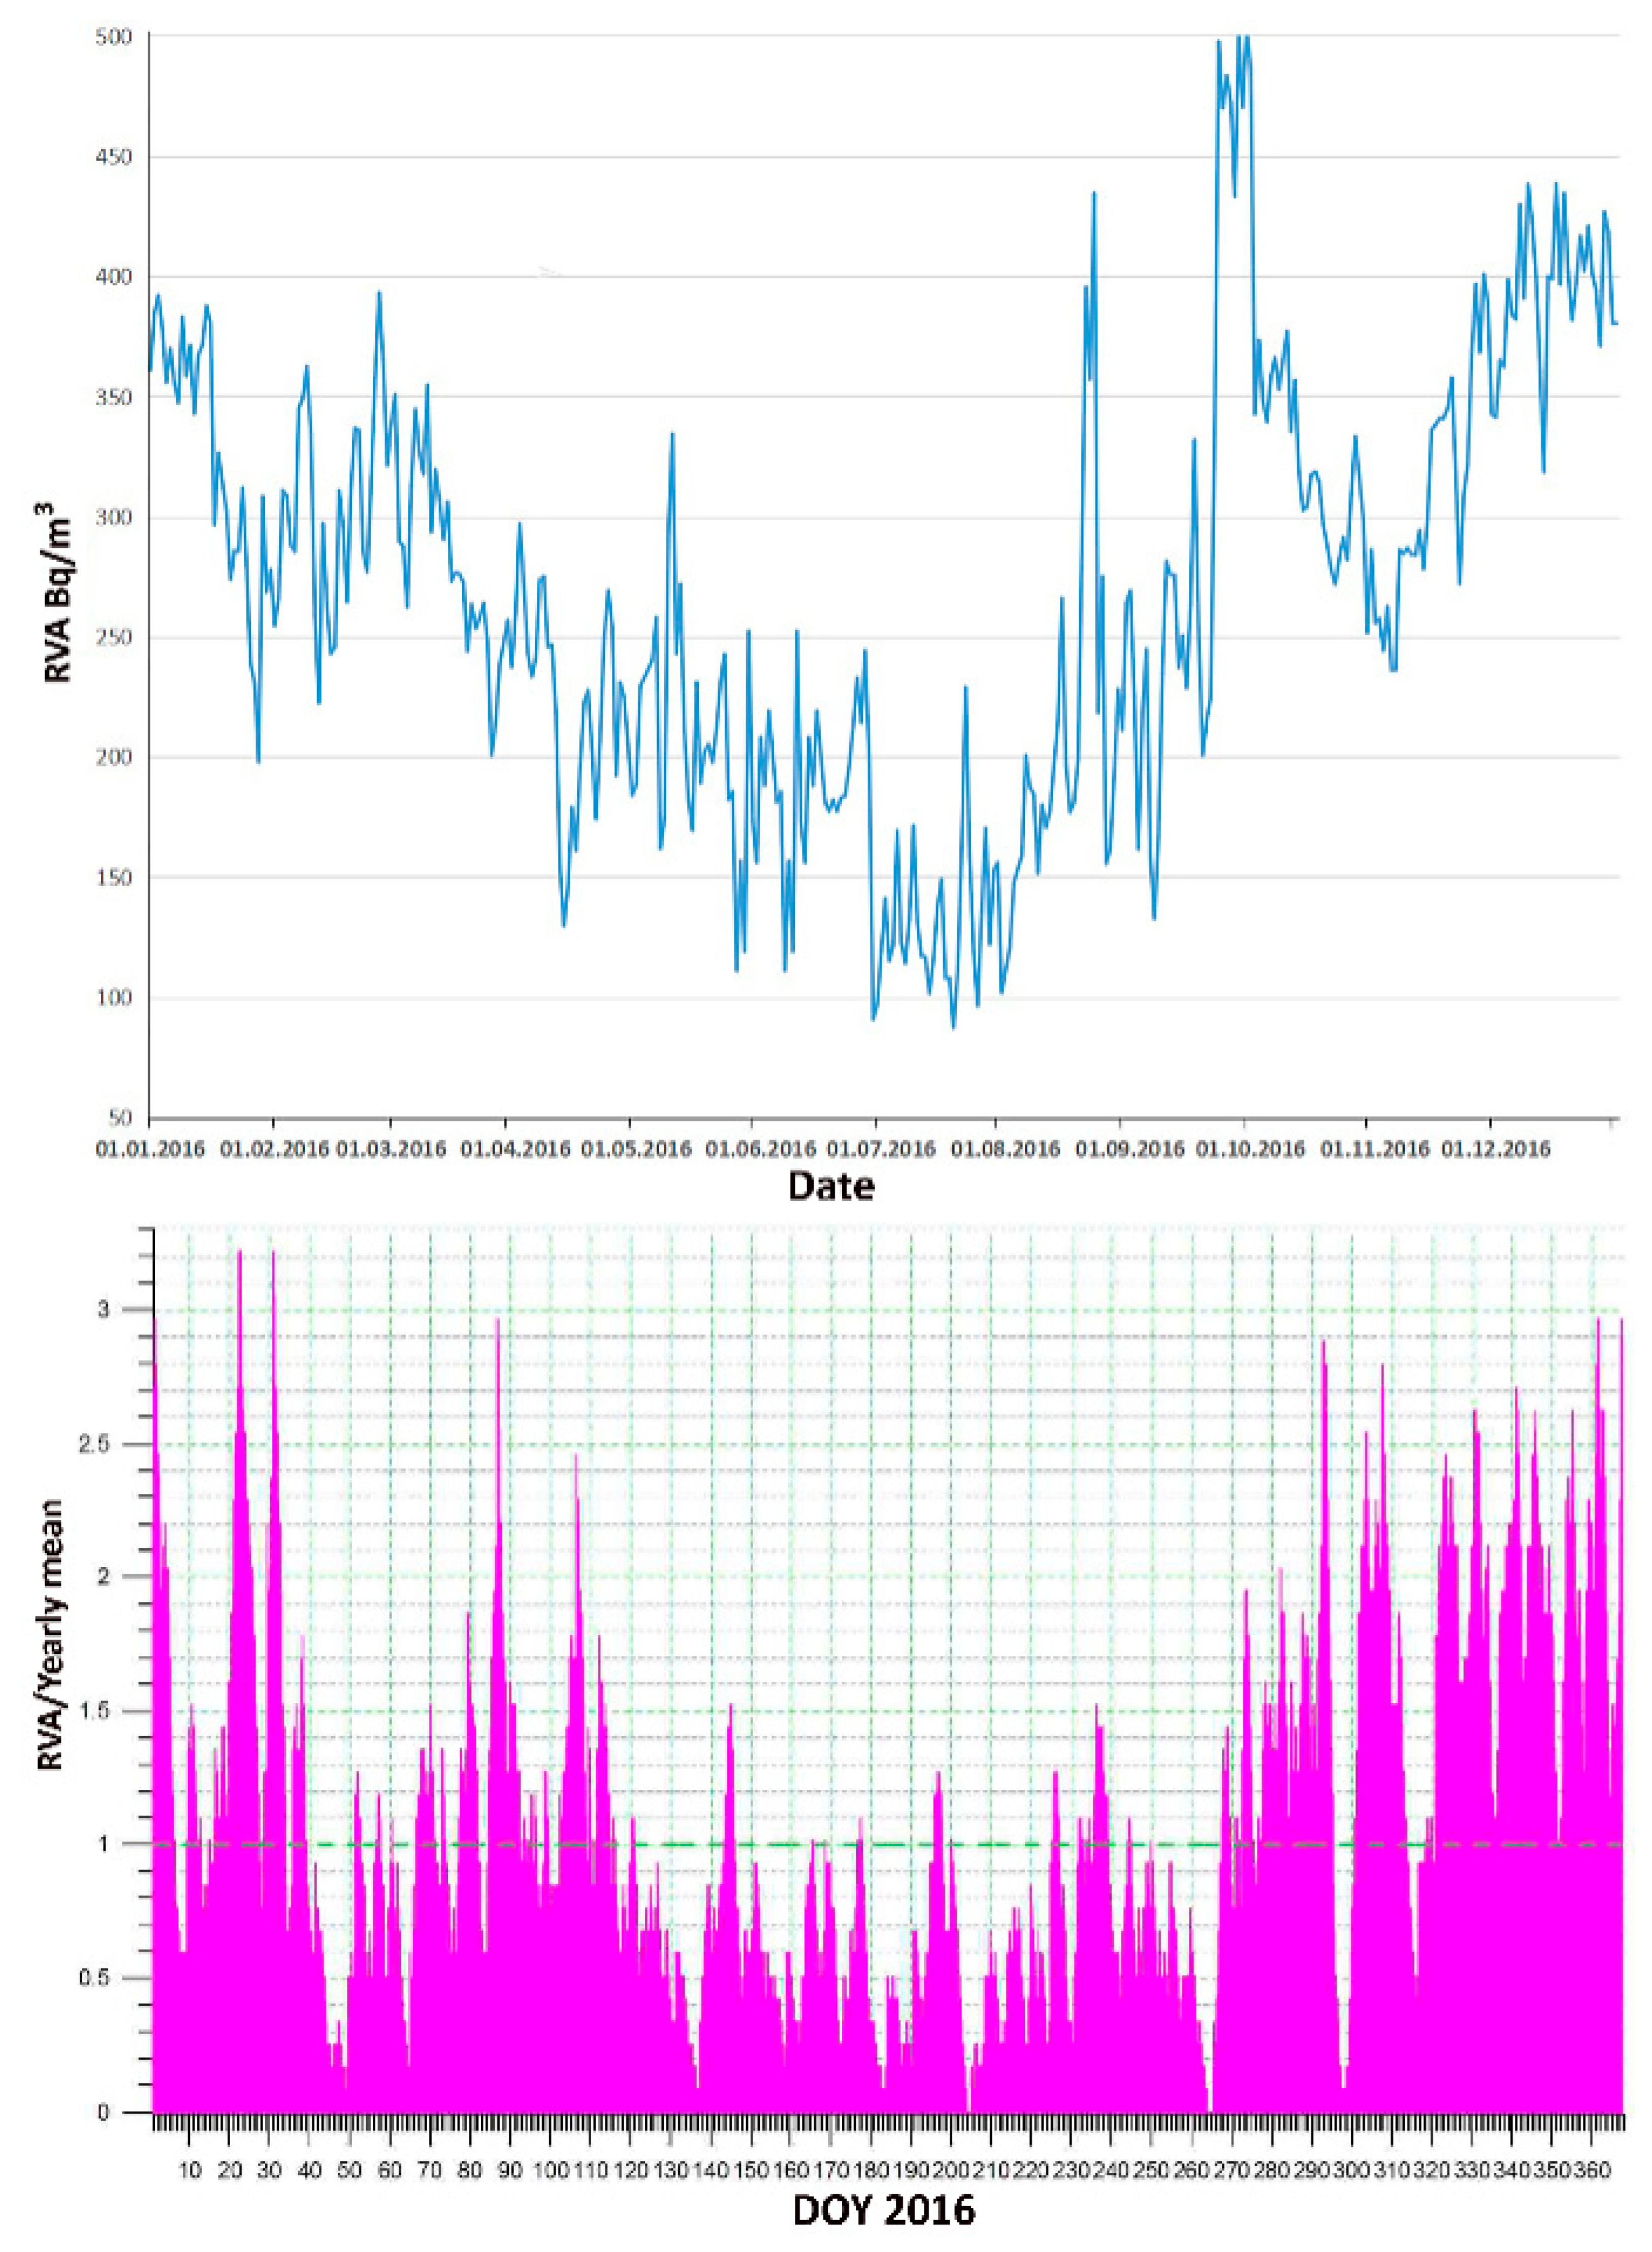
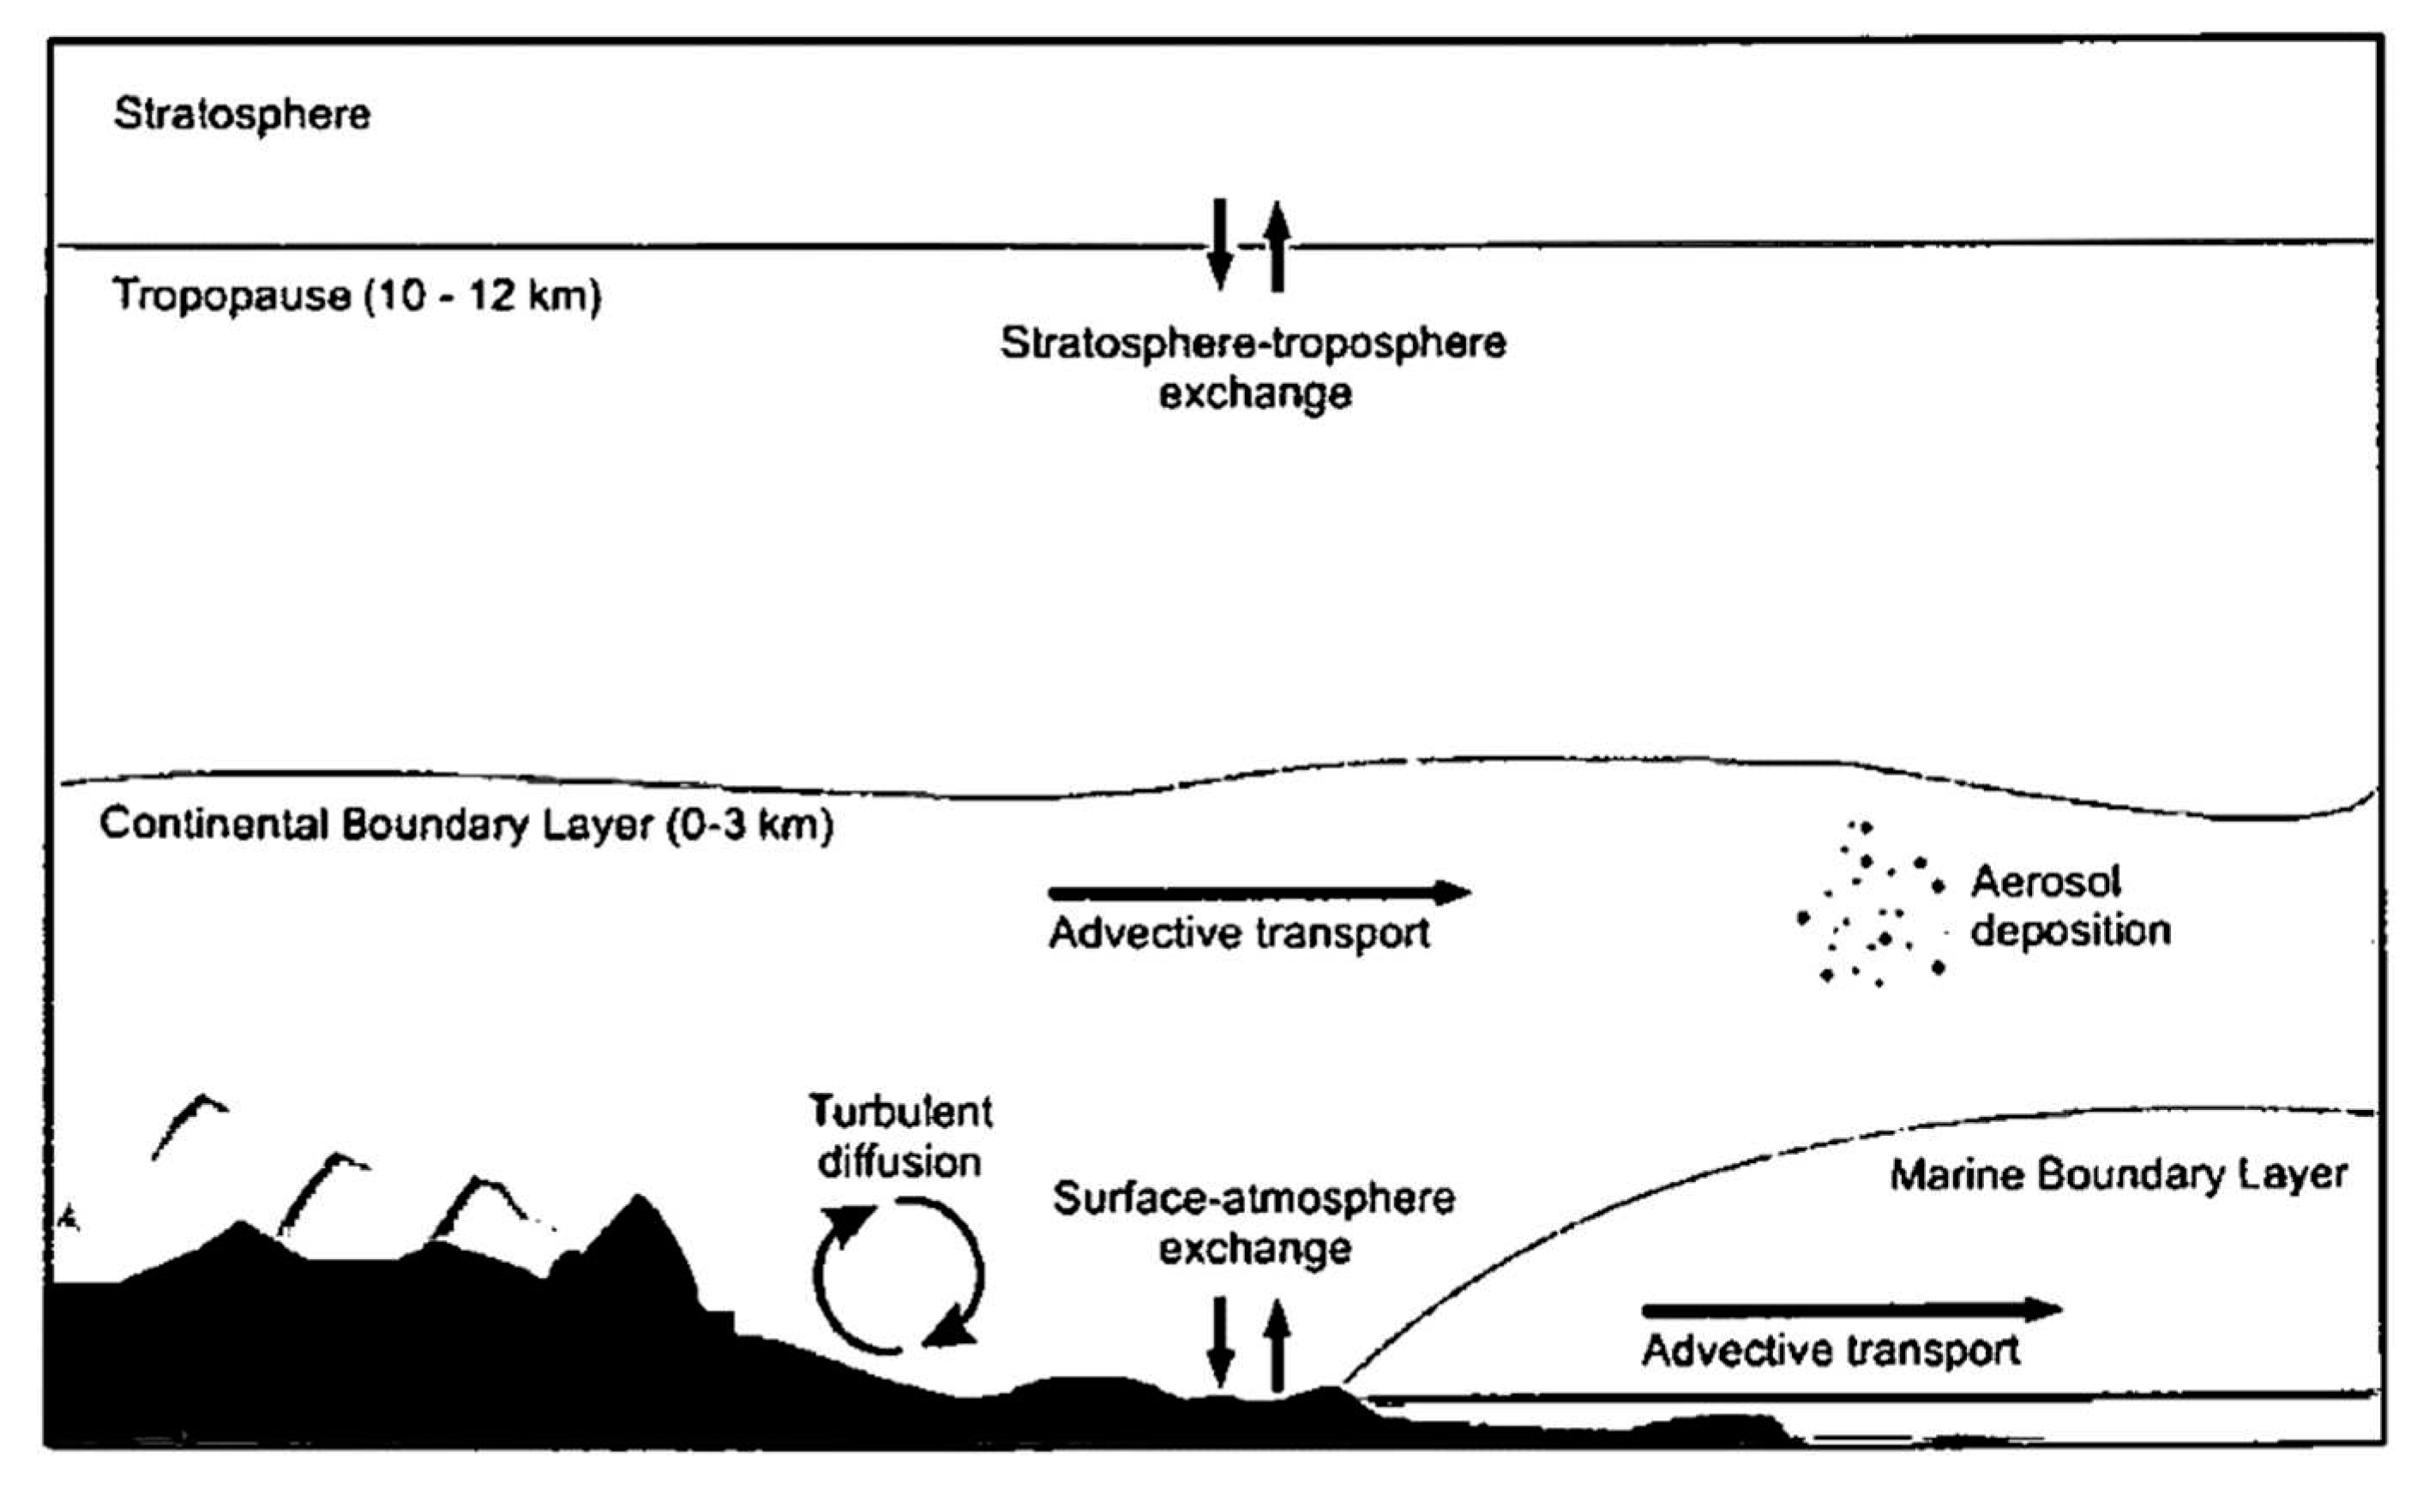
- Daily radon variability (nighttime maximum) is determined by daily dynamics of the Global Boundary Layer
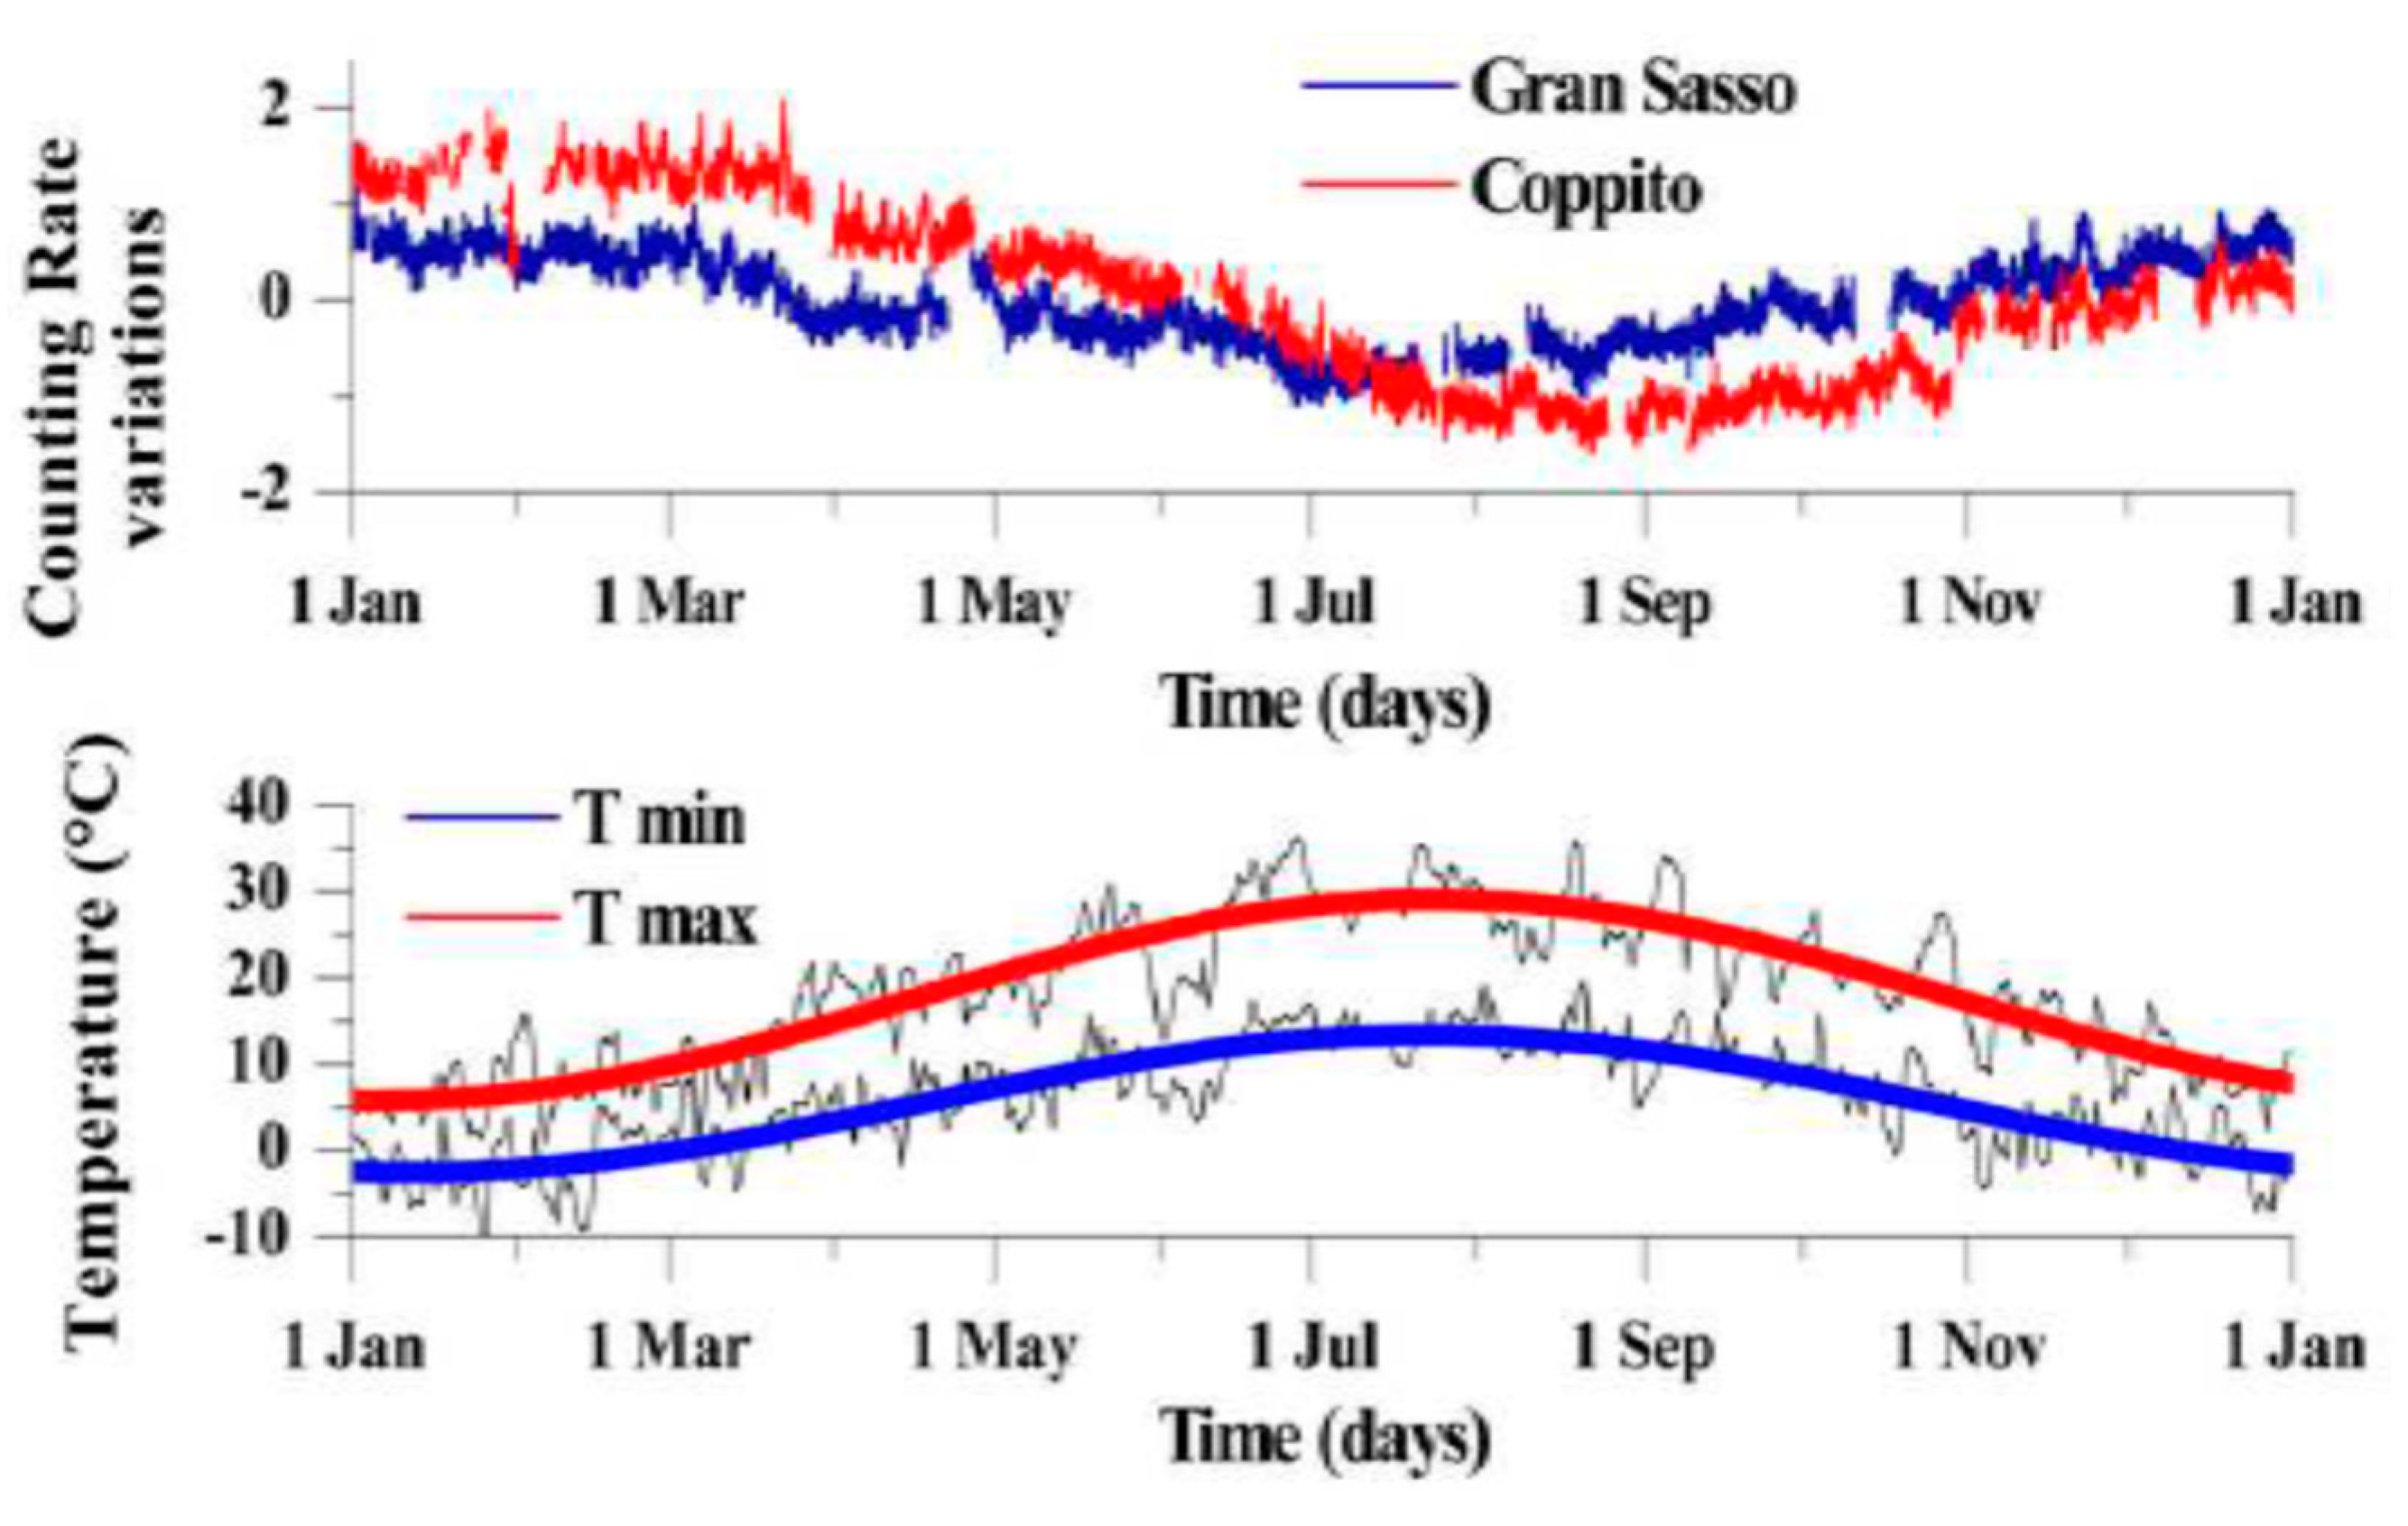
- Two types of seasonal variations of radon (summer maximum or minimum) need further clarification. More probable the summer maximum is a result of measurements site location. The summer minimum should be checked by the long-time measurements at geodetic equator where the air temperature is not changing round the year
- The surface radon contained in radium grains of the soil
- Tectonic radon coming from deeper layers of the crust. The problem of many publications is that dependence of surface radon on meteorological parameters is applied to the tectonic radon creating mish-mash in data interpretation
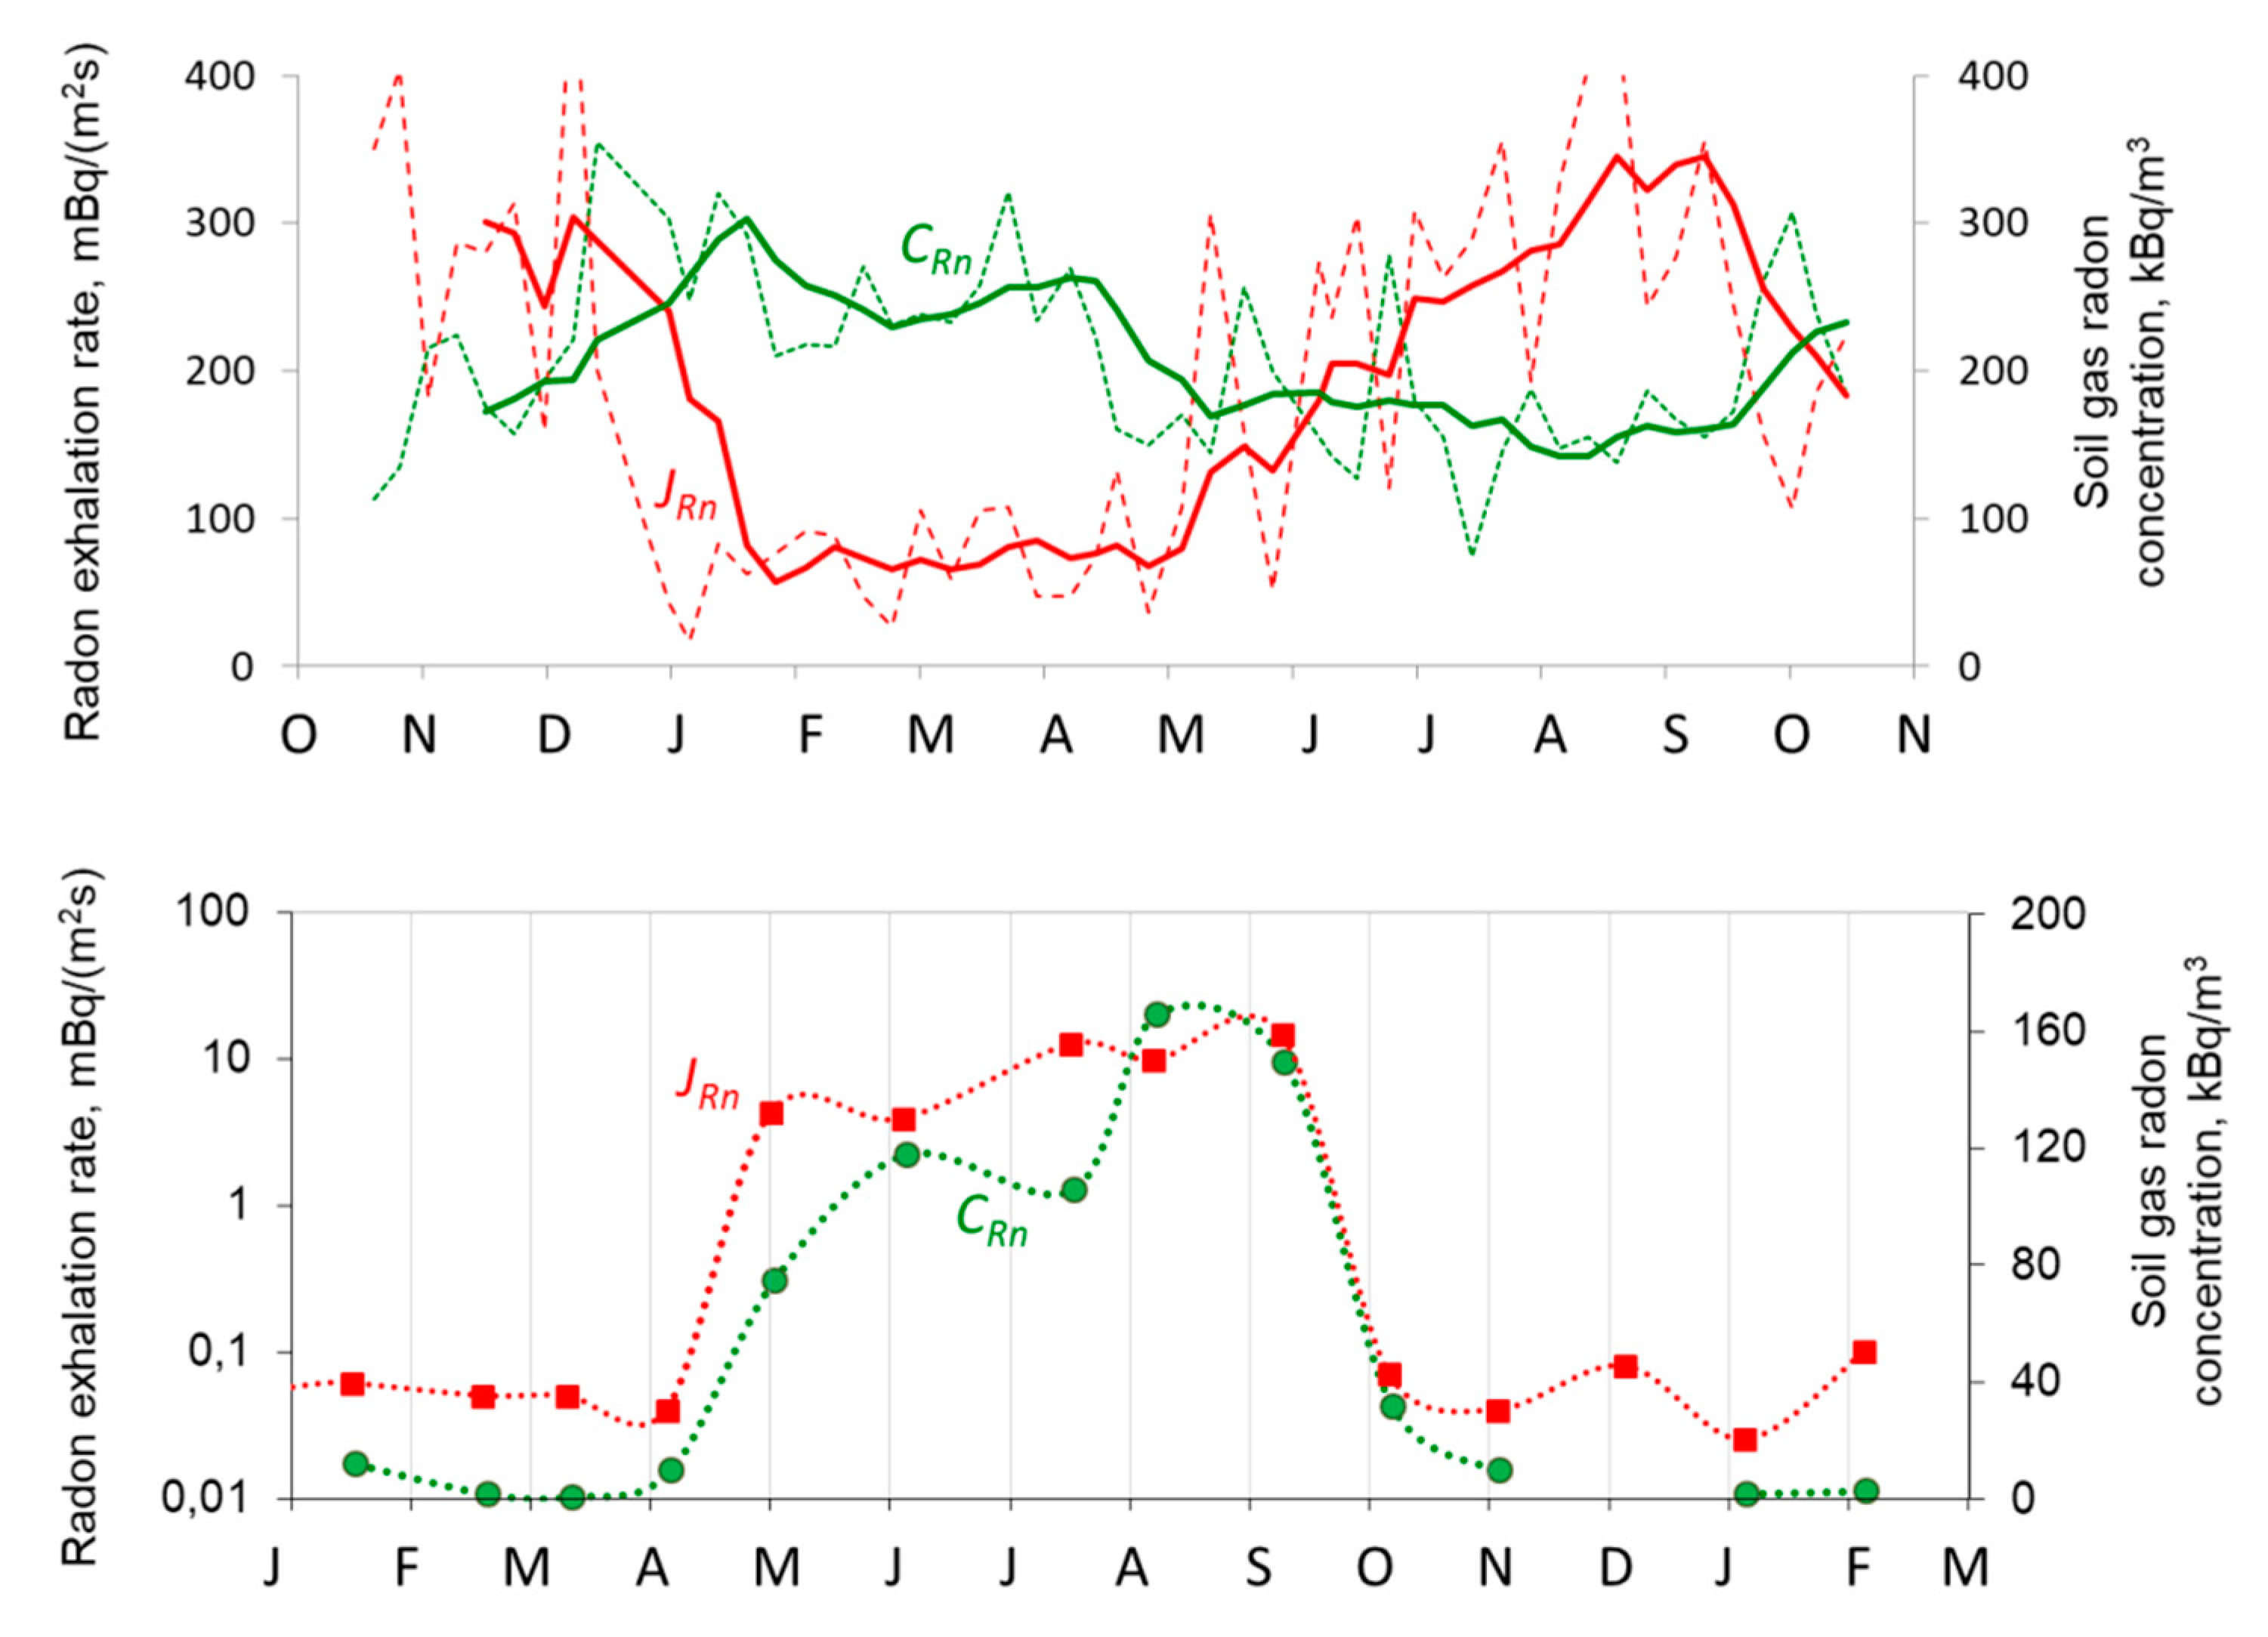
- One of new and important results is the way of discrimination of the surface an tectonic radon. It is simple but effective: for the surface radon the radon concentration and exhalation are in counterphase, while for the tectonic radon they are in phase.
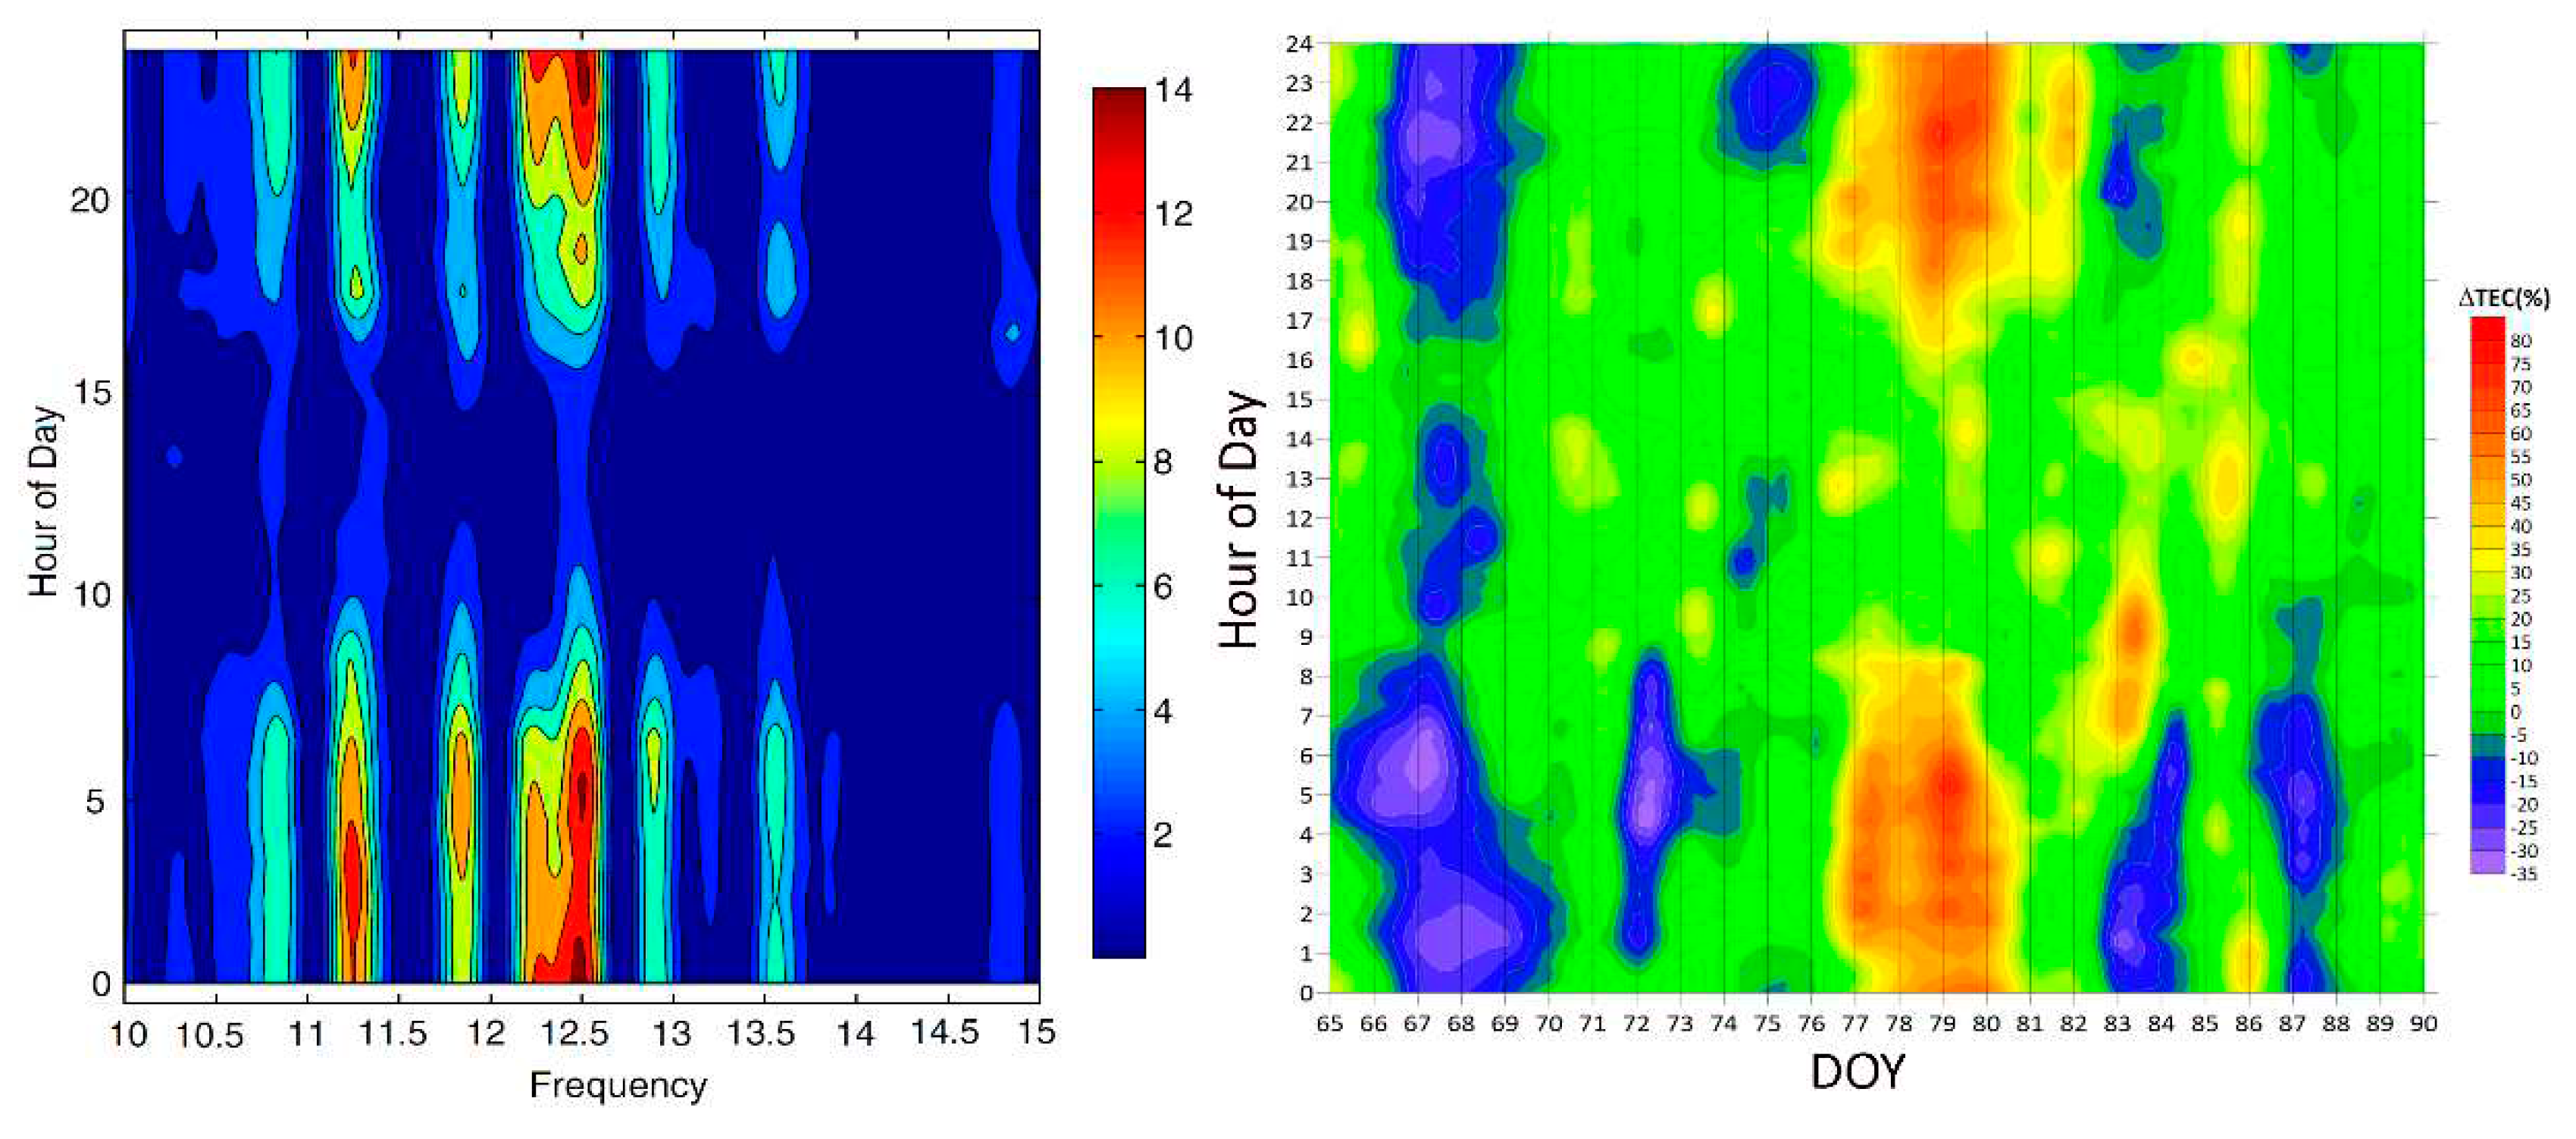
- We supplemented described in [62] the oscillation of radon intensity within the solar cycle with maximum period of 12.5 years was demonstrated which is modulated by radon changes in local time. The maximum of radon activity is observed during night-time hours what coincides with variations of the Total Electron Content provided by radon activity.
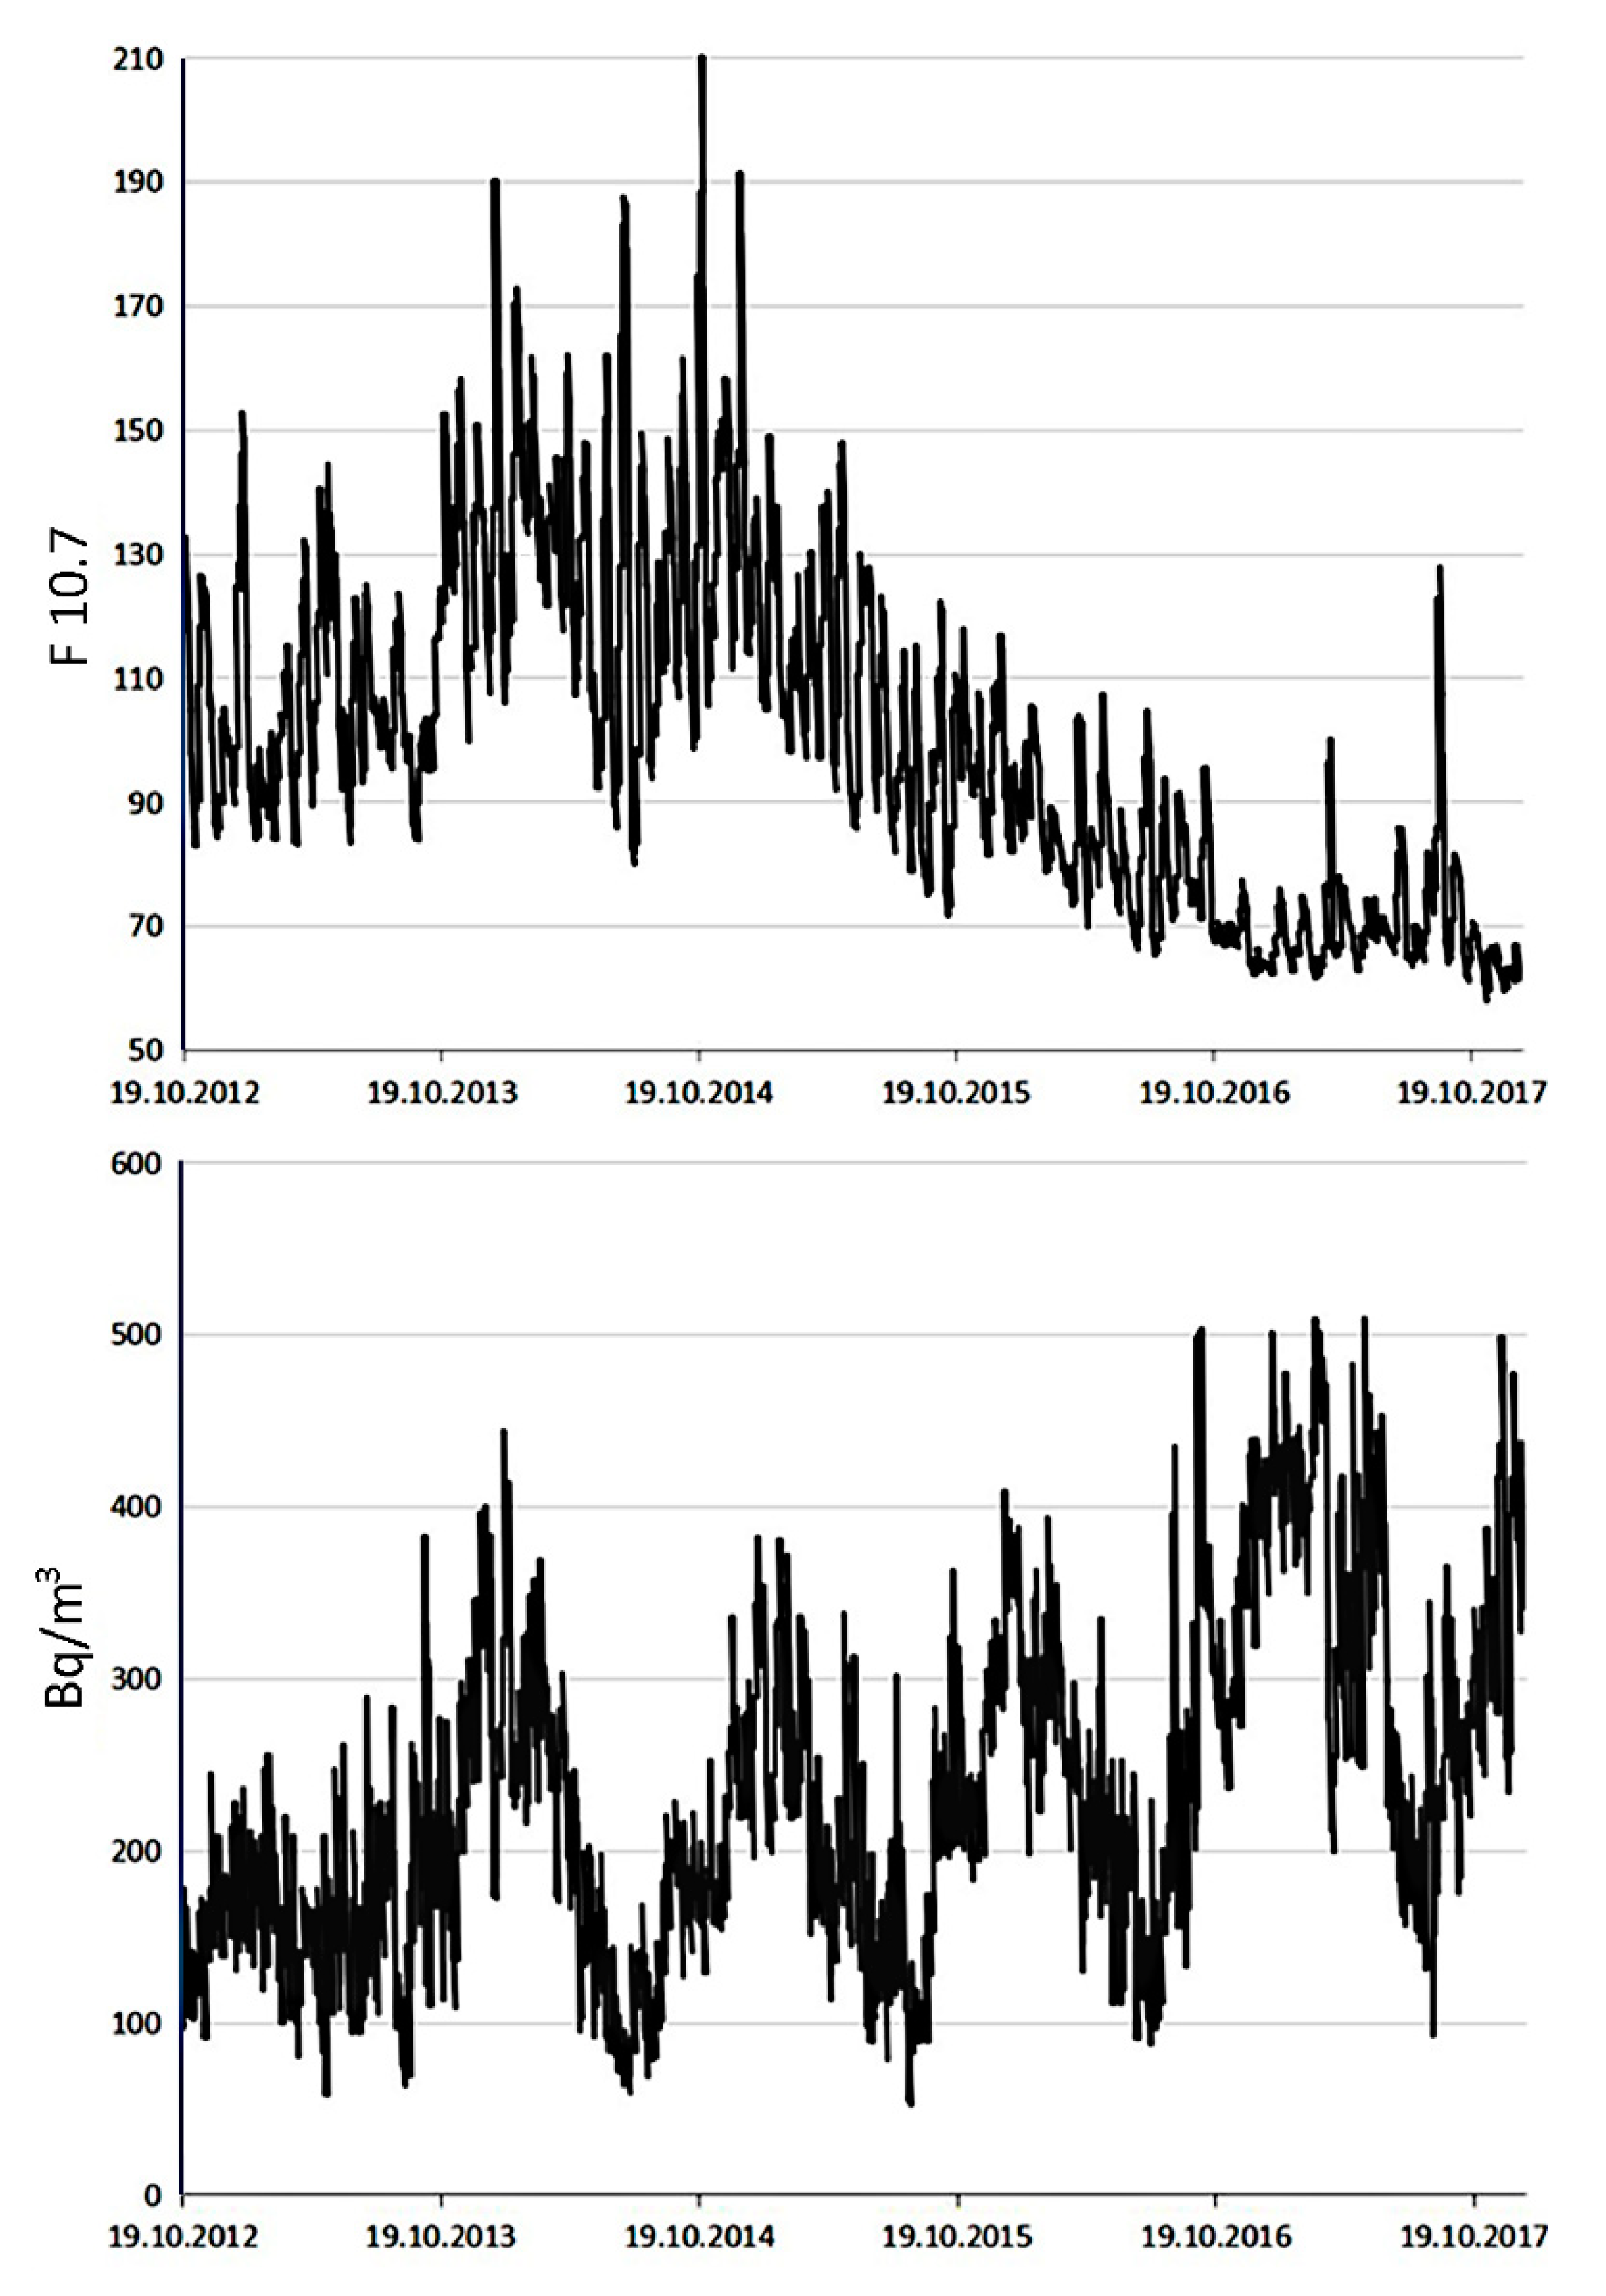
- The study of long-term observations of radon activity in Gorny Altai imply the possible anticorrelation of solar and radon activity within the solar cycle. Nevertheless, more long observations analysis are necessary to make a more definite conclusion.
Acknowledgements
References
- Dorn, Friedrich Ernst. "Über die von radioaktiven Substanzen ausgesandte Emanation", Abhandlungen der Naturforschenden Gesellschaft zu Halle (in German). Stuttgart 1900, 22, 155. [Google Scholar]
- Rutherford, E.; Owens, R. B. Thorium and uranium radiation. Trans. R. Soc. Can. 1899, 2, 9–12. [Google Scholar]
- Debierne, André-Louis. Sur la radioactivite induite provoquee par les sels d'actinium. Comptes Rendus Hebdomadaires des Séances de l'Académie des Sciences (in French). 1903, 136, 446. [Google Scholar]
- Scholz, C.H.; Sykes, L.R.; Aggarwal, Y.P. Earthquake prediction: A physical basis. Science 1973, 181, 803–809. [Google Scholar] [CrossRef] [PubMed]
- Toutain, J.-P.; Baubron, J.-C. Gas geochemistry and seismotectonics: a review. Tectonophysics 1998, 304. [Google Scholar] [CrossRef]
- Steinitz, G.; Begin, Z.B.; Gazit-Yaari, N. Statistically significant relation between radon flux and weak earthquakes in the Dead Sea rift valley. Geology 2003, 31, 505–508. [Google Scholar] [CrossRef]
- Dobrovolsky, I.P.; Zubkov, S.I.; Myachkin, V.I . Estimation of the size of earthquake preparation zones. Pageoph 1979, 117, 1025–1044. [Google Scholar] [CrossRef]
- Allegri, L.; Bella, F.; Della Monica, G.; Ermini, A.; Impora, S.; Sgrigna, V.; Biagi, P.F. Radon and tilt anomalies detected before the Irpinia (South Italy) earthquake of , 1980 at great distance from the epicenter. Geophys. Res. Let. 1983, 10, 269–272. [Google Scholar] [CrossRef]
- Igarashi, G.; Saeki, S.; Takahata, N.; Sumikawa, K.; Tasaka, S.; Sasaki, Y.; Takahashi, M.; Sano, Y. Ground-Water Radon Anomaly Before the Kobe Earthquake in Japan. Science 1995, 269, 60–61. [Google Scholar] [CrossRef]
- King, C.-Y. Gas geochemistry applied to earthquake prediction. An overview. J. Geophys. Res. 1996, 91, 12269–12281. [Google Scholar] [CrossRef]
- Ghosh, D.; Deb, A.; Sengupta, R. Anomalous radon emission as precursor of earthquake. Journal of Applied Geophysics 2009, 69, 67–81. [Google Scholar] [CrossRef]
- Yasuoka, Y.; Nagahama, H.; Ishikawa, T. Anomalous Radon Concentration Prior to an Earthquake. A case Study on the 1995 Kobe Earthquake, Japan. Collected papers; LAMBERT Academic Publishing, 2010; 138p. [Google Scholar]
- Khilyuk, L.F.; Chilingar, G.V.; Robertson, J.O., Jr.; Endres, B. Gas migration. Events Preceding Earthquakes; Gulf Publishing Company: Houston, Texas, 2000; 342p. [Google Scholar]
- Golubenko, K.; Rozanov, E.; Mironova, I.; Karagodin, A.; Usoskin, I. Natural Sources of Ionization and Their Impact on Atmospheric Electricity. Geophys. Res. Lett. 2020, 47. [Google Scholar] [CrossRef]
- Miklyaev, P.S.; Petrova, T.B. Studies of radon emanation from clays. Water Resour. 2011, 38, 868–875. [Google Scholar] [CrossRef]
- Baskaran, M. Mechanisms of Radon Emanation and Long-Term Radon Flux Studies. Radon: A Tracer for Geological, Geophysical and Geochemical Studies. Springer, 2016; pp. 37–62. [Google Scholar]
- Marenny, A.M.; Tsapalov, A.A.; Miklyaev, P.S.; Petrova, T.B. Regularities of formation of the radon field in the geological environment; M.: “Pero” Publishing House, 2016; 394p. [Google Scholar]
- Gavriliev, S.; Petrova, T.; Miklyaev, P.; Karfidova, E. Predicting radon flux density from soil surface using machine learning and GIS data. Sci. Total. Environ. 2023, 903, 166348. [Google Scholar] [CrossRef]
- Ciotoli, G.; Lombardi, S.; Annunziatellis, A. Geostatistical analysis of soil gas data in a high seismic intermontane basin: Fucino Plain. Central Italy. J. Geophys. Res. 2007, 112, B05407. [Google Scholar] [CrossRef]
- King, C.-Y.; King, B.-S.; Evans, W.; Zhang, W. Spatial radon anomalies on active faults in California. Appl. Geochem. 1996, 11, 497–510. [Google Scholar] [CrossRef]
- Etiope, G.; Martinelli, G. Migration of carrier and trace gases in the geosphere: an overview. Phys. Earth Planet. Inter. 2002, 129, 185–204. [Google Scholar] [CrossRef]
- Ciotoli, G.; Lombardi, S.; Annunziatellis, A. Geostatistical analysis of soil gas data in a high seismic intermontane basin: Fucino Plain, central Italy. J. Geophys. Res. 2007, 112. [Google Scholar] [CrossRef]
- Annunziatellis, A.; Beaubien, S.; Bigi, S.; Ciotoli, G.; Coltella, M.; Lombardi, S. Gas migration along fault systems and through the vadose zone in the Latera caldera (central Italy): Implications for CO2 geological storage. Int. J. Greenh. Gas Control. 2008, 2, 353–372. [Google Scholar] [CrossRef]
- Richon, P.; Klinger, Y.; Tapponnier, P.; Li, C.-X.; Van Der Woerd, J.; Perrier, F. Measuring radon flux across active faults: Relevance of excavating and possibility of satellite discharges. Radiat. Meas. 2010, 45, 211–218. [Google Scholar] [CrossRef]
- Ball, T.K.; Cameron, D.G.; Colman, T.B.; Roberts, P.D. Behavior of radon in the geological environment: a review. Q. J. Eng. Geol. 1991, 2, 169–182. [Google Scholar] [CrossRef]
- Walia, V., Lin. Soil–gas monitoring: a tool for fault delineation studies along hsinhua fault (Taiwan), southern Taiwan. Appl. Geochem. 2010; 25, 602–607. [Google Scholar]
- Moreno, V.; Bach, J.; Font, L.; Baixeras, C.; Zarroca, M.; Linares, R.; Roqué, C. Soil radon dynamics in the Amer fault zone: An example of very high seasonal variations. J. Environ. Radioact. 2016, 151, 293–303. [Google Scholar] [CrossRef] [PubMed]
- Chen, Z.; Li, Y.; Liu, Z.; Wang, J.; Zhou, X.; Du, J. Radon emission from soil gases in the active fault zones in the Capital of China and its environmental effects. Sci. Rep. 2018, 8, 16772. [Google Scholar] [CrossRef] [PubMed]
- Kobeissi, M.A.; Gomez, F.; Tabet, C. Measurement of Anomalous Radon Gas Emanation Across the Yammouneh Fault in Southern Lebanon: A Possible Approach to Earthquake Prediction. Int. J. Disaster Risk Sci. 2015, 6, 250–266. [Google Scholar] [CrossRef]
- Miklyaev, P.; Petrova, T.; Marennyy, A.; Shchitov, D.; Sidyakin, P.; Murzabekov, M.; Lopatin, M. High seasonal variations of the radon exhalation from soil surface in the fault zones (Baikal and North Caucasus regions). J. Environ. Radioact. 2020, 219, 106271. [Google Scholar] [CrossRef] [PubMed]
- Gingrich, J.E. Results from a new uranium exploration method. Trans. Trans. AIME 1975, 258, 61–64. [Google Scholar]
- Gingrich, J.E., Fisher, J.C., 1976. Uranium Exploration Using the Track-etch Method. IAEASM-208/19, pp. 213–224.
- Fleischer, R.L.; Mogro-Campero, A. Mapping of integrated radon emanation for detection of long-distance migration of gases within the Earth: Techniques and principles. J. Geophys. Res. 1978, 83, 3539–3549. [Google Scholar] [CrossRef]
- Chen, X.; Liu, Y.; Jiang, Y.; Feng, S. Radon transport carried by geogas: prediction model. Environ. Sci. Pollut. Res. 2023, 30, 86656–86675. [Google Scholar] [CrossRef] [PubMed]
- Berberich, G.M.; Berberich, M.B.; Ellison, A.M.; Wöhler, C. Degassing Rhythms and Fluctuations of Geogenic Gases in A Red Wood-Ant Nest and in Soil in The Neuwied Basin (East Eifel Volcanic Field, Germany). Insects 2018, 9, 135. [Google Scholar] [CrossRef]
- Cao, H.; Jia, X.; Li, Y.; Amador, C.; Ding, Y. CFD-DNS simulation of irregular-shaped particle dissolution. Particuology 2020, 50, 144–155. [Google Scholar] [CrossRef]
- Vàrhegyi, A.; Hakl, J.; Monnin, M.; Morin, J.; Seidel, J. Experimental study of radon transport in water as test for a transportation microbubble model. J. Appl. Geophys. 1992, 29, 37–46. [Google Scholar] [CrossRef]
- Novikov, G.F. (1989) Radiometric scouting. Nedra, Leningrad, 407 p.
- King, C.Y., Minissale. Soil variability of soil-gas radon concentration of cenrtal California. Radiat. Meas. 1994, 23, 683–692. [Google Scholar] [CrossRef]
- Miklyaev Petr, S.; Petrova Tatiana, B.; Shchitov Dmitriy, V.; Sidyakin Pavel, A.; Murzabekov Murat, A.; Tsebro Dmitriy, N.; Marennyy Albert, M.; Nefedov Nikolay, A.; Gavriliev Sakhayaan, G. Radon transport in permeable geological environments. Science of the Total Environment 2022, 852, 158382. [Google Scholar]
- Firstov, P.P.; Makarov, E.O.; Glukhova, I.P. Parameter Variations in the Subsoil Radon Field at the Paratunka Station of the Petropavlovsk-Kamchatsky Geodynamic Test Site in 2011–2016. Seism. Instruments 2018, 54, 121–133. [Google Scholar] [CrossRef]
- Utkin, V.I.; Yurkov, A.K. Radon as a “Deterministic” indicator of natural and industrial geodynamic processes. Dokl. Earth Sci. 2009, 427, 833–836. [Google Scholar] [CrossRef]
- Kats, V.E.; Shitov, A.V.; Drachev, S.S. On the mechanisms of changes in the chemical composition and temperature of groundwater in the Gorno-Altaisk region. Geoecology, engineering geology, hydrogeology, geocryology 2010, 3, 207–212. [Google Scholar]
- Ciotoli, G.; Bigi, S.; Tartarello, C.; Sacco, P.; Lombardi, S.; Ascione, A.; Mazzoli, S. Soil gas distribution in the main coseismic surface rupture zone of the 1980, Ms = 6.9, Irpinia earthquake (southern Italy). J. Geophys. Res. Solid Earth 2014, 119, 2440–2461. [Google Scholar] [CrossRef]
- Jacob, N.; Suresh Babu, D.S.; Shivanna, K. Radon as an indicator of submarine groundwater discharge in coastal regions. Current Science 2009, 97, 1313–1320. [Google Scholar]
- Kawabata, H.; Narita, H.; Harada, K.; Tsunogai, S.; Kusakabe, M. Air-Sea Gas Transfer Velocity in Stormy Winter Estimated from Radon Deficiency. Journal of Oceanography 2003, 59, 651–661. [Google Scholar] [CrossRef]
- Marty, B.; Tolstikhin, I.N. CO2 fluxes from mid-ocean ridges, arcs and plumes. Chemical Geology, 2: 145, 1998; 145, 233–248. [Google Scholar]
- Levintal, E.; Dragila, M.I.; Zafrir, H.; Noam, W. The role of atmospheric conditions in CO2 and radon emissions from an abandoned water well. Science of The Total Environment 2020, 720, 137857. [Google Scholar] [CrossRef]
- Benkovitz, A.; Zafrir, H.; Reuveni, Y. The dynamics of Rn-222 cyclic flow within the shallow geological subsurface media as a daily temporal variated source for exhalation into the air. Sci. Total. Environ. 2024, 912, 169244. [Google Scholar] [CrossRef] [PubMed]
- Mao, Y.; Zhang, L.; Wang, H.; Guo, Q. The temporal variation of radon concentration at different depths of soil: A case study in Beijing. Journal of Environmental Radioactivity 2023, 264, 107200. [Google Scholar] [CrossRef] [PubMed]
- Cushman-Roisin, B. Atmospheric boundary layer. Environment fluid dynamics 2014, 165–186. [Google Scholar]
- Pulinets, S.A.; Davidenko, D.V. The Nocturnal Positive Ionospheric Anomaly of Electron Density as a Short-Term Earthquake Precursor and the Possible Physical Mechanism of Its Formation. Geomagn. Aeron. 2018, 58, 559–570. [Google Scholar] [CrossRef]
- Eresmaa, N.; Härkönen, J.; Joffre, S.M.; Schultz, D.M.; Karppinen, A.; Kukkonen, J. A Three-Step Method for Estimating the Mixing Height Using Ceilometer Data from the Helsinki Testbed. J. Appl. Meteorol. Clim. 2012, 51, 2172–2187. [Google Scholar] [CrossRef]
- Vinuesa, J.-F.; Basu, S.; Galmarini, S. The diurnal evolution of 222Rn and its progeny in the atmospheric boundary layer during the Wangara experiment. Atmospheric Meas. Tech. 2007, 7, 5003–5019. [Google Scholar] [CrossRef]
- Griffiths, A.D.; Parkes, S.D.; Chambers, S.D.; McCabe, M.F.; Williams, A.G. Improved mixing height monitoring through a combination of lidar and radon measurements. Atmospheric Meas. Tech. 2013, 6, 207–218. [Google Scholar] [CrossRef]
- Chandrashekara, М.S.; Sannappa, J.; Paramesh, L. Electrical conductivity of air related to ion pair production rate from radon and its progeny concentrations in dwellings of Mysore city. Indian Joumal of Pure & Applied Physics. 2005, 43, 679–683. [Google Scholar]
- Miklyaev, P.S.; Petrova, T.B.; Shchitov, D.V.; Sidyakin, P.A.; Murzabekov, M.A.; Tsebro, D.N.; Marennyy, A.M.; Nefedov, N.A.; Gavriliev, S.G. Radon transport in permeable geological environments. Sci. Total. Environ. 2022, 852, 158382. [Google Scholar] [CrossRef]
- Shitov, A.V. The Influence of Regional and Global Geophysical Characteristics on the Volumetric Activity of Radon in Gorno-Altaisk (Russia). Radon: Detection, Exposure and Control. Nova Science Publishers. p. 19–30. 2020. [Google Scholar]
- Podymov, I.; Podymova, T. Seasonal variability of radon volumetric activity in the surface layer of the atmosphere of the Black Sea coast. Conference: MSOI 2017. [Google Scholar] [CrossRef]
- Zafrir, H.; Barbosa, S.M.; Malik, U. Differentiation between the effect of temperature and pressure on radon within the subsurface geological media. Radiat. Meas. 2013, 49, 39–56. [Google Scholar] [CrossRef]
- Giuliani, G.G.; Attanasio, A.; Fioravanti, G. Gamma Detectors for Continuous Monitoring of Radon. Journal of International Environmental Application and Science 2013, 8, 541–550. [Google Scholar]
- Belete, G.D.; Shiferaw, A.M. A Review of Studies on the Seasonal Variation of Indoor Radon-222 Concentration. Oncol. Rev. 2022, 16, 10570. [Google Scholar] [CrossRef] [PubMed]
- Sturrock, P.; Steinitz, G.; Fischbach, E.; Javorsek, D.; Jenkins, J. Analysis of gamma radiation from a radon source: Indications of a solar influence. Astropart. Phys. 2012, 36, 18–25. [Google Scholar] [CrossRef]
- Zafrir, H.; Haquin, G.; Malik, U.; Barbosa, S.; Piatibratova, O.; Steinitz, G. Gamma versus alpha sensors for Rn-222 long-term monitoring in geological environments. Radiat. Meas. 2011, 46, 611–620. [Google Scholar] [CrossRef]
- Geller, R.J.; Jackson, D.D.; Kagan, Y.Y.; Mulargia, F. Earthquakes Cannot Be Predicted. Science 1997, 275, 1616–1618. [Google Scholar] [CrossRef]
- Neznal M., Neznal M. Measurement of radon exhalation rate from the ground surface: Can the parameter be used for a determination of radon potential of soils? Radon investigations in the Czech Republic IX (2002) pp. 16-25. https://www.radon-vos.cz/pdf/radon_inv_9-2002.pdf.
- Robertson, L.B. (2004) Radon emissions to the atmosphere and their use as an atmospheric tracer. PhD Thesis, College of Science and Engineering, Institute of Atmospheric and Environmental Science, School of GeoSciences. The University of Edinburg.
- Tsukuda, T. (2008) Radon-gas Monitoring by Gamma-ray Measurements on the Ground for Detecting Crustal Activity Changes. Bull. Earthq. Res. Inst. Univ. Tokyo 2008, 83, 227–241. [Google Scholar]
- Nicolas, A.; Girault, F.; Schubnel, A.; Pili, *!!! REPLACE !!!*; Passelègue, F.; Fortin, J.; Deldicque, D. Radon emanation from brittle fracturing in granites under upper crustal conditions. Geophys. Res. Lett. 2014, 41, 5436–5443. [Google Scholar] [CrossRef]
- Trique, M.; Richon, P.; Perrier, F.; Avouac, J.P.; Sabroux, J.C. Radon emanation and electric potential variations associated with transient deformation near reservoir lakes. Nature 1999, 399, 137–141. [Google Scholar] [CrossRef]
- Seminsky, K.; Bobrov, A.; Demberel, S. Radon and Tectonic Activities of Crustal Faults: the Case of Central Mongolia. Russ. Geol. Geophys. 2019, 60, 204–214. [Google Scholar] [CrossRef]
- Pulinets, S.A.; Ouzounov, D.P.; Karelin, A.V.; Davidenko, D.V. Physical bases of the generation of short-term earthquake precursors: A complex model of ionization-induced geophysical processes in the lithosphere-atmosphere-ionosphere-magnetosphere system. Geomagn. Aeron. 2015, 55, 521–538. [Google Scholar] [CrossRef]
- Pulinets, S.; Ouzounov, D.; Karelin, A.; Boyarchuk, K. Earthquake Precursors in the Atmosphere and Ionosphere; Springer Science and Business Media LLC: Dordrecht, GX, Netherlands, 2022. [Google Scholar]
- Pulinets, S.; Vičič, B.; Budnikov, P.; Potočnik, M.; Dolenec, M.; Žalohar, J. Correlation between Shear-Traction field and Atmospheric Chemical Potential as a tool for earthquake forecasting. In Proceedings of the 3rd European Conference on Earthquake Engineering and Seismology, Bucharest, Romania, 4–9 September 2022; Editura Conspress Publ., 9 September; pp. 3623–3627, ISBN 978-973-100-533-1. [Google Scholar]
- Oh, Y.H.; Kim, G. A radon-thoron isotope pair as a reliable earthquake precursor. Sci. Rep. 2015, 5, srep13084. [Google Scholar] [CrossRef] [PubMed]
- Gregorič, A.; Zmazek, B.; Džeroski, S.; Torkar, D.; Vaupotič, J. Ch. 9 Radon as an Earthquake Precursor – Methods for Detecting Anomalies. In Earthquake Research and Analysis - Statistical Studies, Observations and Planning. Ed. Sebastiano D'Amico; InTech Publ., 2012; pp. 179–196. [Google Scholar]
- Podymov, I.S.; Podymova, T.M.; Esin, N.V. Infrared Radiation of Thermal Anomalies and Radon Fluctuation Anomalies Preceding Two Earthquakes in the Sea of Azov and the Black Sea. Ekologicheskaya Bezop. pribrezhnoy i shel'fovoy zon morya. [CrossRef]
- Dobrovolsky, I.P.; Zubkov, S.I.; Miachkin, V.I. Estimation of the size of earthquake preparation zones. Pure Appl. Geophys. 1979, 117, 1025–1044. [Google Scholar] [CrossRef]
- Toutain, J.-P.; Baubron, J.-C. Gas geochemistry and seismotectonics: a review. Tectonophysics 1998, 304, 1–27. [Google Scholar] [CrossRef]
- Fleischer, R.I. Dislocation model for radon response to distance earthquakes. Geophys. Res. Let. 1981, 8, 477–480. [Google Scholar] [CrossRef]
- Aki, K.; Richards, P.G. Quantitative Seismology. Theory and Methods; Freeman: New York, 1980; 948 p. [Google Scholar]
- Ilin, N.V.; Slyunyaev, N.N.; Mareev, E.A. Toward a Realistic Representation of Global Electric Circuit Generators in Models of Atmospheric Dynamics. J. Geophys. Res. Atmos. 2020, 125. [Google Scholar] [CrossRef]
- Eisenbud, M.; Gesell, T. Environmental Radioactivity: From Natural, Industrial, and Military Sources, 4th ed.; San Diego Academic Press: San Diego; 688 p.
- Karagodin, A.V. Impact of space factors on processes in the global electric circuit. Ph.D. Thesis, Saint Petersburg State University, 2022; 109 p. Available online: https://disser.spbu.ru/files/2022/disser_karagodin.
- Stenke, A.; Schraner, M.; Rozanov, E.; Egorova, T.; Luo, B.; Peter, T. The SOCOL version 3.0 chemistry–climate model: description, evaluation, and implications from an advanced transport algorithm. Geosci. Model Dev. 2012, 6, 1407–1427. [Google Scholar] [CrossRef]
- Maksimovsky V.A., Reshetov V.V., Kharlamov M.G. Radon hazard map of Russia. Scale 1:10 000 000 / Ed. Smyslova A.A.-M.-SPb, St. Petersburg State Mining Institute, 1995 - 1 p.
- Tinsley, B.A.; Zhou, L. Initial results of a global circuit model with variable stratospheric and tropospheric aerosols. J. Geophys. Res. 2006, 11, D16205. [Google Scholar] [CrossRef]
- Lucas, G.M.; Baumgaertner, A.J.G.; Thayer, J.P. A global electric circuit model within a community climate model. J. Geophys. Res. Atmos. 2015, 120, 12–054. [Google Scholar] [CrossRef]
- Noble, J.; Shivanna, K.; Suresh Babu, D.S. Radon as an indicator of submarine groundwater discharge in coastal regions. Current Science 2009, 97, 1313–1320. [Google Scholar]
- Usoskin, I.G.; Kovaltsov, G.A. Cosmic ray induced ionization in the atmosphere: Full modeling and practical applications. J. Geophys. Res. Atmos. 2006, 111. [Google Scholar] [CrossRef]
- Usoskin, I.G.; Kovaltsov, G.A.; Mironova, I.A. Cosmic ray induced ionization model CRAC:CRII: An extension to the upper atmosphere. J. Geophys. Res. Atmos. 2010, 115. [Google Scholar] [CrossRef]
- Segovia, N.; Pulinets, S.; Leyva, A.; Mena, M.; Monnin, M.; Camacho, M.; Ponciano, M.; Fernandez, V. Ground radon exhalation, an electrostatic contribution for upper atmospheric layers processes. Radiat. Meas. 2005, 40, 670–672. [Google Scholar] [CrossRef]
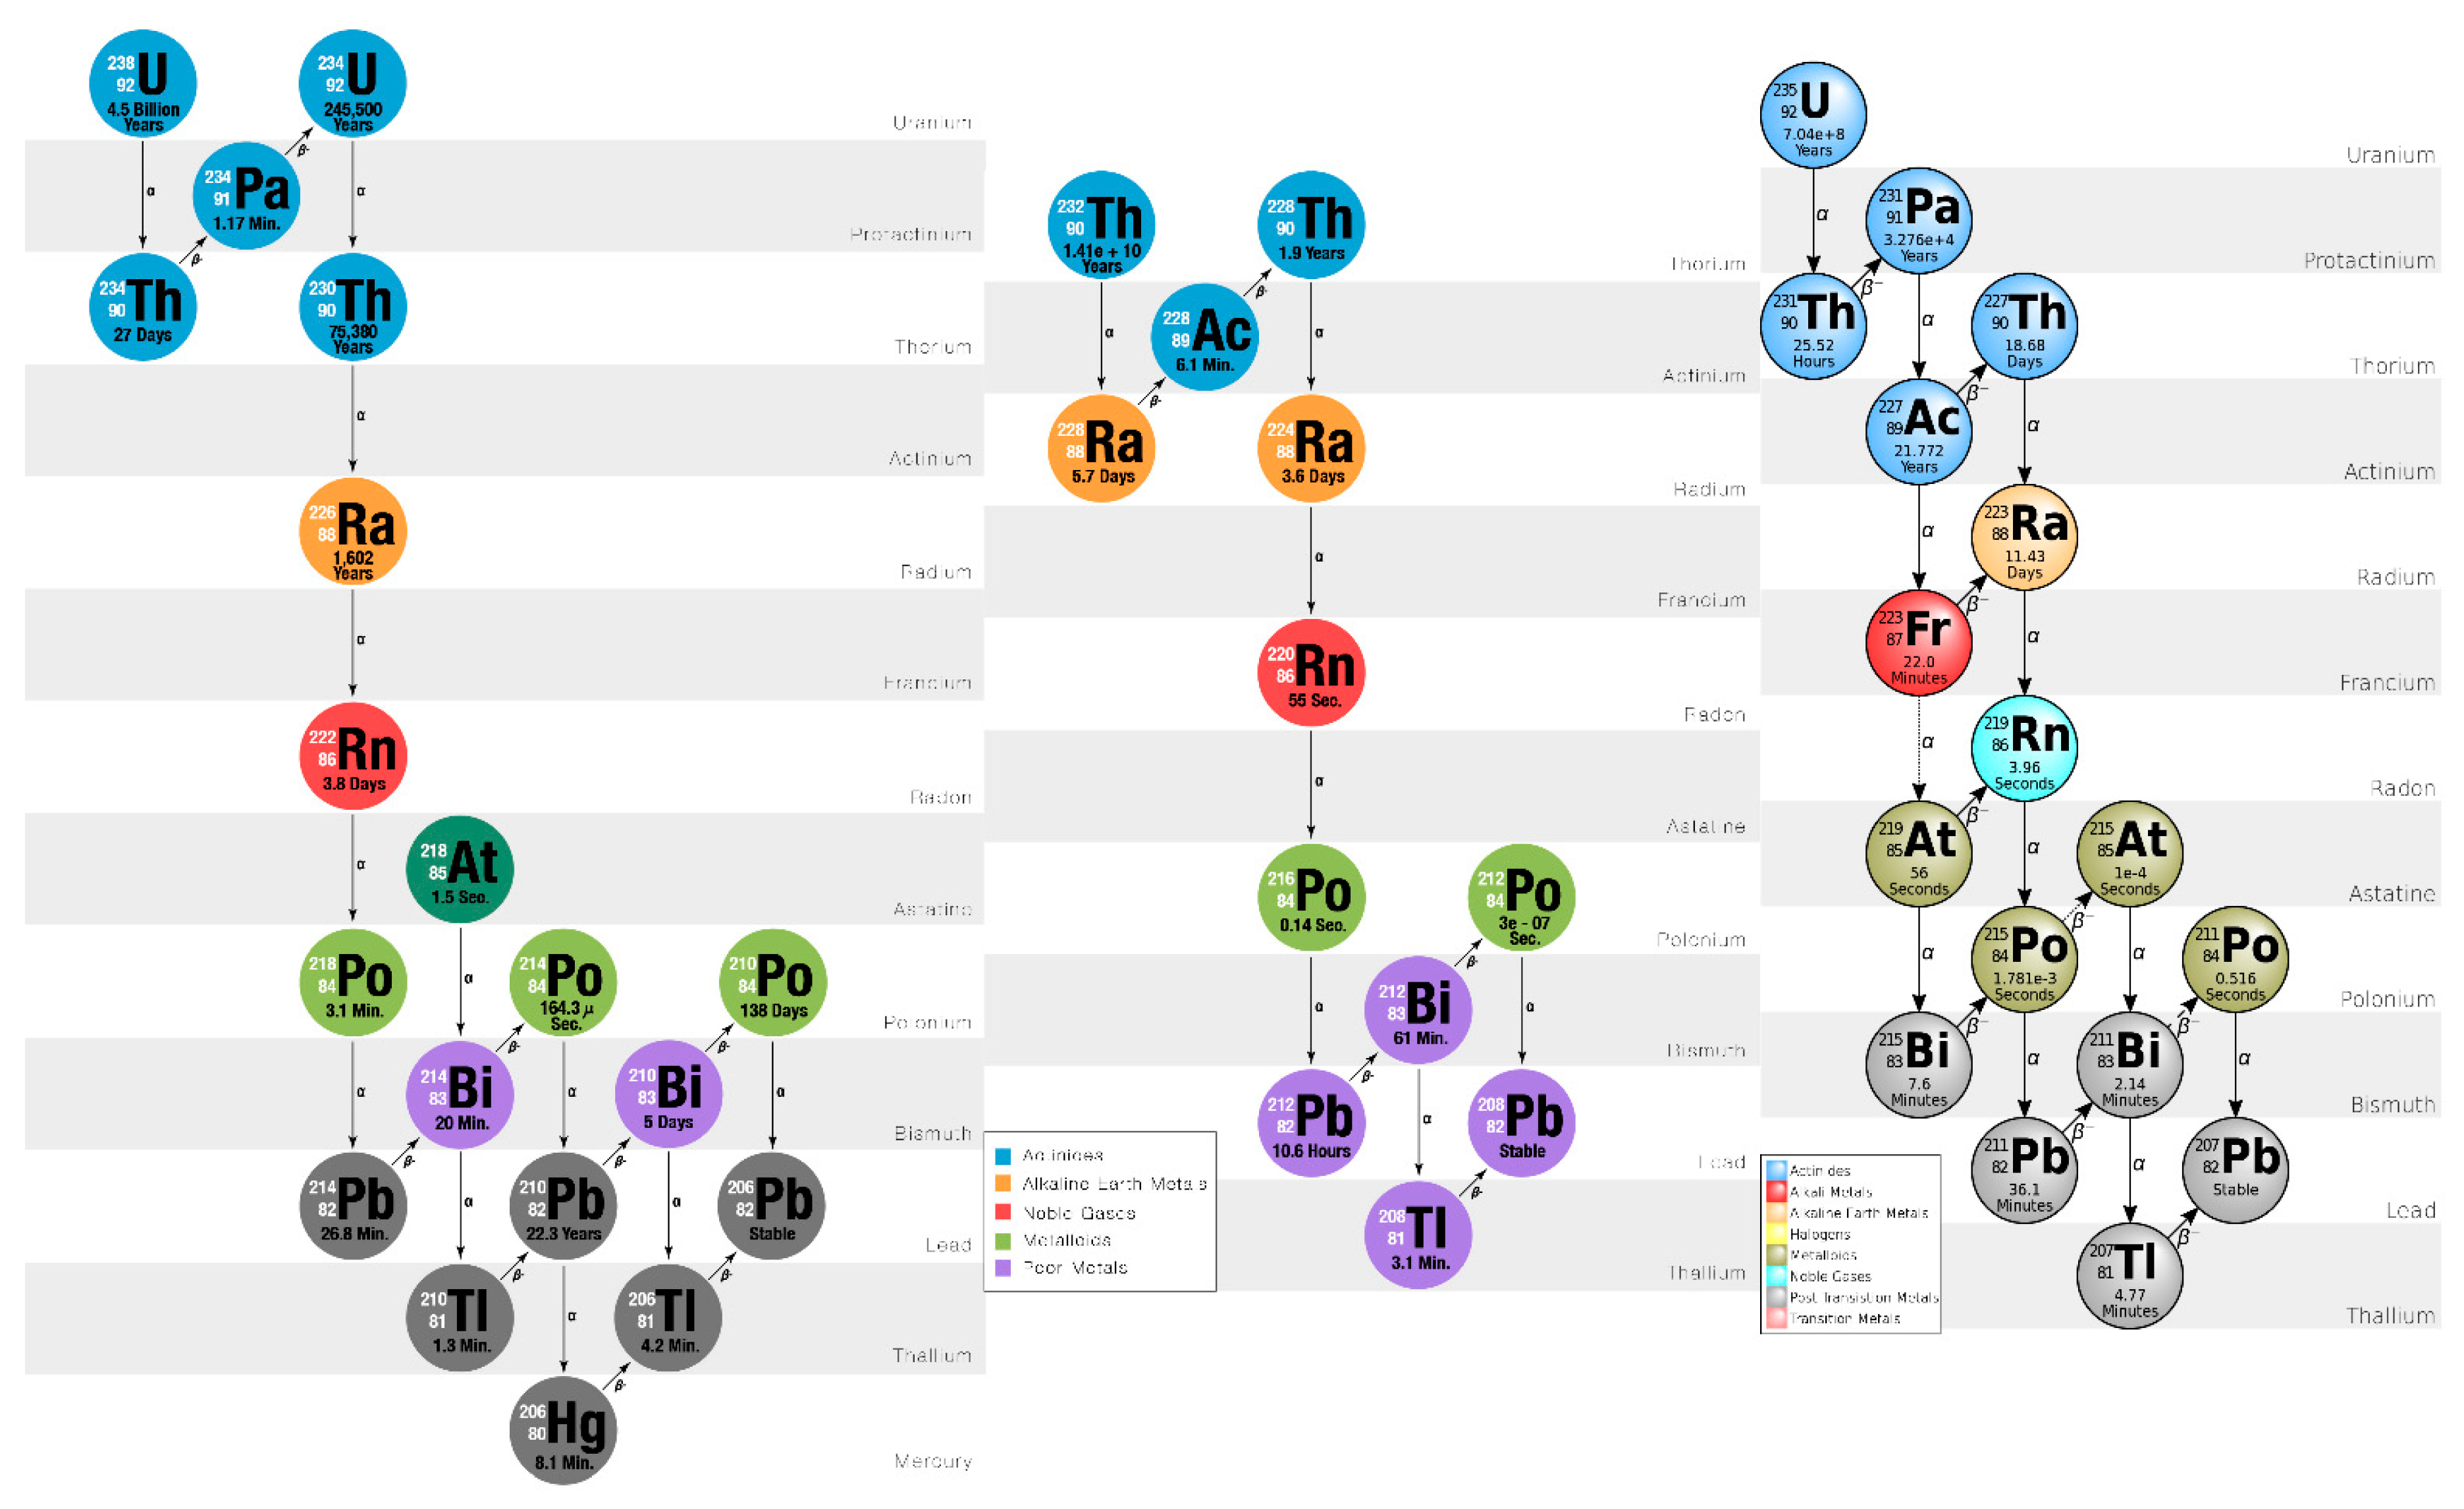

| nuclide | historic name (short) | historic name (long) | decay mode | half life | MeV | product of decay |
|---|---|---|---|---|---|---|
| 222Rn | Rn | Radon | α | 3.8235 d | 5.590 | 218Po |
| 220Rn | Tn | Thoron | α | 55.6 s | 6.4047 | 224Ra |
| 219Rn | An | Actinon | α | 3.96 s | 6.946 | 223Ra |
| 218Po | RaA | Radium A Polonium |
α β− |
3.10 min | 6.1150.265 | 214Pb218At |
| 218At | Astatine | α β− |
1.5 s | 6.8742.883 | 214Bi218Rn | |
| 218Rn | α | 35 ms | 7.263 | 214Po | ||
| 214Pb | RaB | Radium B | β− | 26.8 min | 1.024 | 214Bi |
| 214Bi | RaC | Radium C | β α− | 19.9 min | 3.2725.617 | 214Po210Tl |
| 214Po | RaC' | Radium C' | α | 0.1643 ms | 7.883 | 210Pb |
| Location | -70 cm | 0cm | 100 cm | ||||||
|---|---|---|---|---|---|---|---|---|---|
| Max | Min | Av ± RSD | Max | Min | Av±RSD | Max | Min | Av ± RSD | |
| Cuernavaca Bqm-3 % original soil radon |
4813 100 |
873 100 |
2249 ±71 100 |
288 6 |
86 10 |
179±48 8 |
37 0.8 |
20 2.3 |
29 ± 6 1.3 |
| Las Cruces Bqm-3 % original soil radon |
3197 100 |
500 100 |
1574 ±64 100 |
159 5 |
59 12 |
106 ± 33 6.7 |
18 0.5 |
17 3.4 |
18±4 1.1 |
Disclaimer/Publisher’s Note: The statements, opinions and data contained in all publications are solely those of the individual author(s) and contributor(s) and not of MDPI and/or the editor(s). MDPI and/or the editor(s) disclaim responsibility for any injury to people or property resulting from any ideas, methods, instructions or products referred to in the content. |
© 2024 by the authors. Licensee MDPI, Basel, Switzerland. This article is an open access article distributed under the terms and conditions of the Creative Commons Attribution (CC BY) license (http://creativecommons.org/licenses/by/4.0/).


