Submitted:
17 January 2024
Posted:
18 January 2024
You are already at the latest version
Abstract
Keywords:
1. Introduction
1.1. ELT management: state of the art
| Country | Total ELT generated | Energy | Material | Civil/backfill | other | Total ELT recovered | ELT recovered (%) |
| China (2018) | 14545 | 0 | 5650 | 0 | 8895 | 5650 | 39 |
| United States (2017) | 3700 | 1442 | 1227 | 326 | 706 | 2995 | 81 |
| Europe +(2017) | 3425.5 | 1180 | 1855.5 | 105.5 | 283.5 | 3141 | 92 |
| India (2015) | 2749.8 | 600 | 2094.8 | 0 | 55 | 2694.8 | 98 |
| Japan (2017) | 849 | 619.5 | 160.5 | 1 | 68 | 781 | 92 |
| Russia 2017) | 800 | 6 | 154 | 0 | 640 | 160 | 20 |
| Indonesia (2017) | 684.4 | 376.4 | 136.9 | 0 | 171.1 | 513.3 | 75 |
| Brazil (2017) | 587.9 | 206.1 | 379.1 | 0 | 2.7 | 585.2 | 100 |
| Thailand (2012) | 515 | 75.4 | 202.3 | 0 | 237.3 | 277.7 | 54 |
| Mexico (2017) | 467.5 | 67.1 | 27.9 | 0 | 372.5 | 95 | 20 |
| South Korea(2017) | 319.4 | 160 | 120.9 | 0 | 38.5 | 280.9 | 88 |
| South Africa (2015) | 204 | 9.4 | 41.5 | 0 | 153 | 50.9 | 25 |
| Argentina (2018) | 150 | 0 | 9.6 | 0 | 140.4 | 9.6 | 6 |
| Nigeria (2017) | 113 | 2.8 | 2.8 | 0 | 107.3 | 5.6 | 5 |
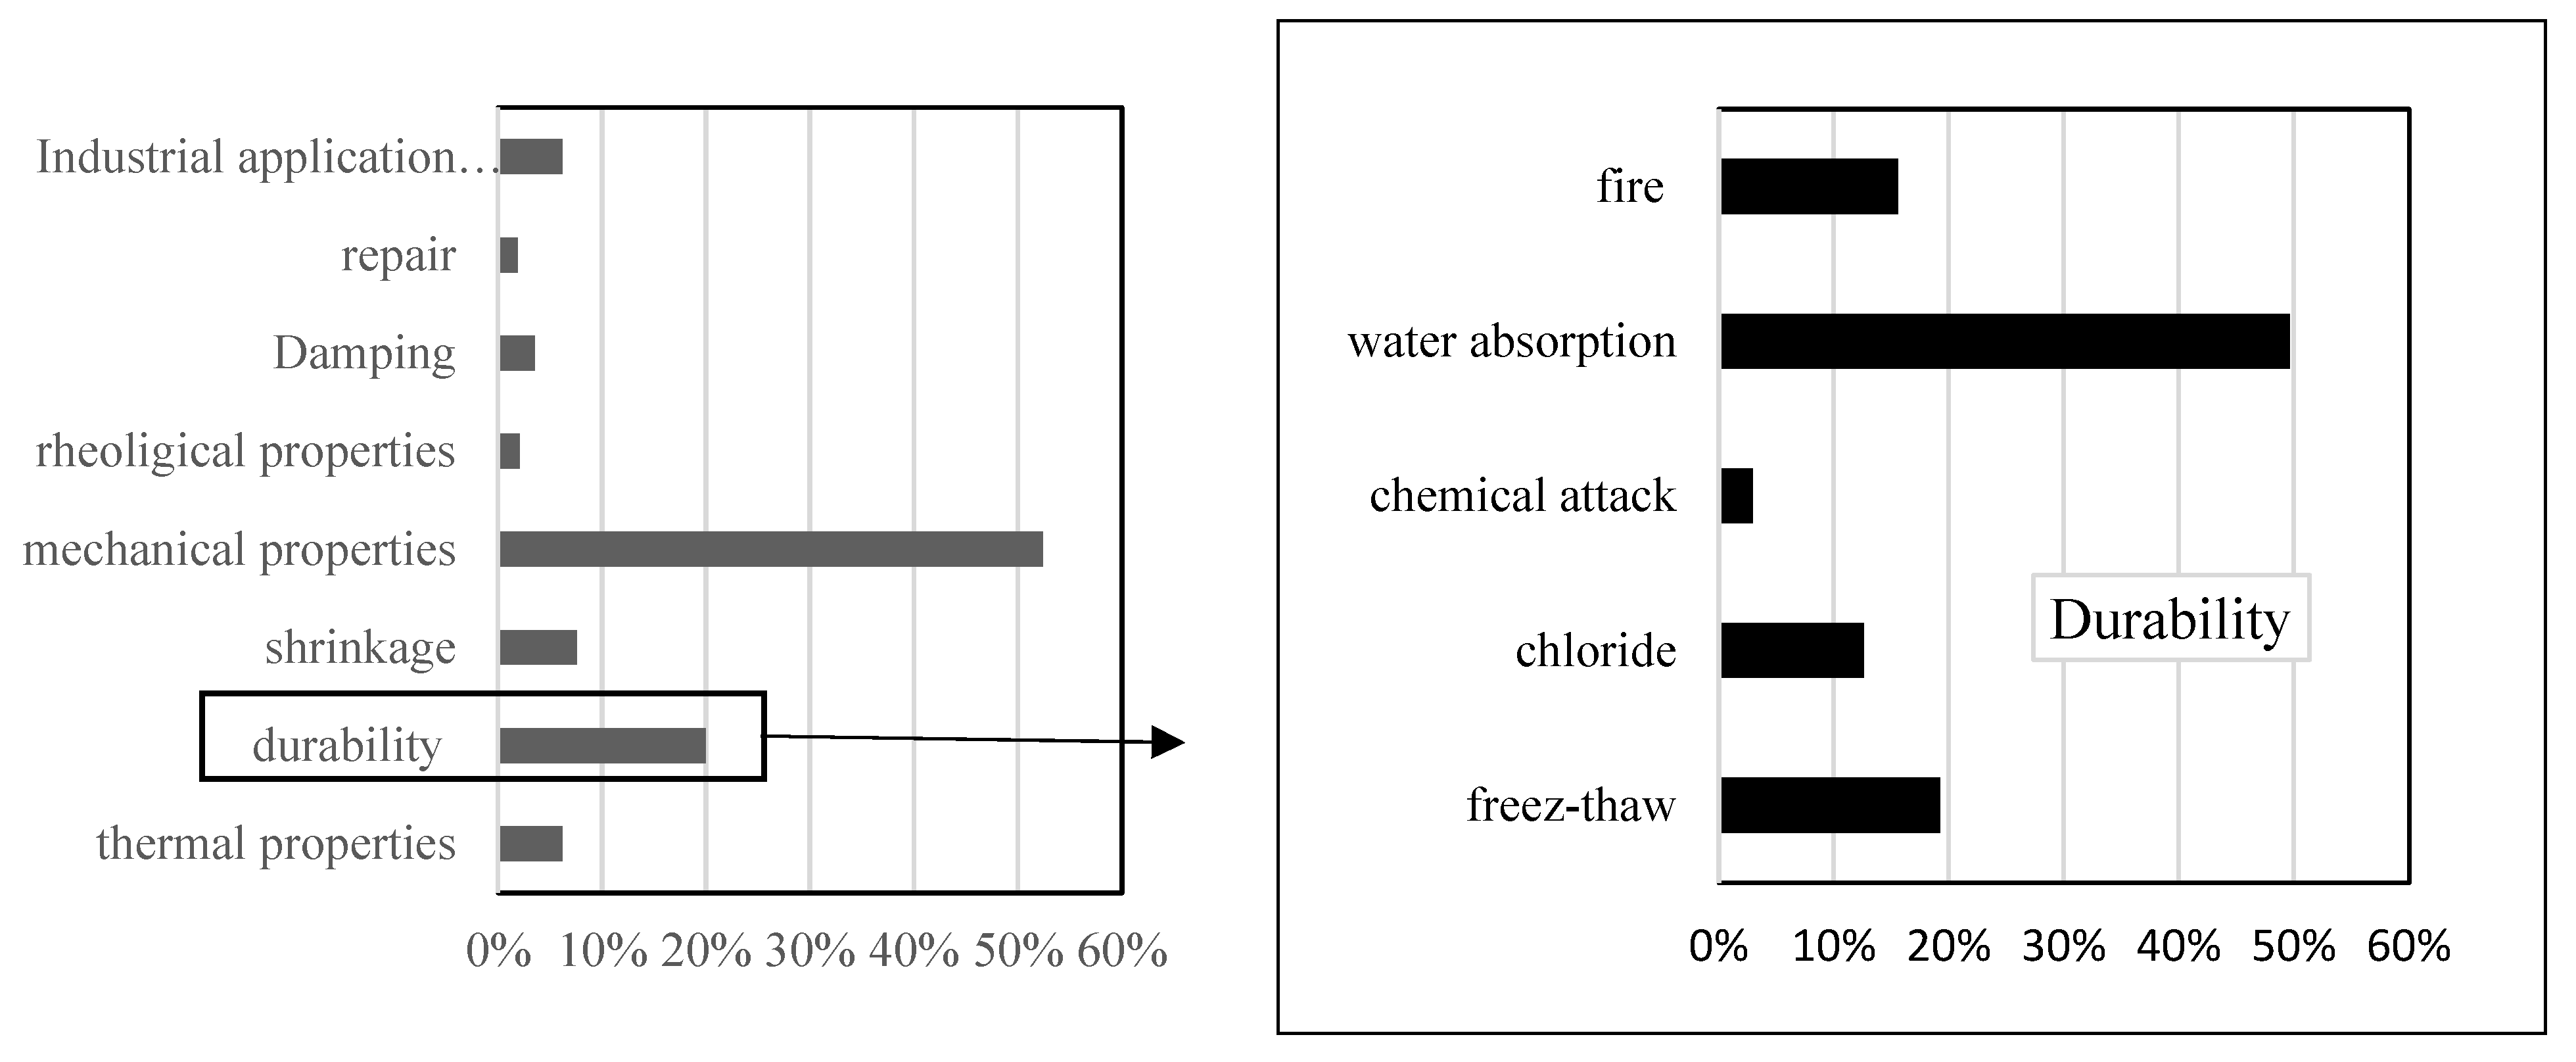
1.2. Recovery of ELT tires as Tyre Derived Aggregate for mortars/concrete applications: state of the art
1.3. Objectives of this research and novelty
- NF EN 1504-3 defining the classes of products according to their performance: classes R4 and R3 for structural repair and classes R2 and R1 for non-structural repair.
- EN 206-1 prescribing the minimum compressive strength class at 28 days for structural applications (LC8/9 minimum) and its density class from D1.0 (o D2.0 .
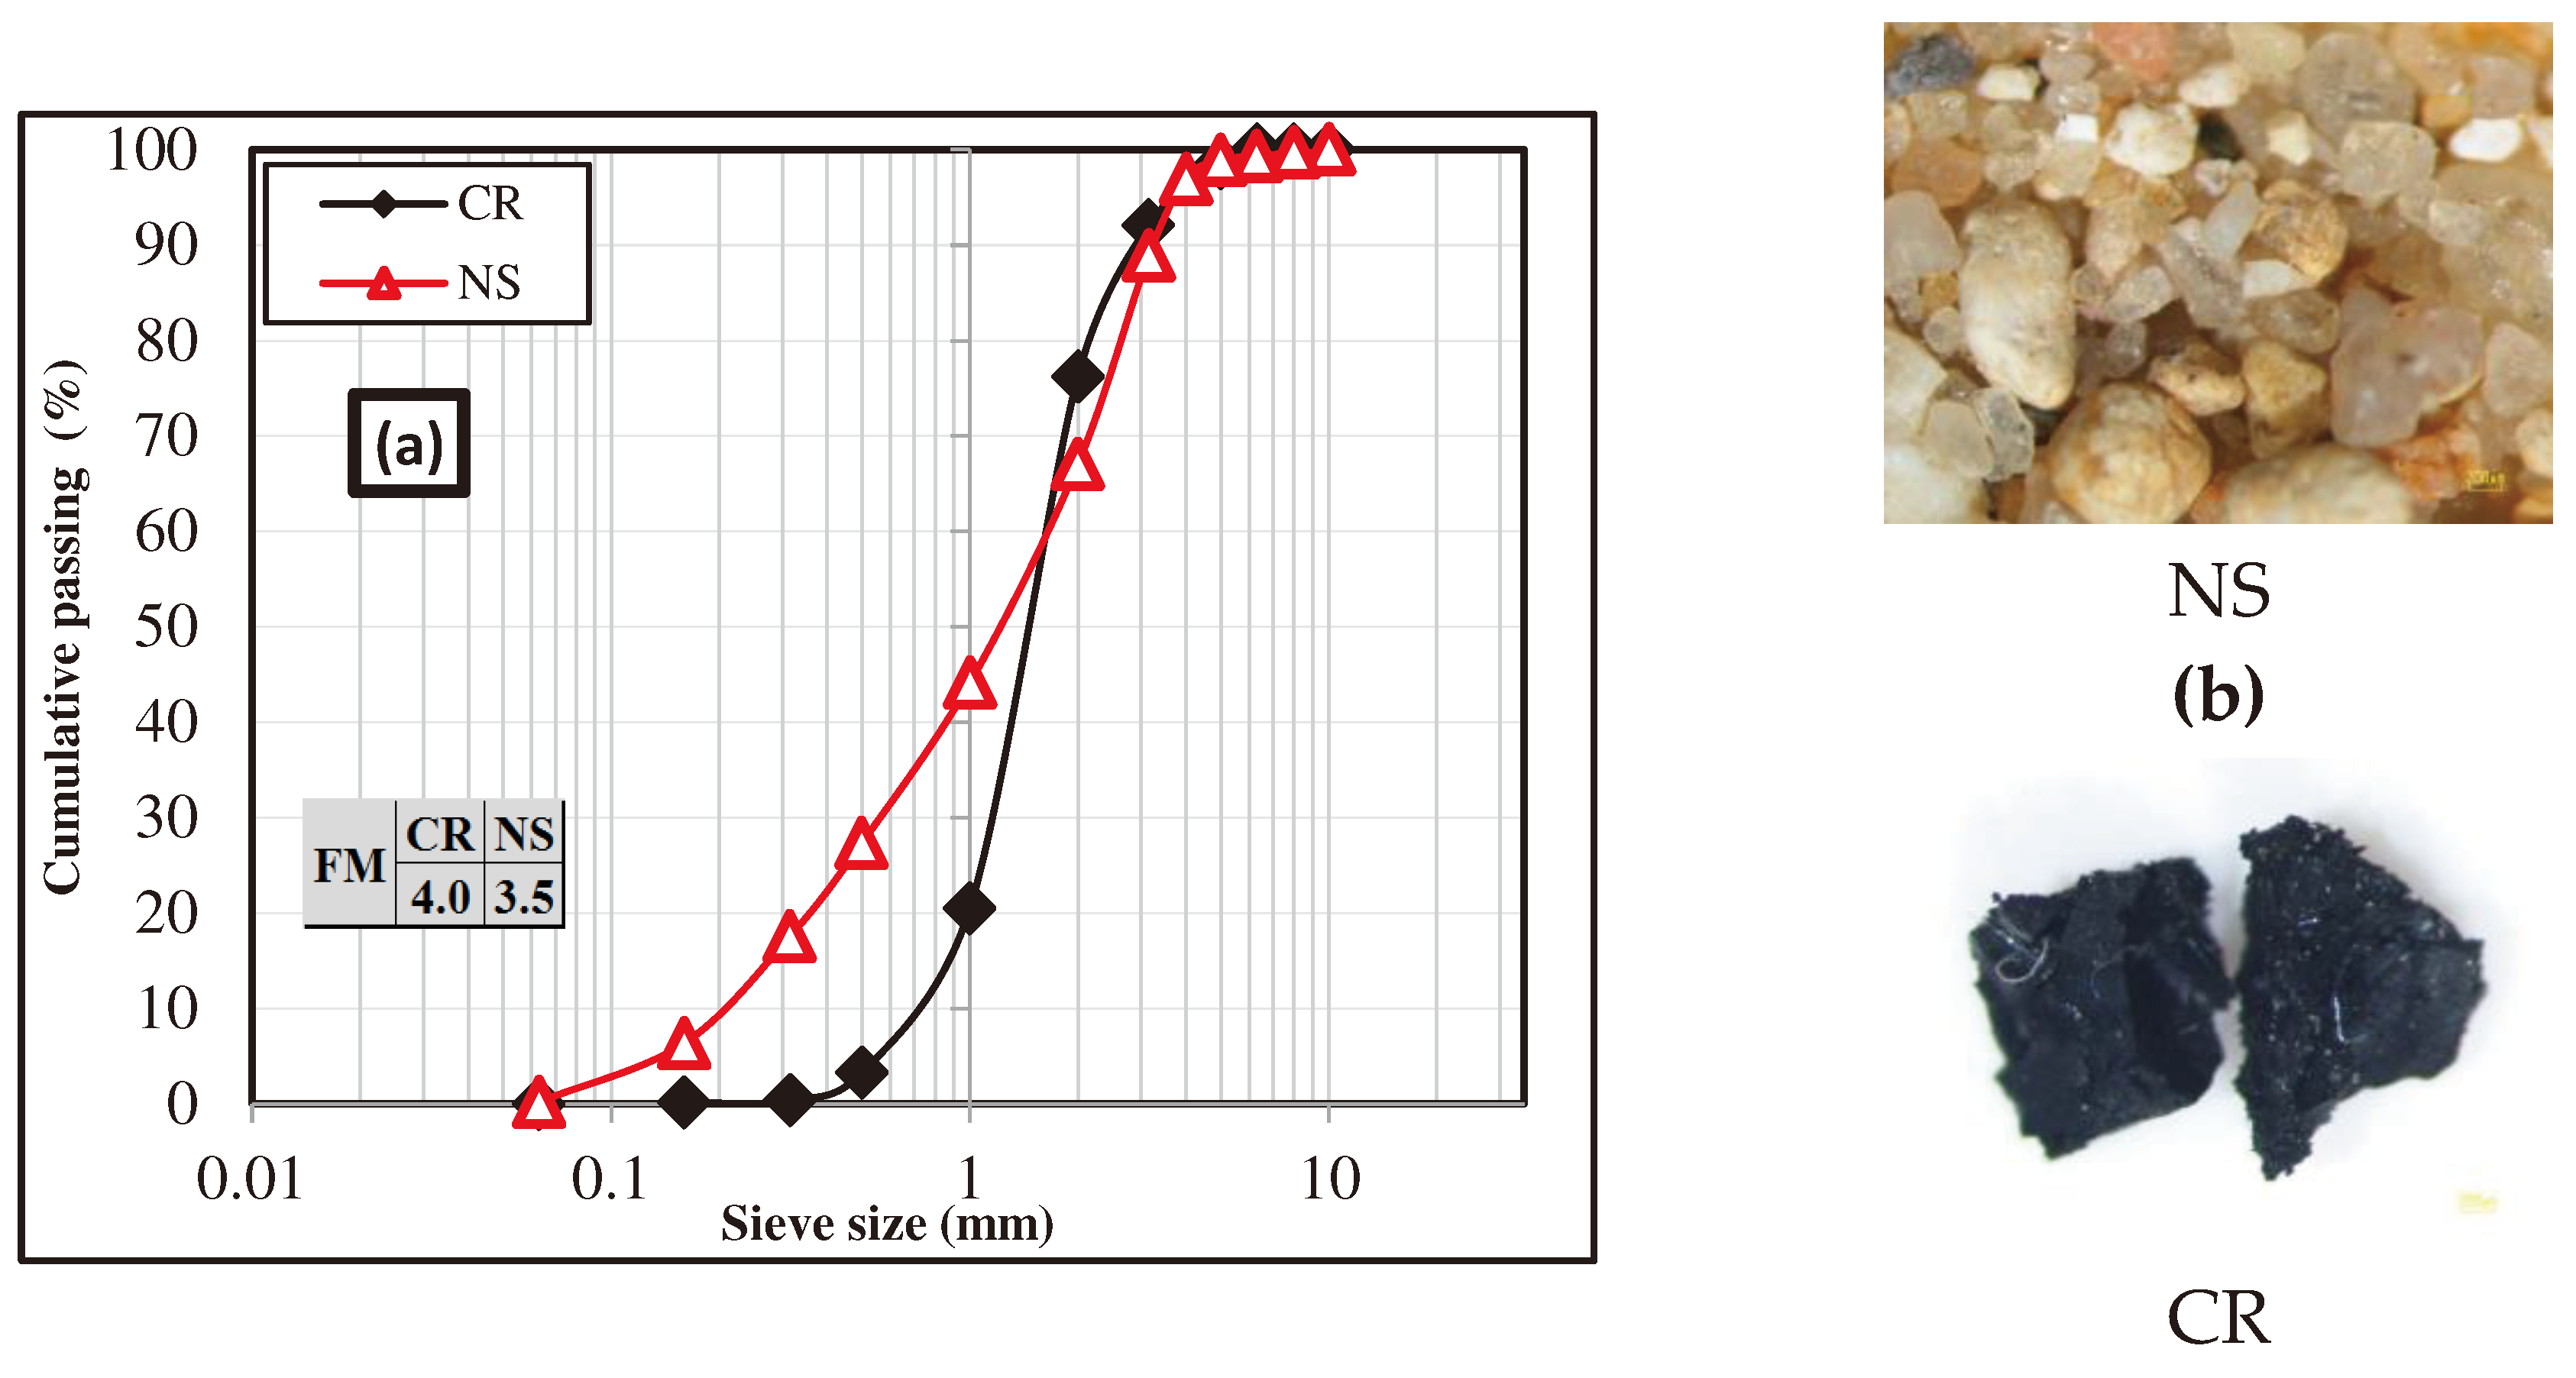
- NF P 18-840 defining the key characteristics for a good repair, namely very good adhesion to the support, mechanical compatibility with existing concrete, controlled shrinkage, permeability, resistance to chemical aggression from carbon dioxide, chlorides and/or sulphates, and workability. Hence, CR and NS have been characterized by their granulometries, densities, water absorption coefficients, and heat capacities measured using a deferential scanning calorimetry (DSC) test. At the fresh state, mortars were characterized by evaluating its density, workability (to verify the conformity to NF P 18-840), setting time and air content tests. At the hardened state, mortar was tested by measuring its density (to check its density class), porosity, three-point bending, and compressive strength (resistance class) to verify the influence of CR on the physical and mechanical performance of mortar. The adhesion of CR mortars to the support, the mechanical compatibility with existing concrete and the shrinkage were also assessed.
2. Materials and Methods
2.1. Materials
2.2. Experimental procedures
2.3. Characteristics of CR and NS
2.4. Mortar mixtures
3. Results and discussion
3.1. Mortar at the fresh state
3.2. Characterization of mortars at hardened state
- a.
- Density and porosity
- b.
- Thermal properties
- c.
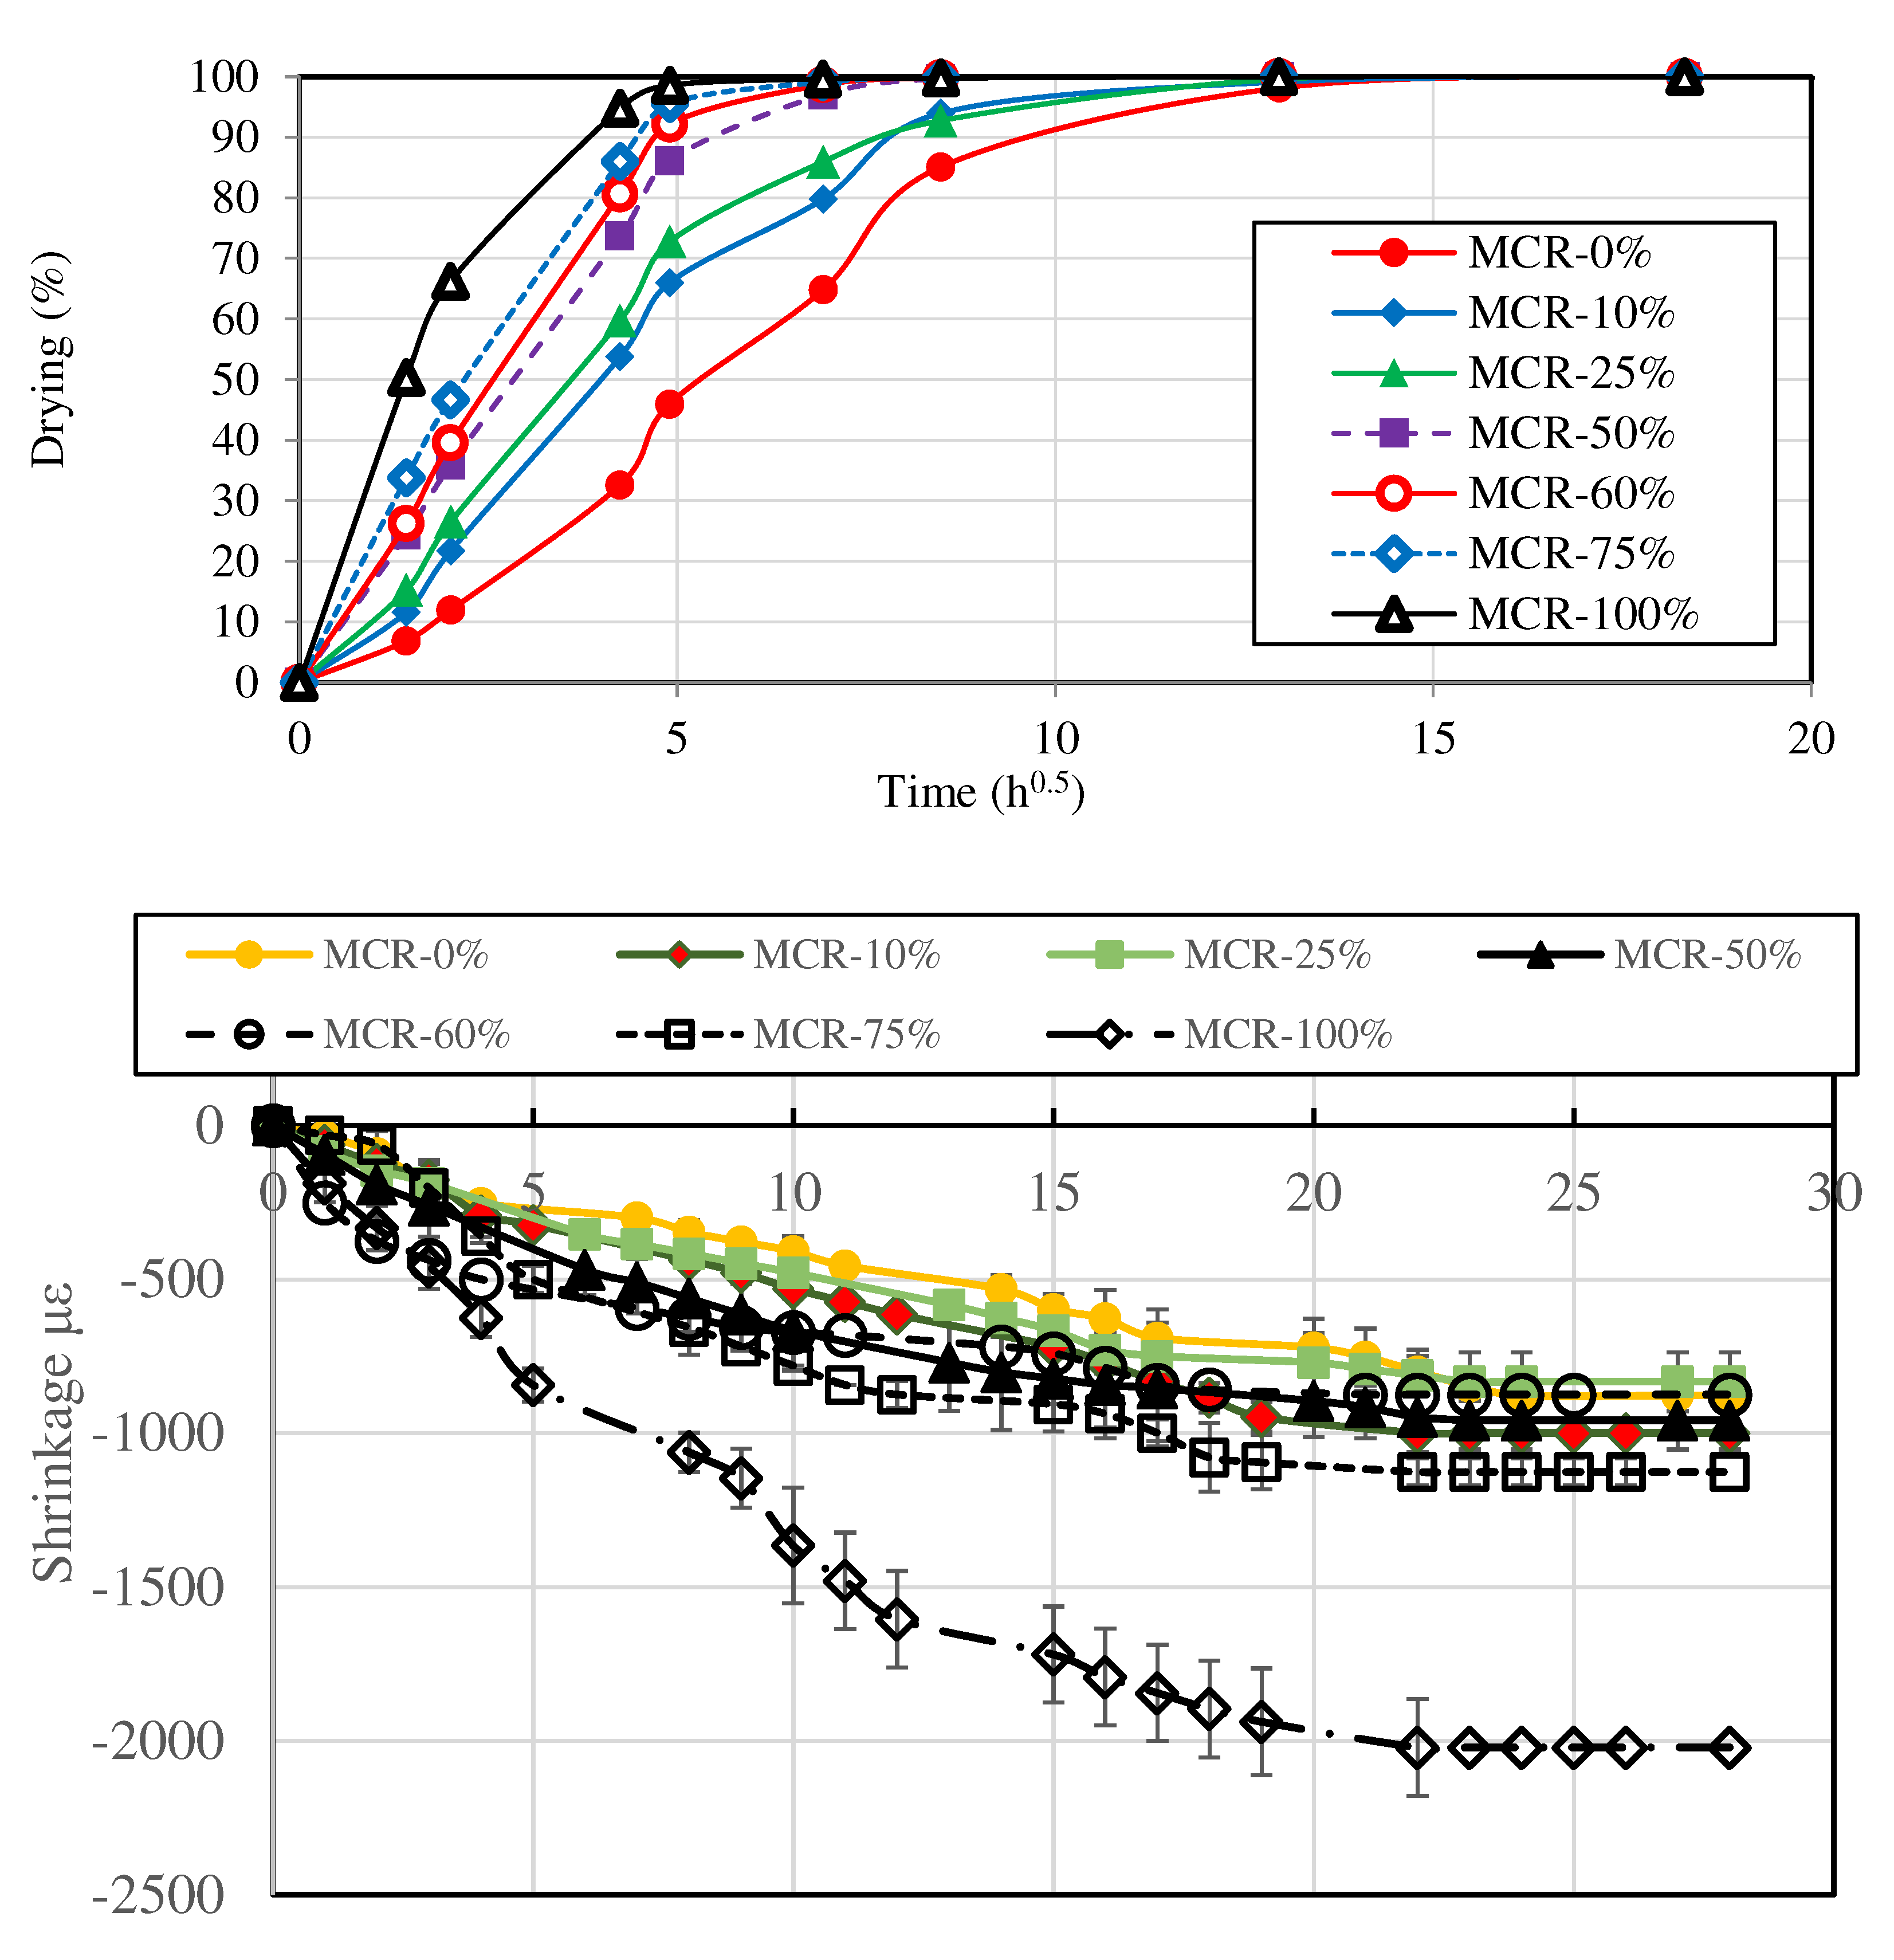
- Drying /Shrinkage
- d.
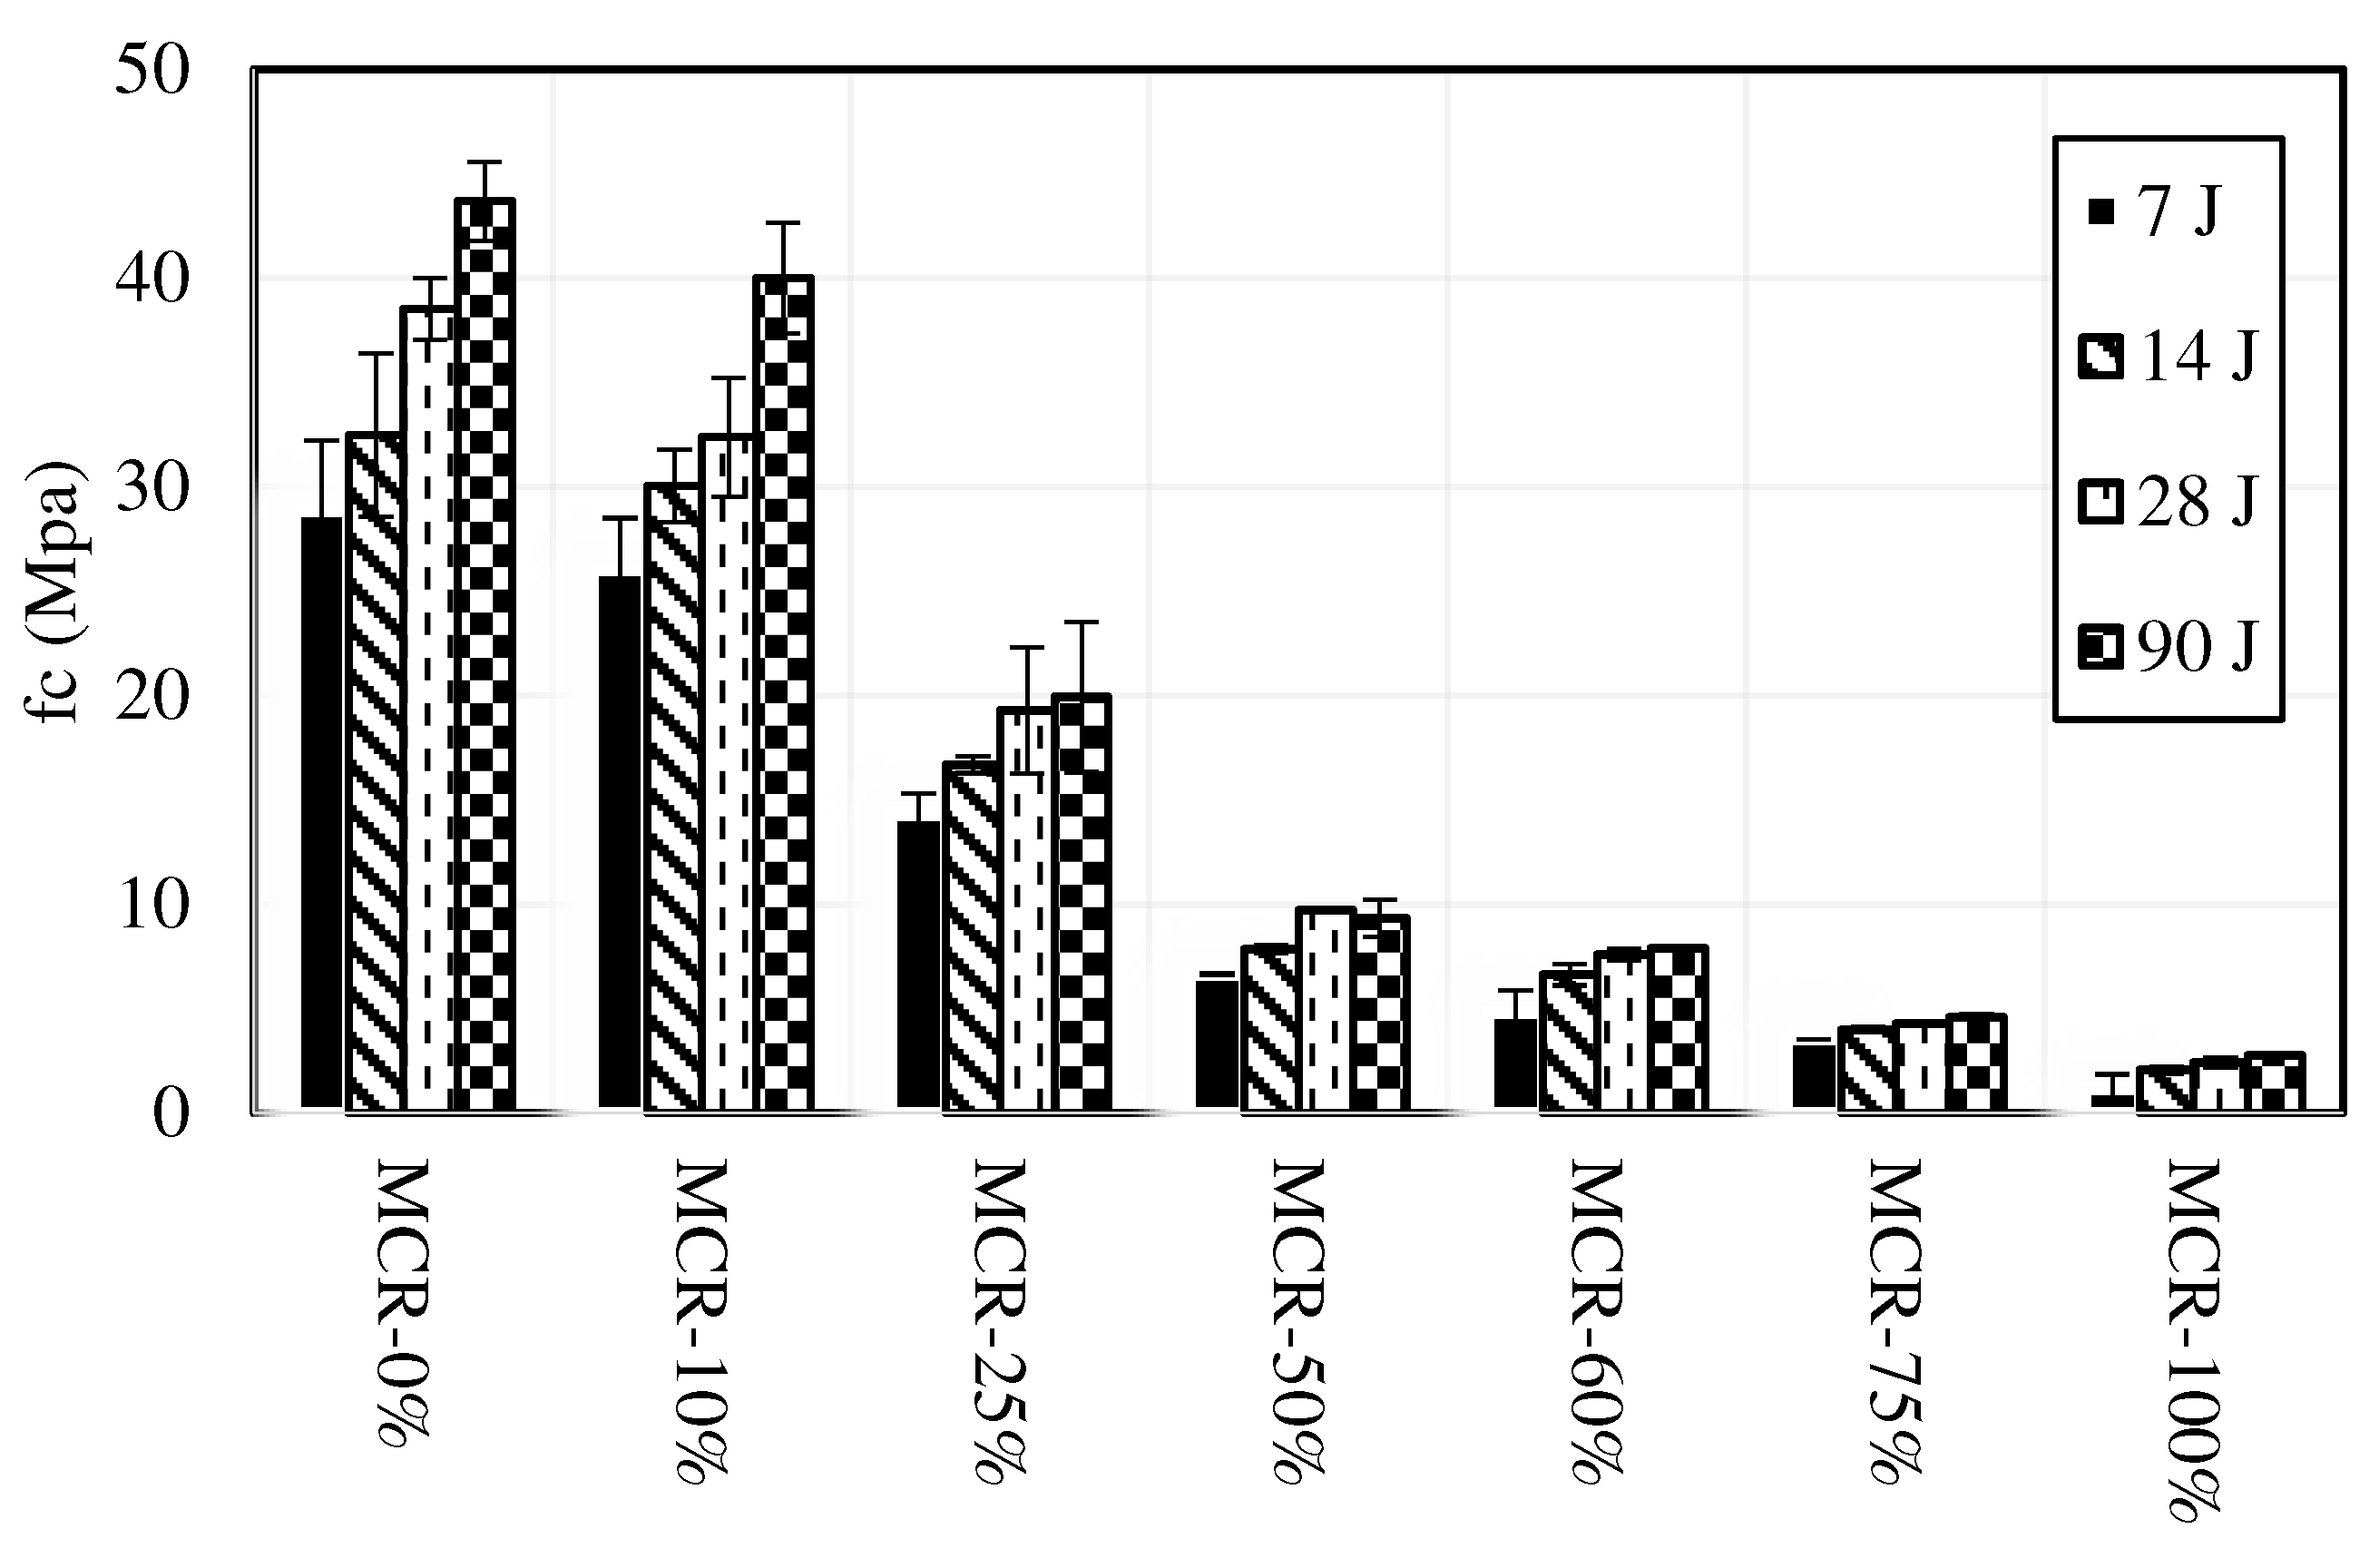
- Compressive strength
- e.
- Flexure/Tensile strength
- f.
- Fracture energy
- g.
- Elastic modulus

3.3. Pull out
3.4. Fire resistance of cured mortars
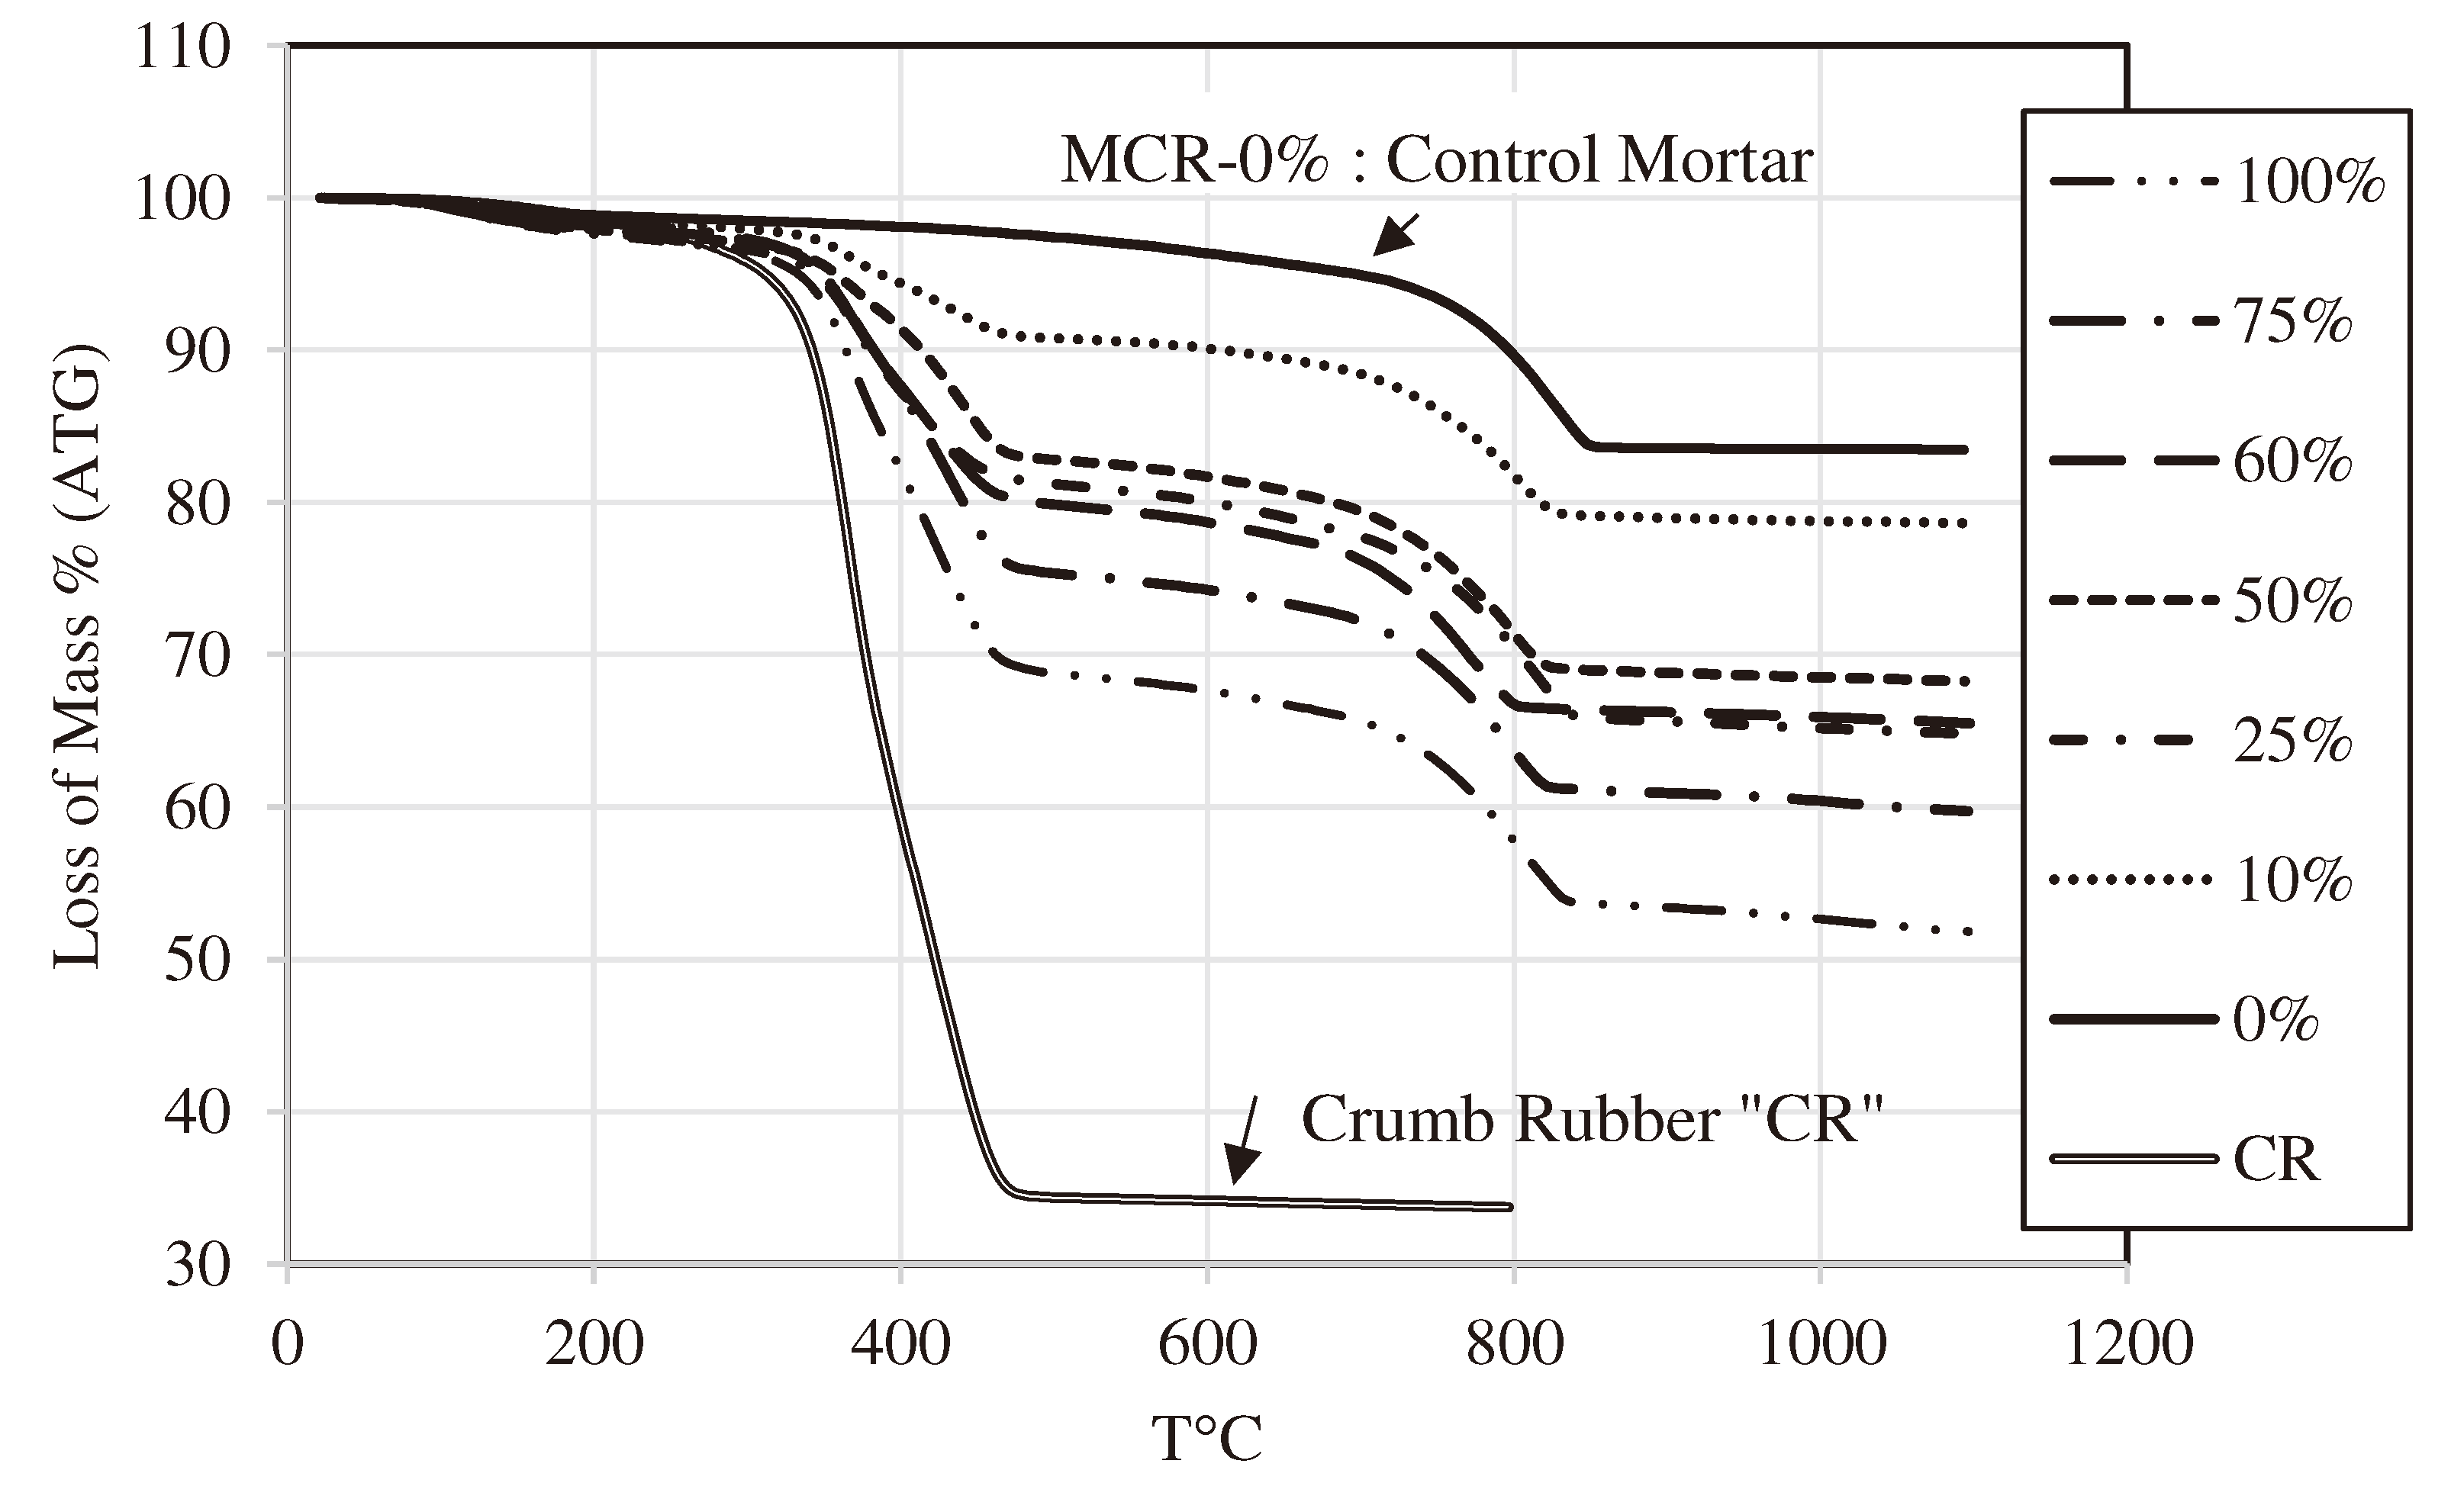
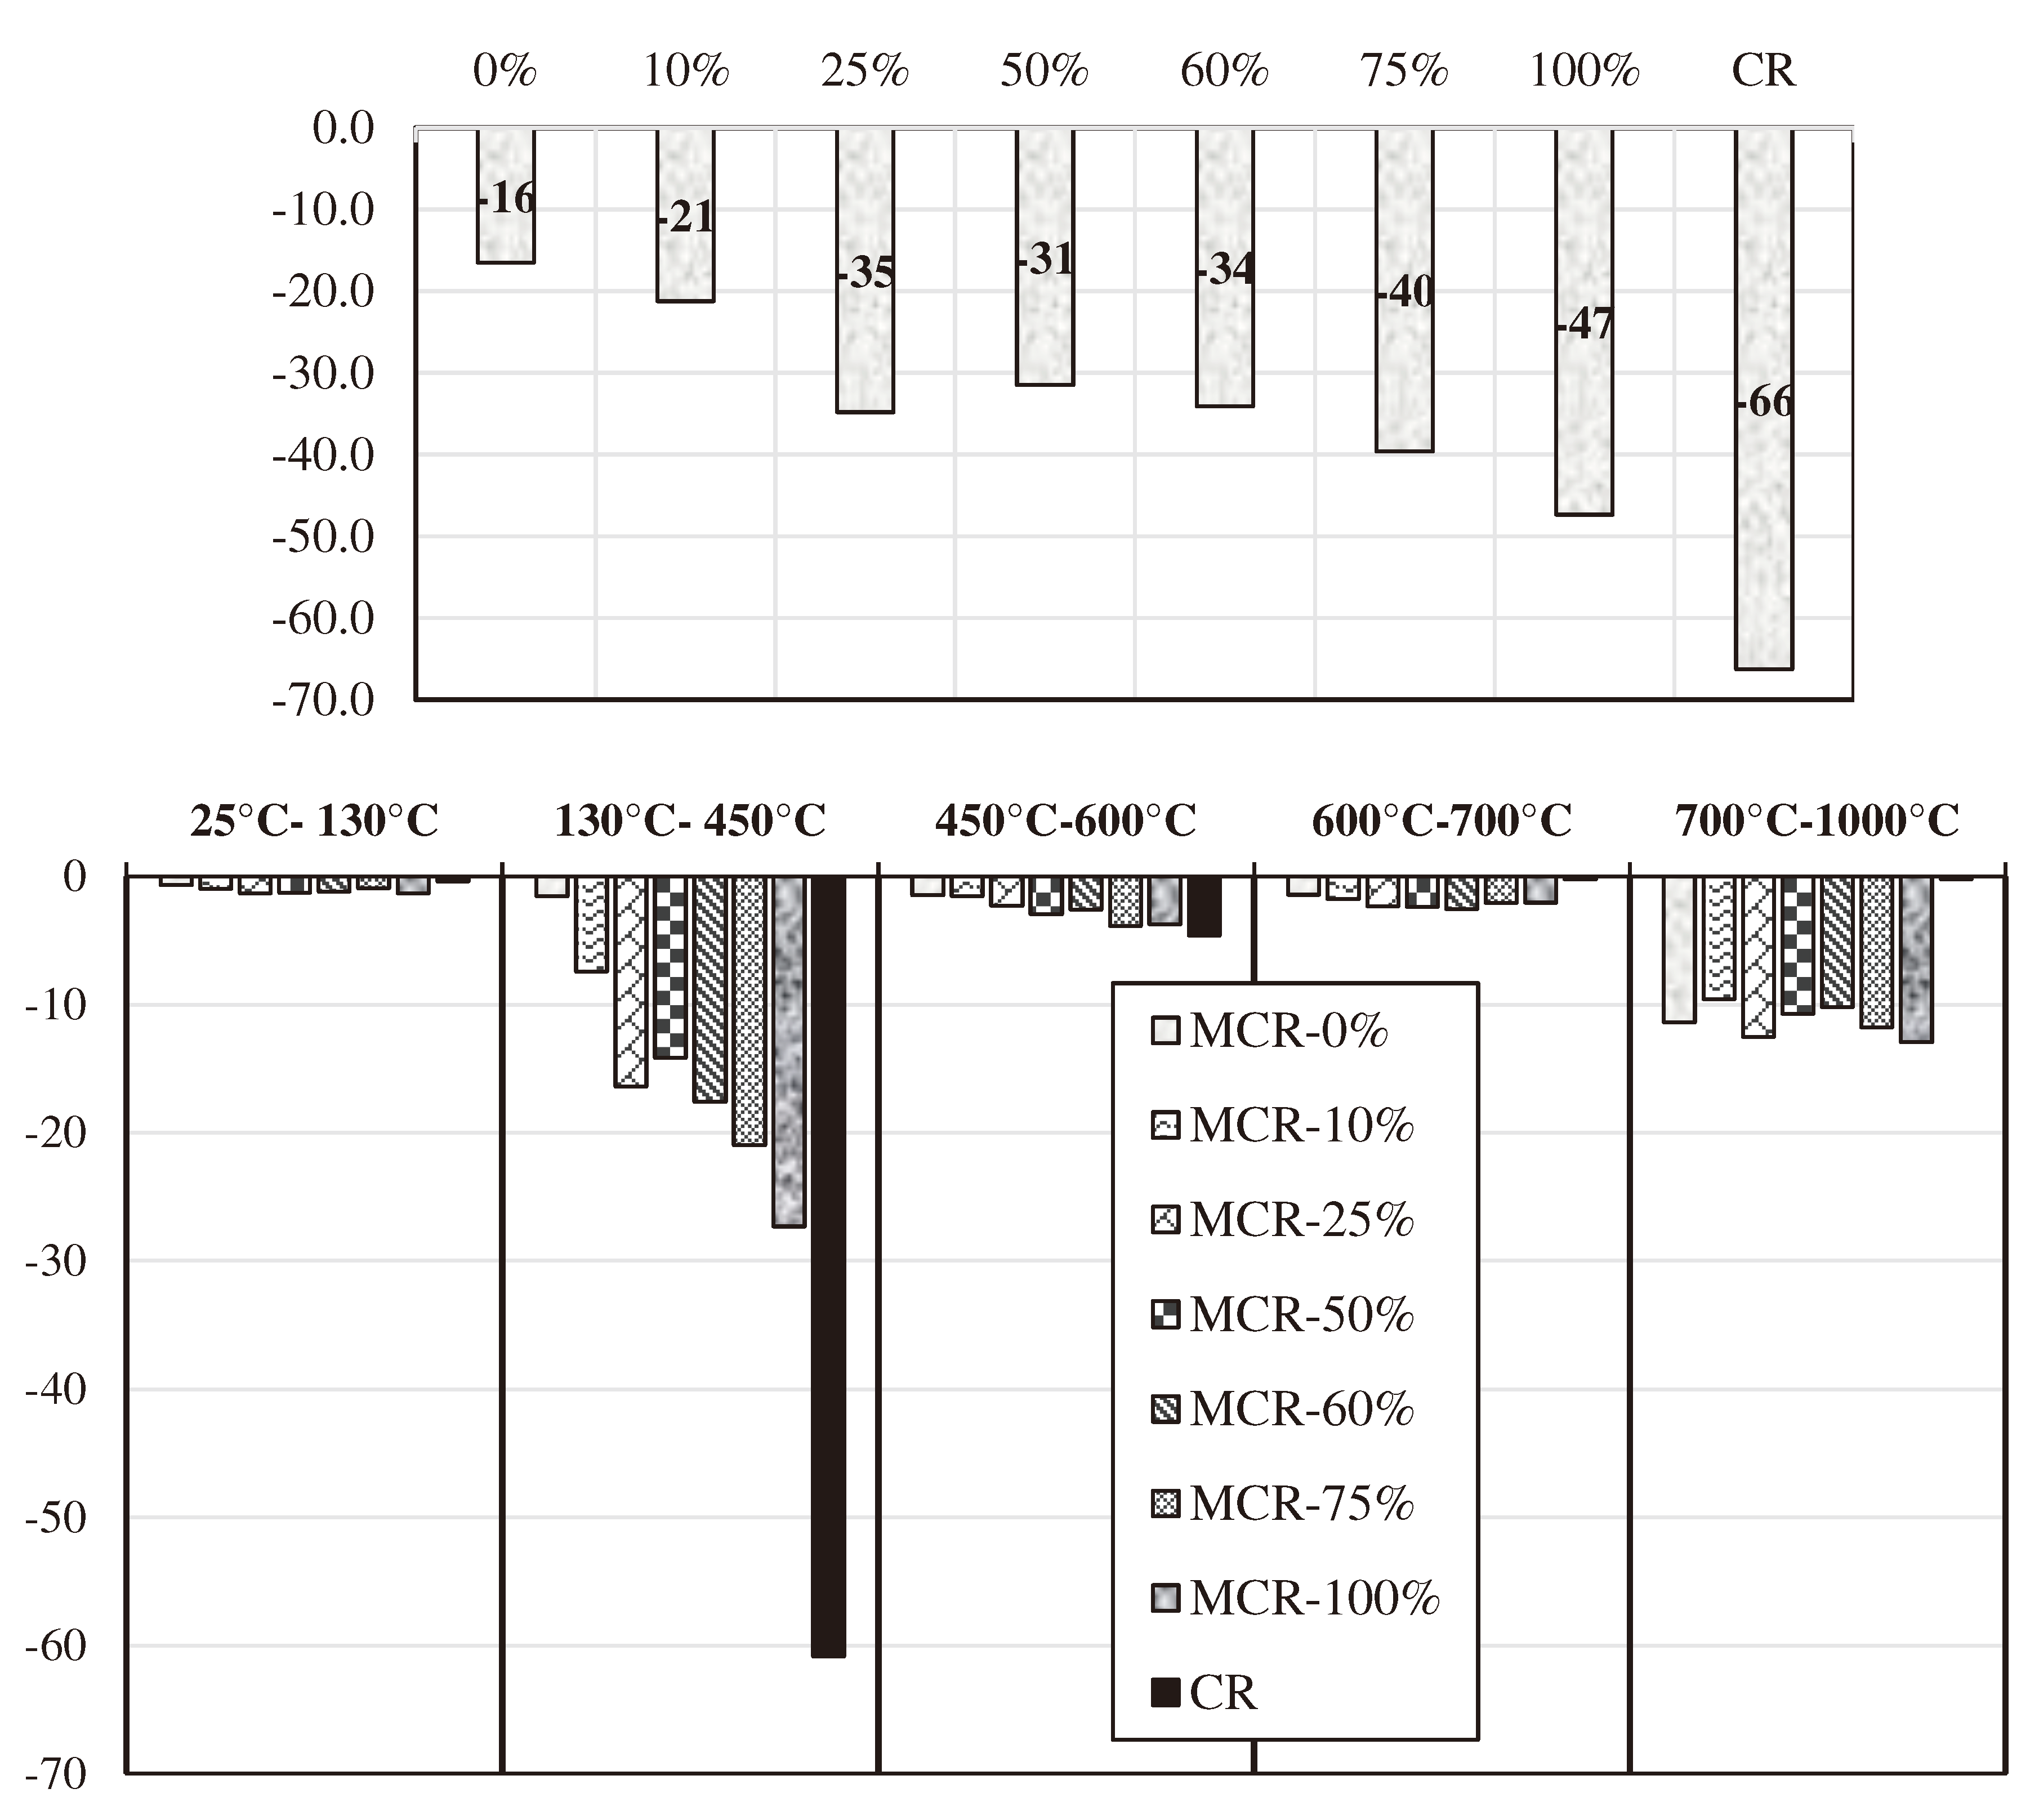
- Between room temperature and 150 °C, the variation of mass is essentially due to the release of volatiles (water and organic compounds).
- Between 450°C and 600°C the mass loss is mainly attributed to the decomposition of the portlandite ( ) and the end of the decomposition of the crumb rubber particles.
- Between 600°C and 700°C the mass loss is due to the dehydration of the CSH gel.
- Beyond 700°C to 1000°C, the loss of mass is attributed to the decomposition of calcite ( and the end of CSH decomposition.
4. Conclusions
- Crumb rubbers obtained from EOL tires can be used with confidence as aggregates in mortars. Leaching tests revealed low levels of leached pollutants, confirming that CR particles can be considered safe for both health and the environment, particularly when embedded in a cementitious matrix.
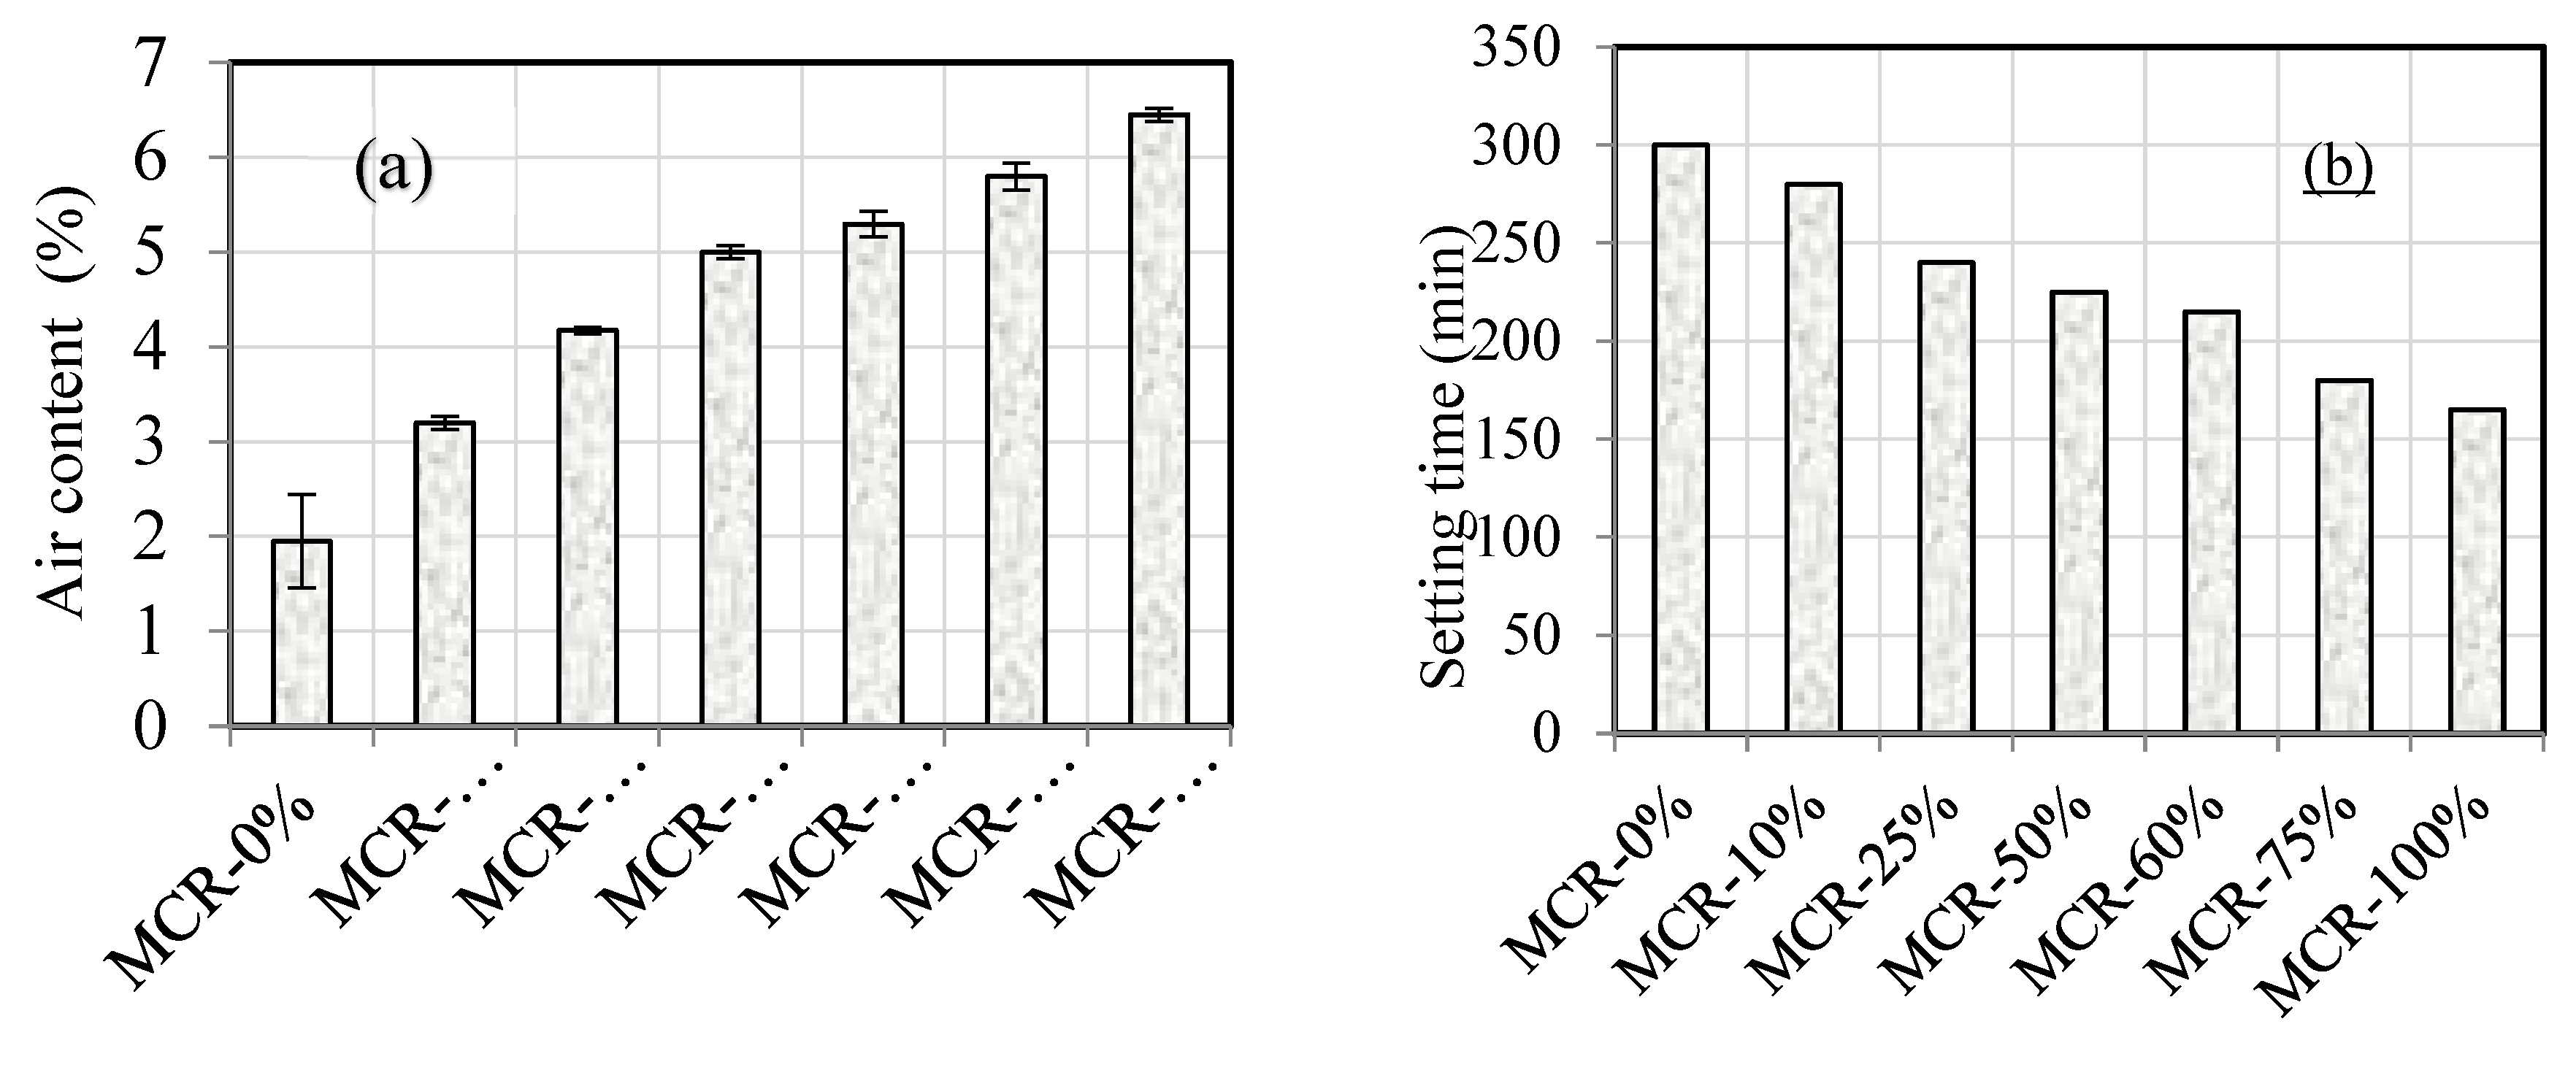
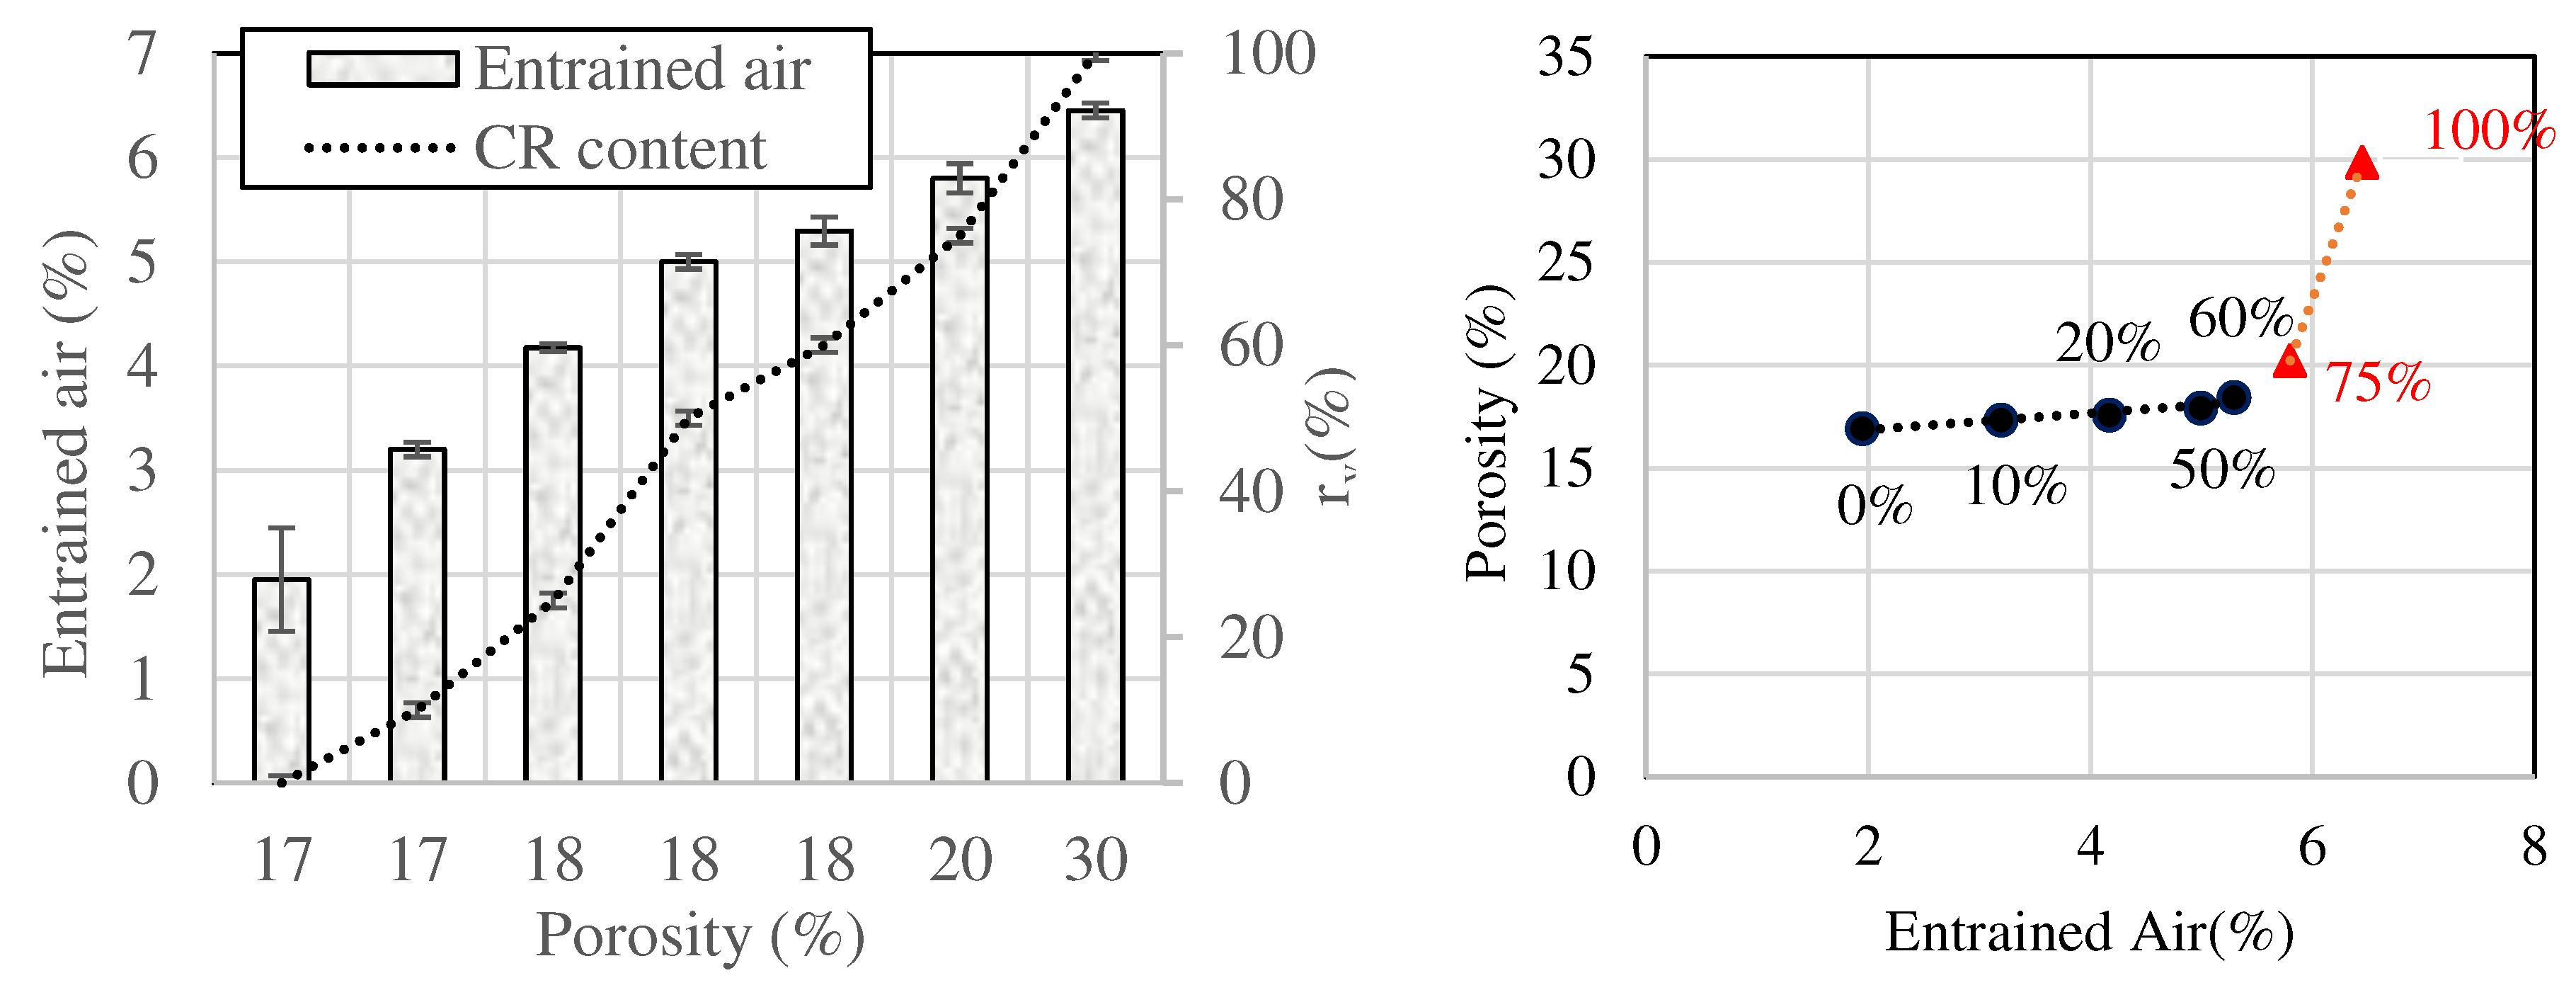
- The air content of early-age mortar paste increases linearly with the CR replacement ratio. Entrapped air bubbles have a significant effect on the hardened behavior since they can concentrate stresses or facilitate the infiltration of damaging elements.
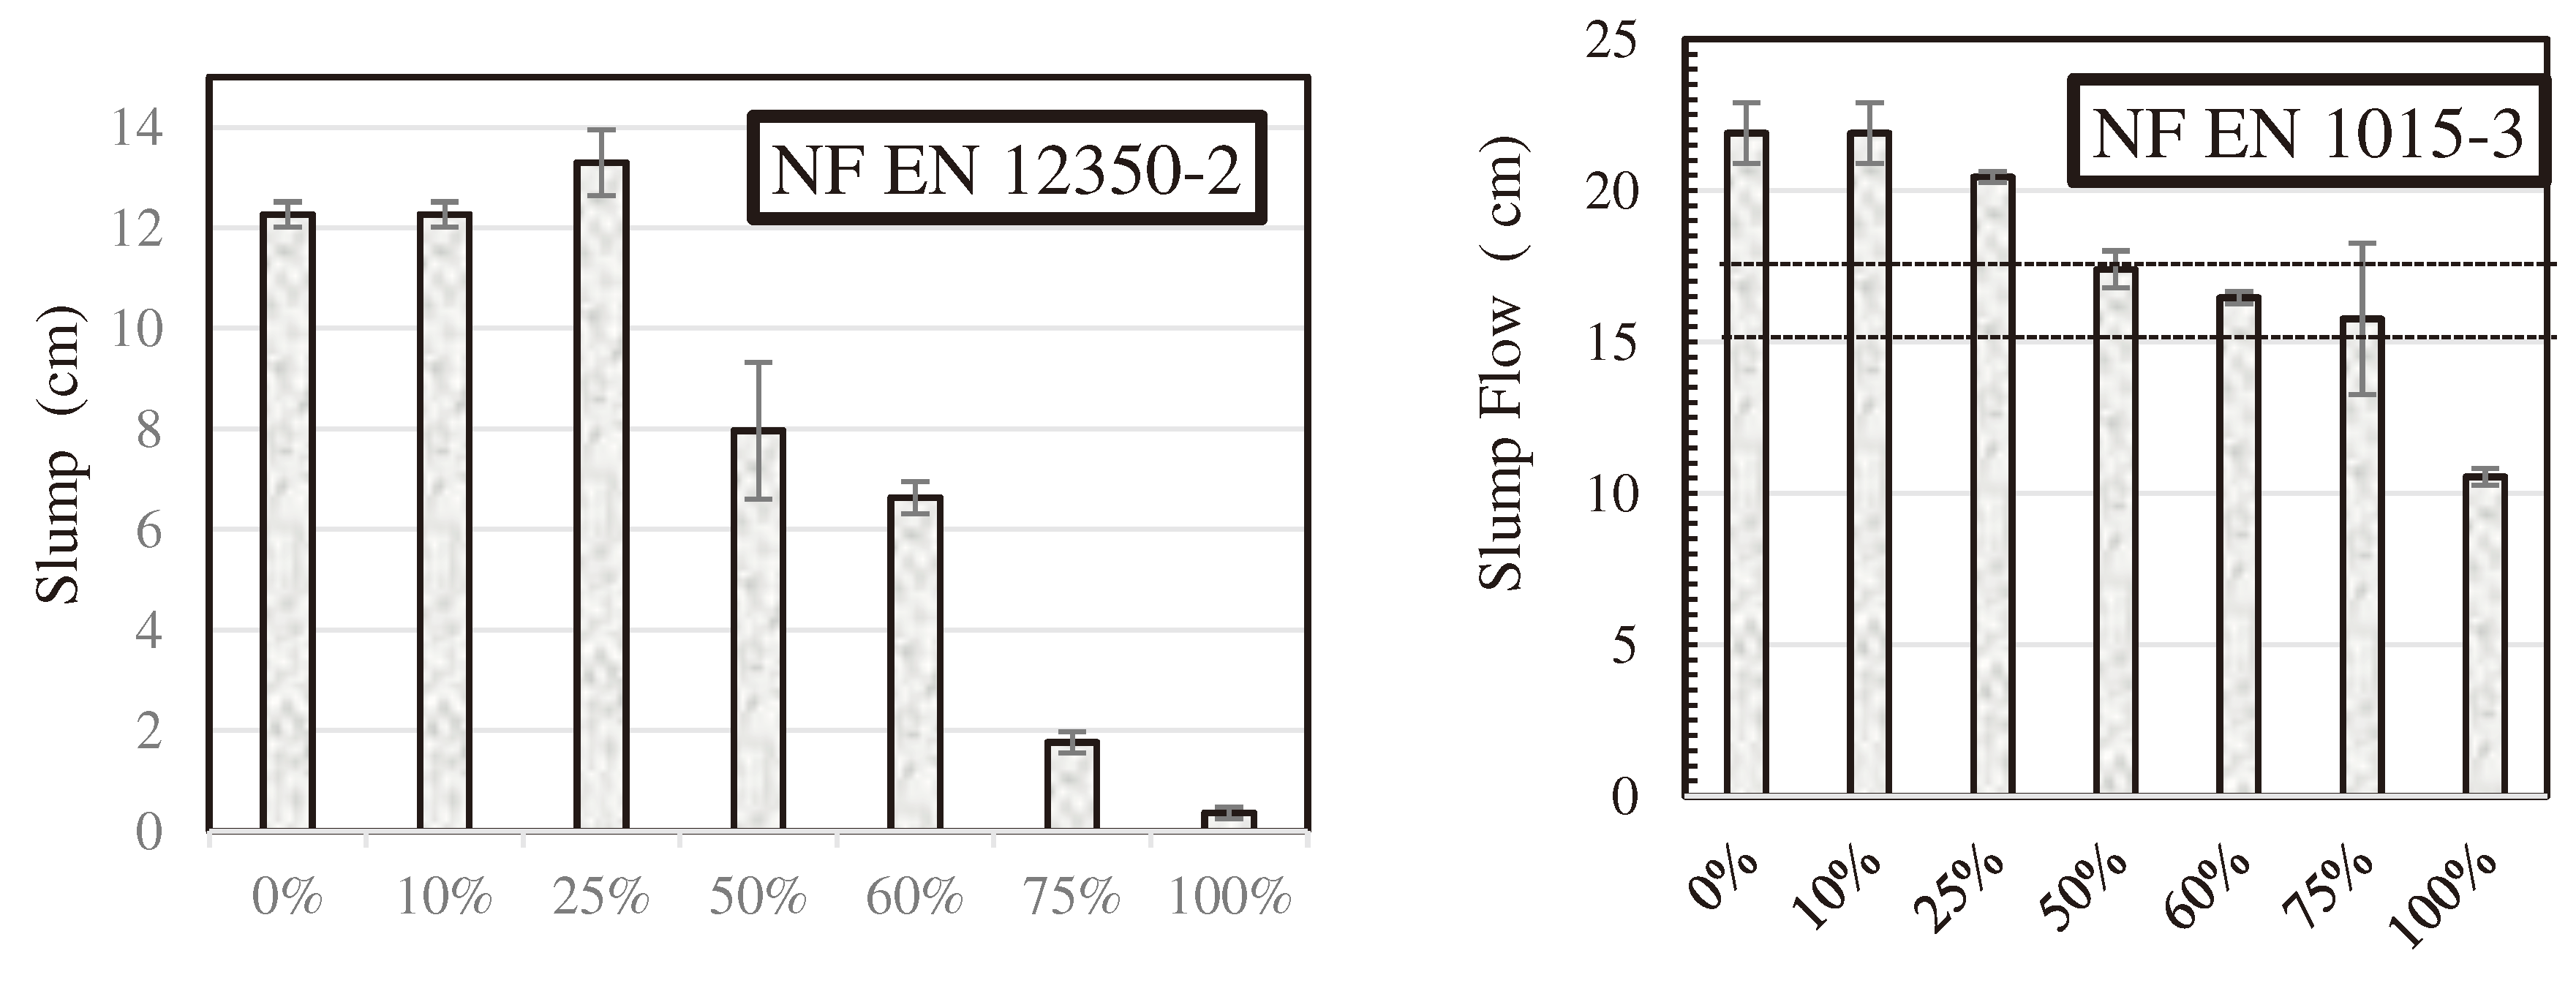
- The increase in the CR content reduces the setting time and the workability of mortars. However, mixes with can still be used for repair work as they meet recommended standards.
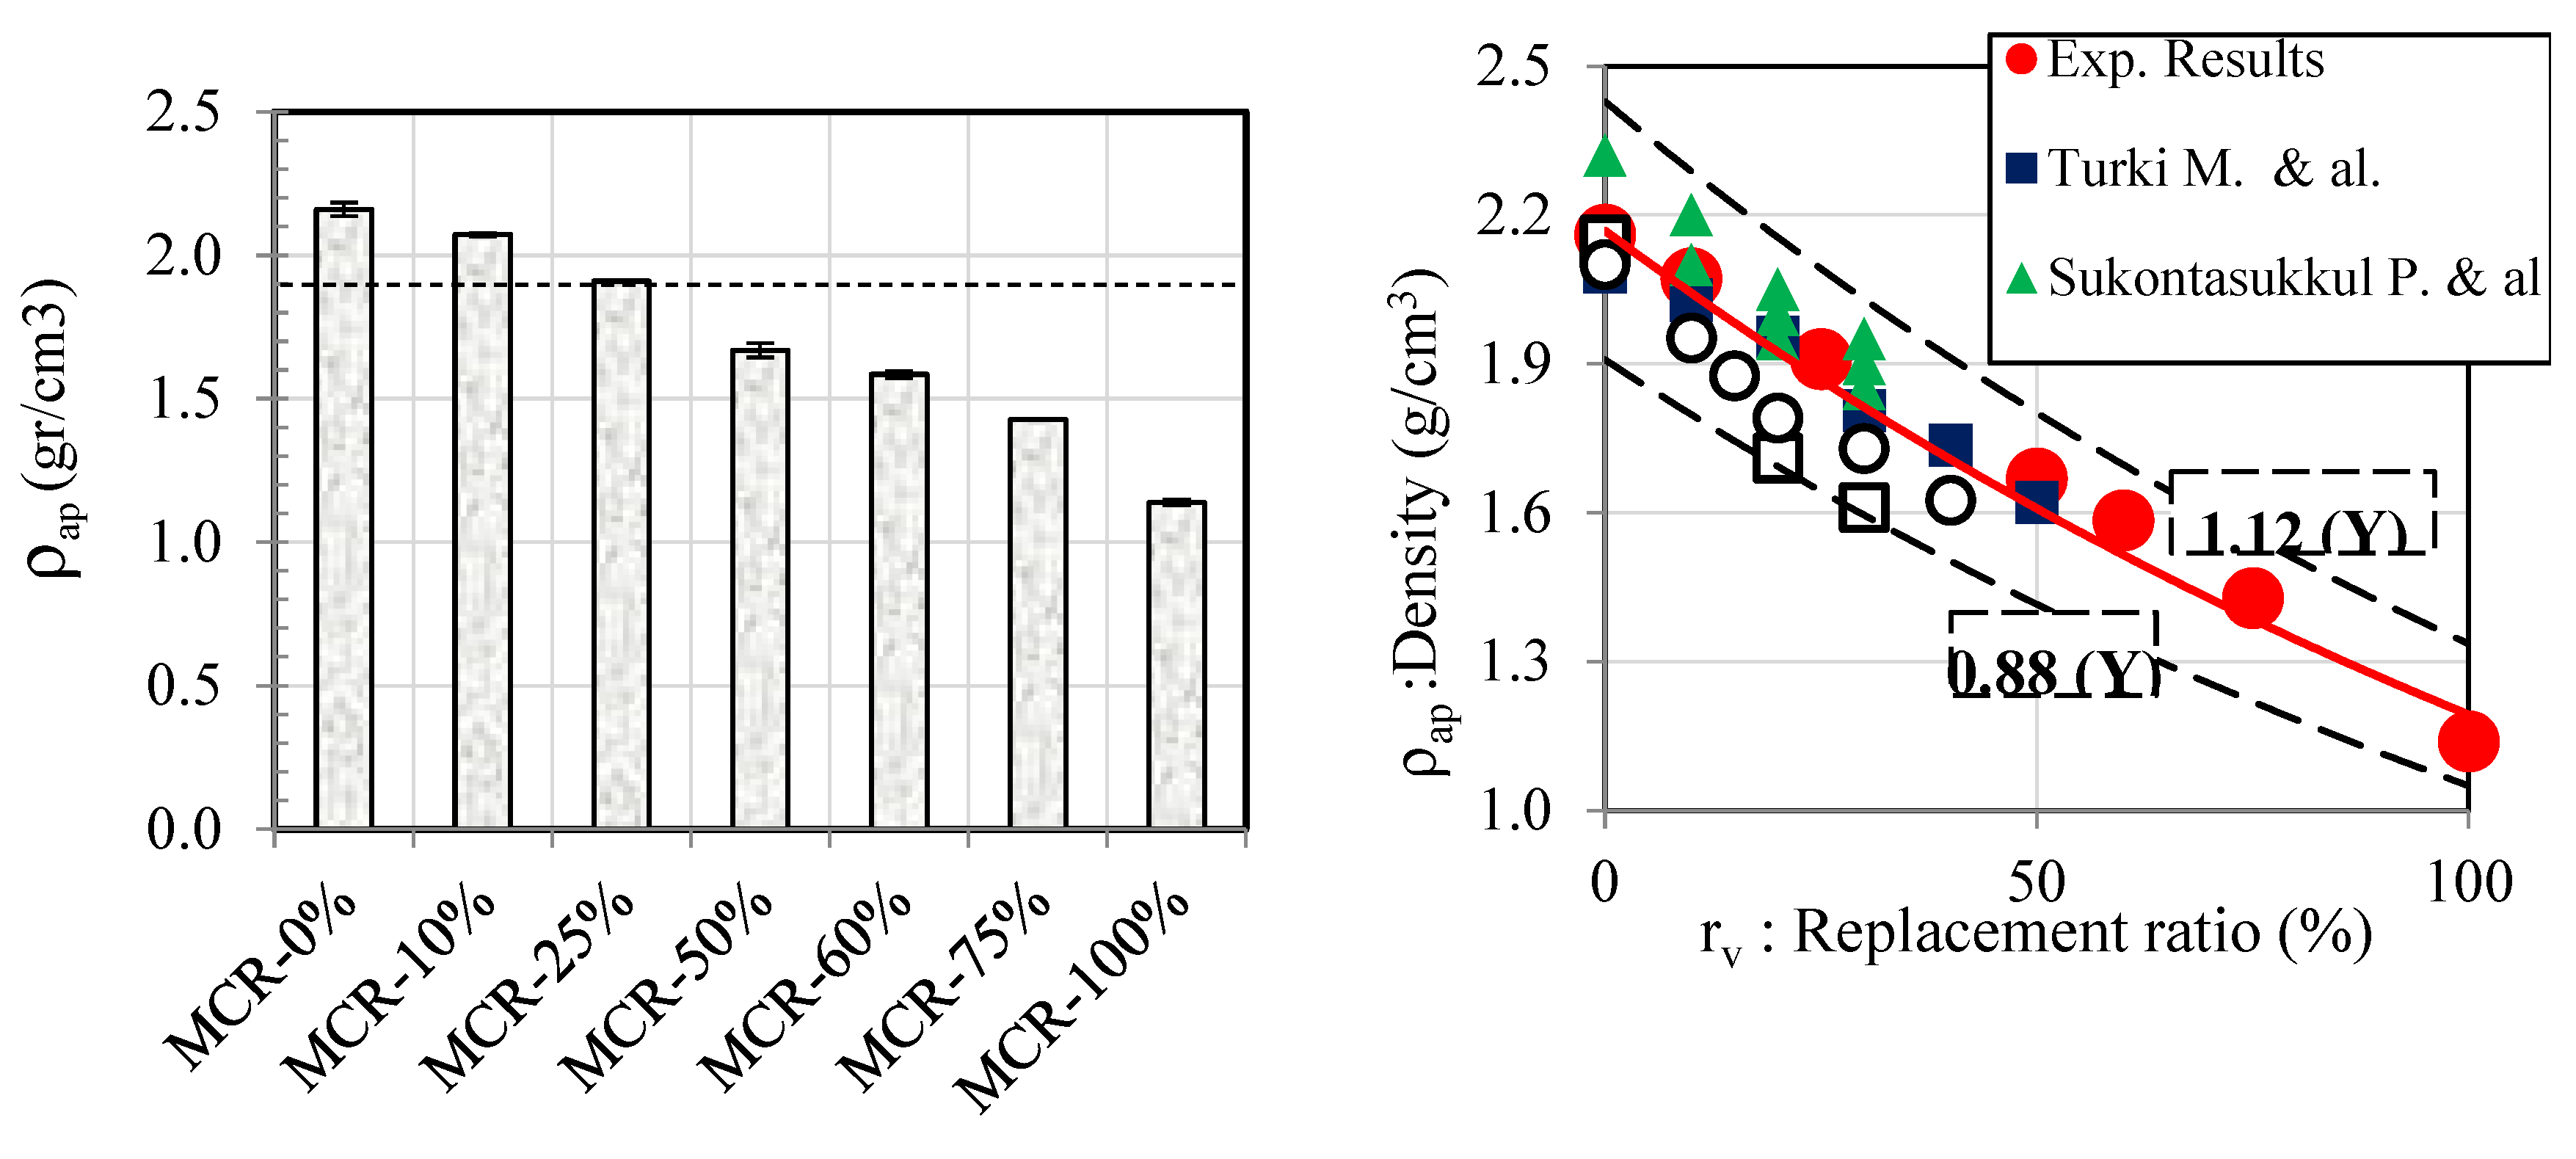
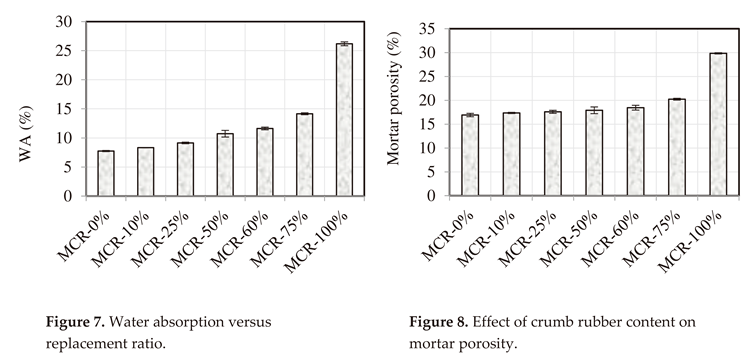
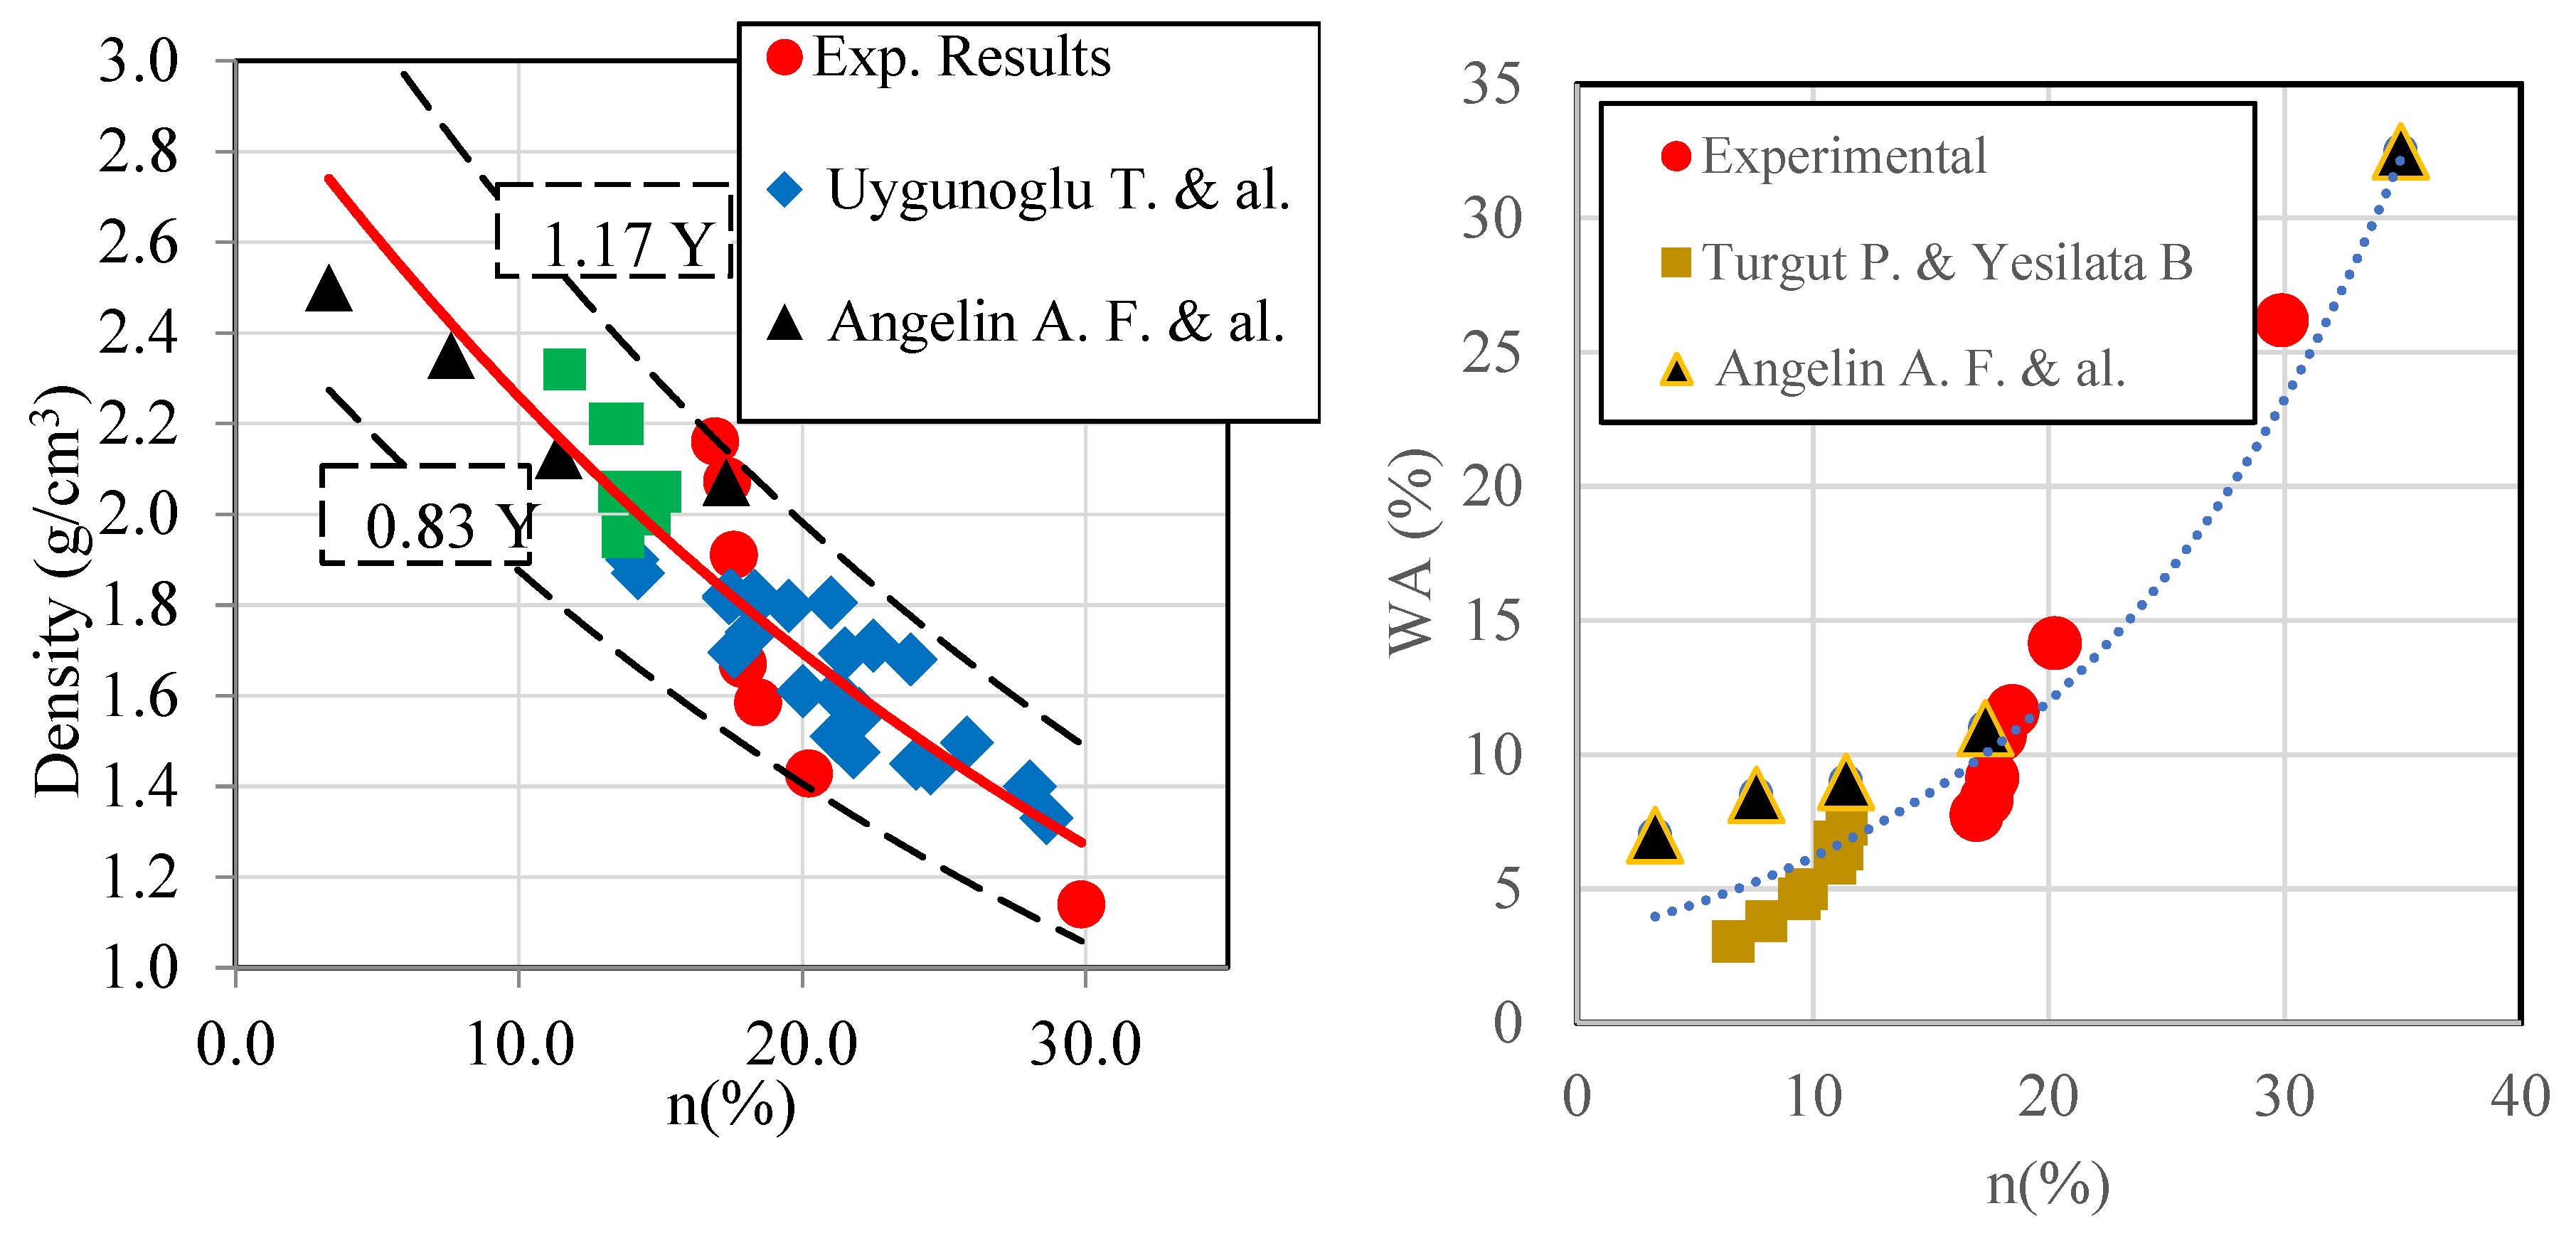
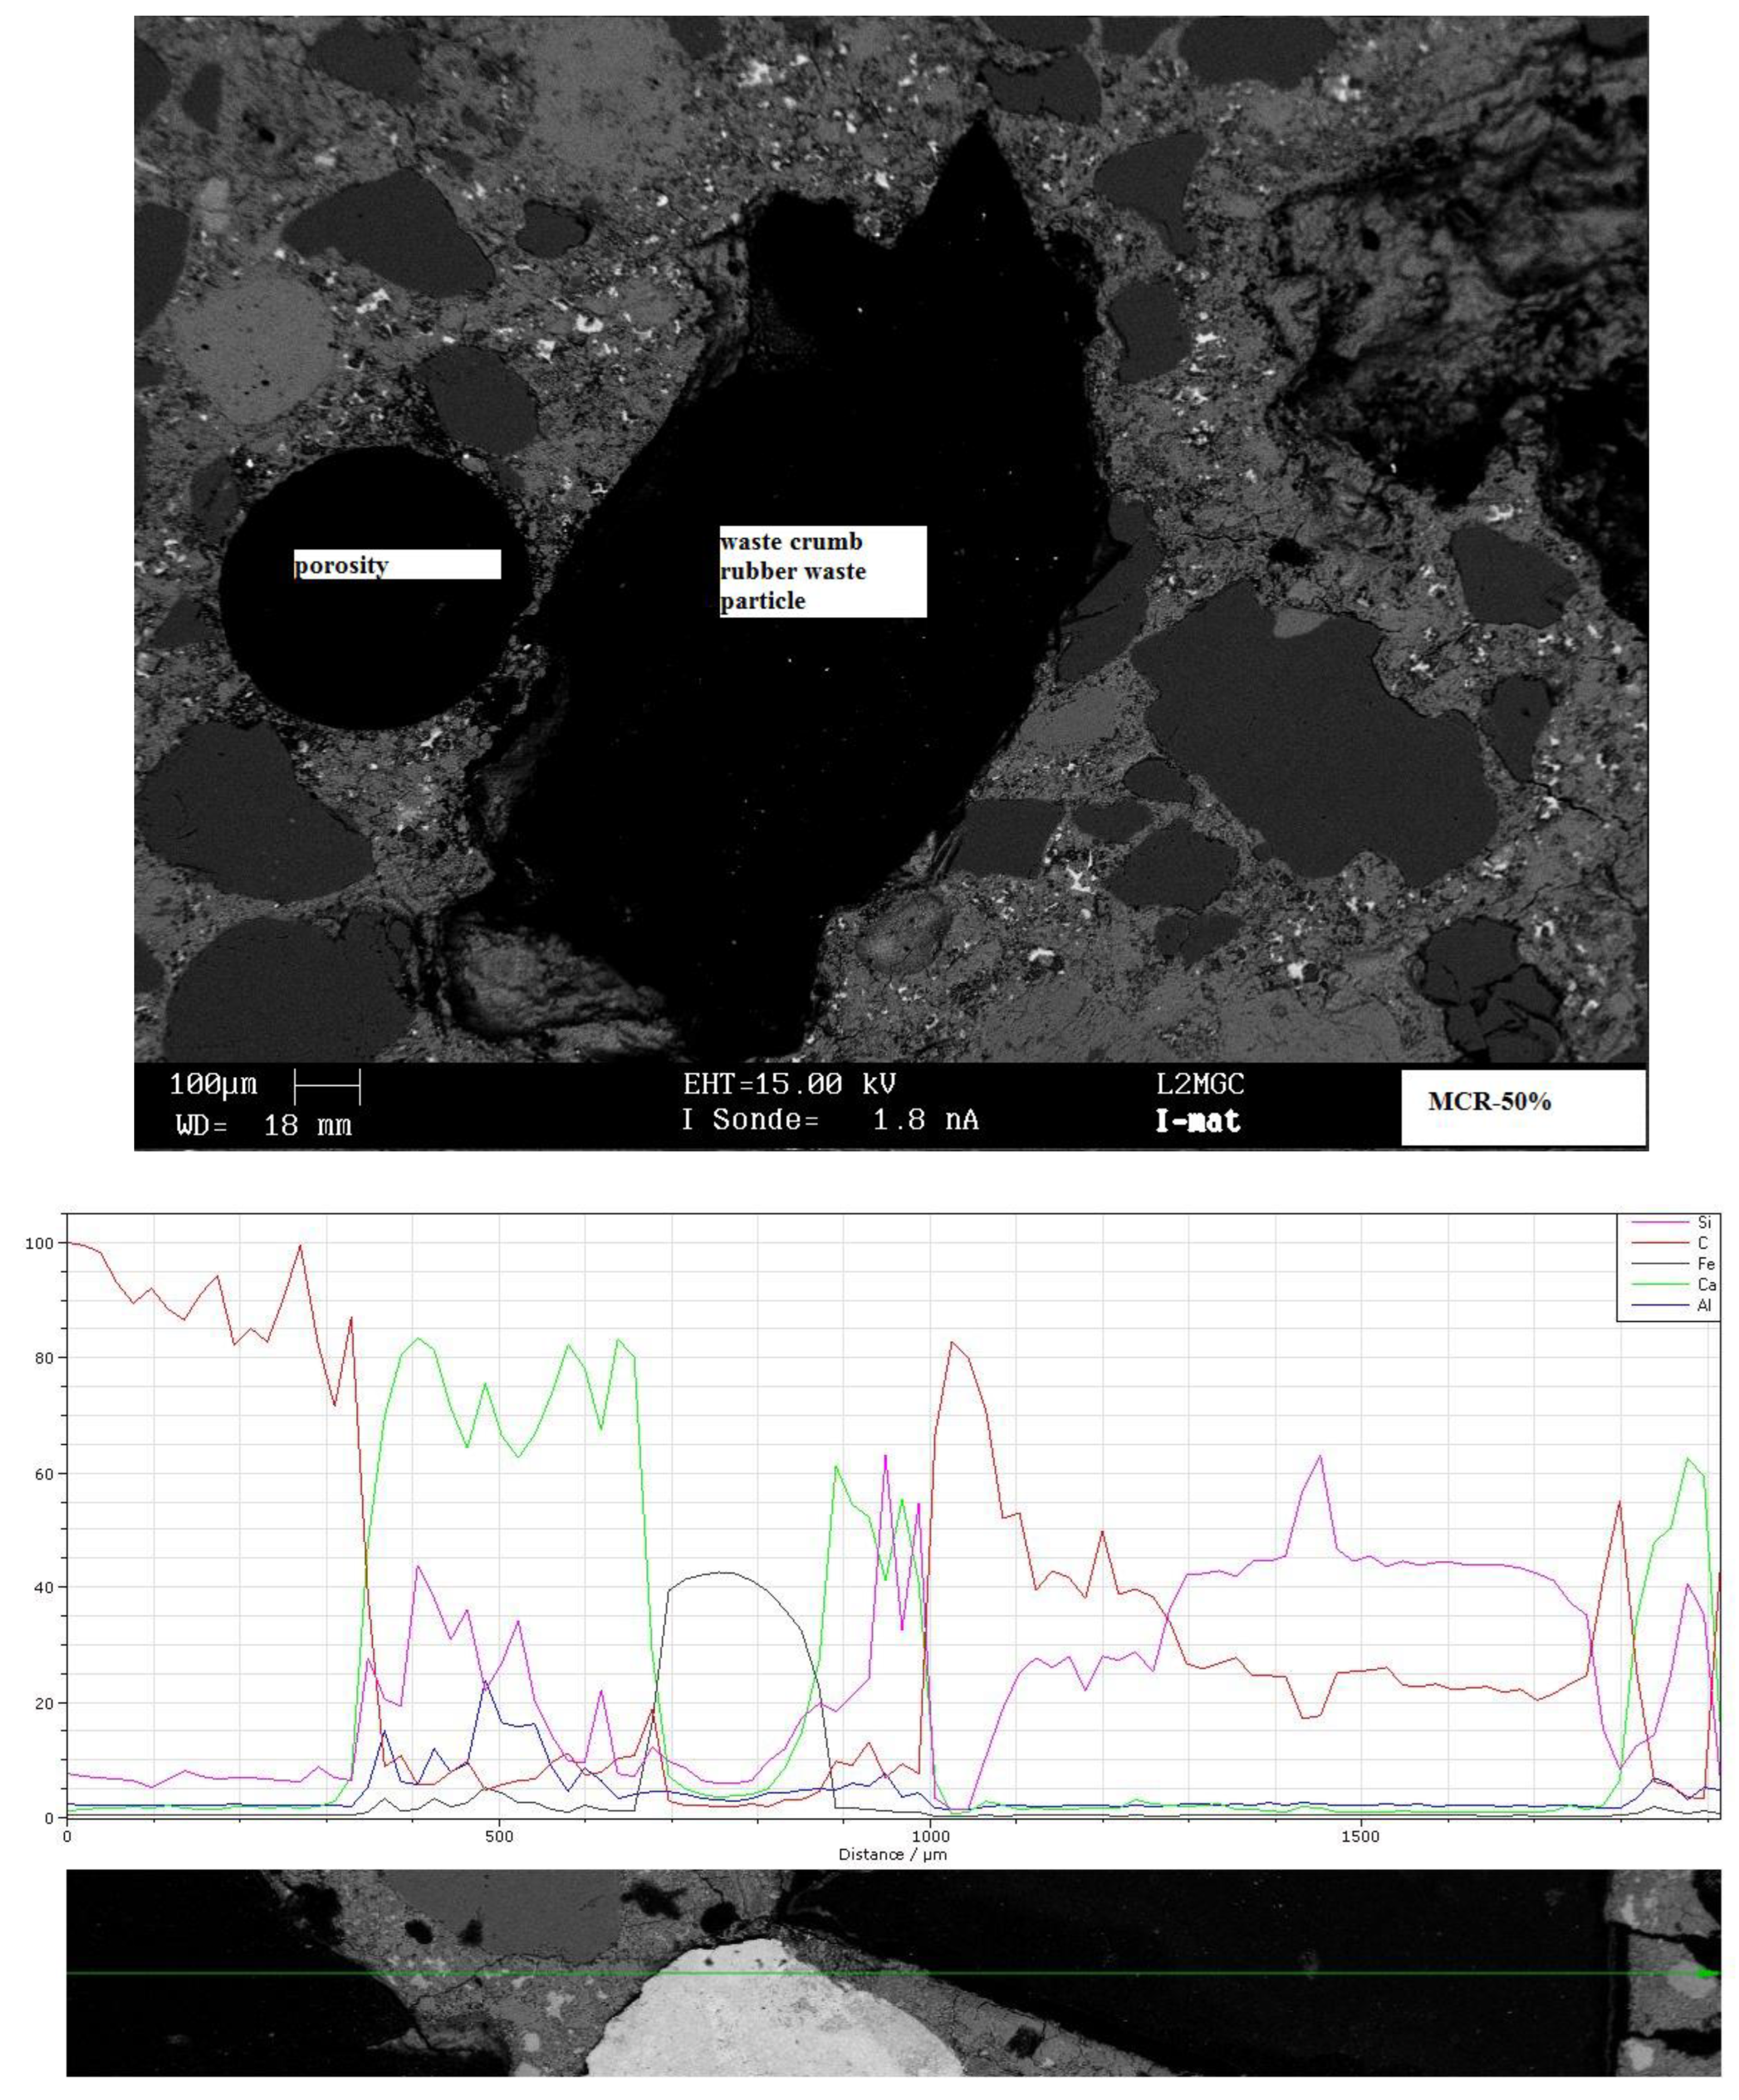
- The apparent density decreases as the CR fraction increases. According to standards, mortars with are classified as lightweight mortars. Moreover, an increase in porosity, mainly attributed to the higher occluded air content associated with higher CR rates, is observed particularly for .
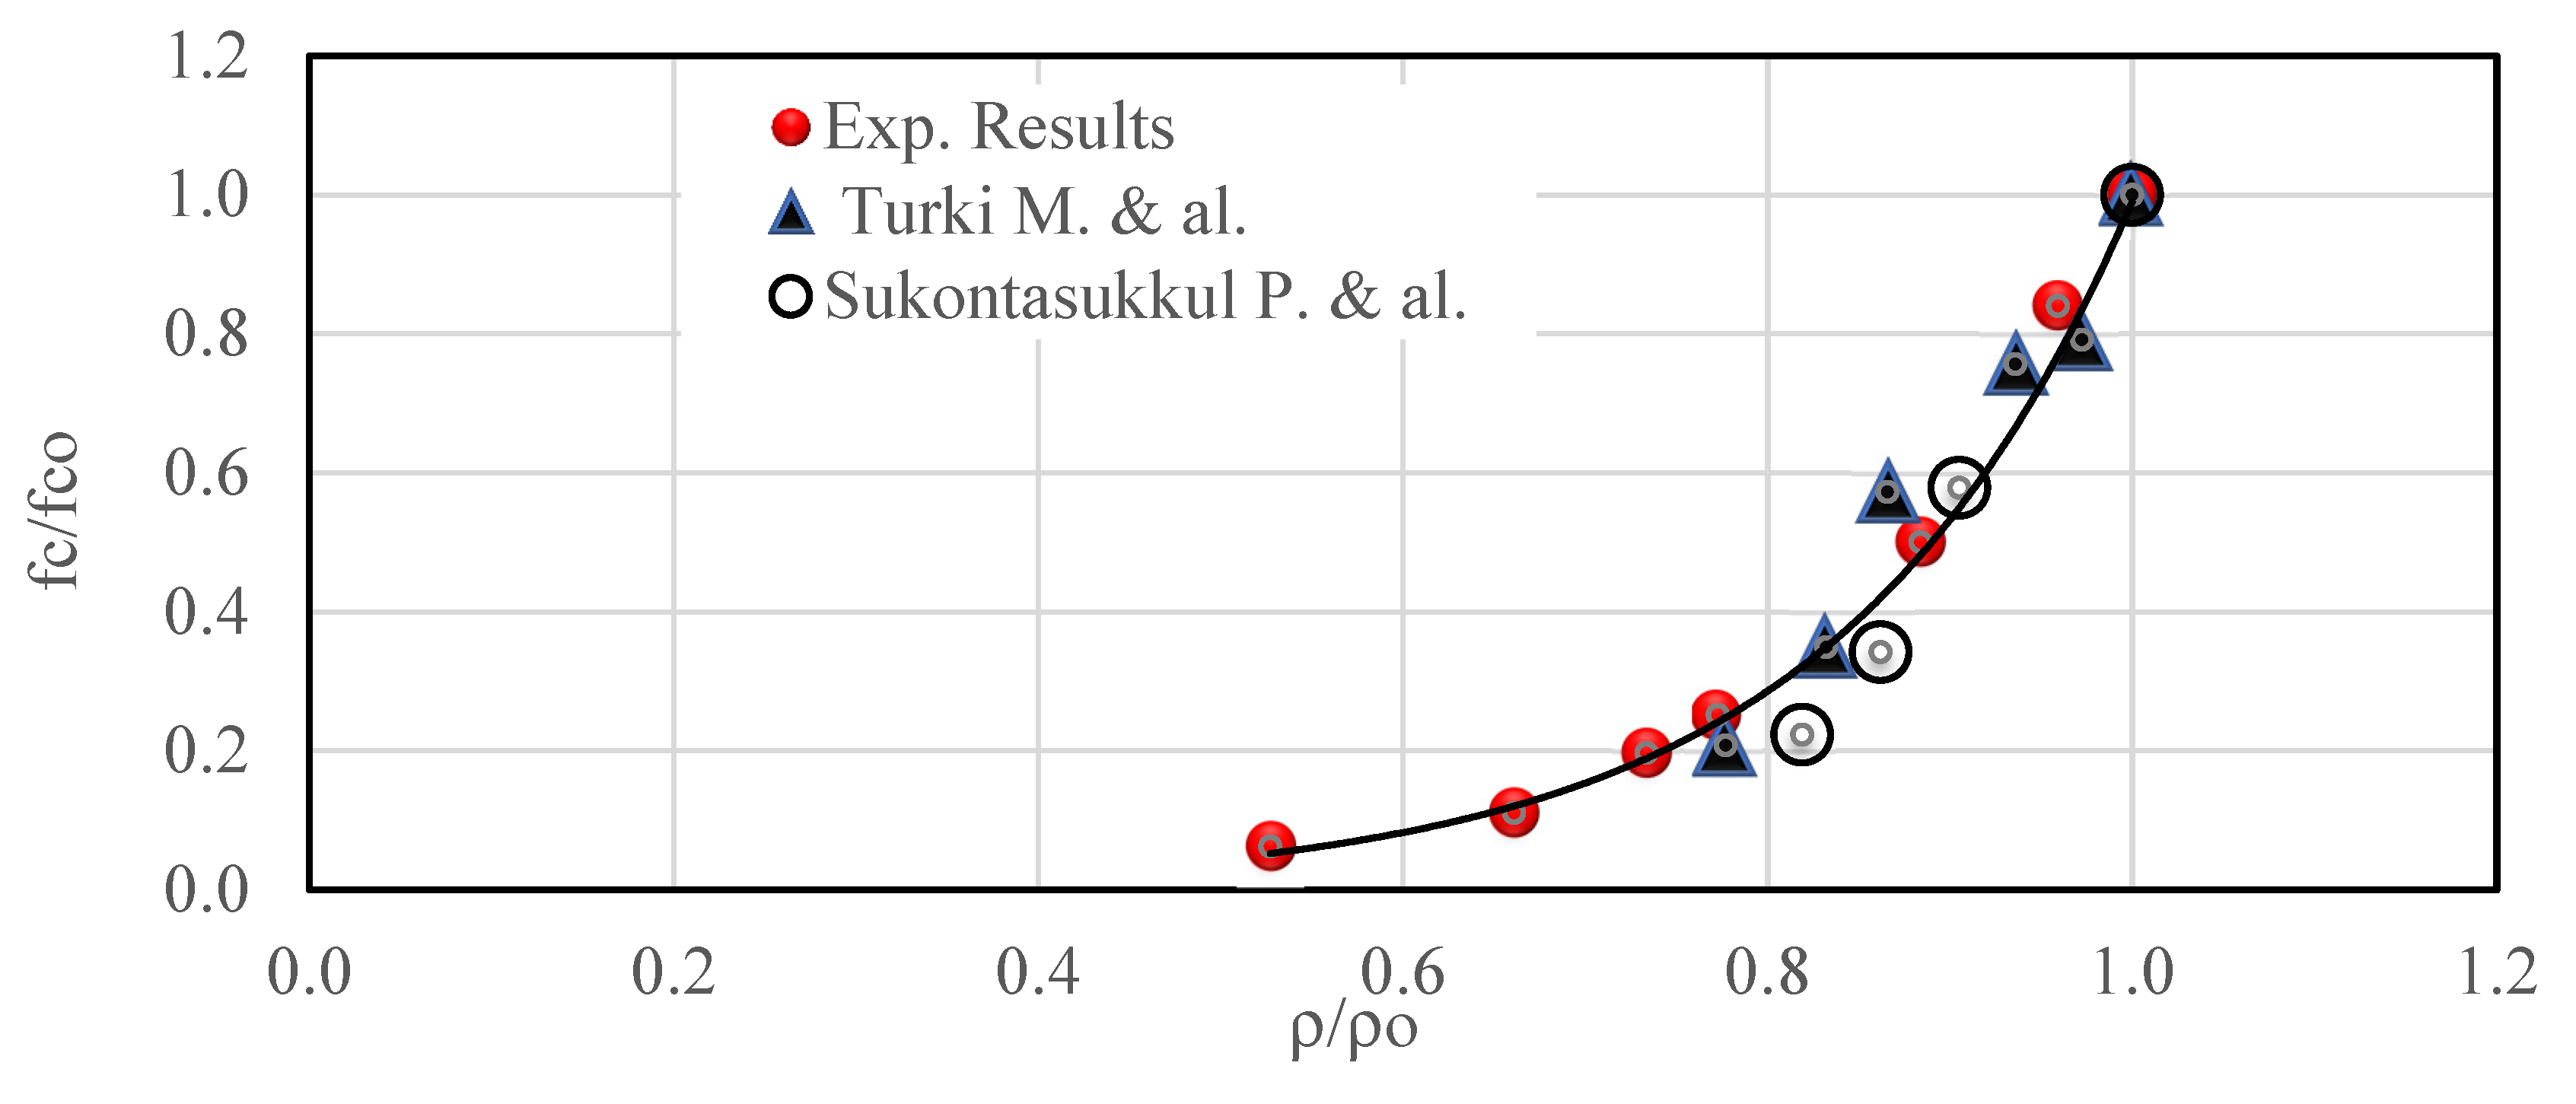
- Since the number and volume of pore spaces and the surface area of cement-rubber interfaces vary with CR content, water absorption increases accordingly. In this study, it was established that both the normalized water absorption coefficient and the bulk density vary in the same way with the CR replacement ratio:
- Similarly, drying shrinkage increases with time and CR content due to the corresponding increase in number and volume of pore spaces and cement-rubber interfaces. However, it is established that this increase is more significant for mixes with
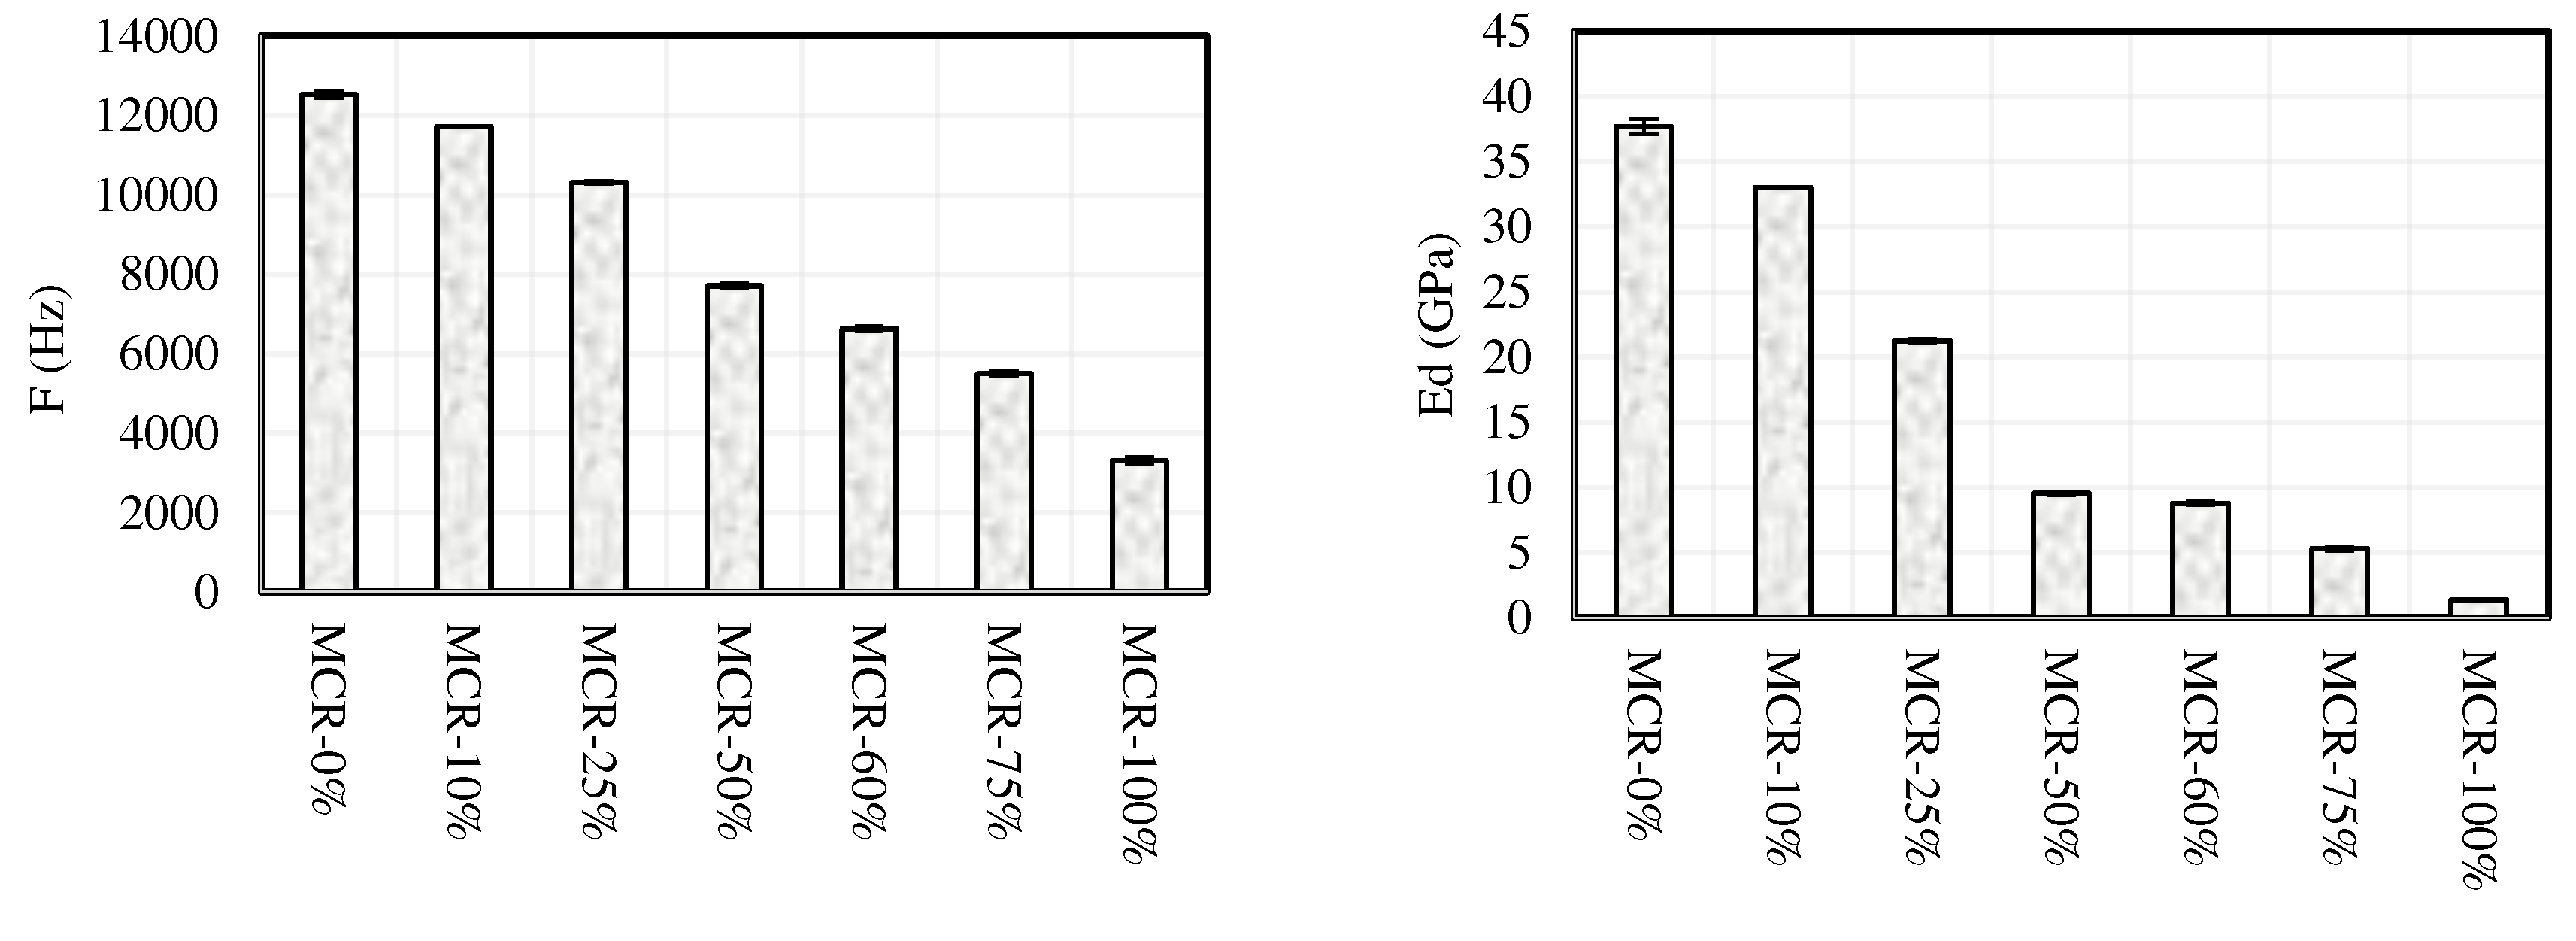
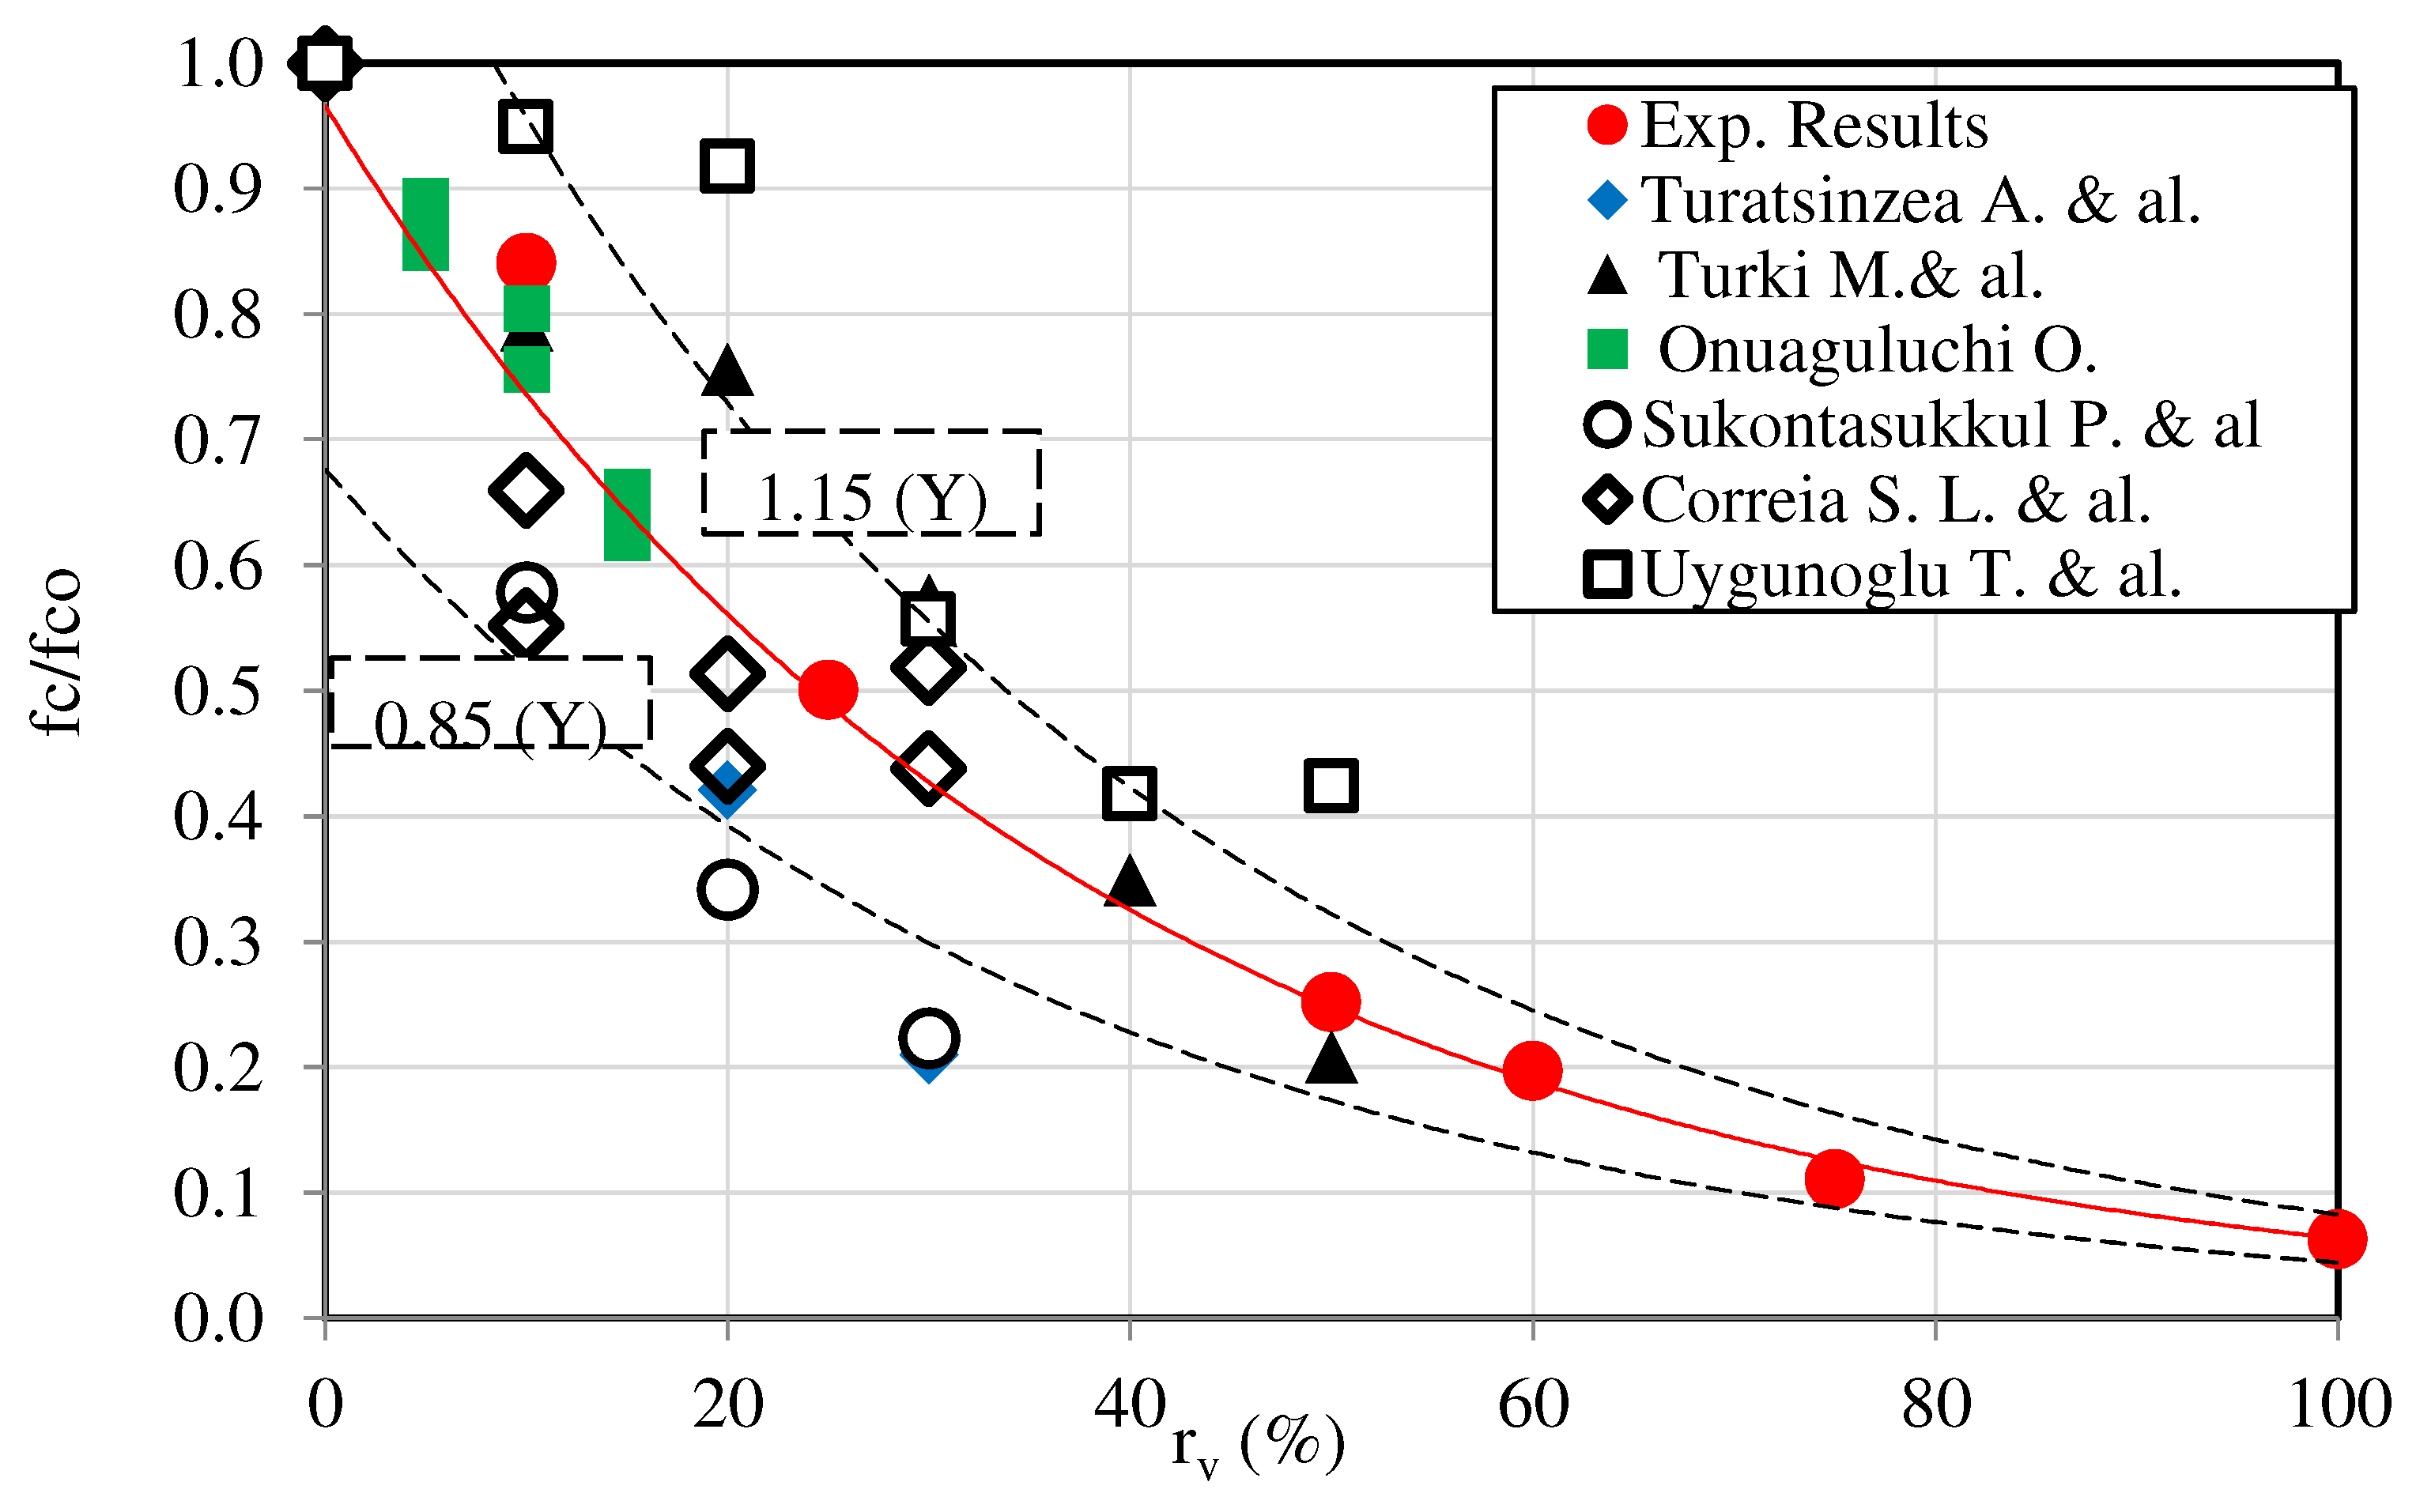
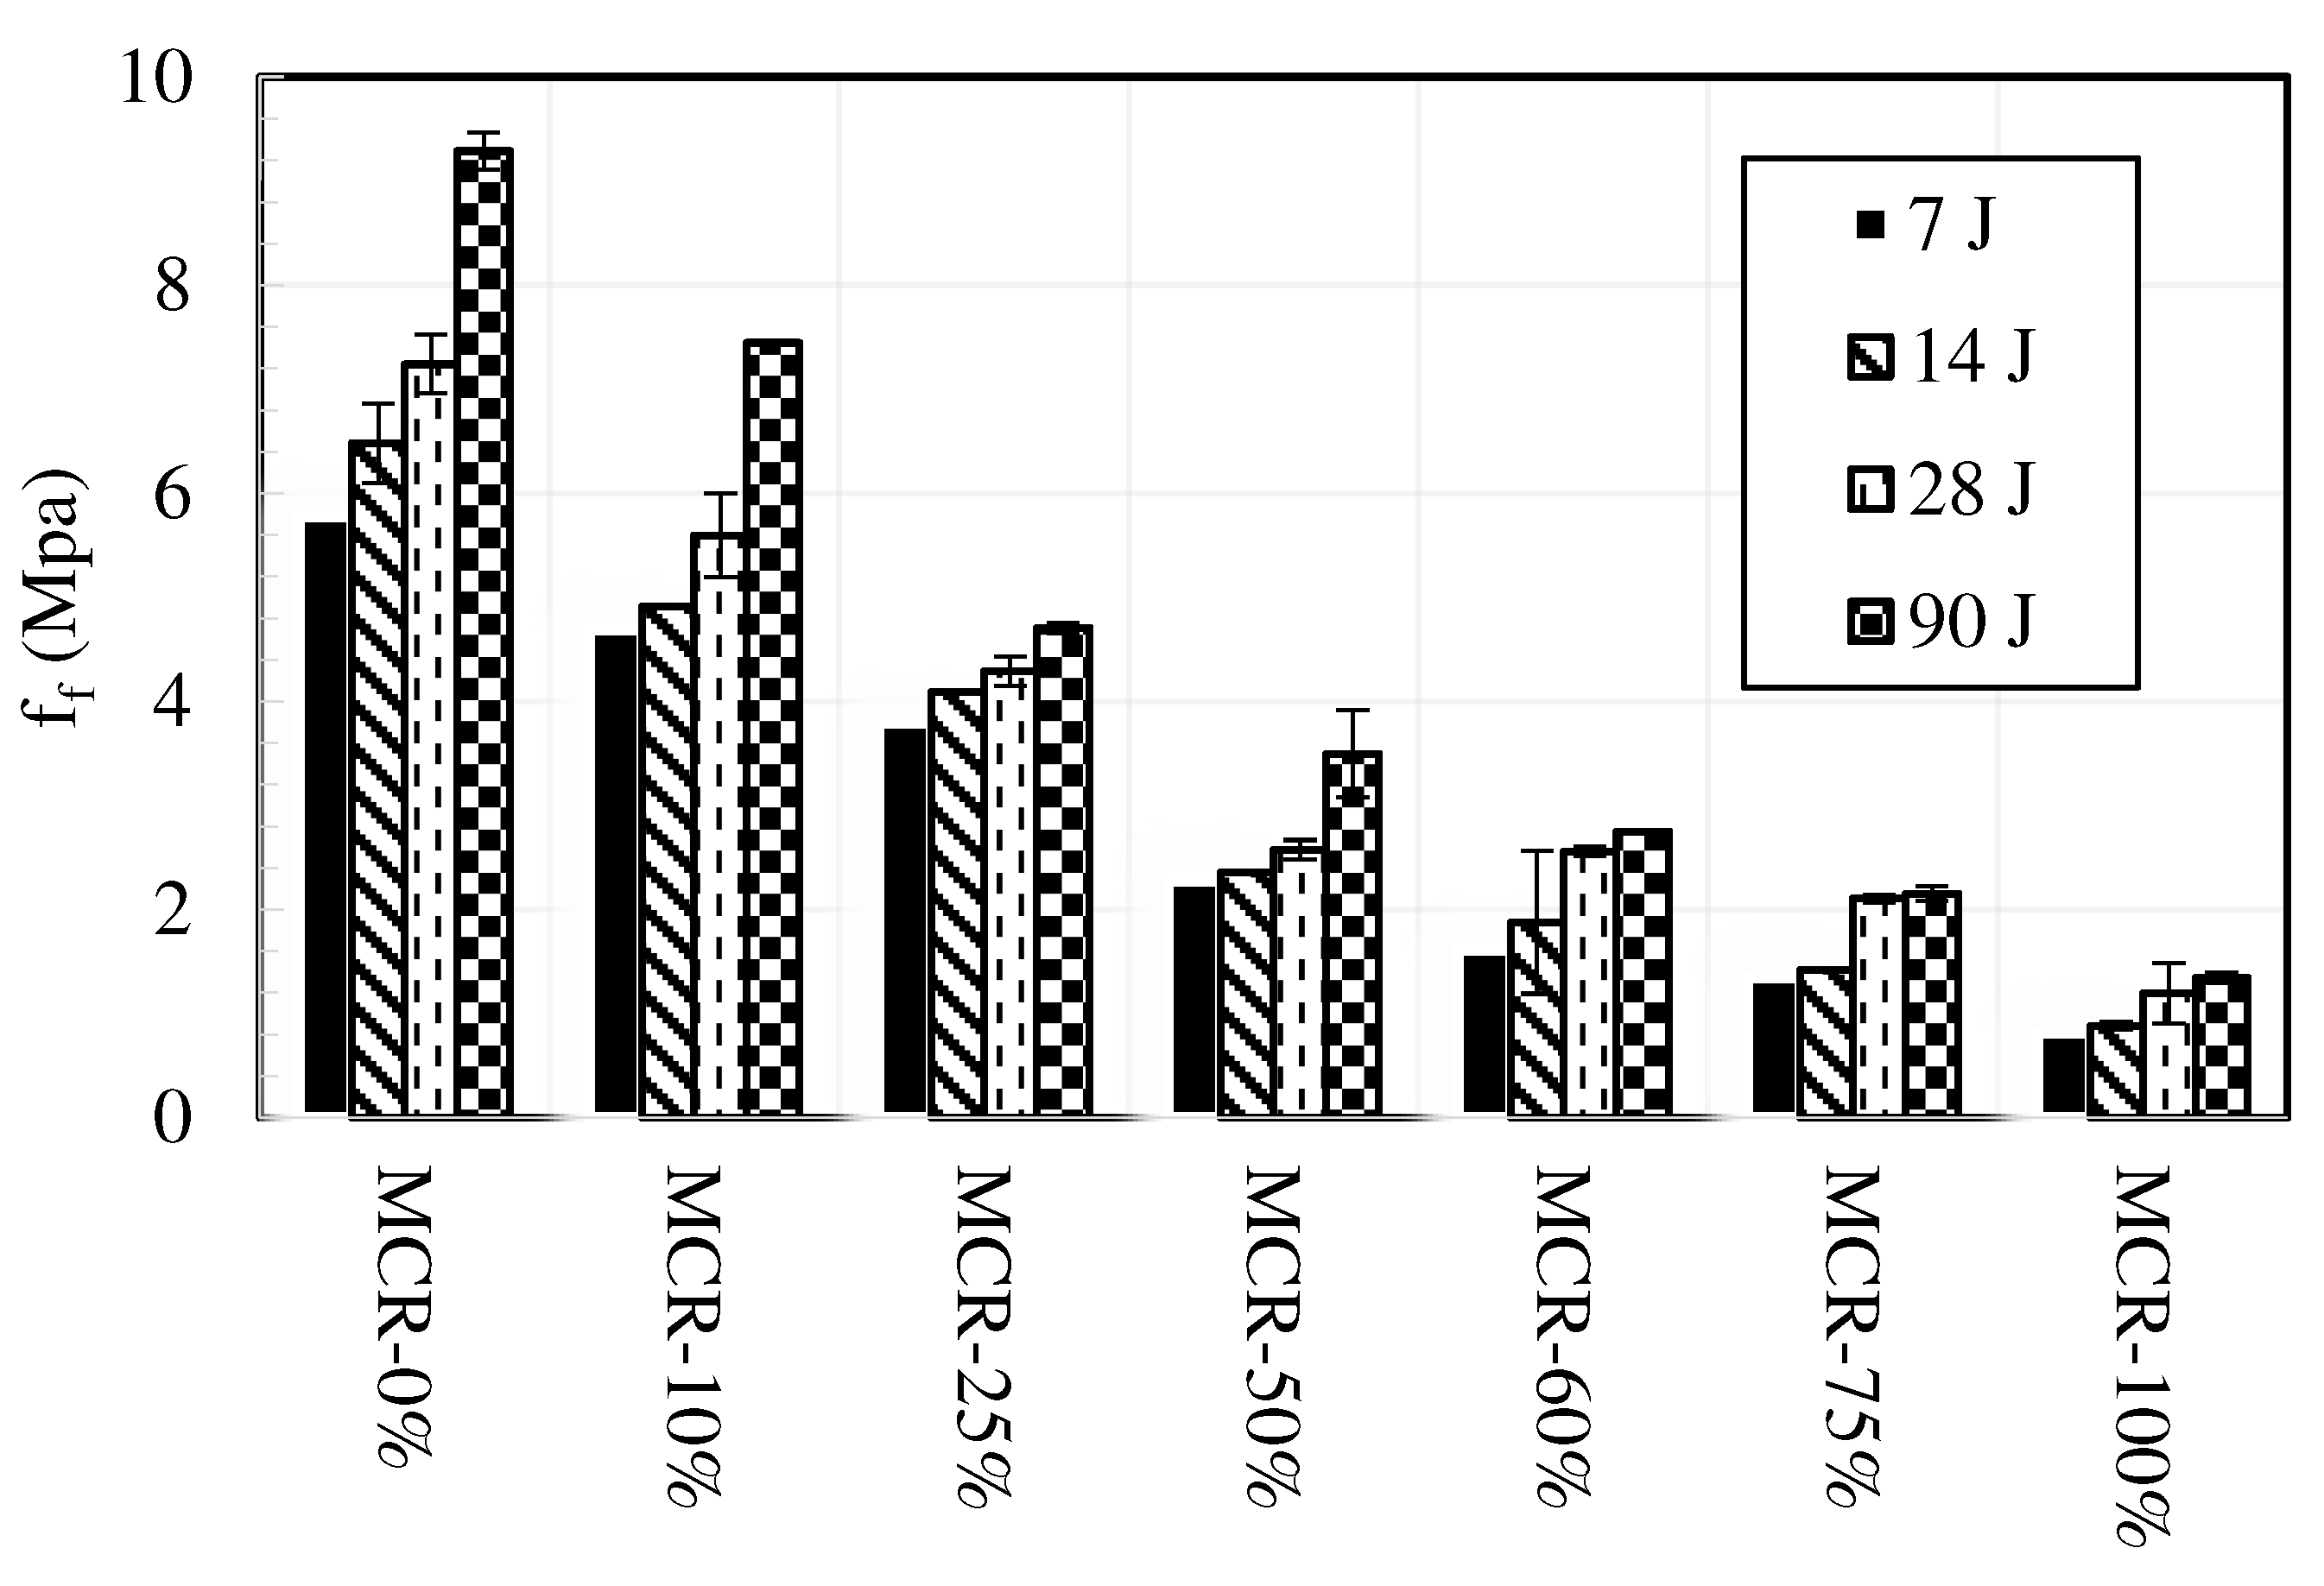
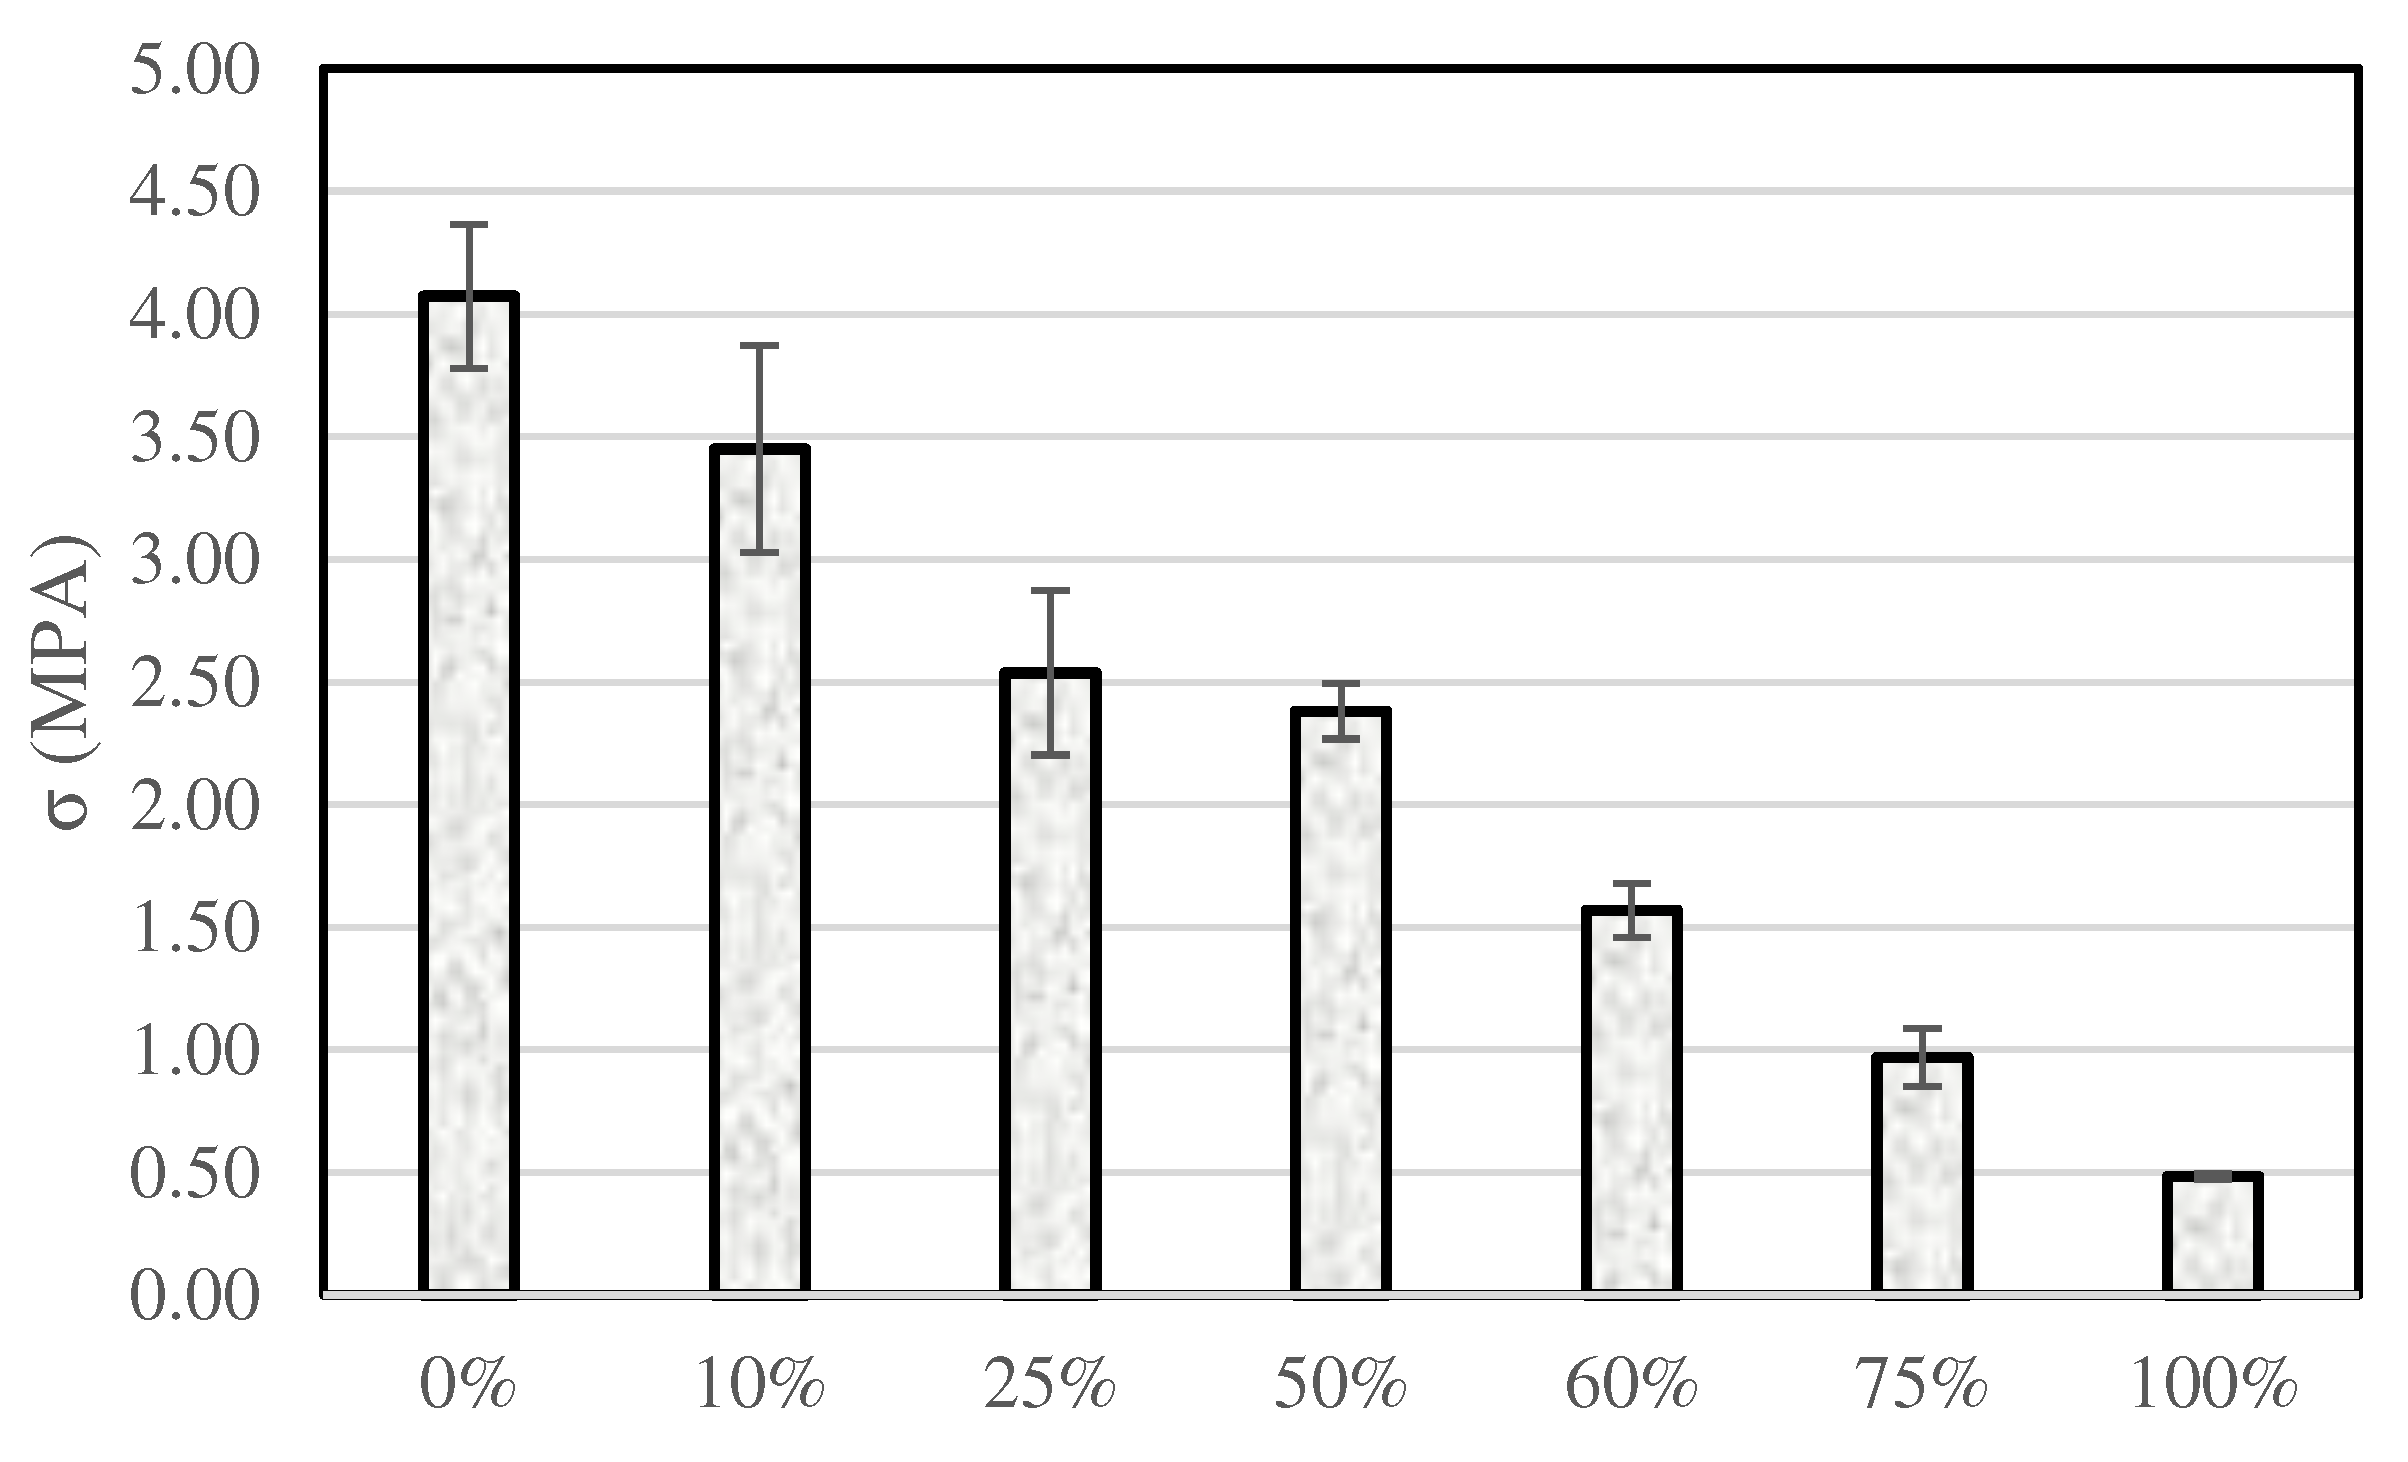
- The mechanical properties decrease as the CR content increases. This was verified in terms of compressive, flexural and tensile strengths as well as the elastic modulus. Nevertheless, mortars with can be used as lightweight mortars according standard recommendations. Up to 50% of CR content, the proposed mortars fall within the range prescribed by the standard as non-structural repair products for civil engineering buildings.
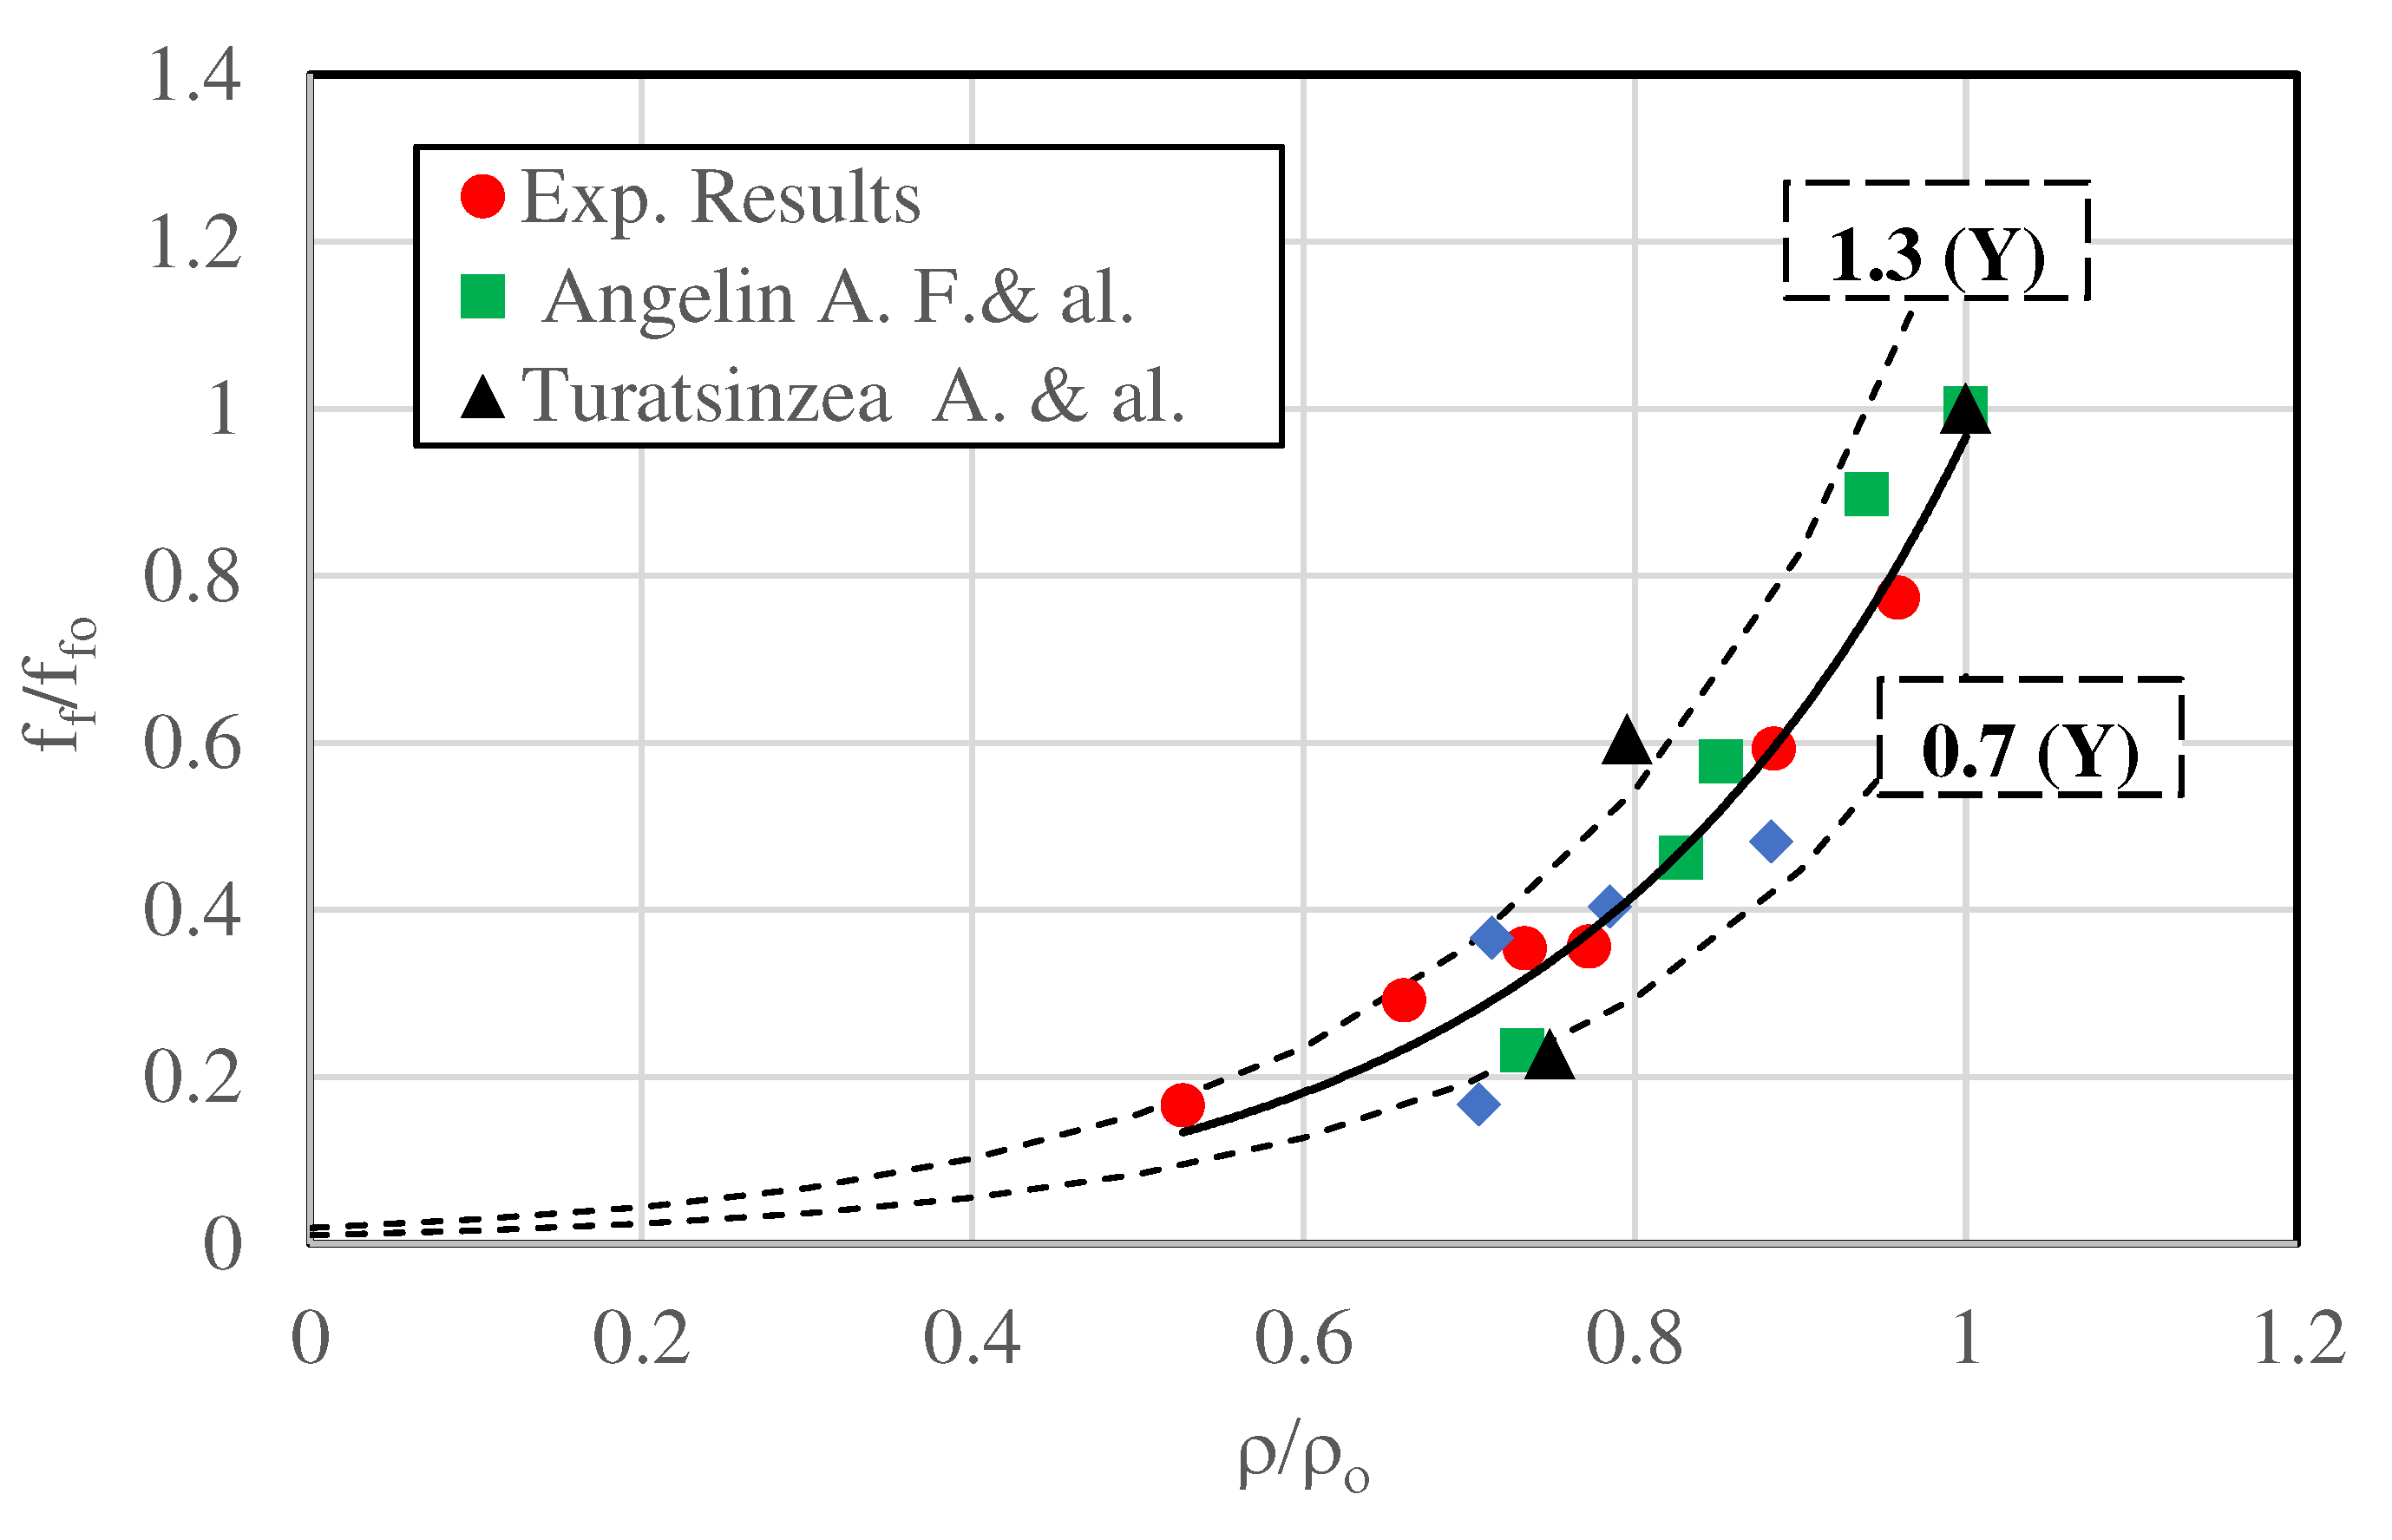
- A similar relationship links the normalized compressive strength and normalized modulus of elasticity to rubber content This relationship was established on the basis of our new experimental results and those reported in the literature. However, it should be emphasized that all normalized mechanical properties are highly dependent on the normalized density. Expressions relating these properties have been established to isolate the effect of rubber incorporation.
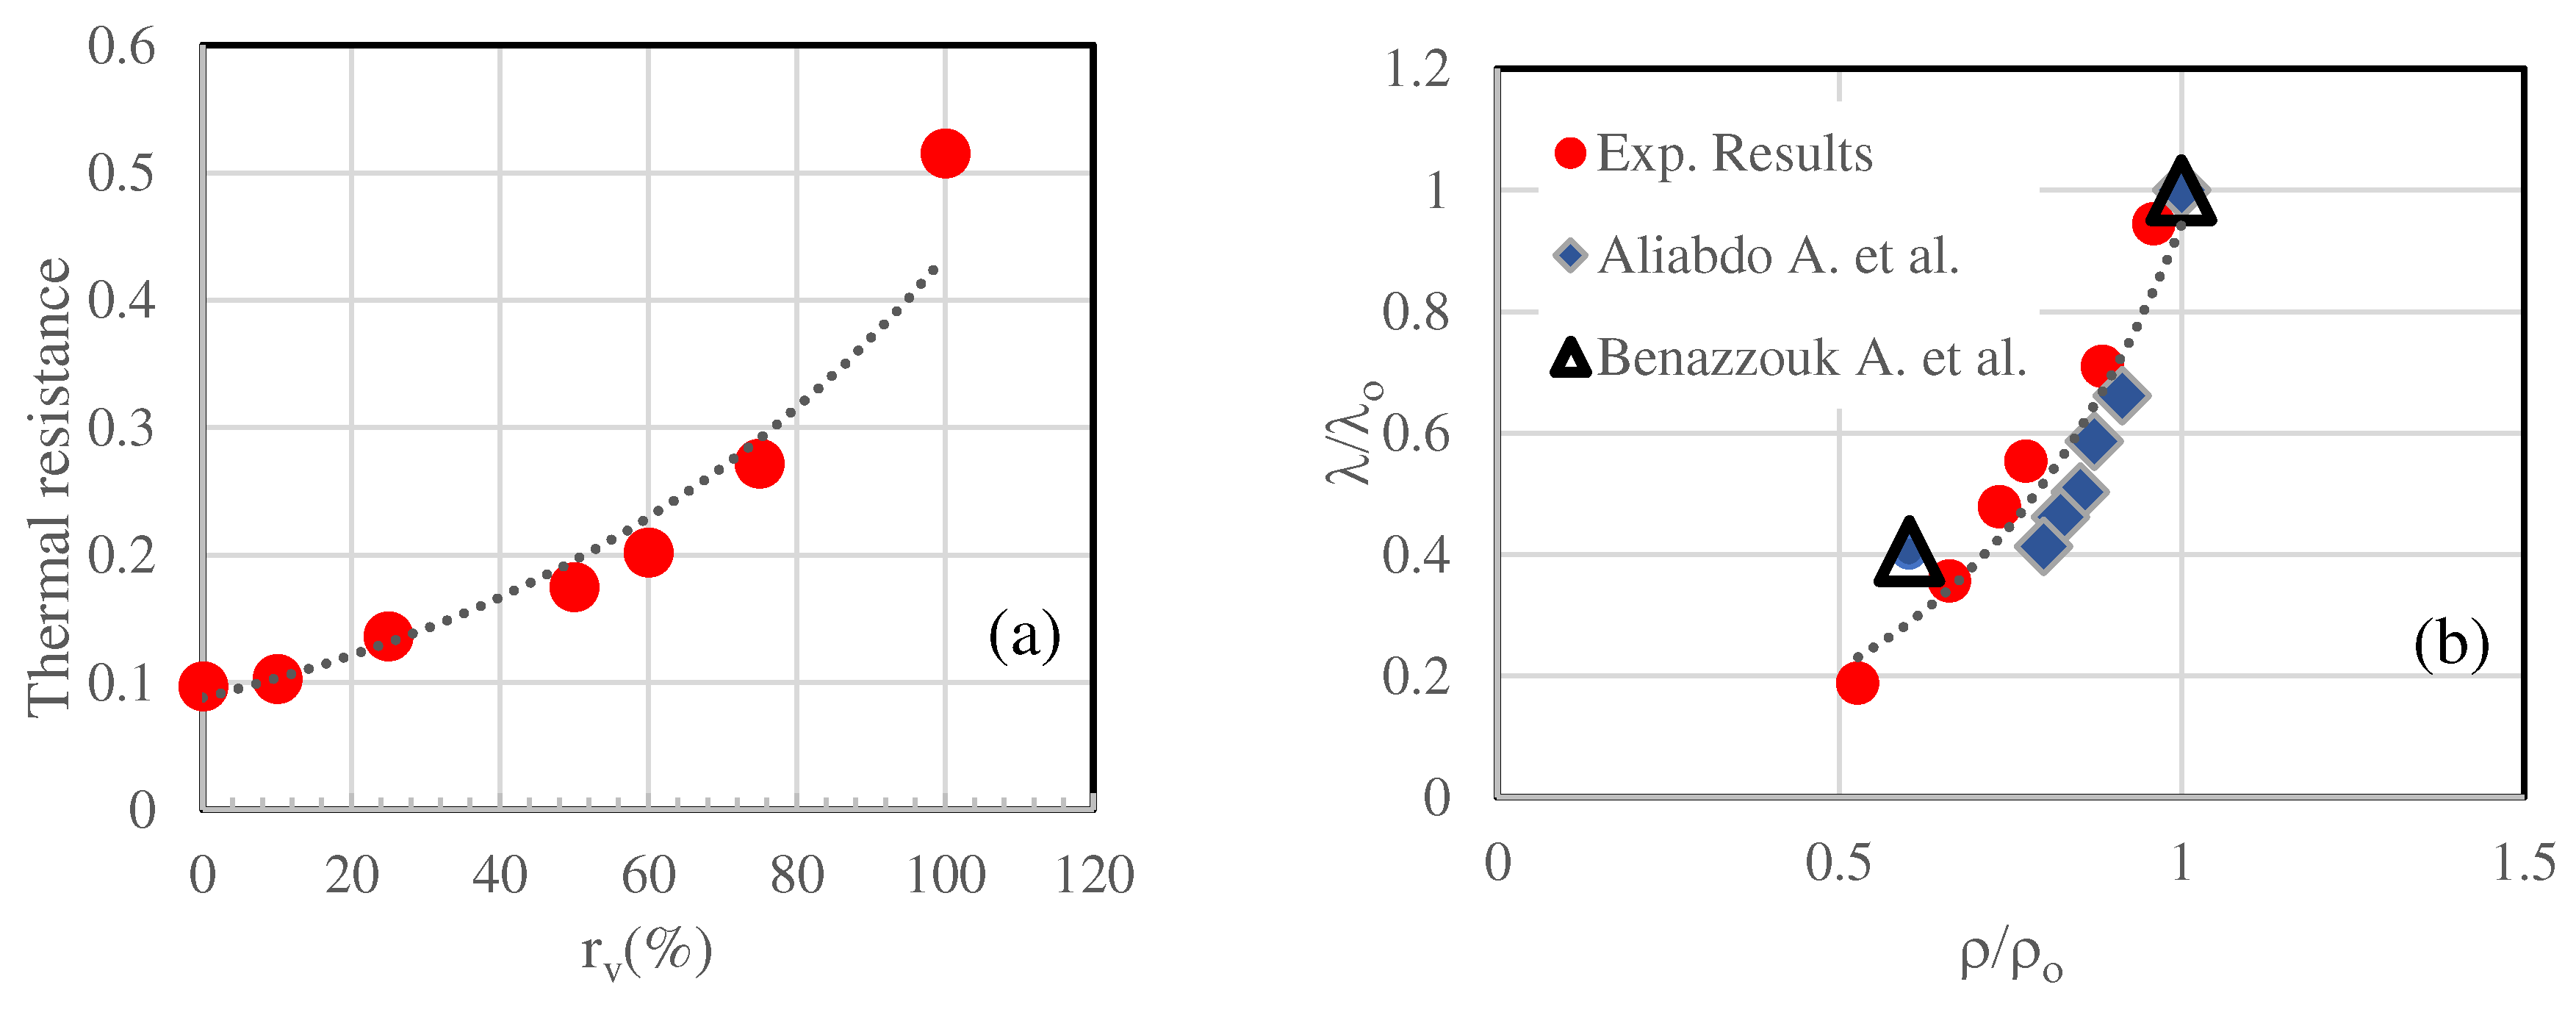
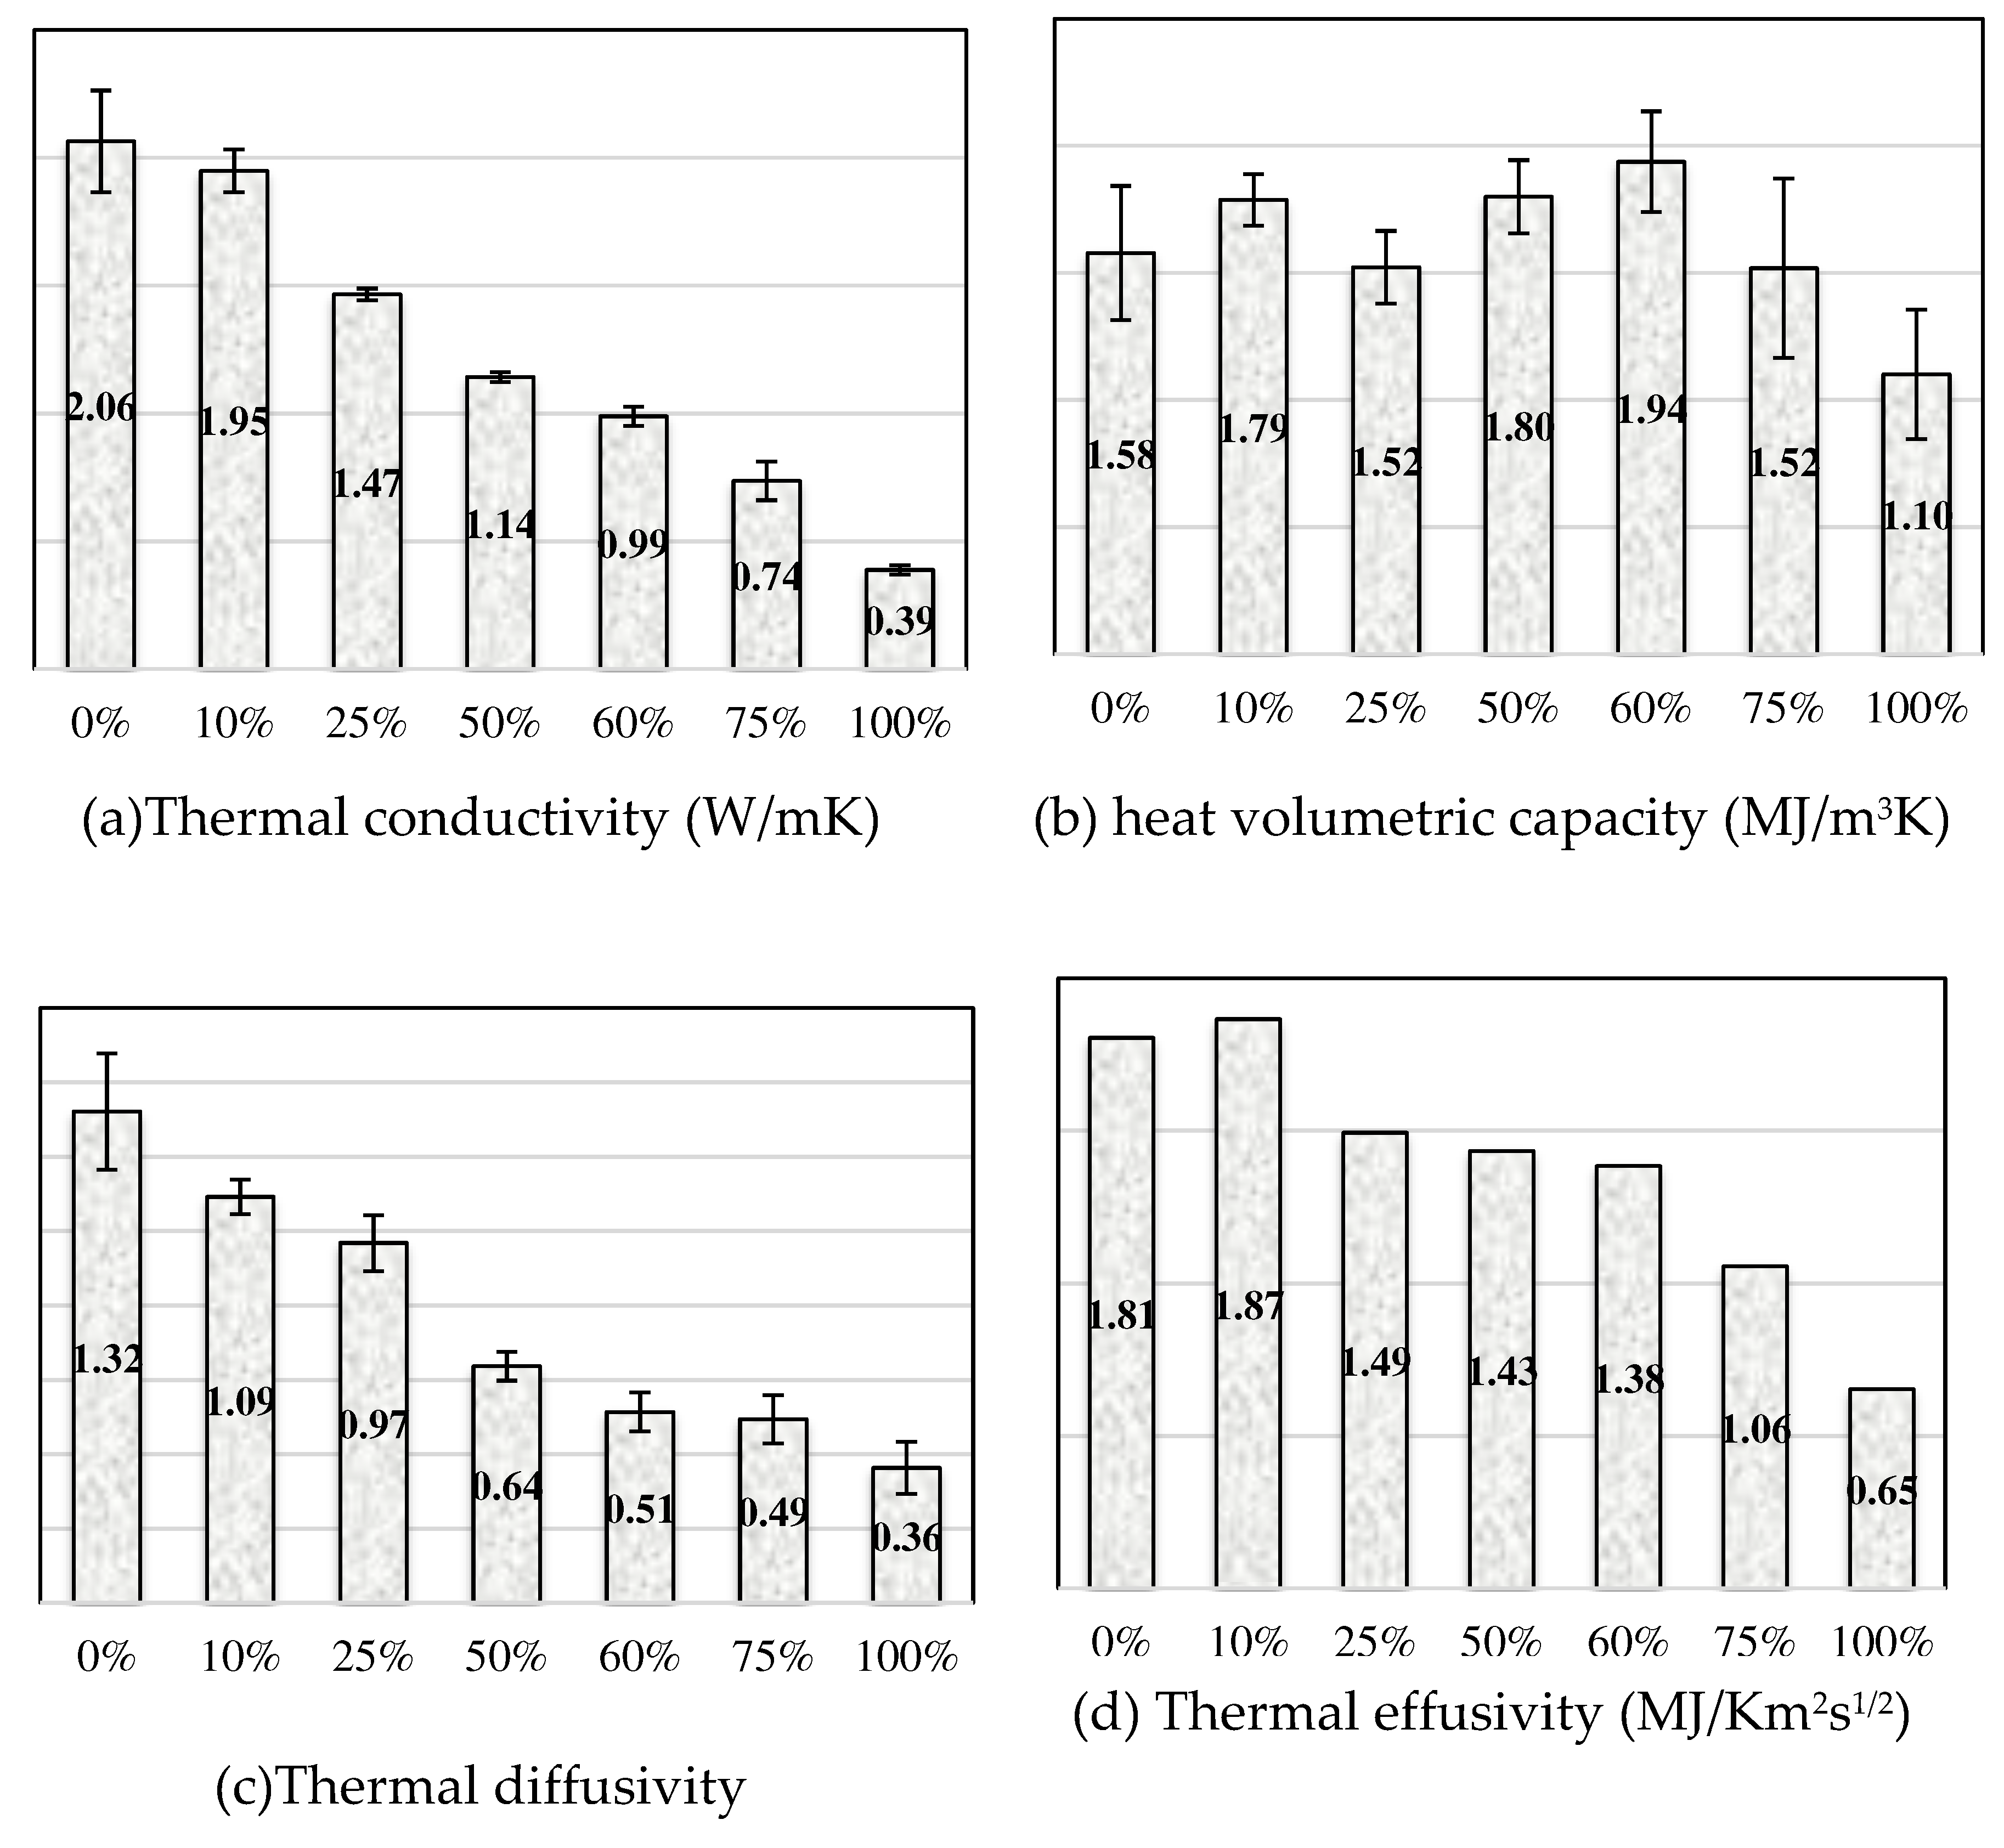
- Incorporating up to 50% of waste tires improves comfort and thermal resistance without affecting thermal inertia. Experimental data indicate that thermal conductivity significantly decreases with respect to CR. However, the changes in volumetric heat capacity with CR are not as large, which explains the little changes observed in terms of thermal effusivity.
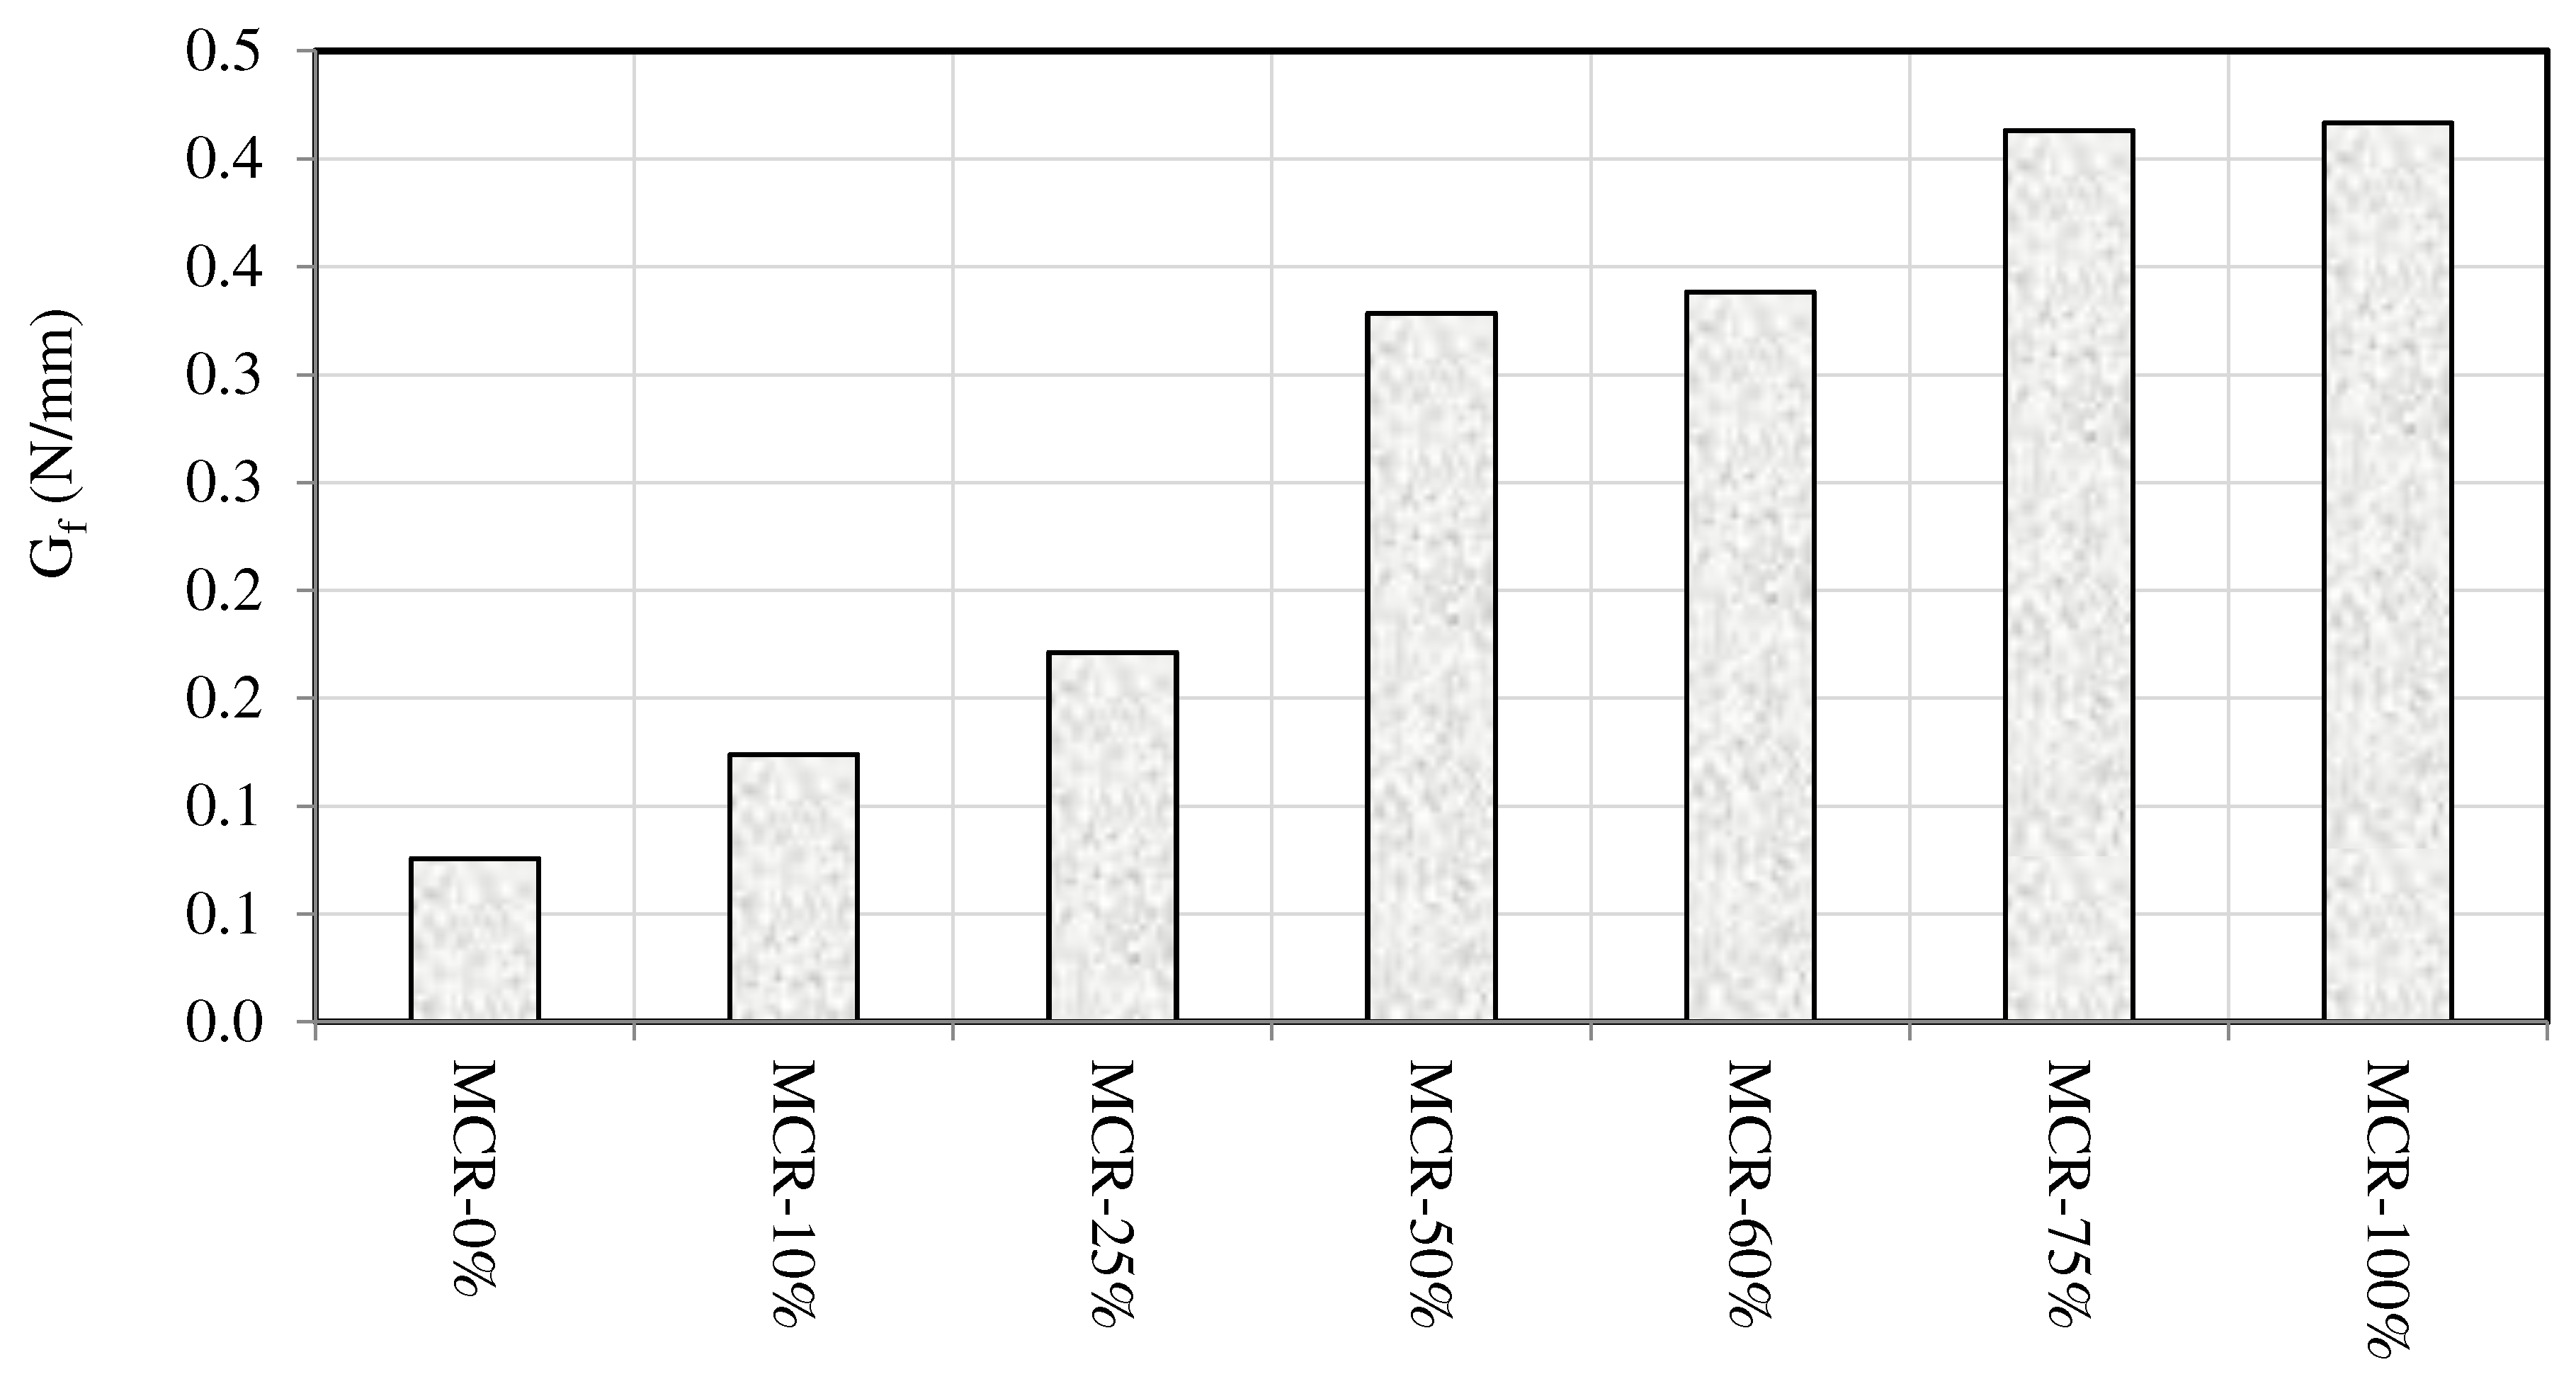
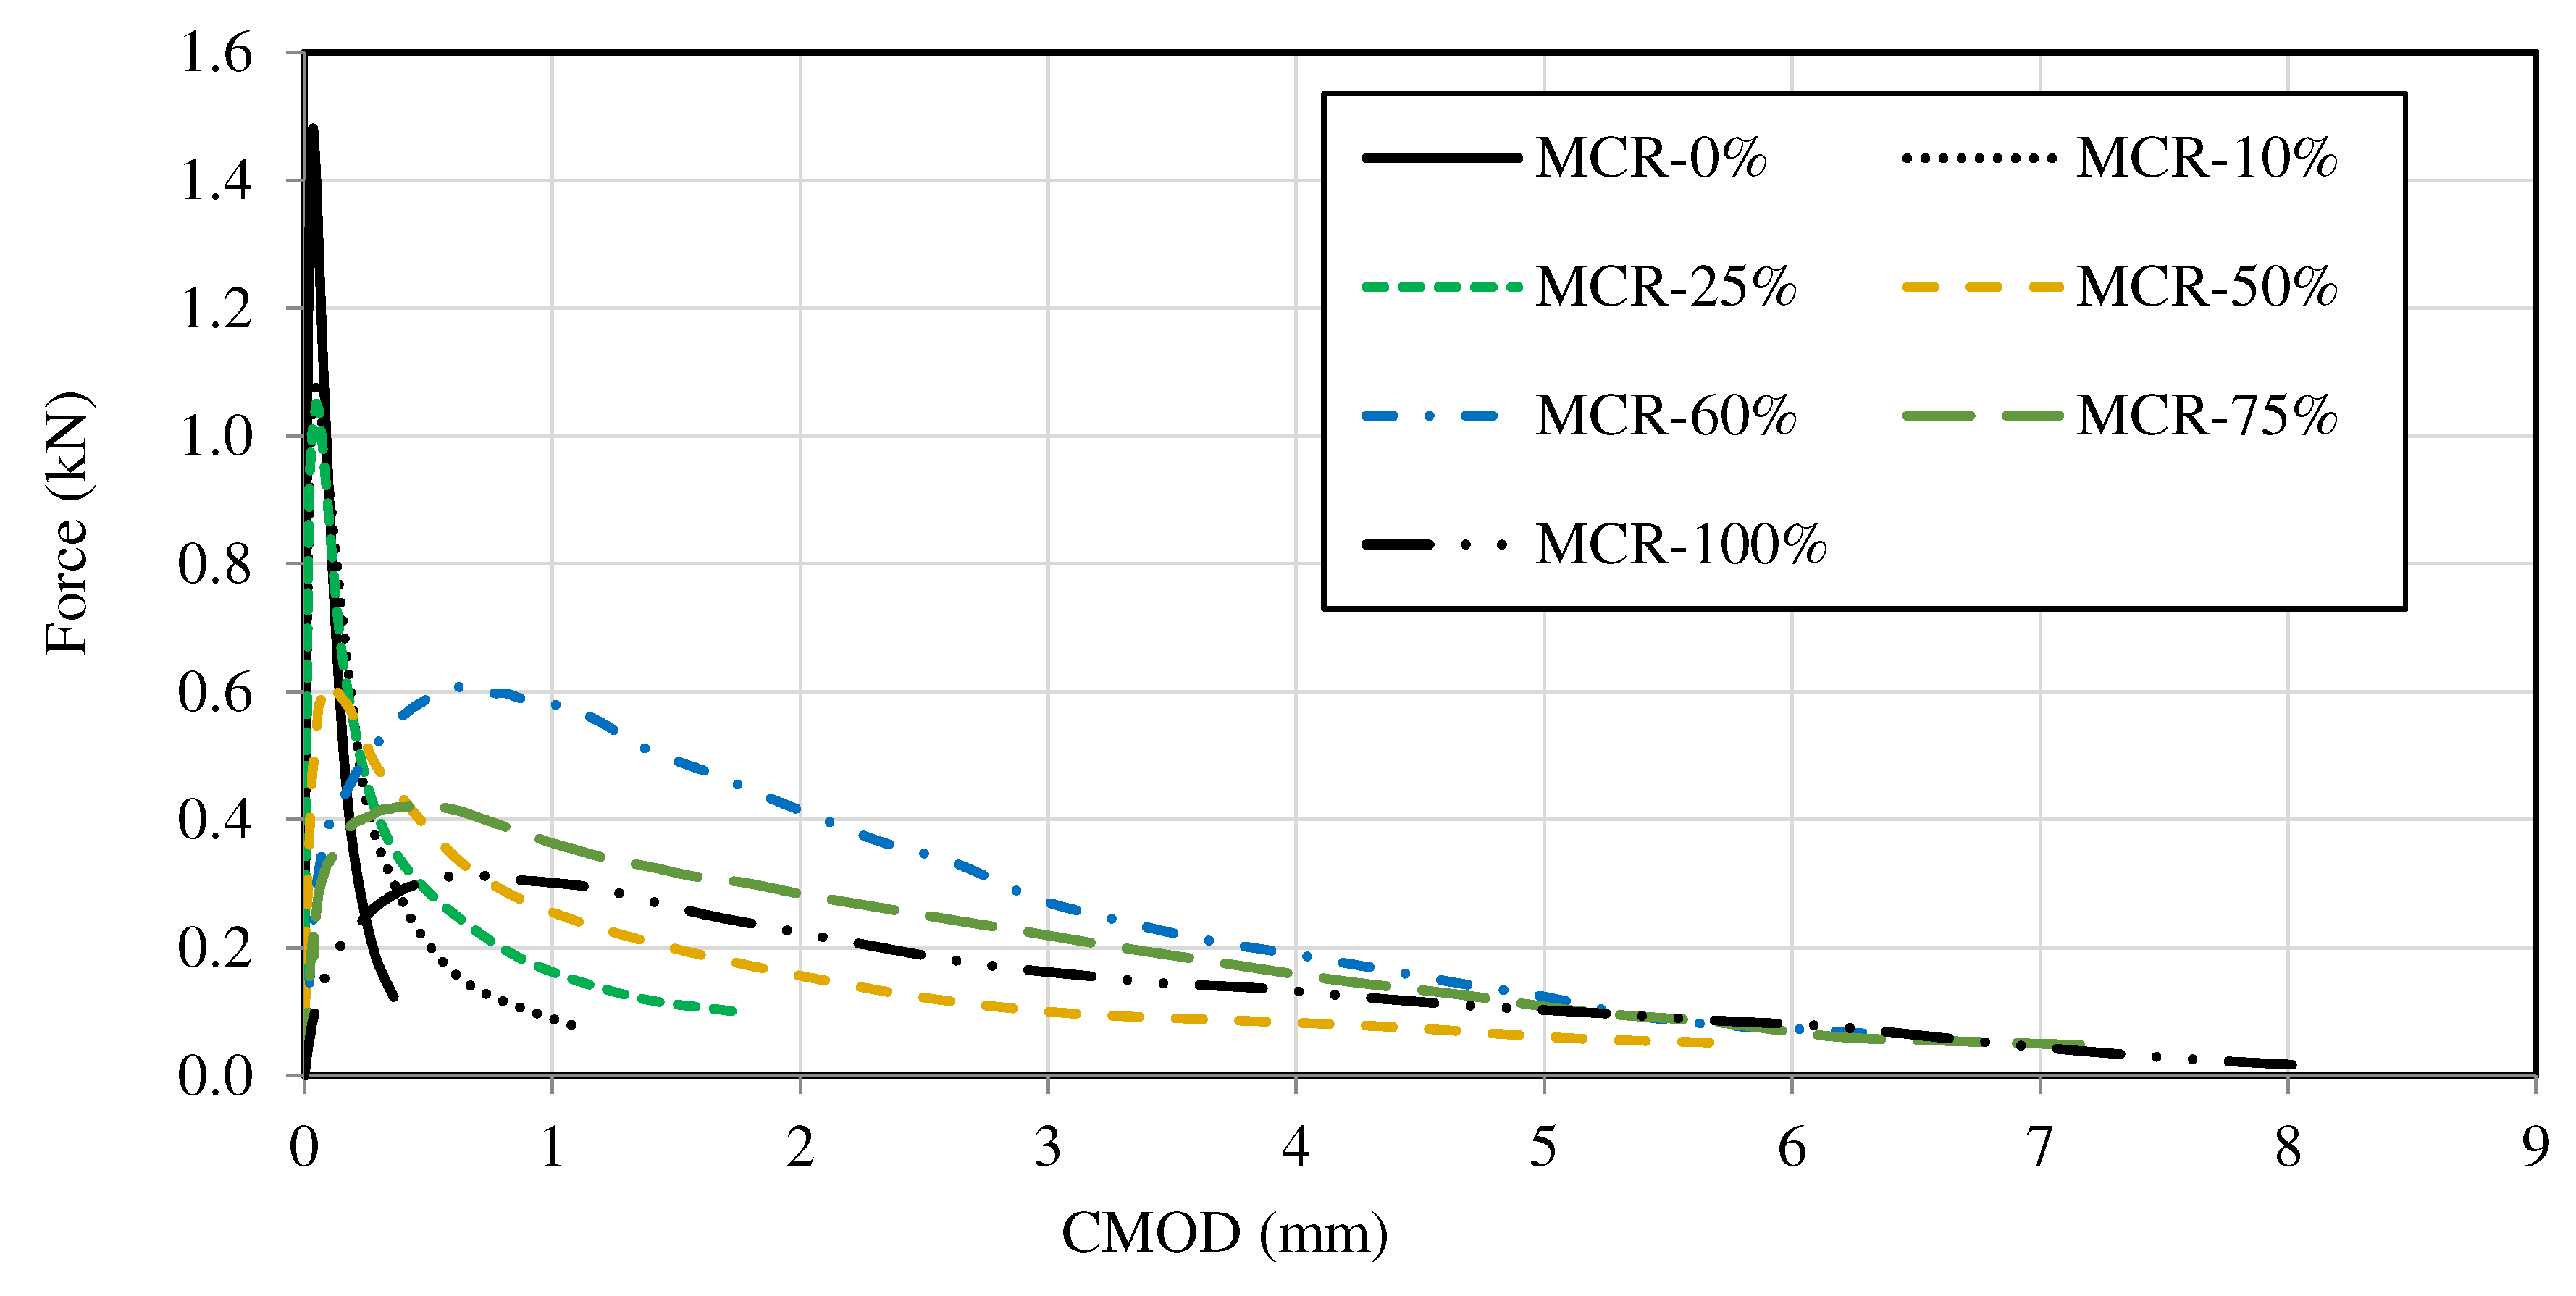
- The fracture energy increases with the increase in CR content. The increase in the density of microcrack networks and aggregate-cement interfaces weakens the material embedding soft crumb rubber. These defects coalesce and propagate, which results in the increase of energy dissipation with higher CR replacement ratios.
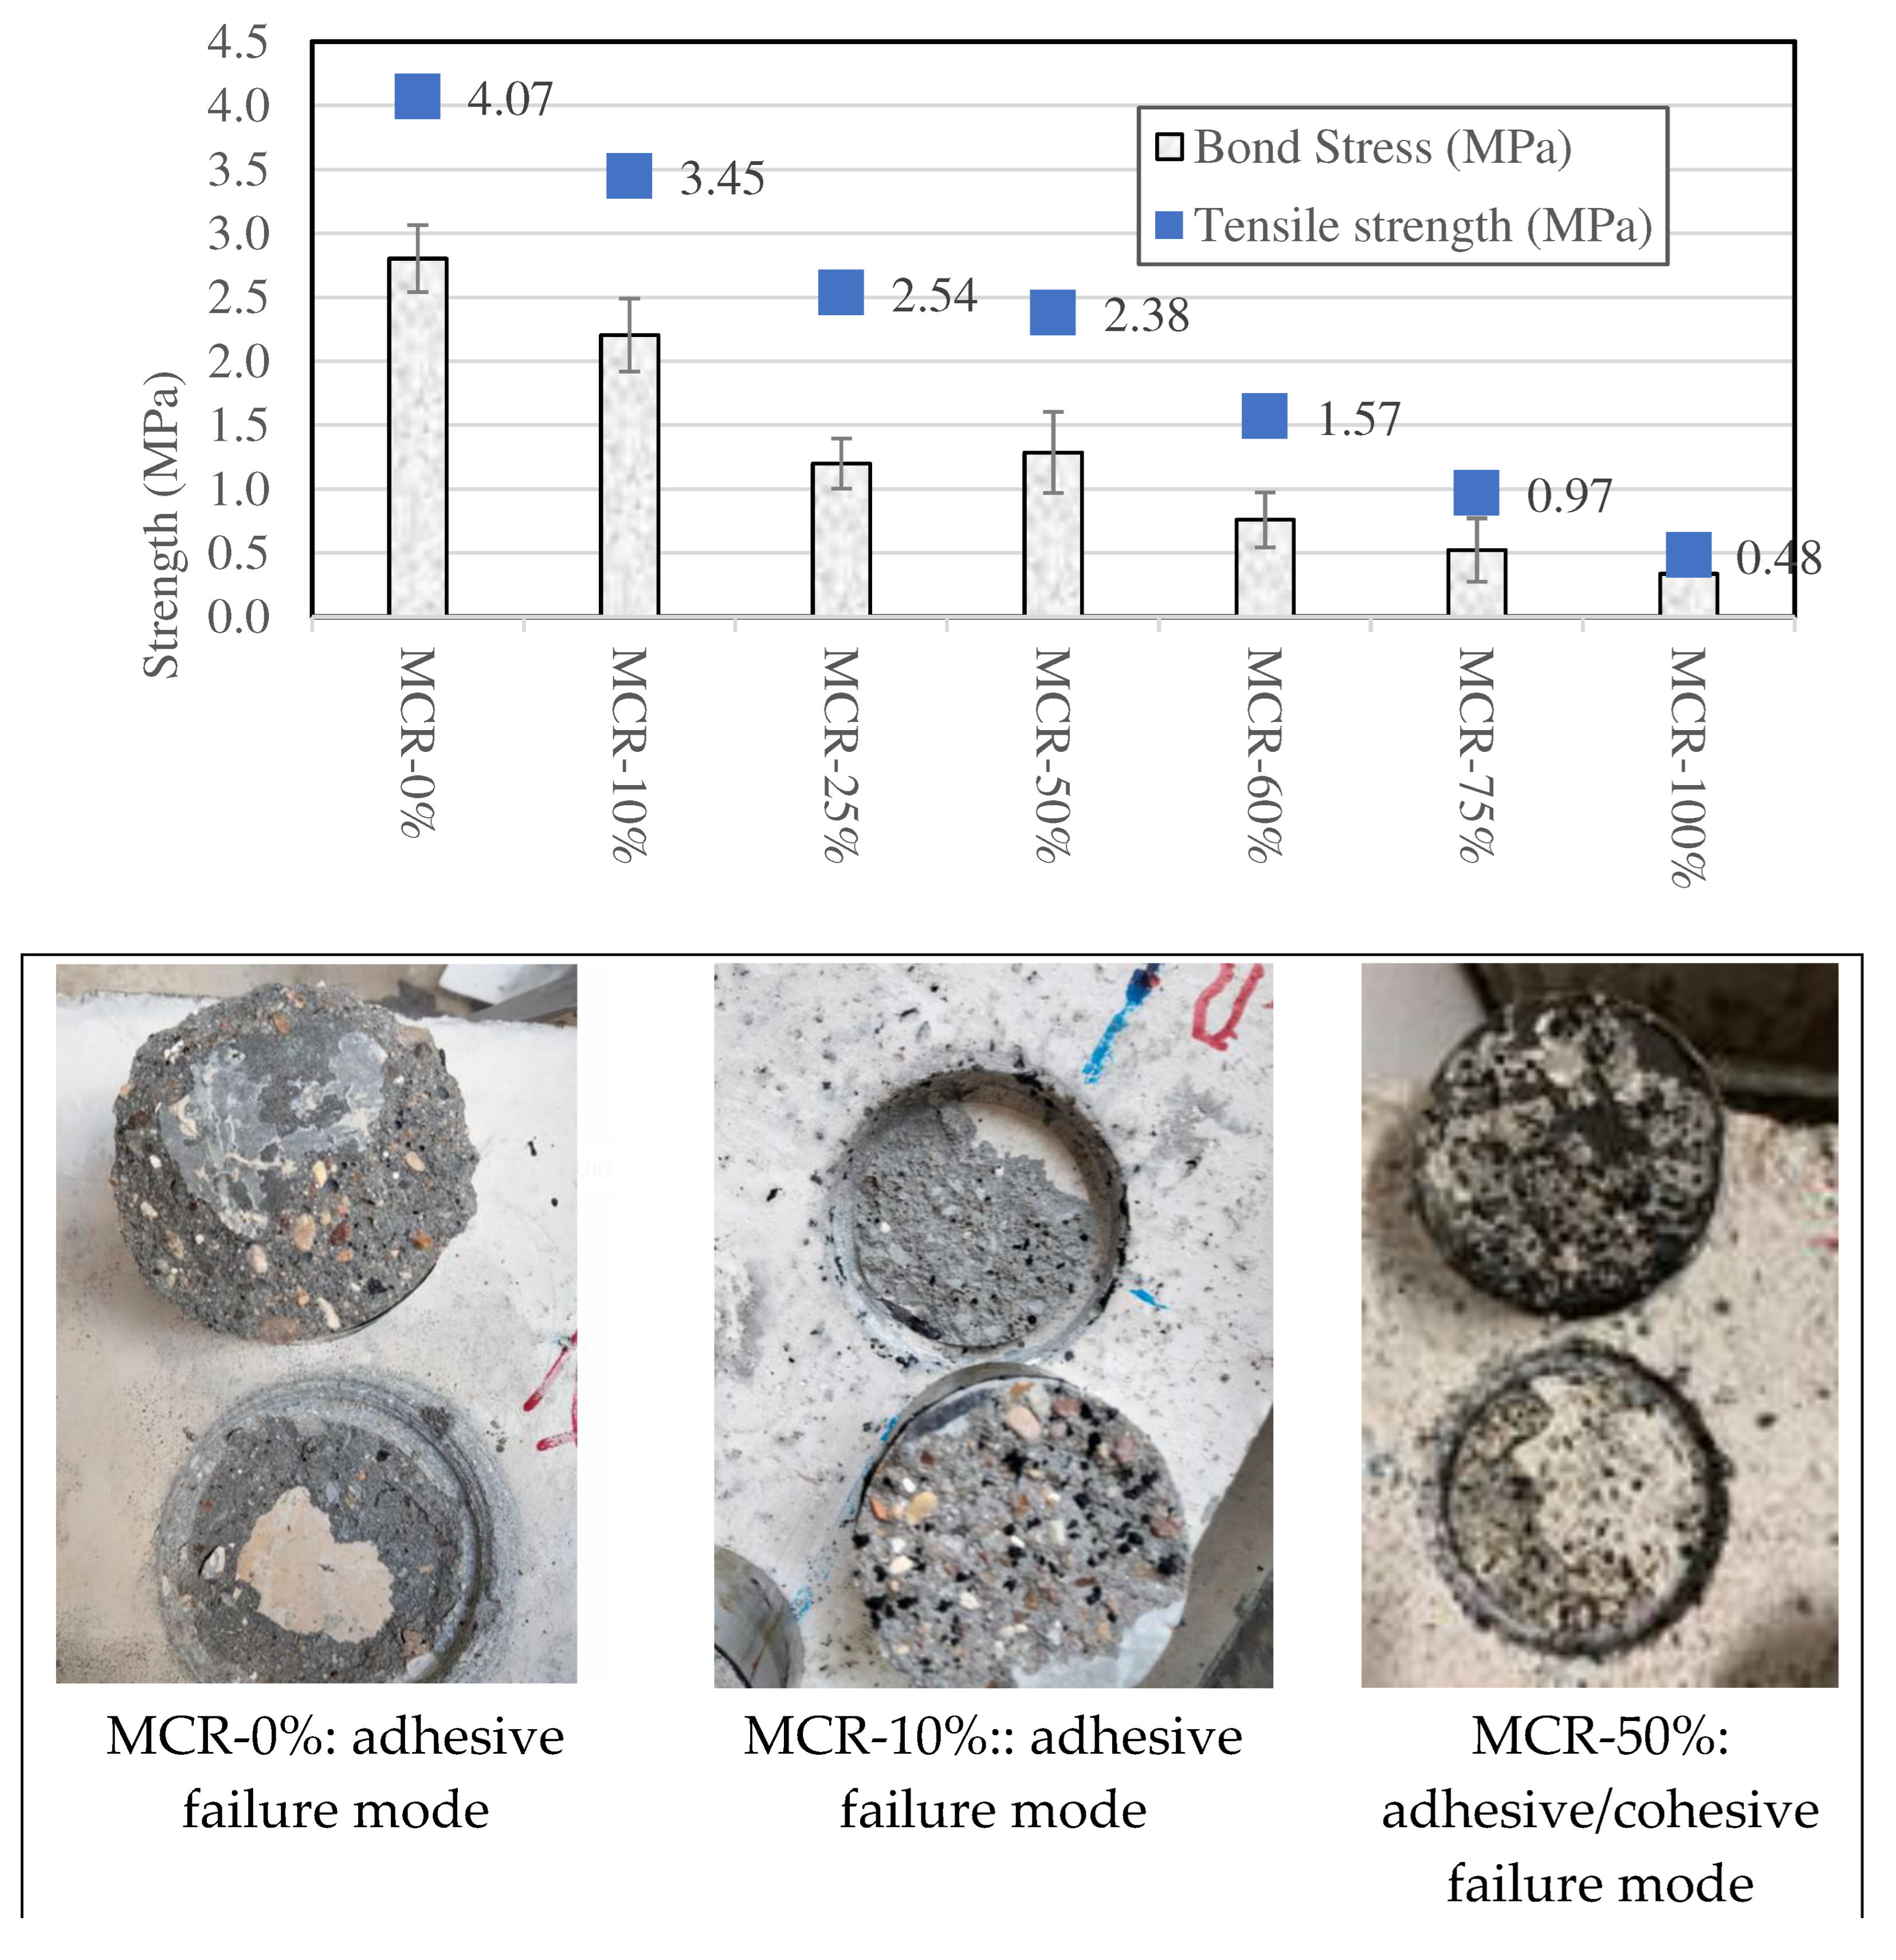
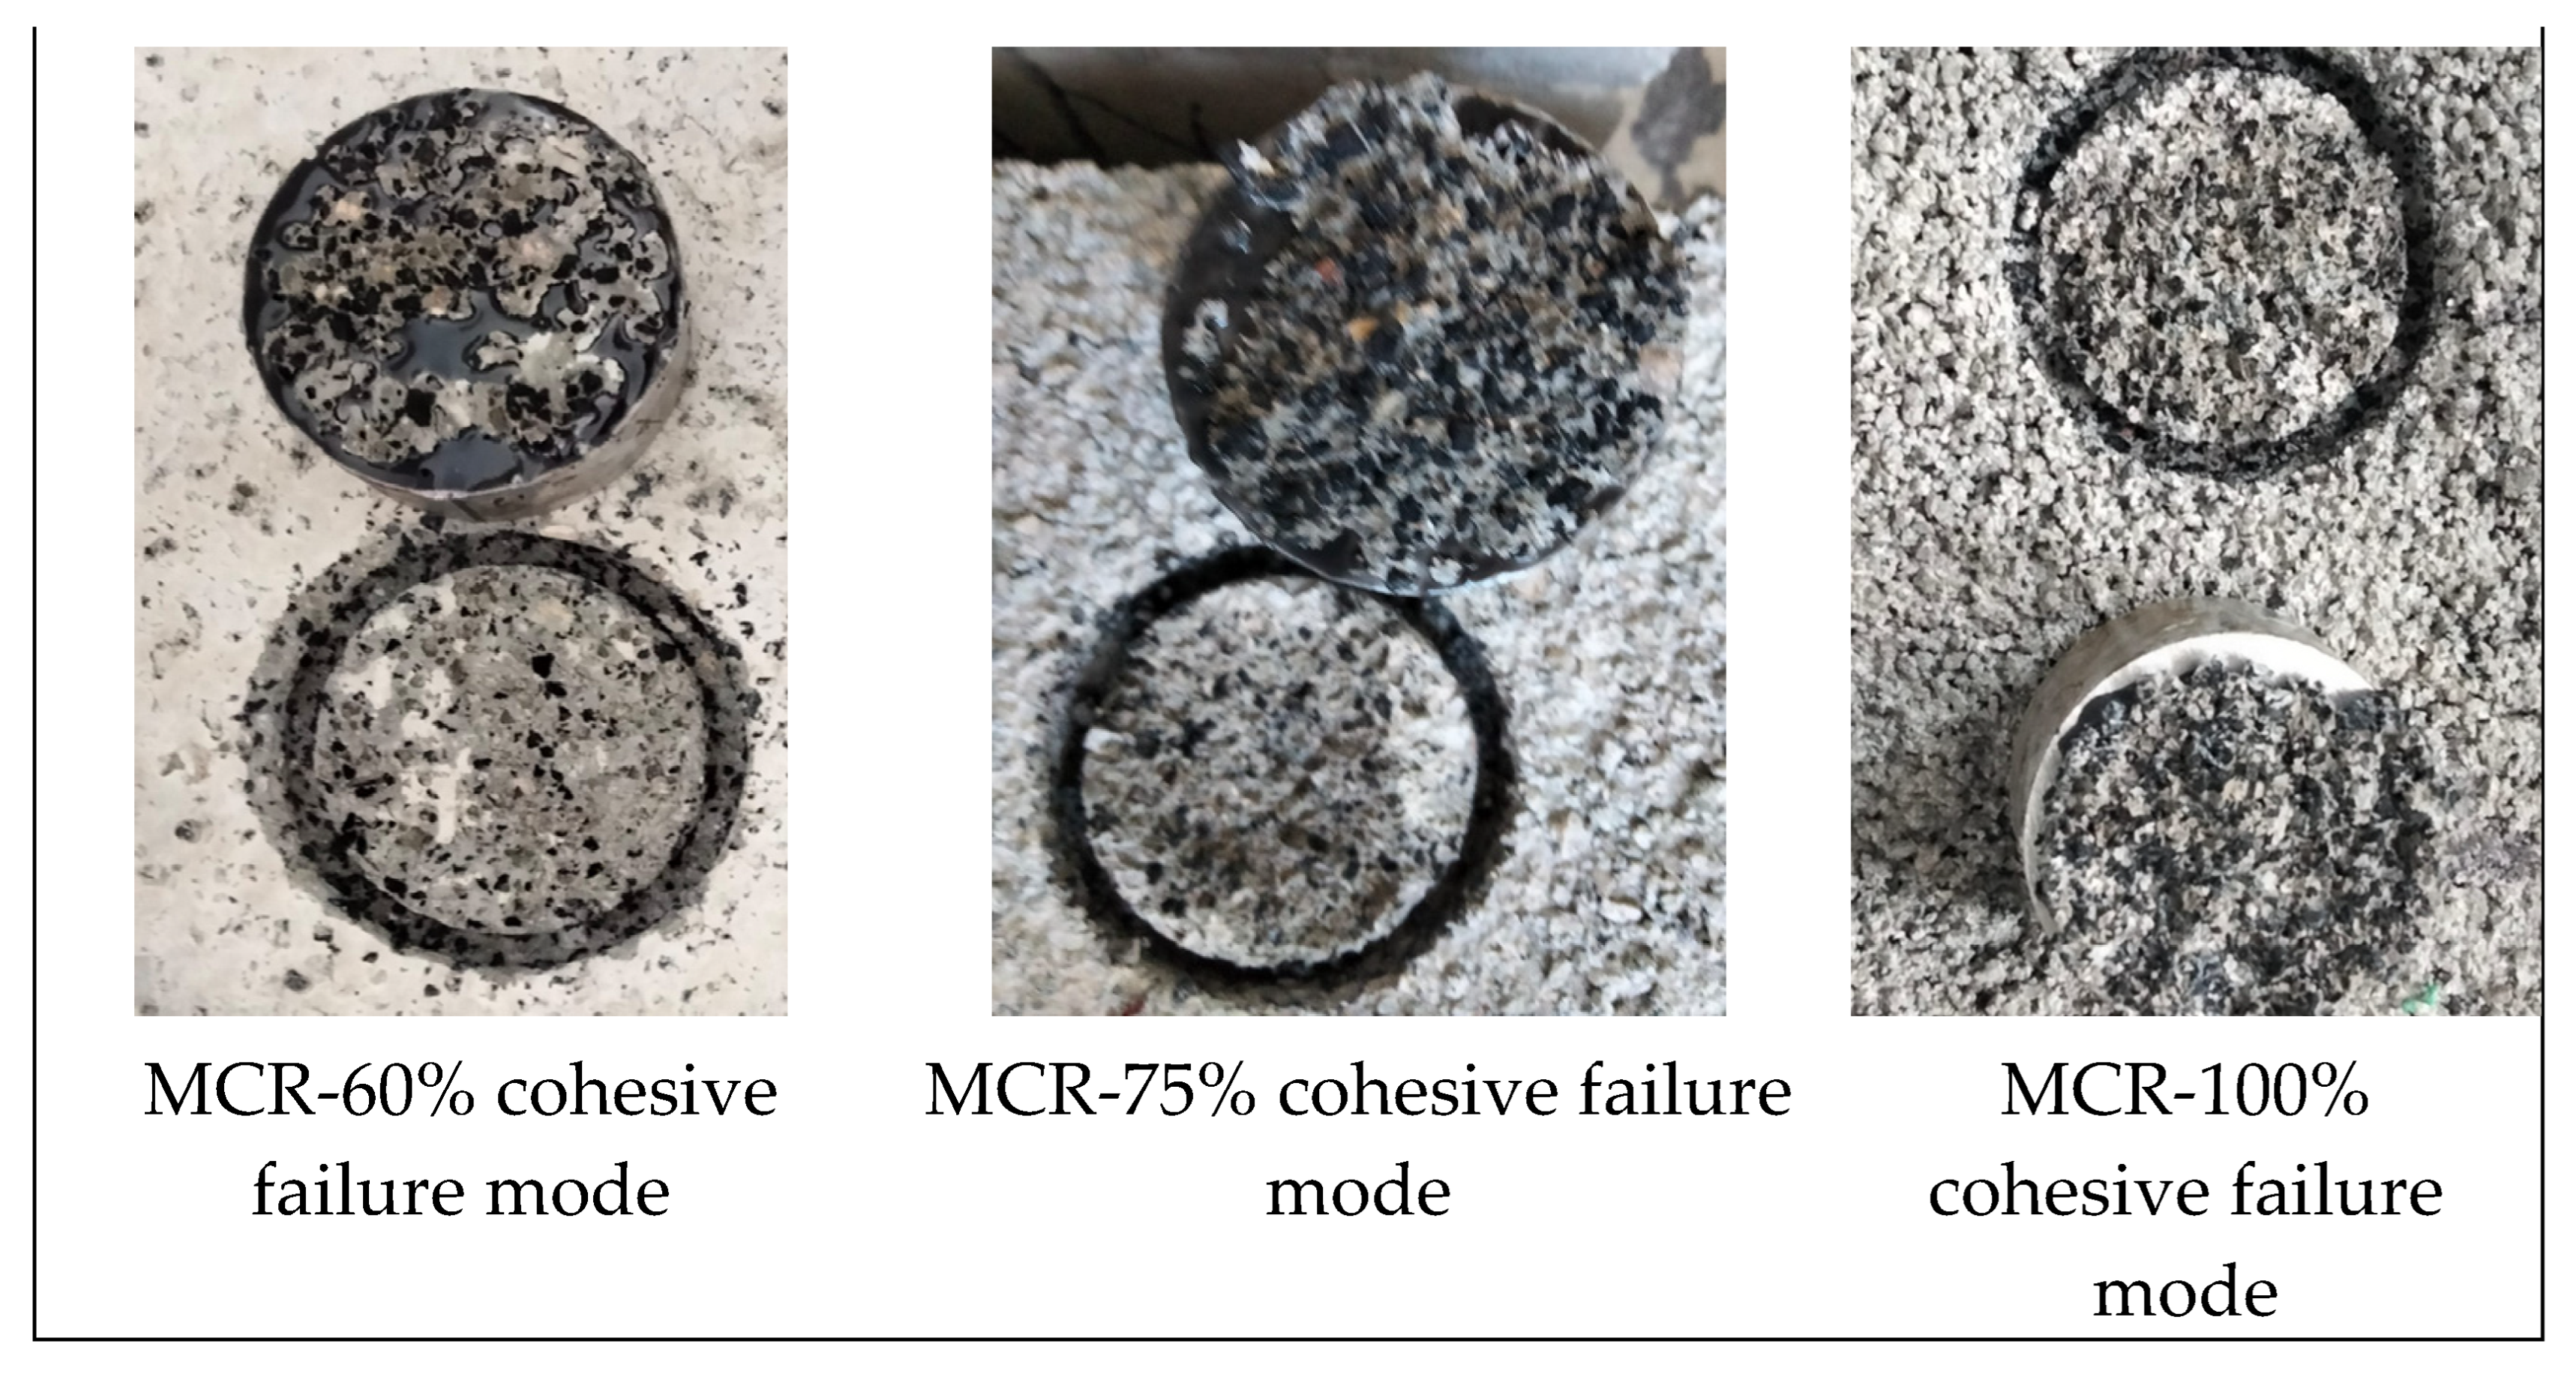
- Pull-out test results show that the bond strength decreases with increasing CR content. However, the obtained bond strengths conform to standards for non-structural repair applications when .
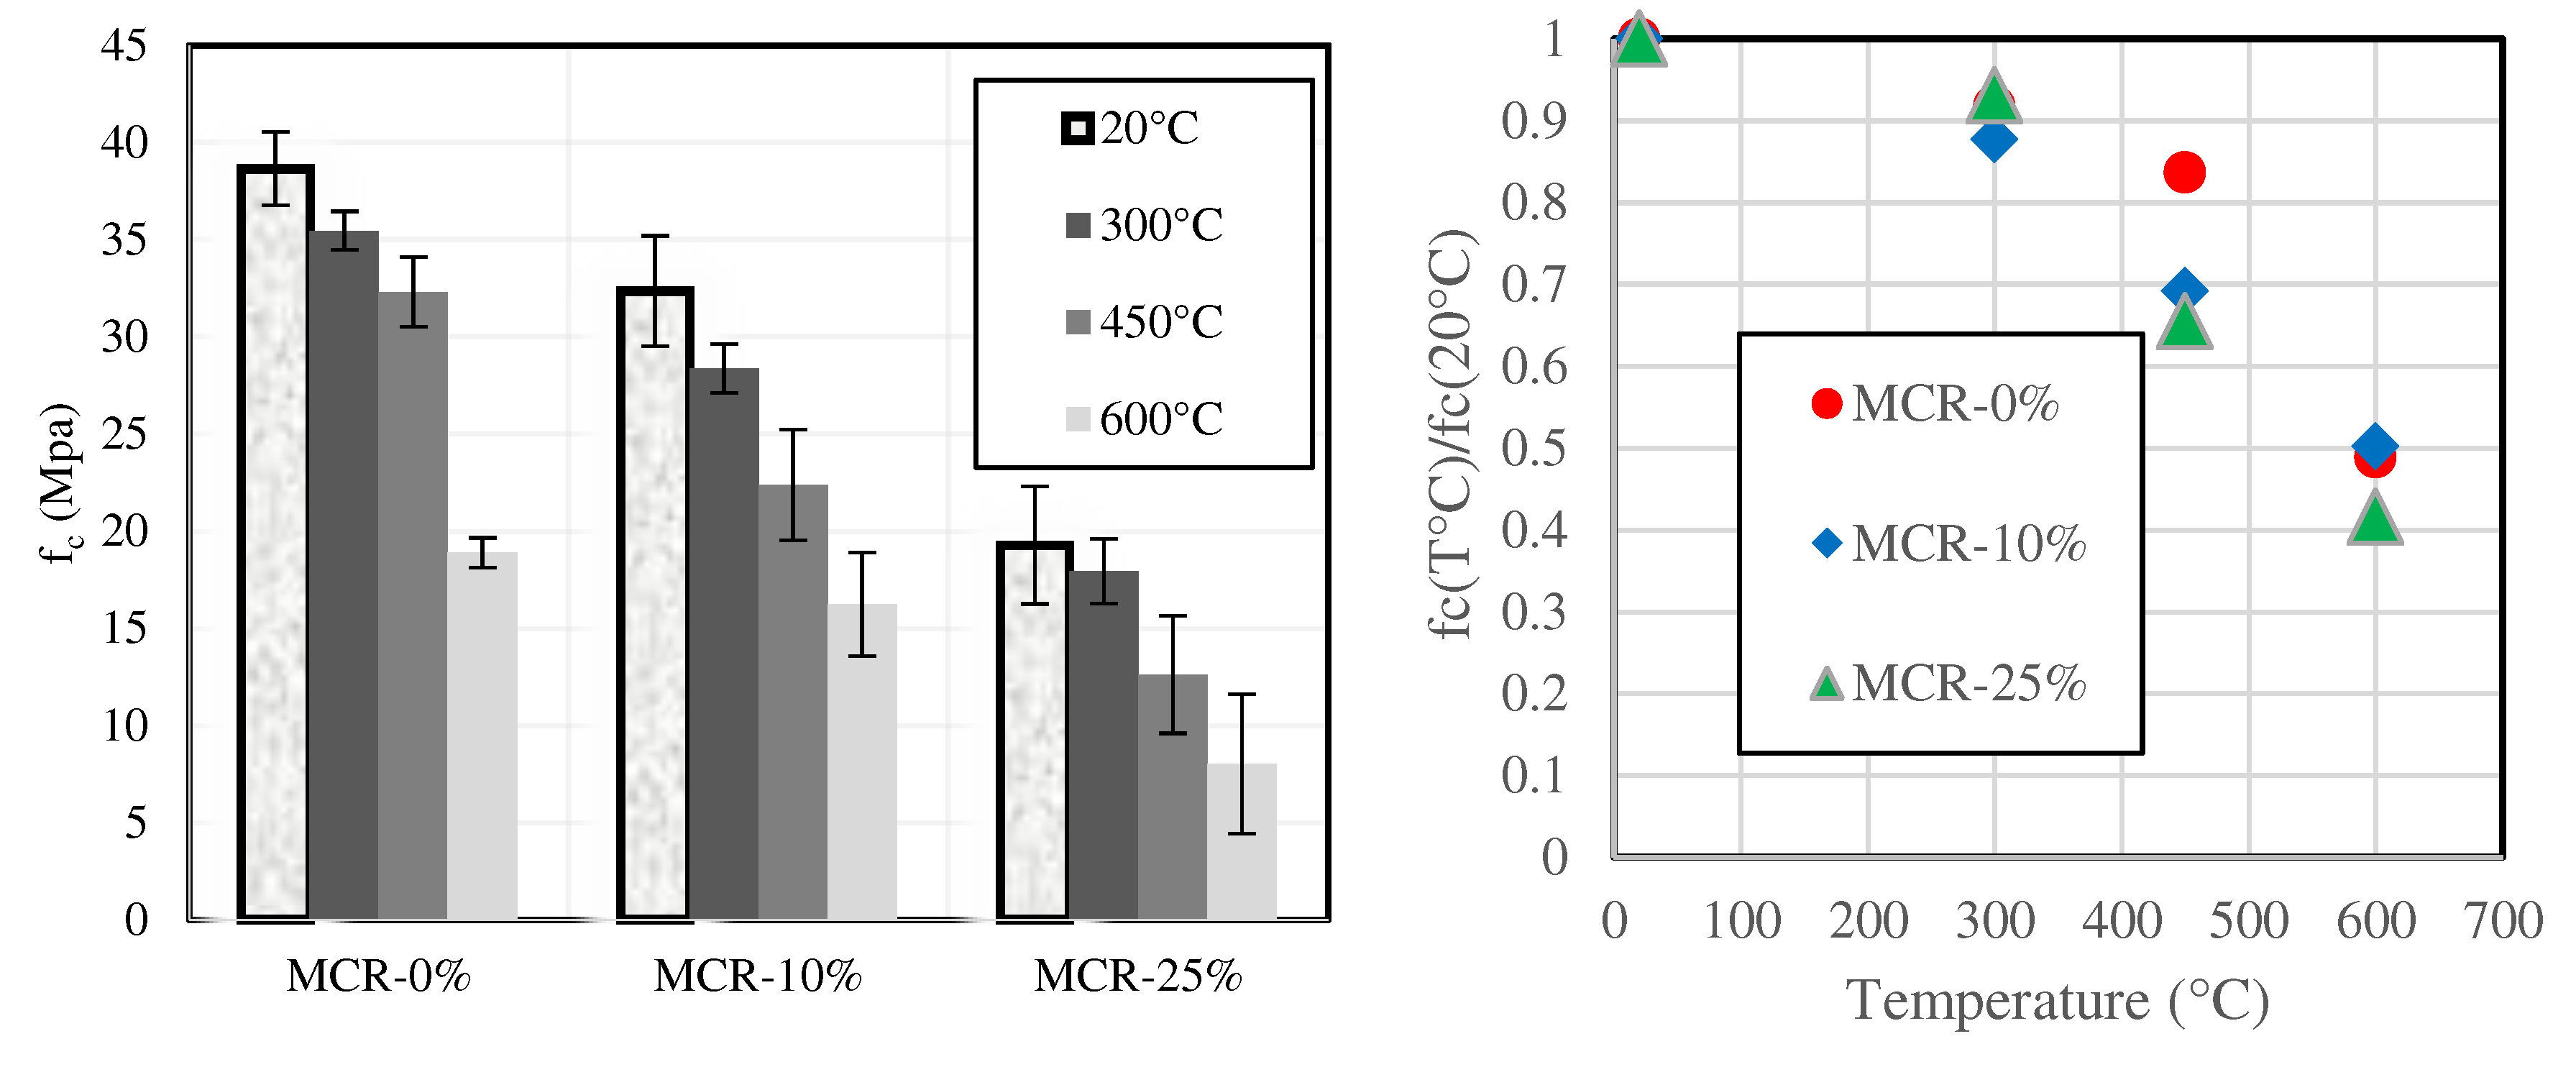
- Mass losses due to heat treatment increase with higher crumb content and/or temperature. However, the variations remain below 12% in the temperature range considered (20 to 600 °C).
5. Acknowledgments
Data Availability Statement
References
- Abbas-Abadi, Mehrdad Seifali, Marvin Kusenberg, Hamed Mohamadzadeh Shirazi, Bahman Goshayeshi, and Kevin M. Van Geem. 2022. “Towards Full Recyclability of End-of-Life Tires: Challenges and Opportunities.” Journal of Cleaner Production 374. [CrossRef]
- Ademe. 2023. Les Exigences Réglementaires Pour Les Travaux de Rénovation.
- Aiello, M. A., and F. Leuzzi. 2010. “Waste Tyre Rubberized Concrete: Properties at Fresh and Hardened State.” Waste Management 30(8):1696–1704. [CrossRef]
- Al-Attar, Alyaa A., Hussein M. Hamada, Bassam A. Tayeh, and Paul O. Awoyera. 2021. “Exploring Engineering Properties of Waste Tire Rubber for Construction Applications- A Review of Recent Advances.” Pp. A1–17 in Materials Today: Proceedings. Vol. 53. Elsevier Ltd.
- Aliabdo, Ali A., Abd Elmoaty M. Abd Elmoaty, and Mostafa M. Abdelbaset. 2015. “Utilization of Waste Rubber in Non-Structural Applications.” Construction and Building Materials 91:195–207. [CrossRef]
- Alsaif, Abdulaziz, Susan A. Bernal, Maurizio Guadagnini, and Kypros Pilakoutas. 2018. “Durability of Steel Fibre Reinforced Rubberised Concrete Exposed to Chlorides.” Construction and Building Materials 188:130–42. [CrossRef]
- Angelin, A. F., E. J. P. Miranda, J. M. C. Dos Santos, R. C. C. Lintz, and L. A. Gachet-Barbosa. 2019. “Rubberized Mortar: The Influence of Aggregate Granulometry in Mechanical Resistances and Acoustic Behavior.” Construction and Building Materials 200:248–54. [CrossRef]
- Angelin, Andressa F., Matheus F. F. Andrade, Rodrigo Bonatti, Rosa C. Cecche Lintz, Luísa A. Gachet-Barbosa, and Wislei R. Osório. 2015. “Effects of Spheroid and Fiber-like Waste-Tire Rubbers on Interrelation of Strength-to-Porosity in Rubberized Cement and Mortars.” Construction and Building Materials 95:525–36. [CrossRef]
- Arulrajah, Arul, Alireza Mohammadinia, Farshid Maghool, and Suksun Horpibulsuk. 2019. “Tire Derived Aggregates as a Supplementary Material with Recycled Demolition Concrete for Pavement Applications.” Journal of Cleaner Production 230:129–36. [CrossRef]
- ASDReports. 2023. GLOBAL END-OF-LIFE TIRE (ELT) MANAGEMENT MARKET FORECAST 2023-2032.
- Atahan, Ali O., and Ayhan Öner Yücel. 2012. “Crumb Rubber in Concrete: Static and Dynamic Evaluation.” Construction and Building Materials 36:617–22. [CrossRef]
- Azevedo, F., F. Pacheco-Torgal, C. Jesus, J. L. Barroso de Aguiar, and A. F. Camões. 2012. “Properties and Durability of HPC with Tyre Rubber Wastes.” Construction and Building Materials 34:186–91. [CrossRef]
- Bala, Anu, and Supratic Gupta. 2021. “Thermal Resistivity, Sound Absorption and Vibration Damping of Concrete Composite Doped with Waste Tire Rubber: A Review.” Construction and Building Materials 299. [CrossRef]
- Batayneh, Malek K., Iqbal Marie, and Ibrahim Asi. 2008. “Promoting the Use of Crumb Rubber Concrete in Developing Countries.” Waste Management 28(11):2171–76. [CrossRef]
- Benazzouk, A., O. Douzane, K. Mezreb, B. Laidoudi, and M. Quéneudec. 2008. “Thermal Conductivity of Cement Composites Containing Rubber Waste Particles: Experimental Study and Modelling.” Construction and Building Materials 22(4):573–79. [CrossRef]
- Bianco, Isabella, Deborah Panepinto, and Mariachiara Zanetti. 2021. “End-of-Life Tyres: Comparative Life Cycle Assessment of Treatment Scenarios.” Applied Sciences 11(8). [CrossRef]
- Bogno, Bachirou, Paul-Salomon Ngohe Ekam, Mohammadou Sali, Dieudonné Kidmo Kaoga, Abderrezak Guenounou, and Michel Aillerie. 2023. “Waste Recovery and Sustainable Development. A Case Study of Material Development from Used Tires in Africa.” Smart Grid and Renewable Energy 14(06):107–29. [CrossRef]
- Brindley, Fraser., Emma. Mountjoy, Gavin. Mountjoy, and Council of Australian Governments. Standing Council on Environment and Water. 2012. COAG Standing Council on Environment and Water Study into Domestic and International Fate of End-of-Life Tyres: Final Report. Hyder Consulting.
- Cerema. 2011. Acceptabilité Environnementale En Technique Routière.
- Charlotte B Merlin. 2020. Life Cycle Assessment of Waste Tyre Treatments: Material Recycling vs. Coincineration in Cement Kilns.
- Consulting, Hyder. 2015. Stocks and Fate of End-of-Life Tyres - 2013-14 Study.
- Consulting, Mra. 2022. End of Life Tyre Management: Thermal Processing Options. [CrossRef]
- Correia, Sivaldo L., Tânia Partala, Felipe C. Loch, and A. M. Segadães. 2010. “Factorial Design Used to Model the Compressive Strength of Mortars Containing Recycled Rubber.” Composite Structures 92(9):2047–51. [CrossRef]
- Dabic-Miletic, Svetlana, Vladimir Simic, and Selman Karagoz. 2021. “End-of-Life Tire Management: A Critical Review.” Environmental Science and Pollution Research 68053–68.
- Dong, Minhao, Mohamed Elchalakani, Ali Karrech, Mostafa Fahmi Hassanein, Tianyu Xie, and Bo Yang. 2019. “Behaviour and Design of Rubberised Concrete Filled Steel Tubes under Combined Loading Conditions.” Thin-Walled Structures 139:24–38. [CrossRef]
- Fayez Obaid Al Mazrouei, Khaled Chaaraoui and Zaid Bdour. 2023. “Tyre Recycling in the Middle East: On the Wheels of Change.” Waste & Recycling Middle East and Africa 13(3):14–16.
- Ferronato, Navarro, and Vincenzo Torretta. 2019. “Waste Mismanagement in Developing Countries: A Review of Global Issues.” International Journal of Environmental Research and Public Health 16(6). [CrossRef]
- Forrest, Martin J. 2019. Recycling and Re-Use of Waste Rubber. De Gruyter.
- Gebreslassie, Mulualem G., Solomon T. Bahta, and Alazar S. Mihrete. 2023. “Development of Alternative Fuel for Cement Industries: The Case of Messebo Cement Factory in Ethiopia.” Waste Management Bulletin 1(3):58–70. [CrossRef]
- Gesoğlu, Mehmet, Erhan Güneyisi, Ganjeena Khoshnaw, and Süleyman İpek. 2014. “Abrasion and Freezing–Thawing Resistance of Pervious Concretes Containing Waste Rubbers.” Construction and Building Materials 73:19–24. [CrossRef]
- Grinys, Audrius, Henrikas Sivilevičius, and Mindaugas Daukšys. 2012. “Tyre Rubber Additive Effect on Concrete Mixture Strength.” Journal of Civil Engineering and Management 18(3):393–401. [CrossRef]
- Grinys, Audrius, Henrikas Sivilevičius, Darius Pupeikis, and Ernestas Ivanauskas. 2013. “FRACTURE OF CONCRETE CONTAINING CRUMB RUBBER.” Journal of Civil Engineering and Management 19(3):447–55. [CrossRef]
- Guo, Shuaicheng, Qingli Dai, Ruizhe Si, Xiao Sun, and Chao Lu. 2017. “Evaluation of Properties and Performance of Rubber-Modified Concrete for Recycling of Waste Scrap Tire.” Journal of Cleaner Production 148:681–89. [CrossRef]
- Gupta, Trilok, Ravi K. Sharma, and Sandeep Chaudhary. 2015. “Impact Resistance of Concrete Containing Waste Rubber Fiber and Silica Fume.” International Journal of Impact Engineering 83:76–87. [CrossRef]
- Han, Qing-Hua, Guang Yang, and Jie Xu. 2018. “Experimental Study on the Relationship between Acoustic Emission Energy and Fracture Energy of Crumb Rubber Concrete.” Structural Control and Health Monitoring 25(10):e2240. [CrossRef]
- Han Zhu, Norasit Thong-On, and Xiong Zhang. 2002. “Adding-Crumb-Rubber-into-Exterior-Wall-Materials.” Waste Manage & Research 20:407–13. [CrossRef]
- Herrero, S., P. Mayor, and F. Hernández-Olivares. 2013. “Influence of Proportion and Particle Size Gradation of Rubber from End-of-Life Tires on Mechanical, Thermal and Acoustic Properties of Plaster–Rubber Mortars.” Materials & Design 47:633–42. [CrossRef]
- Johannes, Hendro Putra, Michikazu Kojima, Fusanori Iwasaki, and Ellen Putri Edita. 2021. “Applying the Extended Producer Responsibility towards Plastic Waste in Asian Developing Countries for Reducing Marine Plastic Debris.” Waste Management and Research 39(5):690–702. [CrossRef]
- Kara De Maeijer, Patricia, Bart Craeye, Johan Blom, and Lieven Bervoets. 2021. “Crumb Rubber in Concrete—the Barriers for Application in the Construction Industry.” Infrastructures 6(8). [CrossRef]
- Karrech, A., V. Strazzeri, and M. Elchalakani. 2021. “Improved Thermal Insulance of Cement Stabilised Rammed Earth Embedding Lightweight Aggregates.” Construction and Building Materials 268:121075. [CrossRef]
- Khaloo, Ali R., M. Dehestani, and P. Rahmatabadi. 2008. “Mechanical Properties of Concrete Containing a High Volume of Tire–Rubber Particles.” Waste Management 28(12):2472–82. [CrossRef]
- K., Khatib Zaher, and Bayomy Fouad M. 1999. “Rubberized Portland Cement Concrete.” Journal of Materials in Civil Engineering 11(3):206–13. [CrossRef]
- Lee, Junghwoon, Tae Sup Yun, and Sung Uk Choi. 2015. “The Effect of Particle Size on Thermal Conduction in Granular Mixtures.” Materials 8(7):3975–91. [CrossRef]
- Li, Lijuan, Shenghua Ruan, and Lan Zeng. 2014. “Mechanical Properties and Constitutive Equations of Concrete Containing a Low Volume of Tire Rubber Particles.” Construction and Building Materials 70:291–308. [CrossRef]
- Liu, Feng, Guixuan Chen, Lijuan Li, and Yongchan Guo. 2012. “Study of Impact Performance of Rubber Reinforced Concrete.” Construction and Building Materials 36:604–16. [CrossRef]
- Liu, Lulu, Guojun Cai, and Xiaoyan Liu. 2020. “Investigation of Thermal Conductivity and Prediction Model of Recycled Tire Rubber-Sand Mixtures as Lightweight Backfill.” Construction and Building Materials 248. [CrossRef]
- Lv, Jing, Tianhua Zhou, Qiang Du, and Hanheng Wu. 2015. “Effects of Rubber Particles on Mechanical Properties of Lightweight Aggregate Concrete.” Construction and Building Materials 91:145–49. [CrossRef]
- Malik, Manisha, S. K. Bhattacharyya, and Sudhirkumar V. Barai. 2021. “Thermal and Mechanical Properties of Concrete and Its Constituents at Elevated Temperatures: A Review.” Construction and Building Materials 270. [CrossRef]
- Marie, Iqbal. 2016. “Zones of Weakness of Rubberized Concrete Behavior Using the UPV.” Journal of Cleaner Production 116:217–22. [CrossRef]
- Medina, Nelson Flores, Darío Flores Medina, F. Hernández-Olivares, and M. A. Navacerrada. 2017. “Mechanical and Thermal Properties of Concrete Incorporating Rubber and Fibres from Tyre Recycling.” Construction and Building Materials 144:563–73. [CrossRef]
- Nadal Gisbert, A., J. M. Gadea Borrell, F. Parres García, E. Juliá Sanchis, J. E. Crespo Amorós, J. Segura Alcaraz, and F. Salas Vicente. 2014a. “Analysis Behaviour of Static and Dynamic Properties of Ethylene-Propylene-Diene-Methylene Crumb Rubber Mortar.” Construction and Building Materials 50:671–82. [CrossRef]
- Noor Azline, M. N., A. B. Nabilah, S. Nor Azizi, and A. A. Farah Nora Aznieta. 2022. “A Comparative Investigation on Mechanical Strength of Blended Concrete with Surface Modified Rubber by Chemical and Non-Chemical Approaches.” Case Studies in Construction Materials 17. [CrossRef]
- Onuaguluchi, Obinna. 2015. “Effects of Surface Pre-Coating and Silica Fume on Crumb Rubber-Cement Matrix Interface and Cement Mortar Properties.” Journal of Cleaner Production 104:339–45. [CrossRef]
- Pneumatiques, France Recyclage. 2023. ANTICIPER PROGRESSER &.
- Qaidi, Shaker M. A., Youkhanna Zayia Dinkha, James H. Haido, Msheer Hasan Ali, and Bassam A. Tayeh. 2021. “Engineering Properties of Sustainable Green Concrete Incorporating Eco-Friendly Aggregate of Crumb Rubber: A Review.” Journal of Cleaner Production 324:129251. [CrossRef]
- Rashad, Alaa M. 2016. “A Comprehensive Overview about Recycling Rubber as Fine Aggregate Replacement in Traditional Cementitious Materials.” International Journal of Sustainable Built Environment 5(1):46–82. [CrossRef]
- RILEM. 1985. “Determination of the Fracture Energy of Mortar and Concrete by Means of Three-Point Bend Tests on Notched Beams.” Materials and Structures 18(4):287–90. [CrossRef]
- Rincón, Lídia, Julià Coma, Gabriel Pérez, Albert Castell, Dieter Boer, and Luisa F. Cabeza. 2014. “Environmental Performance of Recycled Rubber as Drainage Layer in Extensive Green Roofs. A Comparative Life Cycle Assessment.” Building and Environment 74:22–30. [CrossRef]
- Salman Zafar. 2022. “Disposal of Waste Tires. Https://Www.Ecomena.Org/Methods-for-Tire-Recycling/.
- SEREP. 2022. Research Report: Assessment of End-of-Life Tyres in the Pacific.
- Shanley Authors Matt Genever Kyle, Karl O., Farrell Paul Randell John Rebbechi, and Roadcor -. 2017. National Market Development Strategy for Used Tyres Final Strategy Client Client Contact.
- Siddique, Rafat, and Tarun R. Naik. 2004. “Properties of Concrete Containing Scrap-Tire Rubber – an Overview.” Waste Management 24(6):563–69. [CrossRef]
- da Silva, Fabiana Maria, Luisa Andréia Gachet Barbosa, Rosa Cristina Cecche Lintz, and Ana Elisabete P. G. A. Jacintho. 2015. “Investigation on the Properties of Concrete Tactile Paving Blocks Made with Recycled Tire Rubber.” Construction and Building Materials 91:71–79. [CrossRef]
- Strazzeri, V., A. Karrech, and M. Elchalakani. 2020. “Micromechanics Modelling of Cement Stabilised Rammed Earth.” Mechanics of Materials 148:103540. [CrossRef]
- Su, Haolin, Jian Yang, Tung-Chai Ling, Gurmel S. Ghataora, and Samir Dirar. 2015. “Properties of Concrete Prepared with Waste Tyre Rubber Particles of Uniform and Varying Sizes.” Journal of Cleaner Production 91:288–96. [CrossRef]
- Sukontasukkul, Piti, and Koshi Tiamlom. 2012. “Expansion under Water and Drying Shrinkage of Rubberized Concrete Mixed with Crumb Rubber with Different Size.” Construction and Building Materials 29:520–26. [CrossRef]
- Surehali, Sahil, Avishreshth Singh, and Krishna Prapoorna Biligiri. 2023. “A State-of-the-Art Review on Recycling Rubber in Concrete: Sustainability Aspects, Specialty Mixtures, and Treatment Methods.” Developments in the Built Environment 14. [CrossRef]
- Thomas, Blessen Skariah, and Ramesh Chandra Gupta. 2016. “Properties of High Strength Concrete Containing Scrap Tire Rubber.” Journal of Cleaner Production 113:86–92. [CrossRef]
- Thomas, Blessen Skariah, and Ramesh Chandra Gupta. 2016. “A Comprehensive Review on the Applications of Waste Tire Rubber in Cement Concrete.” Renewable and Sustainable Energy Reviews 54:1323–33. [CrossRef]
- Thomas, Blessen Skariah, Ramesh Chandra Gupta, and Vinu John Panicker. 2016. “Recycling of Waste Tire Rubber as Aggregate in Concrete: Durability-Related Performance.” Journal of Cleaner Production 112:504–13. [CrossRef]
- Turatsinze, A., S. Bonnet, and J. L. Granju. 2005. “Mechanical Characterisation of Cement-Based Mortar Incorporating Rubber Aggregates from Recycled Worn Tyres.” Building and Environment 40(2):221–26. [CrossRef]
- Turatsinze, A., and M. Garros. 2008. “On the Modulus of Elasticity and Strain Capacity of Self-Compacting Concrete Incorporating Rubber Aggregates.” Resources, Conservation and Recycling 52(10):1209–15. [CrossRef]
- Turgut, Paki, and Bulent Yesilata. 2008. “Physico-Mechanical and Thermal Performances of Newly Developed Rubber-Added Bricks.” Energy and Buildings 40(5):679–88. [CrossRef]
- Turki, M., E. Bretagne, M. J. Rouis, and M. Quéneudec. 2009a. “Microstructure, Physical and Mechanical Properties of Mortar–Rubber Aggregates Mixtures.” Construction and Building Materials 23(7):2715–22. [CrossRef]
- Turki, M., I. Ben Naceur, M. Makni, J. Rouis, and K. Saï. 2008a. “Mechanical and Damage Behaviour of Mortar–Rubber Aggregates Mixtures: Experiments and Simulations.” Materials and Structures 42(10):1313. [CrossRef]
- Tyre Stewardship Australia (TSA). 2021. AUSTRALIAN TYRE CONSUMPTION AND RECOVERY.
- Tyre Stewardship Australia (TSA). 2022. Domestic and International Markets for Used Tyres and Tyre-Derived Products TSA Levy-Paying Tyre Importers and Autobrands.
- UNEP. 2018. AfricA Waste Management.
- Uygunoğlu, Tayfun, and İlker Bekir Topçu. 2010. “The Role of Scrap Rubber Particles on the Drying Shrinkage and Mechanical Properties of Self-Consolidating Mortars.” Construction and Building Materials 24(7):1141–50. [CrossRef]
- Valentini, Francesco, and Alessandro Pegoretti. 2022. “End-of-Life Options of Tyres. A Review.” Advanced Industrial and Engineering Polymer Research 5(4):203–13. [CrossRef]
- Venice GRAF, Sarah PÉRENNÈS, Louise ROUQUETTE, and Thomas GRANDIN. 2022. Pneumatiques – Rapport Annuel – Données 2021.
- WBCSD. 2019. Global ELT Management-A Global State of Knowledge on Regulation, Management Systems, Impacts of Recovery and Technologies.
- WBCSD. 2021. End-of-Life Tire (ELT) Management Toolkit End-of-Life Tire Management Toolkit 2.
- Xiao, Yang, Bowen Nan, and John S. McCartney. 2019. “Thermal Conductivity of Sand–Tire Shred Mixtures.” Journal of Geotechnical and Geoenvironmental Engineering 145(11). [CrossRef]
- Yang, Yu Ling, Tao Zhang, Krishna R. Reddy, Jiang Shan Li, and Song yu Liu. 2022. “Thermal Conductivity of Scrap Tire Rubber-Sand Composite as Insulating Material: Experimental Investigation and Predictive Modeling.” Construction and Building Materials 332. [CrossRef]
- Zakeremamreza, Amin, Mohammad E. Kianifar, Chidera Chibuisi, Ehsan Ahmadi, and Mohammad R. Salami. 2023. “A High-Performance Rubberised Alkali-Activated Mortar for Repair of RC Beams.” Construction and Building Materials 400. [CrossRef]

| Passenger & motorbike | Truck & bus | Off-the-road | Total | |||
| 2009-2010 | ||||||
| Consumption of new tires | 168901 | 156095 | 173382 | 498377 | ||
| Generation of waste tyres | 105581 | 117391 | 164775 | 387747 | ||
| Recovery / Reuse of waste tyres | 79060 | 43476 | 9568.416 | 132104 | ||
| Waste tyres recovery rate | 0.75 | 0.37 | 0.06 | 0.34 | ||
| 2013-2014 | ||||||
| Consumption of new tires | 154518 | 183682 | 198887 | 537087 | ||
| Generation of waste tyres | 122686 | 127369 | 158276 | 408331 | ||
| Recovery / Reuse of waste tyres | 88335 | 53430 | 12299 | 154064 | ||
| Waste tyres recovery rate | 0.72 | 0.42 | 0.08 | 0.38 | ||
| 2018-2019 | ||||||
| Consumption of new tires | 223000 | 195000 | 127000 | 545000 | ||
| Generation of waste tyres | 188000 | 156000 | 119000 | 463000 | ||
| Recovery / Reuse of waste tyres | 167320 | 138840 | 13090 | 319250 | ||
| Waste tyres recovery rate | 0.89 | 0.89 | 0.11 | 0.69 | ||
| 2019-2020 | ||||||
| Consumption of new tires | 226000 | 197000 | 128000 | 551000 | ||
| Generation of waste tyres | 185000 | 152000 | 113000 | 450000 | ||
| Recovery / Reuse of waste tyres | 164650 | 136800 | 15820 | 317270 | ||
| Waste tyres recovery rate | 0.89 | 0.90 | 0.14 | 0.71 | ||
| 2021-2022 | ||||||
| Consumption of new tires | 227600 | 194400 | 141000 | 563000 | ||
| Generation of waste tyres | 187600 | 157800 | 113600 | 459000 | ||
| Recovery / Reuse of waste tyres | 169800 | 146300 | 14200 | 330300 | ||
| Waste tyres recovery rate | 0.91 | 0.93 | 0.13 | 0.72 | ||
| Materials | Size (mm) | ρrd (g/cm3) | WA24h (%) | |
|---|---|---|---|---|
| Natural sand (NS) | 0.063-5 | 2.58 ± 0.02 | 0.98 ± 0.1 | 1.2 |
| Crumb rubber (CR) | 0.5-5 | 0.91 ± 0.01 | 0.2± 0.1 |
| Element | Concentration mesurée en mg/l | Limit values associated with level 2 environmental characterization (Cerema 2011) |
|---|---|---|
| Ba | 0.007 | 0.5 |
| Cr | 0 | 2 |
| Mo | 0 | 2.8 |
| Ni | 0.001 | 0.8 |
| Cu | 0.002 | 50 |
| Zn | 0.203 | 50 |
| Cd | 0 | 0.16 |
| Hg | 0.006 | 0.04 |
| Pb | 0 | 0.5 |
| Sb | 0 | 0.2 |
| As | 0 | 0.5 |
| Se | 0.007 | 0.4 |
| Constitutions (Kg/m3) | MCR-0% | MCR-10% | MCR-25% | MCR-50% | MCR-60% | MCR-75% | MCR-100% |
|---|---|---|---|---|---|---|---|
| Cement | 400 | 400 | 400 | 400 | 400 | 400 | 400 |
| Water | 219 | 219 | 219 | 219 | 219 | 219 | 219 |
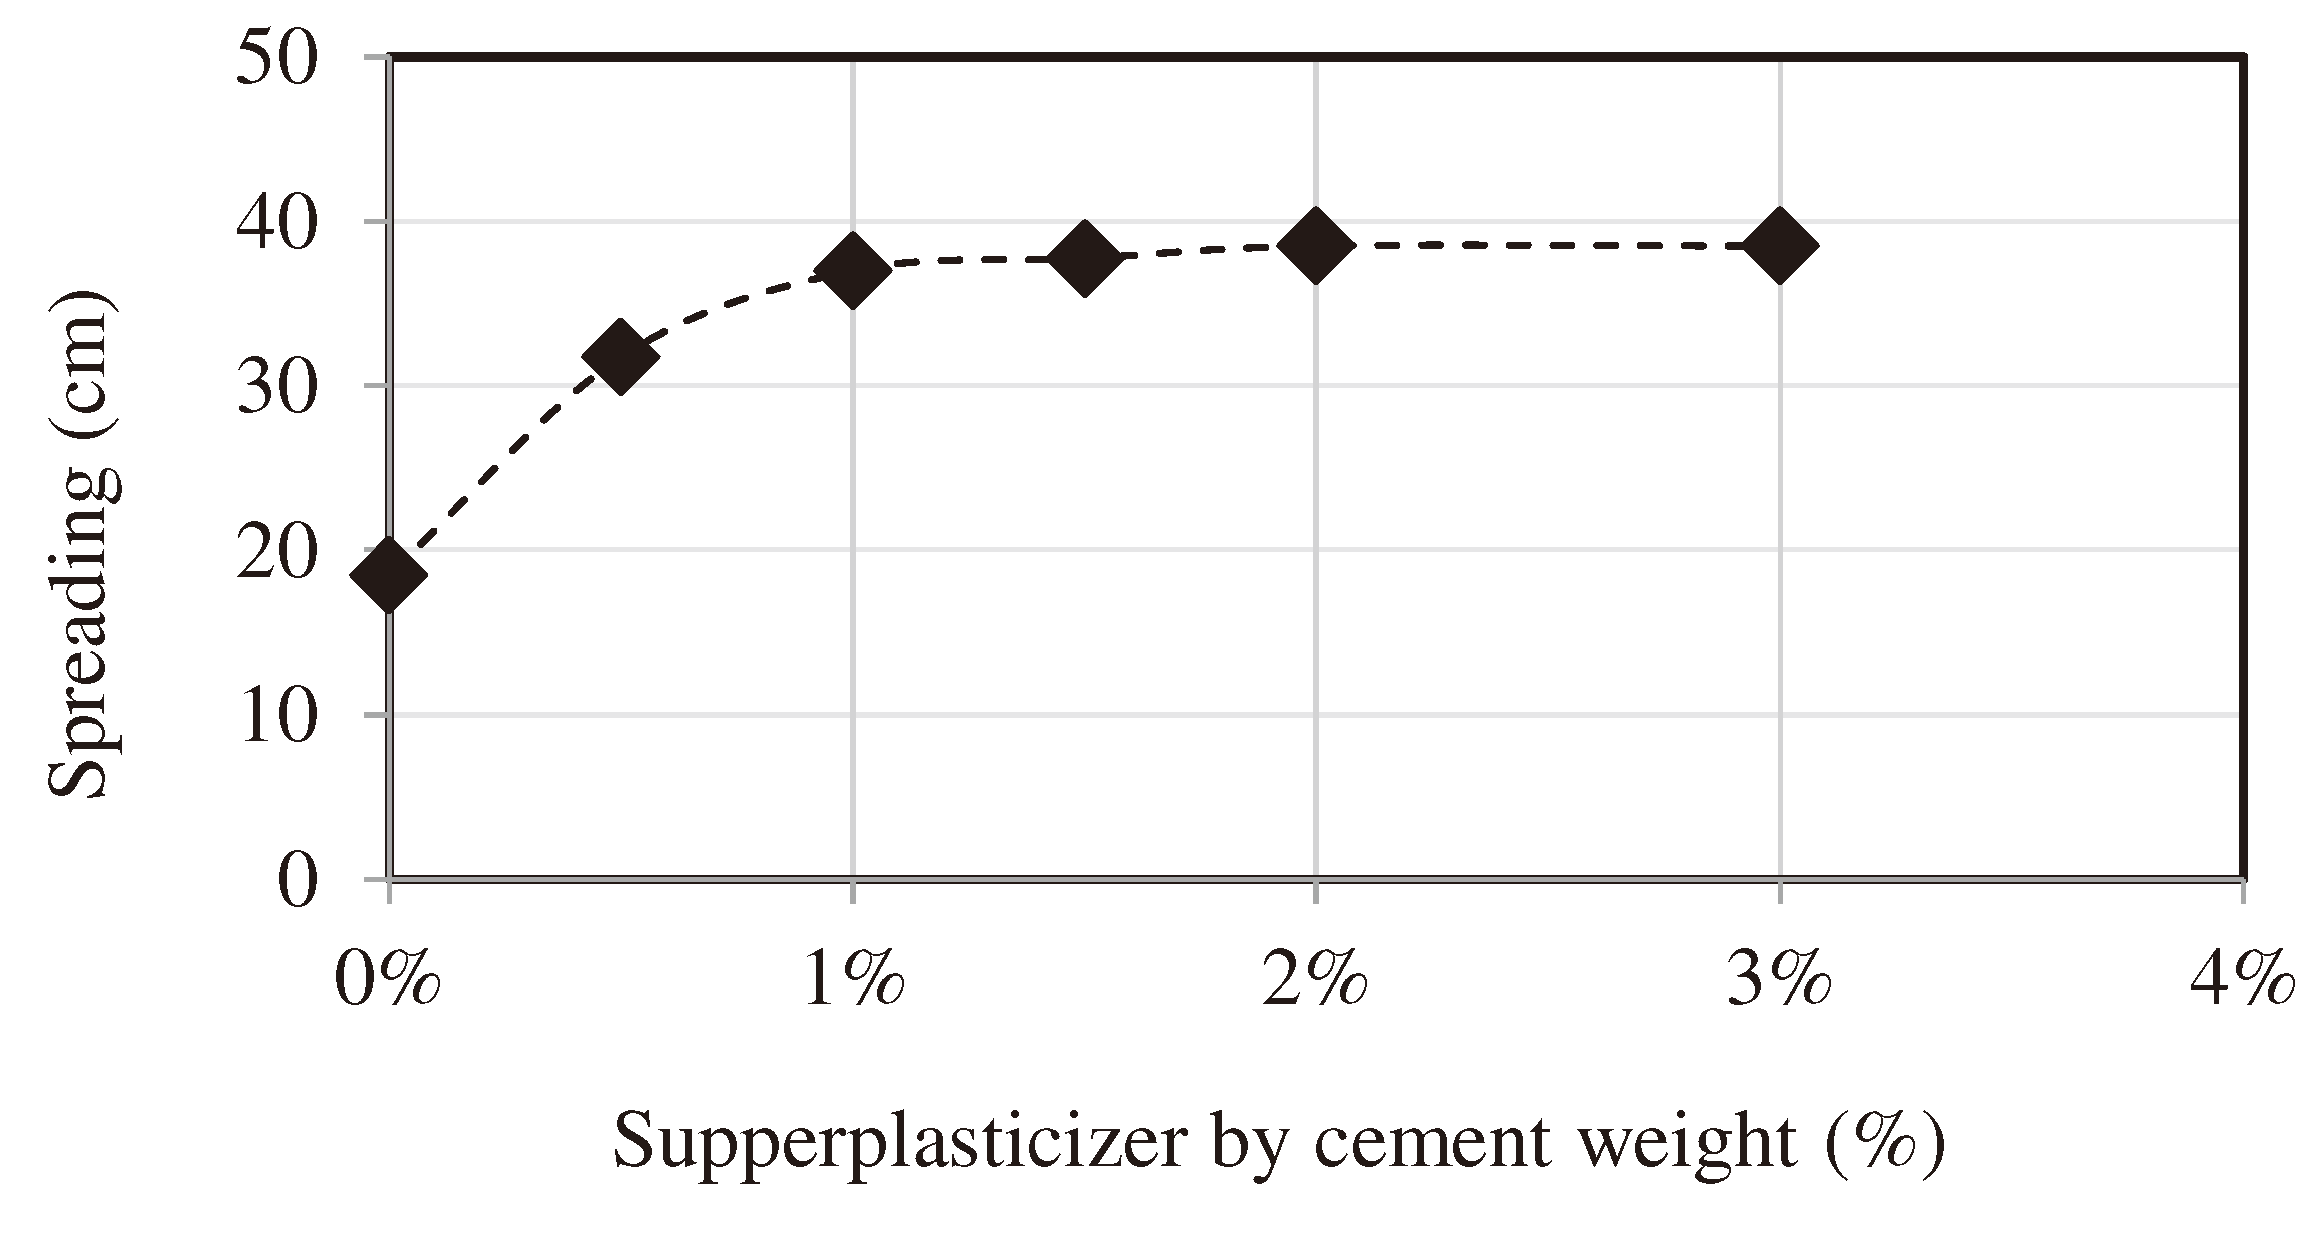
| Superplasticizer | 6 | 6 | 6 | 6 | 6 | 6 | 6 |
| Limestone filler | 300 | 300 | 300 | 300 | 300 | 300 | 300 |
| Natural Sand (NS) | 1328 | 1163 | 939 | 585 | 445 | 233 | 0 |
| Crumb Rubber (CR) | 0 | 47 | 117 | 234 | 281 | 351 | 427 |
| Theoretical density | 2253 | 2135 | 1980 | 1744 | 1651 | 1509 | 1352 |
| W/C | 0.55 | 0.55 | 0.55 | 0.55 | 0.55 | 0.55 | 0.55 |
| W/B | 0.31 | 0.31 | 0.31 | 0.31 | 0.31 | 0.31 | 0.31 |
| rv (%) | 0 | 10 | 25 | 50 | 60 | 75 | 100 |
| Density (Kg/m3) | 2241 ± 5 | 2121 ± 2 | 2030 ±1 2 | 1815 ± 17 | 1763 ± 16 | 1692± 8 | 1447 ± 6 |
| Air content “a (%)” |
Disclaimer/Publisher’s Note: The statements, opinions and data contained in all publications are solely those of the individual author(s) and contributor(s) and not of MDPI and/or the editor(s). MDPI and/or the editor(s) disclaim responsibility for any injury to people or property resulting from any ideas, methods, instructions or products referred to in the content. |
© 2024 by the authors. Licensee MDPI, Basel, Switzerland. This article is an open access article distributed under the terms and conditions of the Creative Commons Attribution (CC BY) license (http://creativecommons.org/licenses/by/4.0/).


