Submitted:
17 January 2024
Posted:
18 January 2024
You are already at the latest version
Abstract
In the present study, hypereutectic Al-Si alloy compacts and Al-Si/B4C composites were produced by conventional, microwave and spark plasma sintering techniques. The effects of sintering techniques and B4C particle addition on microstructural properties, density, hardness and electrical conductivity were investigated. The microstructures were examined with an optical microscope. Densities were measured using the Archimedes technique. Electrical resistance measurements were made with the four-point probe measurement technique. Elemental Al grains, master alloy grains and primary Si particles were determined in the microstructures of all samples. The addition of 15 wt% B4C caused the porosity rate to increase in the samples. Samples produced with SPS technique gave ≈80% higher hardness values than samples produced with CS and MWS. Compared to the samples produced with CS and MWS, the samples produced with SPS gave higher electrical conductivity values. Electrical conductivities were decreased as the weight percentage of B4C increased in all samples.
Keywords:
sintering
; electrical conductivity
; composite
; Al alloy
; microstructures
1. Introduction
Composite materials, whose most important advantages are light weight and high mechanical properties, are used in aerospace, military, automobiles, etc. They are advanced engineering materials are widely used in industries [1,2,3,4,5,6,7]. The high specific strength of composite materials has increased the interest in composite materials [8,9,10,11]. Composites with high specific strength can be produced, especially using aluminum alloys as matrix materials. Hypereutectic Al-Si alloys have been preferred as matrix materials in recent years due to their properties such as high wear resistance and high strength [12,13,14,15].
Composite materials are produced with different powder metallurgy (P/M) techniques. P/M technique in general; The process consists of powder production, mixing of the produced powders, pressing and sintering of the powders. Cold pressing and sintering are the most general known P/M techniques [16,17]. Sintering is a heat treatment process that causes particles to bond together, resulting in high density, increased strength and improved properties [18,19,20]. Research on composite material production has focused on sintering techniques that save energy and time in recent years. Microwave sintering (MWS), spark plasma sintering (SPS), laser sintering and induction sintering are energy and time-saving sintering techniques [9,21,22].
With suitable matrix materials and reinforcement elements, end-product composite materials that can meet specific needs at a high rate can be designed and produced [13,23]. While composite material production produces materials with high specific strength, the electrical conductivity of the matrix material is compromised. Electrical conductivity provides a lot of information about the chemical purity and mechanical properties of the material. Electrical conductivity helps predict other properties, such as thermal conductivity, that are more difficult to determine [23,24]. Electrical conductivity is very sensitive to the microstructure of metallic materials. While alloying element atoms, crystal structure defects and reinforcing ceramic particles increase the mechanical strength of metals, they negatively affect electrical conductivity [23,24,25].
If composites with high mechanical properties can be produced without compromising electrical conductivity and/or with minimal compromise, materials with high specific strength and good electrical conductivity that will meet performance expectations can be obtained. In this study; The effects of different sintering techniques and B4C particle addition on microstructural properties, density, hardness and electrical conductivity were investigated. Due to their remarkable properties, hypereutectic Al-Si alloy powders were chosen as matrix materials. Boron carbide particles in the B4C composition were used as strengtheners. Hypereutectic Al/Si alloy compacts and Al-Si/B4C composites were produced using conventional sintering (CS), MWS and SPS techniques. The advantages of SPS and MWS techniques, which are fast sintering techniques, over CS and the effects of wt% B4C ratio on microstructure, density, hardness and electrical conductivity are discussed.
2. Materials and Methods
2.1. Material
In this experimental study, hypereutectic Al-Si compacts and 5-15 wt% B4C reinforced hypereutectic Al-Si matrix composites were produced by CS, MWS and SPS techniques. Hypereutectic Al-Si powders with the trade name Alumix® 231 (ECKA Granulate Velden GmbH) were used as matrix material. The average sizes (D50) of Alumix® 231 powders and B4C particles are ~75μm and ~10μm, respectively. The chemical composition and recommended pressing-sintering conditions of Alumix® 231 are given in Table 1.
2.2. Method
For the production of particle reinforced composite materials, 5 and 15% B4C by weight was added to Alümix® 231 powders. The prepared powder mixtures were mixed in a three-axis mixer for 45 min. Powders prepared for CS and MWS processes were cold pressed by applying 620 MPa pressure with a 200 tons capacity a unidirectional hydraulic press. The lubricant eliminate process was applied to the pressed samples and those prepared for SPS. This process was completed by holding time for 20 min at 400 °C.
CS process was carried out using a tube furnace in N2 atmosphere, at a heating rate of 5 °C.min-1 and at a temperature of 555 °C. The holding time at the sintering temperature was 60 min and the samples were cooled in air. MWS process was carried out in a Synotherm brand atmosphere-protected laboratory type microwave oven with a heating rate of 10 °C.min-1. The samples were sintered at a sintering temperature of 555 °C and holded for 15 min at this temperature. In studies conducted on Alumix® 231, it was stated that the sintered density increased with increasing sintering temperature up to 560 °C. It has been stated that sintering at temperatures above 560 °C causes loss of density. They attributed the decrease in sintered density to the increasing liquid phase volume, the liquid phase regions coalescing to form large pools, and these liquid pools forming pores during cooling [26,27,28]. Therefore, the sintering temperature of 555 °C was chosen for CS and MWS processes.
For SPS, 25 g of powder was charged into the mold and a preload of 1 MPa was applied. The powders were sintered at 450 °C for 5 min by applying 50 MPa pressing pressure. The SPS process was carried out in a vacuum environment at a heating rate of 100 °C.min-1. Table 2 illustrates the specimen notations of the samples.
For microstructural analysis, the samples were subjected to standard metallographic grinding processes. Keller's was used for etching the samples. The microstructures of the prepared samples were imaged and analyzed with an optical microscope.
The densities of the sintered samples were measured by the Archimedes technique in accordance with the ASTM B962-08 standard. Densities are reported as relative density in proportion to the theoretical density value. Theoretical density was calculated according to the mixture rule using the material composition.
Macro hardness tests of the samples were performed using the Brinell hardness method (Emcotest Duravision). Hardness measurements were performed with a load of 31.5 kgf and a hardened steel indenter ball with a diameter of 2.5 mm. Ten measurements were carried out on each sample. The arithmetic averages of the measurement results were used.
Electrical resistance measurements were made at room temperature (300 K) to determine the electrical conductivity of the samples. Electrical resistance measurements were carried out with the four-point probe measurement technique. The four-point probe technique is a method used for low-level DC resistance measurement. It has high precision and contains less measurement error. In this technique, two probes are used to apply current to the material, and the other two probes are used to measure the voltage on the material. Measurements were made with a Keithley 2450 SourceMeter brand/model measuring device. Data were analyzed with Kickstart software version 2.10.1. Six current (I) and voltage (V) measurements were taken from each sample. The arithmetic averages of the data obtained were calculated. Then, resistivity (ρ) and conductivity (σ) values were calculated for each sample, respectively, using equation 1 and equation 2.
3. Results and Discussion
3.1. Material and Microstructure Characterization
Hypereutectic Al-Si powders, which lubricant eliminated and hypereutectic Al-Si/B4C composite powders with 5-15 wt% B4C added were cold pressed in unidirectionally with 620 MPa pressure. Cold pressed samples were sintered with CS and MWS techniques. In addition, hypereutectic Al-Si and Al-Si/B4C mixture powders, subjected to lubricant eliminate, were sintered with spark plasma technique and compact samples were produced. Figure 1 shows the optical microscope micrograph of green Alumix® 231. Alumix® 231 is a P/M powder consisting of a mixture of elemental aluminum and original master alloy (Al-Si-Cu-Mg) powders. The light colored areas seen in the micrograph in Figure 1 are grains formed by elemental Al powders containing low amounts of Si, Cu and Mg. The dark regions containing grayish coarse particles and fine white shiny particles are the original master alloy consisting of Al-Si-Cu-Mg composition. It is stated in the literature that grayish coarse particles are primary Si particles, and fine white shiny particles are Cu-rich secondary phases [4,14,29]. It has been stated in the literature that structures rich in Cu content have θ (CuAl2) and γ (Al2CuMg) secondary phases, and that the Mg element exists as the β (Mg2Si) secondary phase in the microstructure [10,26,30,31,32].
Optical micrographs of the samples are given in Figure 2. It was determined from the micrographs that elemental Al grains, master alloy grains and primary Si particles were formed in the microstructures of all samples, depending on the matrix material.
CS and MWS samples gave porosity values close to each other. The porosity rates of CS-555/60, 5-CS-555/60 and 15-CS-555/60 samples were calculated as 11.95%, 12.88% and 15.29%, respectively. The porosity rates of MWS-555/15, 5-MWS-555/15 and 15-MWS-555/15 samples were calculated as 13.7%, 13.81 and 15.06%, respectively. The advantage of the MWS technique over the CS technique is that the heating rate is high, the holding time is short and energy saving is achieved. However, approximately 12% more porosity was determined in the microstructure of the compacts produced from pure Alumix® 231 with the MWS (MWS-555/15) technique compared to the sample produced with the CS (CS-555/60) technique.
In the MWS process, the holding time at the sintering temperature was very short, causing a lack of coalescence between the grains and causing more porosity in the MWS-555/15 sample. The addition of 5 wt%
B4C did not cause a significant change in the porosity ratio of the samples produced by CS and MWS techniques. Porosity rates of 11.95% and 13.7% were determined in the microstructures of CS-555/60 and MWS-555/15 samples.
The pores formed in the microstructure after sintering the mixture powders prepared with the addition of 5 wt% B4C by CS or MWS techniques are the places where B4Cs are located. In other words, B4C particles added to Alumix® 231 as a strengthener are located within the pores in the microstructure. Therefore, adding 5 wt% B4C did not cause a significant change in the porosity rate. The addition of 15 wt% B4C caused an increase in the porosity rate in the samples. The porosity rates of the samples produced by sintering the mixture powders prepared by adding 15 wt% B4C with CS and MWS increased by ≈27% and ≈10%, respectively. The high surface tension of B4Cs settled between elemental Al and/or master Al grains seen in Alumix® 231 micrographs caused porosity in these regions.
The samples with the lowest porosity rate are the samples produced with SPS (Figure 2). Porosity rates in SPS-450/5, 5-SPS-450/5 and 15-SPS-450/5 samples were calculated as 1.54%, 2.79% and 4.81%, respectively. SPS is a pressure sintering technique. In this study, the SPS process was carried out at 450 °C, 50 MPa pressure and 5 min sintering time. In SPS, sparks formed at the contact points or gaps between the powders charged to the mold cause instantaneous regional high temperatures and therefore evaporation and melting on the surfaces of the powder grains. The pressure applied during sintering eliminates and/or minimizes microspaces between powder grains and/or B4C clusters [22,33,34].
When the micrographs of the SPS-450/5, 5-SPS-450/5 and 15-SPS-450/5 samples given in Figure 2 are examined, it is seen that the amount of porosity is quite low and the existing pore size is smaller than other sintering techniques. The pores in the microstructure of the 15-SPS-450/5 sample have larger sizes than other SPS samples. The agglomeration of B4C particles can be said to be the reason for the formation of large pores. The increase in porosity with the addition of 15 wt% B4C is attributed to the incompatibility between the matrix grains and B4C particles and the lack of a continuous and effective interface [22,35].
3.2. Density and Hardness
Sample densities were measured by the Archimedes technique according to ASTM B962-08 standard. Densities are reported as relative density. The hardness values of the samples were measured in Brinell hardness type. The density and hardness of the samples are given in Figure 3. In the samples produced with different sintering techniques, with the addition of B4C particles, an increase in porosity was determined, as seen in Fig. 2, and a decrease in density, as seen in Fig. 3. This decrease in densities is attributed to the pores between the matrix powder grains and B4C and/or B4C particles [10,22,35]. 5 wt% B4C added to the samples did not cause a significant decrease in density. In the samples to which 5 wt% B4C was added, the highest density decrease was determined in the SPS sample, with a decrease of approximately 1.26%. The pores that exist in the microstructure of pure Alumix® 231 samples produced with the CS and MWS technique provide the spaces where B4C particles will be positioned. However, the porosity rate in the pure Alumix® 231 sample produced with the SPS technique is approximately 1.5%, and the addition of 5 wt% B4C caused more porosity in this sample than the CS and MWS coded samples. If the micrographs in Figure 2 are examined; In samples with B4C particle addition, it will be seen that the size and volume ratio of the pores formed between the particle/matrix increases with the increasing B4C particle ratio. When the density values of samples produced with different sintering techniques are compared, it can be seen in Figure 3 that the samples produced with SPS give the highest density values. Densities over 95% were obtained in samples produced with SPS. Samples produced with CS and MWS techniques gave similar density values.
When the hardness data in Figure 3 is examined, CS and MWS samples gave hardness values that are close to each other and have similar tendencies, in line with the density data. In these samples, adding 5 wt% B4C did not cause a significant change in hardness. Although the added hard B4C ceramic particles were expected to increase the hardness, the presence of these particles in the pores in the microstructure caused a low increase of 7.5% in the hardness of the sample coded 5-CS-555/60. No change was observed in the hardness of the sample coded 5-MWS-555/15. Due to the increase in pore sizes and volume ratio caused by adding 15 wt% B4C, the hardness of the samples coded 15-CS-555/60 and 15-MWS-555/15 decreased by 17% and 25%, respectively. The fact that samples produced with CS and MWS techniques give hardness and density values close to each other is an important advantage offered by MWS samples produced by holding 15 min at high heating rate and sintering temperature in terms of time and energy saving. Samples produced with SPS technique gave ≈80% higher hardness values than samples produced with CS and MWS.
Since high density samples can be produced with the SPS technique, the addition of 5 wt% B4C caused a ≈5 increase in hardness and the addition of 15 wt % B4C caused a ≈3.5 decrease in hardness compared to the sample coded SPS-450/5. The decrease in hardness in the sample coded 15-SPS-450/5 is related to the correlation between the pore volume ratio and size and the hardness of B4C particles. Ozer et al. [22,35] stated that the increase in pore size and/or pore amount with the addition of B4C caused this decrease in hardness.
3.3. Electrical conductivity
I-V measurements of the samples were made at room temperature (300 K). The electrical conductivity values of the samples are given as % IACS (International Annealed Copper Standard) in Figure 4. The electrical resistance (ρ) and electrical conductivity (σ) of the samples were calculated using equations (1) and (2). Electrical conductivity data calculated as Sm-1 was converted to % IACS. Samples produced with SPS exhibited higher electrical conductivity than samples produced with CS and MWS (Fig. 4). The reason for the higher electrical conductivity in samples produced with SPS is the high density and low porosity. Samples produced with CS and MWS gave similar electrical conductivity values due to the close porosity ratio. Porosity in samples produced with MWS is approximately 2% higher than CS coded samples, and electrical conductivity is approximately 4% poorer. Electrical conductivities decreased as the weight percentage of B4C increased in all samples. The fact that B4C is a semiconductor and the porosity it causes in the microstructure can be said to be the reason for this decrease in electrical conductivity [23].
The decrease in electrical conductivity is lower in SPS coded samples. Since the porosity rate caused by B4C in the microstructure is less, the decrease in electrical conductivity in these samples was limited to ≈4.7%. The decrease in electrical conductivity with the addition of B4C is approximately 11.7%, 61.7%, 26% and 71% respectively, in samples coded 5-CS-555/60, 15-CS-555/60, 5-MWS-555/15 and 15-MWS-555/15.
In general, the electrical conductivity of pure metals tends to decrease when mixed with other elements [36]. With increasing B4C weight percentage, the proportion of voids formed at the particle/matrix interface and between semiconductor B4C particles also increases. These holes serve as electron scattering sources and reduce the speed and free path length of electrons [23,37]. In addition, the energy of electrons colliding with B4C particles decreases due to their scattering. The increase in the number of B4C particles per unit volume makes these effects evident [23].
It can be said that this is another reason for the decrease in electrical conductivity in composites containing 15 wt% B4C. All these negative effects caused by the increase in the weight percentage of B4C in the matrix caused the electrical conductivity of the samples to decrease. Electrons move by colliding with crystal defects and secondary phases (particles) in the microstructure. These collisions negatively affect the mobility of electrons. As a result, electron drift speed and electrical conductivity decrease.
4. Conclusions
The results of this experimental study are summarized below.
- Depending on the matrix material, the microstructures of all samples consist of elemental Al grains, master alloy grains and primary Si particles. CS and MWS samples gave porosity values close to each other. The superiority of the MWS technique over the CS technique is its high heating rate, short holding time and energy saving.
- The addition of 5 wt% B4C did not cause a significant change in the porosity ratio of the samples produced by CS and MWS techniques. The addition of 15 wt% B4C caused the porosity rate to increase in the samples. The samples with the lowest porosity rate, in other words, the samples with the highest density, are the samples produced with SPS. Densities over 95% were obtained in samples produced with SPS. Samples produced with CS and MWS techniques gave similar density values.
- The addition of 5 wt% B4C added to the samples did not cause a significant decrease in density. Compared to pure Alumix® 231 compacts, the highest density decrease was determined in the SPS sample with approximately 1.26% in the samples with 5 wt% B4C added.
- CS and MWS samples gave hardness values that were close to each other and had similar tendencies. The addition of 5 wt% B4C did not cause a significant change in hardness. The addition of 15 wt% B4C caused a 17% and 25% decrease in the hardness of the samples produced with CS and MWS, respectively. Samples produced with SPS technique gave ≈80% higher hardness values than samples produced with CS and MWS.
- Samples produced with SPS gave higher electrical conductivity values than samples produced with CS and MWS. Samples produced with CS and MWS gave similar electrical conductivity values due to the close porosity ratio. Porosity in samples produced with MWS is approximately 2% higher than CS coded samples, and electrical conductivity is approximately 4% lower. Electrical conductivities decreased as the weight percentage of B4C increased in all samples.
- P/M samples produced with the SPS technique exhibited better microstructures than MWS and CS samples. Therefore, SPS samples provided very good data in terms of density, hardness and electrical conductivity. MWS and CS samples gave close values in terms of density, hardness and electrical conductivity. Therefore, the fact that the sintering temperature and holding time parameters in the SPS technique are much lower than in the MWS and CS techniques offers significant advantages in terms of energy and time savings. The MWS technique is also superior to the CS technique when the same parameters are taken into account.
Institutional Review Board Statement
Not applicable.
Informed Consent Statement
Not applicable.
Data Availability Statement
All data are provided in the article.
Conflicts of Interest
The authors declare no conflicts of interest.
References
- Khanna, V.; Kumar, V.; Bansal, S.A. Mechanical properties of aluminium-graphene/carbon nanotubes (CNTs) metal matrix composites: Advancement, opportunities and perspective. Mater. Res. Bull. 2021, 138, 111224. [Google Scholar] [CrossRef]
- Puchy, V.; Podobova, M.; Dzunda, R.; Hvizdos, P.; Velgosova, O.; Besterci, M.; Ballokova, B. Graphene nanoplatelets reinforced aluminum alloy matrix composites produced by spark plasma sintering. Kovove Mater. 2021, 59, 237–244. [Google Scholar] [CrossRef]
- Mosher, W.G.E.; Kipouros, G.J.; Caley, W.F.; Donaldson, I.W.; Bishop, D.P. On hot deformation of aluminium–silicon powder metallurgy alloys. Powder Met. 2011, 54, 366–375. [Google Scholar] [CrossRef]
- Zeng, J.; Zhu, C.; Wang, W.; Li, X.; Li, H. Evolution of primary Si phase, surface roughness and mechanical properties of hypereutectic Al-Si alloys with different Si contents and cooling rates. Phil. Mag. Lett. 2020, 100, 581–587. [Google Scholar] [CrossRef]
- Kumar, D.; Phanden, R.K.; Thakur, L. A review on environment friendly and lightweight magnesium-based metal matrix composites and alloys Mater. Today-Proc. 2021, 38, 359–364. [Google Scholar] [CrossRef]
- Altuntaş, G.; Altuntaş, O.; Bostan, B. Characterization of Al-7075/T651 alloy by RRA heat treatment and different pre-deformation effects. T. Indian I. Metals, 2021, 74, 3025–3033. [Google Scholar] [CrossRef]
- Altuntaş, G.; Bostan, B. Metallurgical characterization of natural aging effects on pre-deformed Al 7075/T651 alloy during retrogression and re-aging heat treatment. Kov. Mater. 2022, 60, 209–222. [Google Scholar] [CrossRef]
- Kareem, E.; Kudeiri, C.E.; Asarudheen, A.; Thanveer, A.; Ziout, A. A review on AA 6061 metal matrix composites produced by stir casting. Materials. 2021, 14, 175. [Google Scholar] [CrossRef]
- Ahamad, N.; Mohammad, A.; Rinawa, M.L.; Sadasivuni, K.K.; Gupta, P. Correlation of structural and mechanical properties for Al-Al2O3-SiC hybrid metal matrix composites. J. Compos. Mater. 2021, 55, 3267–3280. [Google Scholar] [CrossRef]
- Ozer, M.; Aydogan, S.I.; Cinici, H.; Ozer, A. Effects of sintering techniques and parameters on microstructure and mechanical properties of Al-15Si-2,5Cu-0.5Mg compacts and Al-15Si-2,5Cu-0.5Mg/B4C composites. Mater. Today Commun. 2022, 30, 103192. [Google Scholar] [CrossRef]
- Altuntaş, G.; Özdemir, A.T.; Bostan, B. A survey of the effect of cryogenic treatment and natural ageing on structural changes and second-phase precipitation in Al–Zn–Mg–Cu alloy. J. Therm. Anal. Calorim. 2023, 148, 10713–10725. [Google Scholar] [CrossRef]
- Kang, N.; El Mansori, M. A new insight on induced-tribological behaviour of hypereutectic Al-Si alloys manufactured by selective laser melting. Tribol. International. 2020, 149, 105751. [Google Scholar] [CrossRef]
- Damavandi, E.; Nourouzi, S.; Rabiee, S.M.; Jamaati, R.; Tiamiyu, A.A.; Szpunar, J.A. Effects of prior ECAP process on the dynamic impact behaviors of hypereutectic Al-Si alloy. Mat Sci Eng A-Struct. 2020, 793, 139902. [Google Scholar] [CrossRef]
- Faraji, M. A new approach in numerical modeling of inoculation of primary silicon in a hypereutectic Al-Si alloy. Metall. Mater. Trans. B. 2021, 52, 778–791. [Google Scholar] [CrossRef]
- Saravanana, T.T.; Kamaraj, M.; Sharma, S.C.; Anoop, S.; Manwatkar, S.K.; Ravikanth, K.V.; Venugopal, A.; Kumaran, S. Influence of characteristic eutectic free microstructure on mechanical and corrosion response of spark plasma sintered hypereutectic Al-Si alloy. Mater. Lett. 2022, 308, 131104. [Google Scholar] [CrossRef]
- Tjong, S.C.; Ma, Z.Y. Microstructural and mechanical characteristics of in situ metal matrix composites. Mater. Sci. Eng. R Rep. 2000, 29, 49–113. [Google Scholar] [CrossRef]
- Kaczmar, J.W.; Pietrzak, K.; Wlosinski, W.J. The production and application of metal matrix composite materials. Mater. Process. Tech. 2000, 106, 58–67. [Google Scholar] [CrossRef]
- German, R.M. Powder metallurgy and particulate materials processing, Metal Powder Industry, Princeton, New Jersey, USA, 2005; pp. 233–274. Princeton, New Jersey, USA.
- German, R.M. Sintering: From empirical observations to scientific principles, Butterwortf-Heinemann, Massachusetts, USA, 2014; pp. 387–408.
- Kang, S-J.L. Sintering densification, grain growth, and microstructure, Butterworth-Heinemann, Oxford, UK, 2005; pp. 197–205.
- Kaplan, Y.; Aksöz, S.; Ada, H.; İnce, E.; Özsoy, S. The effect of aging processes on tribo-metallurgy properties of al based ternary alloys product by P/M technique. Sci. Sinter. 2020, 52, 445–456. [Google Scholar] [CrossRef]
- Ozer, M.; Aydogan, S.I.; Ozer, A.; Cinici, H.; Ayas, E. Influence of spark plasma sintering and conventional sintering on microstructure and mechanical properties of hypereutectic Al-Si alloy and hypereutectic Al-Si/B4C composites. Kov. Mater. 2022, 60, 171–179. [Google Scholar] [CrossRef]
- Ozer, A.; Cetin, H. Correlation of microstructure, hardness, and electrical conductivity of hypereutectic Al-Si/B4C composites manufactured by hot pressing technique and subjected to hot extrusion. Can. Metall. Quart. 2023. [Google Scholar] [CrossRef]
- Pakiela, Z.; Ludwichowska, K.; Ferenc, J.; Kulczyk, M. Mechanical properties and electrical conductivity of Al 6101 and 6201 alloys processed by hydro-extrusion. IOP Conf. Ser-Mat. Sci. Eng. 2014, 63, 012120. [Google Scholar] [CrossRef]
- Allen, P.B.; Butler, W.H. Electrical conduction in metals. Phys. Today. 1978, 31, 44–49. [Google Scholar] [CrossRef]
- Heard, D.W.; Donaldson, I.W.; Bishop, D.P. Metalurgical assesment of a hypereutectic aluminum-silicon P/M alloy. J. Mater. Process. Tech. 2009, 209, 5902–5911. [Google Scholar] [CrossRef]
- Rudianto, H.; Yang, S.; Nam, K-W. ; Kim, Y-J. Mechanical properties of Al-14Si-2.5Cu-0.5Mg aluminum-silicon P/M alloy. Rev. Adv. Mater. Sci. 2011, 28, 145–149. [Google Scholar]
- Su, S.S.; Chang, I.T.H.; Kuo, W.C.H. Effects of processing conditions on the sintering response of hypereutectic Al-Si-Cu-Mg P/M alloy. Mater. Chem. Phys. 2013, 139, 775–782. [Google Scholar] [CrossRef]
- Ozer, A. The microstructures and mechanical properties of Al-15Si-2.5Cu-0.5Mg/(wt%)B4C composites produced through hot pressing technique and subjected to hot extrusion. Mater. Chem. Phys. 2016, 183, 288–296. [Google Scholar] [CrossRef]
- Arribas, I.; Martin, J.M.; Castro. F. The initial stage of liquid phase sintering for an Al–14Si–2.5Cu–0.5Mg (wt%) P/M alloy. Mat. Sci. Eng. A Struct. 2010, 527, 3949–3966. [Google Scholar] [CrossRef]
- Rudinsky, S.; Aguirre, J.M.; Sweet, G.; Milligan, J.; Bishop, D.P.; Brochu, M. Spark plasma sintering of an Al-based powder blend. Mat. Sci. Eng. A Struct. 2015, 621, 18–27. [Google Scholar] [CrossRef]
- Manonukul, A.; Salee, A. Relationship between atmospheric dew point and sinterability of Al-Si based alloy. J. Mater Sci. Technol. 2013, 29, 70–76. [Google Scholar] [CrossRef]
- Saheb, N.; Iqbal, Z.; Khalil, A.; Hakeem, A.S.; Aqeeli, N.-A.; Laoui, T.; Al-Qutub, A.; Kirchner, R. Spark plasma sintering of metals and metal matrix nanocomposites: A review. J. Nanomater. 2012, 983470. [Google Scholar] [CrossRef]
- Shen, Z.; Johnsson, M.; Zhao, Z.; Nygren, M. Spark plasma sintering of alumina. J. Am. Ceram. Soc. 2002, 85, 1921–1927. [Google Scholar] [CrossRef]
- Ozer, M.; Kaplan, Y.; Ozer, A.; Aksoz, S. Influence of different sintering techniques on the wear properties of Al-15Si-2.5Cu-0.5Mg/B4C composites. Sci. Sinter. 2023. [Google Scholar] [CrossRef]
- Pal, H.; Sharma, V. Mechanical, electrical, and thermal expansion properties of carbon nanotube-based silver and silver-palladium alloy composites. Int. J. Min. Met. Mater. 2014, 21, 1132–1140. [Google Scholar] [CrossRef]
- Isfahani, M.J.; Payami, F.; Asadabad, M.A.; Shokri, A.A. Investigation of the effect of boron carbide nanoparticles on the structural, electrical, and mechanical properties of Al-B4C nanocomposites. J. Alloy. Compd. 2019, 797, 1348–1358. [Google Scholar] [CrossRef]
Figure 1.
Optical microscope micrograph of green Alumix® 231.
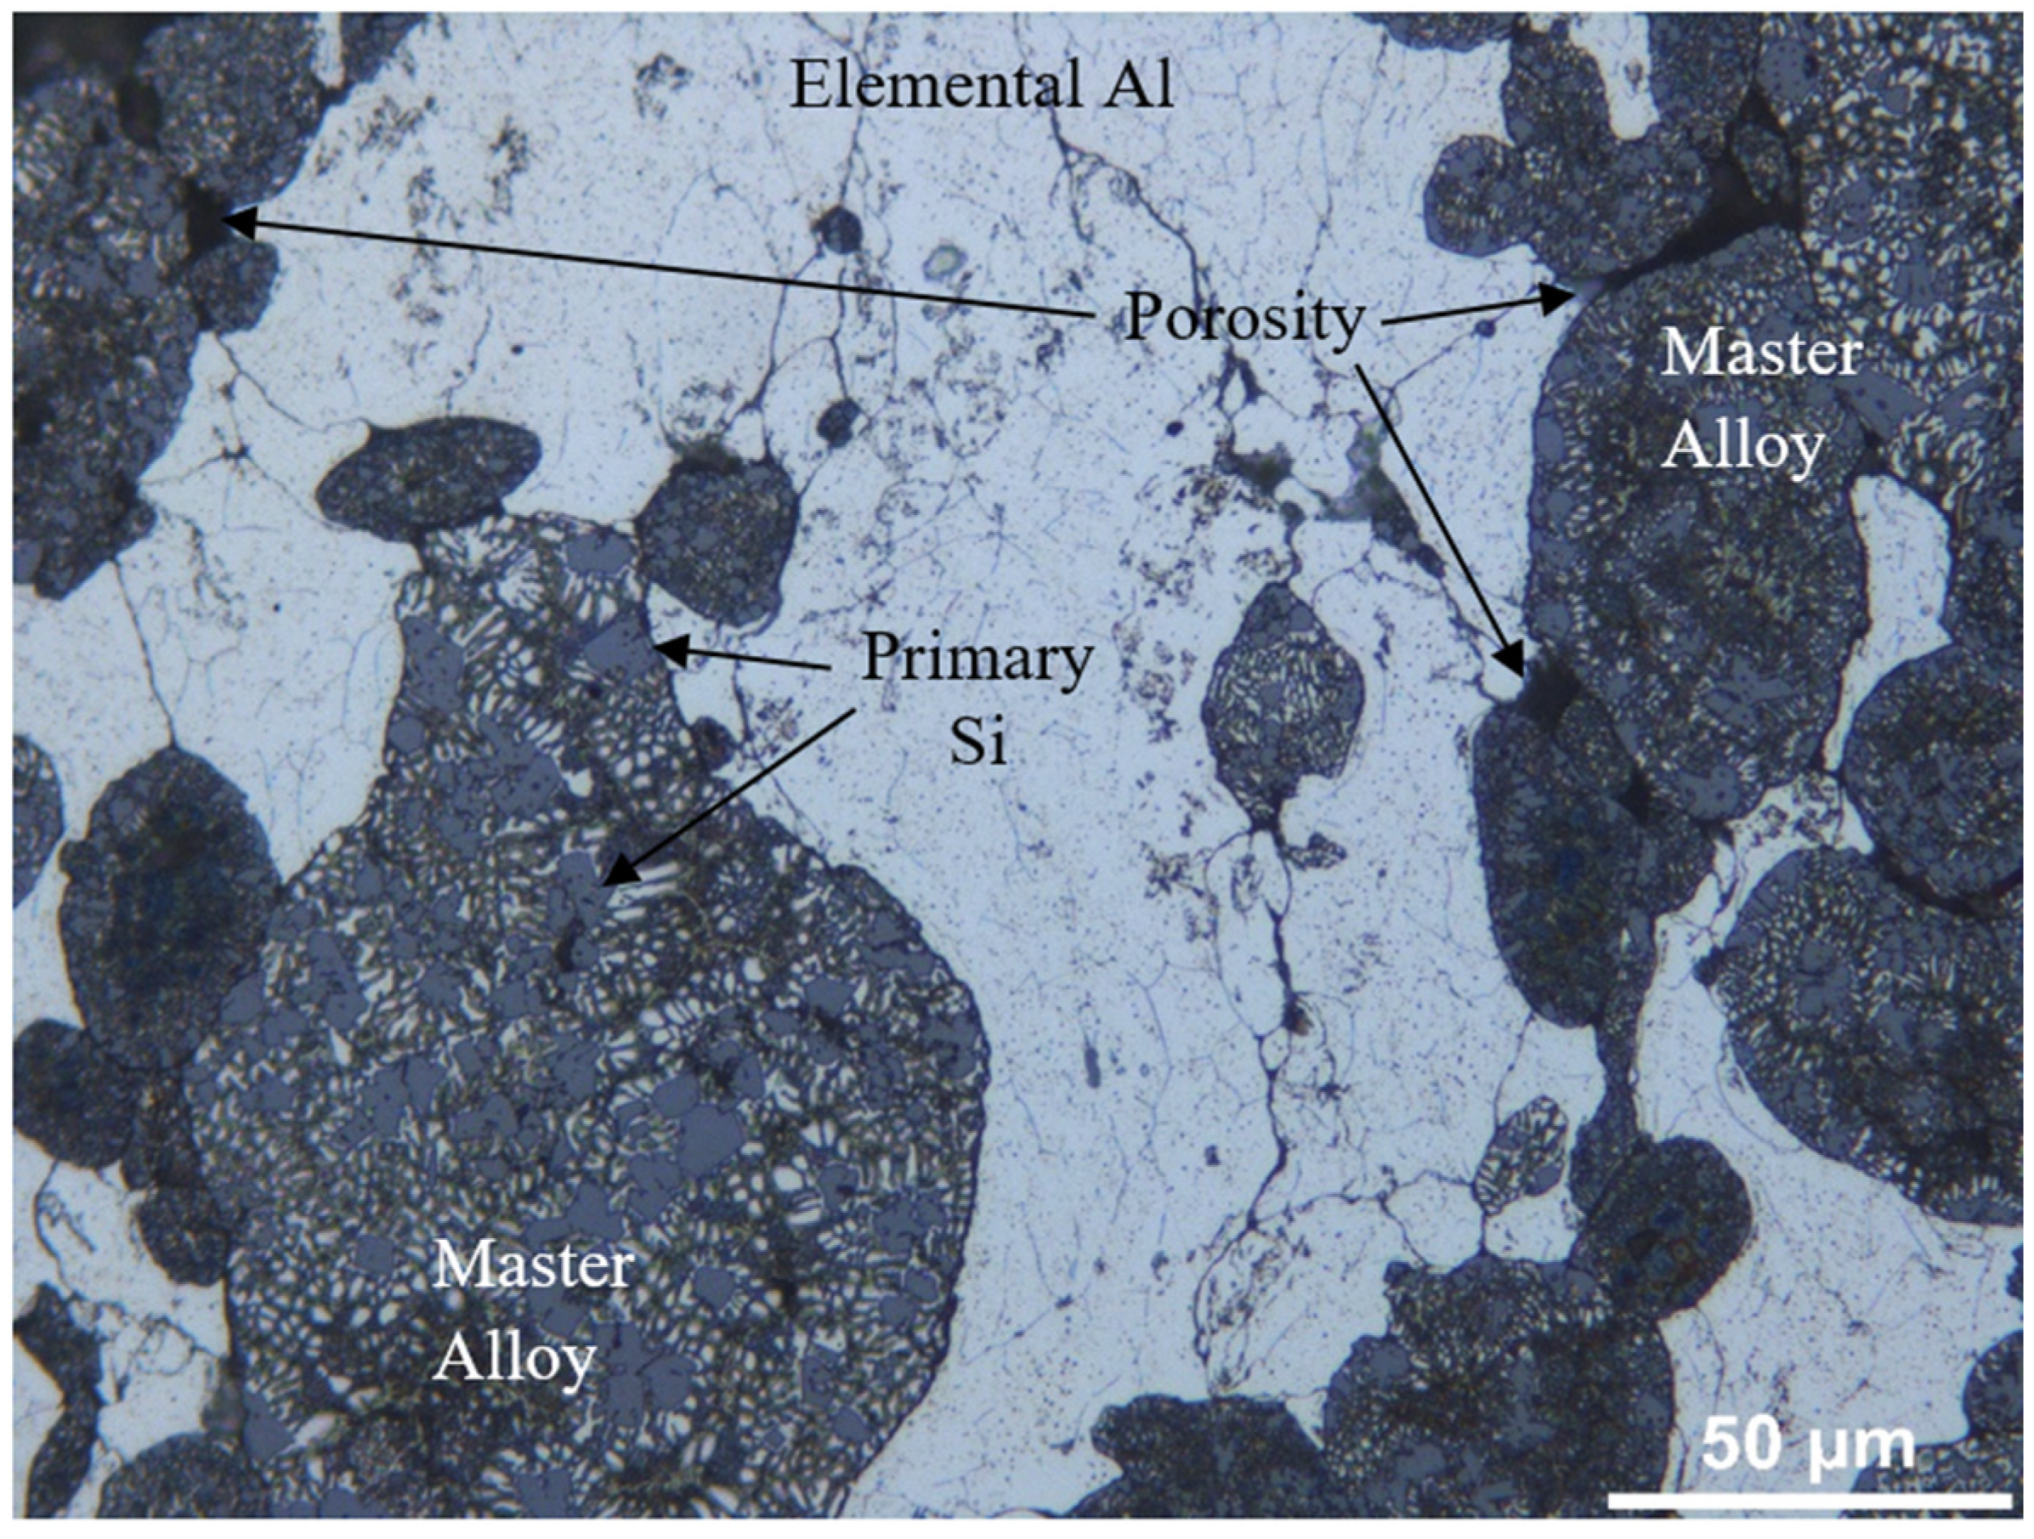
Figure 2.
Optical micrographs of samples: (a) CS-555/60; (b) 5-CS-555/60; (c) 15-CS-555/60; (d) MWS-555/15; (e) 5-MWS-555/15; (f) 15-MWS-555/15; (g) SPS-450/5; (ı) 5-SPS-450/5; (j) 5-SPS-450/5 (E: elemental Al grains; M: master alloy grains).
Figure 2.
Optical micrographs of samples: (a) CS-555/60; (b) 5-CS-555/60; (c) 15-CS-555/60; (d) MWS-555/15; (e) 5-MWS-555/15; (f) 15-MWS-555/15; (g) SPS-450/5; (ı) 5-SPS-450/5; (j) 5-SPS-450/5 (E: elemental Al grains; M: master alloy grains).
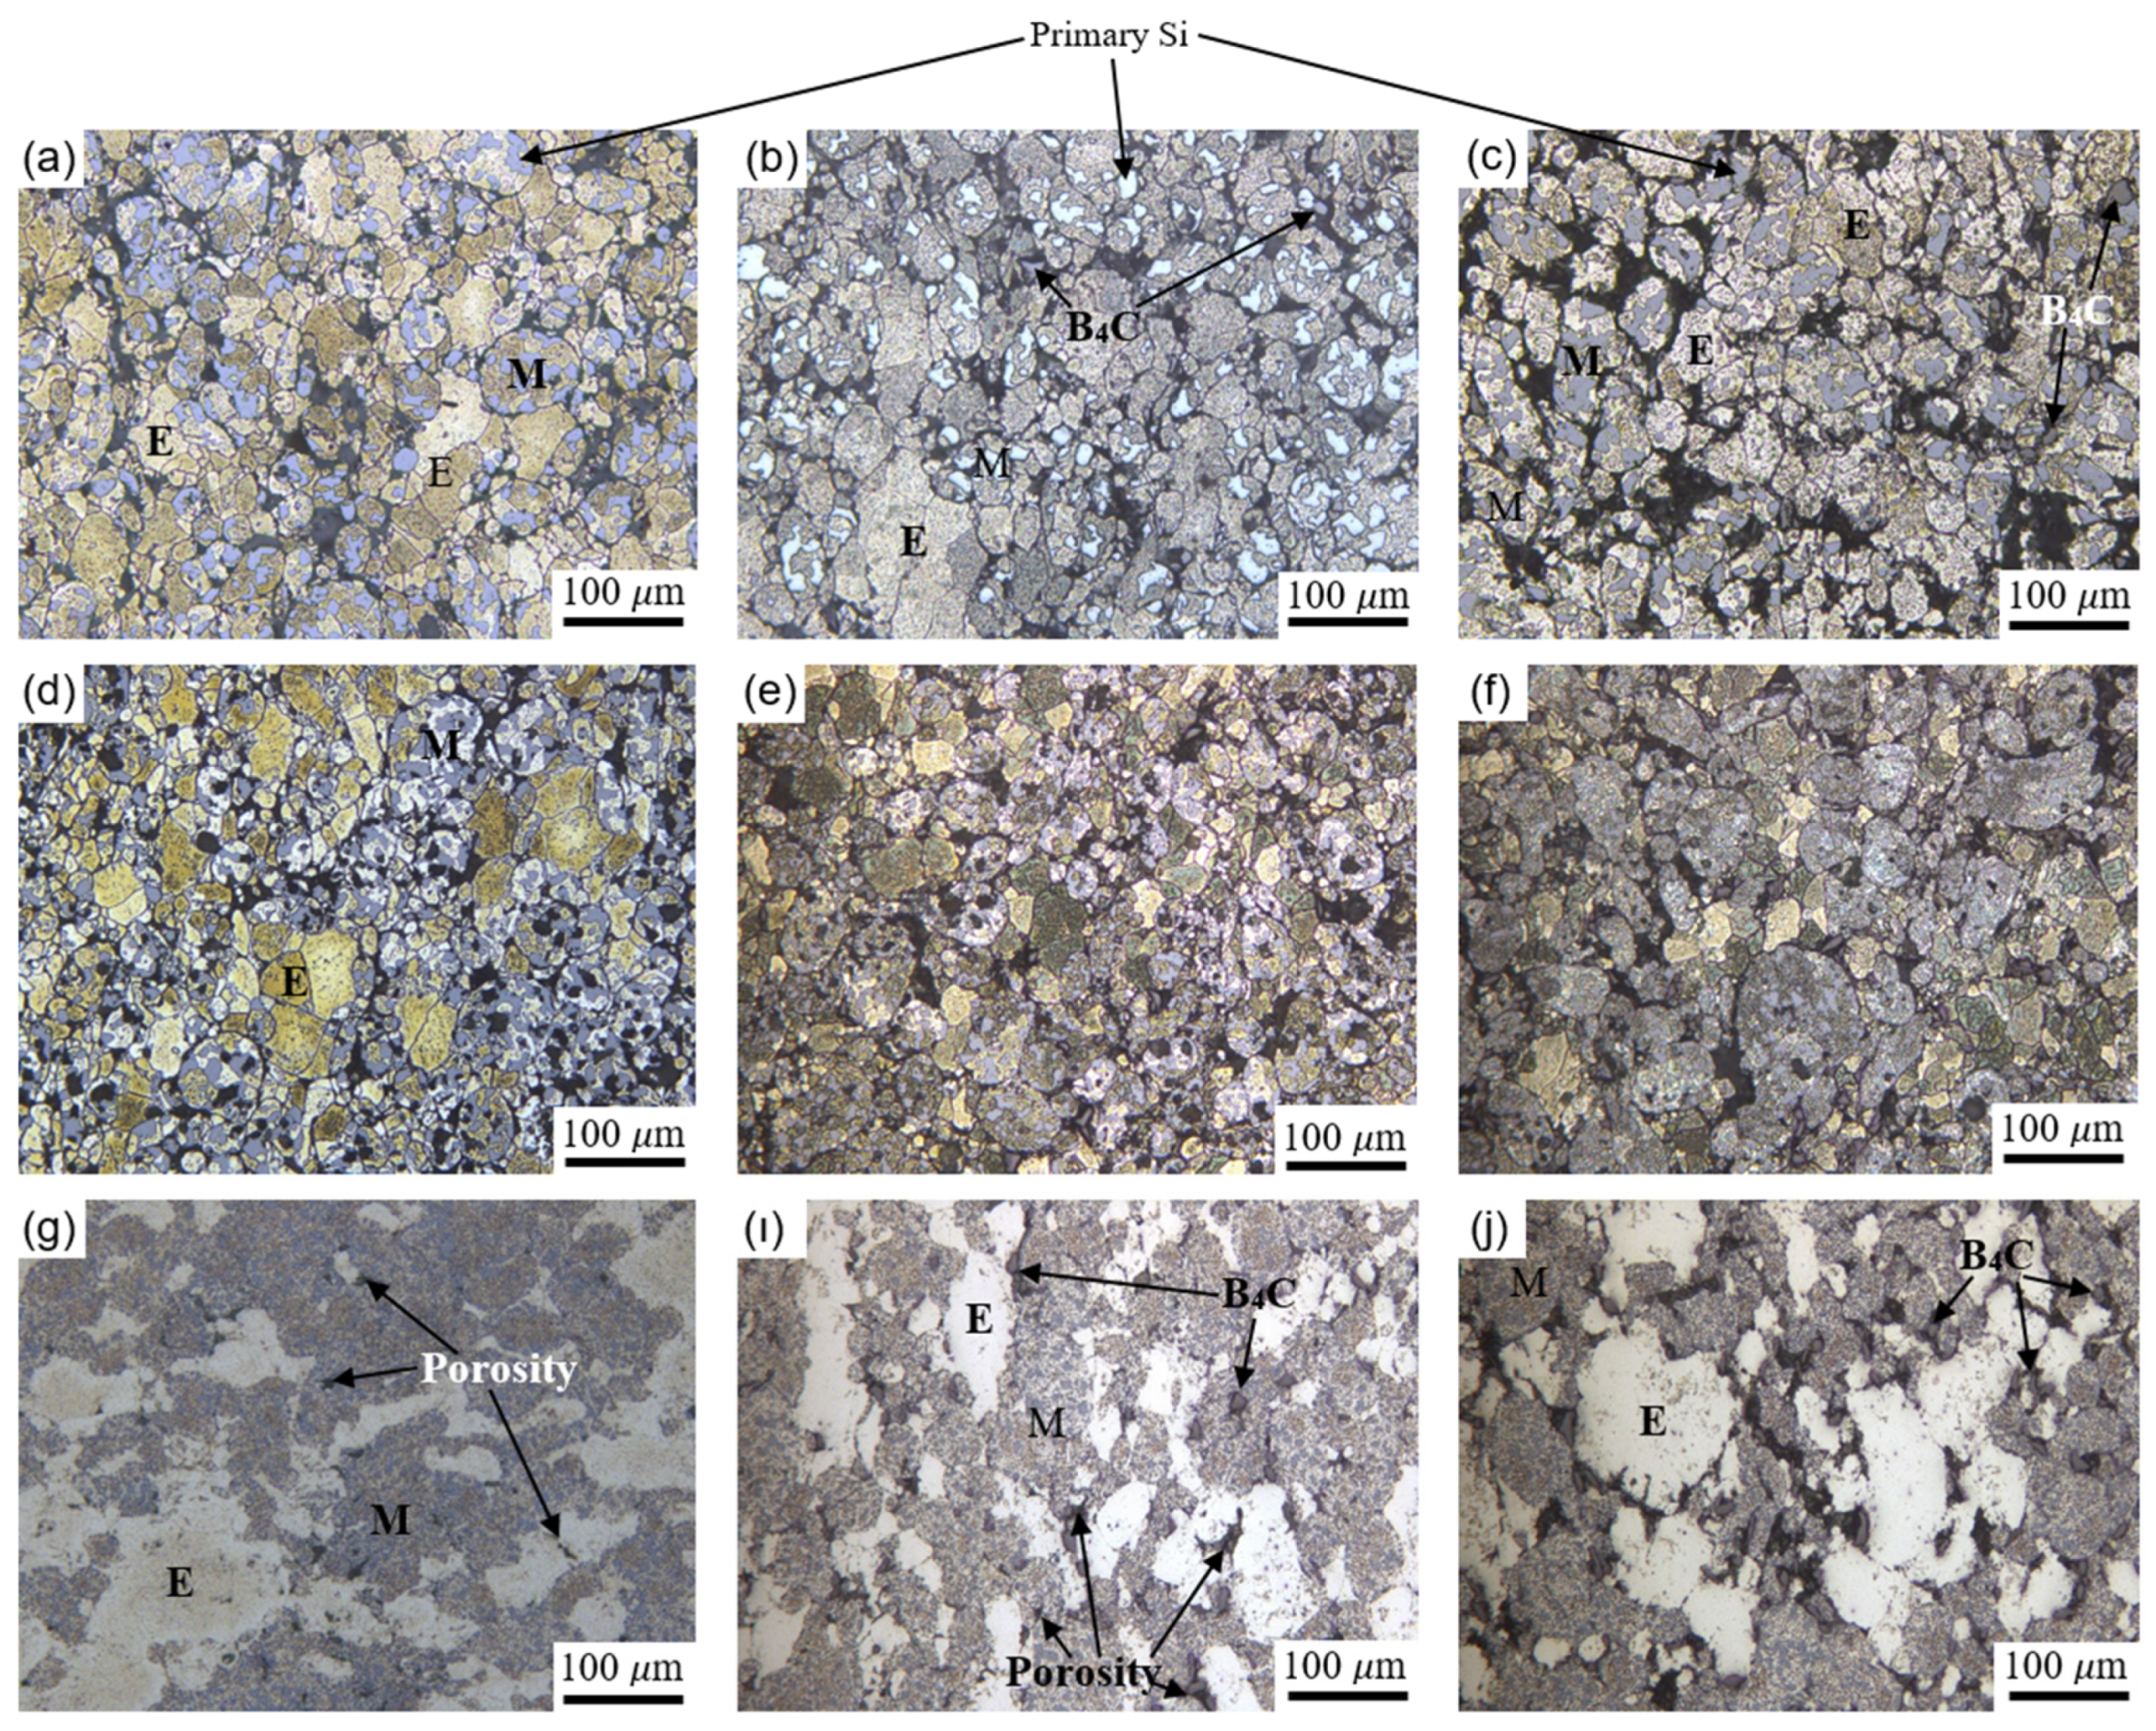
Figure 3.
Density and hardness changes in samples sintered with different techniques.
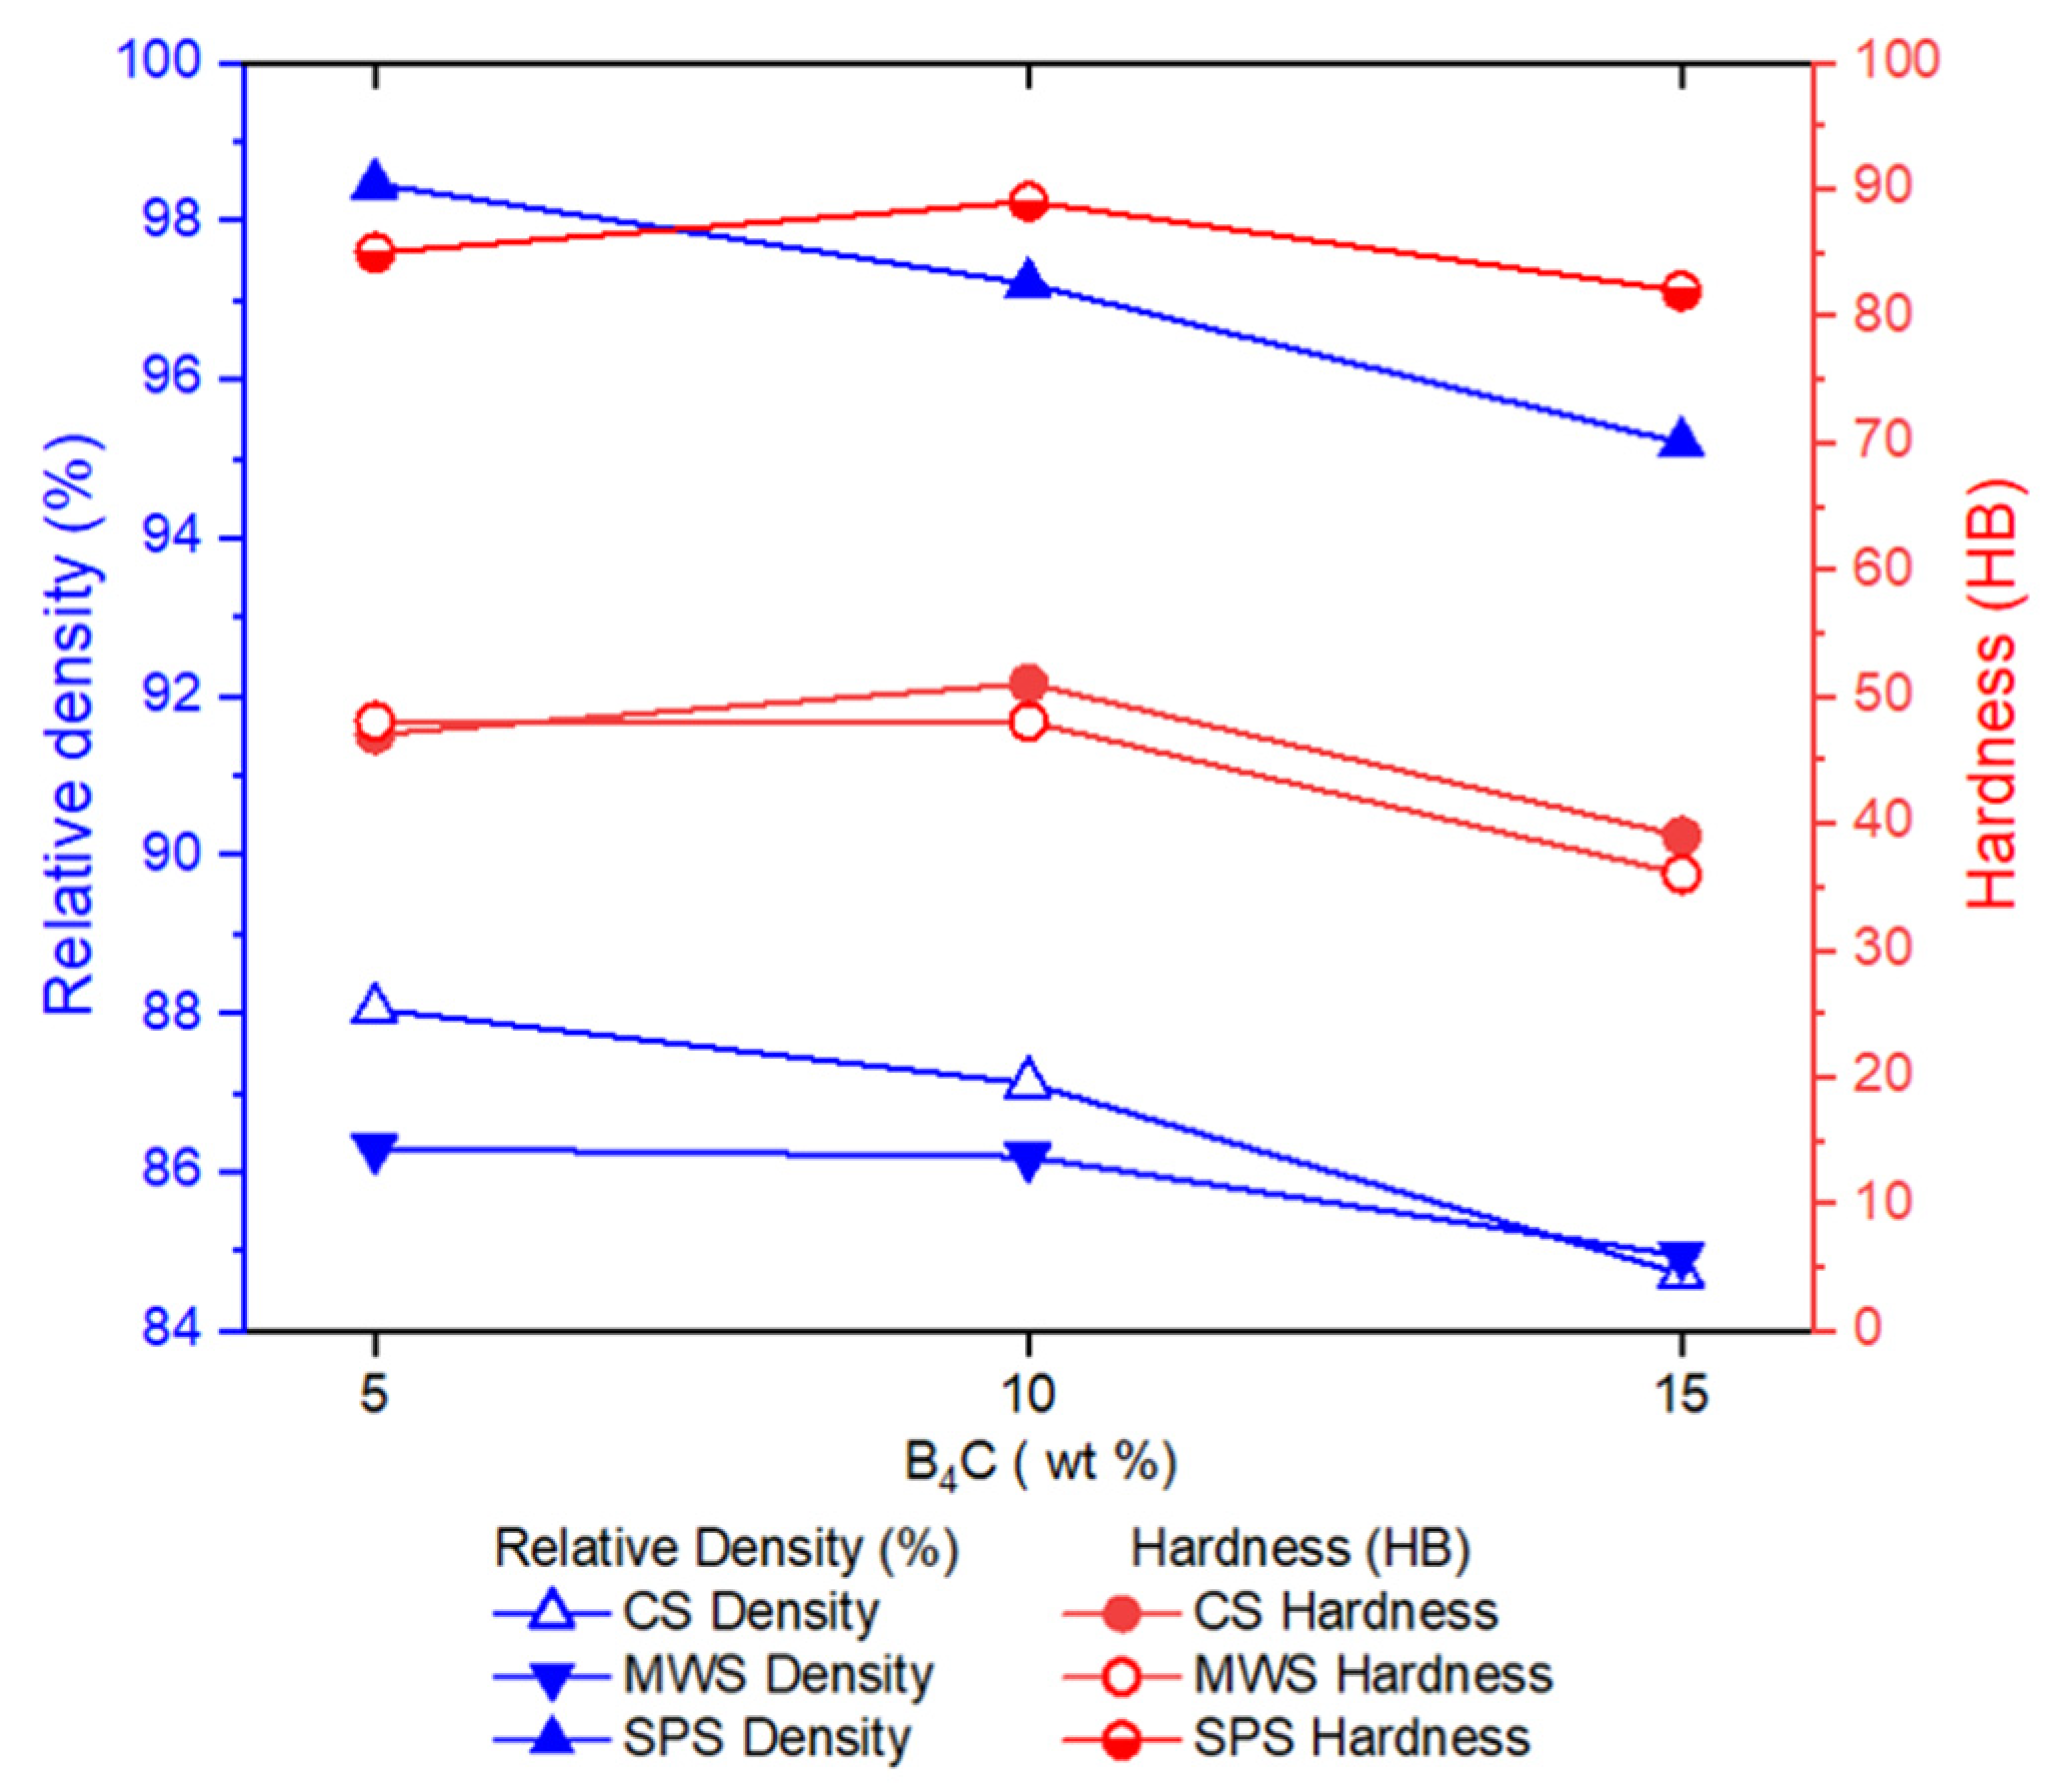
Figure 4.
Electrical conductivity plot of the samples at room temperature.
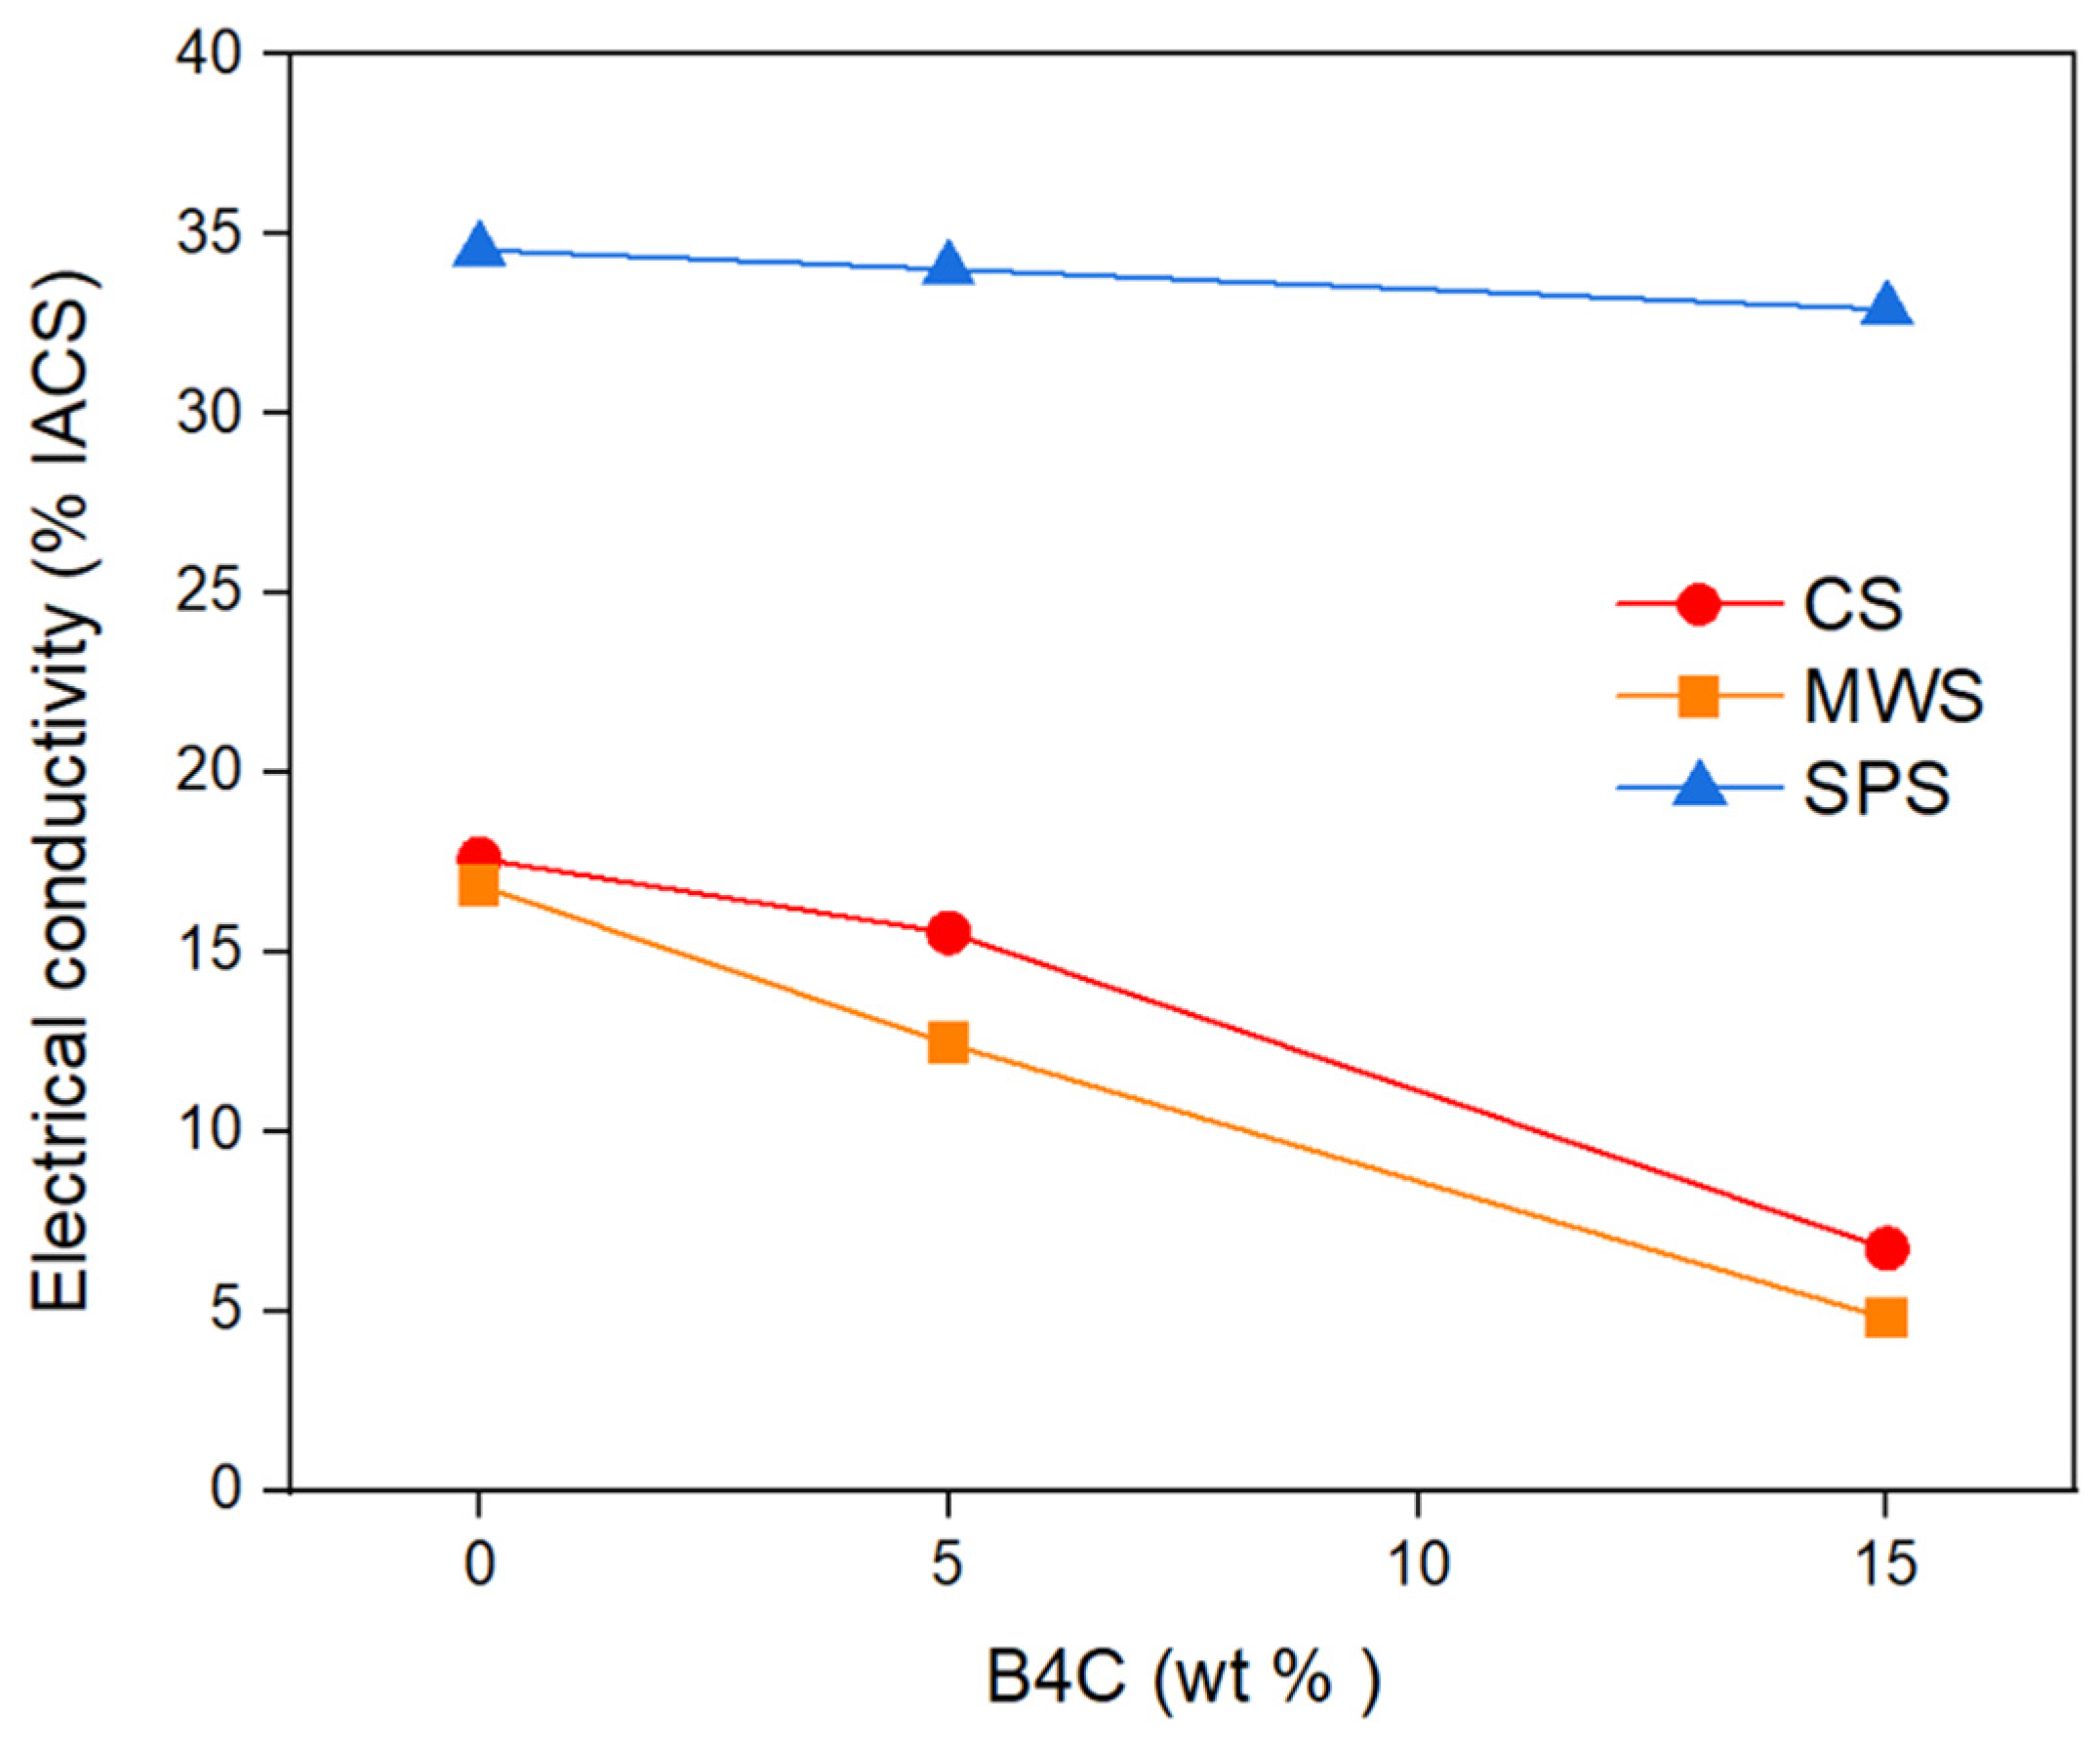

Table 1.
Chemical composition of Alumix® 231 (wt%) and pressing-sintering conditions.
| Alumix® 231 | Al | Si | Cu | Mg | Lubr. Amidwax | |
| Nominal target: | Remainder | 14-16 | 2.4-2.8 | 0.5-0.8 | 1.5 | |
| Experimental: | Remainder | 15.10 | 2.75 | 0.60 | ||
| Compacting Pressure: 620 MPa | Sintering atmosphere: N2 | |||||
| Sintering temperature: 550-560 °C | Dewaxing: 380-420 °C | |||||
| Sintering time: approx. 60 min | ||||||
Table 2.
The specimen notations of the samples.
| Specimen Notation | Materials | Sintering | Sintering Temperature (°C) | Sintering Time (min) |
|---|---|---|---|---|
| CS-555/60 | Alumix 231® | Conventional | 555 | 60 |
| 5-CS-555/60 | Alumix 231® +5wt%B4C | Conventional | 555 | 60 |
| 15-CS-555/60 | Alumix 231® +15wt%B4C | Conventional | 555 | 60 |
| MWS-555/15 | Alumix 231® | Microwave | 555 | 15 |
| 5-MWS-555/15 | Alumix 231® +5wt%B4C | Microwave | 555 | 15 |
| 15-MWS-555/15 | Alumix 231® +15wt%B4C | Microwave | 555 | 15 |
| SPS-450/5 | Alumix 231® | Spark Plasma | 450 | 5 |
| 5-SPS-450/5 | Alumix 231® +5wt%B4C | Spark Plasma | 450 | 5 |
| 15-SPS-450/5 | Alumix 231® +15wt%B4C | Spark Plasma | 450 | 5 |
Disclaimer/Publisher’s Note: The statements, opinions and data contained in all publications are solely those of the individual author(s) and contributor(s) and not of MDPI and/or the editor(s). MDPI and/or the editor(s) disclaim responsibility for any injury to people or property resulting from any ideas, methods, instructions or products referred to in the content. |
© 2024 by the authors. Licensee MDPI, Basel, Switzerland. This article is an open access article distributed under the terms and conditions of the Creative Commons Attribution (CC BY) license (http://creativecommons.org/licenses/by/4.0/).
Copyright: This open access article is published under a Creative Commons CC BY 4.0 license, which permit the free download, distribution, and reuse, provided that the author and preprint are cited in any reuse.


