1. Introduction
Wheat images contain data on wheat growth, pest monitoring and harvest prediction, which are important for agricultural researchers [
1,
2,
3,
4,
5]. To protect the integrity, confidentiality and availability of sensitive data, wheat images should be encrypted. At the same time, in order to ensure the reliability and security of wheat production and research, it is necessary to prevent unauthorized access, tampering and leakage [
6]. The image encryption technology based on chaos is used to protect wheat images. Chaotic image encryption is an encryption technology based on chaos theory, which uses chaotic system to generate pseudorandom number sequences to encrypt and decrypt images [
7]. The chaotic system has the characteristics of high randomness, complexity and unpredictability [
8], and are often used in image encryption. It can also provide higher anti-aggression and increase the difficulty of encrypted data being cracked. However, it is also necessary to select appropriate encryption schemes and parameters according to different needs to ensure the security and practicality of encryption algorithms.
In recent years, many scholars have made contributions to promoting the development of image encryption research. An image encryption scheme based on a new dynamic four-dimensional chaotic system, Z-type transformation and DNA operation is proposed by Zhao et al. [
9], which has the characteristics of good security performance and resistance to various attacks. In order to realize the security and efficiency of the encryption algorithm, a color image encryption algorithm combining KAA mapping and multiple chaotic mappings is proposed by Alexan et al. [
10]. Aiming at the problems of small key space and weak anti-differential attack capability of existing encryption algorithms, a chaotic image encryption scheme based on artificial fish swarm algorithm and DNA coding is proposed by Zhu et al. [
11], which has better encryption performance and higher security. In order to solve the problem of too long computation time, composite crossover technology is introduced by Premkumar et al. [
12], who proposed an image encryption technology based on genetic operators. In general, using chaotic system to encrypt images can effectively improve the security and confidentiality of image content. At the same time, it also has the advantages of high efficiency and flexibility, and has important application value in the field of image encryption.
Chaotic image encryption is a widely used digital image encryption technology in recent years. According to different application fields, various color image encryption schemes are compared and analyzed by Ghadirli et al. [
13], and their respective advantages and limitations are summarized. The characteristics, advantages and disadvantages of various chaotic systems used for image encryption are discussed by Suneja et al. [
14]. By comparison, it is concluded that the security of image encryption based on low-dimensional chaotic system proposed earlier is low. So, in recent years, researchers have proposed various high-dimensional chaotic systems for image encryption. Due to the problem that traditional encryption algorithms cannot be used on resource-limited Internet of Things devices, a lightweight image encryption technology with losless, effective and anti-security attack capabilities is proposed by Roy et al. [
15], which is based on two-dimensional von Neumann cellular automata. And the algorithm is suitable for implementation in real-time sensitive Internet of Things applications. A permisse-based private blockchain solution is proposed by Khan et al. [
16], which stores the encrypted pixel value of the image on the blockchain, guaranteeing the privacy and security of the image data. Blockchain technology provides a solution for the encryption of sensitive image data for decentralized devices, which is suitable for the security needs of intelligent industries such as the Industrial Internet of Things. A symmetric key image encryption system based on piecewise linear chaotic mapping is proposed by Zhang et al. [
17], which has the same encryption and decryption process, high encryption and decryption speed and the ability to resist plaintext attacks, and can be applied to actual communication. Combining sinusoidal mapping and fractional arithmetic, a new one-dimensional fractional chaotic mapping is proposed by Zhu et al. [
18], which is used to design an image encryption algorithm based on parallel DNA coding. The experimental results show that the algorithm has good encryption performance and less time overhead, and has good application potential in secure communication applications. Different chaotic systems have different characteristics and are suitable for different image encryption tasks, which need to be selected according to specific needs.
In order to protect the security of agricultural information, it is necessary to build a scheme suitable for agricultural image encryption. An image-driven multi-feature plant management model based on feature data encryption scheme is constructed by Santhosh et al. [
19], which used dynamic scheme and key to encrypt data, improving the security and performance of smart agriculture. Perumal et al. [
20] realized data security of different smart devices in farmland by using data encryption schemes, which used different encryption schemes and keys to encrypt data of farmland devices controlled by users, thus achieving higher accuracy of low-rate attack detection. A new homomorphic encryption algorithm is proposed by Kulalvaimozhi et al. [
21], which combined with the compression process to encrypt field crop images, reducing the encryption time and preserving high-quality reconstructed images. A method combining Logistic-Sine and Logistic-Tent chaotic system is proposed by Padmapriya et al. [
22] to encrypt agricultural image information, which is effective and robust.
After analyzing the above literature, it is found that a good image encryption scheme is very important for the development of smart agriculture. However, there are too few agricultural image encryption algorithms based on chaotic systems, so it is impossible to know whether the performance of different chaotic systems in agricultural image encryption is good or bad. In order to solve the problem of wheat image encryption, in this paper, the existing popular chaotic system is applied to wheat image encryption algorithm, and compares and analyzes the common image encryption performance evaluation index to measure its encryption effect. The aim is to find the most suitable chaotic system scheme for wheat image encryption, and provide a reference for agricultural image encryption scheme based on chaotic system.
The 10 chaotic system schemes proposed in this paper include Piecewise Linear Chaotic Map (PWLCM) chaotic mapping, Sine mapping, Tent mapping, Logistic mapping, Lorenz system, Rossler system, Chen system, hyper-chaotic Chen system, hyper-chaotic Lorenz system, hyper-chaotic Rossler system, hyper-chaotic Hide-Skeldon-Acheson system, new four-dimensional chaotic system, hyper-chaotic Lü system.
The main contributions of this paper are as follows:
1.The image encryption algorithm based on chaotic system is applied to wheat image encryption. 2. An encryption scheme for selecting a suitable chaotic system based on wheat images is proposed. 3. By comparing 8 common evaluation indexes of image encryption performance, the new four-dimensional chaotic system is selected as the most suitable for wheat image encryption.
4. Results and Discussion
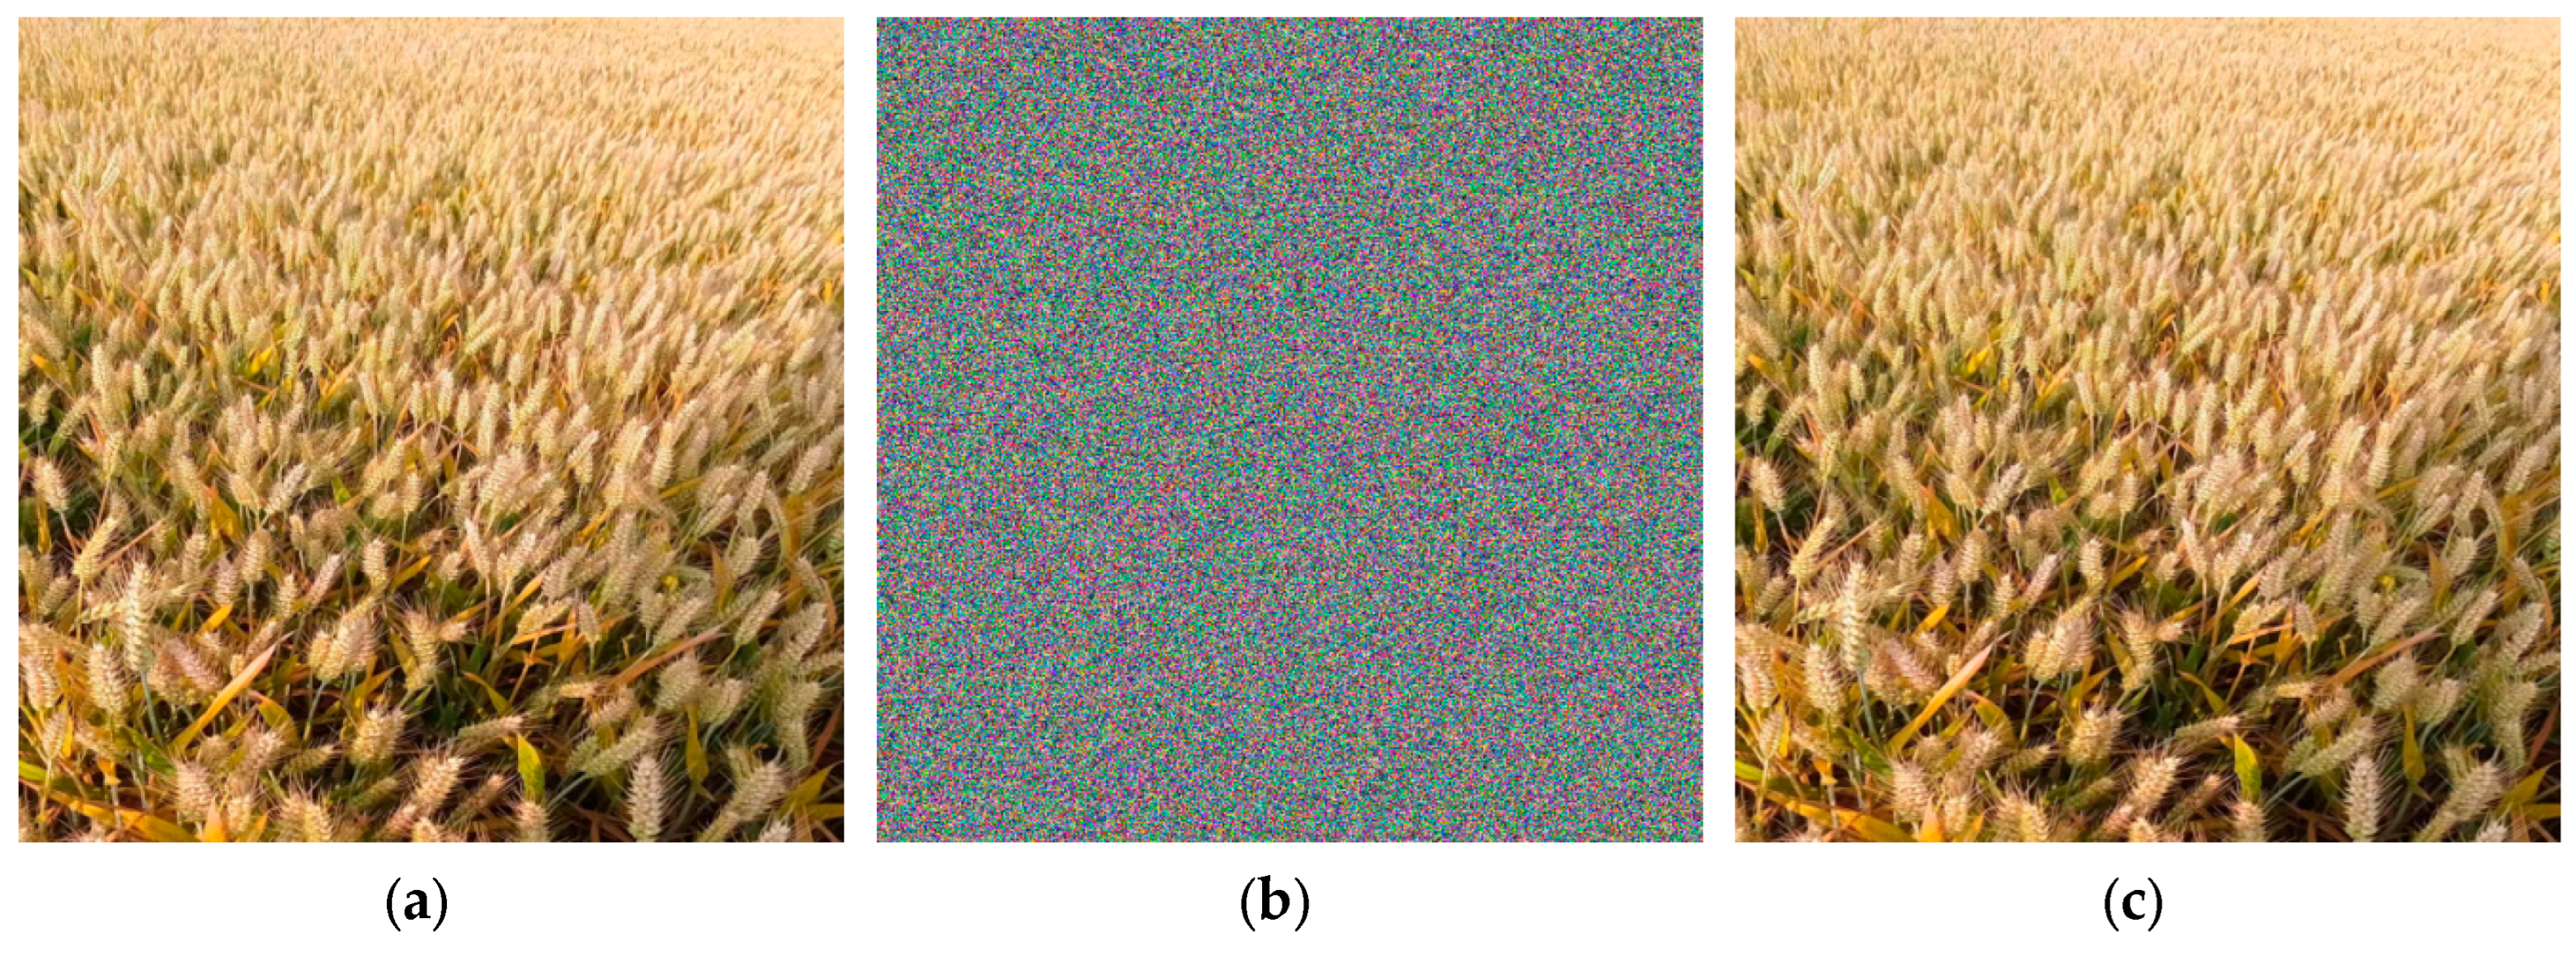
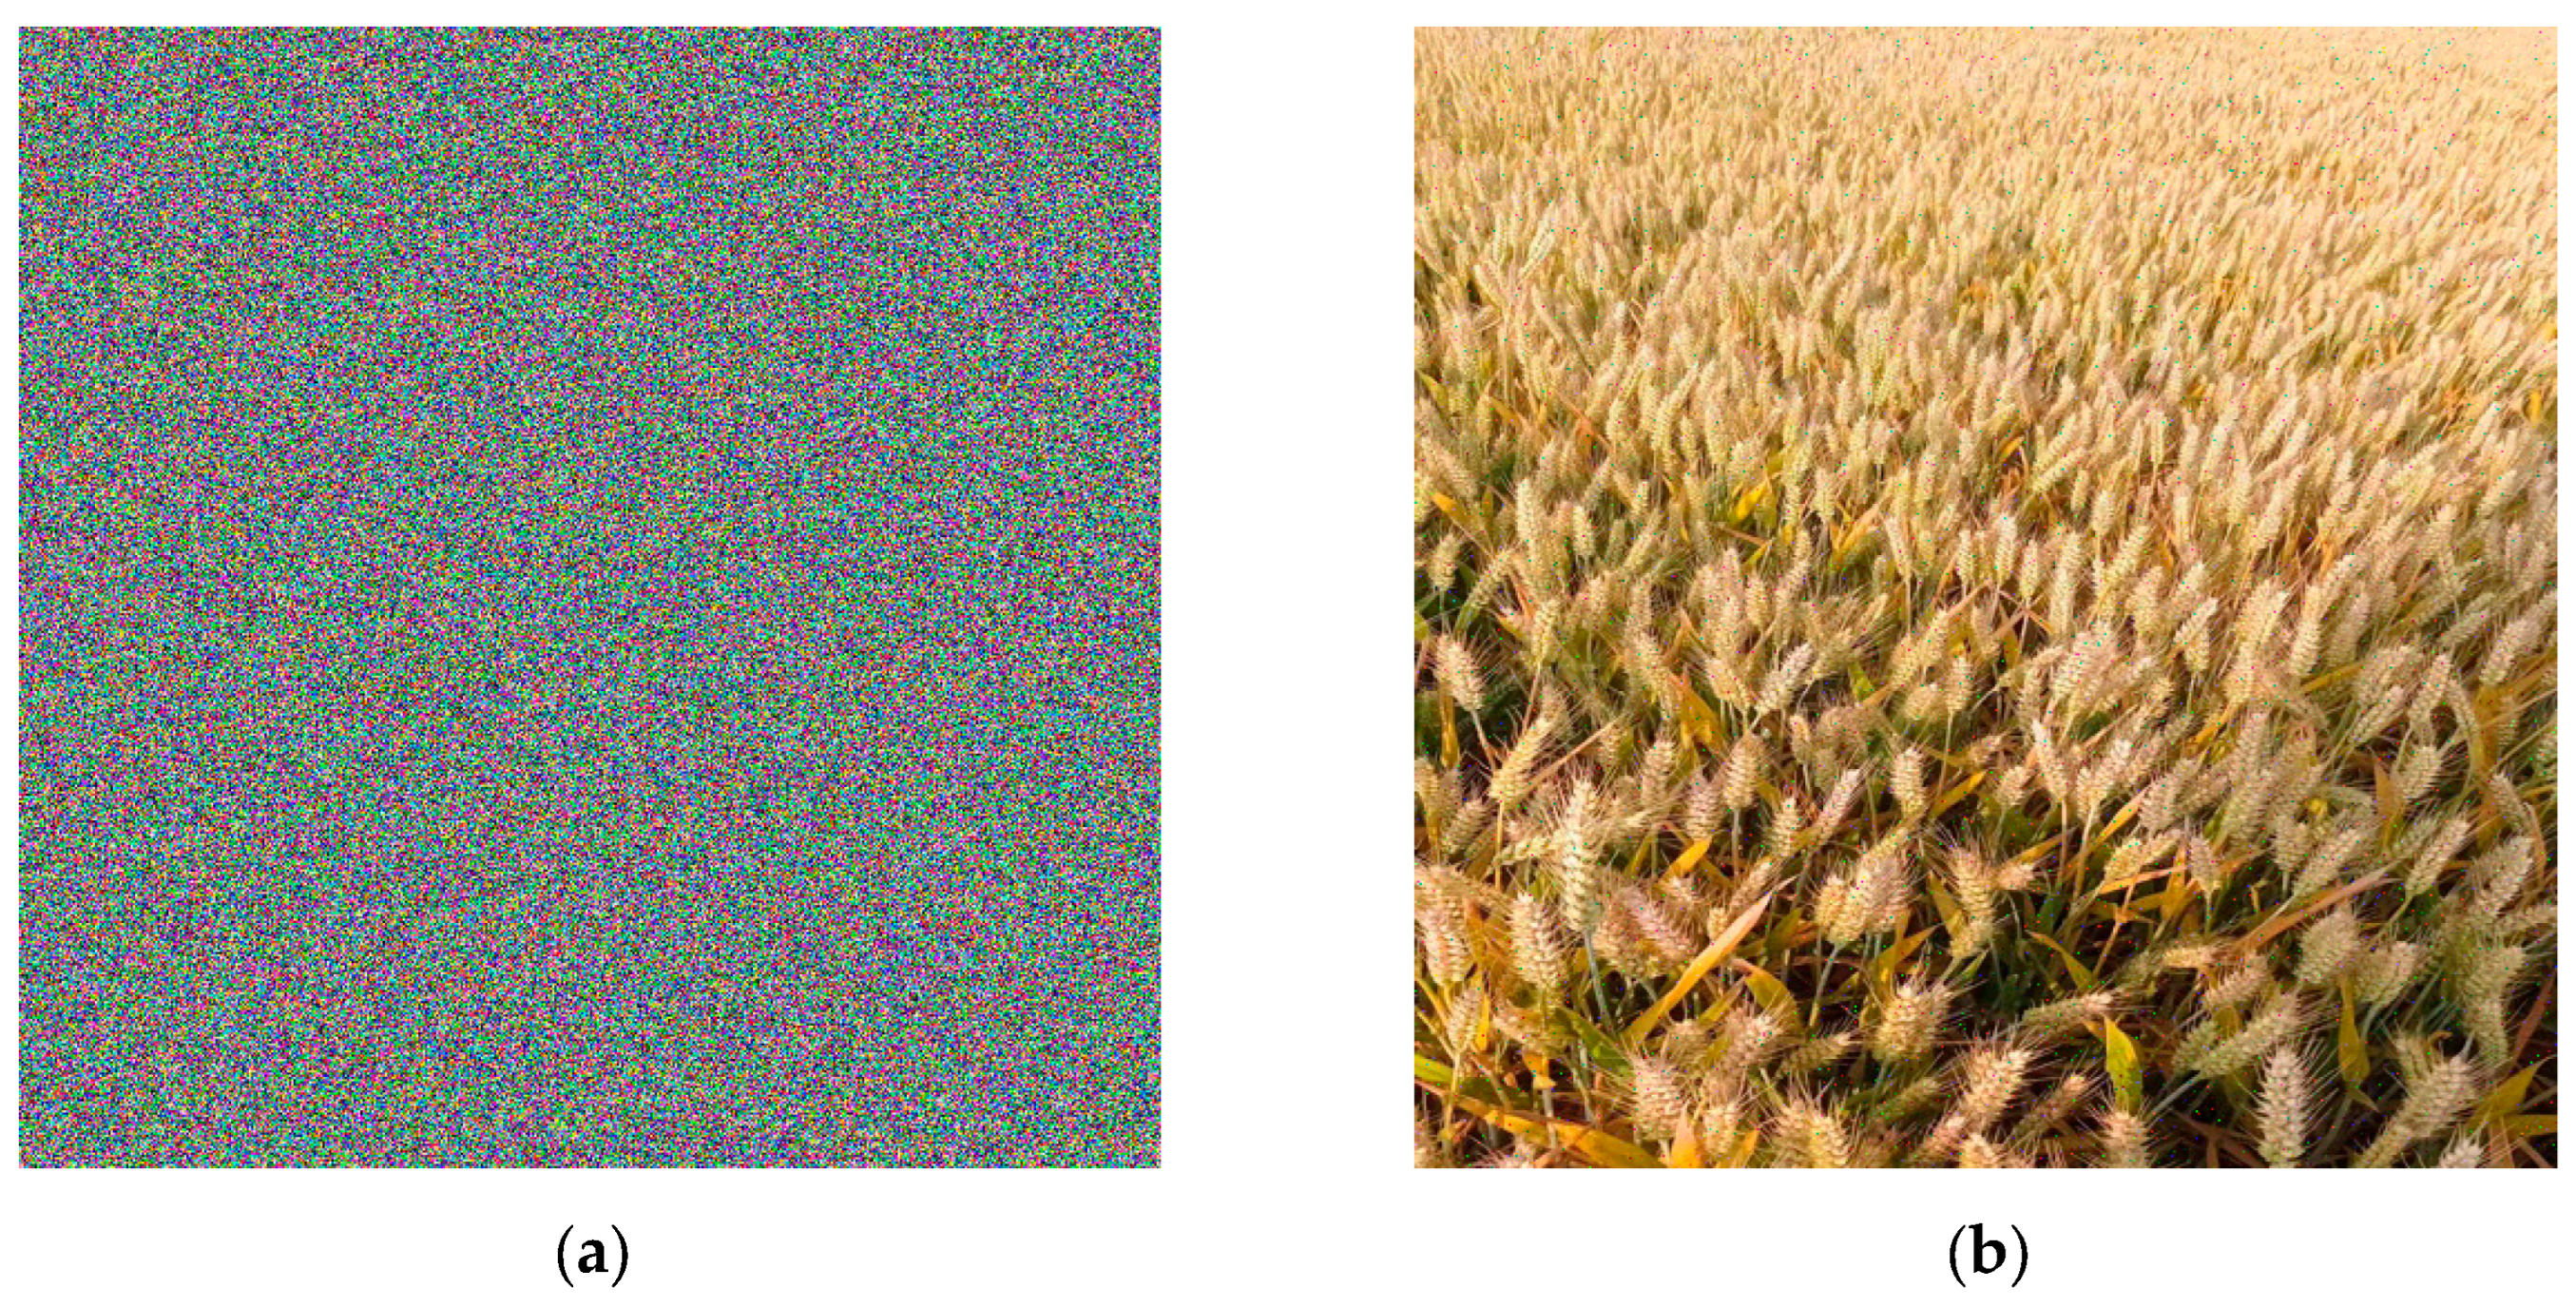
The experimental platform is a PC with an 13th Gen Intel(R) Core(TM) i5-13400F @ 2.50 GHz CPU, 32.0 GB memory, NVIDIA GeForce RTX 4060 graphics, and Windows 11 operating system. Based on the encryption scheme mentioned in
Section 3, taking the wheat image of Gaoping City, Shanxi Province as an example, the encryption and decryption of the wheat encryption system is shown in
Figure 1.
4.1. Histogram Analysis
Histogram refers to the graph drawn by the frequency of each gray value in the statistical image, reflecting the most basic statistical characteristics of the image [
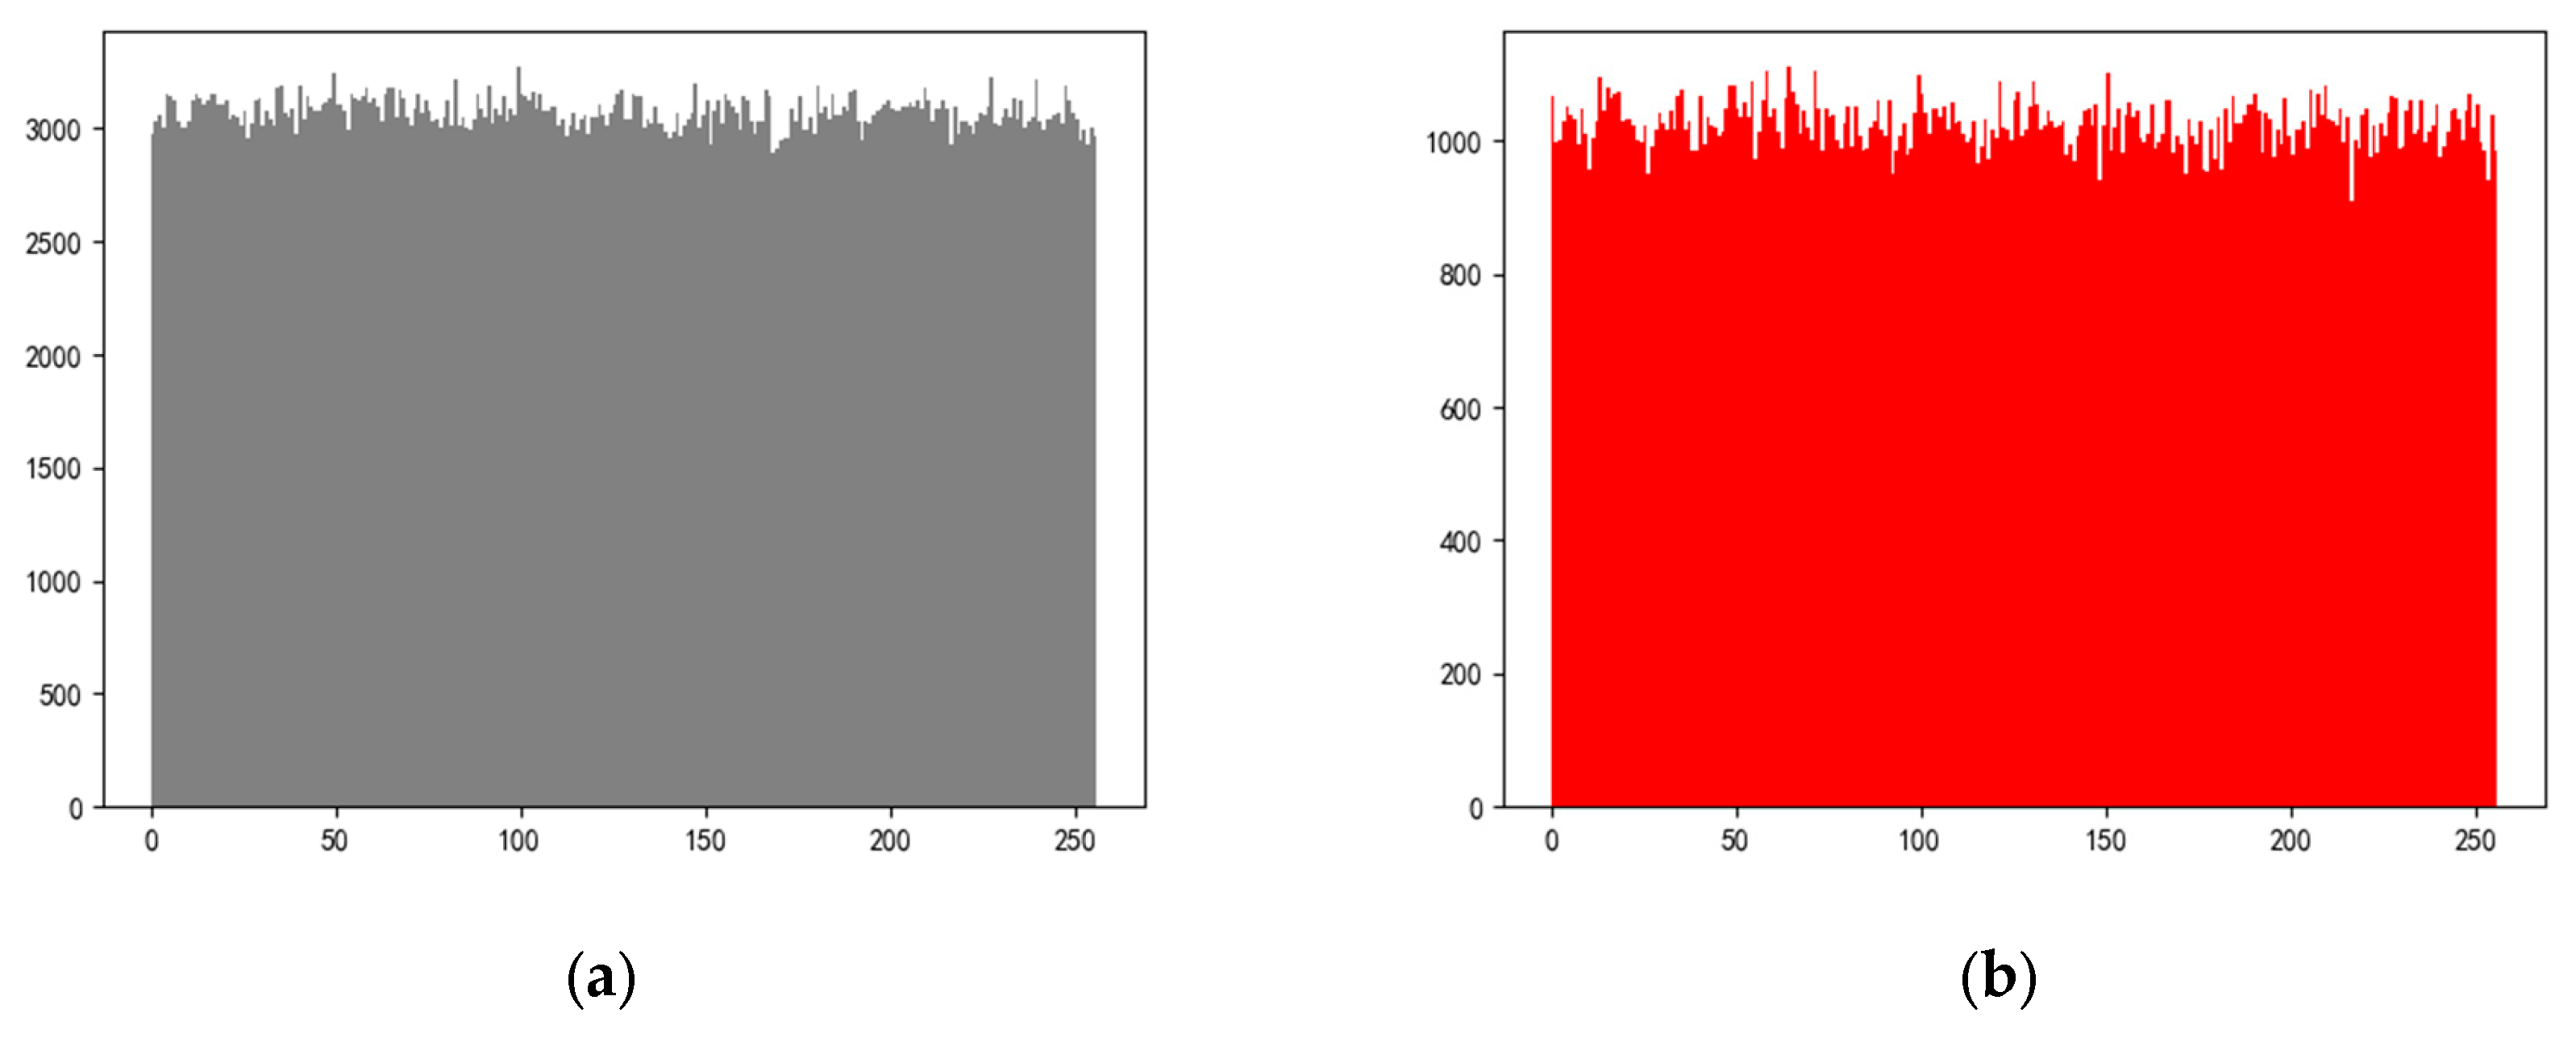
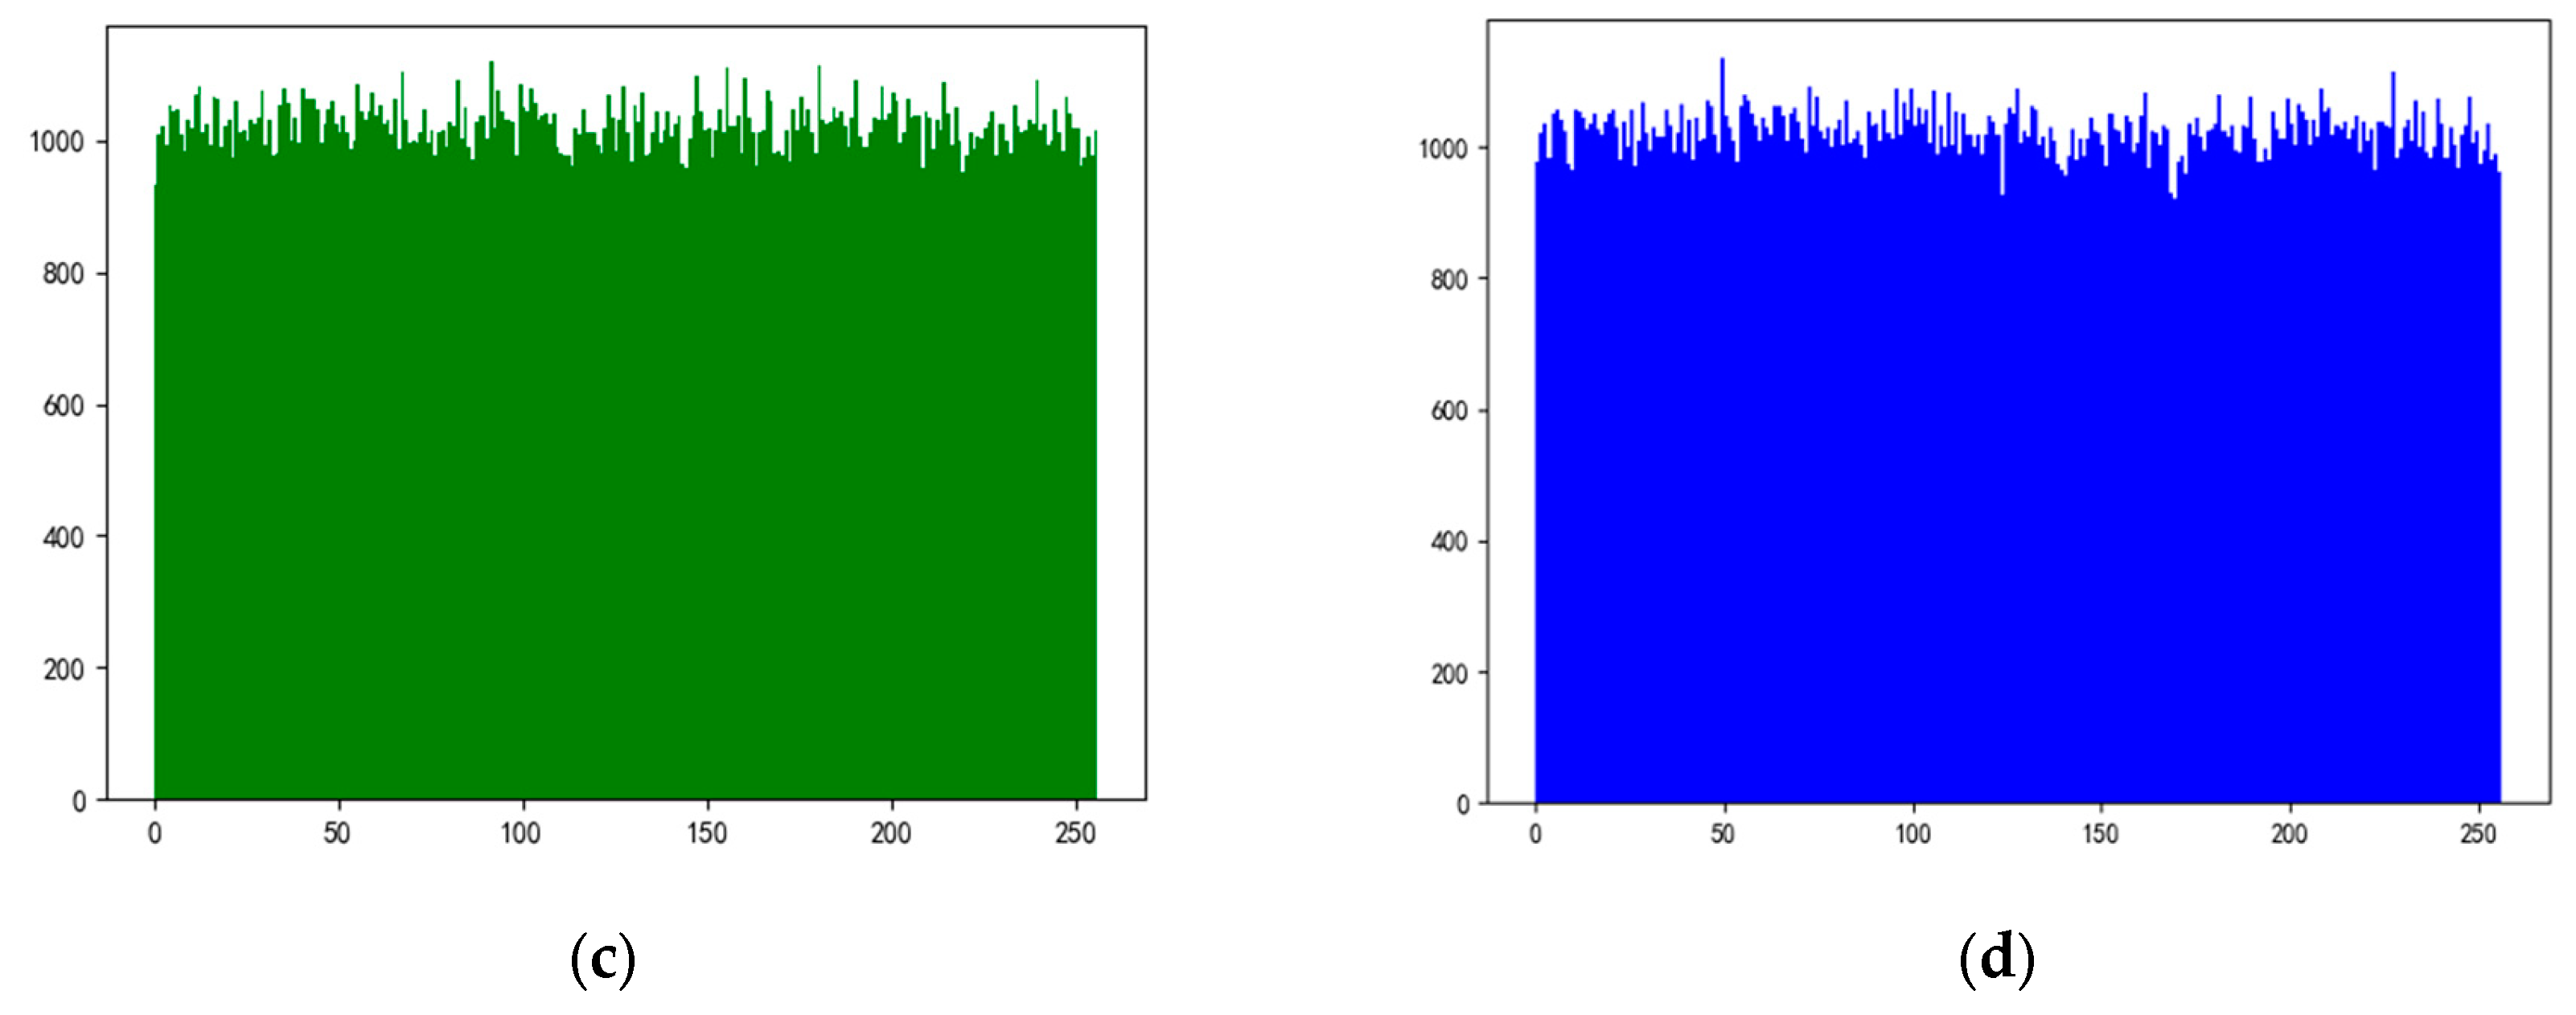
30]. In order to resist statistical analysis attacks, the histogram of the encrypted image should be as evenly distributed as possible. Variance is used to measure the frequency distribution of the histogram, and the calculation formula is shown in equation (16). The smaller the variance, the more uniform the pixel distribution. The arithmetic square root of the variance is called the standard deviation, which reflects the degree of dispersion in a data set.
The histogram of wheat encryption image of Gaoping City based on scheme 1 is shown in
Figure 2.
Table 4 compares the values of variance and standard deviation in each scheme. The results show that the variance and standard deviation of scheme 7 are the best, while the variance and standard deviation of scheme 9 are the worst.
4.2. Correlation Analysis of Adjacent Pixels
The correlation of adjacent pixels refers to the correlation degree of pixel values in adjacent positions of an image [
31], and the calculation formula is as follows:
where
is the adjacent pixel of
, and
is the covariance at two pixels
and
, respectively. The
is the total number of pixels in the image.
is the mean,
is the variance, and
is the standard deviation, respectively. The
is the correlation of adjacent pixels.
Generally speaking, there is a strong correlation between adjacent pixels in the horizontal, vertical and diagonal directions in a plaintext image. This feature is often used by attackers to infer the values of adjacent pixels from the values of known pixels, thus cracking encrypted images. A good image encryption algorithm should be able to reduce the correlation between adjacent pixels and achieve zero correlation as far as possible.
The correlation of adjacent pixels of wheat encryption image of Gaoping City based on scheme 1 is shown in
Figure 3.
Table 5,
Table 6 and
Table 7 lists the values of each scheme for the correlation of adjacent pixels in the horizontal, vertical, and diagonal directions. In general, scheme 9 shows good correlation, with the value most close to 0. Moreover, it is found that the correlation on the R, G and B channels of the same scheme will also show great differences. So, the difference in the color of the original image will also affect the choice of the best scheme.
4.3. Key Sensitivity Analysis
Key sensitivity analysis aims to analyze the difference between two ciphertext images obtained from the same plaintext image that is encrypted when the key changes slightly [
32]. If two ciphertext images are significantly different, it is said that the key sensitivity of the image cryptosystem is strong. If the difference between two ciphertext images is small, the key sensitivity is poor. A good image encryption system should have strong key sensitivity. The Normalized Pixel Contrast Ratio (NPCR) and Unified Average Changing Intensity (UACI) are commonly used to measure the difference between two images of the same size. NPCR is used to compare the values of pixels in the corresponding positions of two images, and record the proportion of the number of different pixels in all pixels. The calculation formula is as follows:
is a symbolic function, defined as follows:
where
and
are the width and height of the image, respectively.
and
are the pixel values at the position of the first image and the second image, respectively.
UACI is used to first record the difference of pixels in the corresponding positions of the two images. Then calculate the average value of the ratio between the difference and the maximum difference (that is, 255) of all pixels at the corresponding position. The calculation formula is as follows:
Due to the randomness of the location, the theoretical expected values of NPCR and UACI for the two random images are 99.6094% and 33.4635%, respectively.
The NPCR and UACI values of wheat encryption images in Gaoping City in each scheme are shown in
Table 8. In general, the NPCR value of scheme 1 is closest to the theoretical expected value of 99.6094%, and the UACI value of scheme 9 is closest to the theoretical expected value of 33.4635%. In addition, the NPCR and UACI values of different R, G and B channels may have great differences.
4.4. Key Space Analysis
Key space refers to the set of all legal keys [
33]. The key space of an image encryption system should be large enough to effectively combat exhaustive attacks. According to the current computer level, the key space of the encryption algorithm should generally be greater than
. The key spaces of each scheme are shown in
Table 9. The key space of scheme 6 and scheme 10 is the smallest, which is
. The key space of scheme 8 is the largest, which is
. And the key space of scheme 4 and scheme 9 is the second largest , which is
.
4.5. Information Entropy
Information entropy is used to measure the uniformity of gray value distribution in images, reflecting the uncertainty of image information [
34]. Generally speaking, the greater the information entropy of an image, the greater the uncertainty. Then, the more uniform the distribution of gray values of pixels, the less visible information, and the stronger the resistance to entropy attacks. The calculation formula of information entropy is as follows:
where
is the number of gray levels of the image.
is the probability that the gray value
occurs. For a gray random image with
, the theoretical value of information entropy
is 8.
The information entropy values of wheat encryption images in Gaoping City in each scheme are shown in
Table 10. The entropy value of scheme 1 to scheme 8 is 7.999, which is closest to 8, and has good anti-entropy attack ability. Scheme 9 has the lowest entropy, the smaller the uncertainty, and the worst effect of anti-entropy attack.
4.6. Gray Difference Degree
Gray difference degree is used to measure the gray level difference between the original image and the encrypted image [
35], and the calculation formula is as follows:
where
.
where
is the grayscale value at the
position.
is the gray difference degree.
is the average neighborhood gray difference of the original image.
is the average neighborhood gray difference of the encrypted image. The value of GVD is between 0 and 1. 0 means two images that are exactly the same, and 1 means two images that are completely different.
In an image, each pixel has a grayscale value that represents its brightness or color intensity. GVD quantifies the degree of variation between images by calculating the grayscale difference between the original image and the encrypted image.
The GVD values of wheat encryption images in Gaoping City in each scheme are shown in
Table 11. Scheme 9 exhibits a large GVD value, which is closest to 1 and has the best effect.
4.7. Peak Signal to Noise Ratio
The peak signal to noise ratio (PSNR) is the calculation of the error between the corresponding pixels, which is based on the error-sensitive image quality evaluation [
36]. The calculation formula is as follows:
where
is the Mean Square Error of the encrypted image X and the original image Y.
is the height of the image and
is the width of the image.
is the number of pixel bits, generally valued at 8, and the gray level of pixels is 256. The larger the value of PSNR, the smaller the distortion, the smaller the gap between the original image and the encrypted image, and the worse the encryption effect.
The PSNR values of wheat encryption images in Gaoping City in each scheme are shown in
Table 12. It can be seen that the PSNR value of scheme 9 is the smallest, which indicates that the greater the gap between the original image and the encrypted image, and the better the encryption effect.
4.8. Robustness Analysis
Analyze the ability of encrypted images to resist noise attacks and blocking attacks [
37]. The encrypted image may be interfered by various factors in the transmission process of the channel, such as blur, distortion and partial information loss. This has an impact on the image decryption effect and increases the difficulty of image decryption.
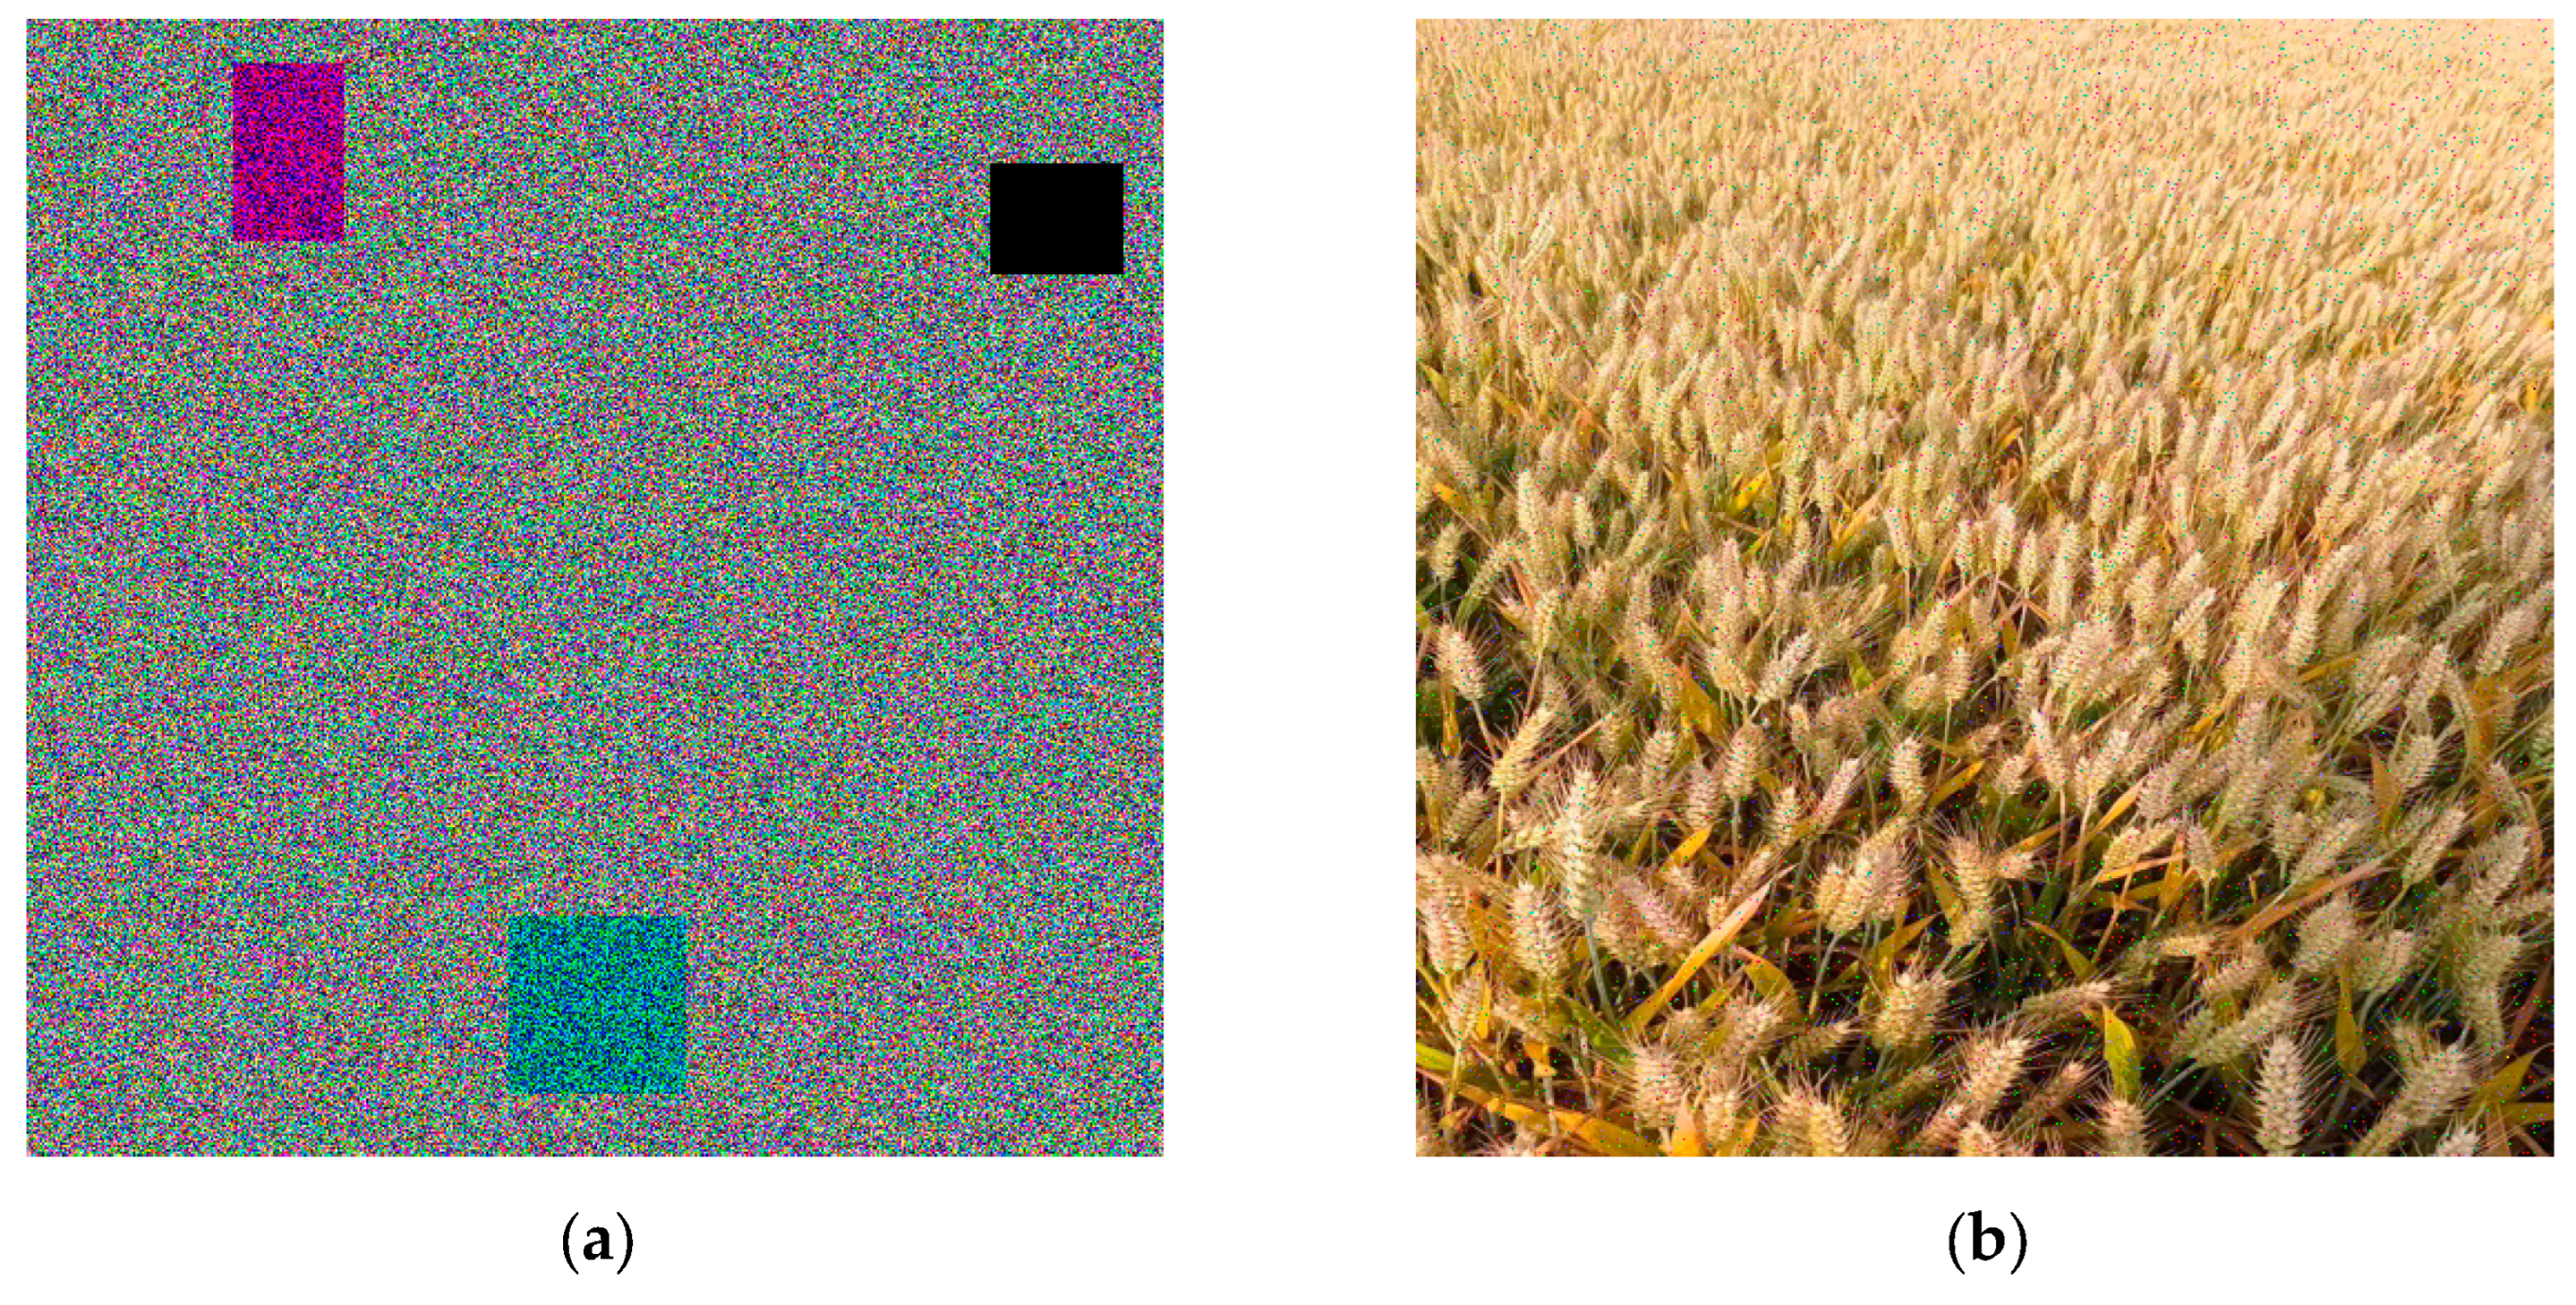
The 60*50 pixels in the encrypted image, the 80*80 pixels in the R channel, and the 50*80 pixels in the G channel are randomly lost. The pixel loss of wheat encryption image in Gaoping City based on scheme 1 is shown in
Figure 4(a), and the decrypted result is shown in
Figure 4(b). According to the values of NPCR, UACI and PSNR, the anti-blocking ability of encryption algorithm in each scheme is measured, as shown in
Table 13. Scheme 9 shows good encryption effect on UACI and PSNR values.
Gaussian white noise with mean 0, standard deviation 1 and variance 1 is added to the encrypted image. The wheat encryption image with white Gaussian noise in Gaoping City based on scheme 1 is shown in
Figure 5(a), and the decrypted result is shown in
Figure 5(b). According to the values of NPCR, UACI and PSNR, the anti-noise ability of encryption schemes in each scheme is measured, as shown in
Table 14. Scheme 8 has good performance on NPCR values, and Scheme 9 shows good encryption effect on UACI and PSNR values.
4.9. Experimental summary
In summary, Scheme 9 shows good performance in correlation, UACI value, GVD value, PSNR value, anti-blocking attack ability and anti-noise attack ability. Its key space size is second only to scheme 8 with the largest key space size, but its variance, standard deviation and anti-entropy attack ability are the worst. Scheme 8 shows good performance in key space size, entropy value and anti-noise attack ability. The variance, standard deviation and entropy of scheme 7 are the best. Scheme 1 is closest to the theoretical expected value of NPCR at 99.6094% and has good entropy. Although the key space of scheme 6 and scheme 10 is the smallest, it is much larger than the value that can resist brute force attacks.
