Submitted:
19 January 2024
Posted:
19 January 2024
You are already at the latest version
Abstract
Keywords:
1. Introduction
- Closed-form solutions (SHAKE, SHAKE91, DEEPSOIL, etc) in the frequency domain are available for one-dimensional shear wave propagation in the linearly viscous elastic system subjected to base accelerations.
- Numerical finite element solutions as the time domain analysis can be directly compared to such closed-form solutions in the free-fields including lateral boundary so that we can assess the accuracy of numerical solutions.
2. Linear Frequency Domain Analysis
2.1. Main Algorithm of the Frequency Domain Analysis
2.2. Site Profile and Response Spectra for Input Earthquake
2.3. Analysis Results
3. Linear Time Domain Analysis
3.1. Finite Element Formulations of Dynamic Equation
| Fundamental natural circular frequency of the system | |
| Predominant circular frequency of the input earthquake motion | |
| Critical damping ratio in an element |
3.2. Computer Programs for Free Field Analysis
- Lumped mass matrix as implicitly used by the frequency domain analysis
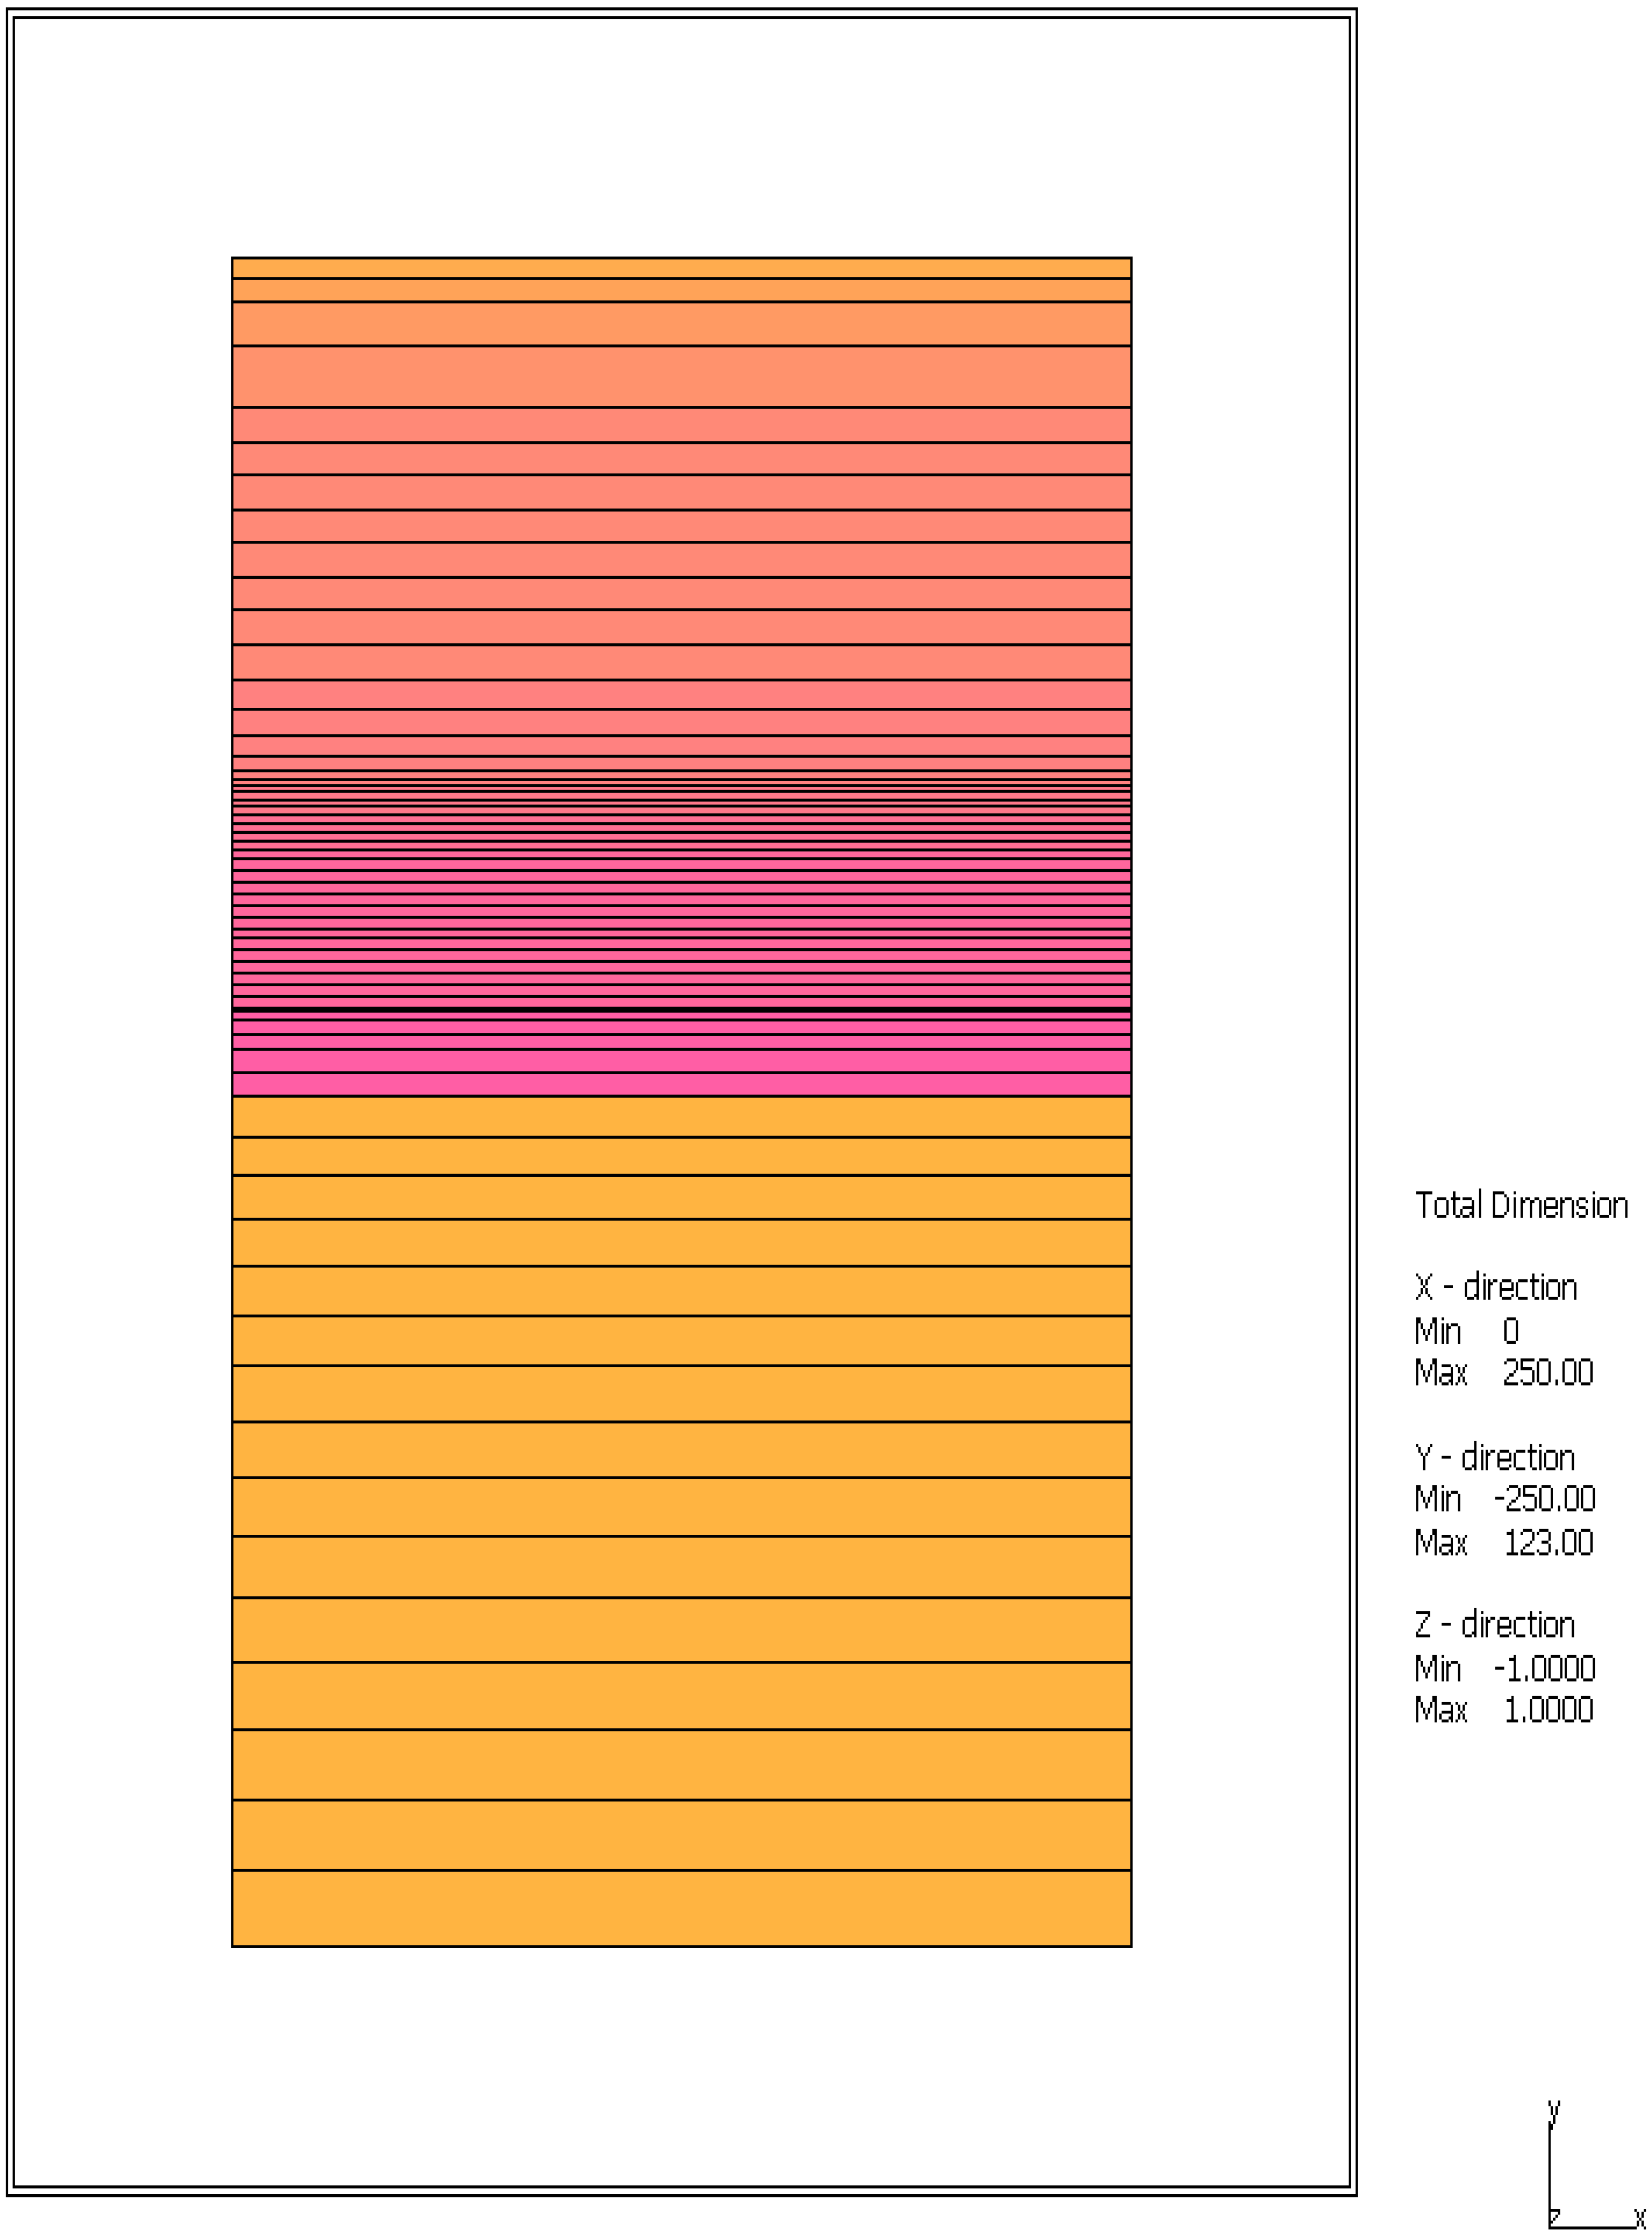
- Transmitting boundary on bottom of finite element mesh to represent the elastic half-space
-
Two methods for applying external earthquake loadings [11]
- Method 1: Base accelerations to relative displacement fields as the conventional procedure
- Method 2: Base shear forces associated with base velocities
- Newmark average acceleration method for the time integration
3.3. Analysis Results
4. Linear Frequency vs Linear Time Domain Analysis
4.1. General
4.2. Analysis Results
5. Conclusions
- Closed-form solutions (SHAKE, SHAKE91, DEEPSOIL, etc) in the frequency domain are available for one-dimensional shear wave propagation in the linearly viscous elastic system subjected to base accelerations.
- Numerical finite element solutions as the time domain analysis can be directly compared to such closed-form solutions in the free-fields including lateral boundary so that we can assess the accuracy of numerical solutions.
- (1)
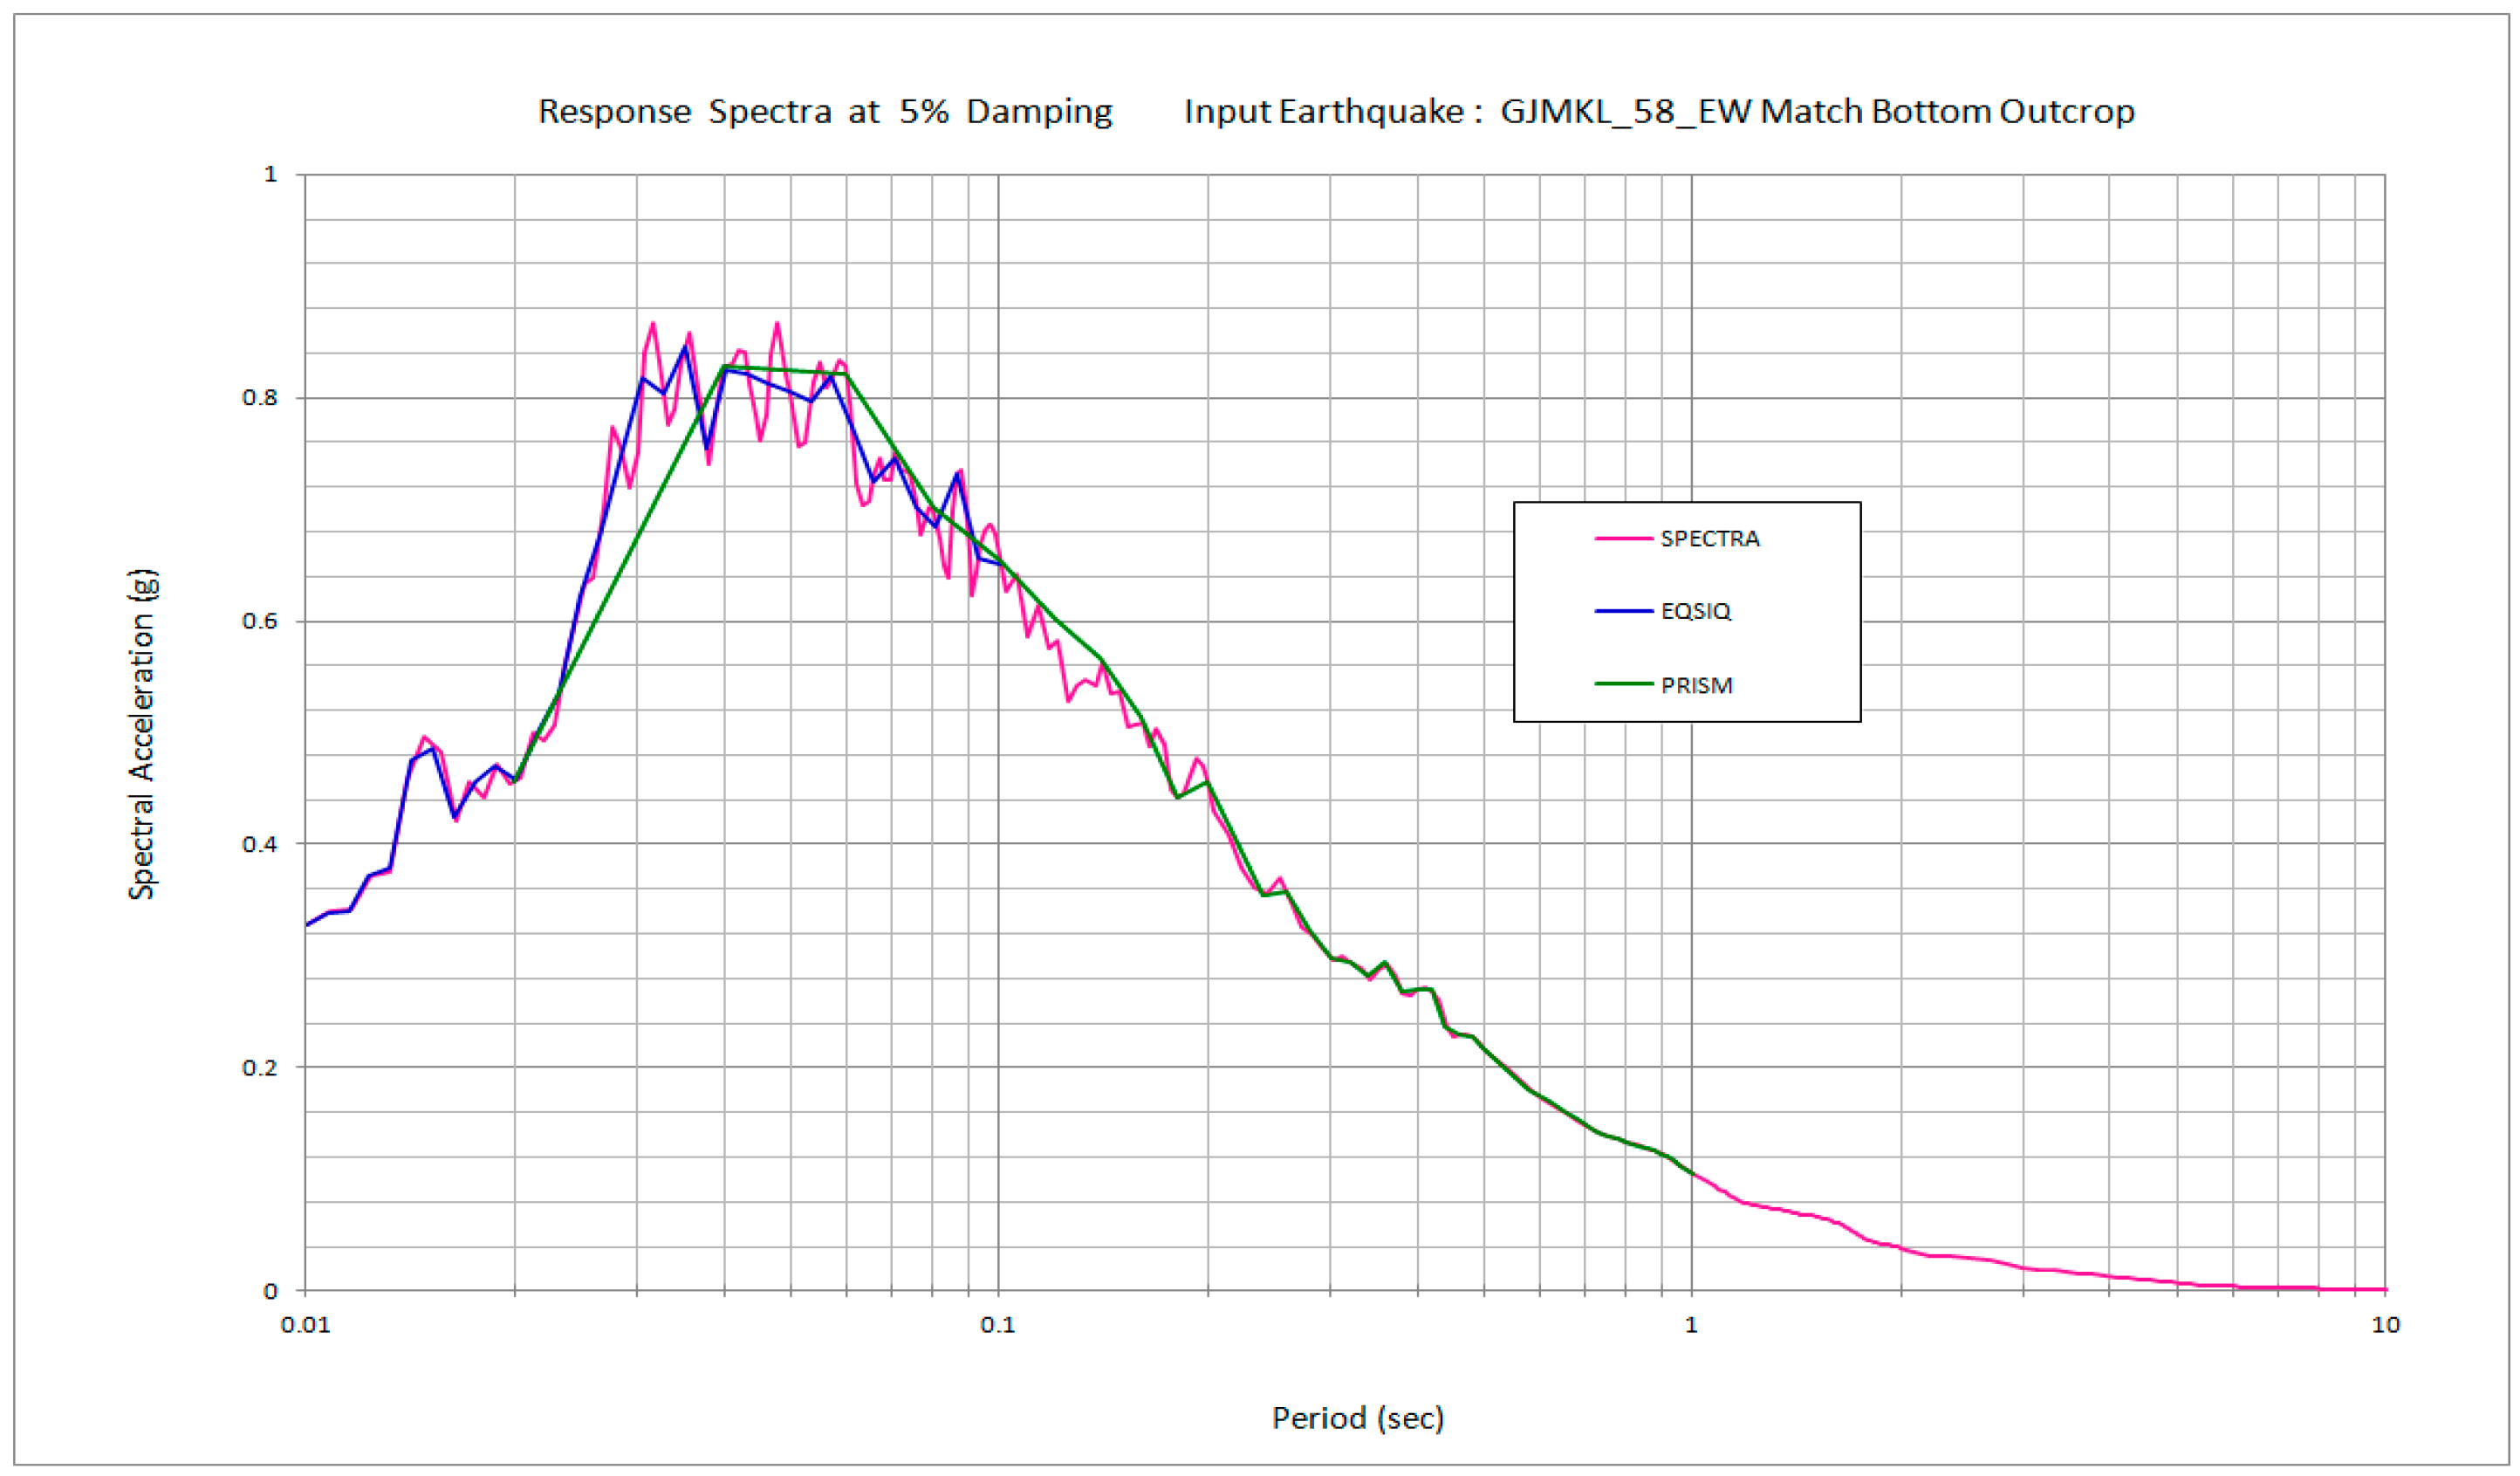
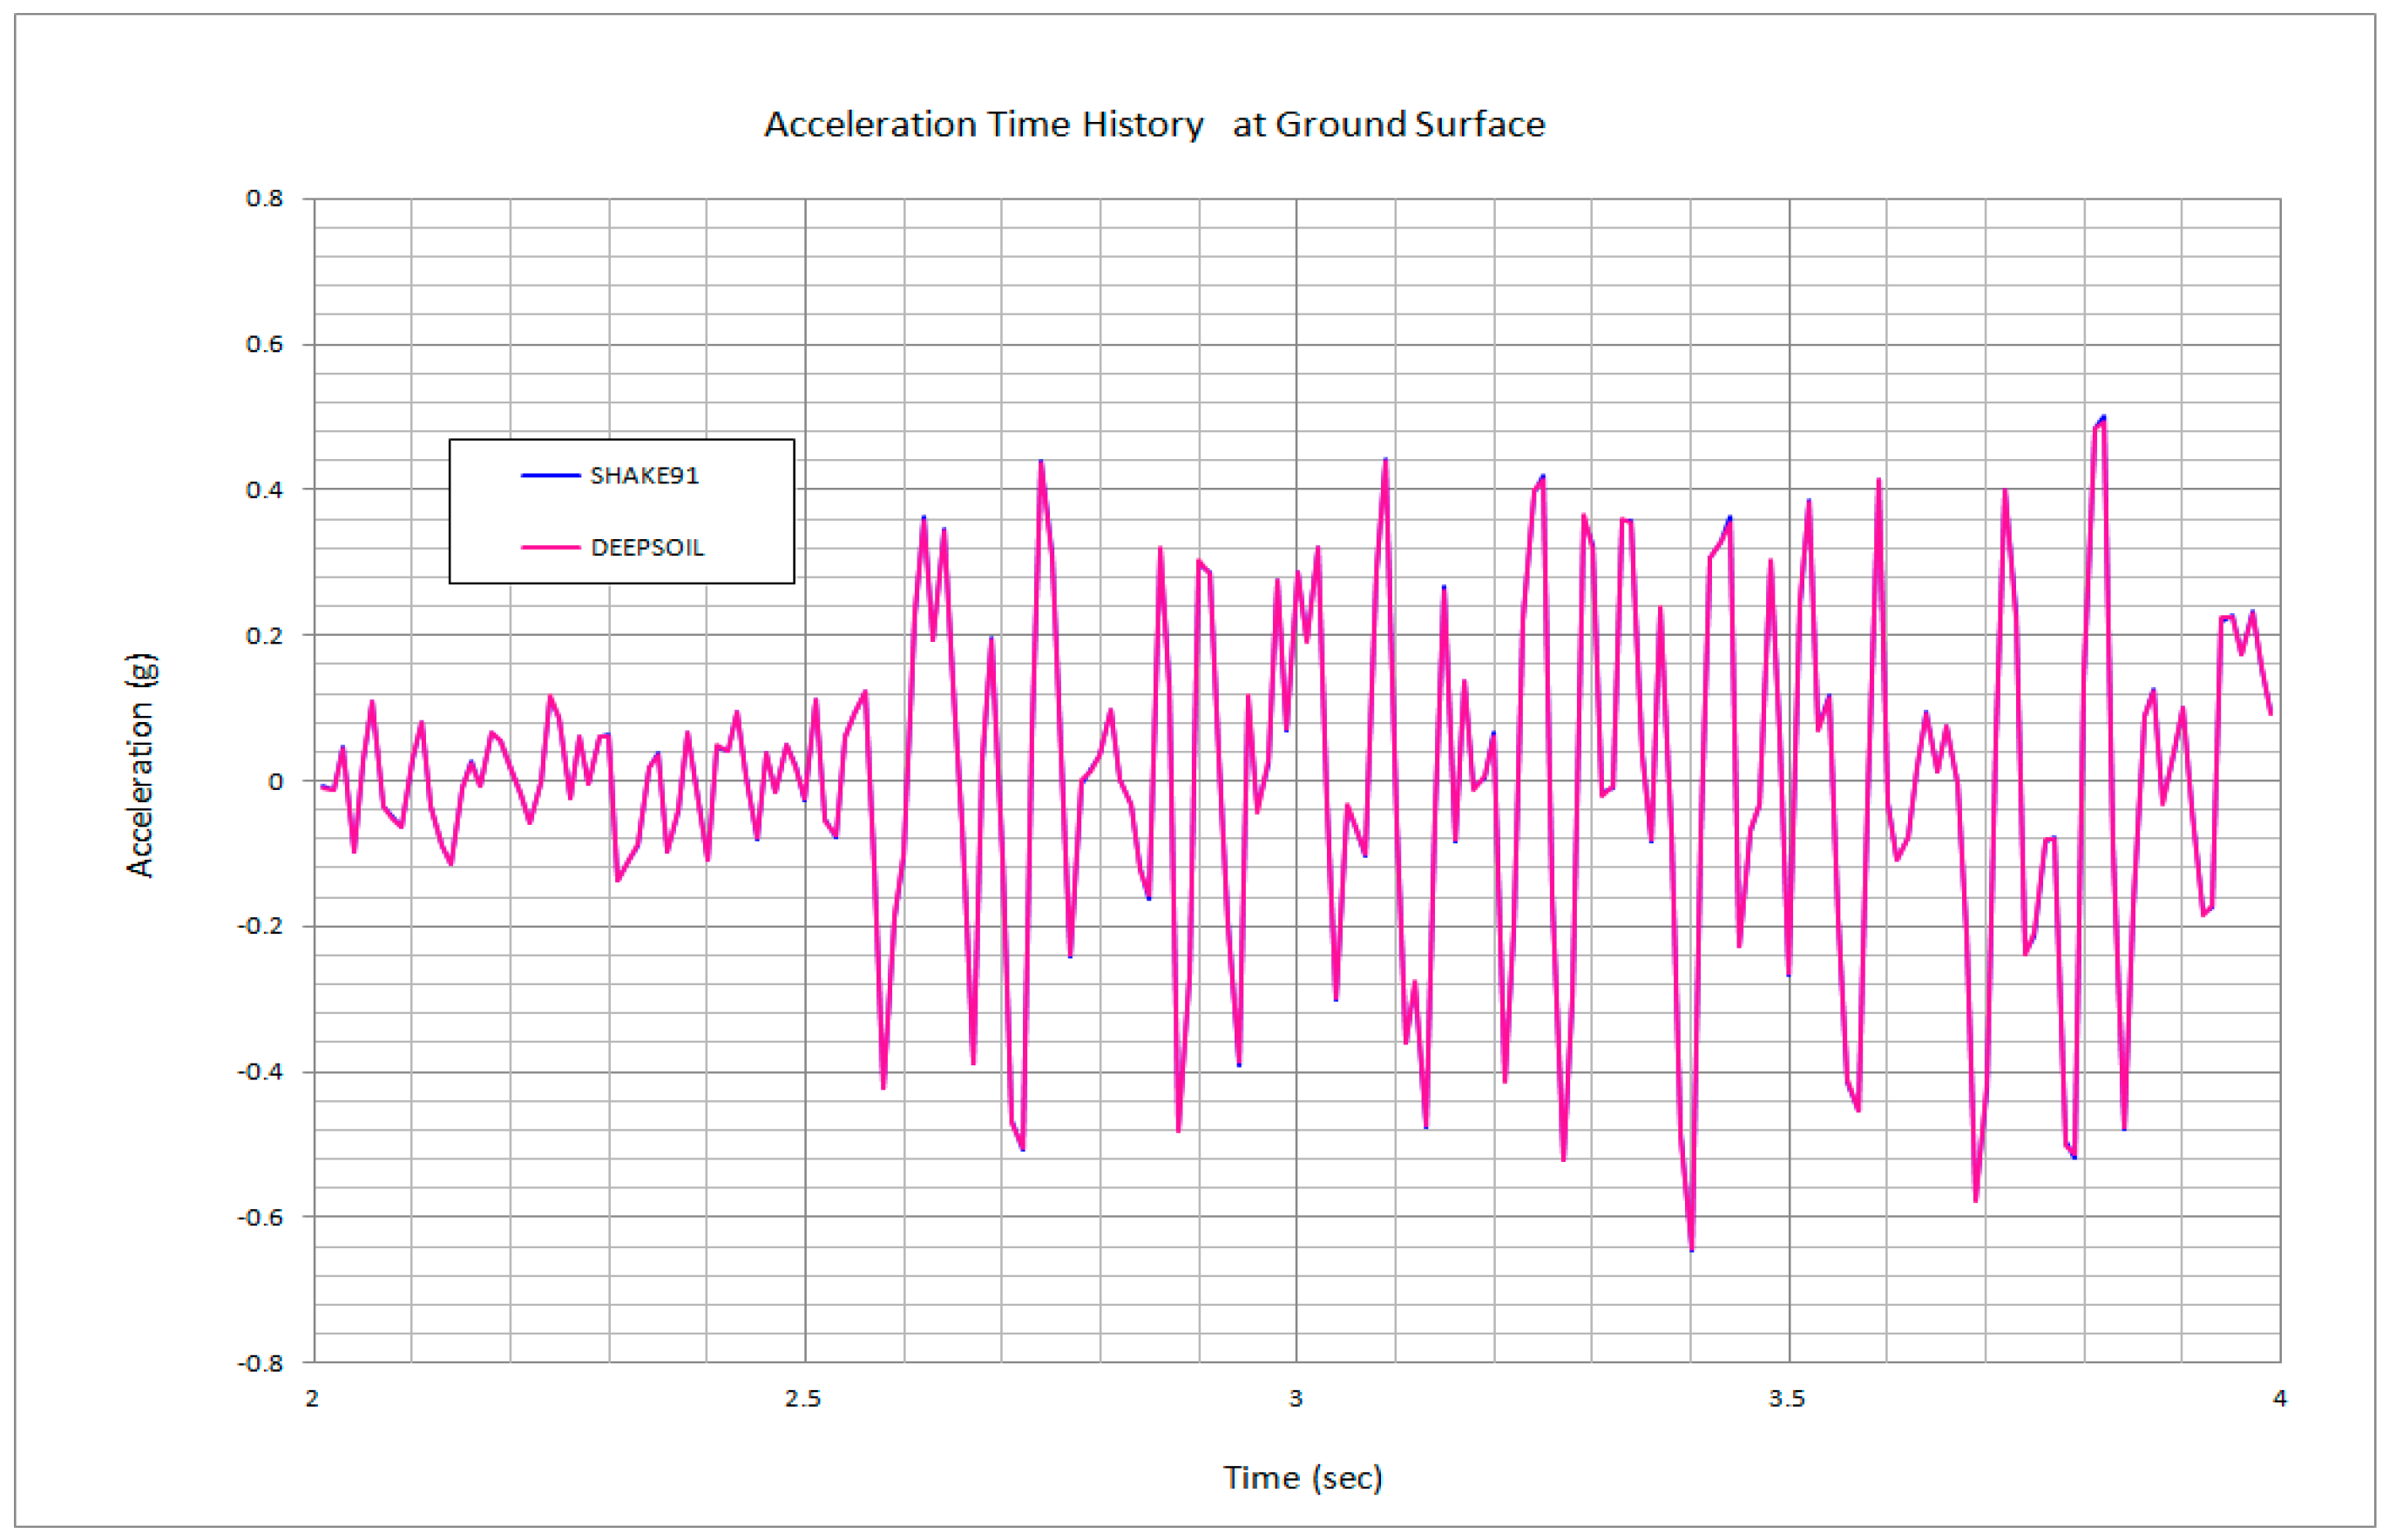
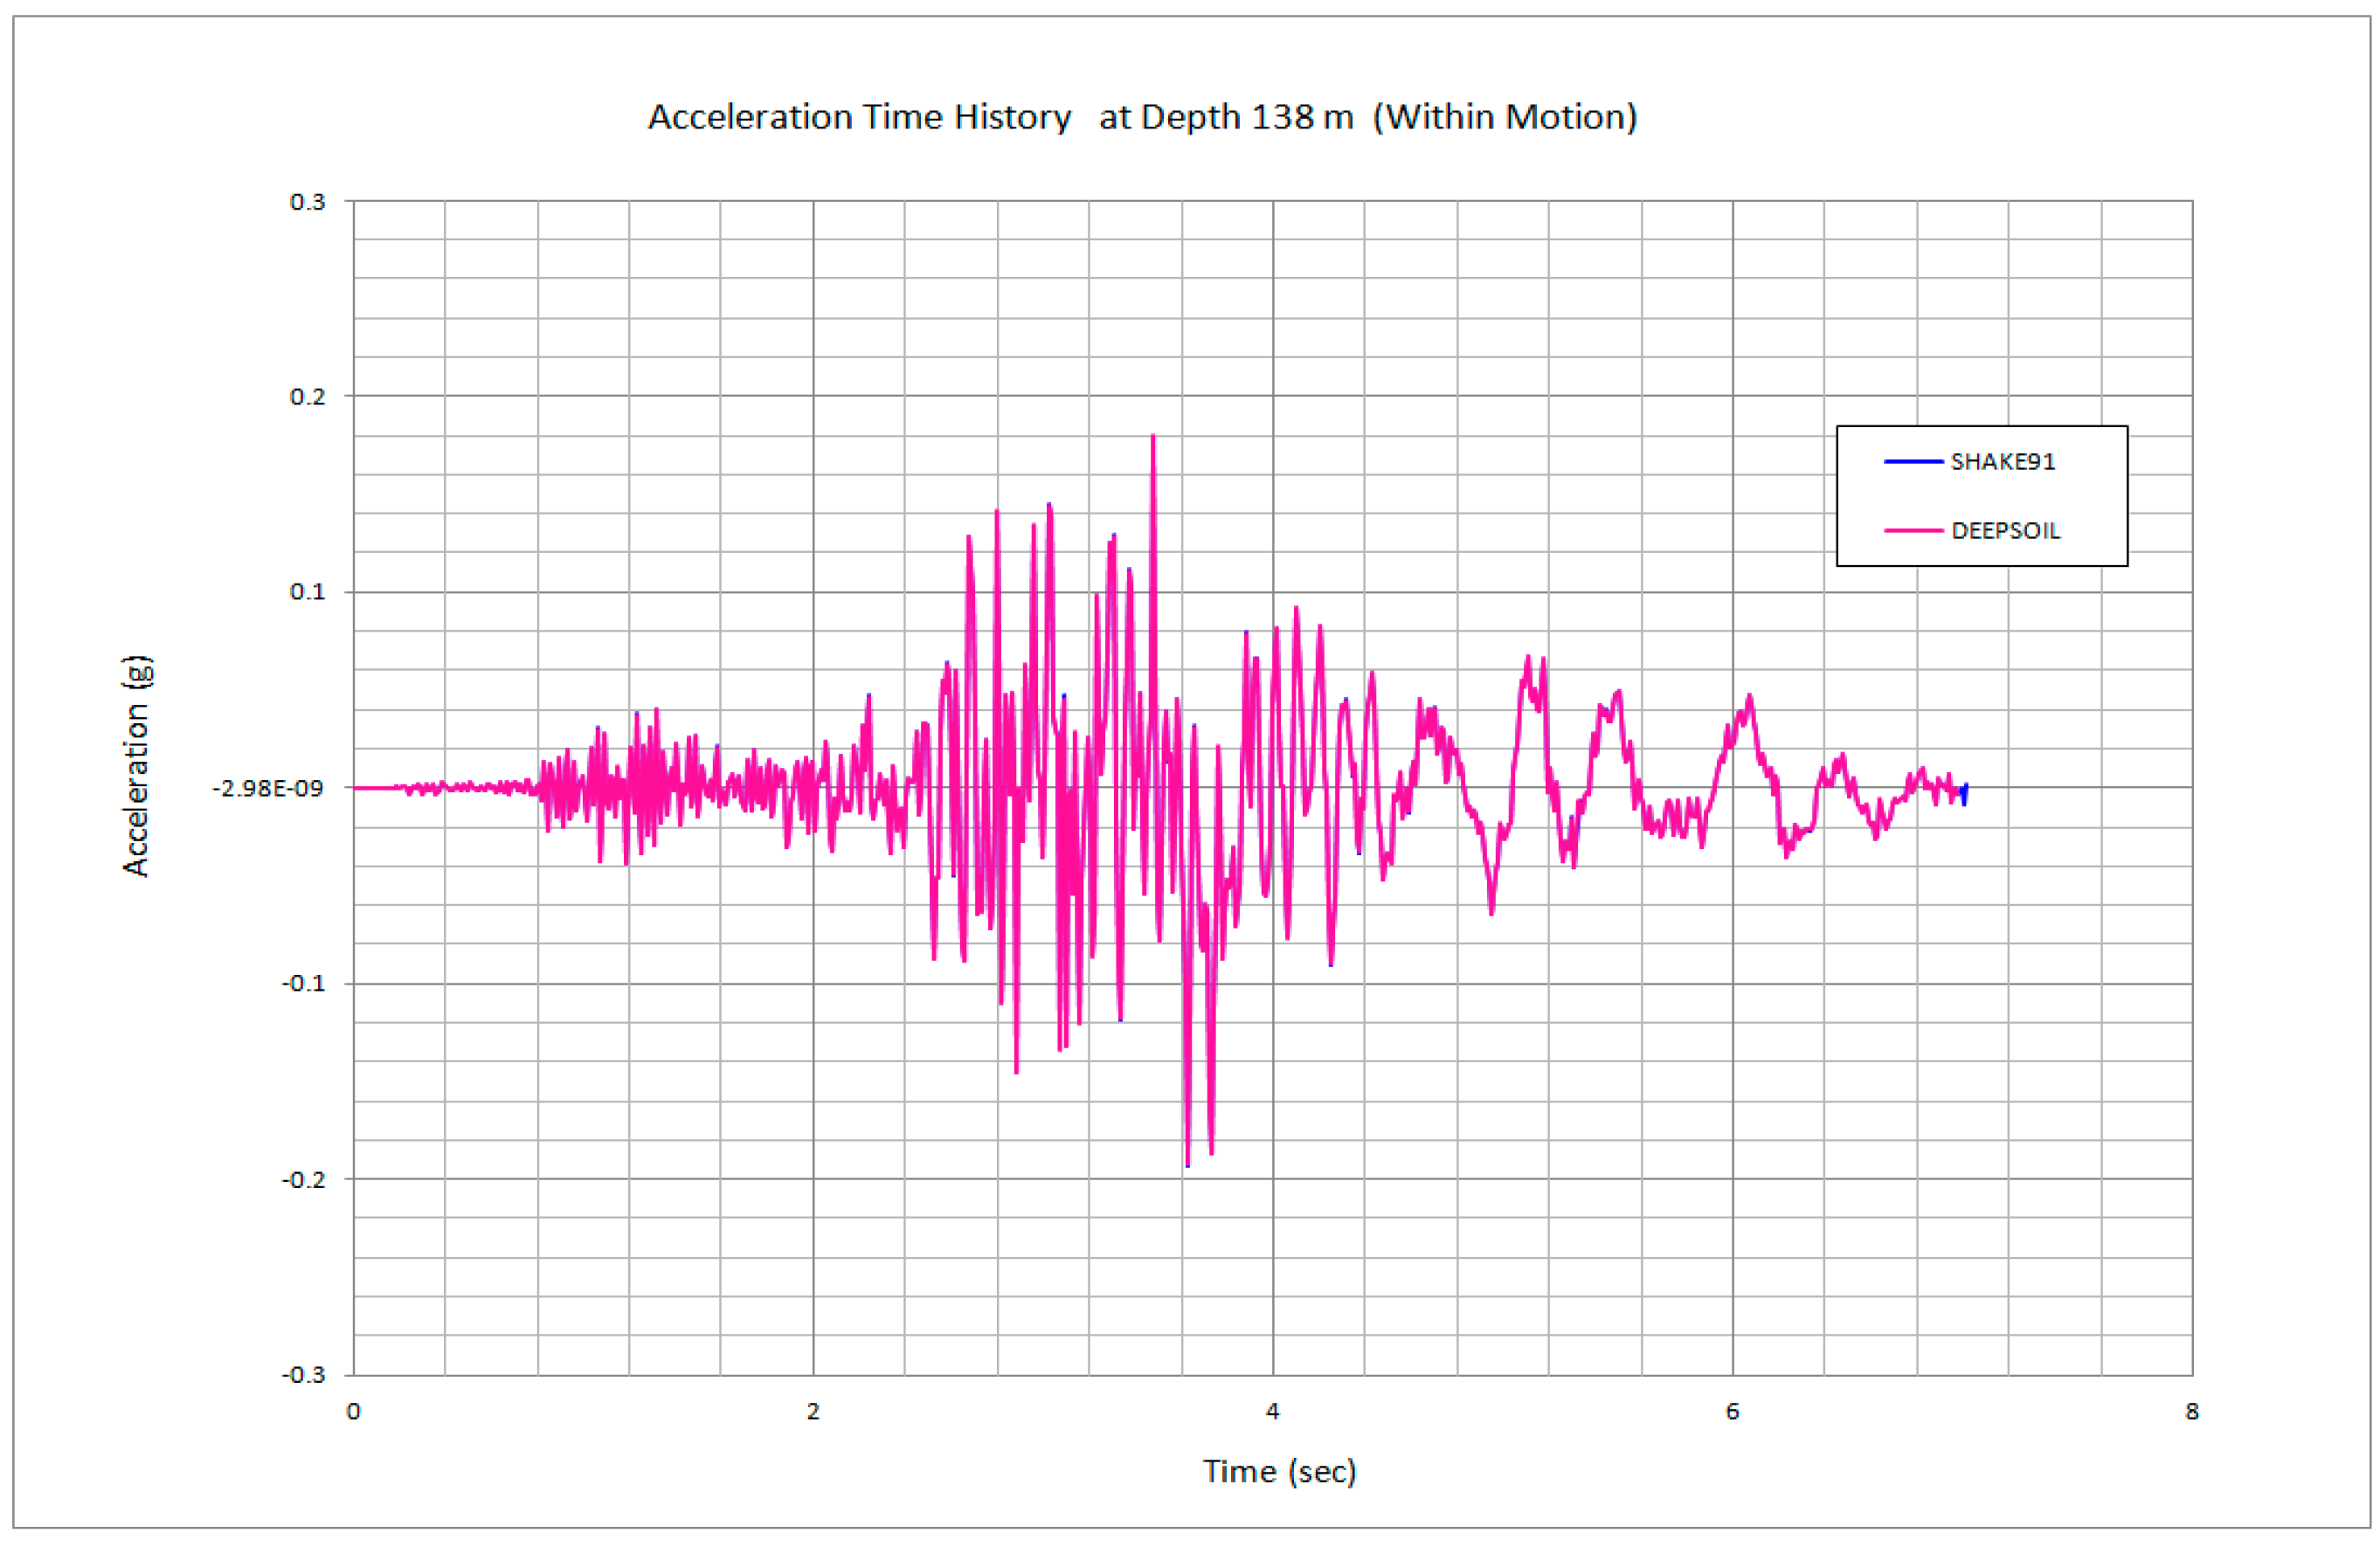
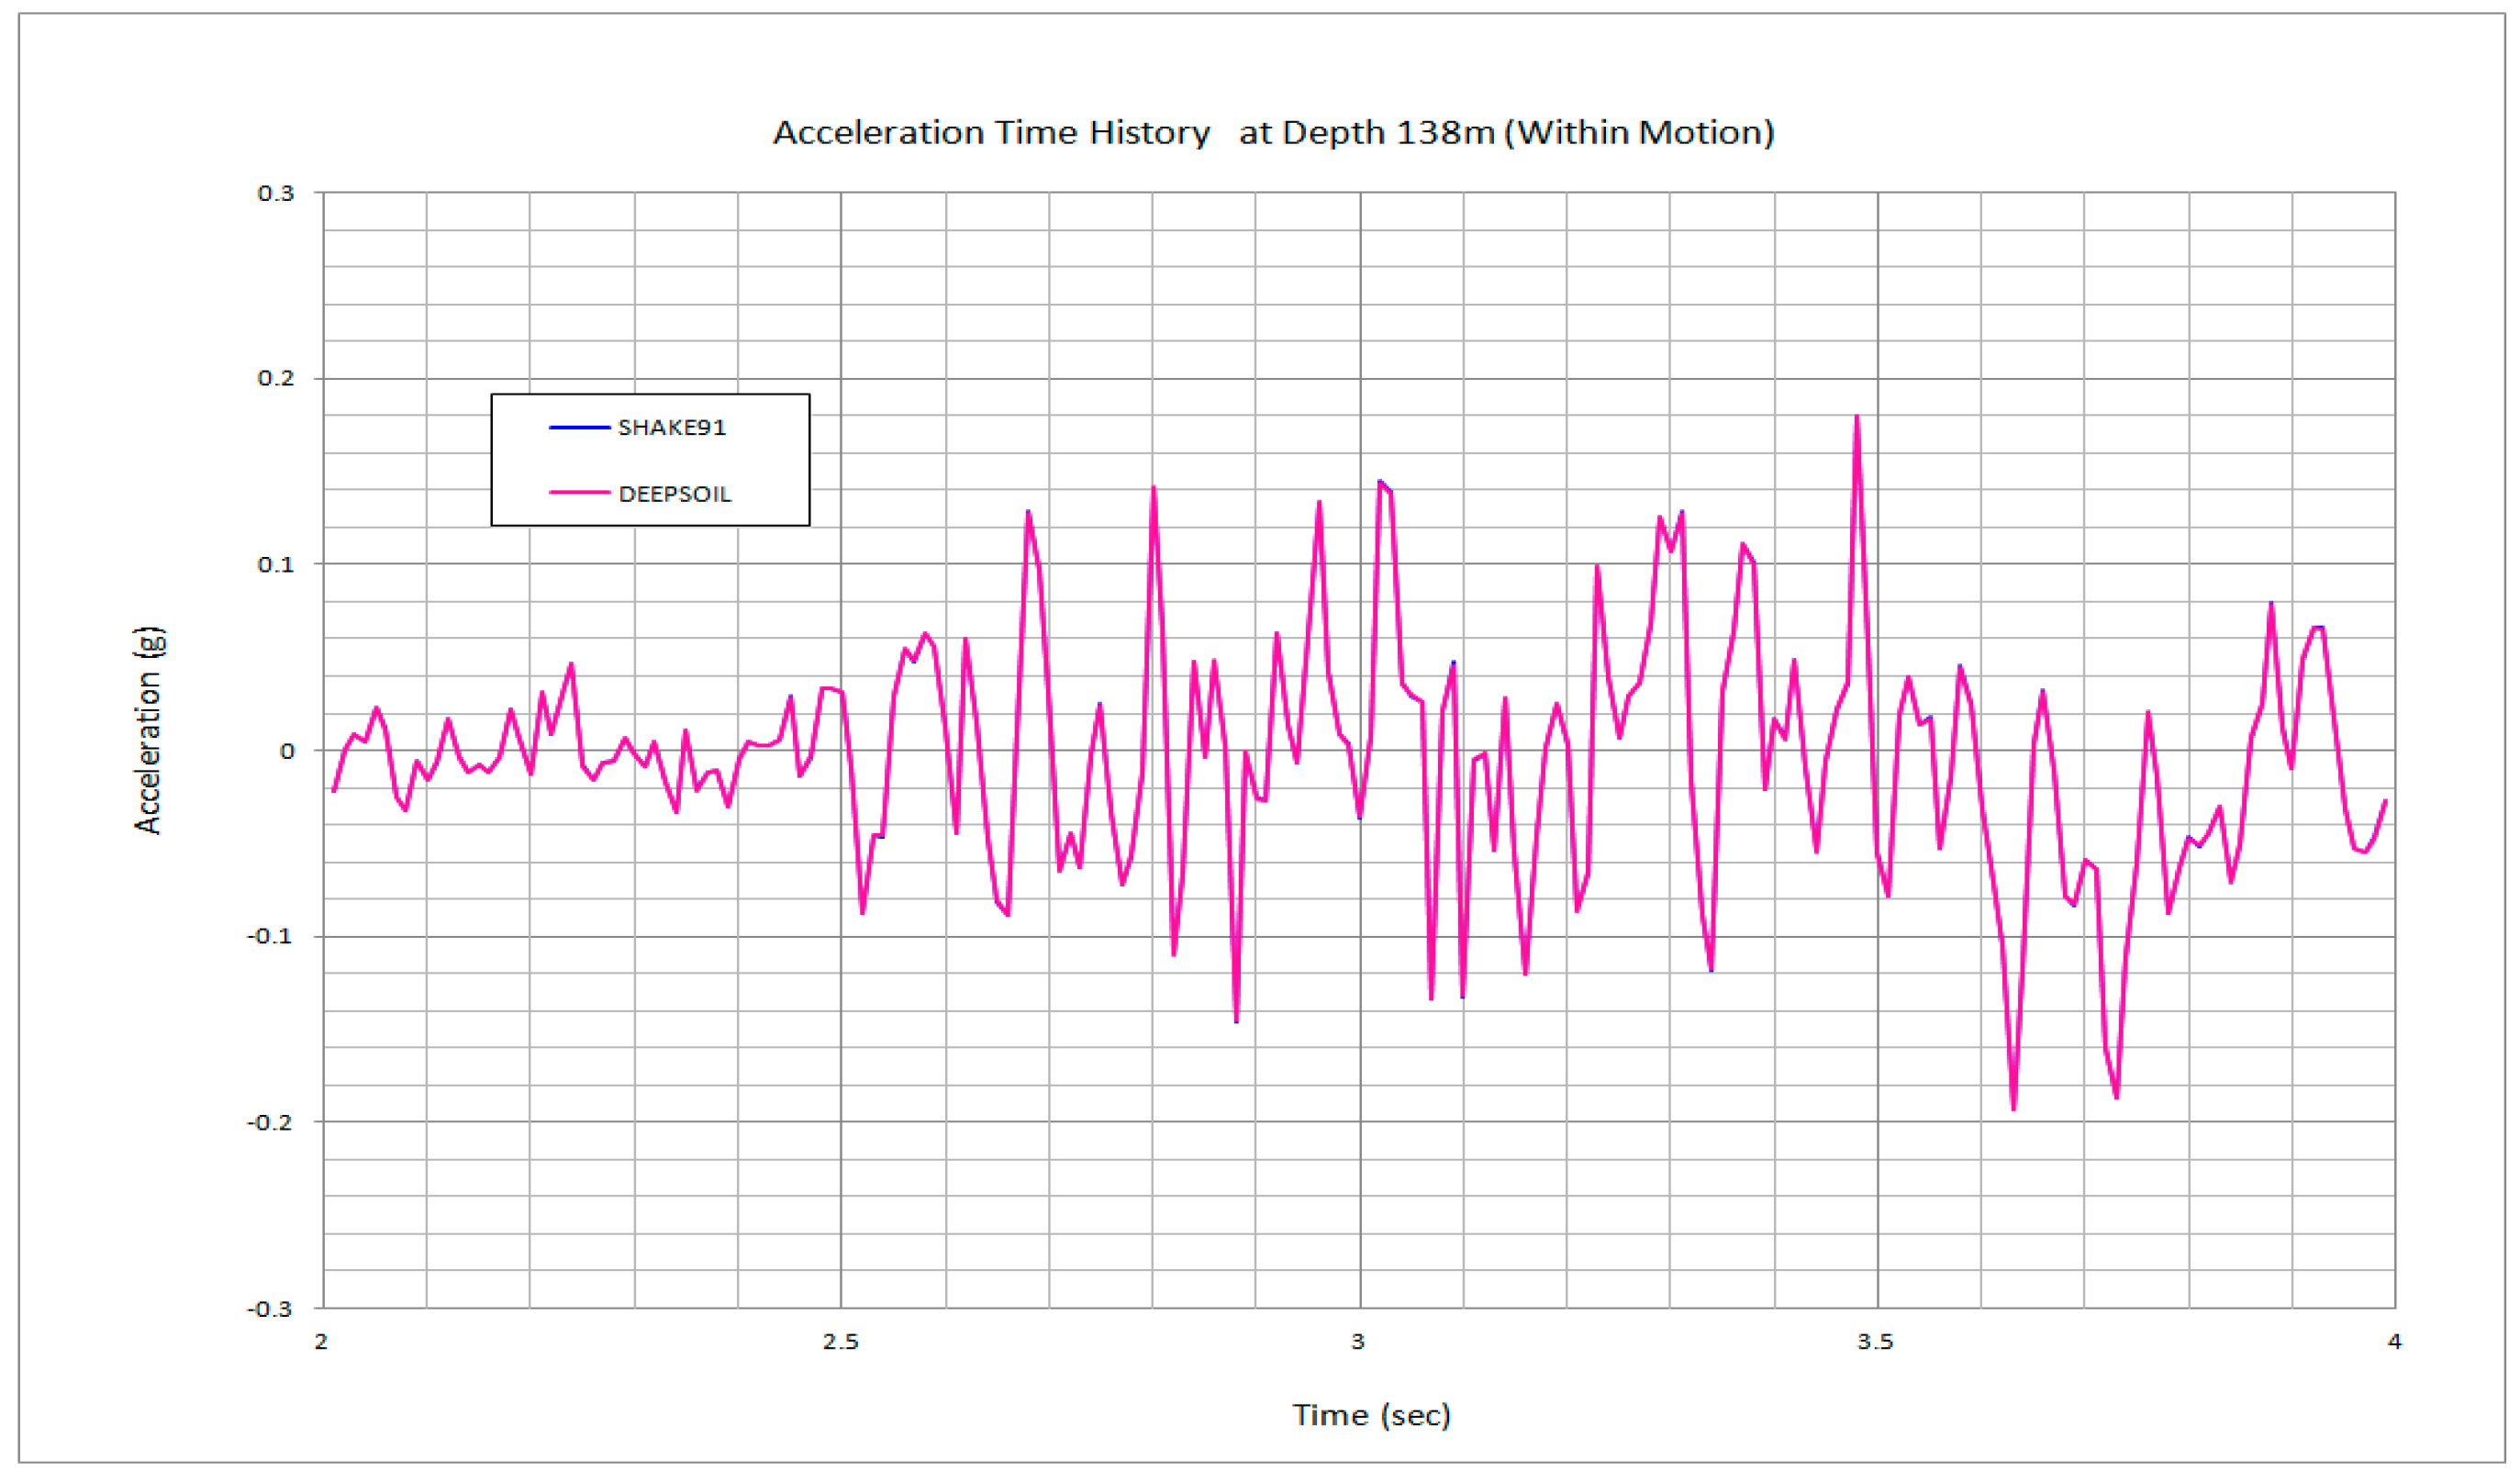
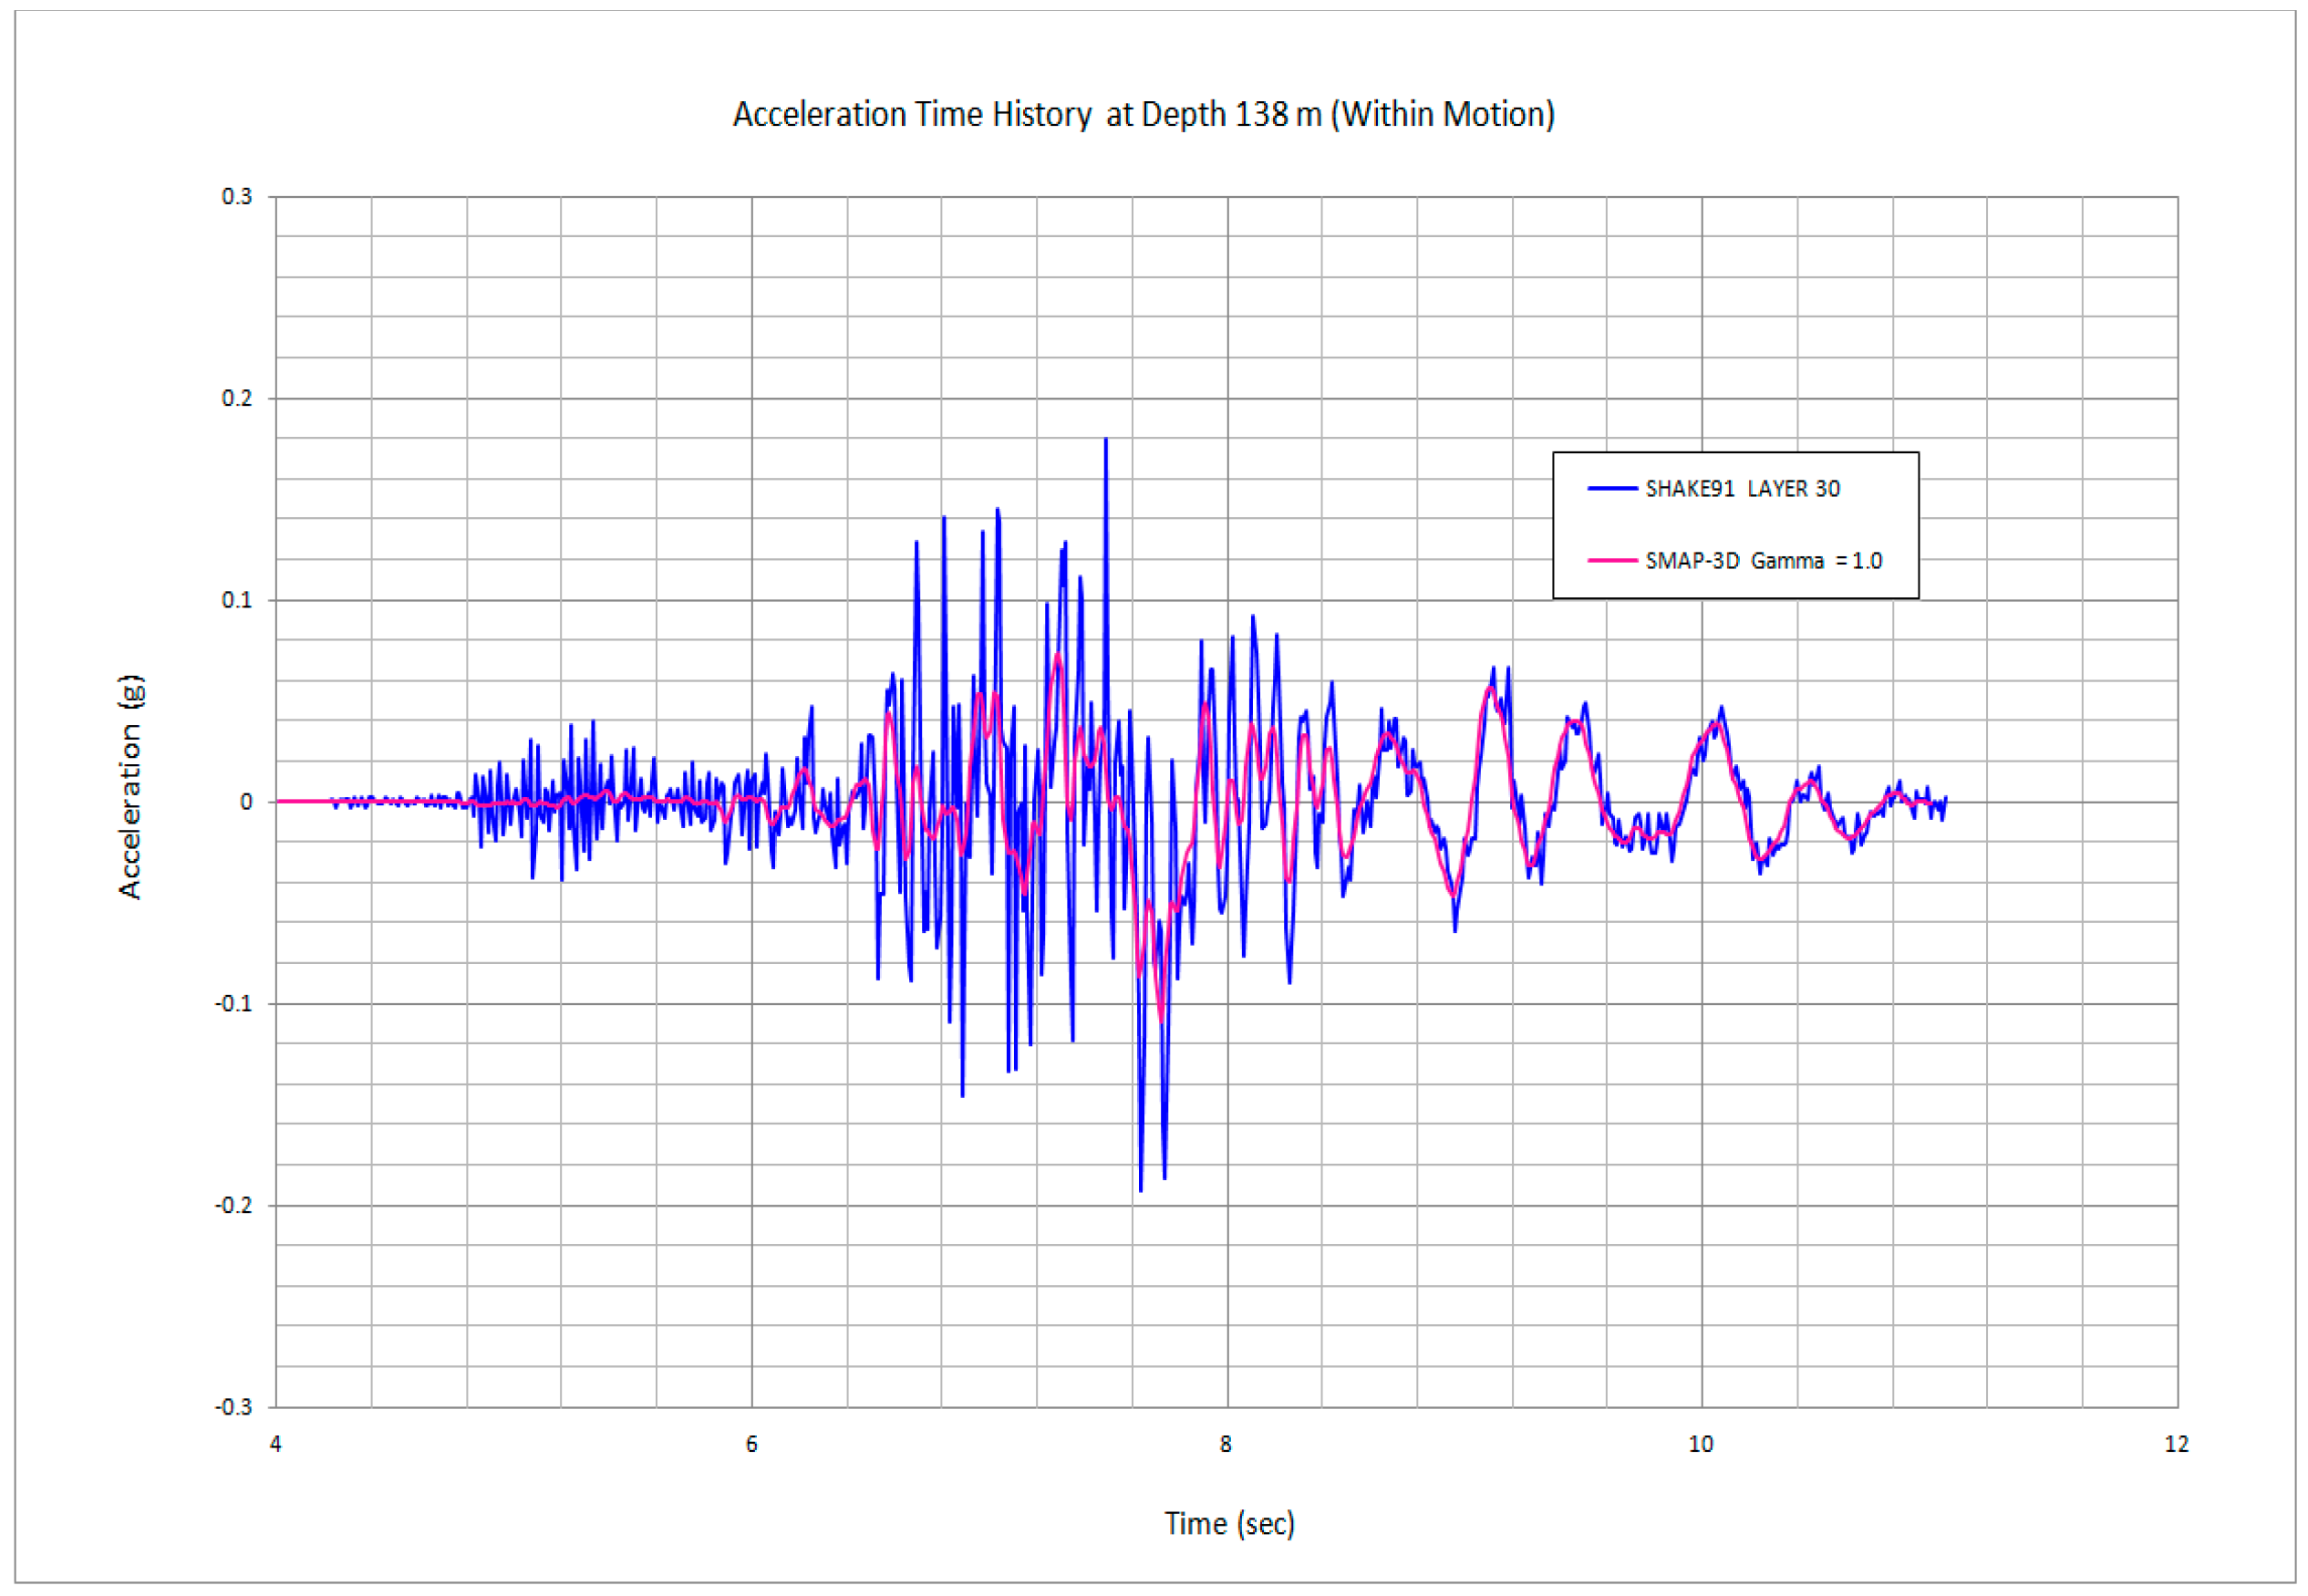
- Two computer programs (SHAKE91 and DEEPSOIL) are selected for the closed-form solutions in frequency domain. The acceleration time histories on the ground surface which compare SHAKE91 to DEEPSOIL show almost identical responses in the time where strong motions occur. The acceleration time histories at the location of the silo mid-height show also almost identical responses in the time where strong motions occur.
- (2)
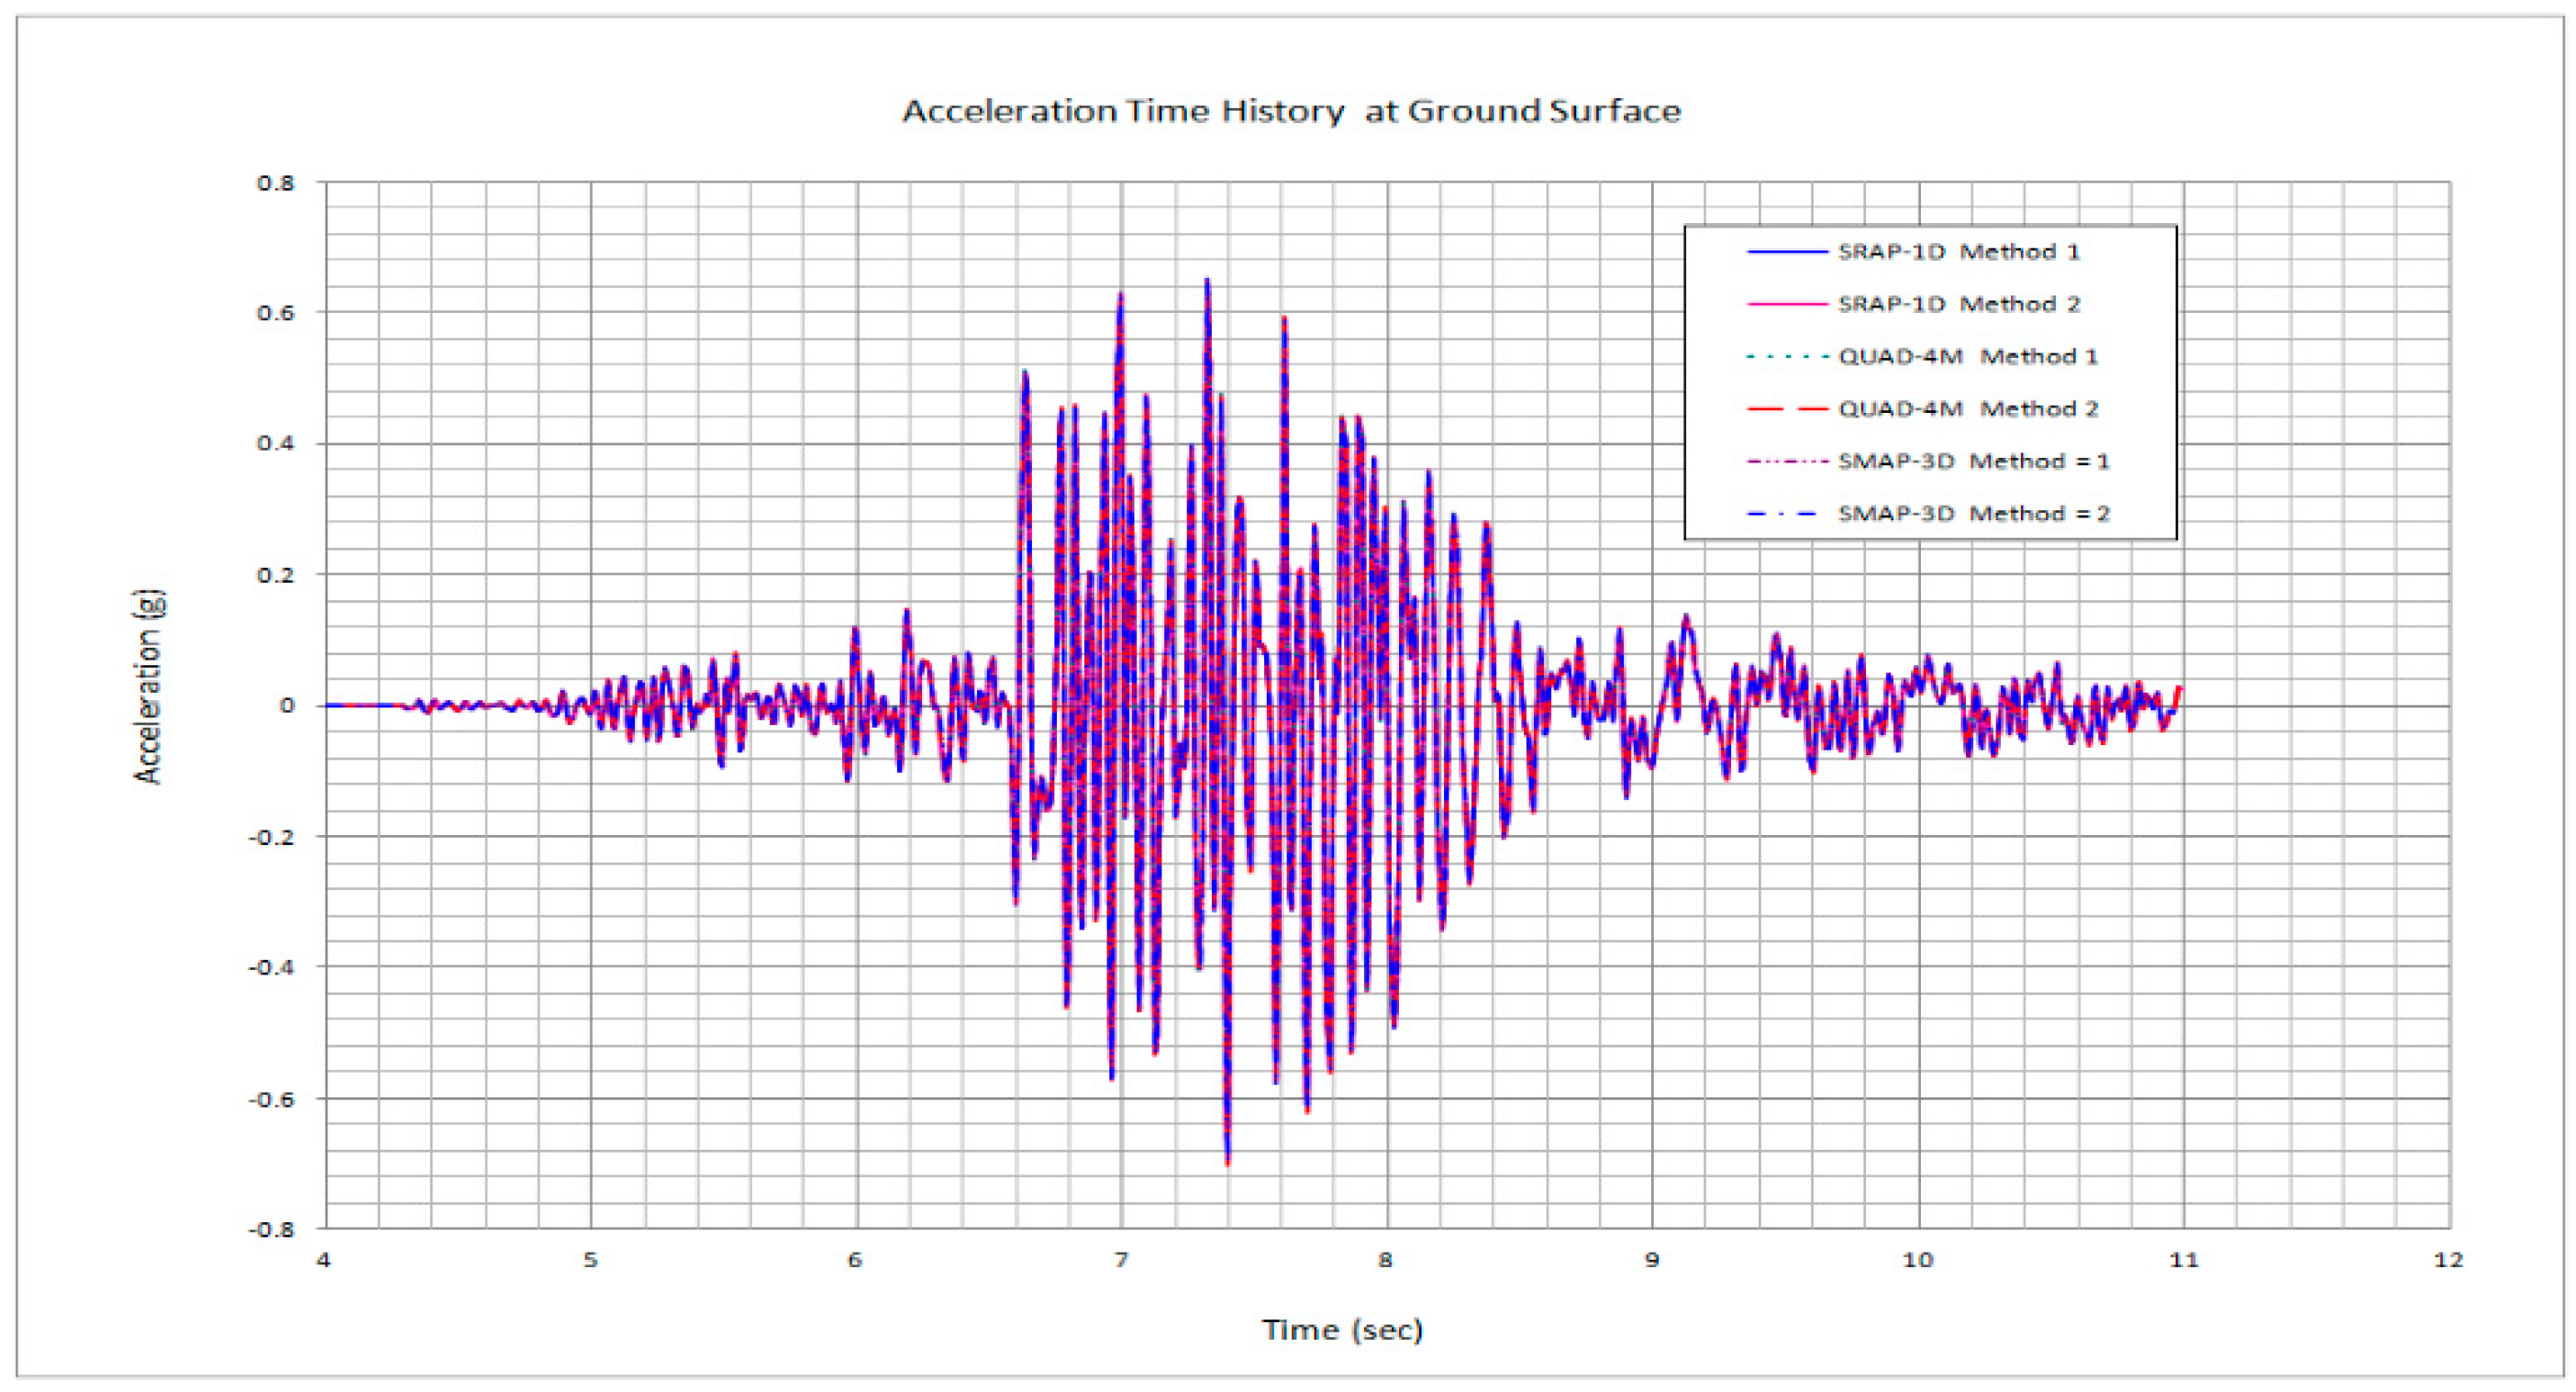
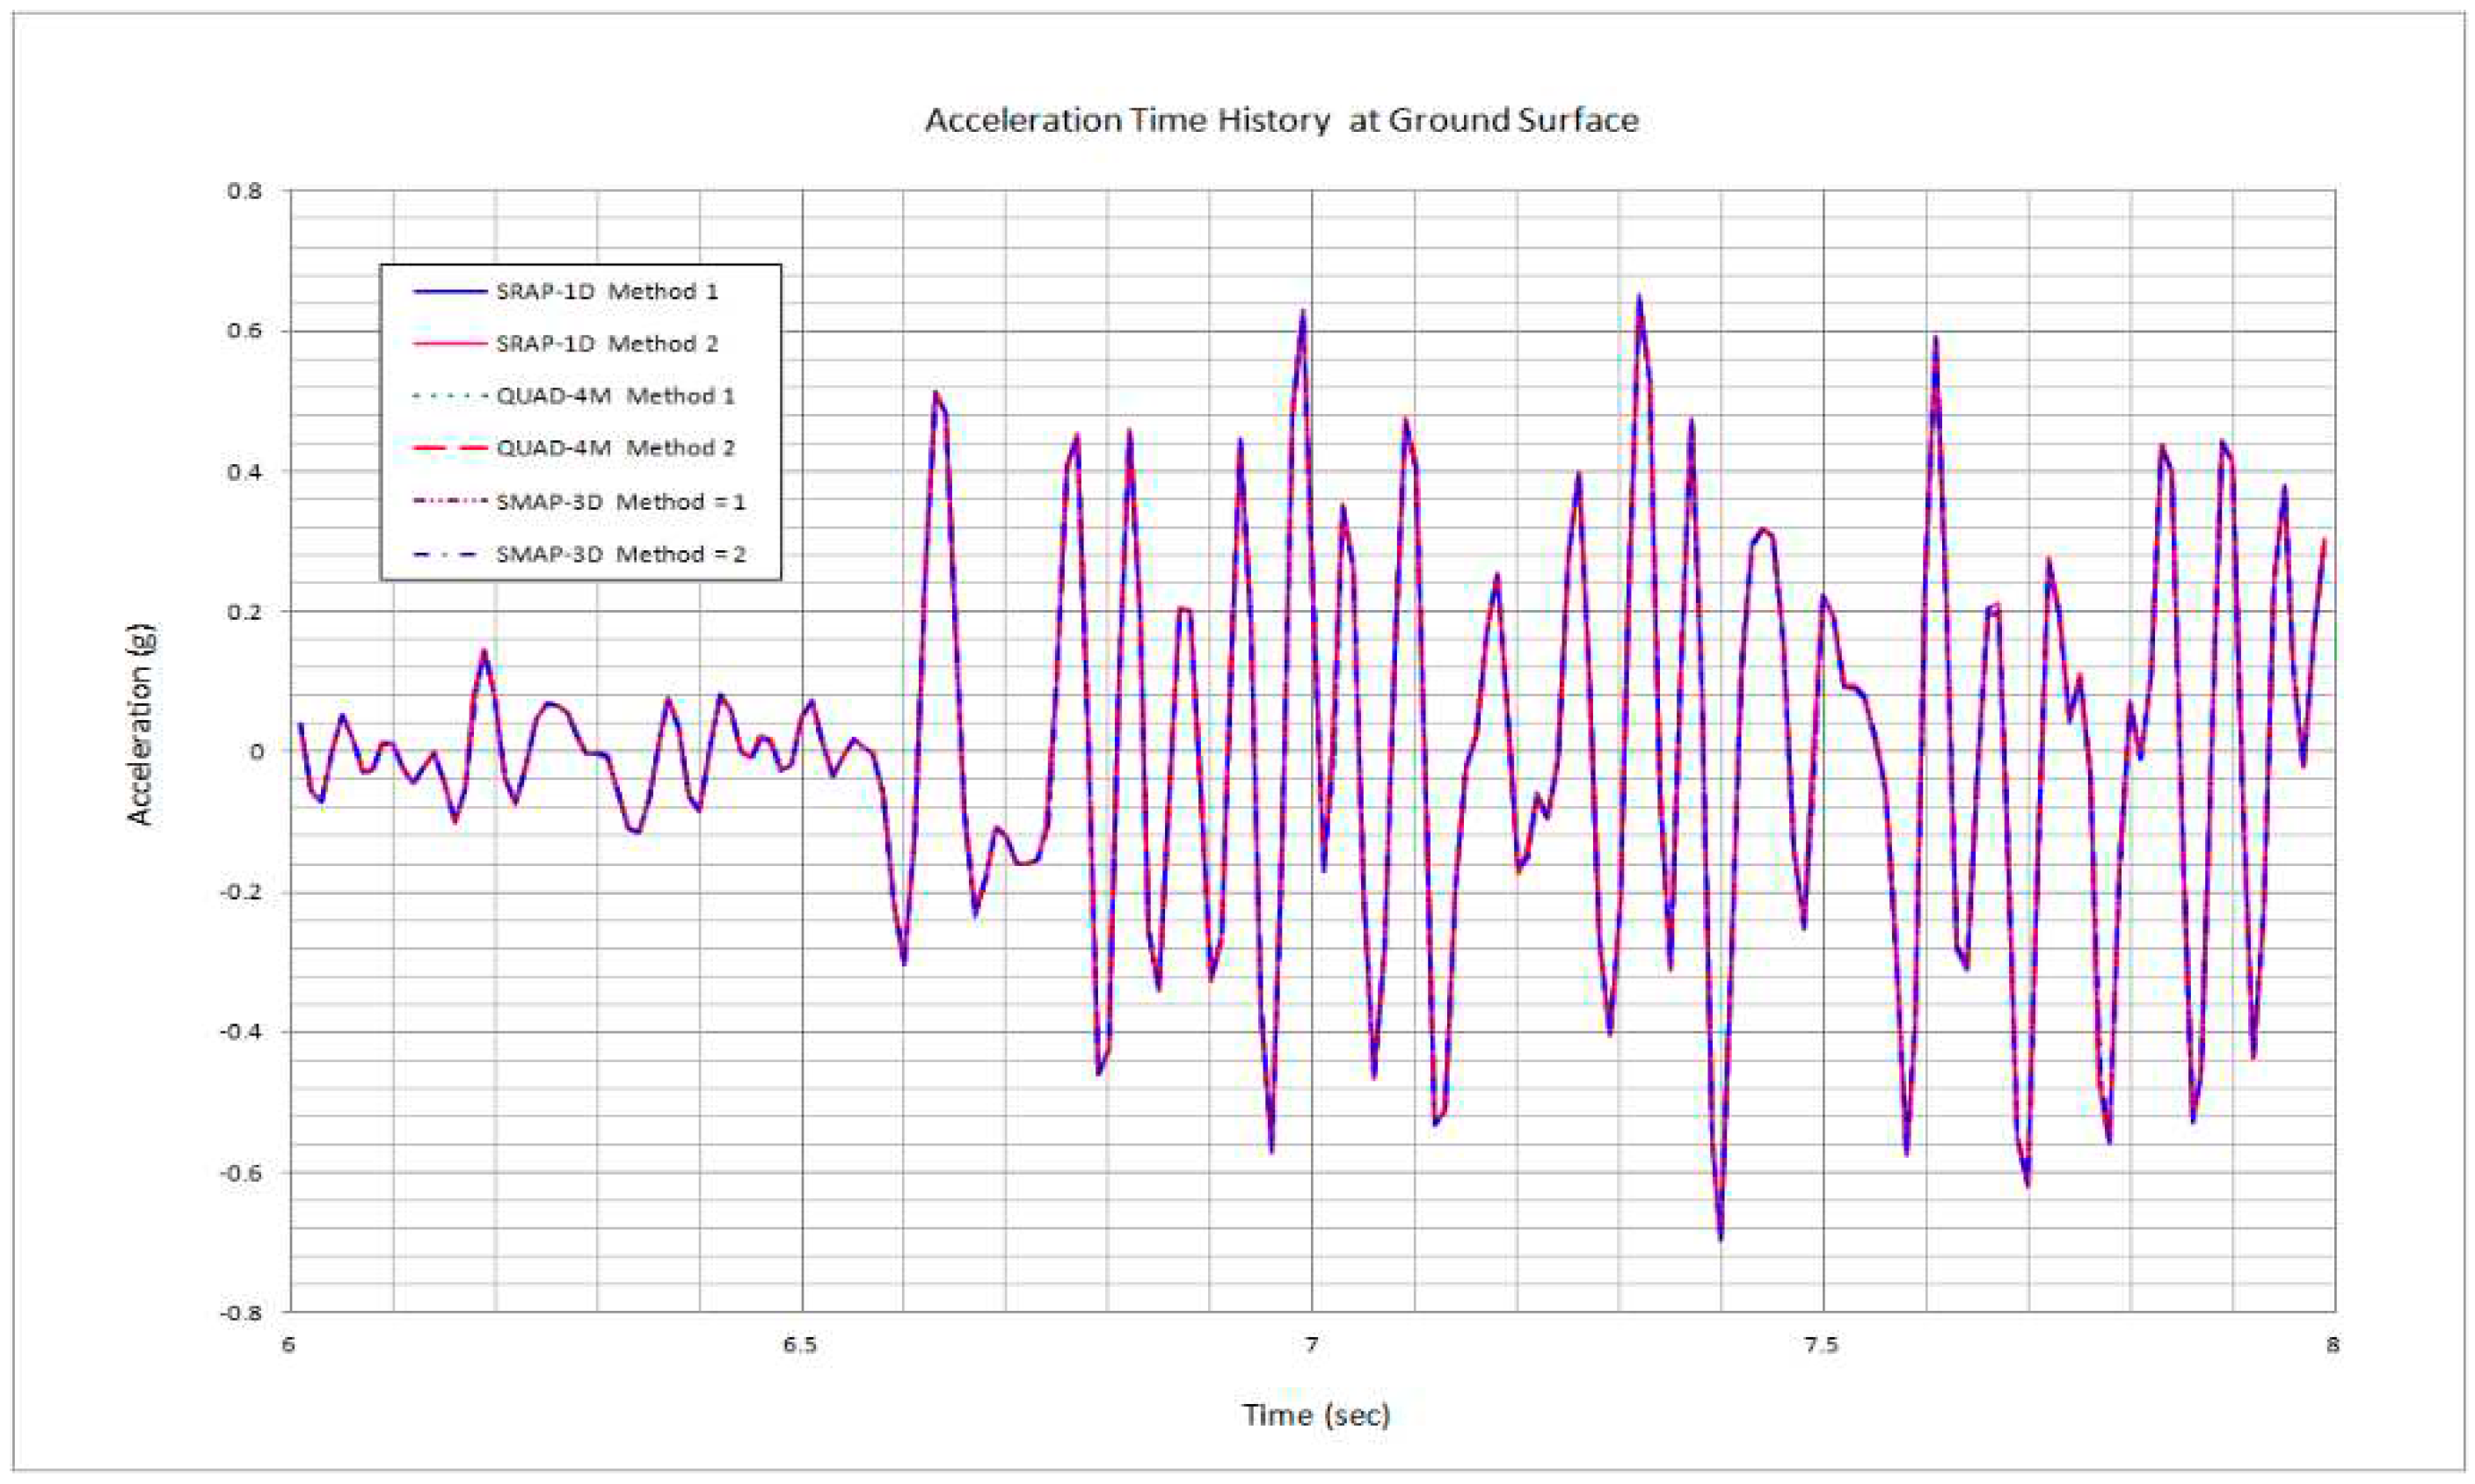
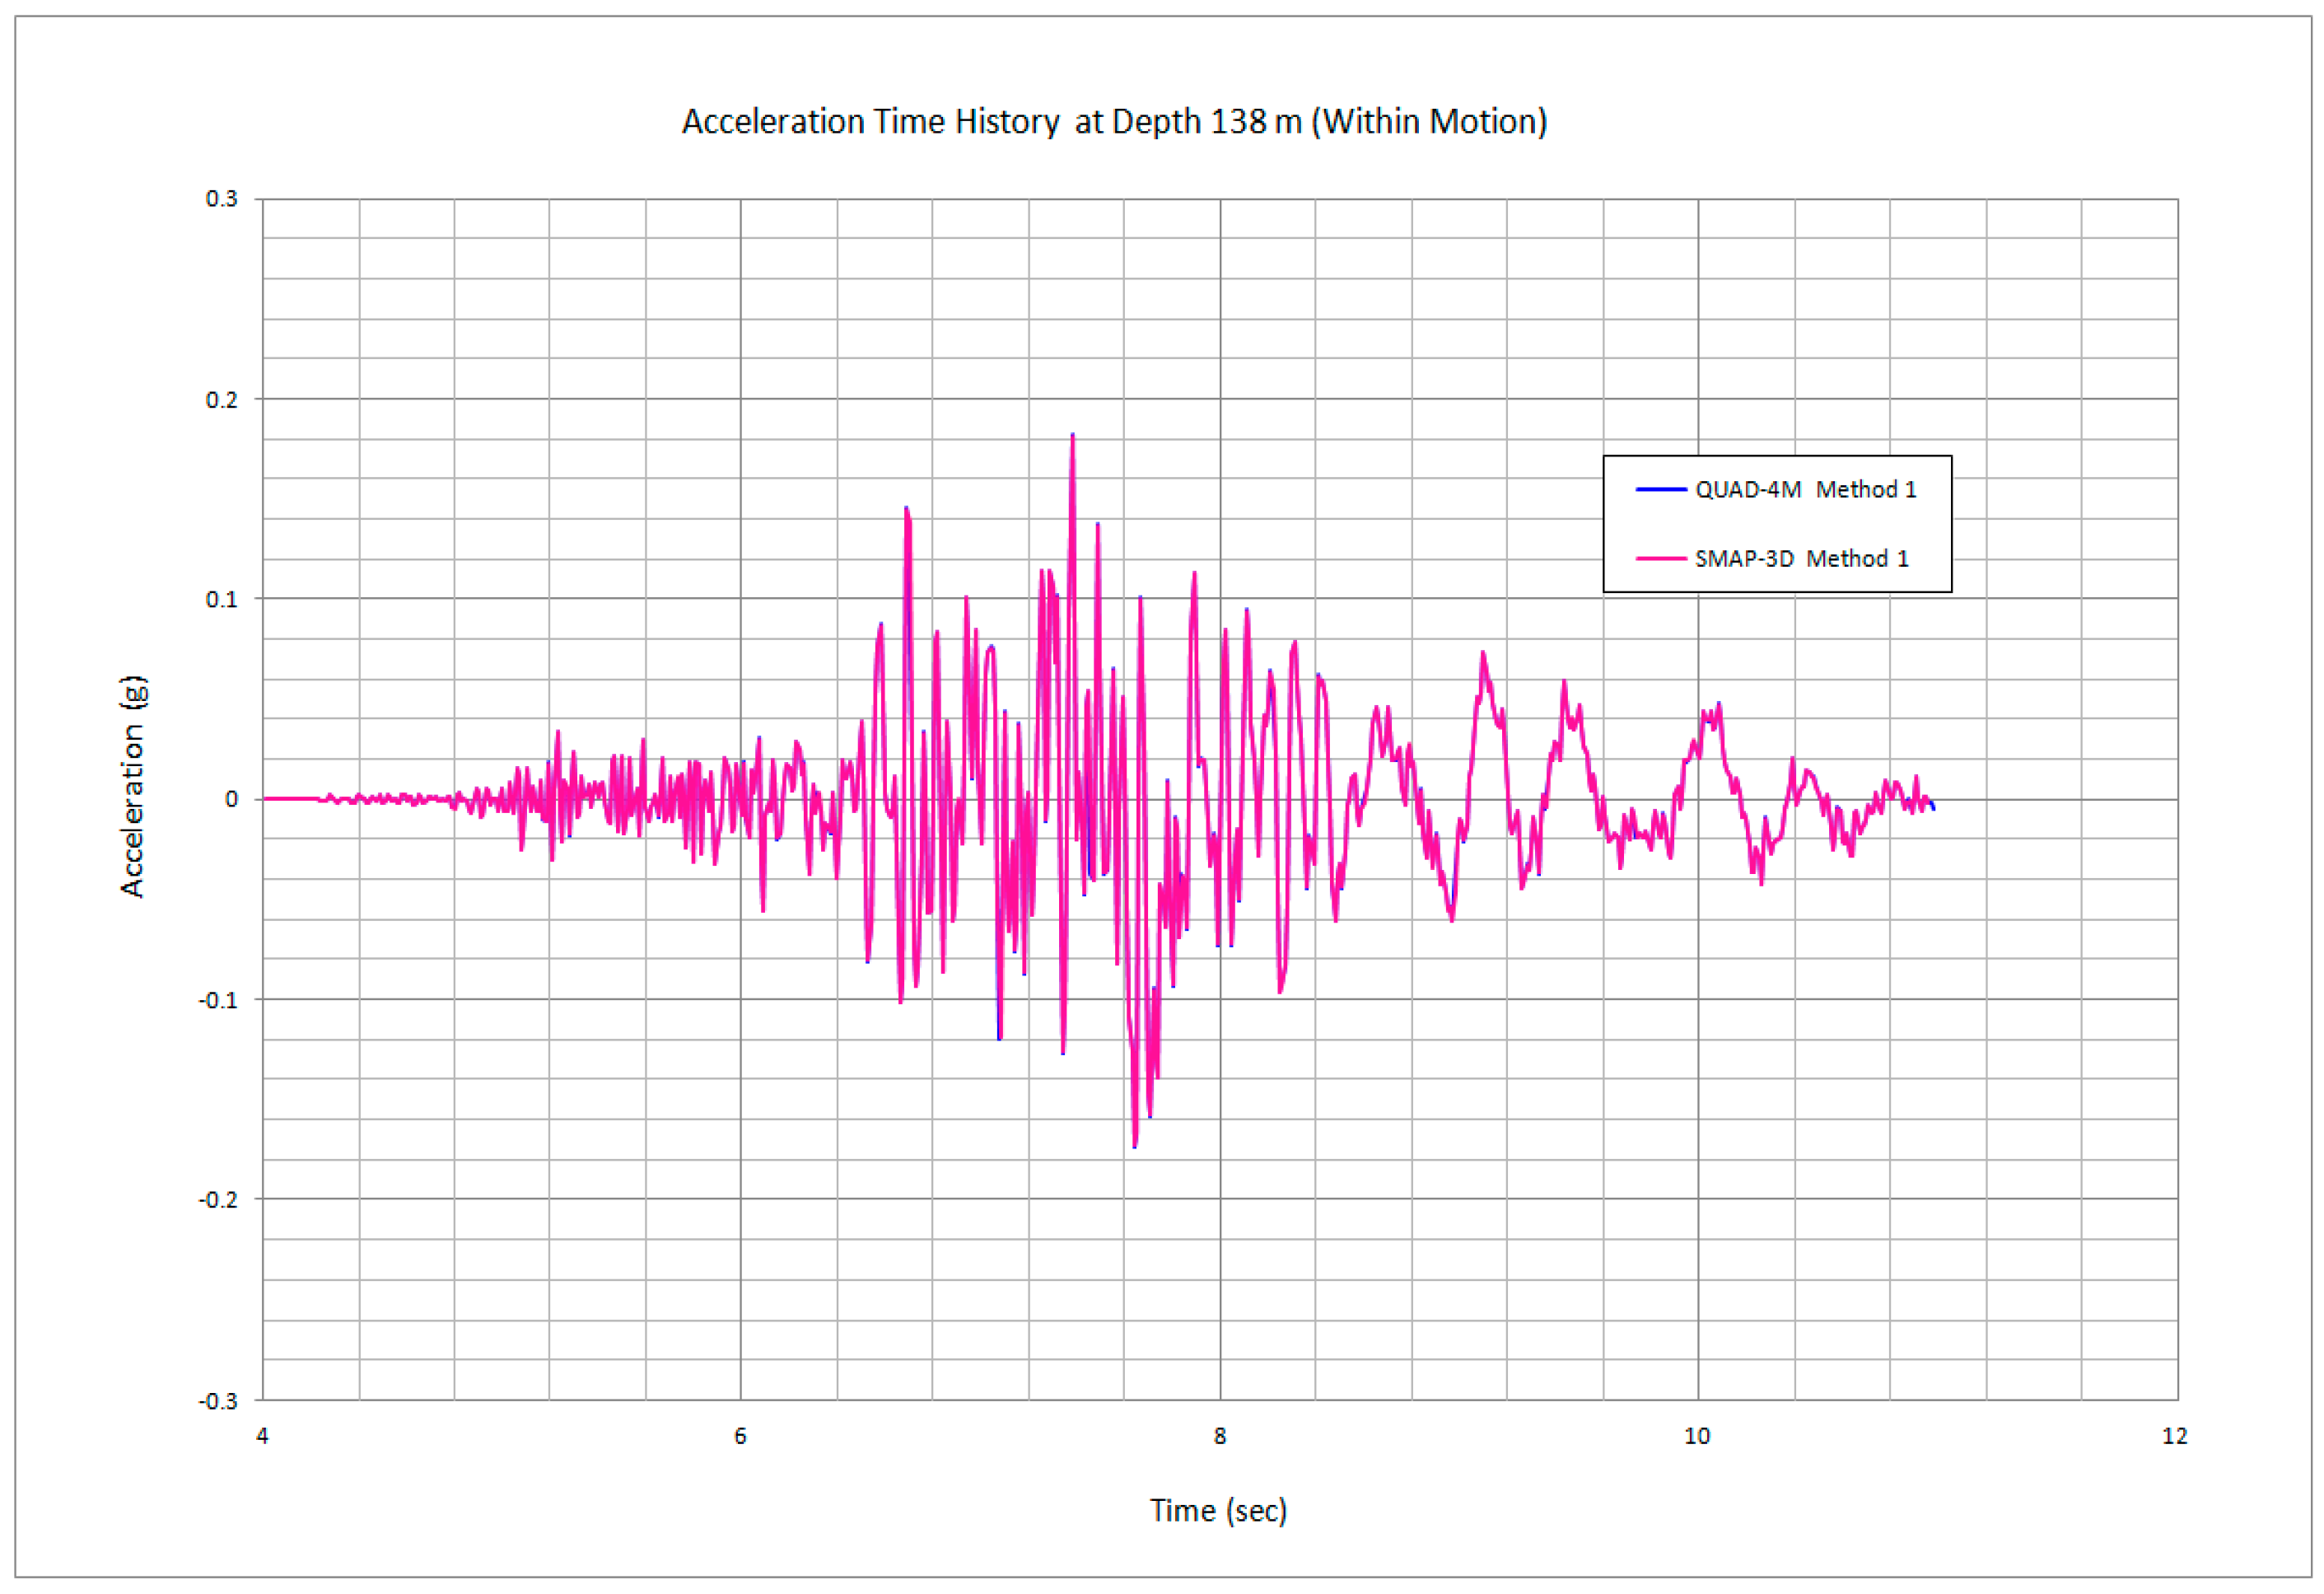
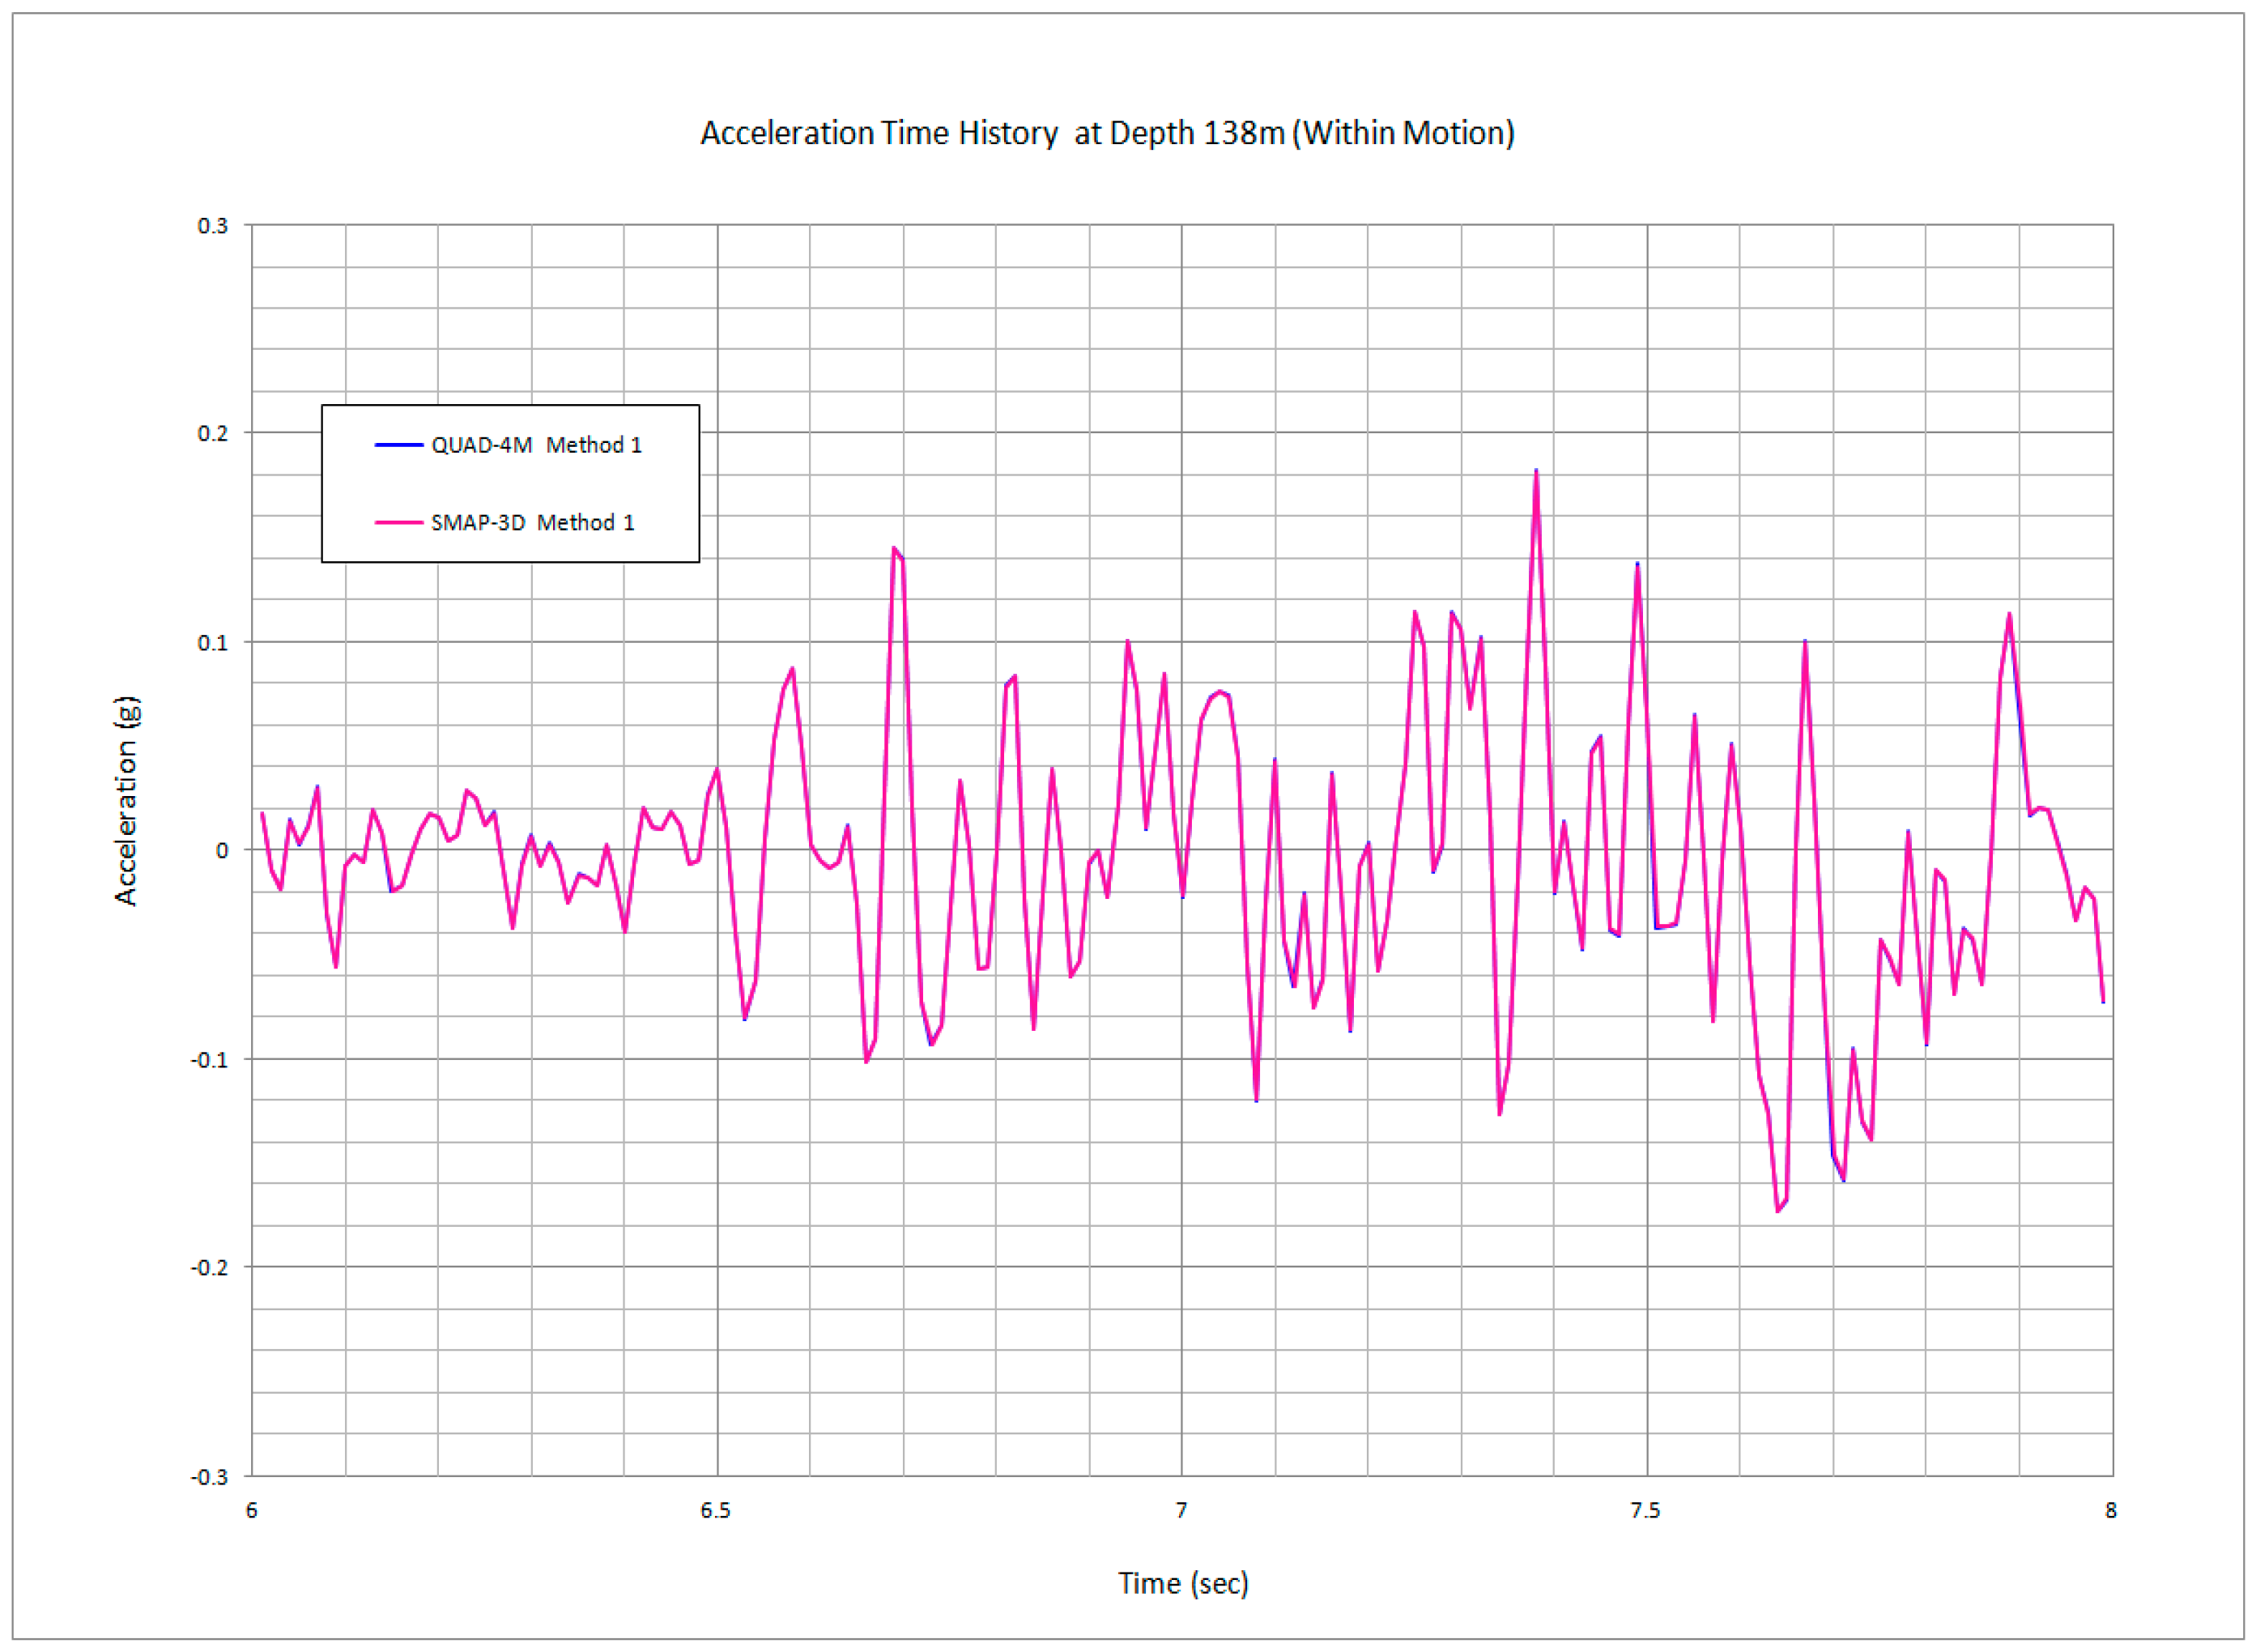
- Three finite element computer programs (SRAP-1D, QUAD-4M, and SMAP-3D) are selected to perform the free-field analysis in the time domain. The acceleration time histories on the ground surface which compare the results of all three computer programs show almost identical responses in the time where strong motions occur. It also shows that Method 1 conventional procedure produces almost the same results as Method 2. The acceleration time histories at the location of the silo mid-height which compare QUAD-4M to SMAP-3D show almost identical responses in the time where strong motions occur.
- (3)
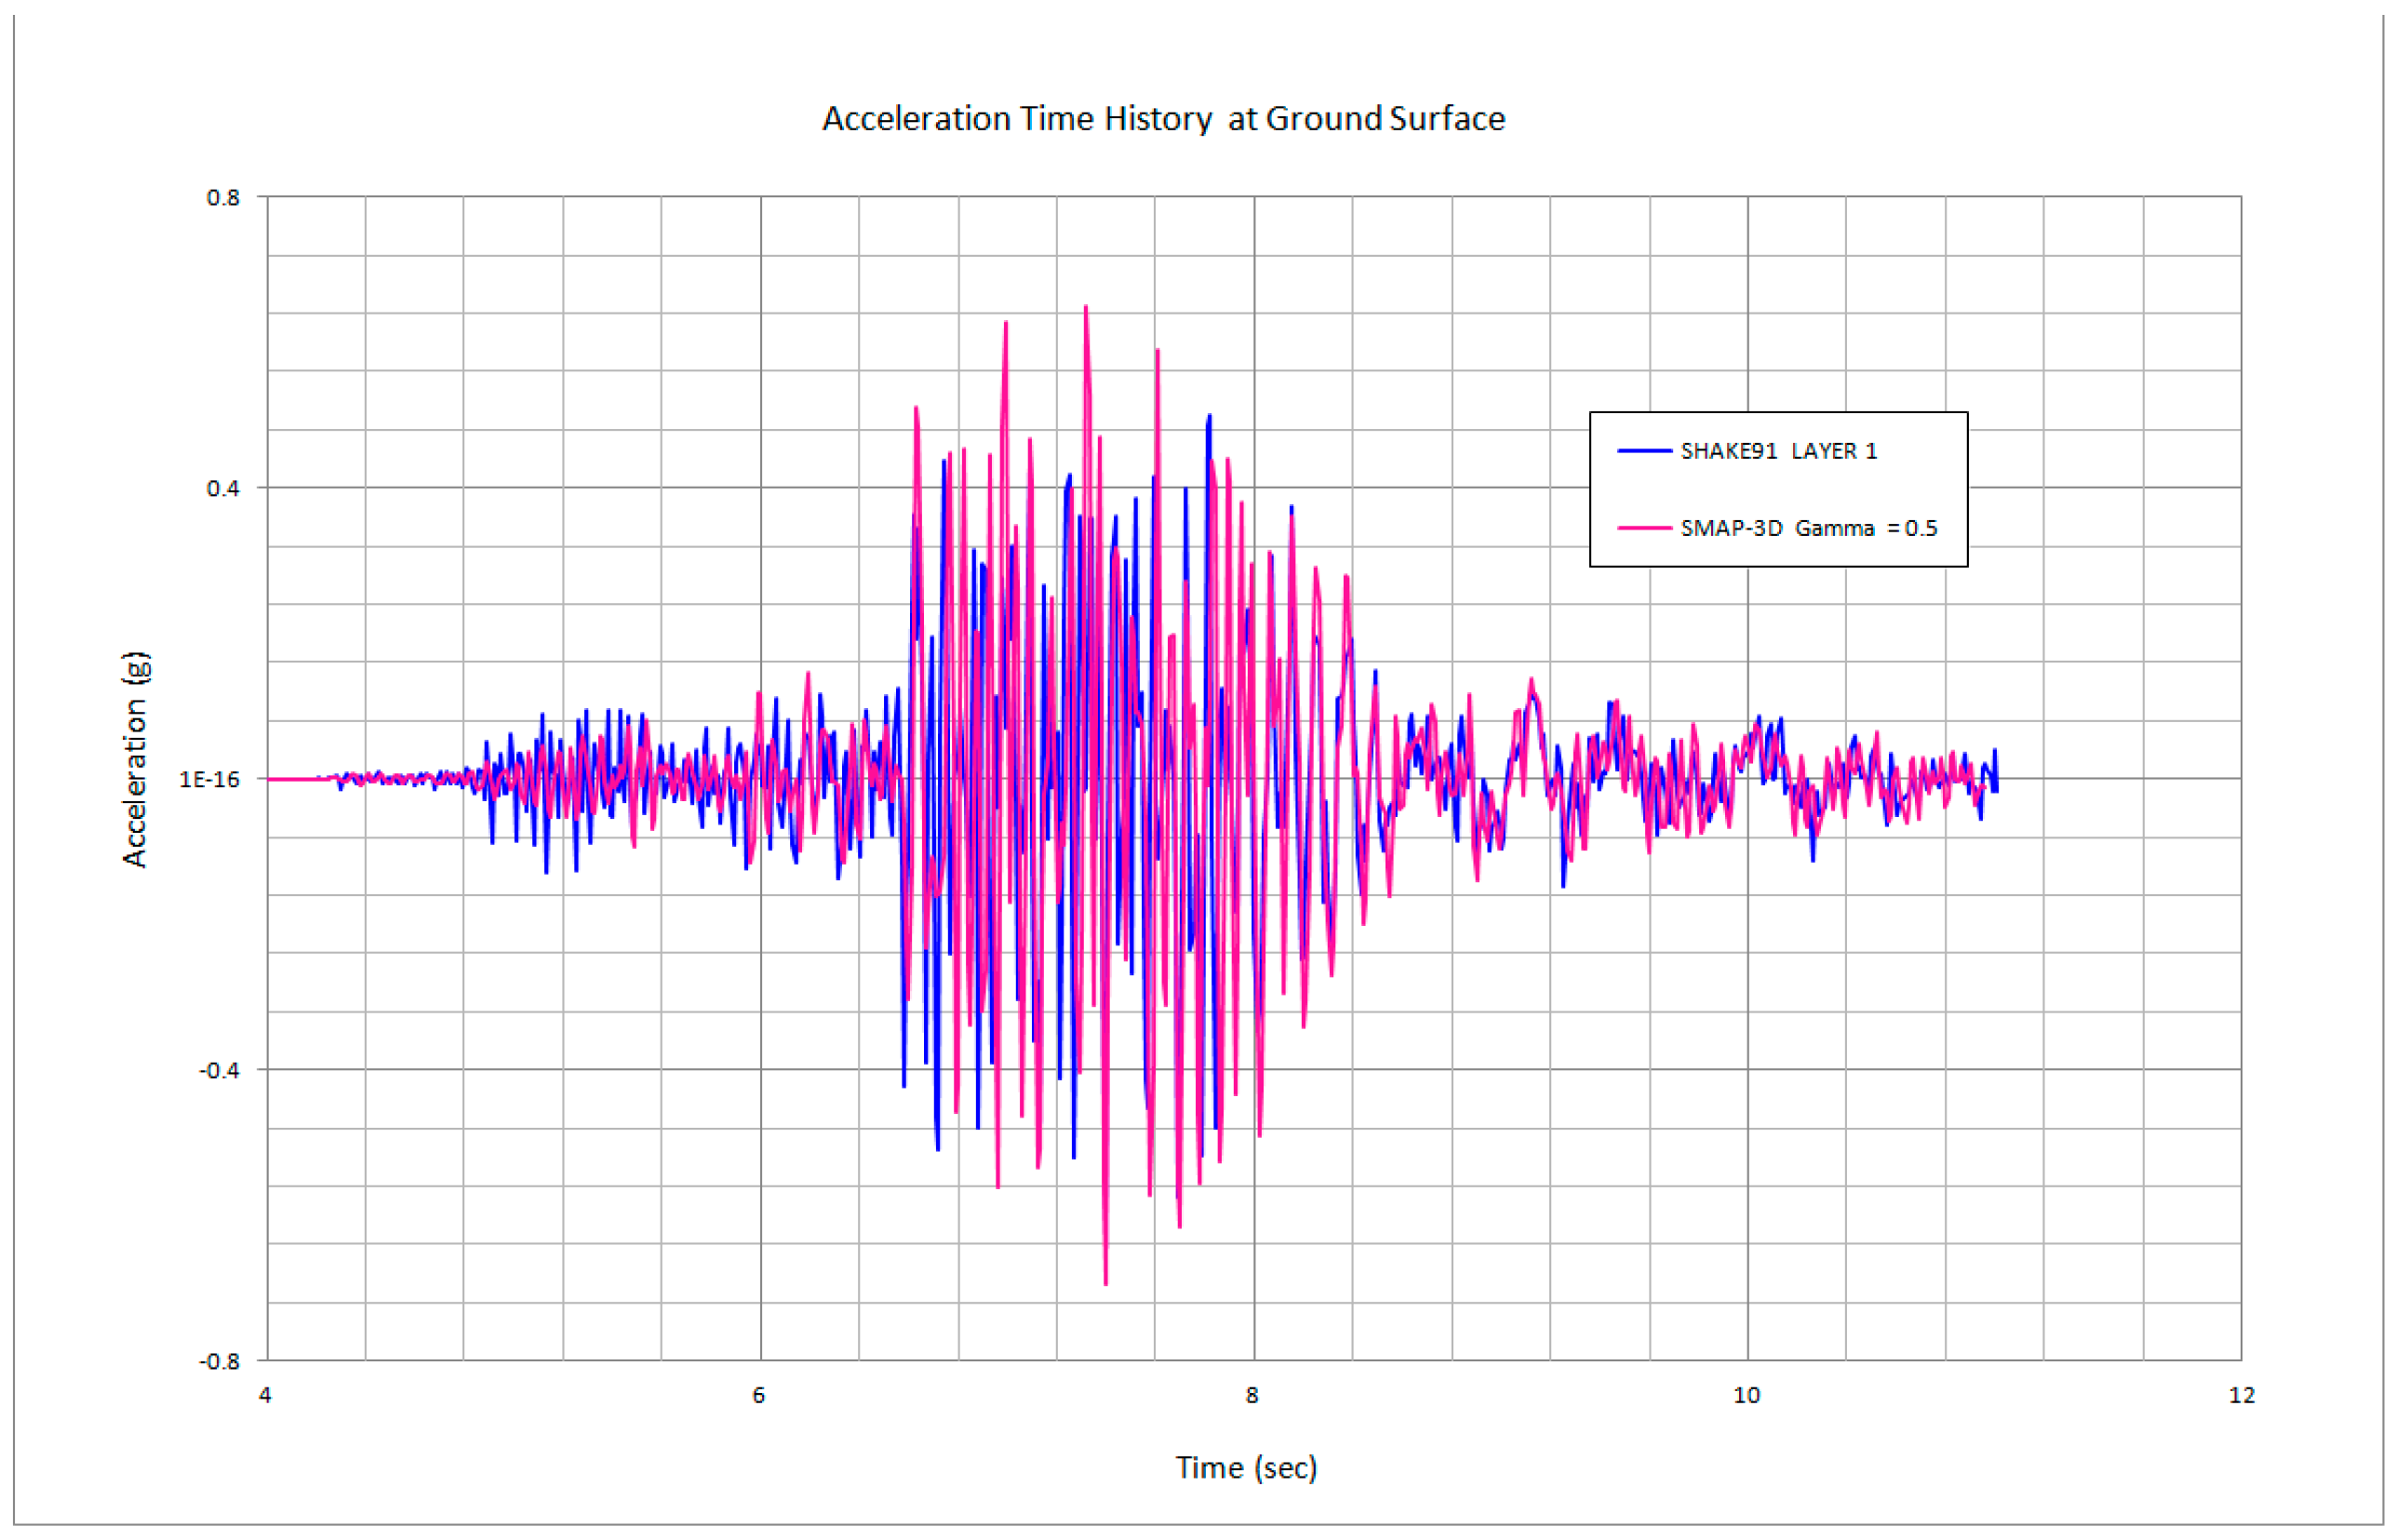
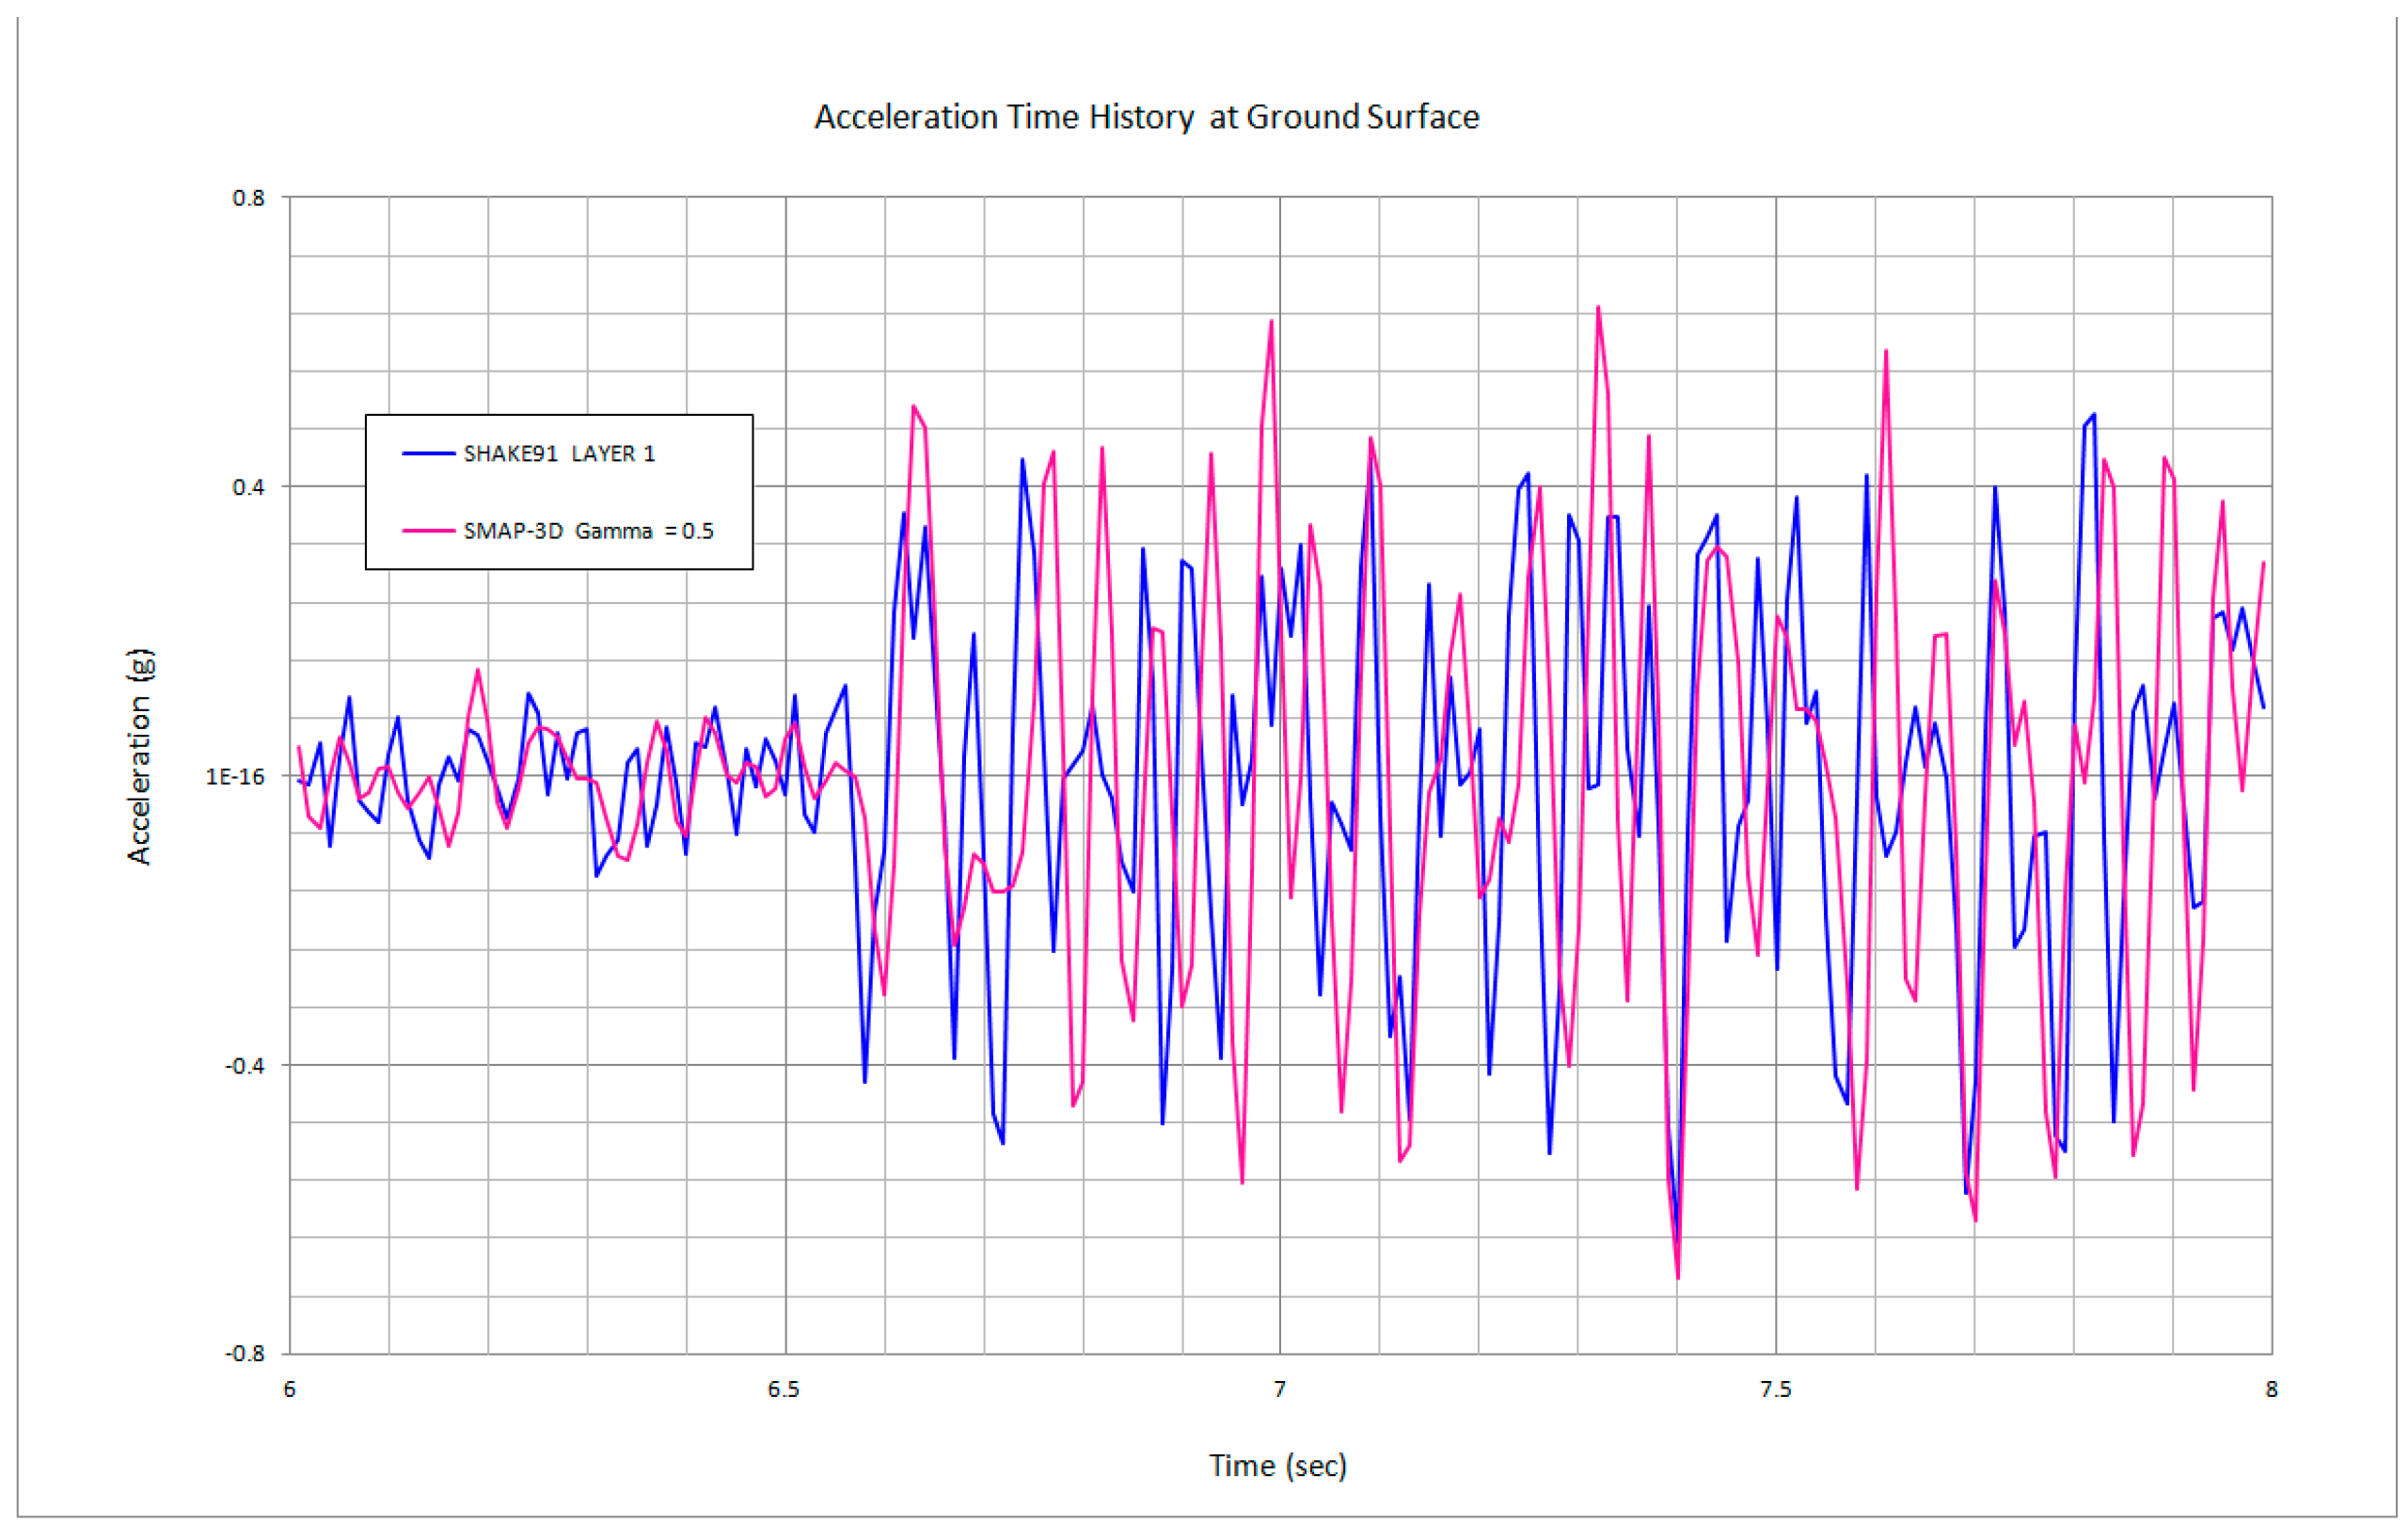
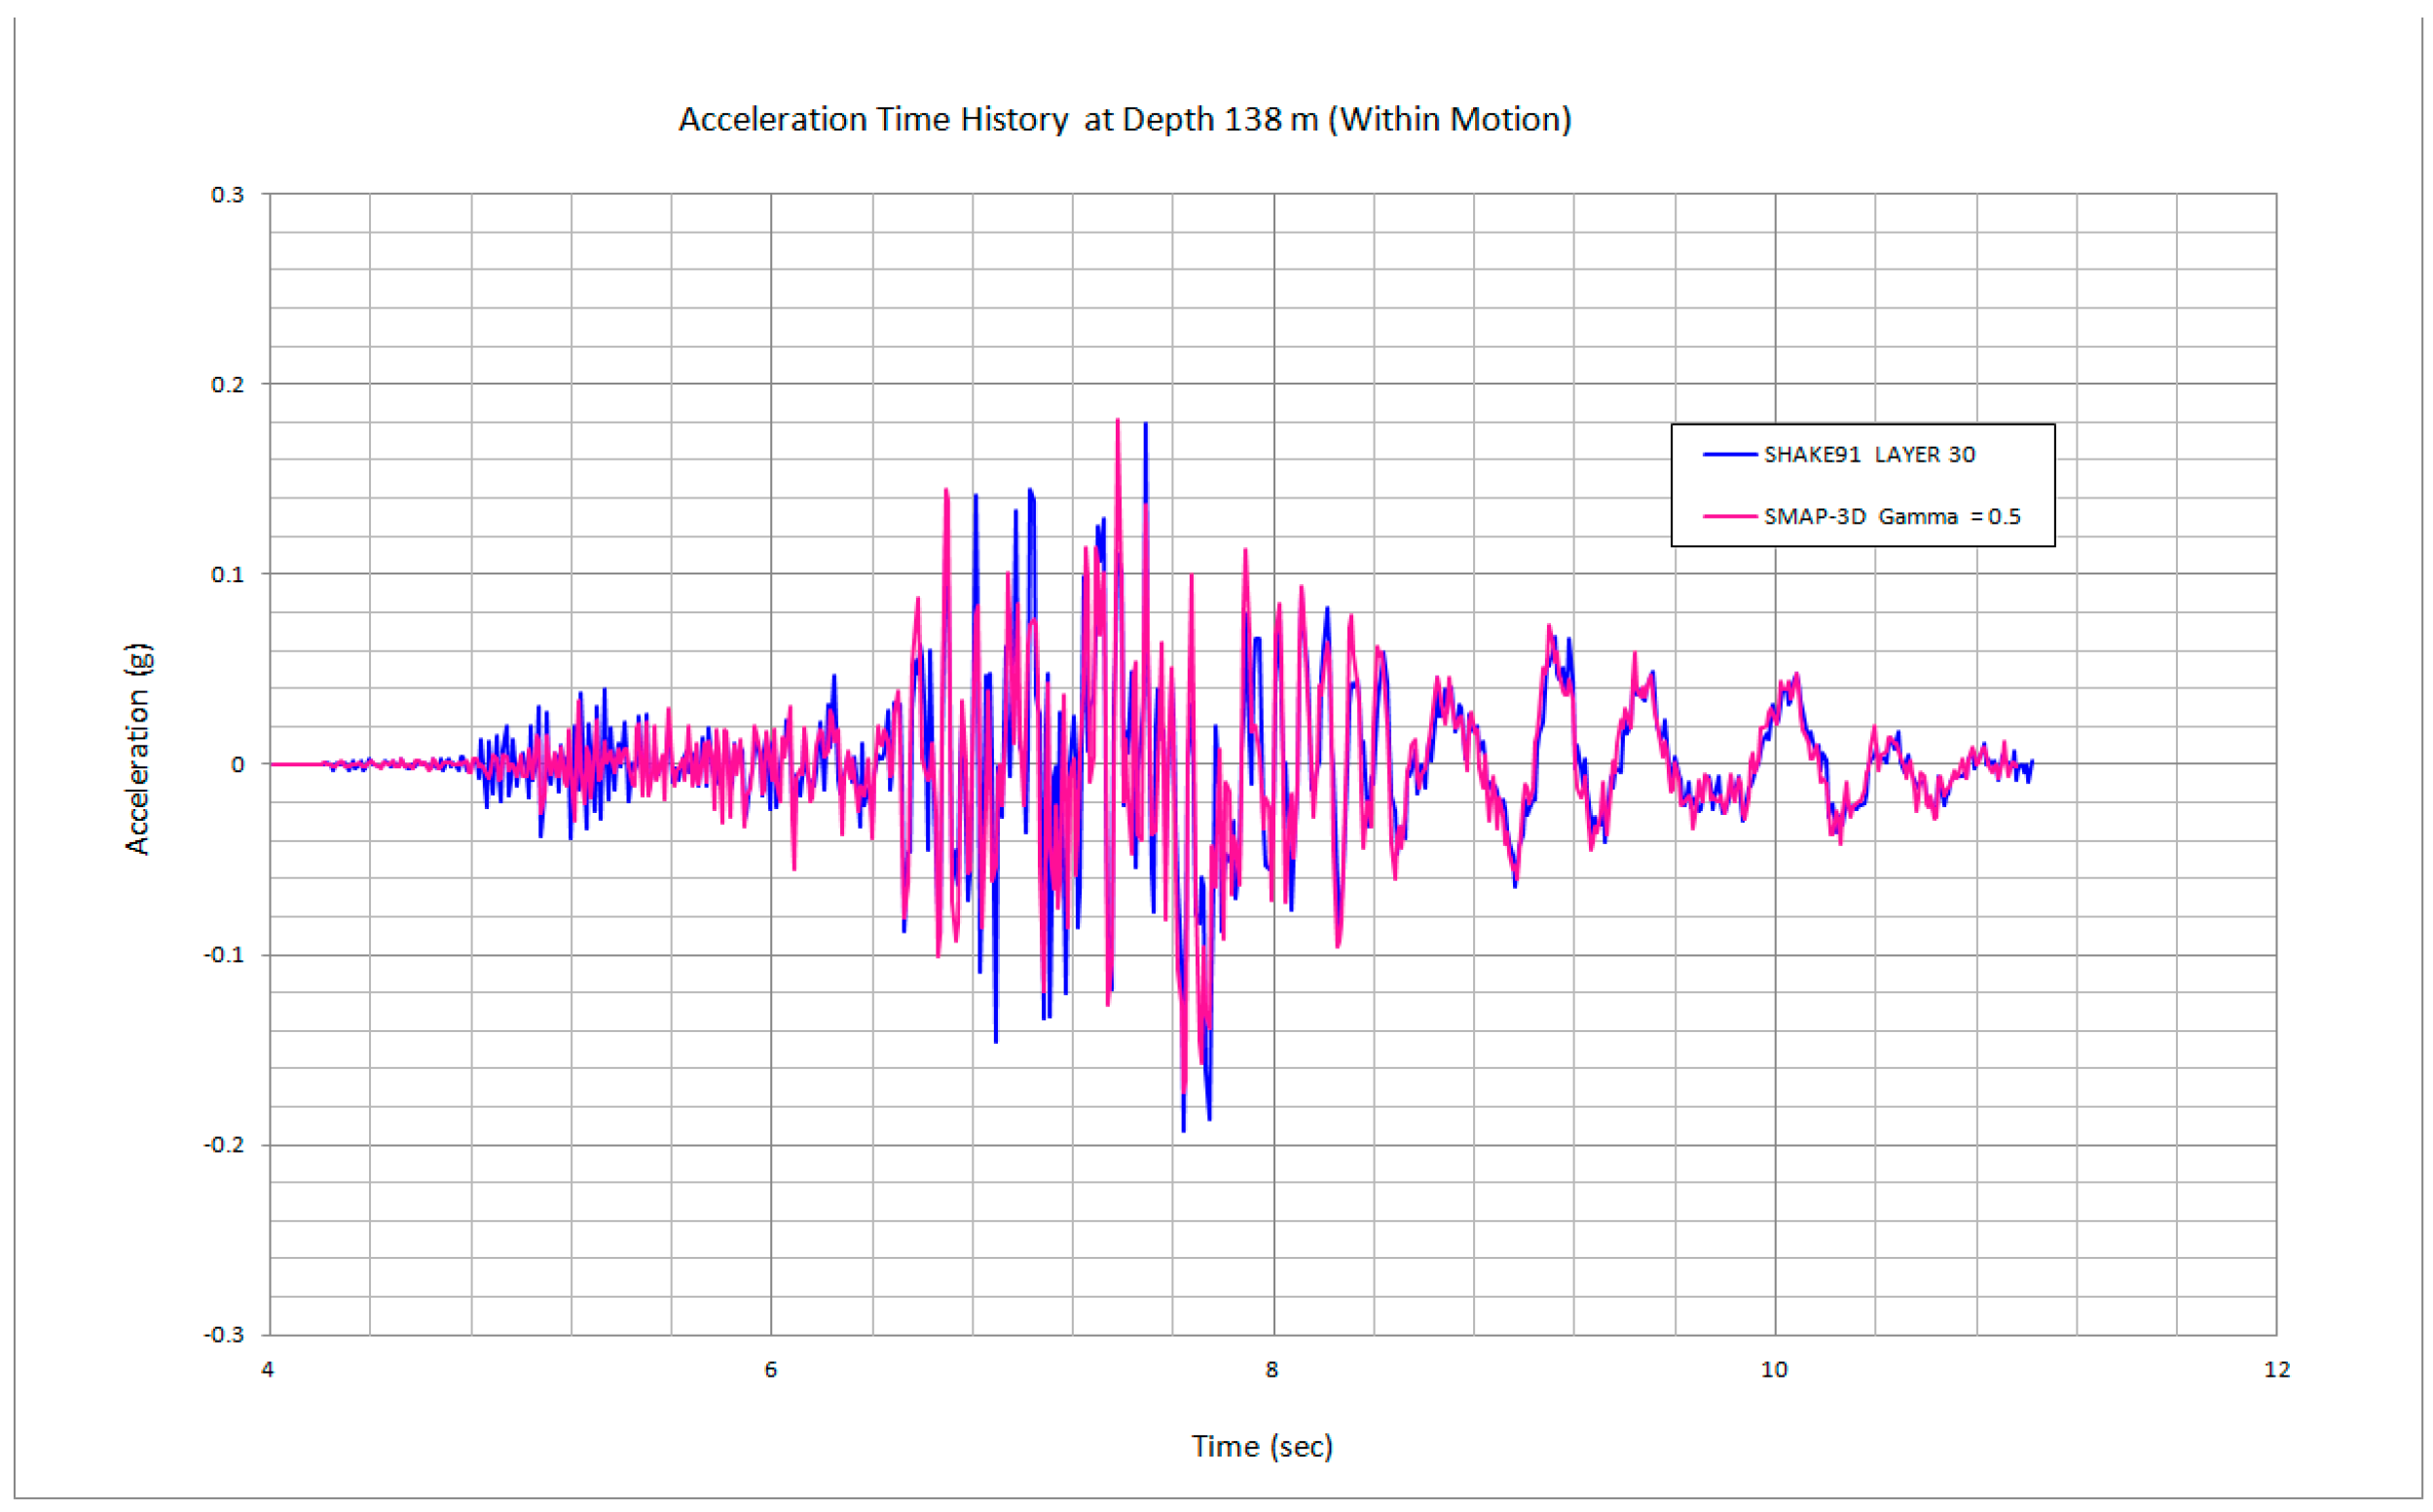
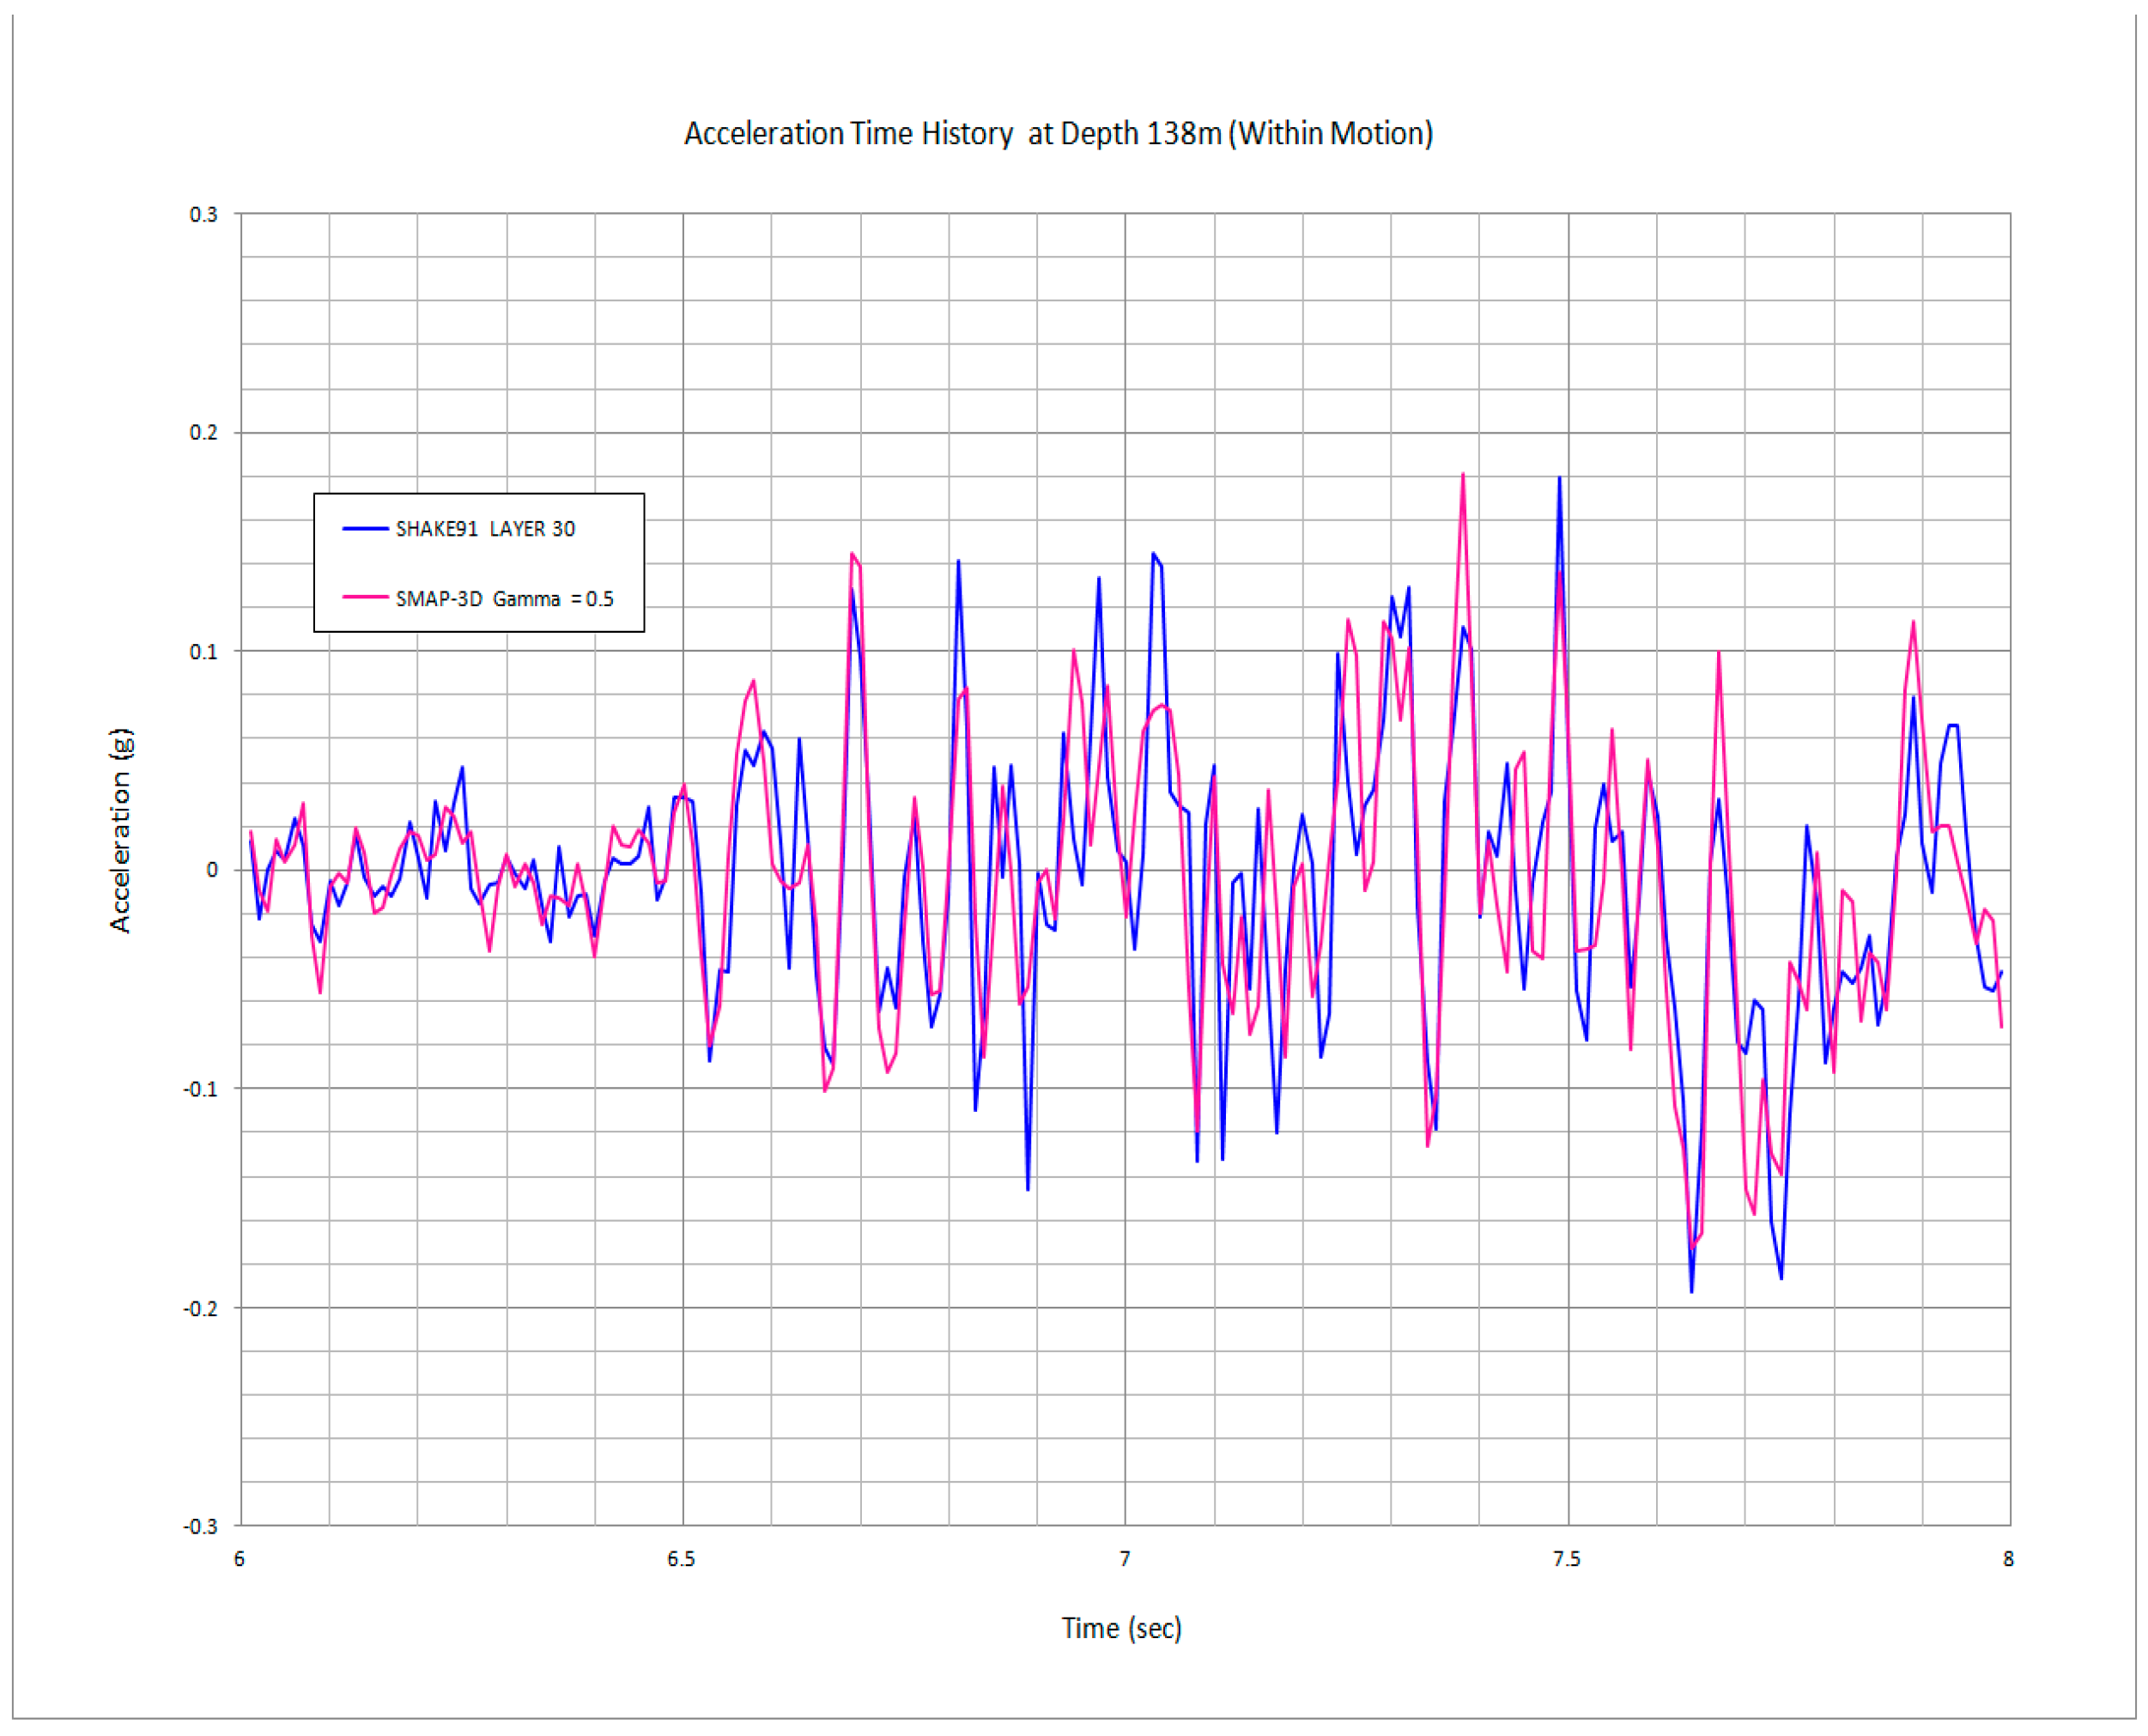
- SMAP-3D time domain solutions are compared to the exact closed-form frequency domain SHAKE91 solutions for the analysis of free-field responses subjected to vertically propagating shear waves caused by earthquake motions. As a result of comparing SMAP-3D with γ = 0.5 and SHAKE91 to the acceleration time histories on the ground surface, SMAP-3D results show somewhat higher responses in the time where strong motions occur. SMAP-3D results at the location of the silo mid-height show more close to SHAKE91 results than we see those comparisons on the ground surface.
- (4)
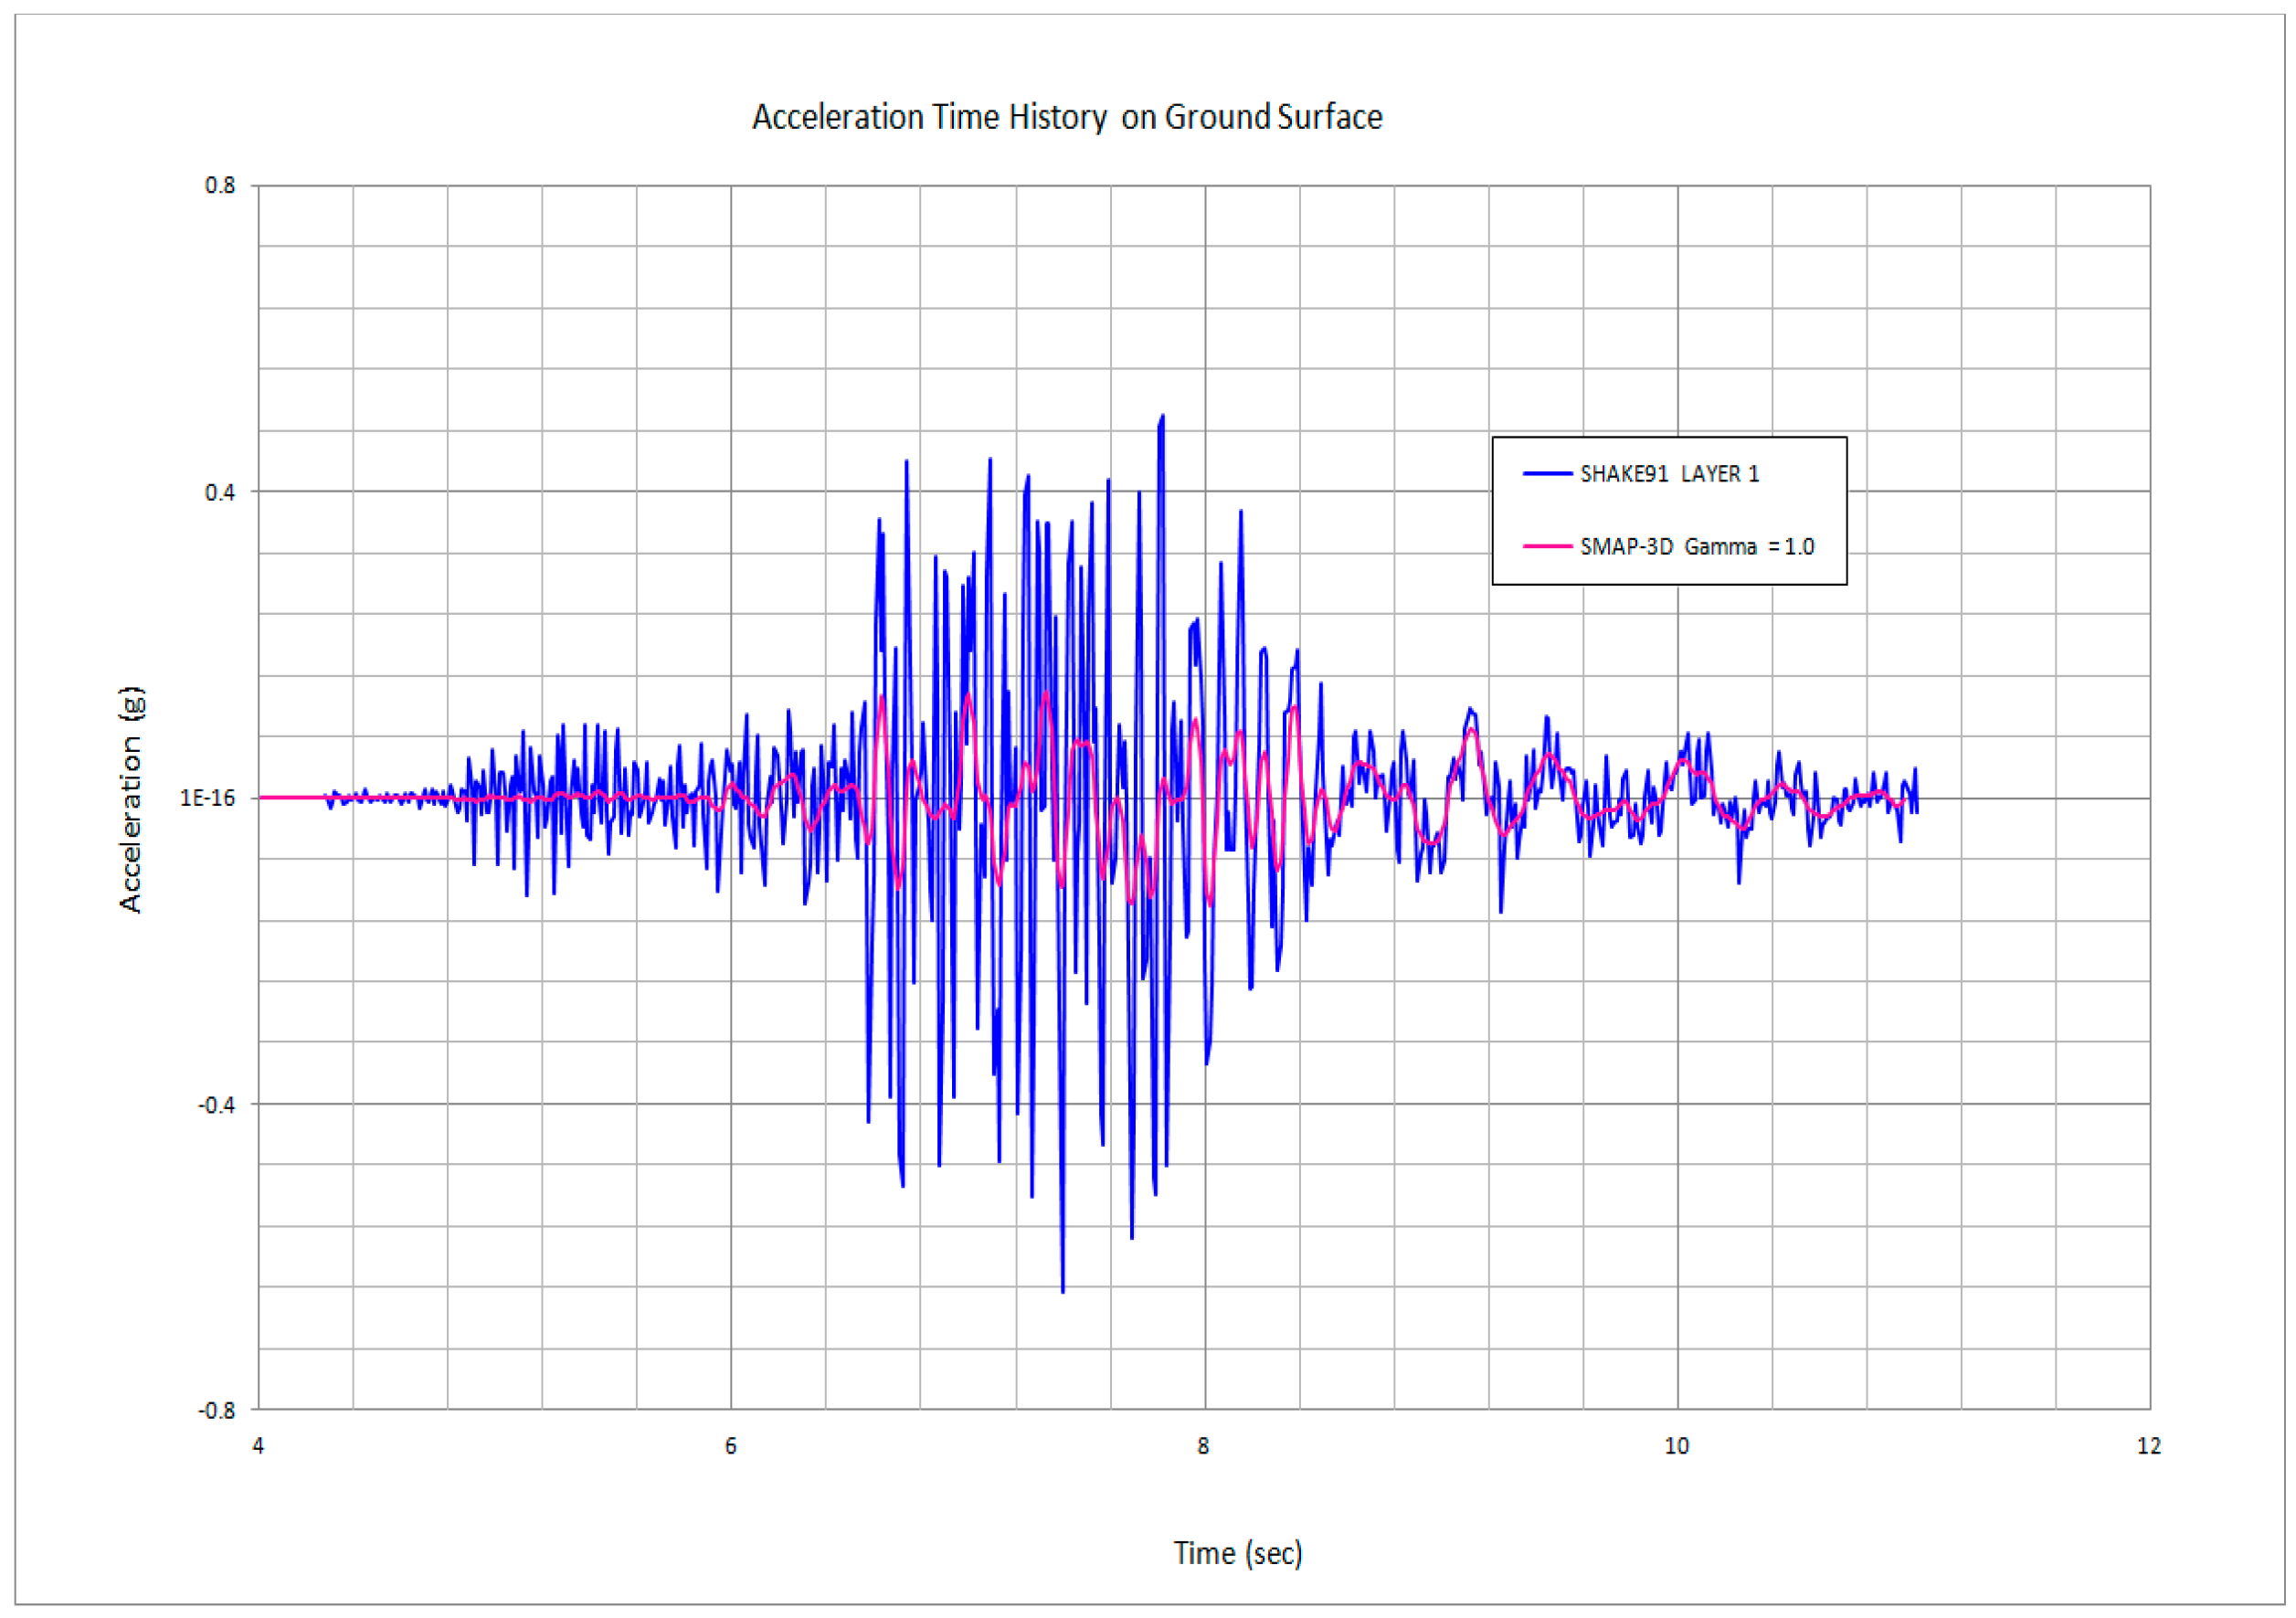
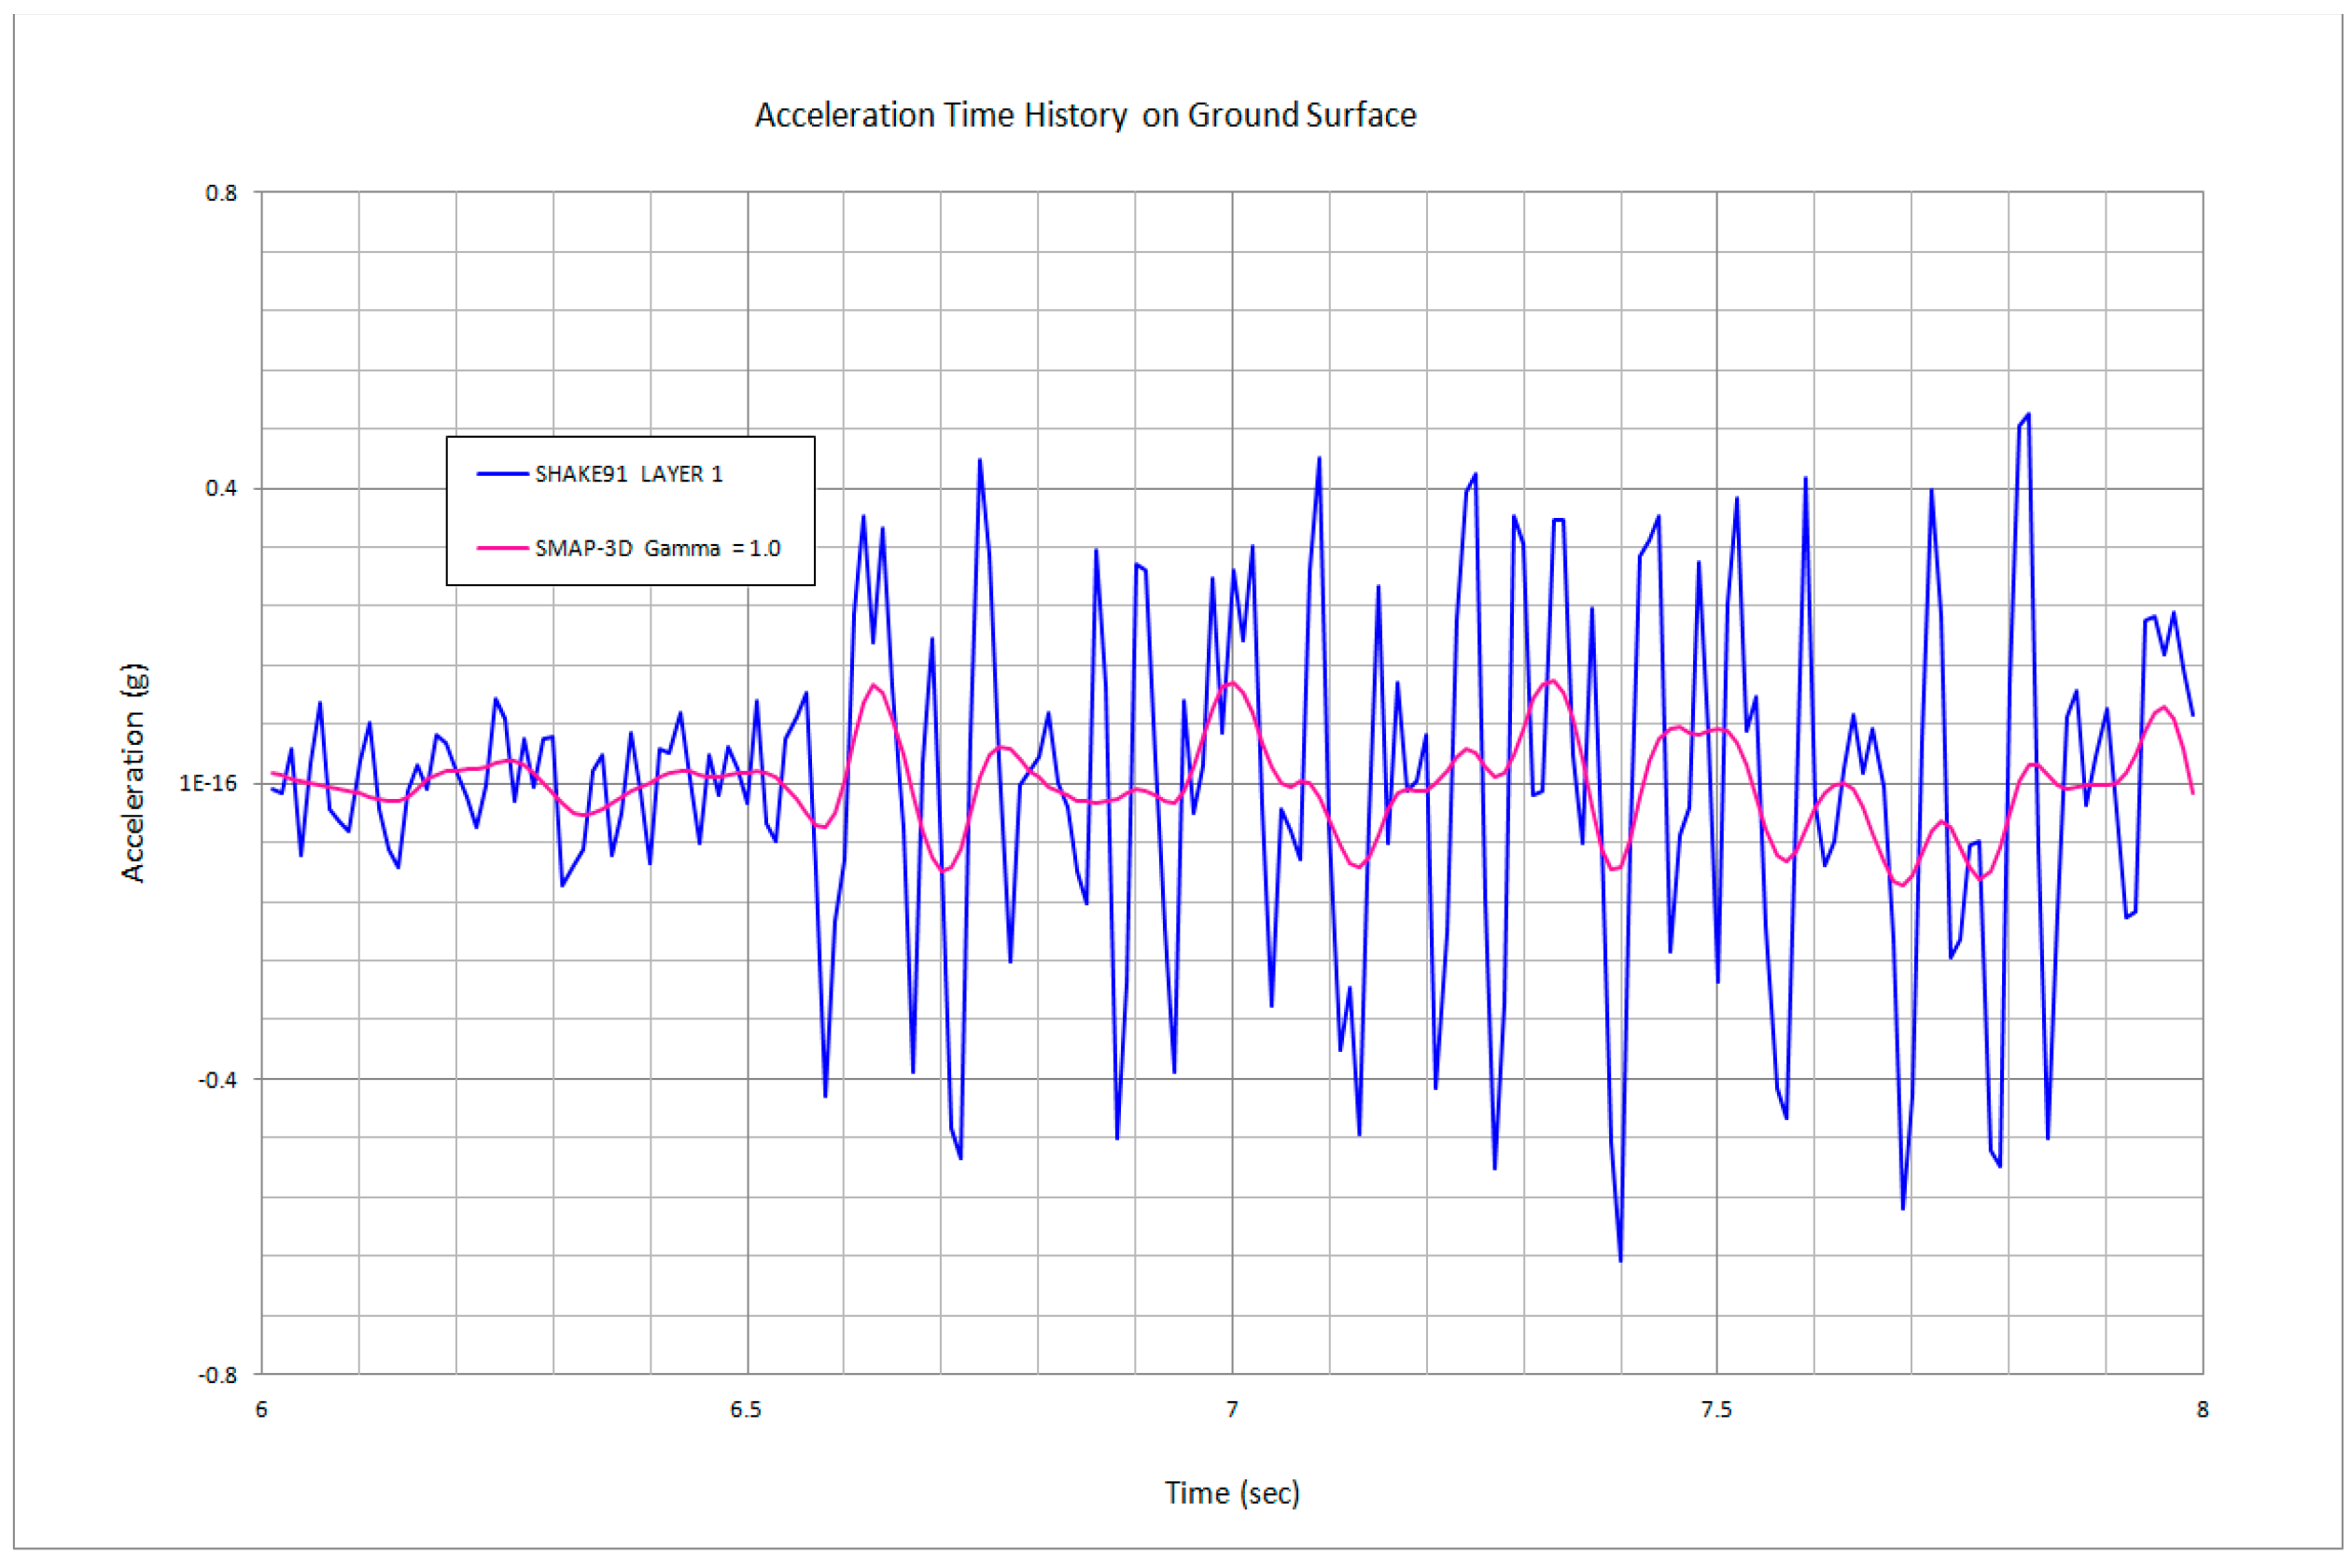
- Compared to SHAKE91, SMAP-3D with γ = 1.0 results show significantly damped responses in the time where strong motions occur to the acceleration time histories on the ground surface. Compared to SHAKE91, SMAP-3D results show also moderately damped responses in the time where strong motions occur to the acceleration time histories at the location of the silo mid-height.
- (5)
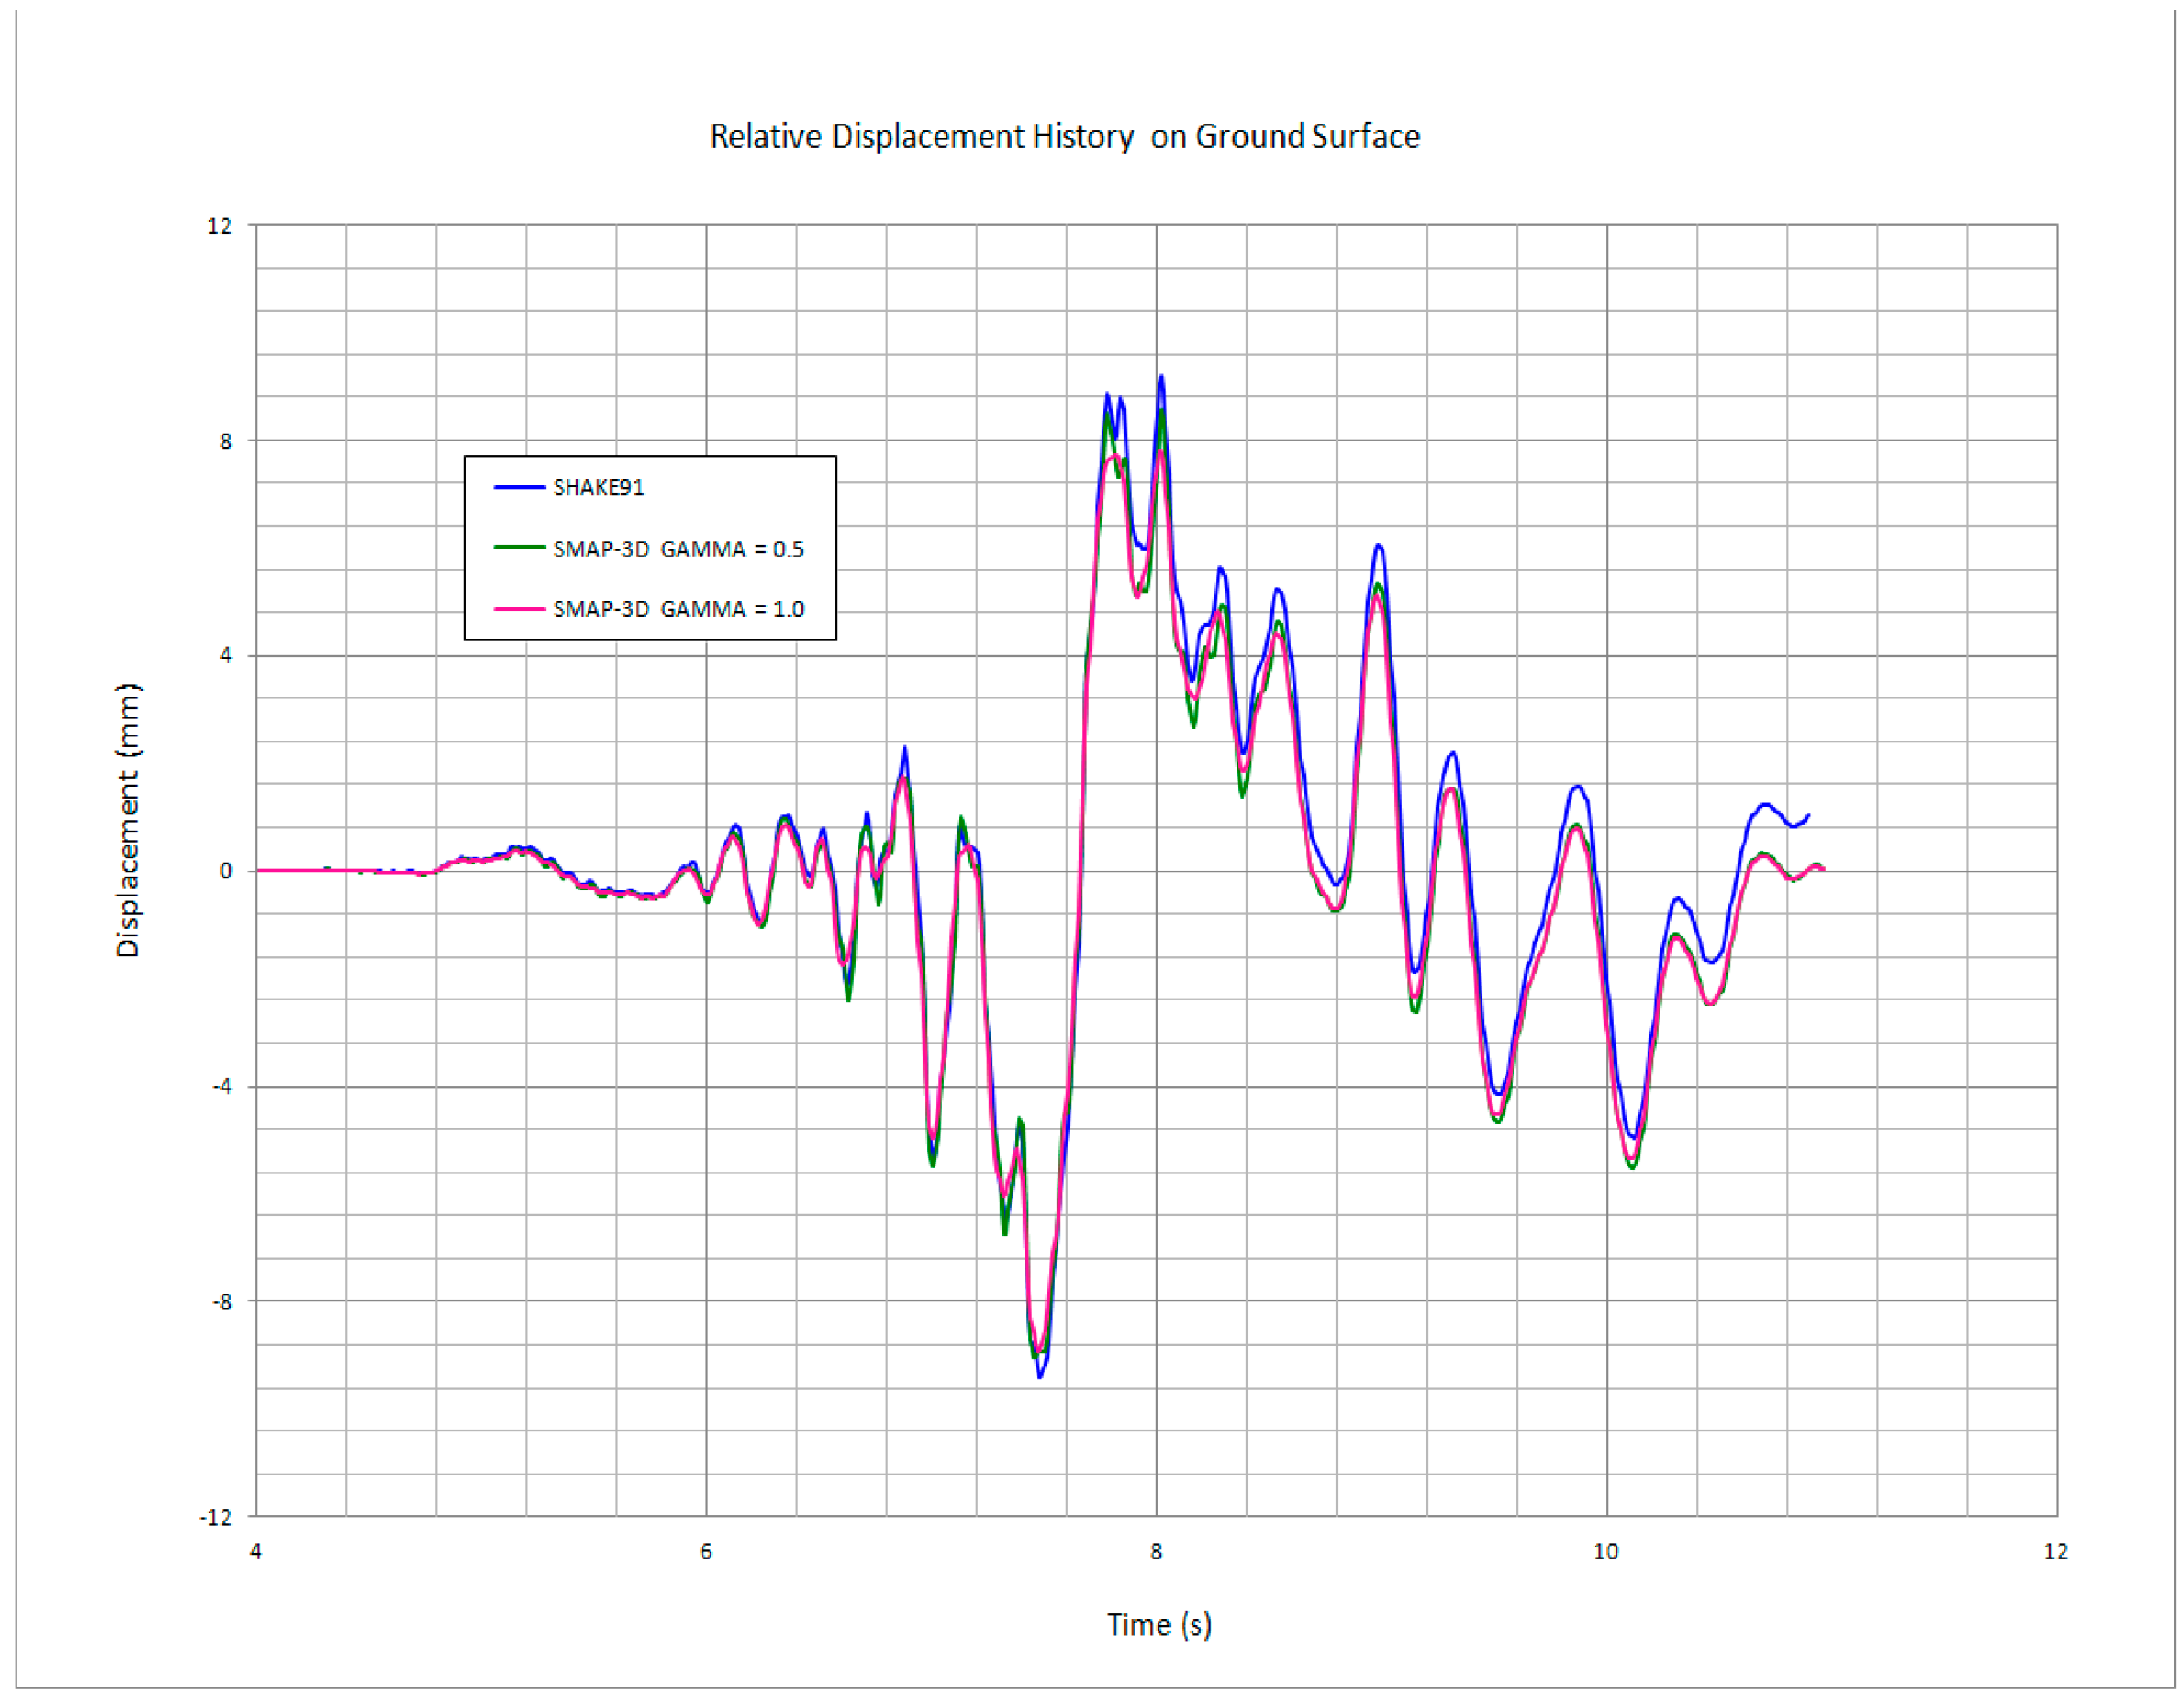
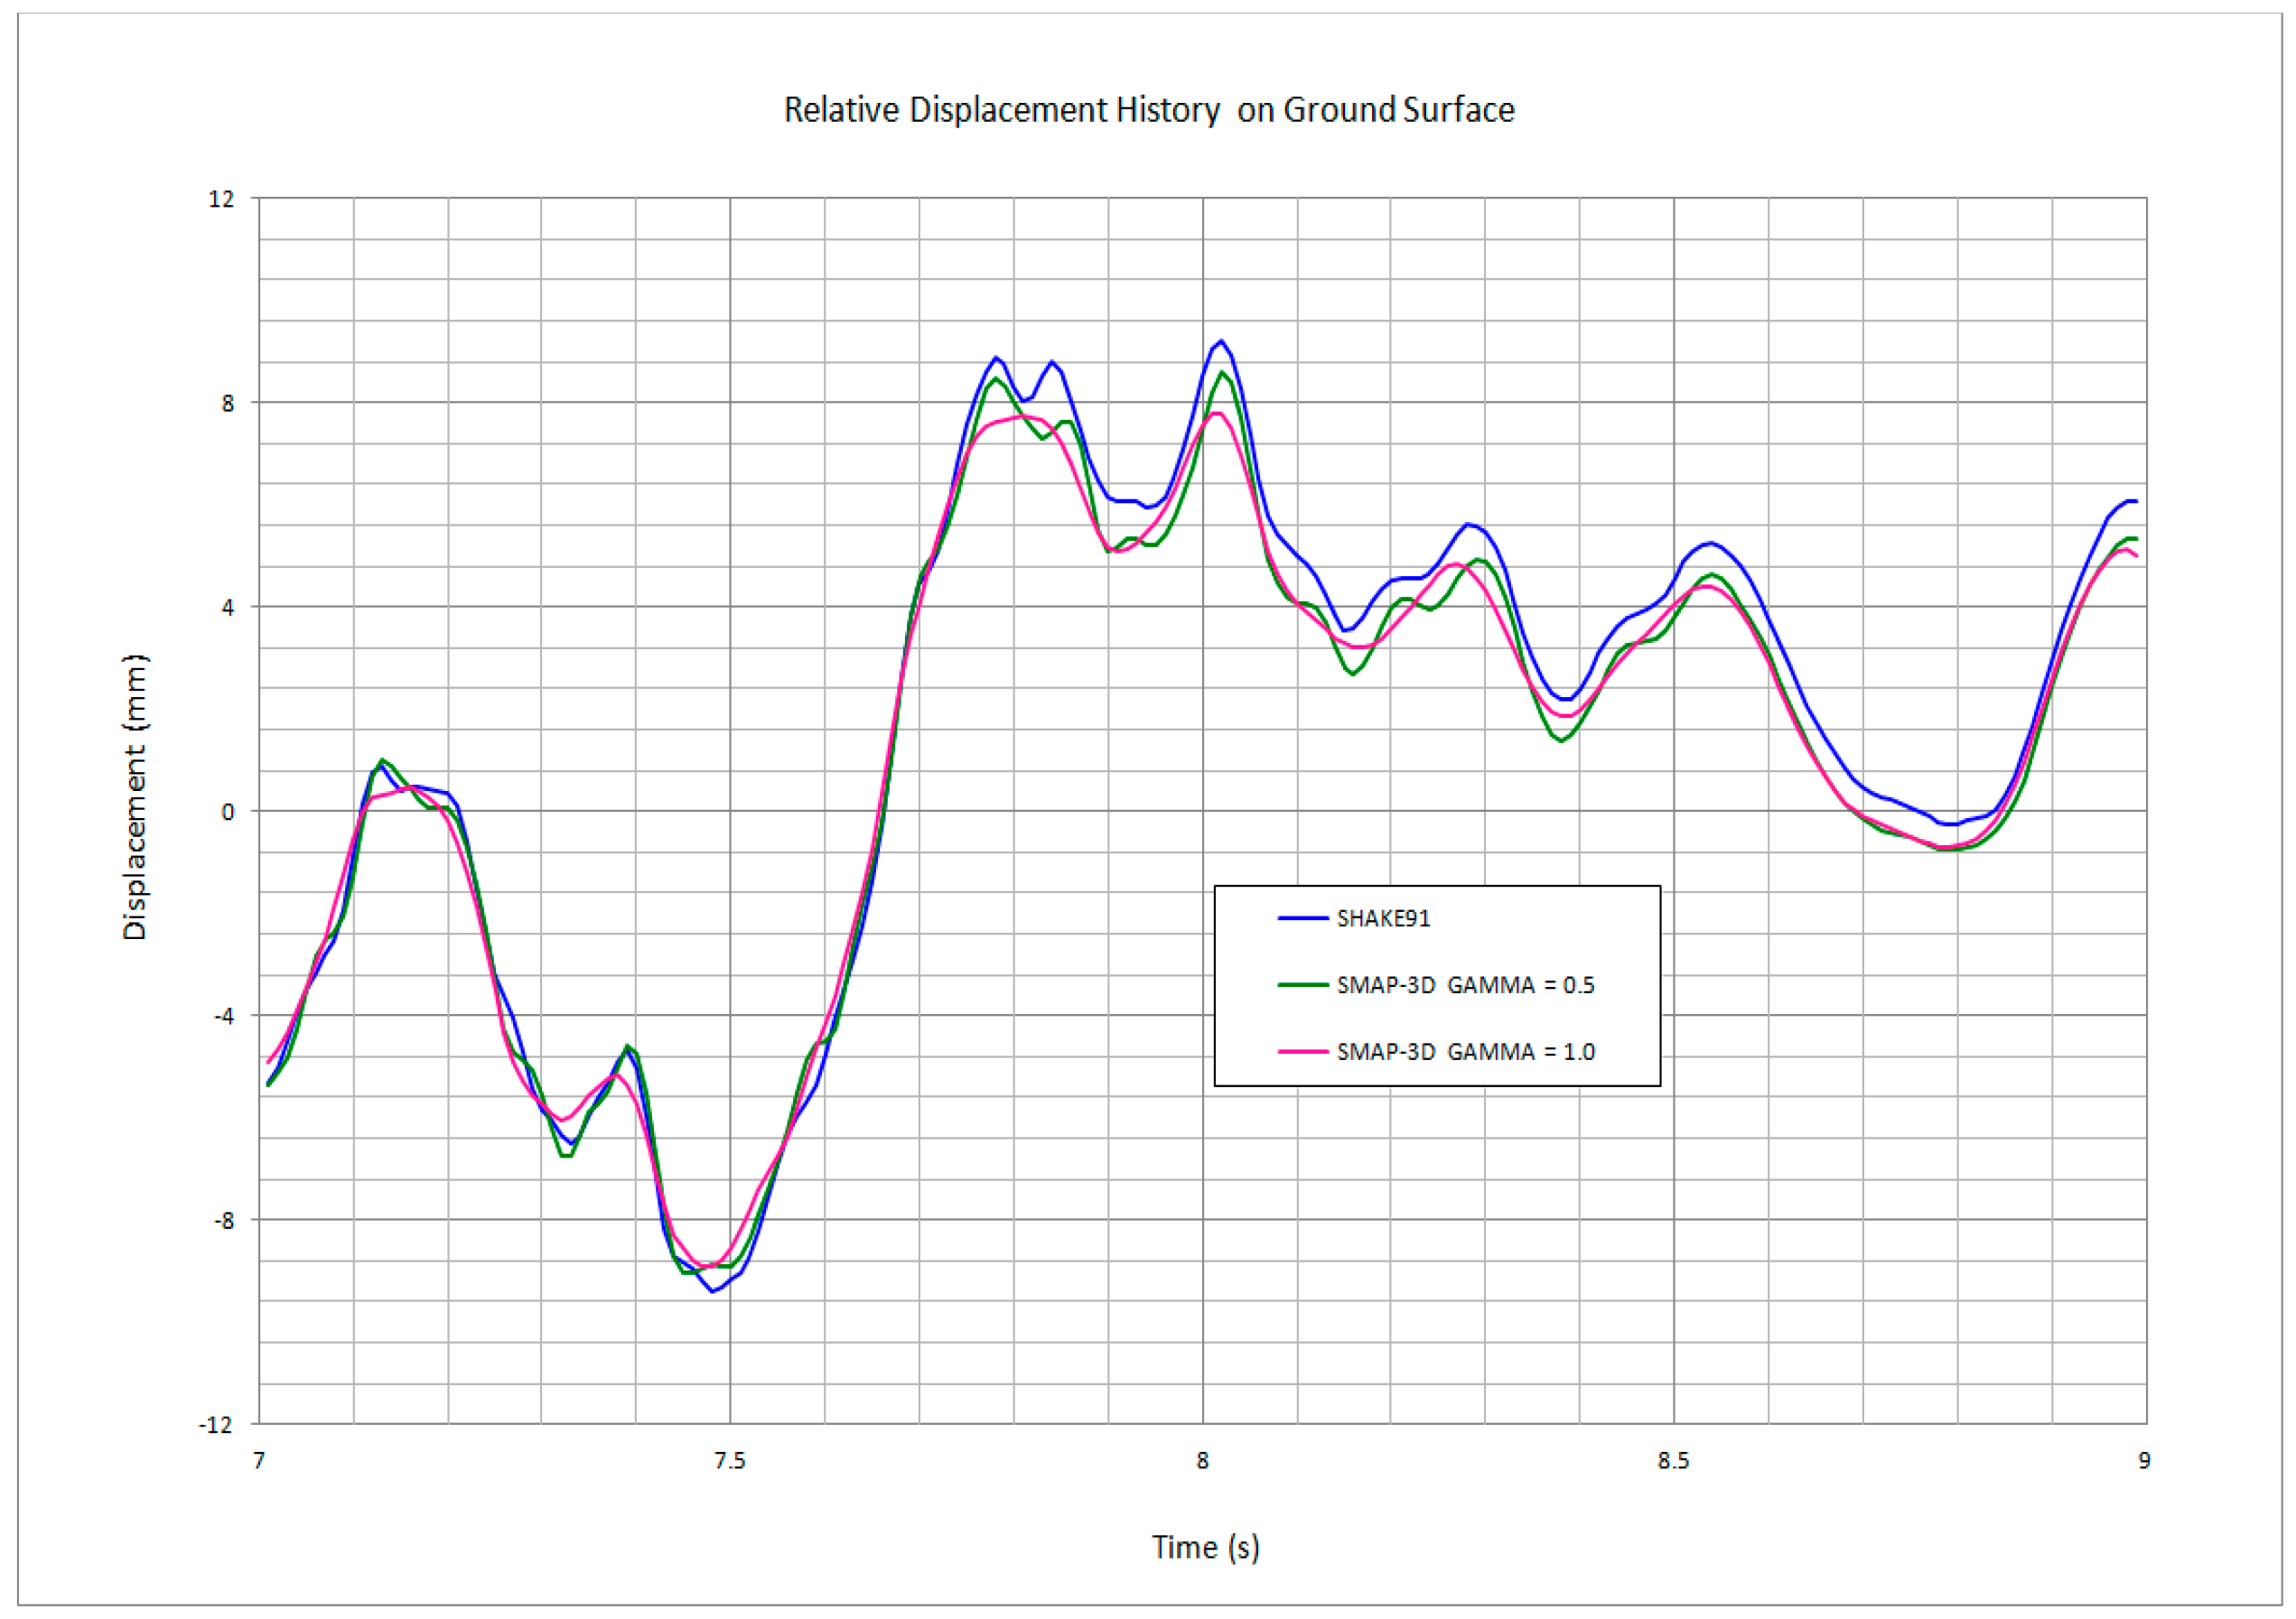
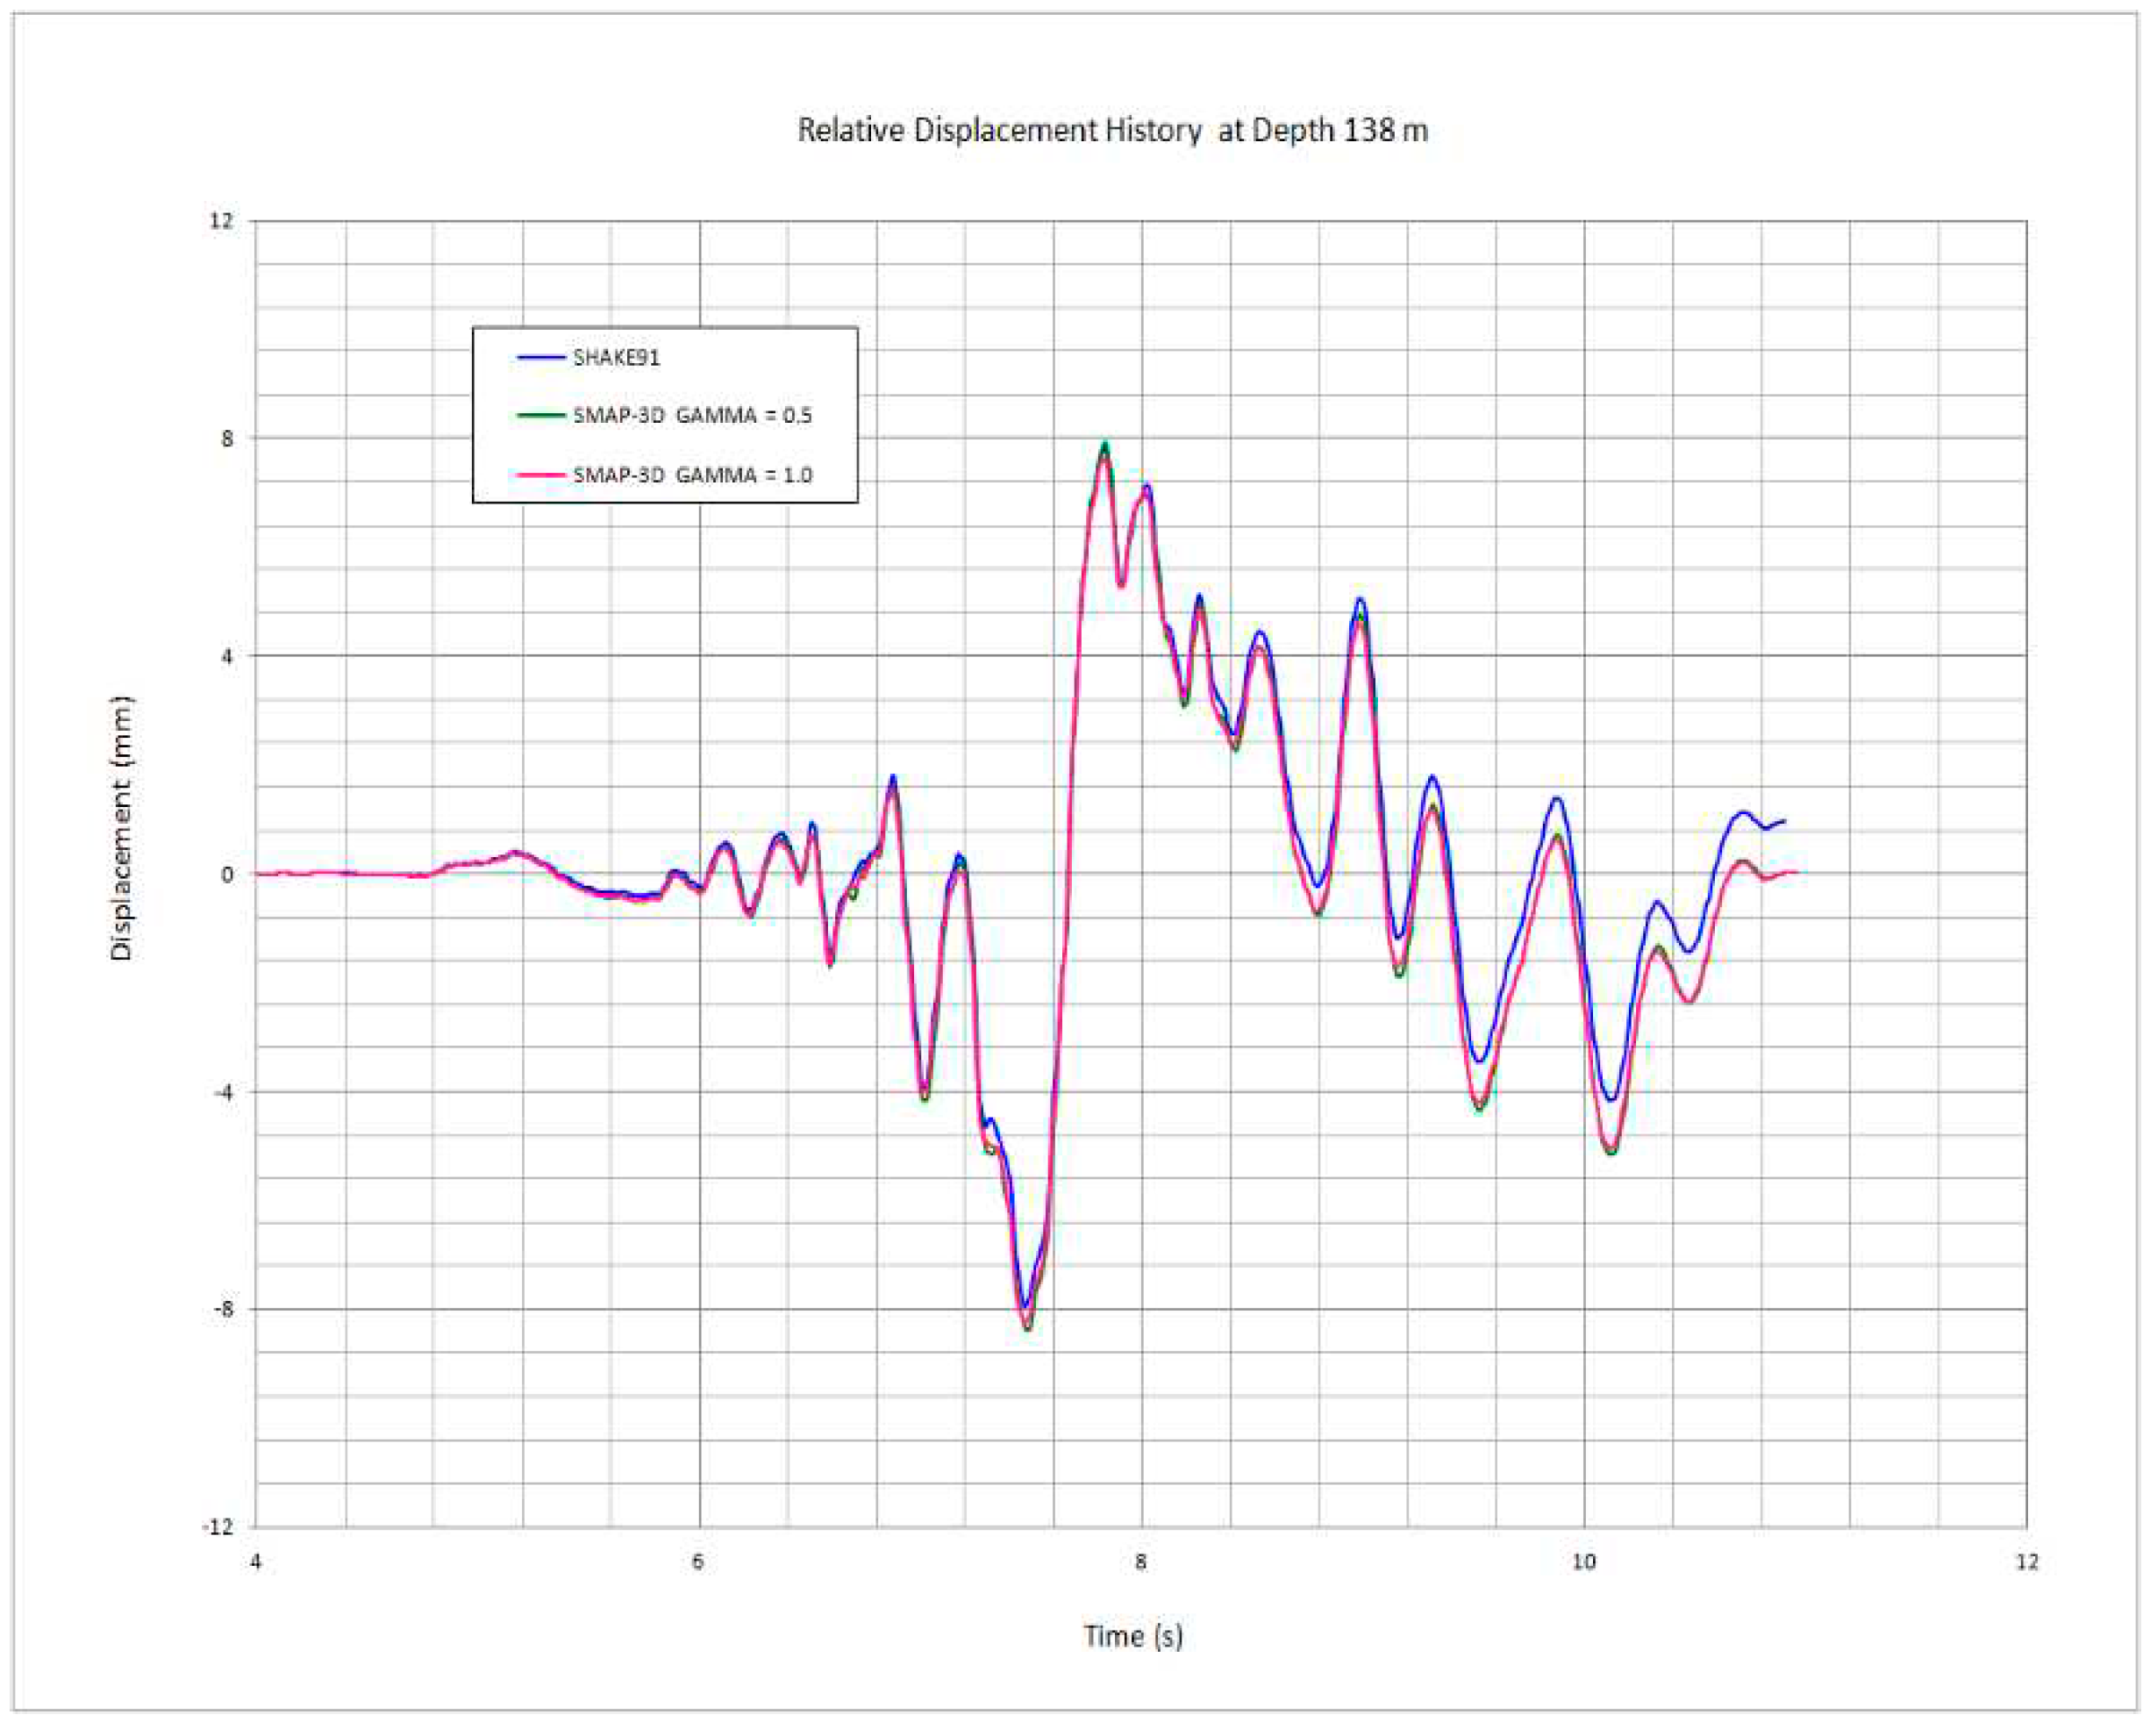
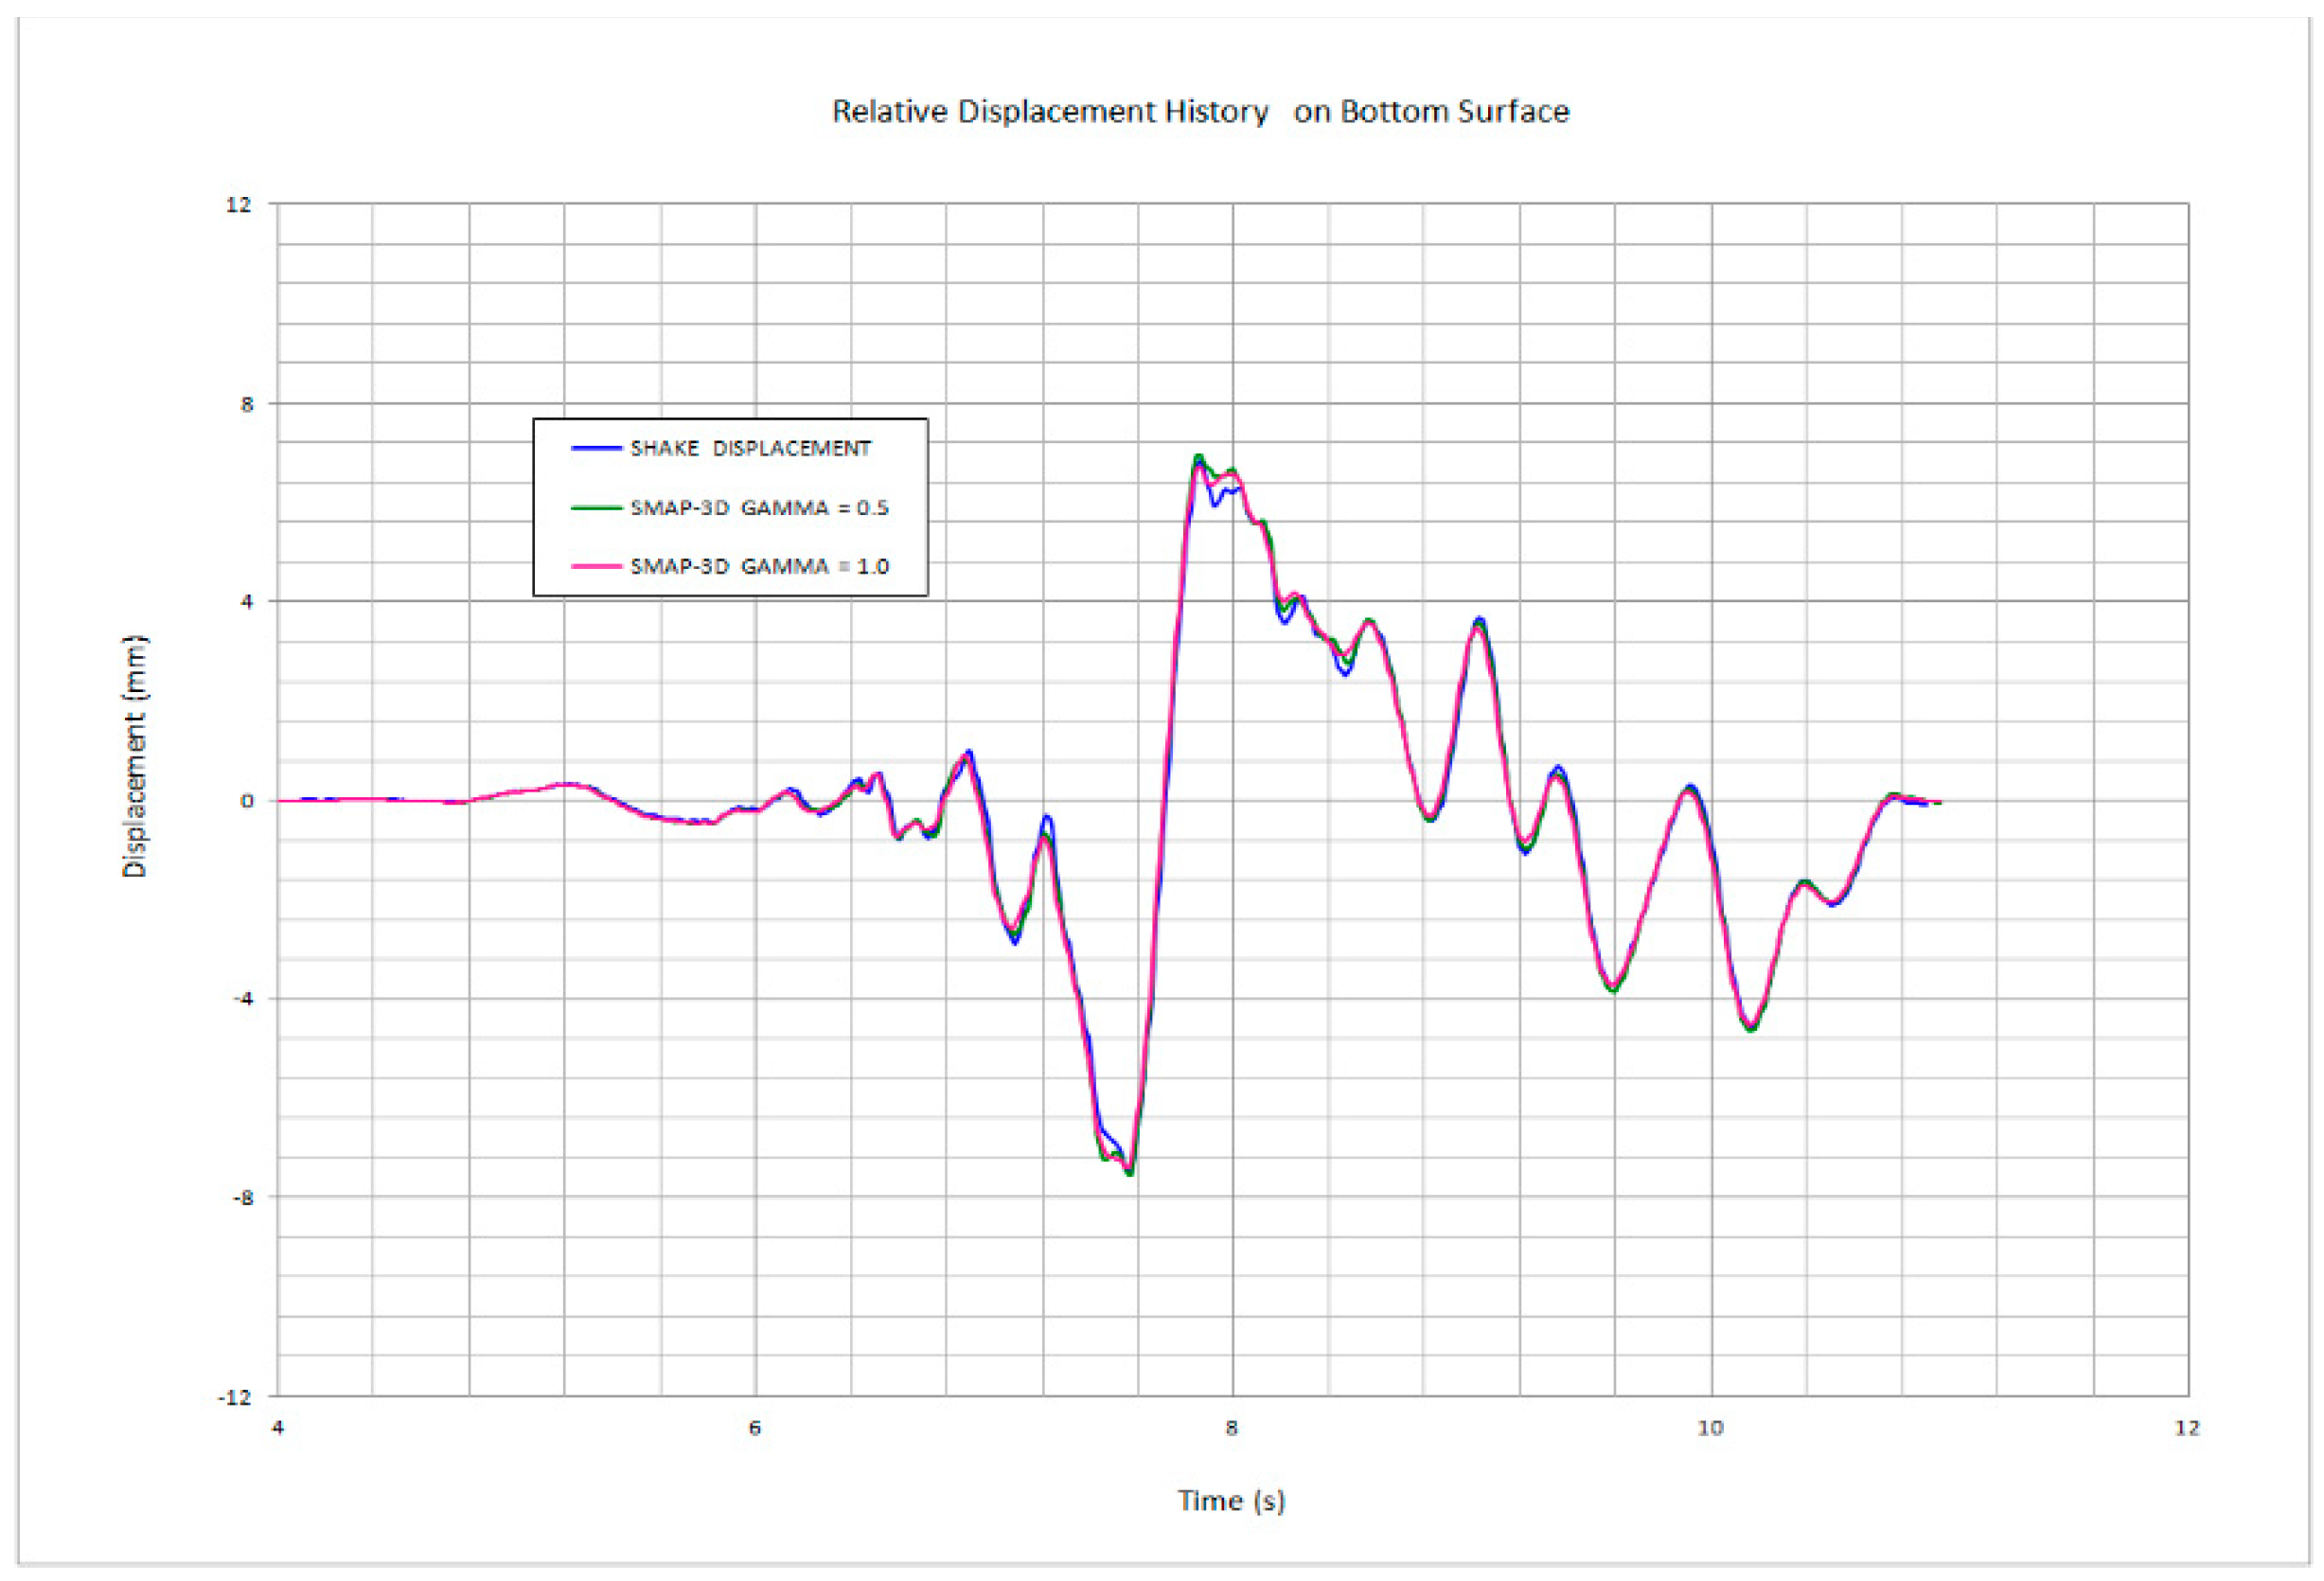
- Compared to SHAKE91, SMAP-3D with γ = 0.5 and γ = 1 results show closer to SHAKE91 results than we see those comparisons for acceleration histories to the relative displacement time histories on the ground surface. It is also noticed that the effect of numerical damping is less significant in the relative displacements. Compared to SHAKE91, SMAP-3D with γ = 0.5 and γ = 1 results in the relative displacement time histories at the location of the silo mid-height showing the same trends as in the ground surface. Here also, the numerical damping has a slight influence on the response of relative displacements.
- (6)
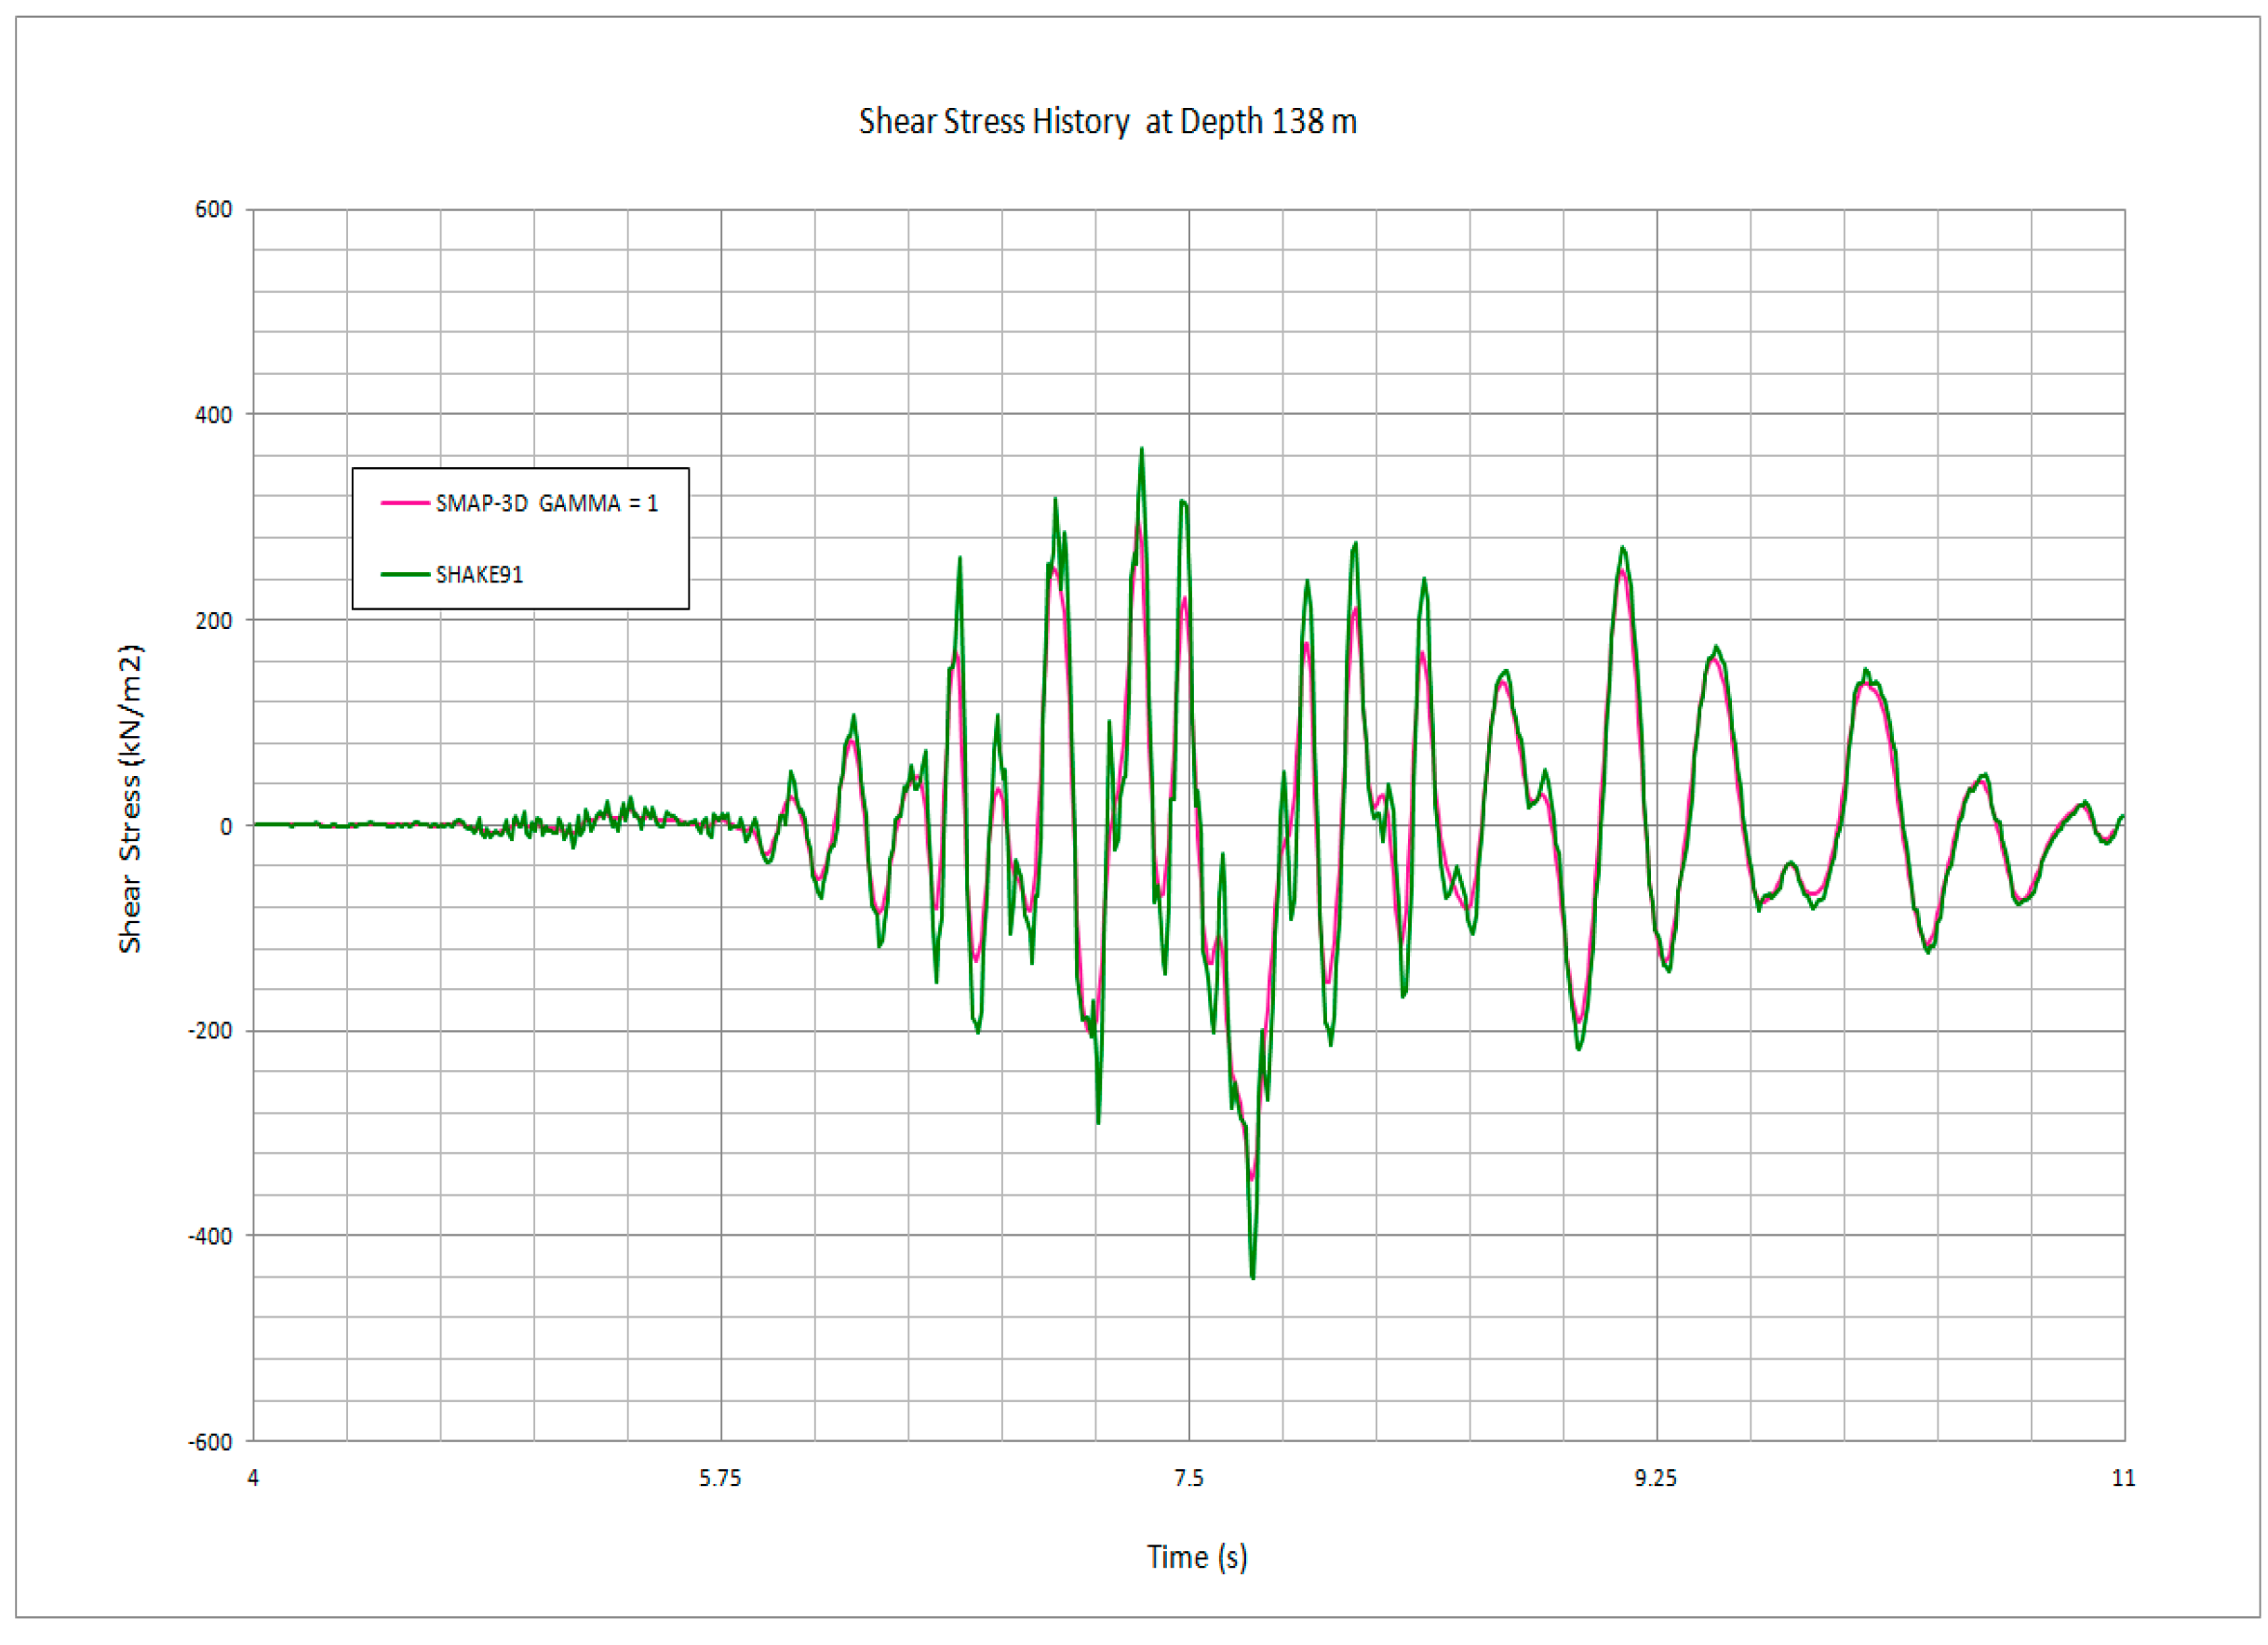
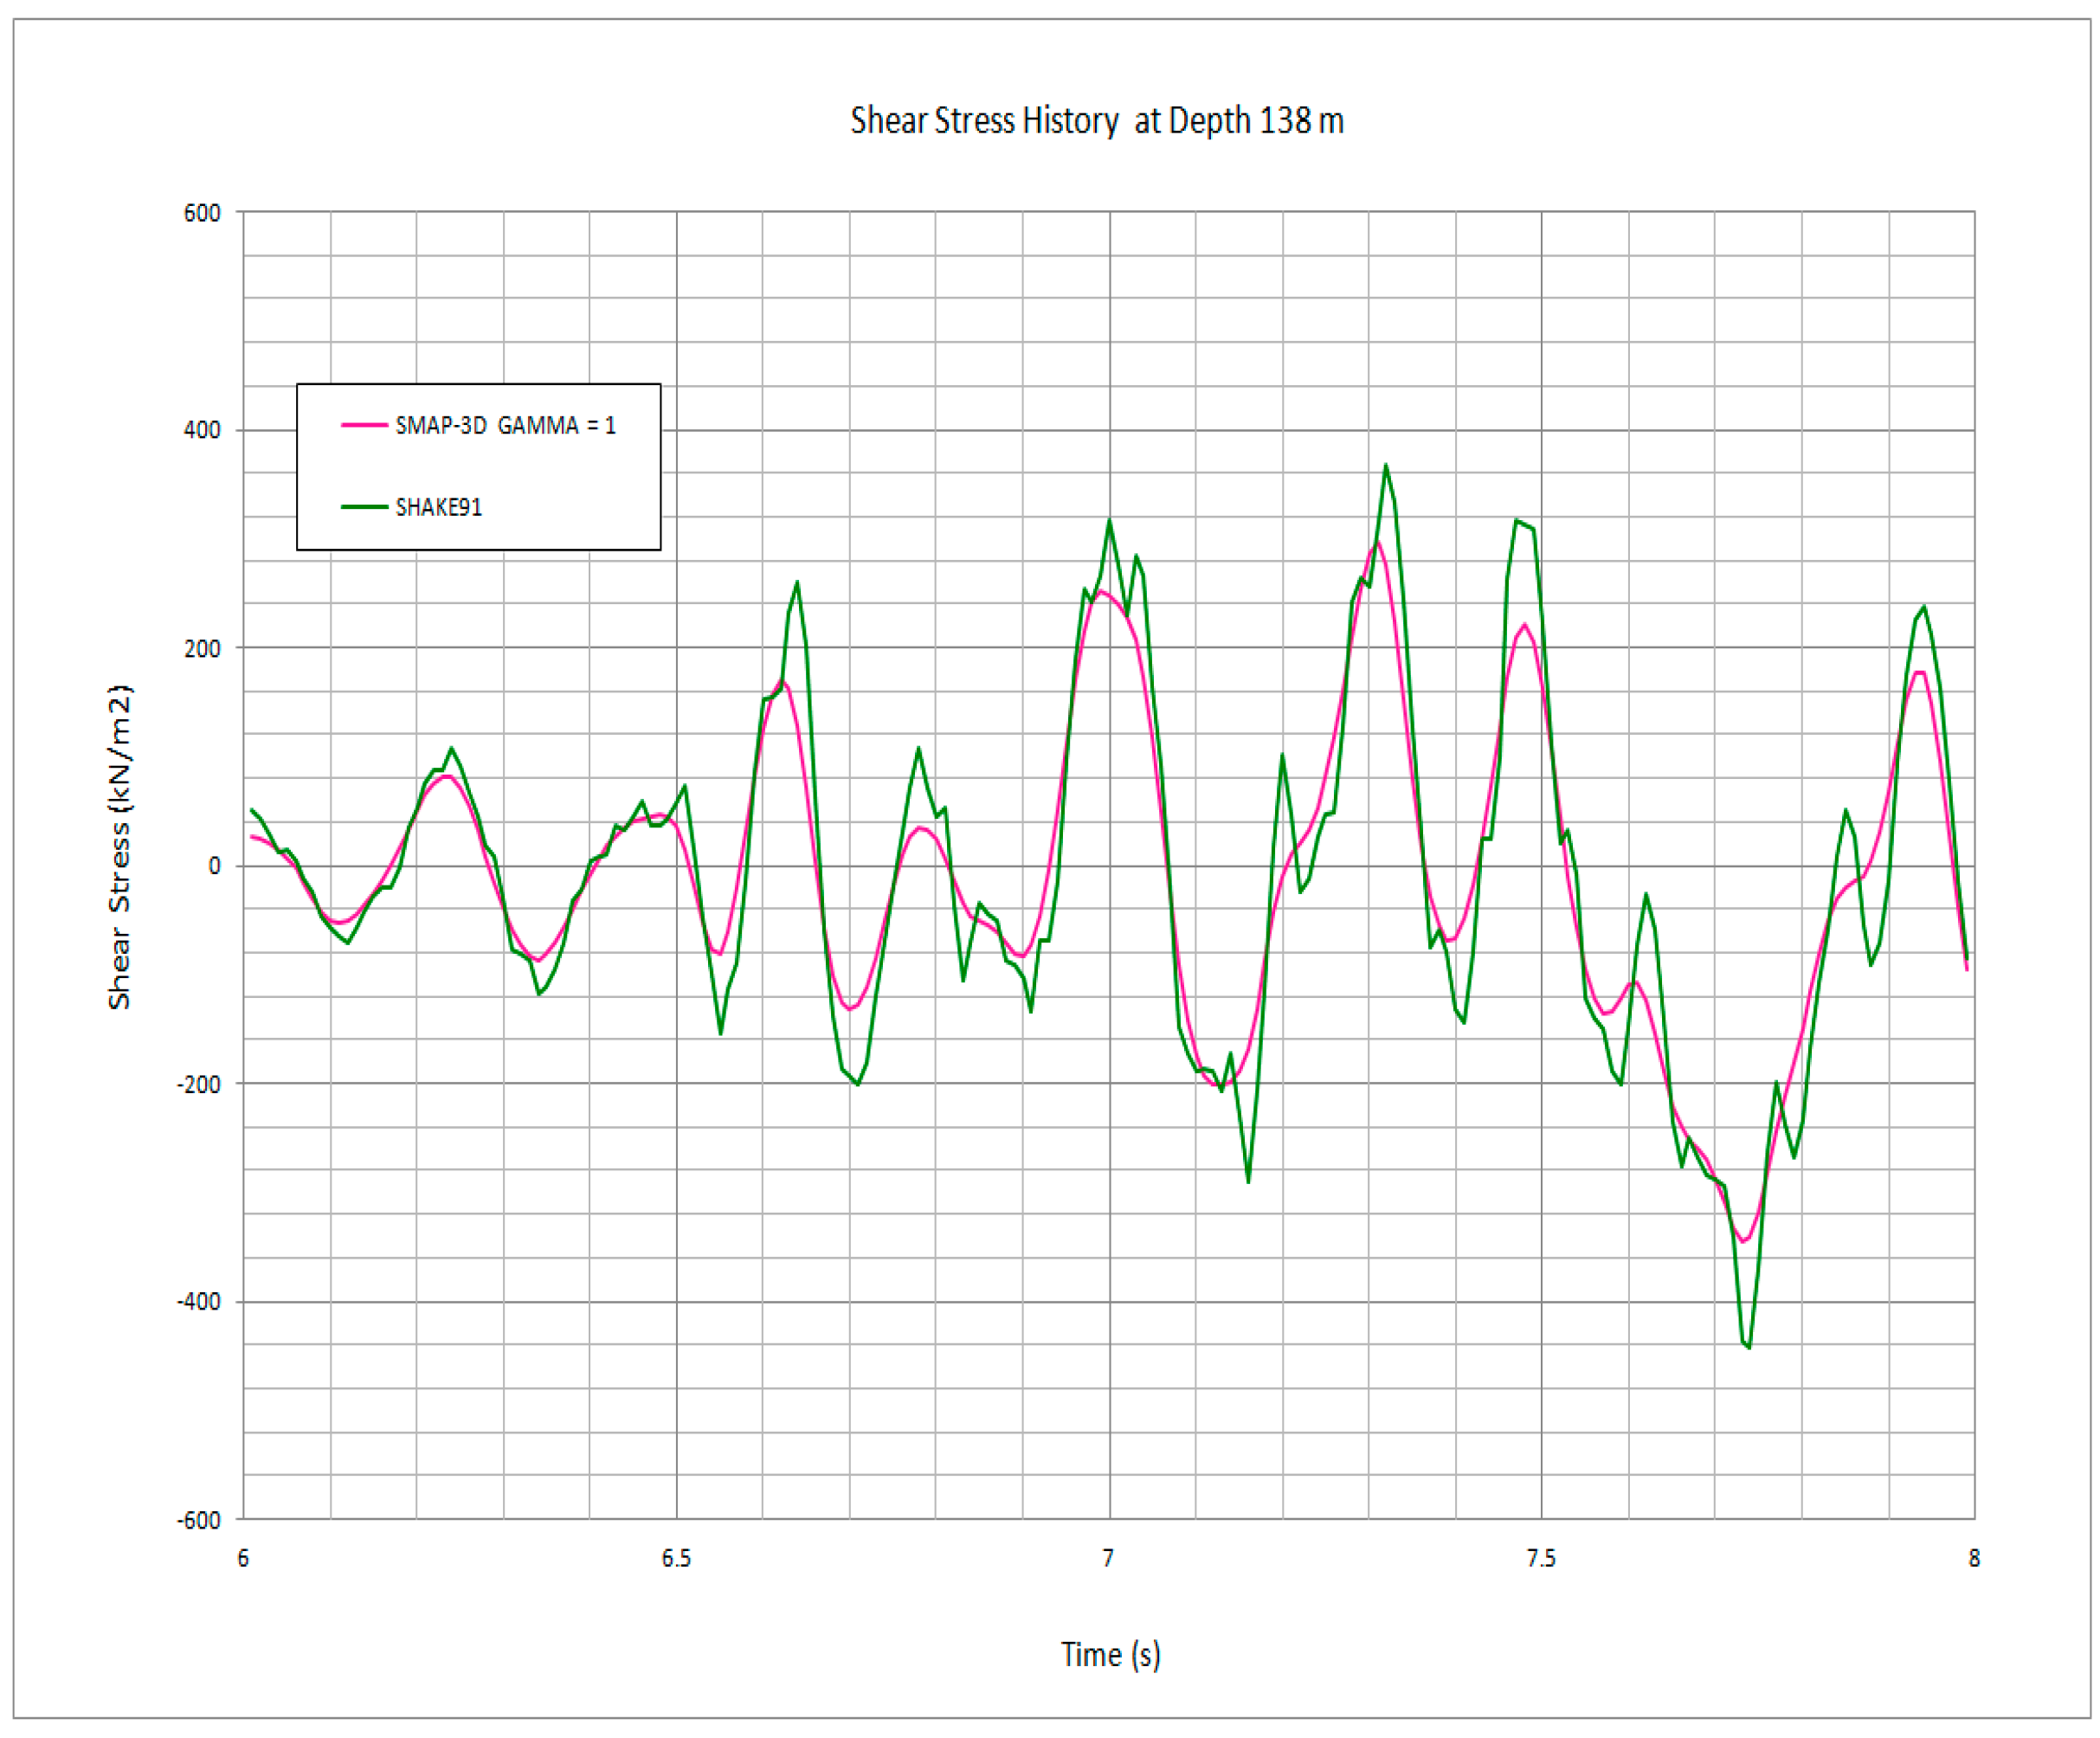
- SMAP-3D calculation with numerical damping of γ = 1 to the shear stress time histories at the location of the silo mid-height predicts reasonably well SHAKE91 closed-form results.
Acknowledgments
References
- KORAD. Earth & Us. Korea Radioactive Waste Agency. Gyeongju, Korea, 2018.
- Shin, Y.; Lee, J. The status and experiences of LILW disposal facilities construction. J Korean Soc Miner Energy Resour Eng. 2017, 54(4), pp.389-396. (in Korean. [CrossRef]
- Park, J.B.; Jung, H.R.; Lee, E.Y.; Kim, C.L.; Kim, G.Y.; Kim, K.S.; Koh, Y.K.; Park, K.W.; Cheong, J.H.; Jeong, C.W.; Choi, J.S.; Kim, J.S.; Kim, K.D. Wolsong low- and intermediate-level radioactive waste disposal center: progress and challenges. Nucl Eng Techno. 2009, 41(4), pp.477-492. [CrossRef]
- Bang, J.H.; Park, J.H.; Jung, K.I. Development of two-dimensional near-field integrated performance assessment model for near-surface LILW disposal. J Nucl Fuel Cycle Waste Tech. 2014, 12(4), pp.315-334. [CrossRef]
- Jung, K.I.; Kim, J.H.; Kwon, M.J.; Jeong, M.S.; Hong, S.W.; Park, J.B. Comprehensive development plans for the low- and intermediate-level radioactive waste disposal facility in Korea and preliminary safety assessment. J Nucl Fuel Cycle Waste Tech. 2016, 14(4), pp.385-410. [CrossRef]
- Kim, K.H.; Ree, J.H.; Kim, Y.H.; Kim, S.S.; Kang, S.Y.; Seo, W.S. Assessing whether the 2017 Mw 5.4 Pohang earthquake in South Korea was an induced event. Science. 2018, 360(6392), pp.1007-1009. [CrossRef]
- Jin, K.; Lee, J.; Lee, K.; Kyung, J.B.; Kim, Y.S. Earthquake damage and related factors associated with the 2016 ML=5.8 Gyeonju earthquake, southeast Korea. Geosci J. 2020, 24(2), pp.141-157. [CrossRef]
- Kim, M.K.; Choi, I.K.; Jeong, J. Development of a seismic risk assessment system for low and intermediate level radioactive waste repository – current status of year 1 research. WM2011 Conference, Phoenix, AZ, 2011.
- Kim, S.H.; Kim, K.J. Numerical parametric studies on the stress distribution in rocks around underground silo. Appl. Sci. 2022, 12(3), 1613. [CrossRef]
- Byen, H.; Jeong, G.Y.; Park, J. Structural stability analysis of waste packages containing low- and intermediate-level radioactive waste in a silo-type repository. Nucl Eng Techno. 2021, 53(5), pp.1524-1533. [CrossRef]
- Kim, S.H.; Kim, K.J. Finite element formulations for free field one-dimensional shear wave propagation. Earthquakes Struct. 2024, 26(2), in press.
- Idriss, I.M.; Sun, J.I. User's manual for SHAKE91 : a computer program for conducting equivalent linear seismic response analyses of horizontally layered soil deposits. Center for Geotechnical Modeling, Department of Civil & Environmental Engineering, University of California, Davis, California, 1992.
- Schnabel, P.B.; Lysmer, J.; Seed, H.B. SHAKE —A computer program for earthquake response analysis of horizontal layered sites. Report. No. EERC 71-12, Earthquake Engineering Research Center, Berkeley, 1972.
- Ordonez, G.A. SHAKE2000 : A computer program for the 1-D analysis of geotechnical earthquake engineering problems. 2004.
- Hashash, Y.M.A.; Musgrove, M.I.; Harmon, J.A.; Ilhan, O.; Xing, G.; Numanoglu, O.; Groholski, D.R.; Phillips, C.A.; Park, D. DEEPSOIL 7, User Manual. Urbana, IL, Board of Trustees of University of Illinois at Urbana-Champaign, 2020.
- Rayleigh, J.; Lindsay, R. The Theory of Sound. Dover Publications, Inc., Dover, 1945.
- Lai, C.G.; Rix, G.J. Simultaneous Inversion of Rayleigh Phase Velocity and Attenuation for Near-Surface Site Characterization. Report No. GIT-CEE/GEO-98-2. School of Civil and Environmental Engineering, Georgia Institute of Technology, 1988.
- Hudson, M. Behavior of Slopes and Earth Dams During Earthquakes. Doctoral Thesis, University of California, Davis, 1994.
- Idriss, I.M.; Seed, H.B. Response of Horizontal Soil Layers During Earthquakes, Research Report, Soil Mechanics and Bituminous Materials Laboratory, University of California, Berkeley, CA, USA, August 1967.
- Hudson, M.; Idriss, I.M.; Beikae, M. User’s Manual for QUAD4M: A Computer Program to Evaluate the Seismic Response of Soil Structures Using Finite Element Procedures and Incorporating a Compliant Base. University of California, Davis, CA, USA, 1994.
- Comtec Research. SMAP-3D; Structure Medium Analysis Program, User’s Manual Version 7.03, 2020.
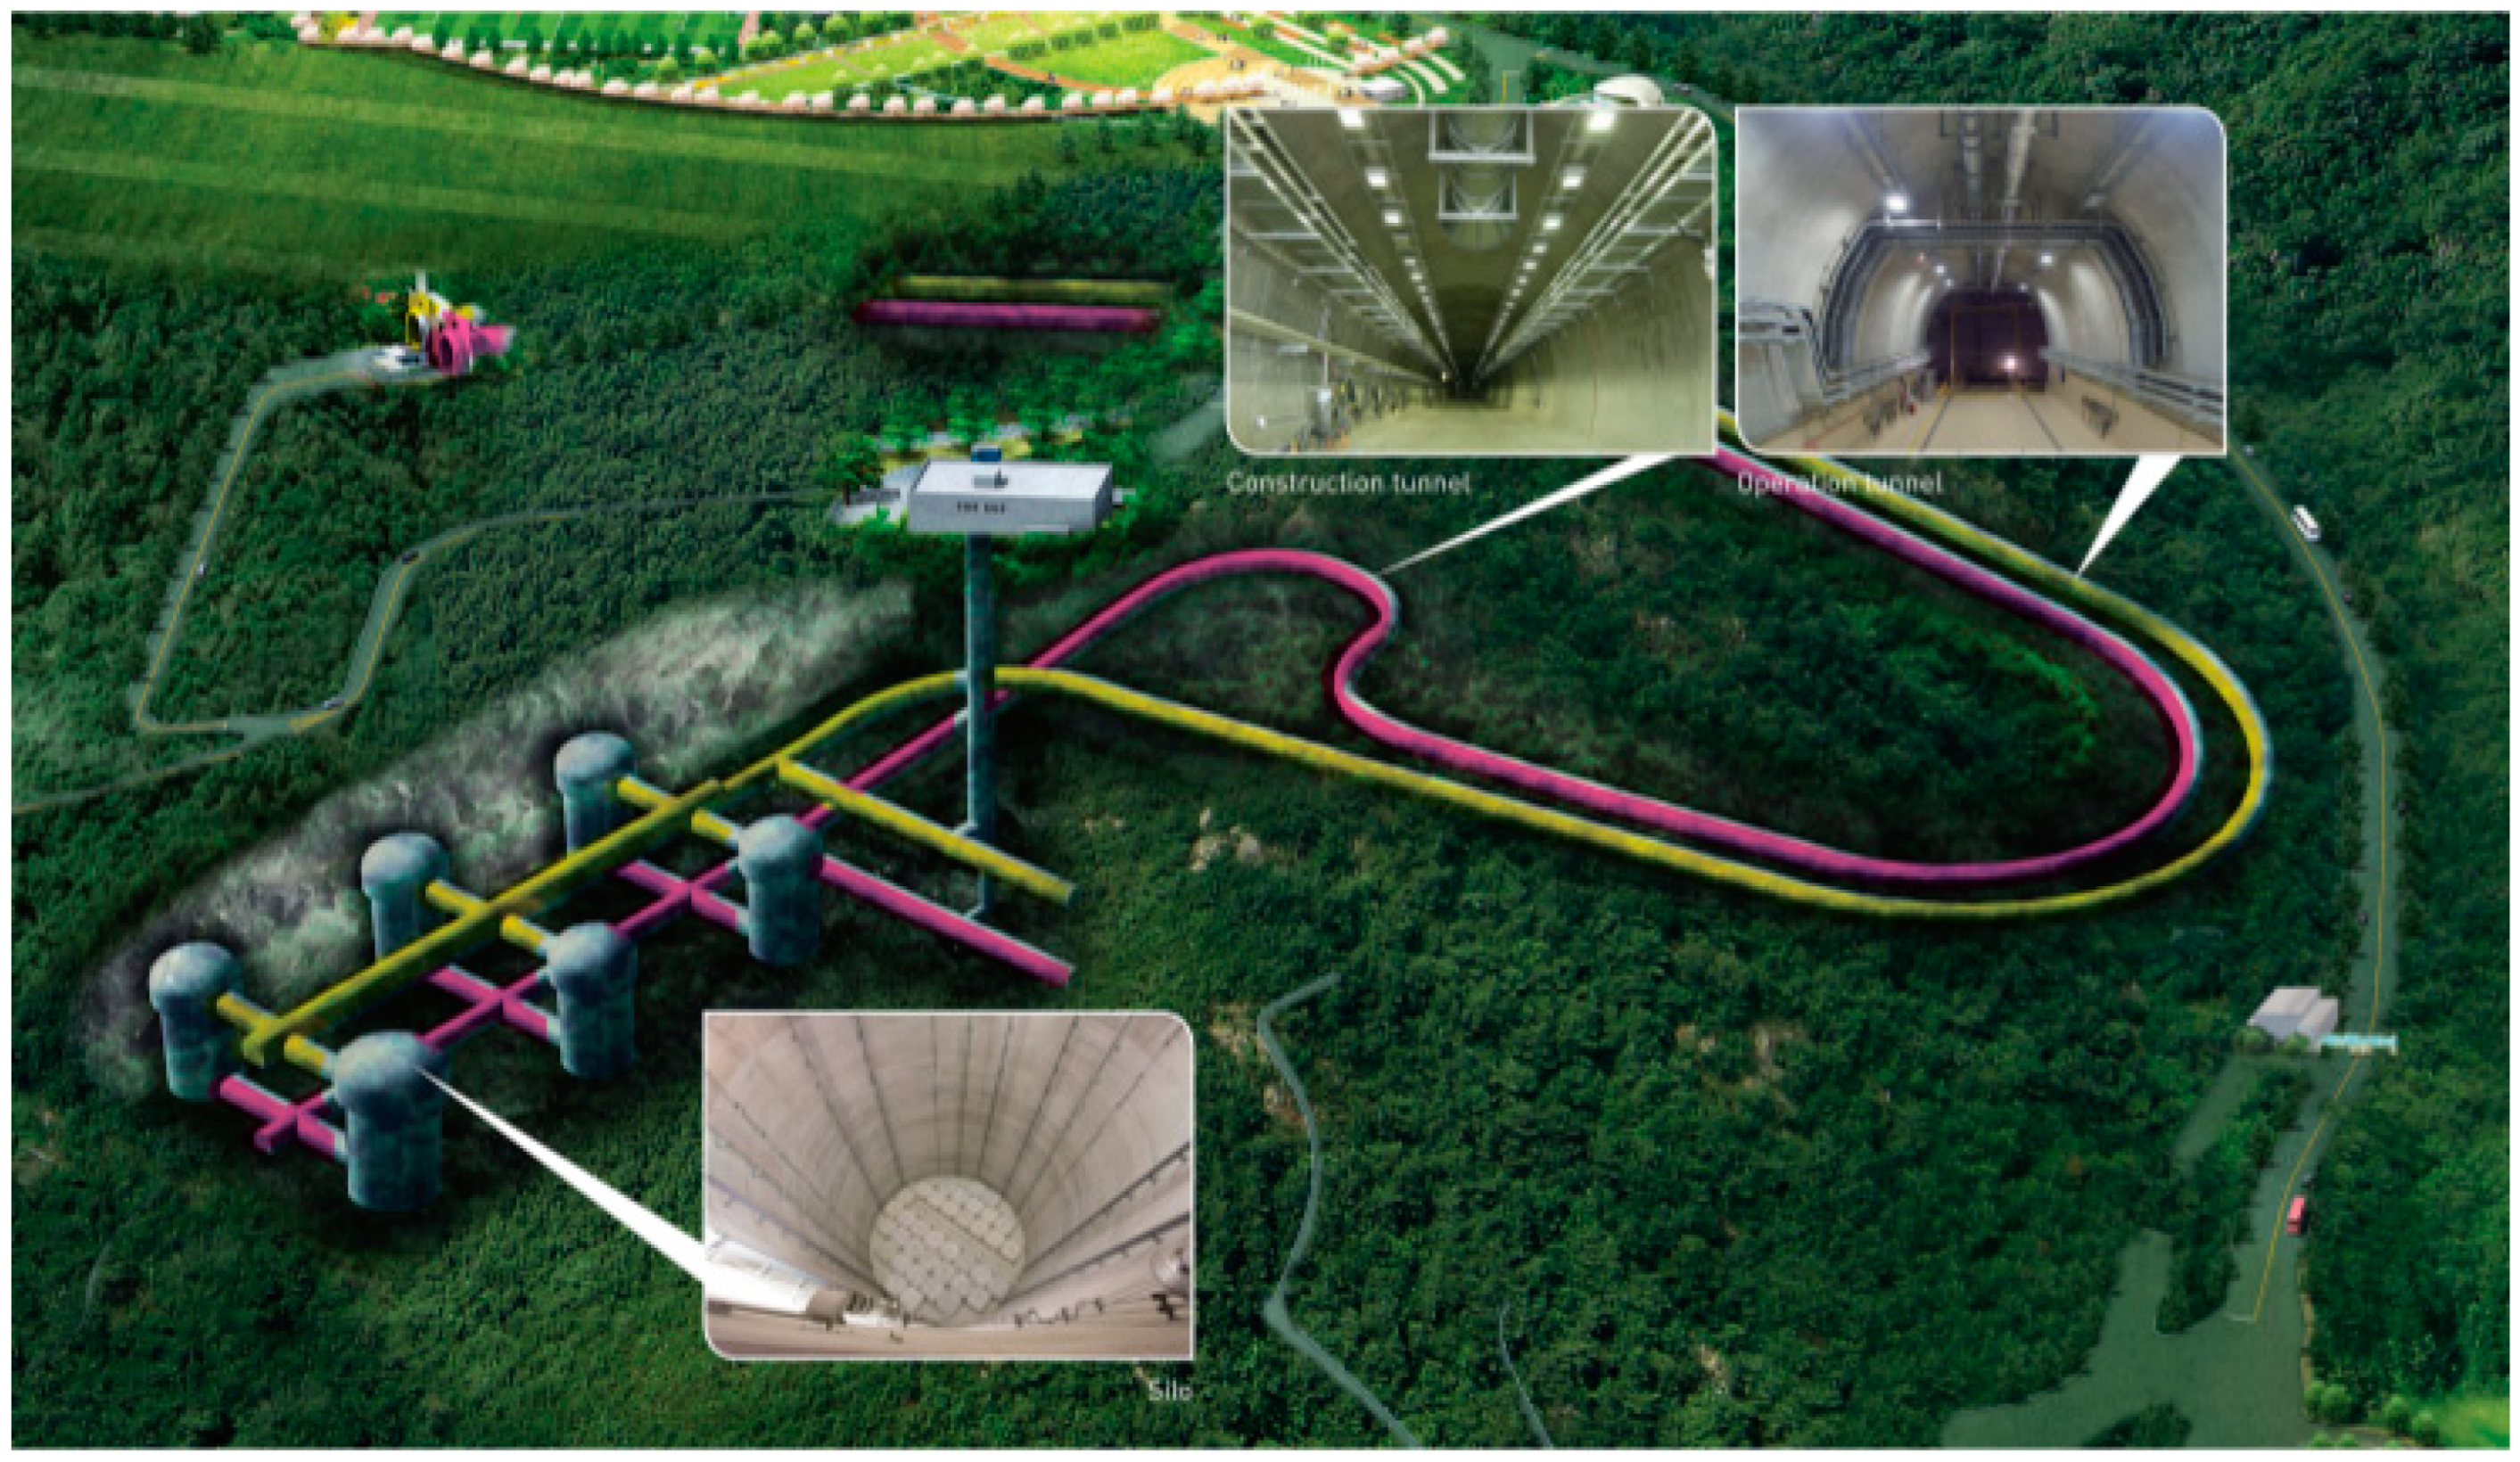
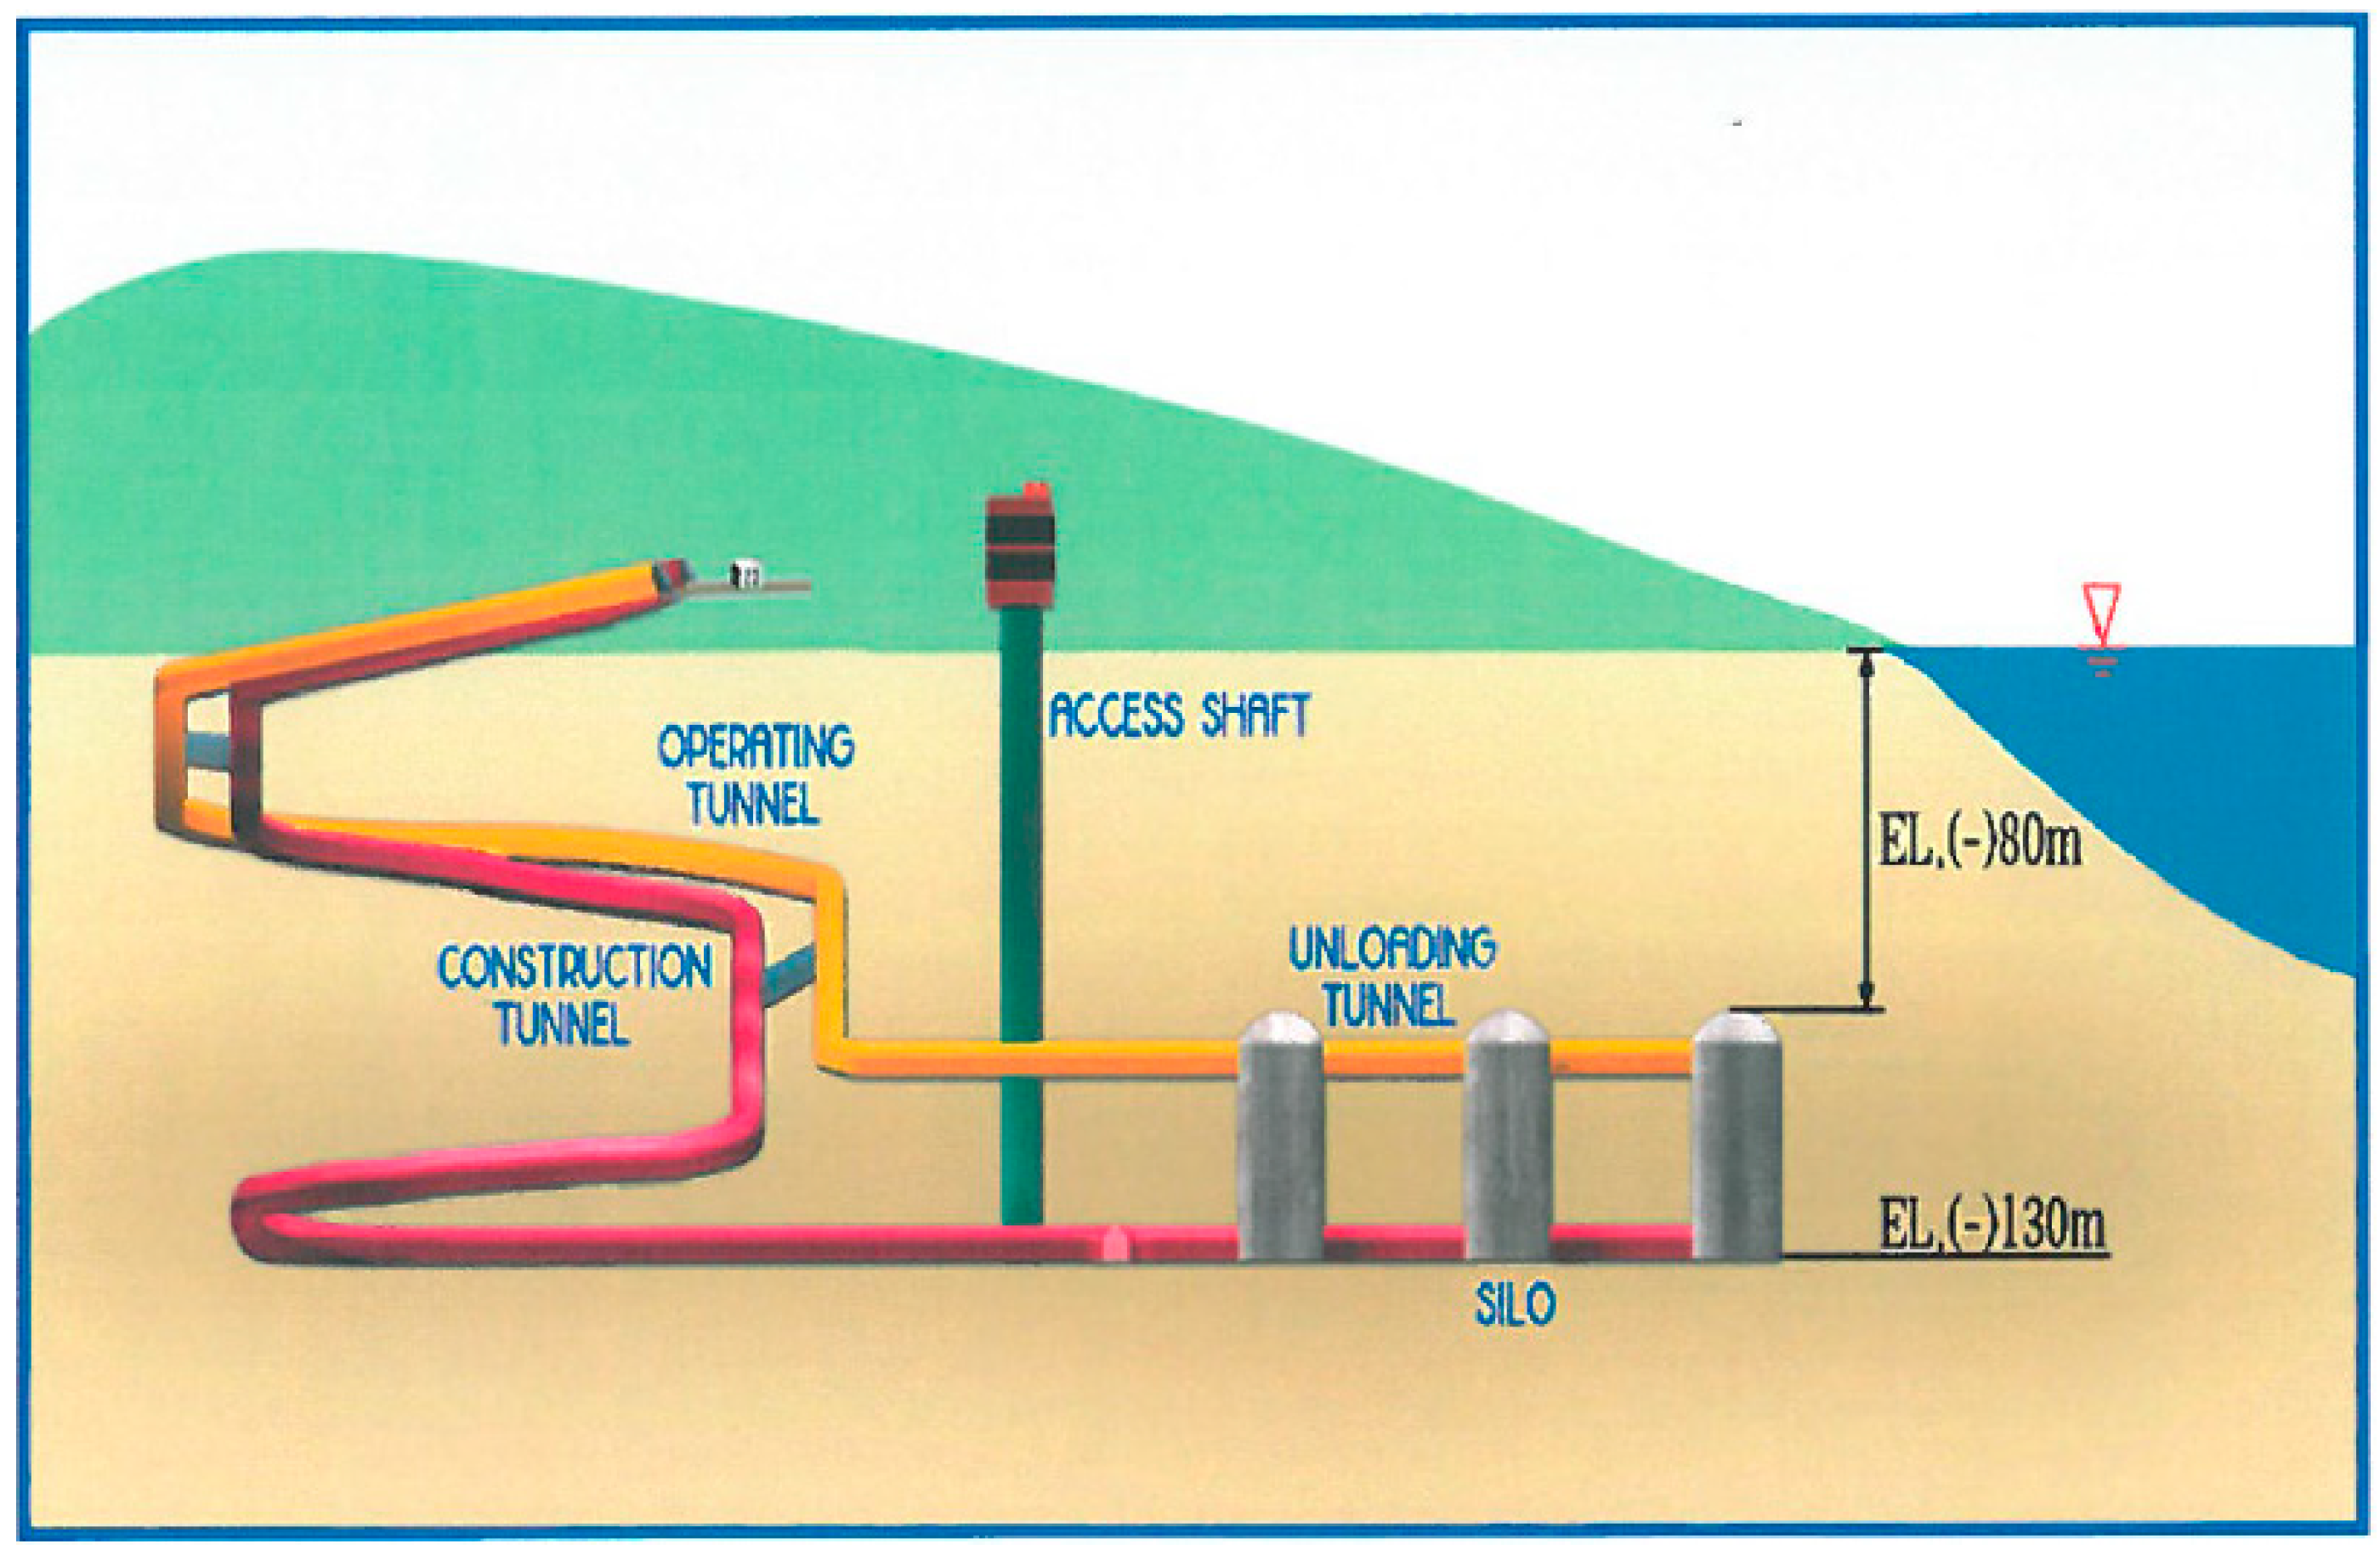

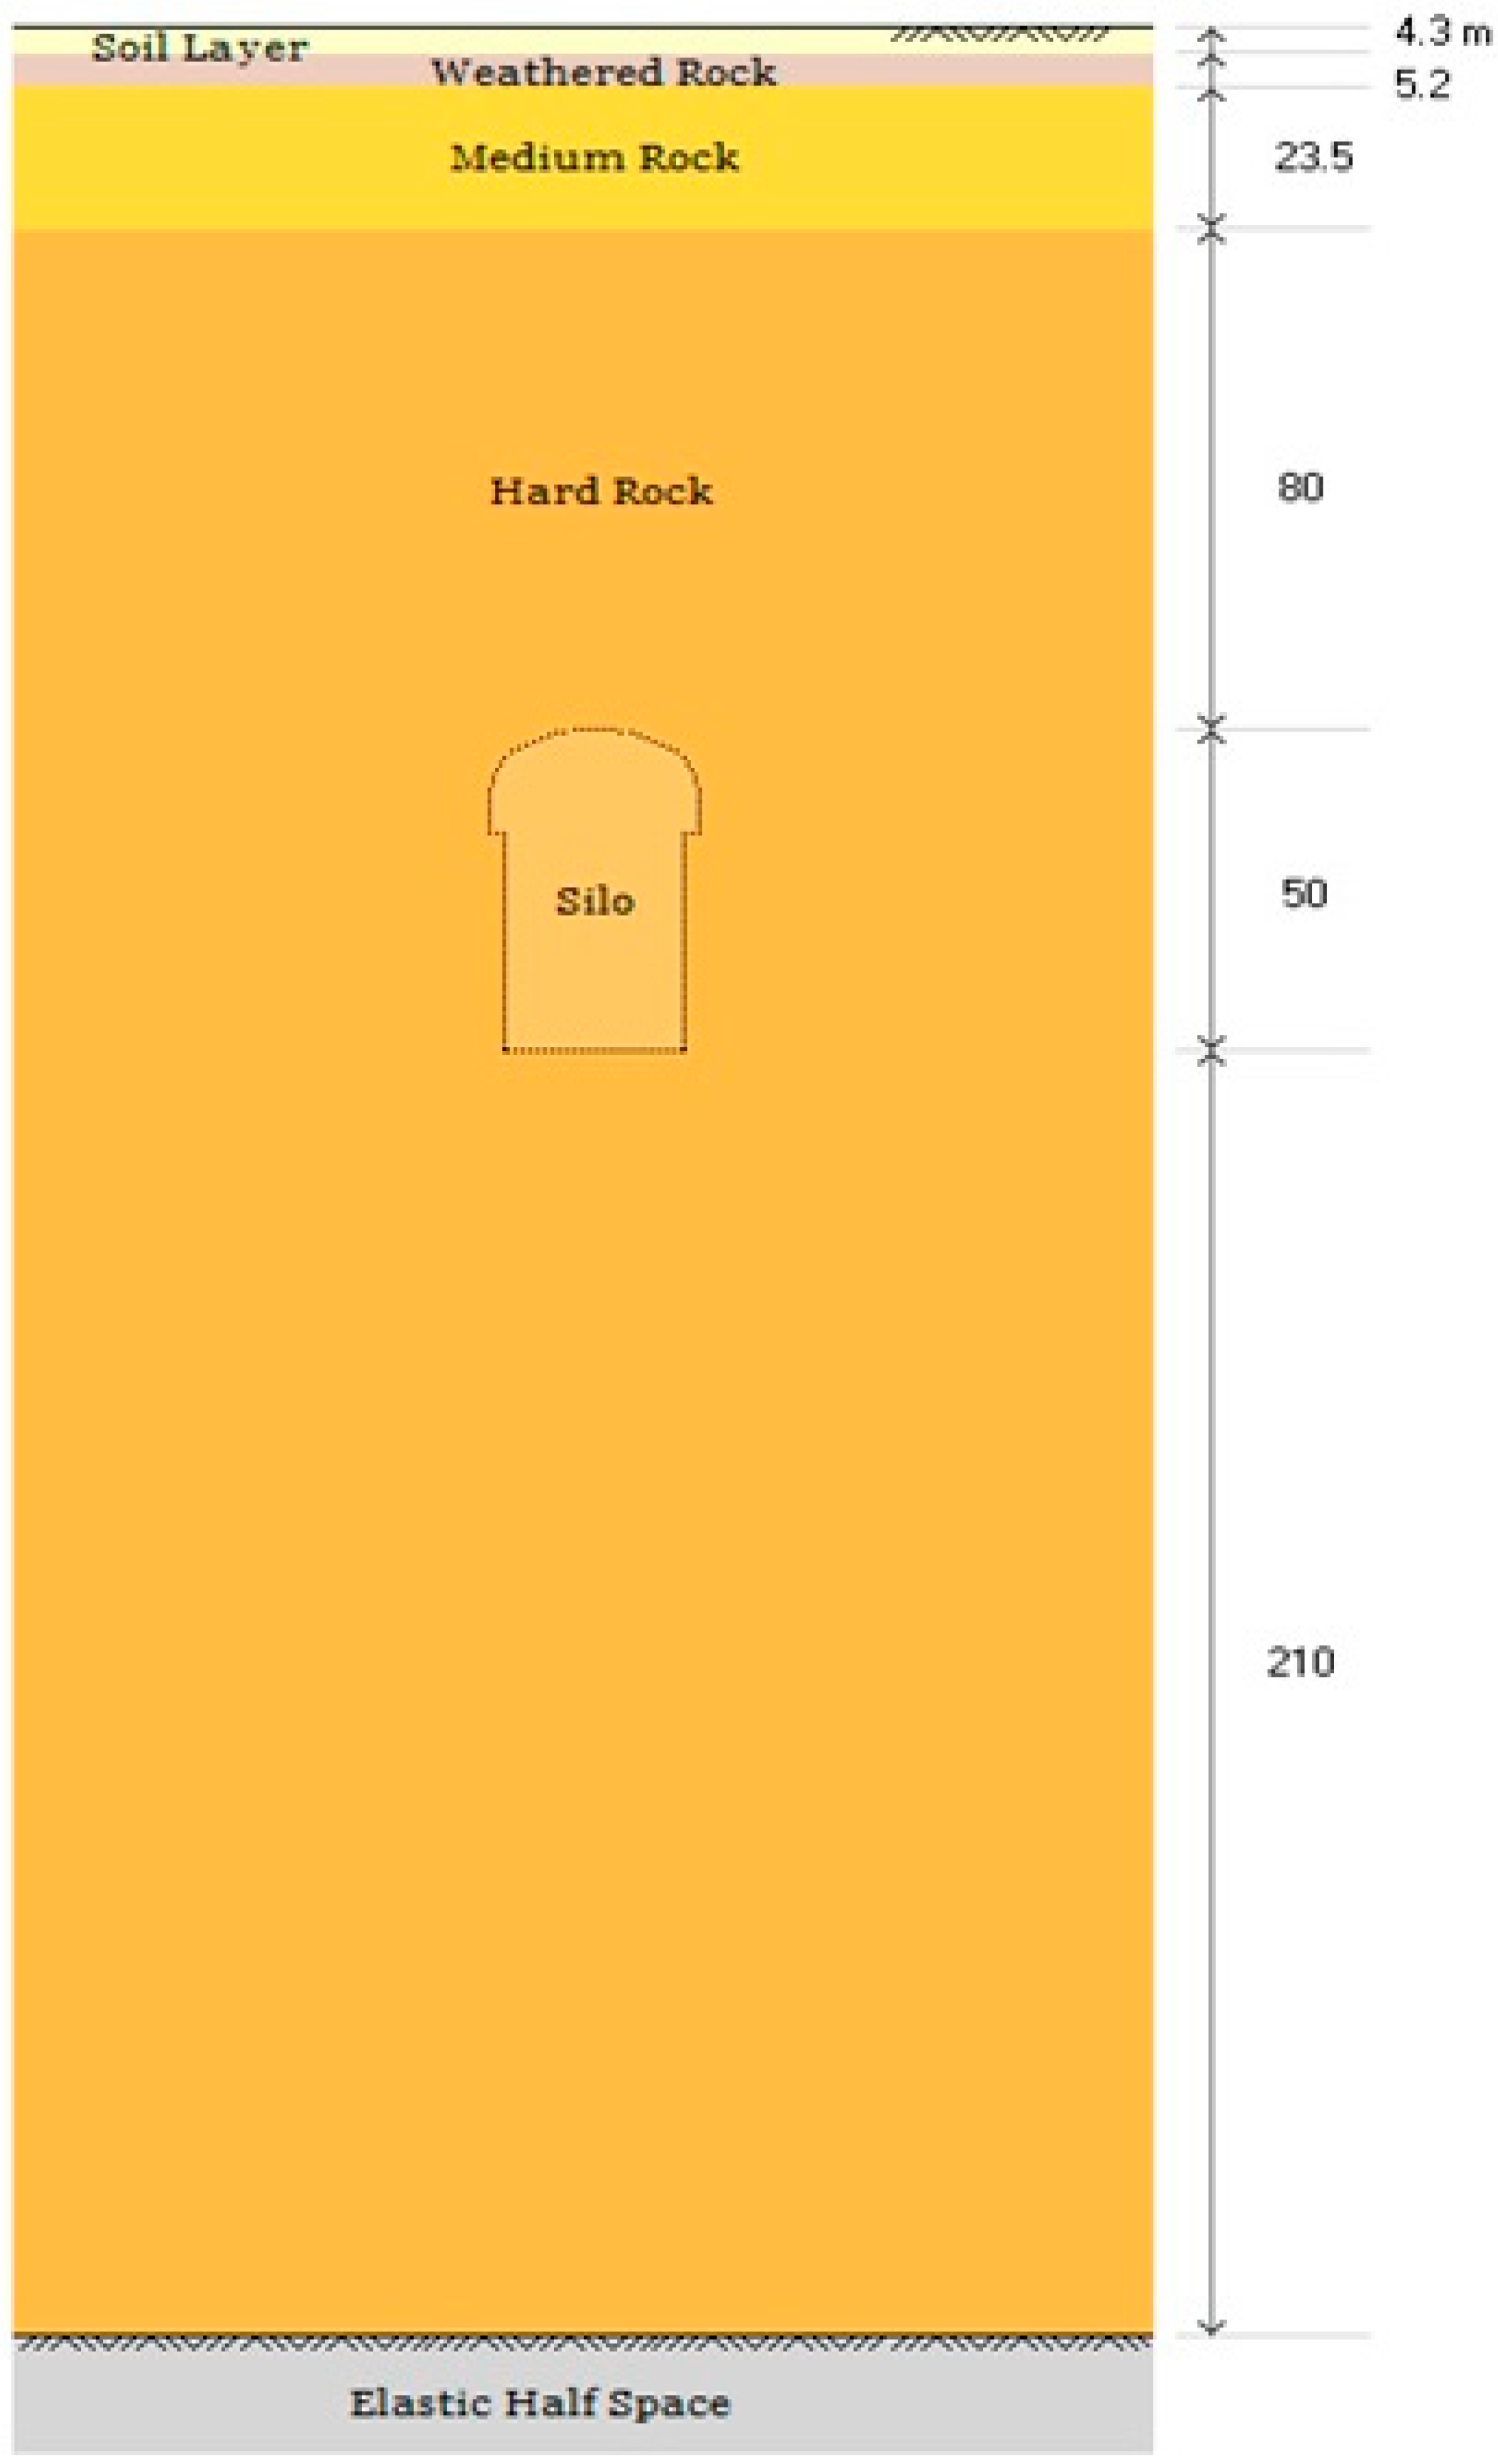
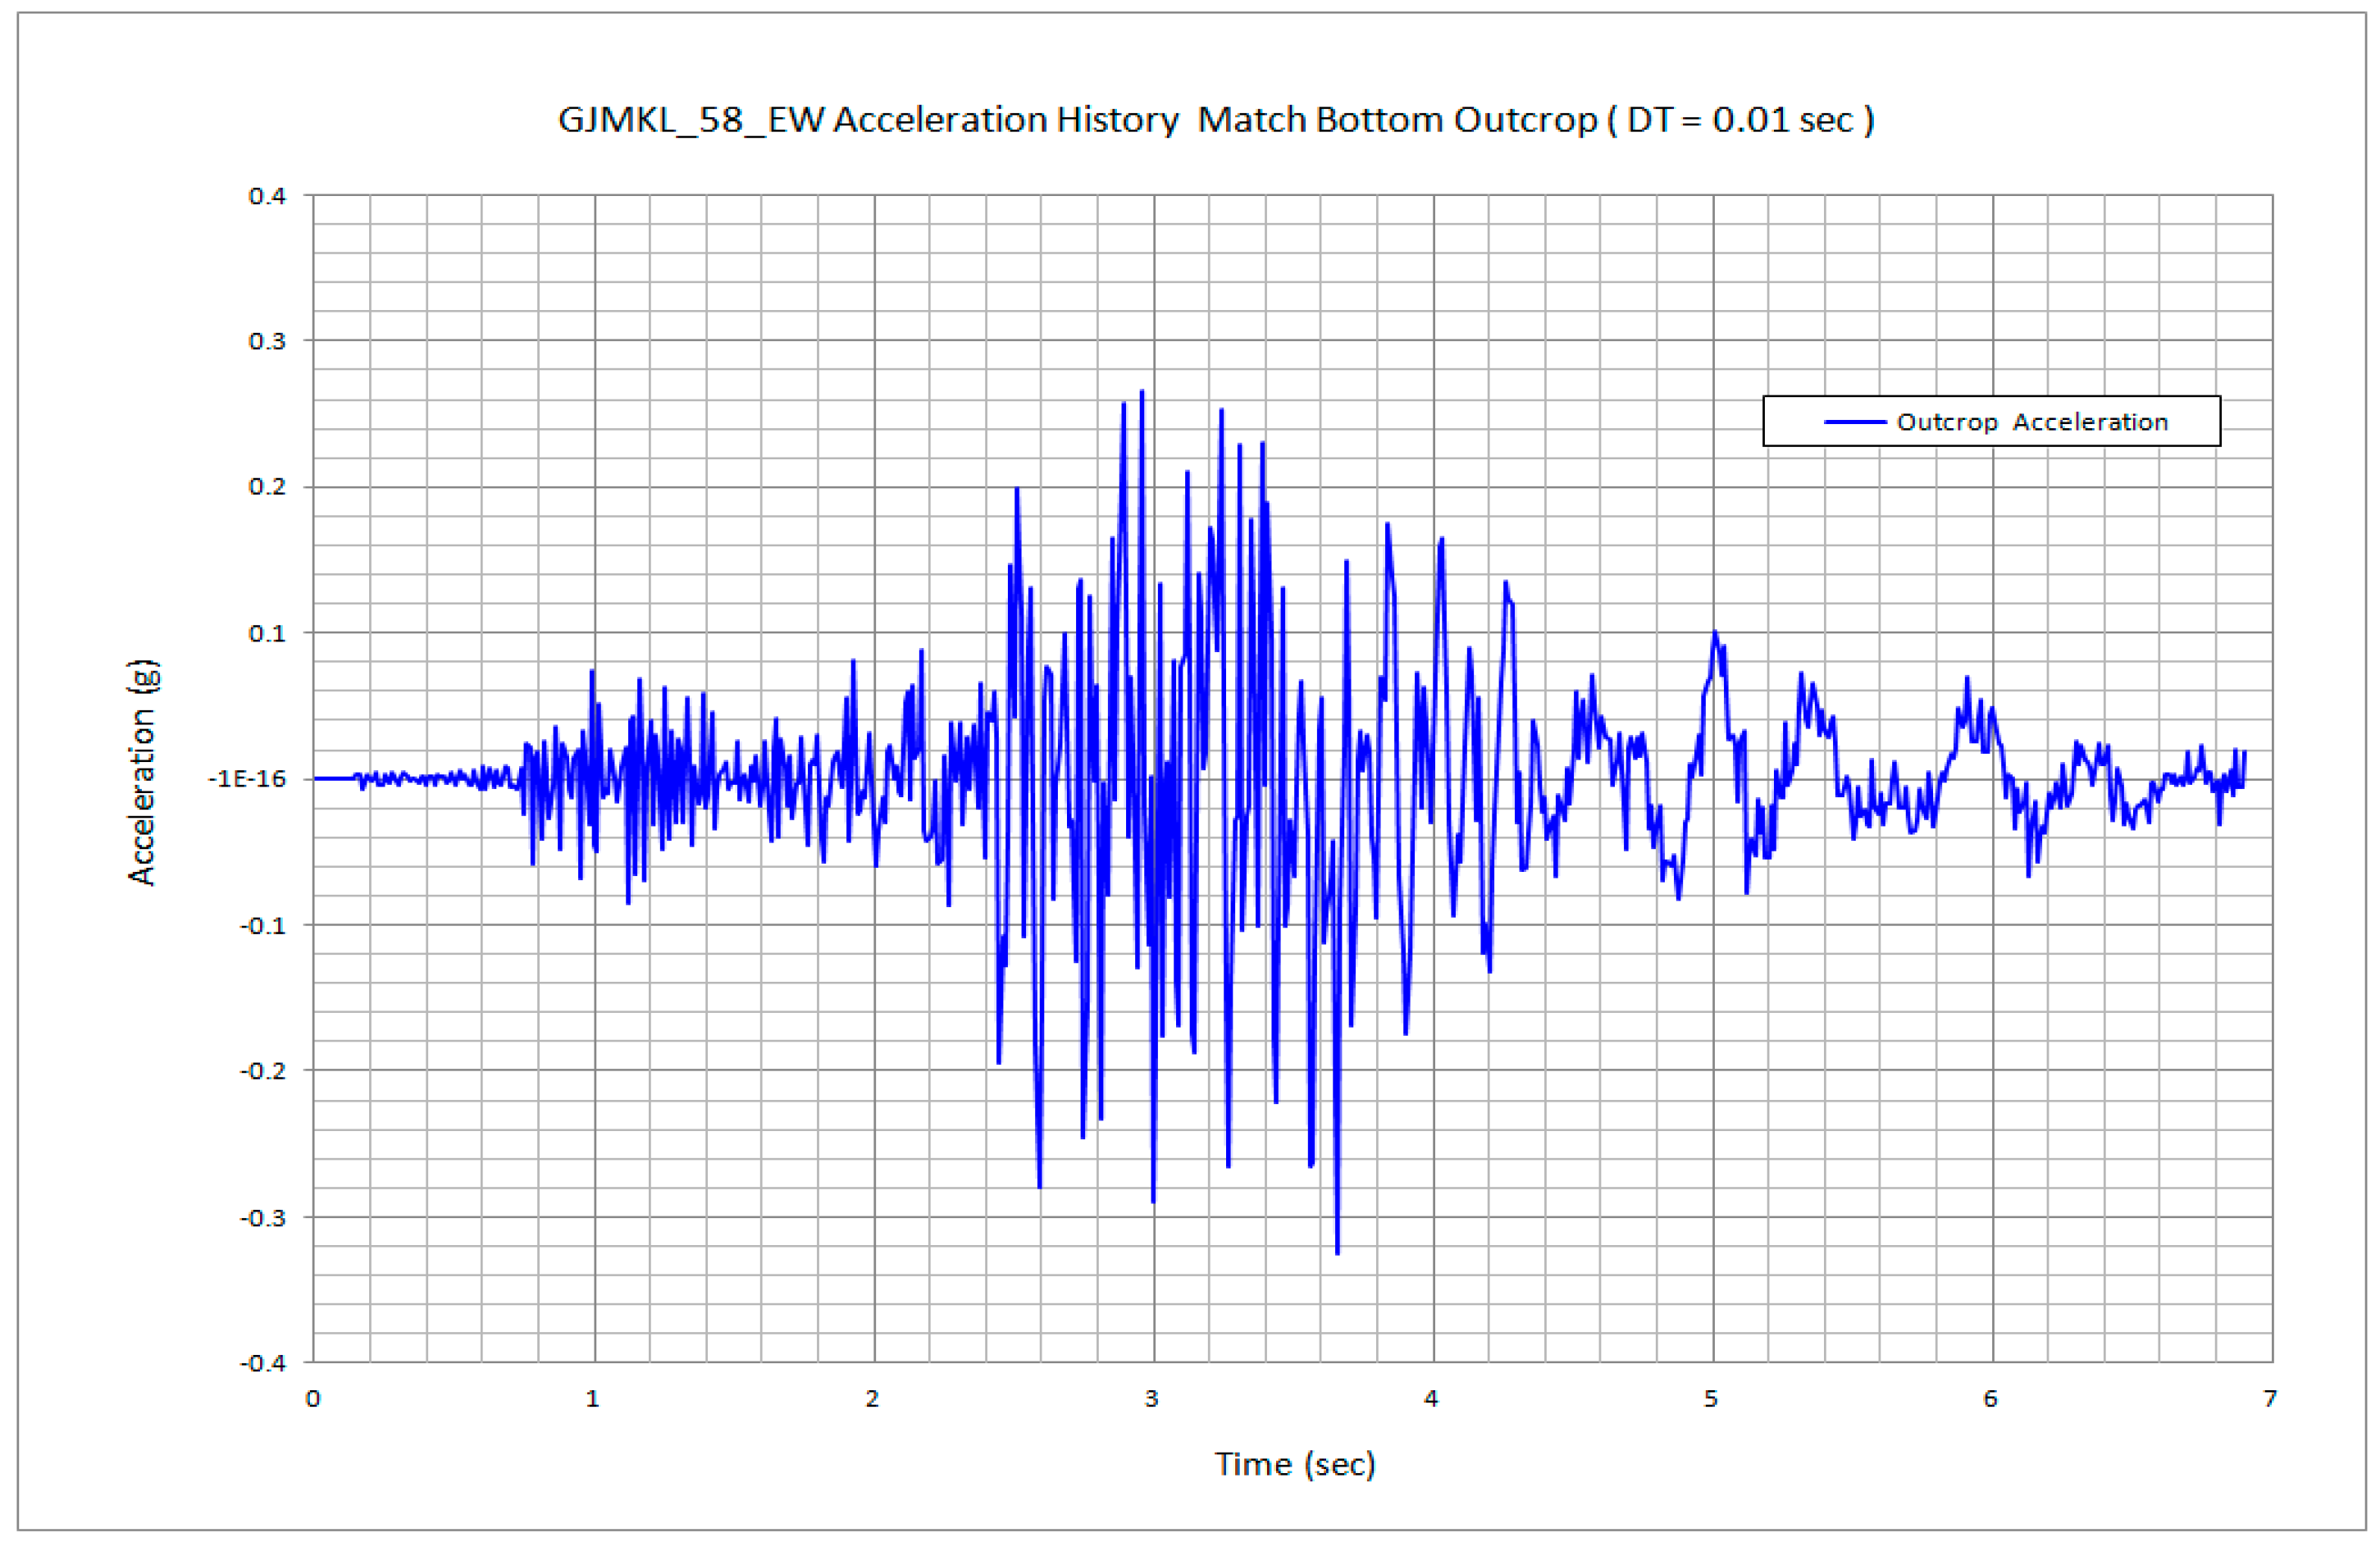
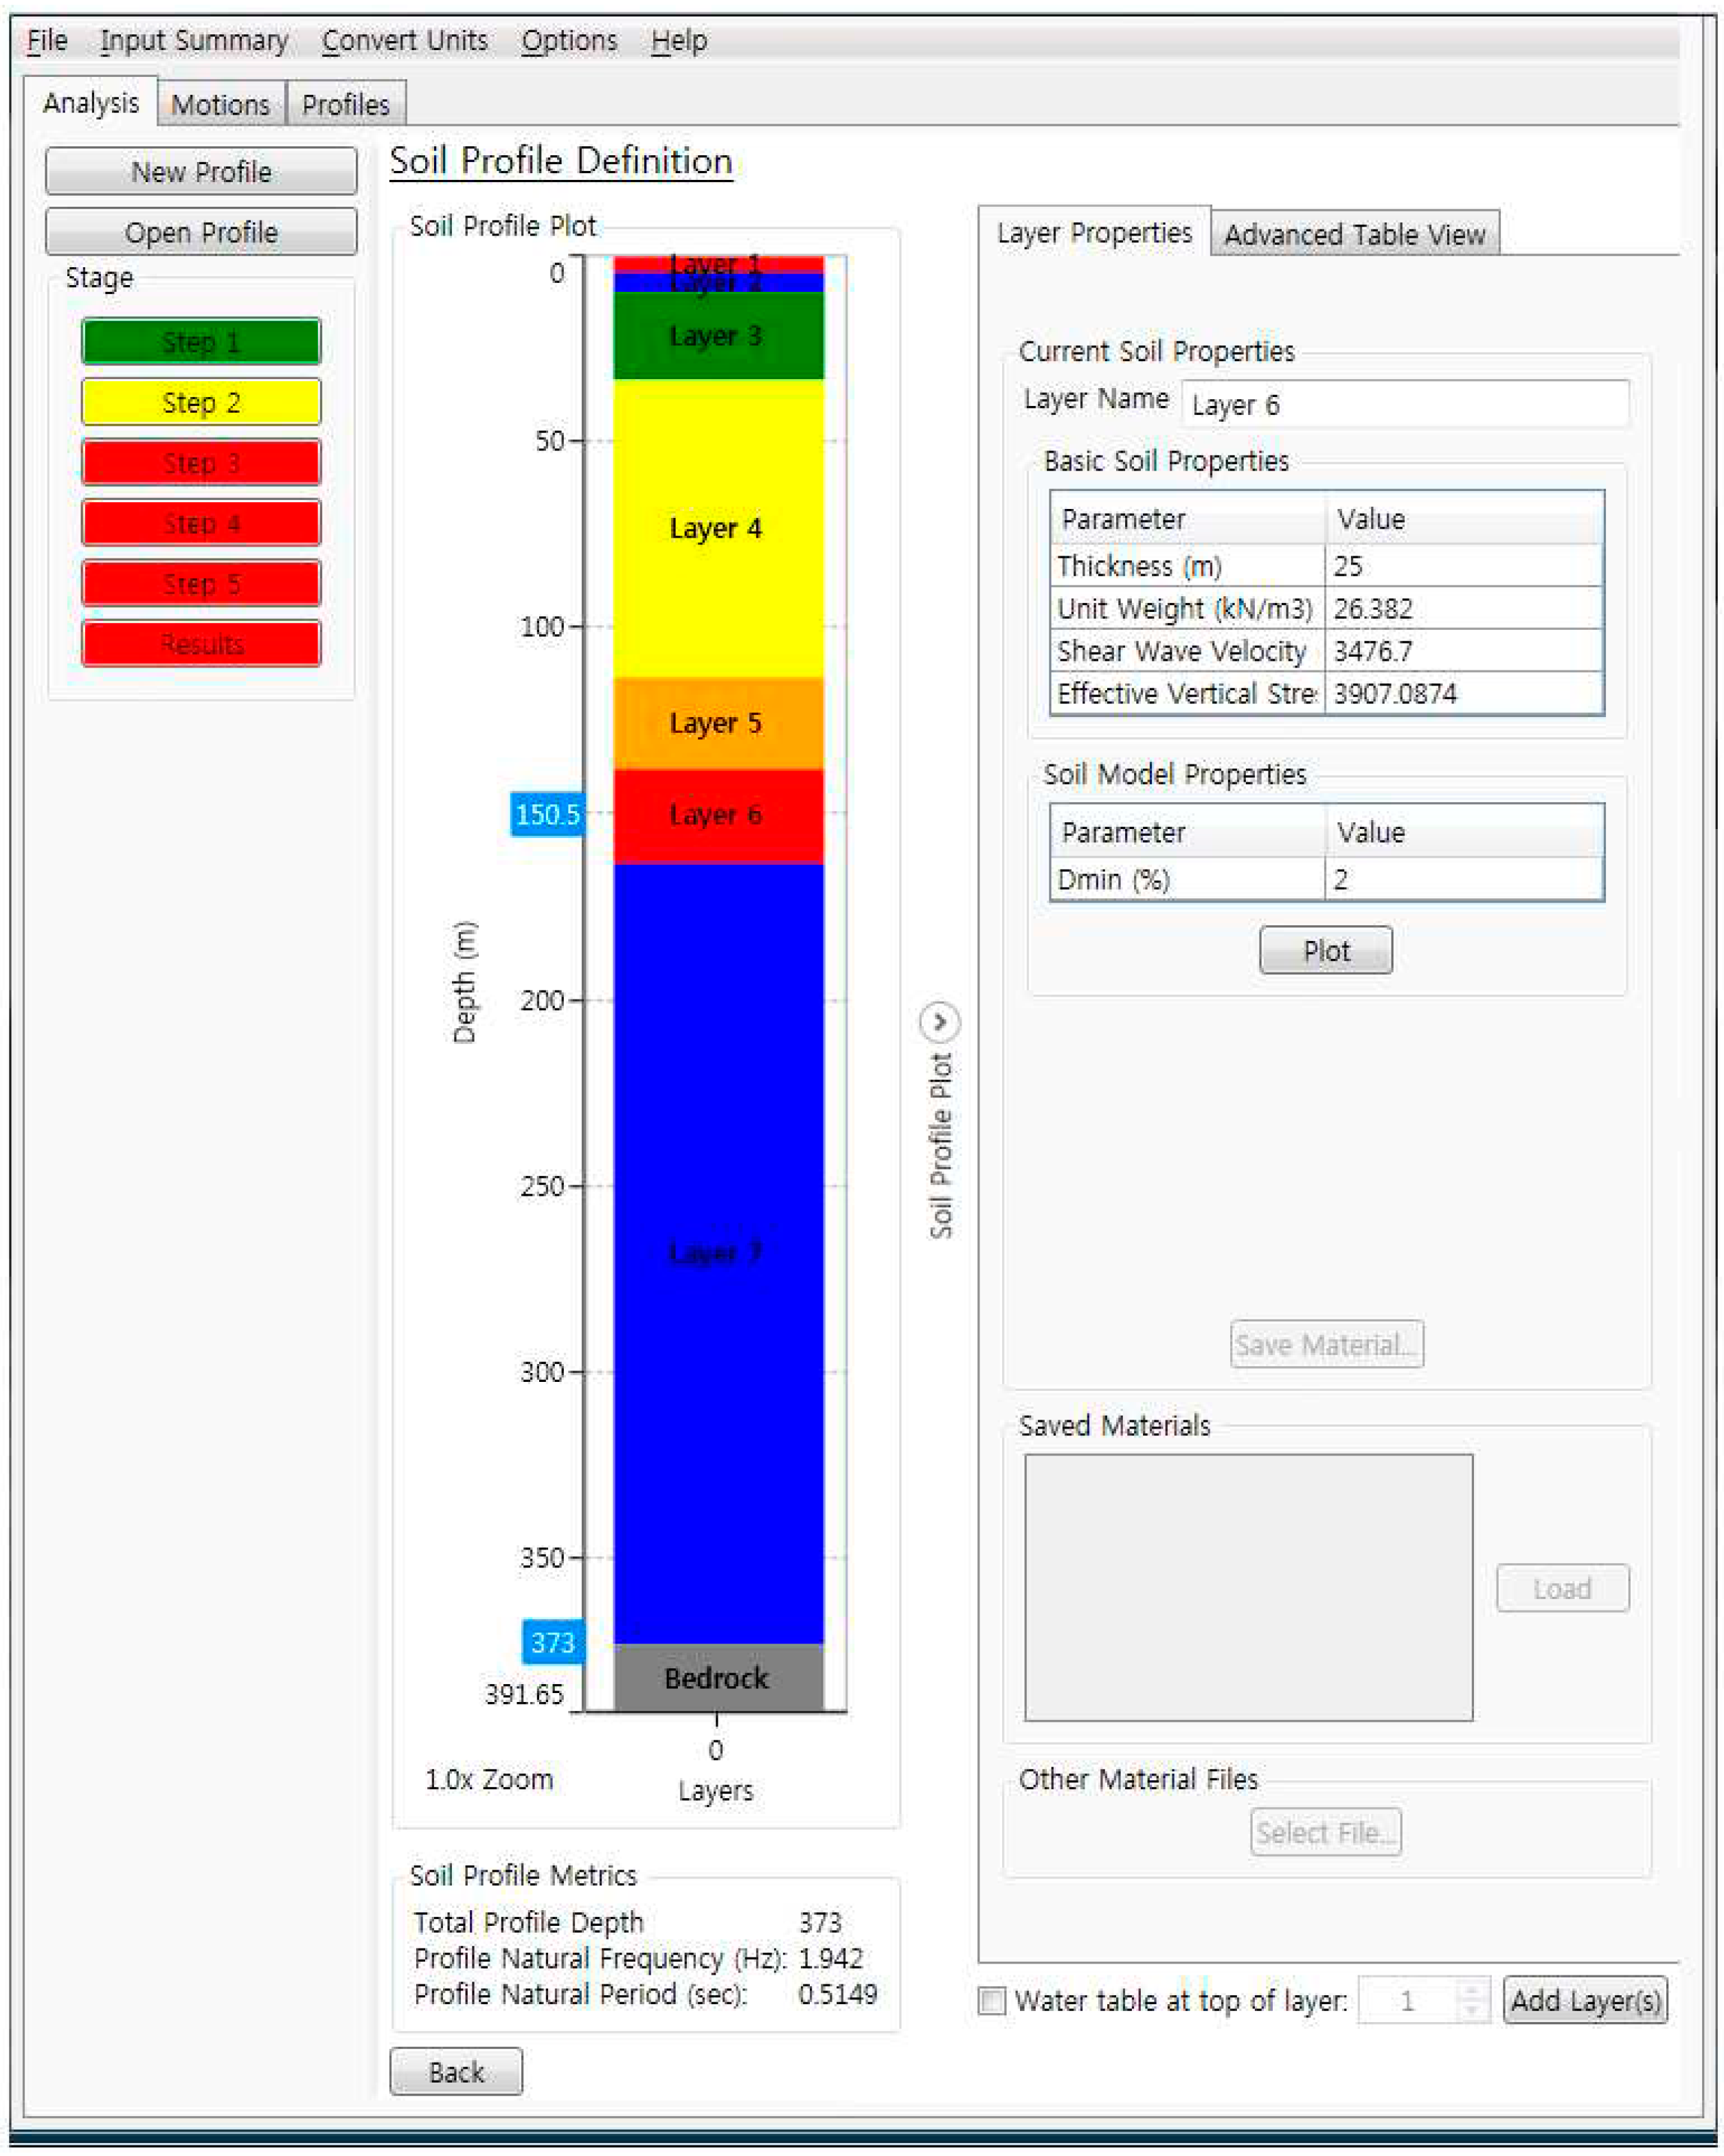


| Ground Layer | Unit weight (kN/m3) |
Shear wave velocity (m/sec) |
Damping ratio (%) |
|---|---|---|---|
| Soil Layer | 18.63 | 495 | 5 |
| Weathered Rock | 20.59 | 792 | 5 |
| Medium Rock | 26.38 | 1500 | 3 |
| Hard Rock | 26.38 | 3477 | 2 |
| Elastic Half Space | 26.38 | 3607 | 1 |
Disclaimer/Publisher’s Note: The statements, opinions and data contained in all publications are solely those of the individual author(s) and contributor(s) and not of MDPI and/or the editor(s). MDPI and/or the editor(s) disclaim responsibility for any injury to people or property resulting from any ideas, methods, instructions or products referred to in the content. |
© 2024 by the authors. Licensee MDPI, Basel, Switzerland. This article is an open access article distributed under the terms and conditions of the Creative Commons Attribution (CC BY) license (http://creativecommons.org/licenses/by/4.0/).


