1. Introduction
Water is the principal factor limiting vegetation growth in semi-arid climates, and consequently, drought constitutes the most severe environmental stress for plants in these ecosystems [
1]. Understanding how species are adapted to water availability is decisive for forest ecosystem management [
2], especially in areas with limited water resources, as Mediterranean semi-arid climates, where low soil-water content during the dry periods are the main limitations to plant growth [
3].
Among the adaptations to survive under water deficit conditions, the control of transpiration is the best-known physiological plant response [
4]. Transpiration is the process through which water moves from the soil, passes through the plant, and is released into the atmosphere as water vapor from leaves [
5,
6]. The two main physiological effects of transpiration are cooling and providing water to leaves for photosynthesis, i. e., vegetal growth [
7].
The response of plant transpiration to environmental conditions is extremely complex and dependent on multiple factors. For example, leaf temperature, photosynthetically active radiation (PAR), relative humidity, and air velocity affect water exchange from leaves, illustrating the intricate nature of this process [
8]. At stand level transpiration varies across species, meteorology, and soil conditions [
7,
9,
10,
11]. The link established between water availability and soil parameters has consequently made soil water status an important factor to study in transpiration dynamics, particularly in scenarios of soil drying [
12]. Furthermore, studies based on leaf parameters have often proven insufficient in explaining the transpiration responses in Mediterranean sites, which are characterized by strong seasonality [
3], particularly during the summer drought [
13], because variation in transpiration depends on seasonal soil water conditions [
10]. In arid environments, water use efficiency during the growing seasons is primarily controlled by transpiration [
14].
Seasonal rainfall limits physiological processes, playing a pivotal role in augmenting soil water content and increasing transpiration [
9,
15]. Clear evidence now suggests a metabolically mediated response (“hydroactive feedback”) between stomatal responses and soil drought, possibly involving abscisic acid production in leaves [
12]. This implies that in arid environments, small rainfall pulses (0-5 mm) would lead to increased plant transpiration [
15]. Given all this evidence, there has been an increase in studies focusing on the relationship between soil water content and transpiration recently [
2,
9,
14].
However, the effect of soil moisture conditions on plant transpiration in the Mediterranean basin has often been neglected, and relatively little information is available from typical Mediterranean species on this issue. This is exemplified by
Stipa tenacissima L. (“esparto”; Poaceae), a perennial tussock grass widely distributed in semi-arid ecosystems of the southwestern Mediterranean Basin [
16]. Esparto grass is a robust, large herbaceous species, with a wide tussock ranging from 45 to 210 cm [
17]. The leaves of esparto grass are thin, ribbon-like, smooth, and shining [
18], forming a specialized leaf tissue that facilitates leaf rolling. This structure plays a crucial role in controlling water balance of leaves under drought conditions [
19].
Another noteworthy characteristic of this bush is the presence of senescent leaves, which also contributes to its survival and the completion of the plant life cycle under drought stress [
20]. The tussock exhibits different age-classes of leaves, including green, senescent, and dead leaves [
17]. Ramírez et al. [
21] demonstrated the necessity of consider leaf senescence to study transpiration in
S. tenacissima. The importance of foliar self-shading as a structural photoprotective mechanism in this species has also been observed [
22,
23], and Ramírez et al. [
23] noted diverse physiological responses to water conditions in S.
tenacissima individuals based on bush size.
S. tenacissima frequently coexists with
Pinus halepensis (
P. halepensis) in semi-arid areas of southeast Spain, where the pine has been the most widely used tree in reforestations [
16]. In these Mediterranean forests,
S. tenacissima is the dominant species present in the herbaceous layer of
P. halepensis stands. These mixed formations reflect important plant-environment interactions that permit the evaluation of the adaptabilities of Stipa to environmental change [
24].
While
S. tenacissima demonstrates various plant-level strategies to adapt to severe drought [
22,
25], a relevant aspect for investigating this species is its susceptibility to climate change. The Mediterranean region, identified as a hotspot vulnerable to increased droughts [
3], is expected to face adverse effects on the survival and growth of esparto bushes under the predicted scenarios [
26]. Consequently, the ability of esparto to reverse leaf senescence may be compromised [
23]. In this line Krichen et al. [
27] observed a negative impact on the plant's total biomass and leaves as rainfall became scarcer. Smaller esparto bushes could be particularly sensitive to drought, potentially reducing the genetic diversity of the species [
23]. Pugnaire et al. [
28] and Ramírez et al. [
21] observed that
S. tenacissima halts leaf extension following a decrease in water content. Ghiloufi et al. [
29] identified a negative relationship between aridity and the cover of vegetation dominated by esparto. These findings suggest that an increase in drought could contribute to the loss of esparto cover in the Mediterranean basin.
The arrangement of bushes species into “patchy vegetation” in semi-arid regions, characteristic of steppes dominated by esparto grass, represents an additional adaptation for optimizing soil water in response to drought [
1,
17,
30]. However, in forest ecosystems dominated by pine trees with an understory of bushes species, such as esparto grass, the adaptation of plants to environmental conditions is also influenced by intrinsic factors in the forest structure, such as density, competition, maturity, and size [
31]
. As a result, transpiration in these mixed pine-bush forests depends not only on environmental conditions but also on canopy density and structural features
[10].
In this scenario, both facilitation and competition between esparto grass and
P. halepensis influence plant physiological responses [
16]. Competence becomes a crucial factor, influencing water availability, size, growth, and foliage exposure to incident radiation [
10]. Species coexisting in semi-arid environments rely on water utilization strategies for survival [
32]. The competition for resources within different strata of a semi-arid ecosystem affects grass transpiration, involving water absorption by the tree stratum and indirectly impacting the bush through reduced irradiance caused by shadows cast by trees [
16,
28]. The study of ecophysiological variables at the stand level also requires consideration of plant structure, as plant water exchange varies with plant size, leaf surface area, amount of senescent leaves, and distance from competitors [
33,
34].
Therefore, in planning our experimental layout and considering the importance of soil water availability in physiological processes such as transpiration rate, we hypothesized that interspecific pine competition for water resources (characterized by soil humidity) can affect water fluxes in esparto grass. We can also predict that the type of leaf (green, senescent) and maturity of esparto grass could influence the responses in transpiration rate. The high seasonality inherent in the Mediterranean climate compels us to test these hypotheses throughout the four seasons of the year.
As consequence, the aims of this study were twofold: (1) to investigate the seasonal variation of transpiration rates in S. tenacissima in relation to leaf type (green or senescent), stand inter-specific competence (open sites, without P. halepensis competition, and closed sites with pine competence), and the maturity of esparto bushes (young, mature); and (2) to determine the effects of soil water content on the daily transpiration of S. tenacissima, along with the interactions occurring with leaf type, site or competence, and the maturity of bushes throughout the four growing seasons under a Mediterranean semi-arid climate. The findings from our study have the potential to provide accurate predictions regarding the responses of S. tenacissima to shifts in climate or competition conditions.
3. Materials and Methods
3.1. Study Area
The study was conducted in pine forests dominated by
P. halepensis as the tree species in the canopy or overstory, with
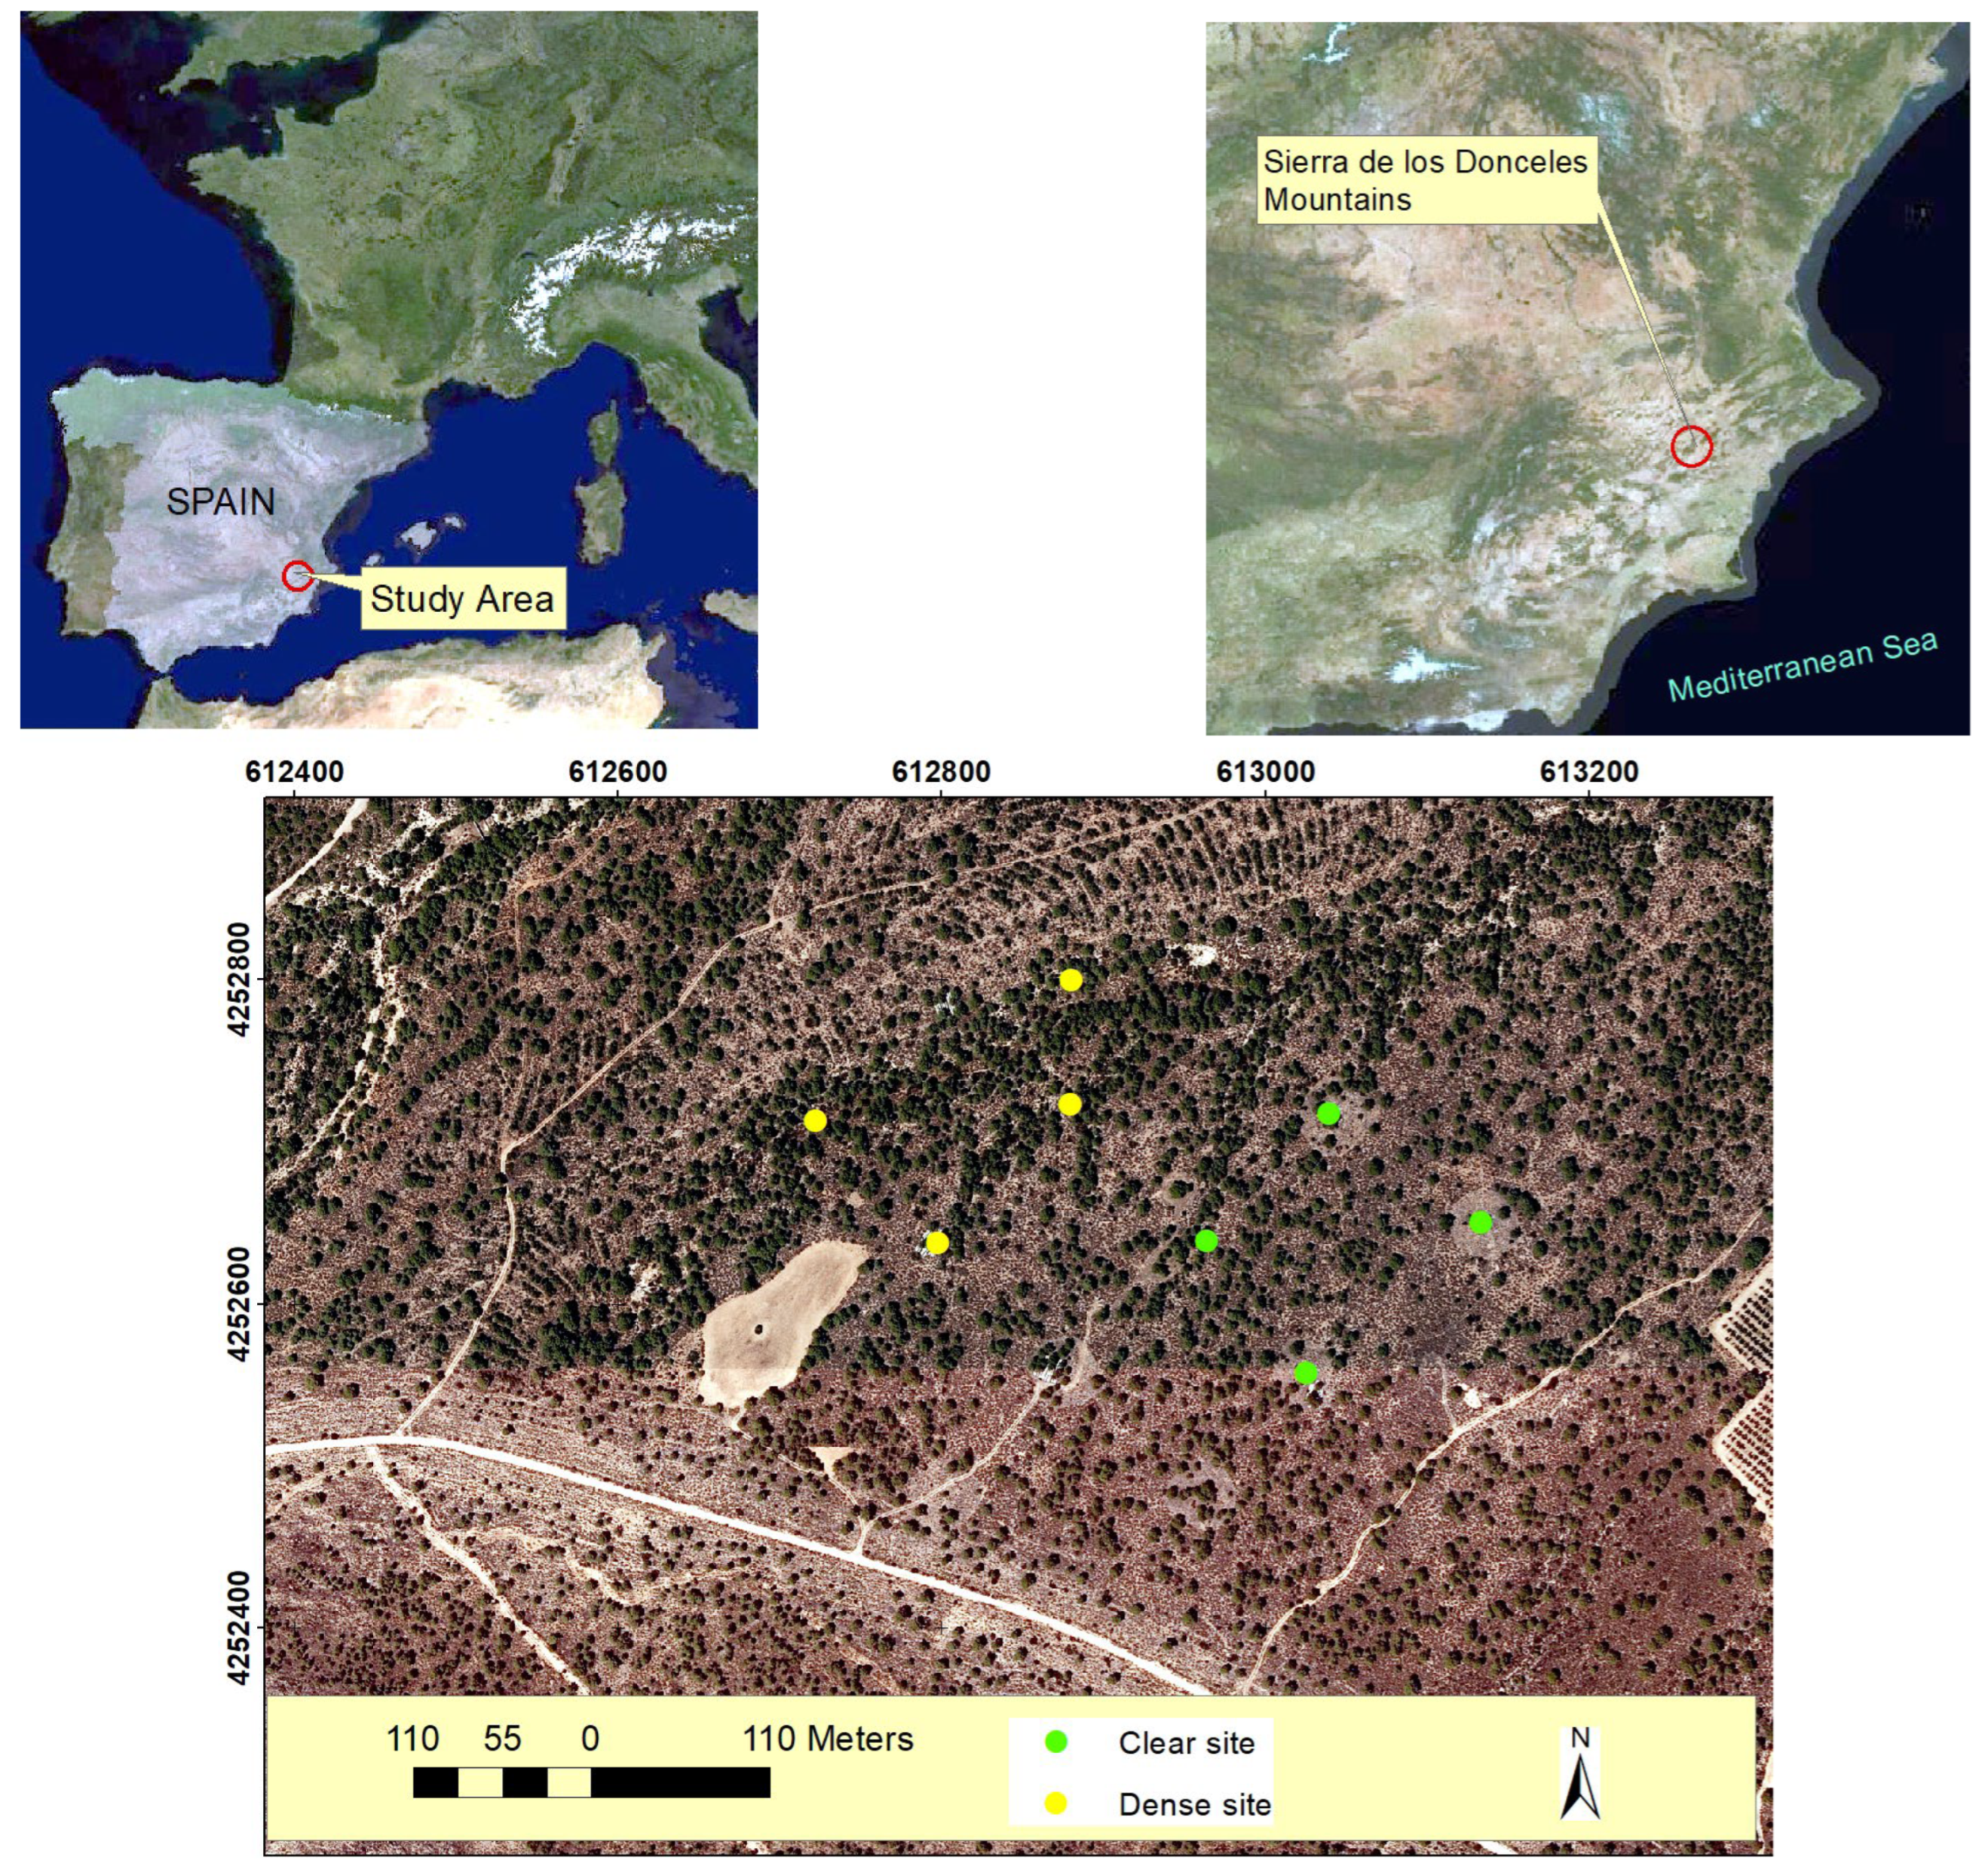
S. tenacissima L. as the main species in the herbaceous layer. These vegetal formations are situated in the Sierra de los Donceles Mountain (Southeast of the Iberian Peninsula, Spain;
Figure 8). The climate is classified as Mediterranean semiarid, type BSk according to the Köppen-Geiger climate classification system. The area falls within the meso-mediterranean bioclimatic type, with an average annual temperature and precipitation of 15.8 °C and 327.6 mm, respectively (1990–2022 period; meteorological data provided by the Spanish Meteorological Agency, AEMET, Madrid). The region experiences a large thermal amplitude, resulting in an average annual temperature ranging from 42.6 °C in August to −1.2 °C in January. Precipitation occurs erratically throughout the year, primarily in short periods marked by intense storm events.
The Donceles Mountain Range is characterized by dolomitic limestone formations dating back to the Jurassic period, with altitudes ranging from 504 to 808 m.a.s.l. The pine forest in the study area is positioned on a mid-slope area, facing north. According to the USDA Soil Taxonomy System, soils in the research area are classified as Aridisol, suborder Calcid, owing to limited soil moisture available for plant growth and the accumulation of carbonates. The soils are alkaline-clayey (pH: 8-8.5 and clay content > 30%), with the profile extending from a depth of 10 to 30 centimeters [
45].
Aleppo pine dominates the upper canopy layer, while the forest understory mainly consists of shrublands of
S. tenacissima L. Other species present in the area form an evergreen sclerophyllous forest, including
Rhamnus lycioides L.,
Rosmarinus officinalis L.,
Pistacia lentiscus L., and
Quercus coccifera L. [
45]. The density of Aleppo pine stands in this forest is highly heterogeneous, ranging from 88 trees per hectare in open sites to 345 trees per hectare in dense, closed stands [
46].
3.2. Experimental Layout and Sampling of Bushes
Diurnal patterns of water exchange in green and senesced leaves were monitored from August 2020 to March 2021 on 14 sampling days, spanning the four seasons, thus reflecting the period of water stress (summer), period of growth and return to dormancy (autumn), dormancy (winter), and season of activate grown (spring) [
35].
To do this, eight esparto bushes were chosen as samples for leaf-level transpiration measurements. The bushes were growing under two levels of pine-esparto competition, encompassing both clear and dense stands, and thereby experiencing different water absorption effects from nearby pines. Clear stands have a low density of trees, ranging from 50 to 80 trees per hectare, with the herbaceous vegetation of esparto grass dominating the understory. In contrast, the dense site is a closed pine forest with a high density of Aleppo pine trees, ranging from 250 to 350 per hectare [
46]. Half of the measured esparto grass samples were selected from the clear site, while the remaining half were chosen from the dense site.
The esparto grasses in the dense site were located within a circular area 5 m radius from pine competitor. In the open site, the sampled esparto bushes were isolated from pine competitors (>10 m). The tussocks were selected while maintaining a distance greater than 2 meters from the surrounding esparto grass to prevent intraspecific alterations in their water balance.
We additionally assessed transpiration in two bush maturity groups based on their mean cover diameter [
21]: young (<70 cm perimeter of the base) and mature (>130 cm perimeter) esparto grass. To achieve this, half of the sampled bushes were chosen as young, with the remaining half classified as mature.
Within each selected tussock, tillers were randomly chosen on each sampling day and categorized as either green leaves (in their first or second growing season) or senescent leaves (displaying orange to yellow colors). The aim was to measure transpiration based on the type of leaf. No differences exist between the soils or slopes of the two studied sites.
3.3. Measurements of Transpiration at Leaf Level
Transpiration at the leaf level was quantified using LI-6400 XT equipment, which incorporates a camera for the measurement of water fluxes in needles (6400 07 Needle Chamber; LI-COR Inc., Lincoln, NE, USA). Measurements were conducted three times a day (approximately at 8:00, 12:00, and 16:00 UTC) to mitigate the influence of temperature fluctuations during daylight hours on transpiration. This approach also was chosen because transpiration in esparto grass is maximized around midday [
21,
46] a pattern characteristic of plants with C3 metabolism [
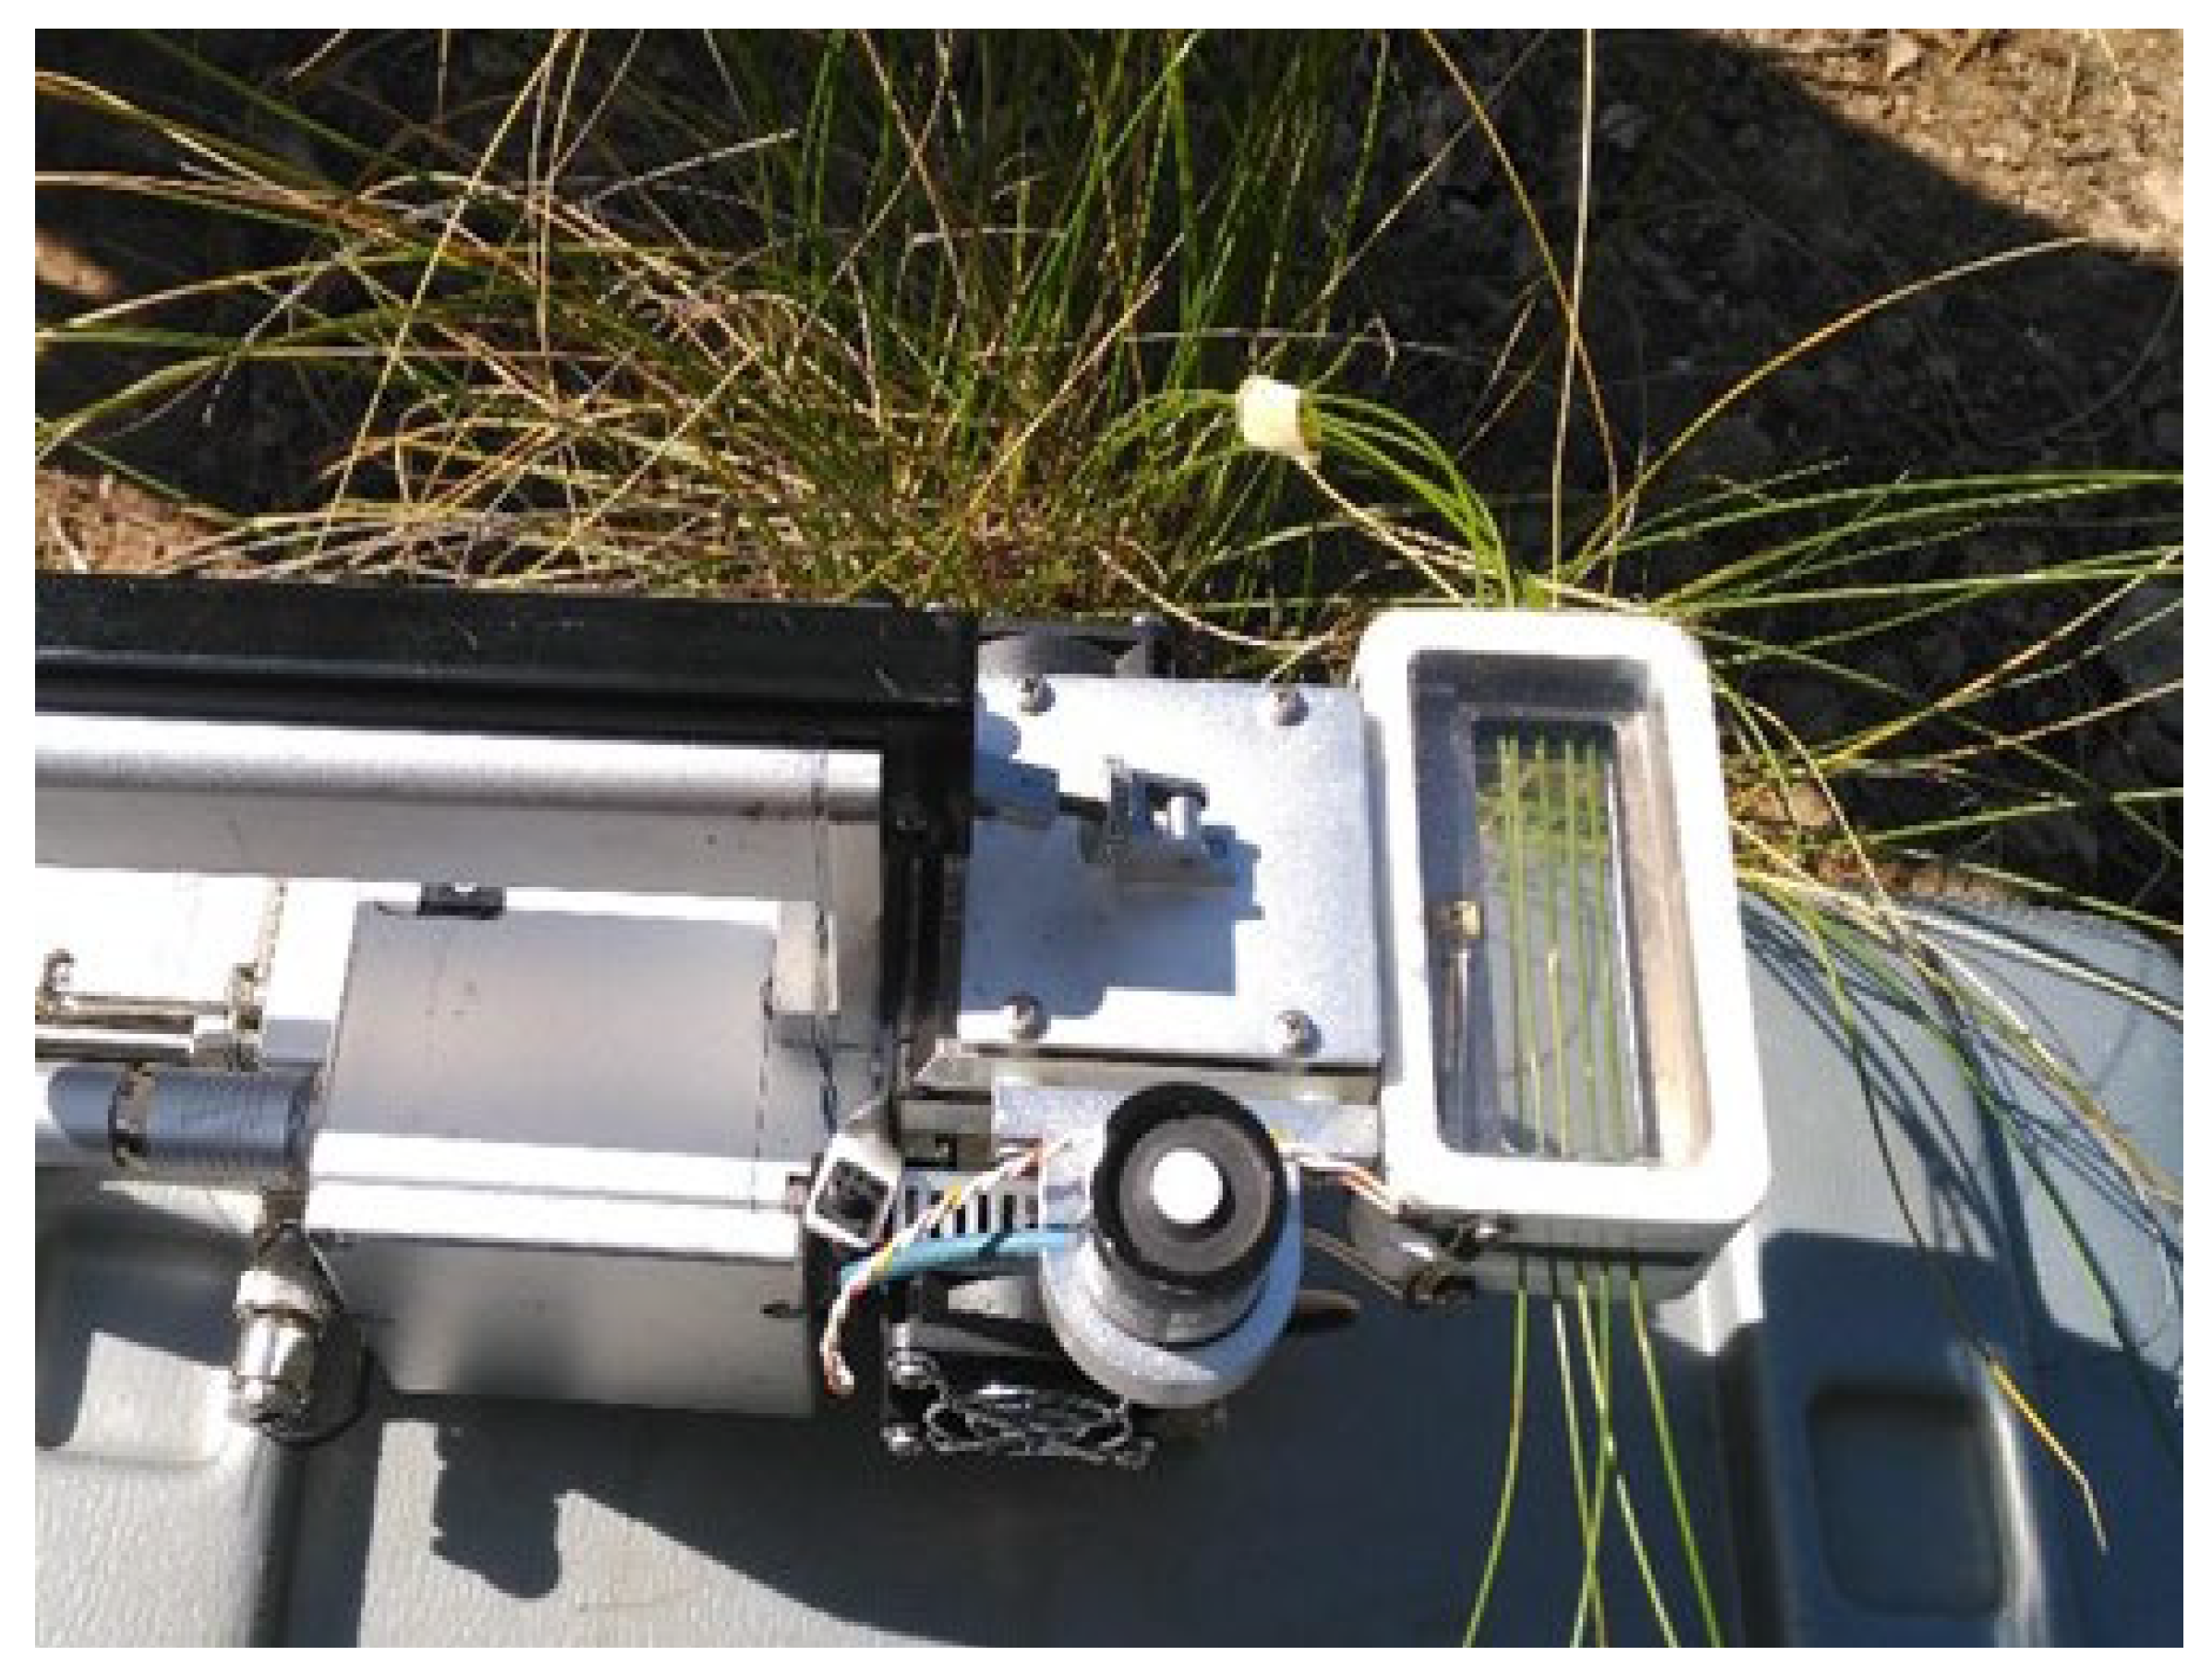
47]. Each replica consisted of five leaves taped together, that were placed in the IRGA’s chamber (
Figure 9). Three repeated measures were taken for each hour, and the mean was used for subsequent statistical analysis. Thus, the total dataset included: 3 times day
−1 x 2 types of leaf x 8 bushes x 14 sampling days. Transpiration was registered in leaves at full sunlight to avoid photo-inhibition effects. Water exchange was calculated based on the projected leaf area, employing the formula integrated into the LI-COR operating software:
Where T represents transpiration (mol H
2O m
−2 s
−1), F is the air flow entering the chamber (μmol air s
−1), Ws and Wr are the mole fractions of water in the sample and the reference flows, respectively (mmol H
2O (mol air)
−1), and S denotes the measured leaf area (cm
2). Afterward, water exchange was expressed as the transpiration rate in mm h⁻¹, considering the weight of 1 mmol of H₂O (0.018016 g) and 1 liter of water = 1 mm m⁻². Thus, transpiration represents the rate of water exchange per unit of foliar area (m⁻²). The leaf segments used in the measurements were harvested and their projected area was determined with a leaf area measurement equipment (WD-E3; Delta-T Devices, Cambridge, UK). Considering that esparto grass folds its leaves into a cylinder, the only viable approach was to assess the projected leaf area in the closed position [
26].
Figure 2.
Measurement of transpiration in Stipa tenacissima L. leaves using the LI-6400XT portable equipment. The setup involved the use of the 6400-07 Needle Chamber, specifically designed for needle-like leaves. The sample consisted of 5 segments of leaves.
Figure 2.
Measurement of transpiration in Stipa tenacissima L. leaves using the LI-6400XT portable equipment. The setup involved the use of the 6400-07 Needle Chamber, specifically designed for needle-like leaves. The sample consisted of 5 segments of leaves.
3.4. Biometric Characterization of Sampled Bushes: Plant Structure
To determine the biometry of each sampled esparto grass plant, at the conclusion of the experimental campaign, the bushes used for sampling were extracted from the soil. Subsequently, in the laboratory, the esparto components—green leaves, senescent leaves, dead leaves, and roots—were separated. The dry biomass of each foliar component (green, senescent leaves) was obtained by drying samples in an oven (65 ºC for 48 h). The samples were weighed using a precision balance (sensitivity ± 0.01 g; Kern EW, Kern & Sohn GmbH, Balingen, Germany). Also, the dimensions of the root (root depth, and root length) were determined by using a scaler ruler (± cm). To determine the total projected leaf area of each bush, a subsample of each leaf type was selected to calculate the specific leaf area (SLA), resulting in an SLA of 10.8 ± 0.9 cm² g⁻¹ for the study area. Following this, the total dry weight of each leaf type was multiplied by the SLA to obtain the total leaf area per leaf type for the bush [
46].
3.5. Microclimatic Soil Measurements and Environmental Conditions
Soil moisture content (Sw; %) and soil temperature (Ts; º C) were measured at a depth of 5 cm with a moisture probe (Theta Probe ML2x, Delta-T Devices, Cambridge, UK), and a temperature probe (TMC20-HD, Onset Computers, Bourne, Massachusetts, USA), respectively. Data collection was conducted beneath each sampled esparto grass during the transpiration measurement period. Data were recorded in dataloggers (CR1000, Campbell Scientific, Logan, Utah, USA). Additionally, photosynthetically active radiation (PAR; µmol m−2 s−1) was recorded in situ with a levelable quantum sensor integrated into the LI6400 (LI-190, LI-COR Inc., Lincoln, NE, USA). The vapor pressure deficit (VPD; kPa) was calculated using parameters also measured inside the chamber connected to the LI6400 equipment as the difference between the vapor pressure at saturation of the plant and the vapor pressure of the air.
3.6. Statistical Analysis
The influence of considered factors on transpiration rate (T; mm h−1) was examined using nested linear mixed models (LMM). While the measurements were independent, with distinct leaves measured on each sampling day, it is necessary to consider repeated measurements on the same subject (bush) within a sample of leaves. The first model included as the fixed components leaf type (2 levels: green or senescent), site (2 levels: clear or dense), season (4 levels based on sampling time: winter, spring, summer, and autumn), and bush maturity (2 levels: young and mature esparto grass), along with their interactions. This model aims to detect differences between green and senescent leaves in relation to the main factors.
Afterwards, the model was readjusted by removing the type of leaf as a fixed effect, and then considering only transpiration of green leaves as the dependent variable (to isolate and highlight the effects of the main factors on leaves with higher physiological activity, i.e., the green leaves).
The two models incorporated as random effects the sampled bush (8 levels) nested within site, and heteroscedastic variance across the sampling dates. In the models, the sampling “bush” was nested within “site” since different shrubs were measured in each woodland, and “bush” was considered a random factor since the selected bushes were a random sample from the total esparto grass (randomized design, [
48]). Thus, this model represents a linear mixed-effects model with fixed and nested random effects. The effects of “between factors” on the response variable “within each season” was also analyzed, taking into account the seasonal data.
Random variance components were estimated using restricted maximum likelihood estimation (RMLE). Model selection was based on Bayesian Information Criterion (BIC) and Akaike Information Criterion (AIC). Mean values were compared using Fisher’s LSD post-hoc test (α = 0.05) if the factors were significant. Mixed models were fitted using the nlme package in R [
49].
In addition, we explored the relationships between the rate of water exchange (T; mm h
−1) and the soil water content (Sw; %). These models were conducted using the entire dataset for both types of leaves across all seasons, employing the following combined exponential-power model (Model 1):
This model, a generalization of the power function [
50], captures the relationship where transpiration increases based on soil humidity but follows a hump-shaped pattern skewed to the right. In Model 1, the influence of the competence (site) on transpiration was incorporated through the use of a dummy variable “S” (S = 0 for the clear site and S = 1 for the dense site). The models were estimated for both short-term (seasonal variations in transpiration) and long-term (annual data aggregated across all seasons). The selection of significant parameters in Model 1 involved logarithmic transformation (linearization) and stepwise regression, facilitating the comparison of two regression lines between the two sites across different seasons. Coefficients with a p-value < 0.05 were deemed significant. The regressions were evaluated based on the F ratio (p < 0.05) and the adjusted R
2 [
51]. Values with absolute DIFT > (2
) were considered influential points (p is the number of coefficients, and n is the number of data [
52] and were removed. Regressions were fitted using Statgraphics Centurion XVIII
® software (Statgraphics Technologies, Inc., Virginia, USA). We also conducted correlations between measured environmental variables and transpiration rates, considering soil water content, using this software.
Author Contributions
Conceptualization, I.P., F.L., E.R. and F.G.; methodology, F.L., D.G., E.R., W.C. and R.A.; software, F.G., I.P.; validation, E.R., M.A., M.P.; formal analysis, I.P., F.G., D.G., M.P., W.C., R.A.; resources, F.L., E.R. and M.A.; writing—original draft preparation, I.P., F.G.; writing—review and editing, I.P., F.G., F.L.; supervision, F.L., E.R.; funding acquisition, E.R., M.A. and F.L. All authors have read and agreed to the published version of the manuscript.
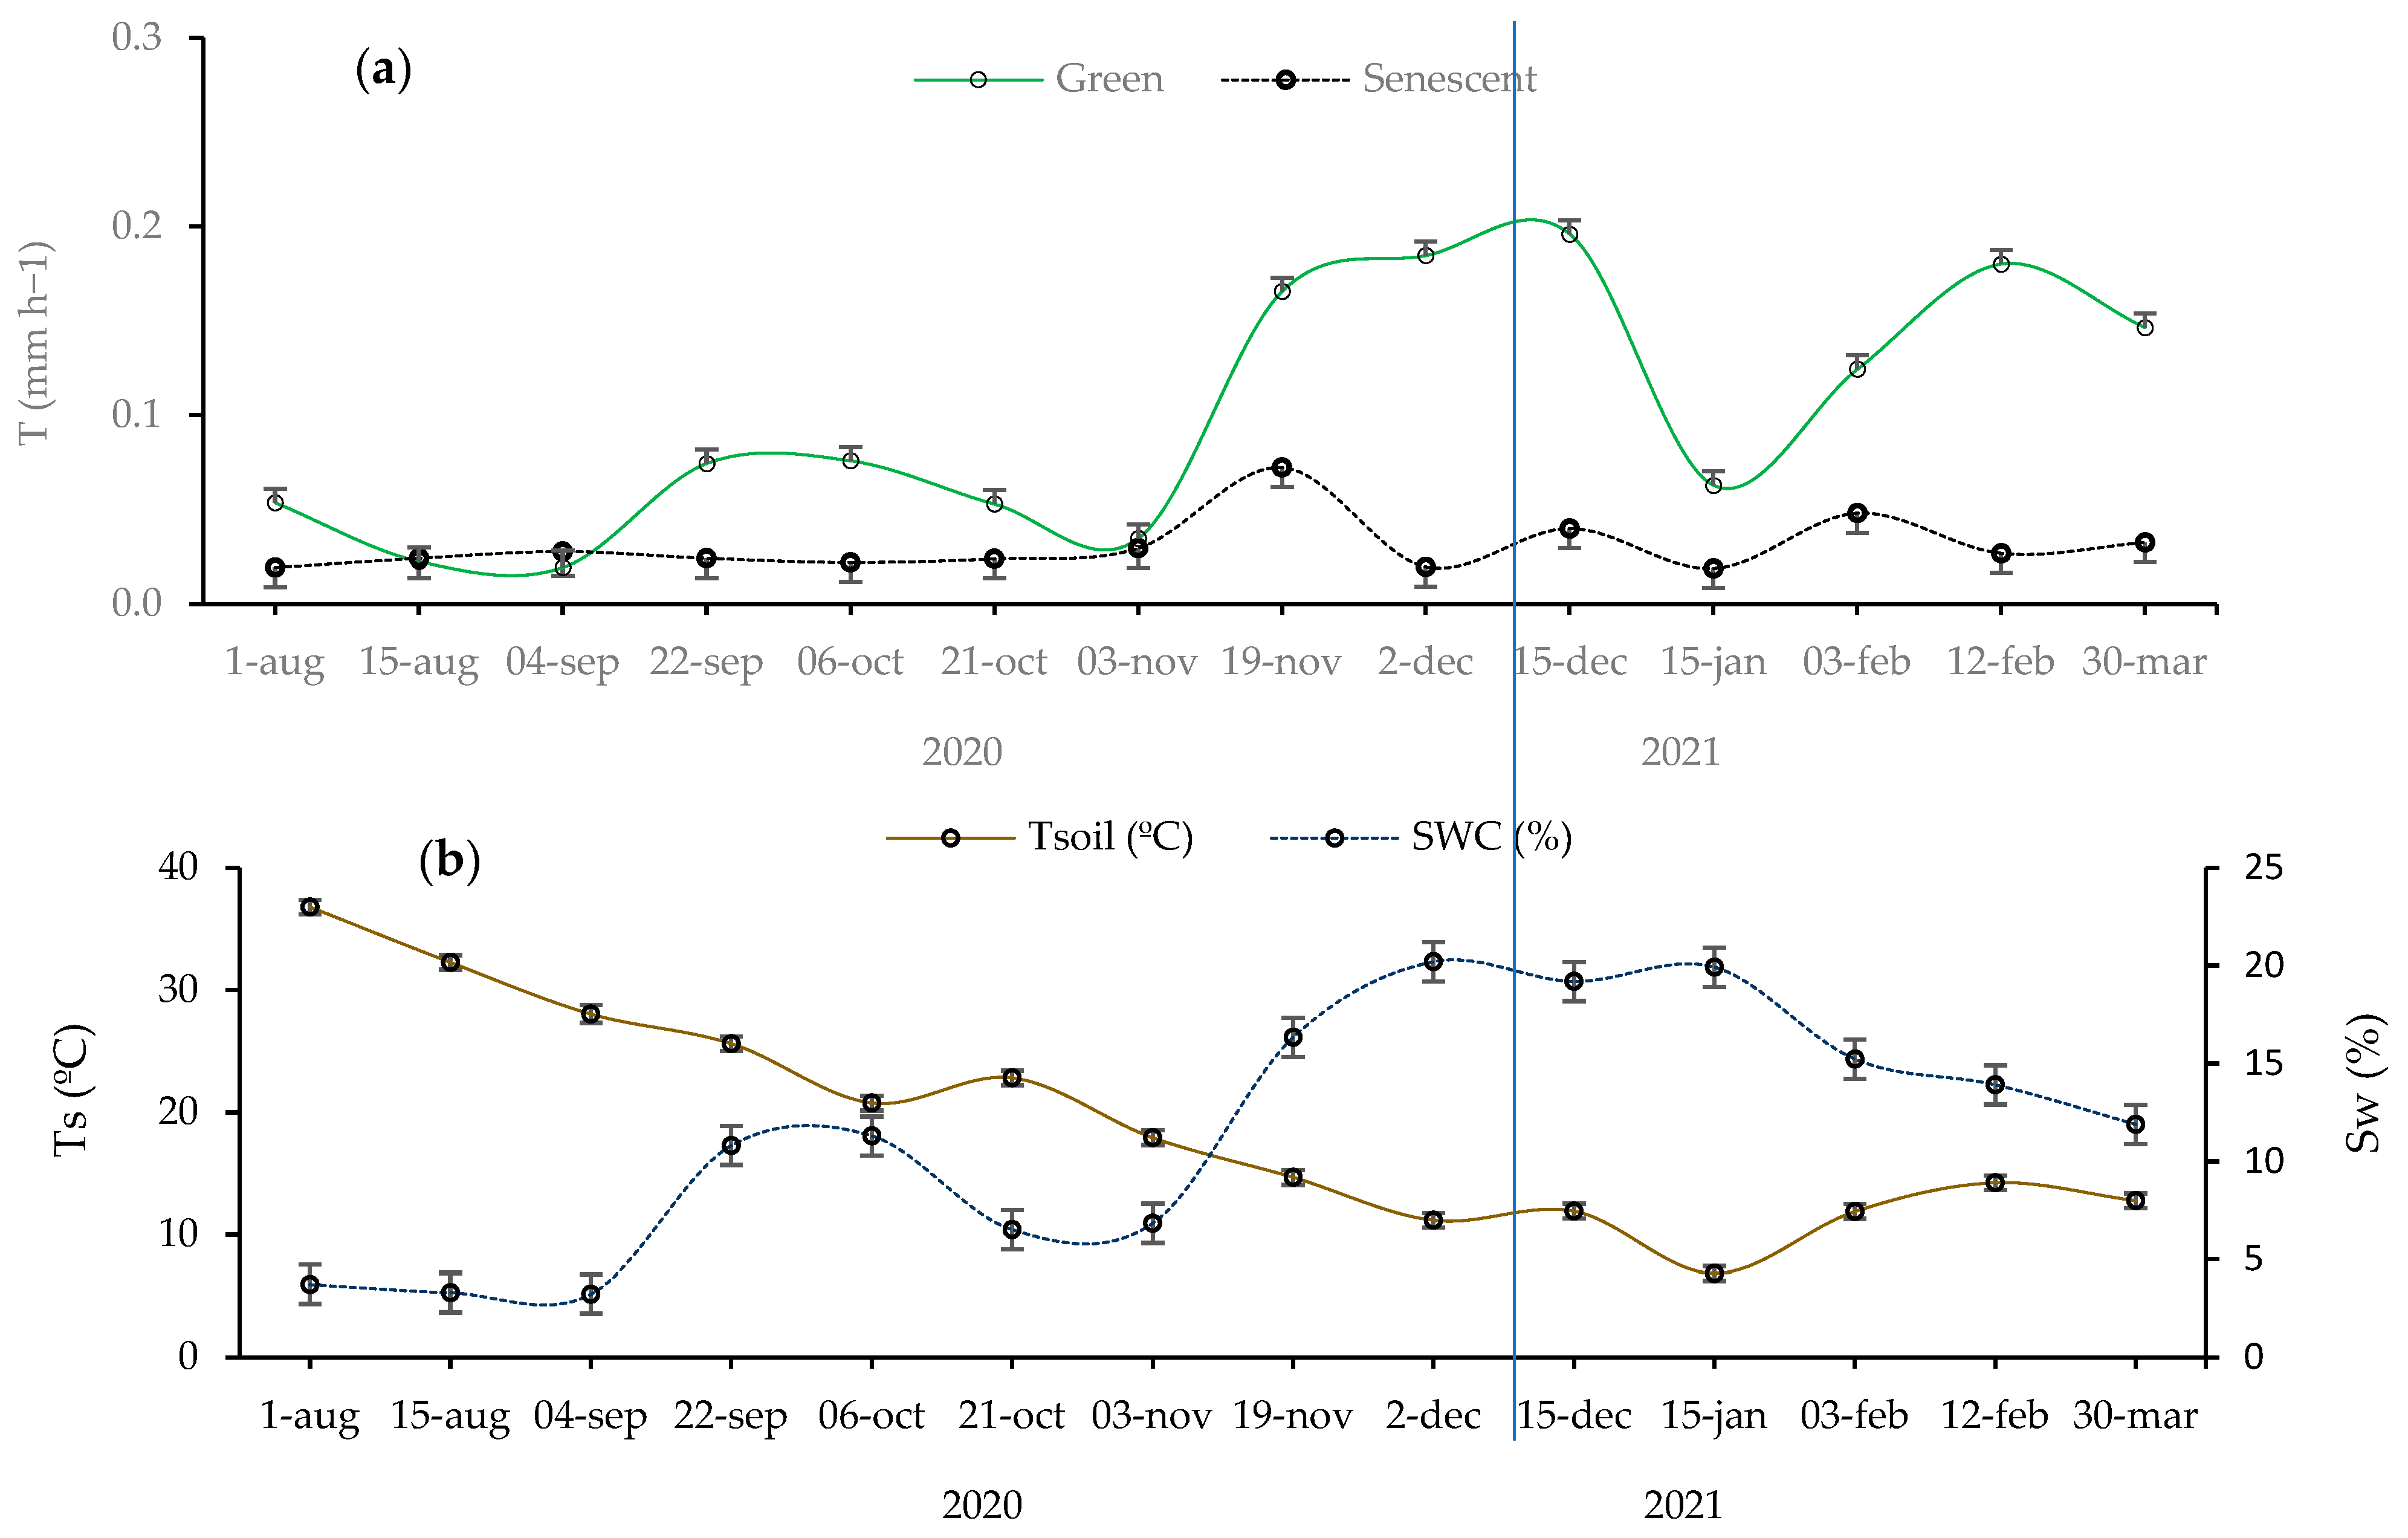
Figure 1.
(a) Variation in measured transpiration rate (T; mm h−1) in both green and senescent leaves throughout the study period's seasons; and (b) Variation of soil microclimatic conditions during the sampling period, including soil water content (Sw; %), and soil temperature (Ts; ºC). Error bars: standard error.
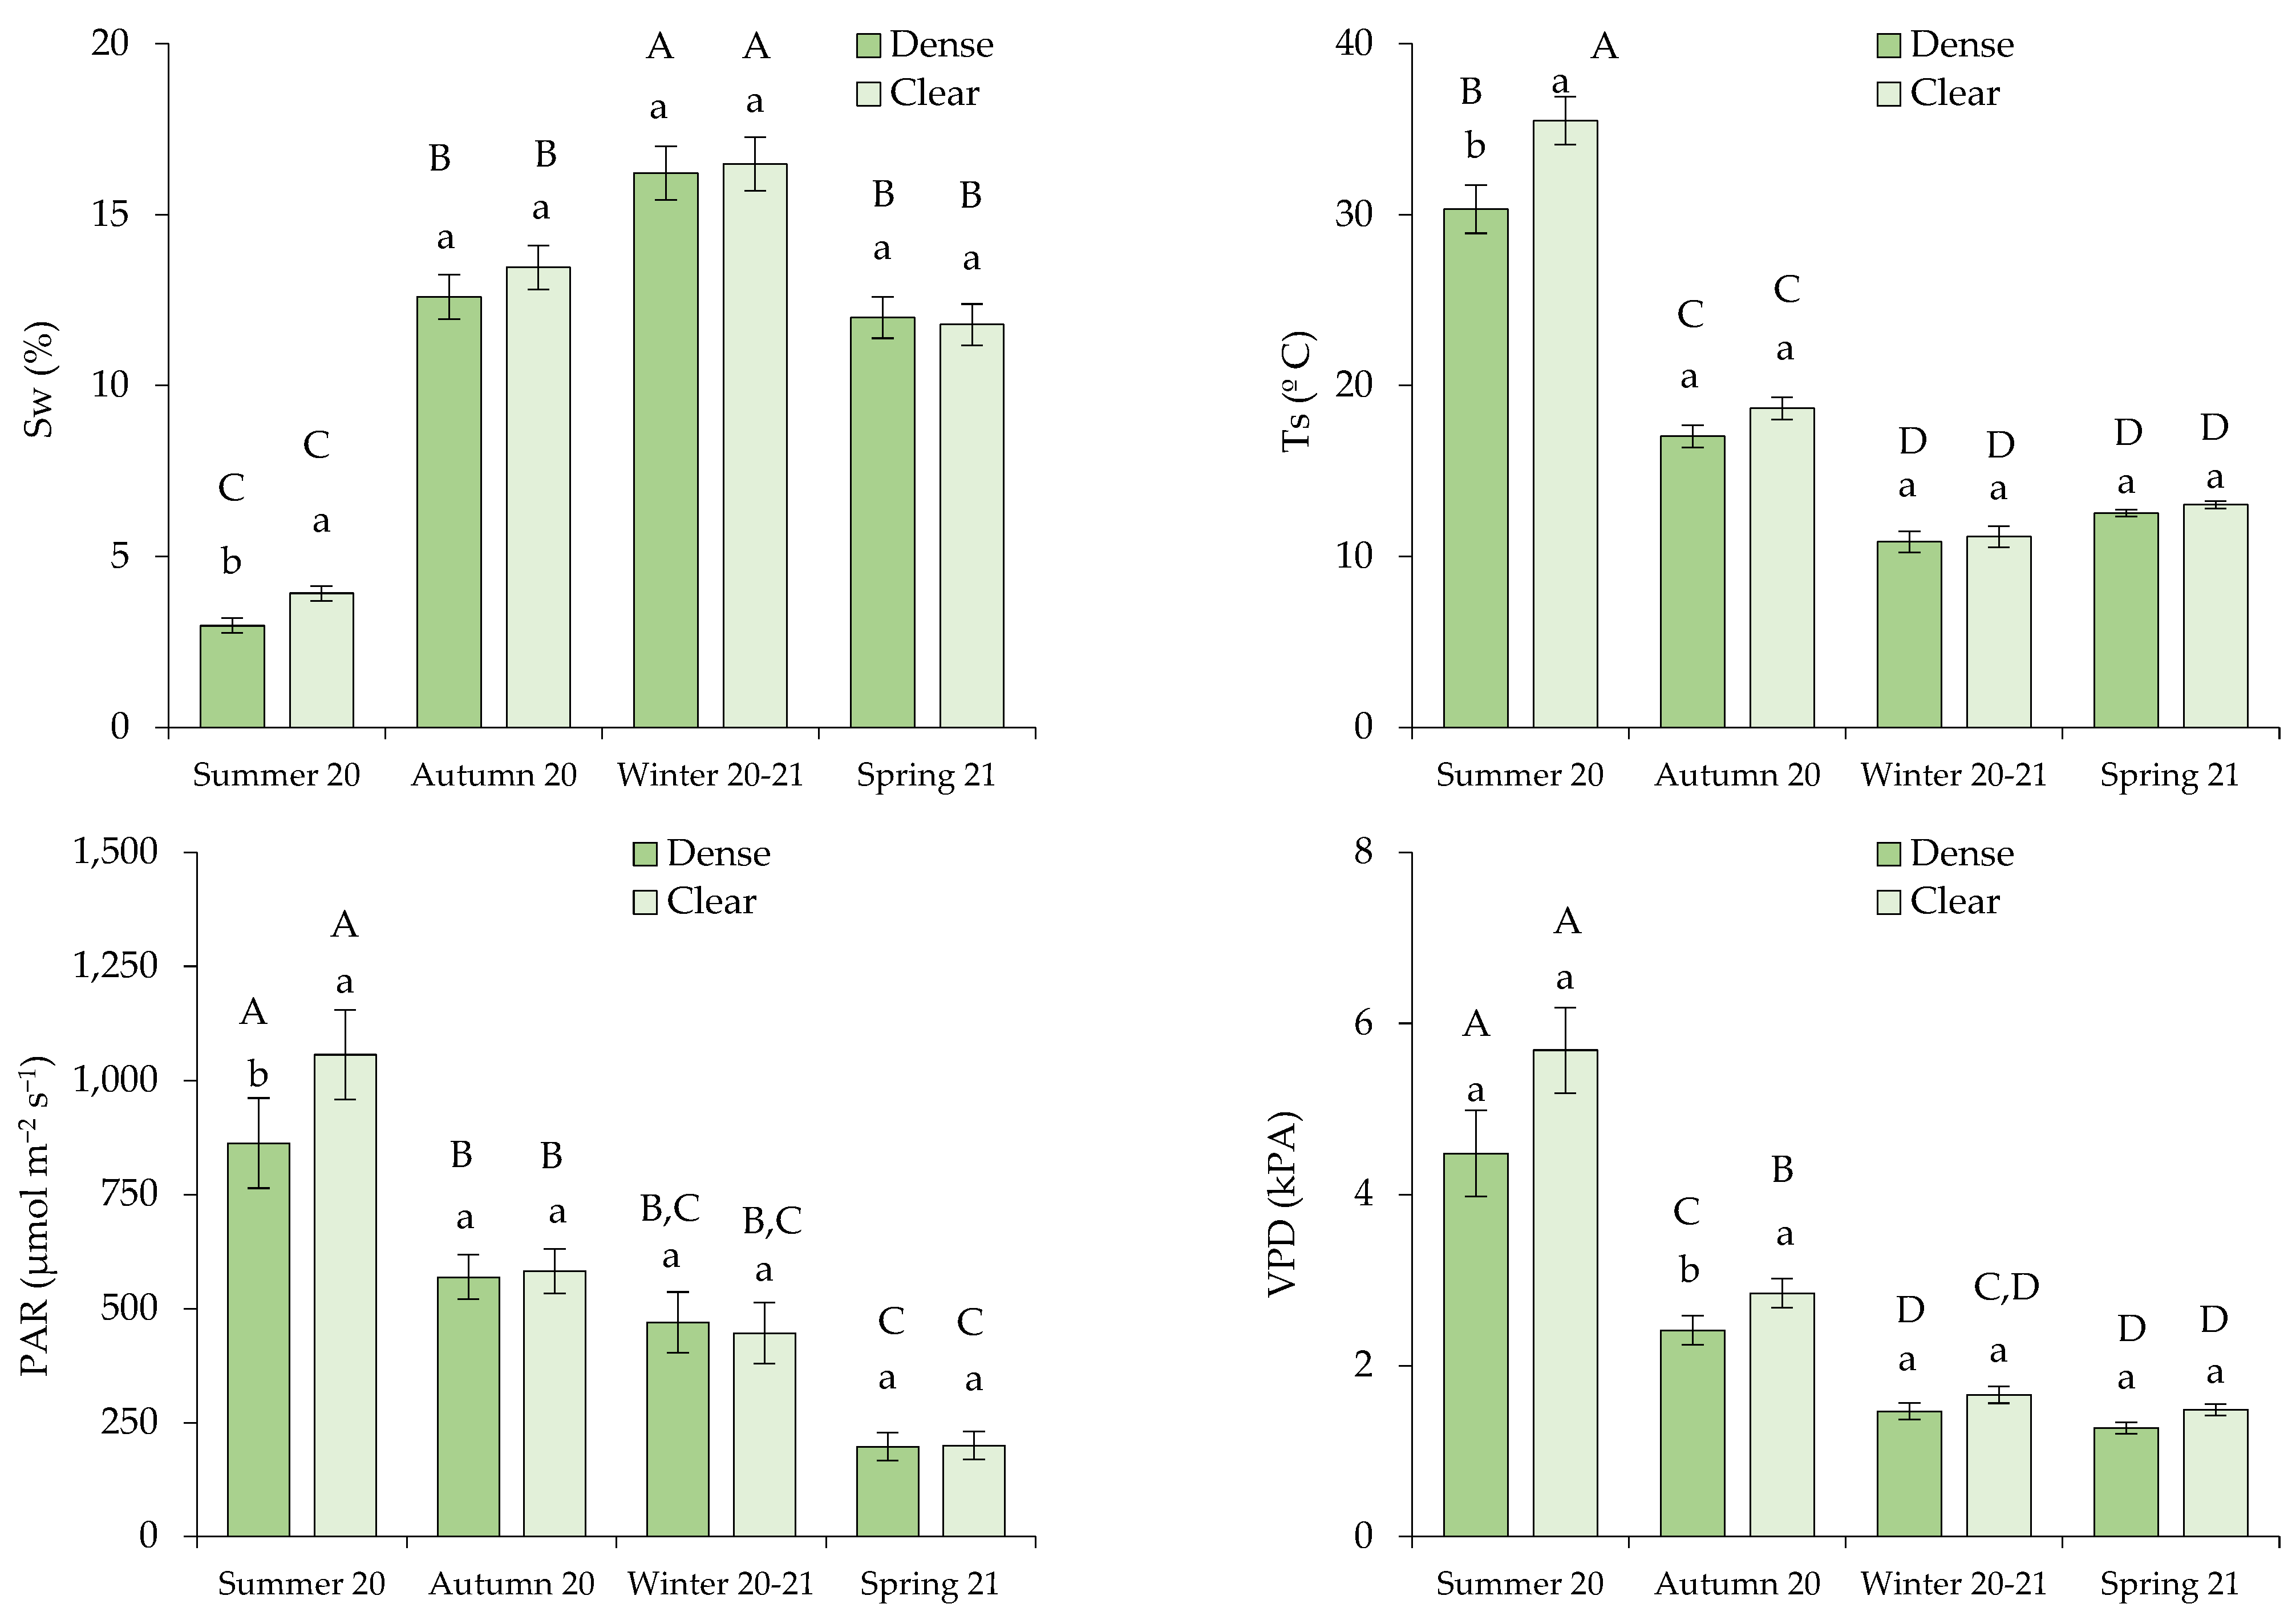
Figure 2.
Environmental conditions measured in the sampling bushes, defined by (a) soil water content (Sw; %), and (b) soil temperature (Ts; ºC), along with environmental parameters correlated with the transpiration rate, specifically (c) photosynthetic active radiation (PAR; µmol m−2 s−1) and (d) vapor pressure deficit (VPD; kPa). In each season, distinct lowercase letters indicate statistically significant differences, while different uppercase letters signify statistically significant differences (p ≤ 0.05; LSD test) between seasons. Error bars represent standard errors.
Figure 3.
Biometric characterization of the esparto grasses sampled in the study area based on leaf type, site, and maturity: (a) Bush dimensions: Pb (perimeter at the base in cm), h (height of the bush in cm); (b) Root dimensions (cm): depth and length; (c) Dw (foliar dry weight in g); (d) Af (foliar area in cm²). Distinct lowercase letters indicate statistically significant differences (p ≤ 0.05; LSD test) between bushes in terms of height (a), root depth (b), foliar biomass for green leaves (c), and foliar area for green leaves (d). Different uppercase letters signify statistically significant differences (p ≤ 0.05; LSD test) between perimeter at the base (a), root length (b), foliar biomass of senescent leaves (c), and foliar area for senescent leaves (d). Error bars represent standard errors.
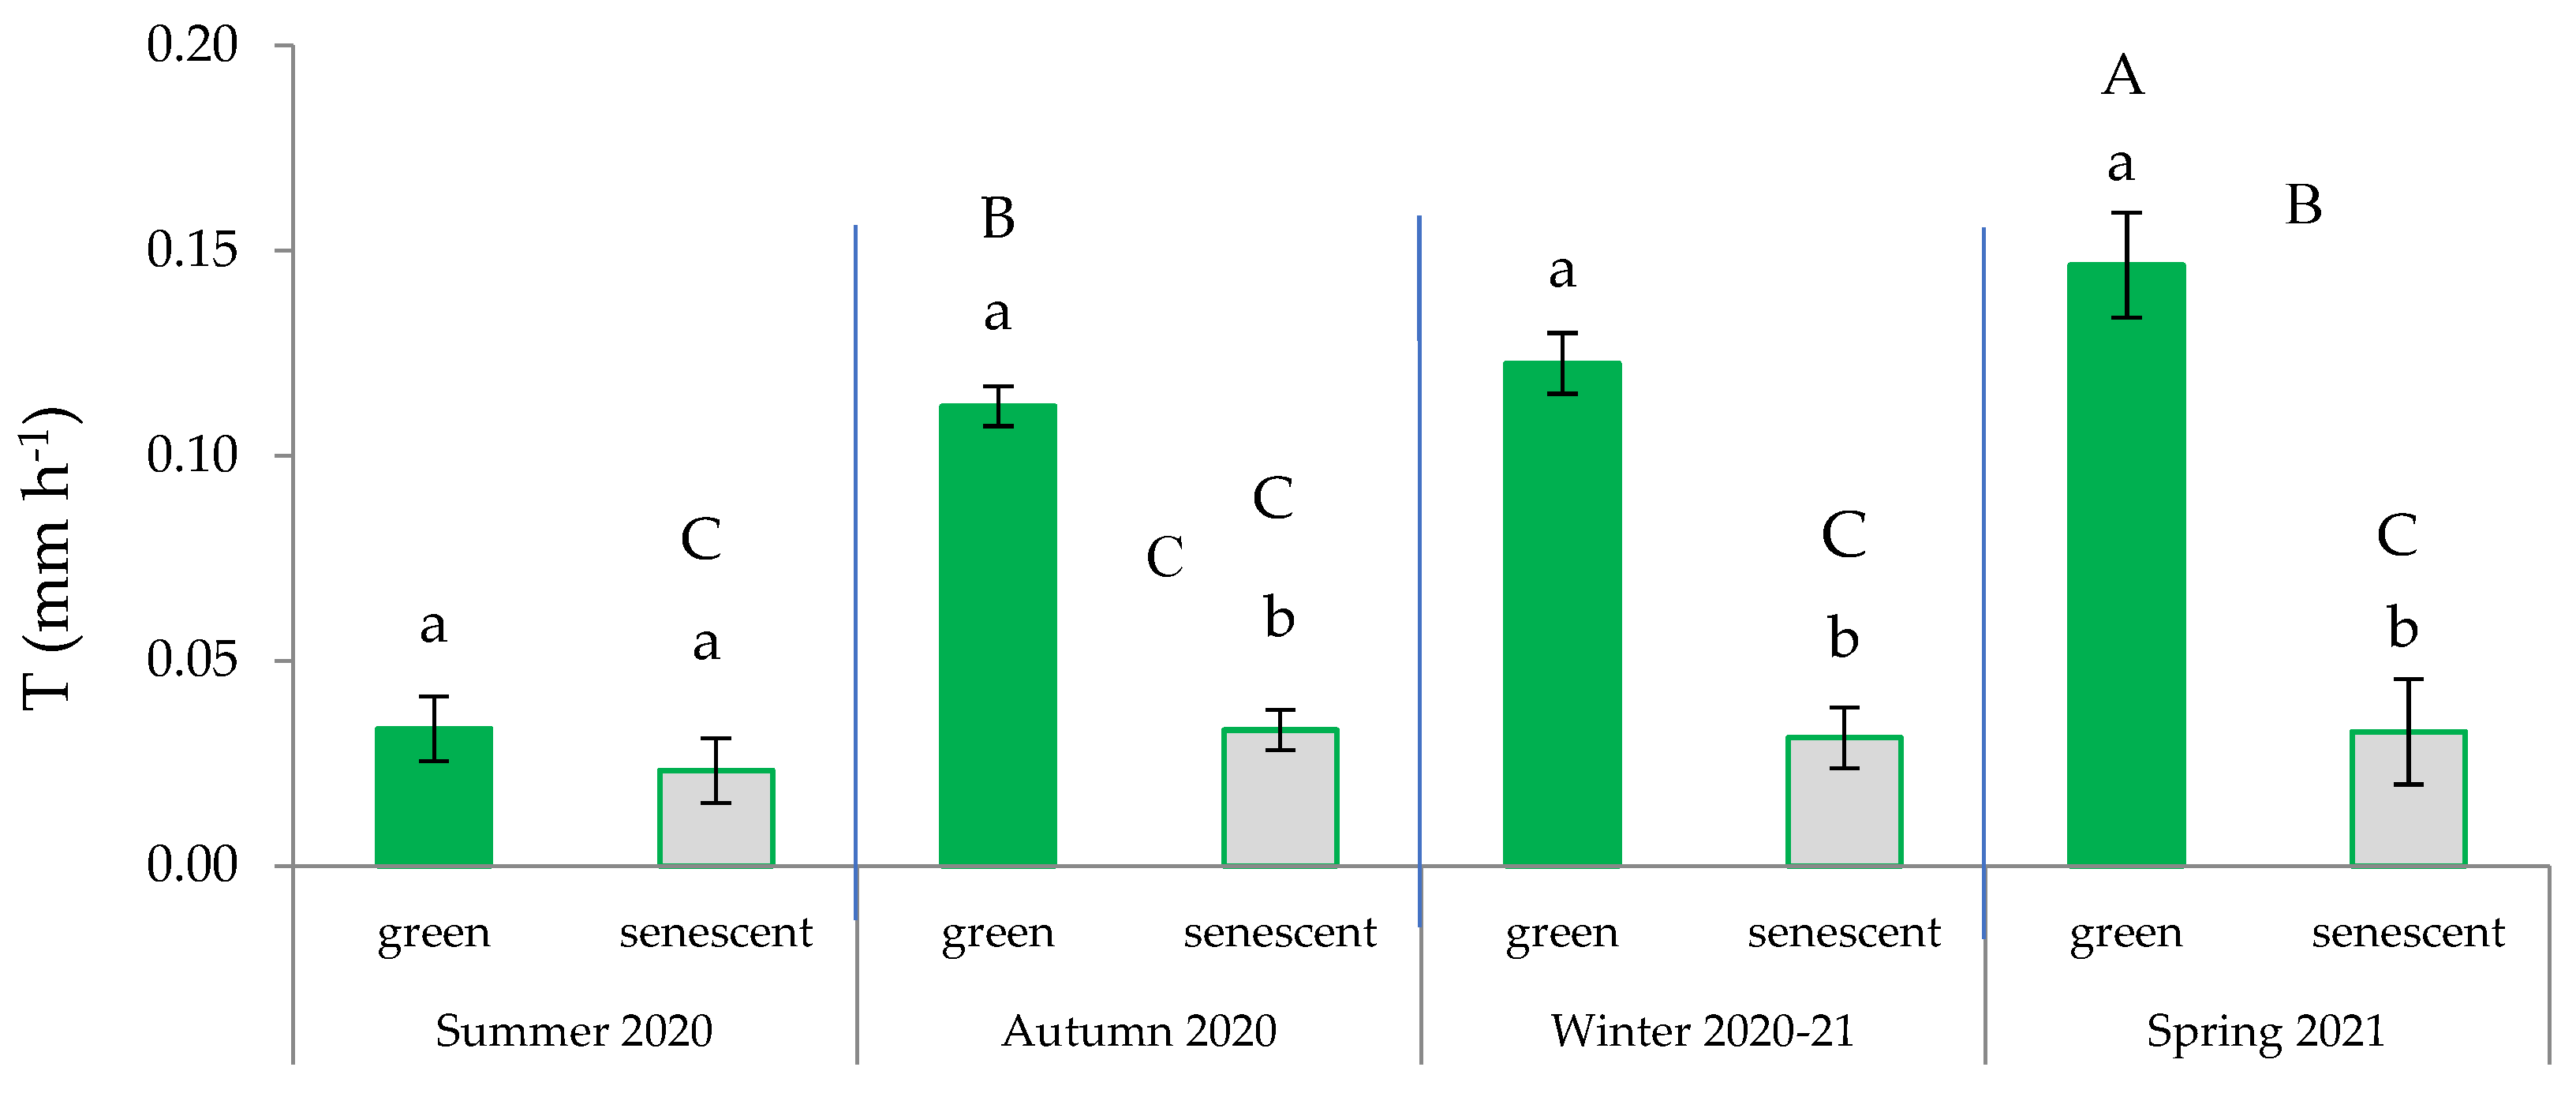
Figure 4.
Variation in transpiration rate across the four seasons based on the type of leaves (green or senescent). In each season, distinct lowercase letters indicate statistically significant differences (p ≤ 0.05; LSD test), while different uppercase letters signify statistically significant differences (p ≤ 0.05; LSD test) between seasons. Error bars represent standard errors.
Figure 5.
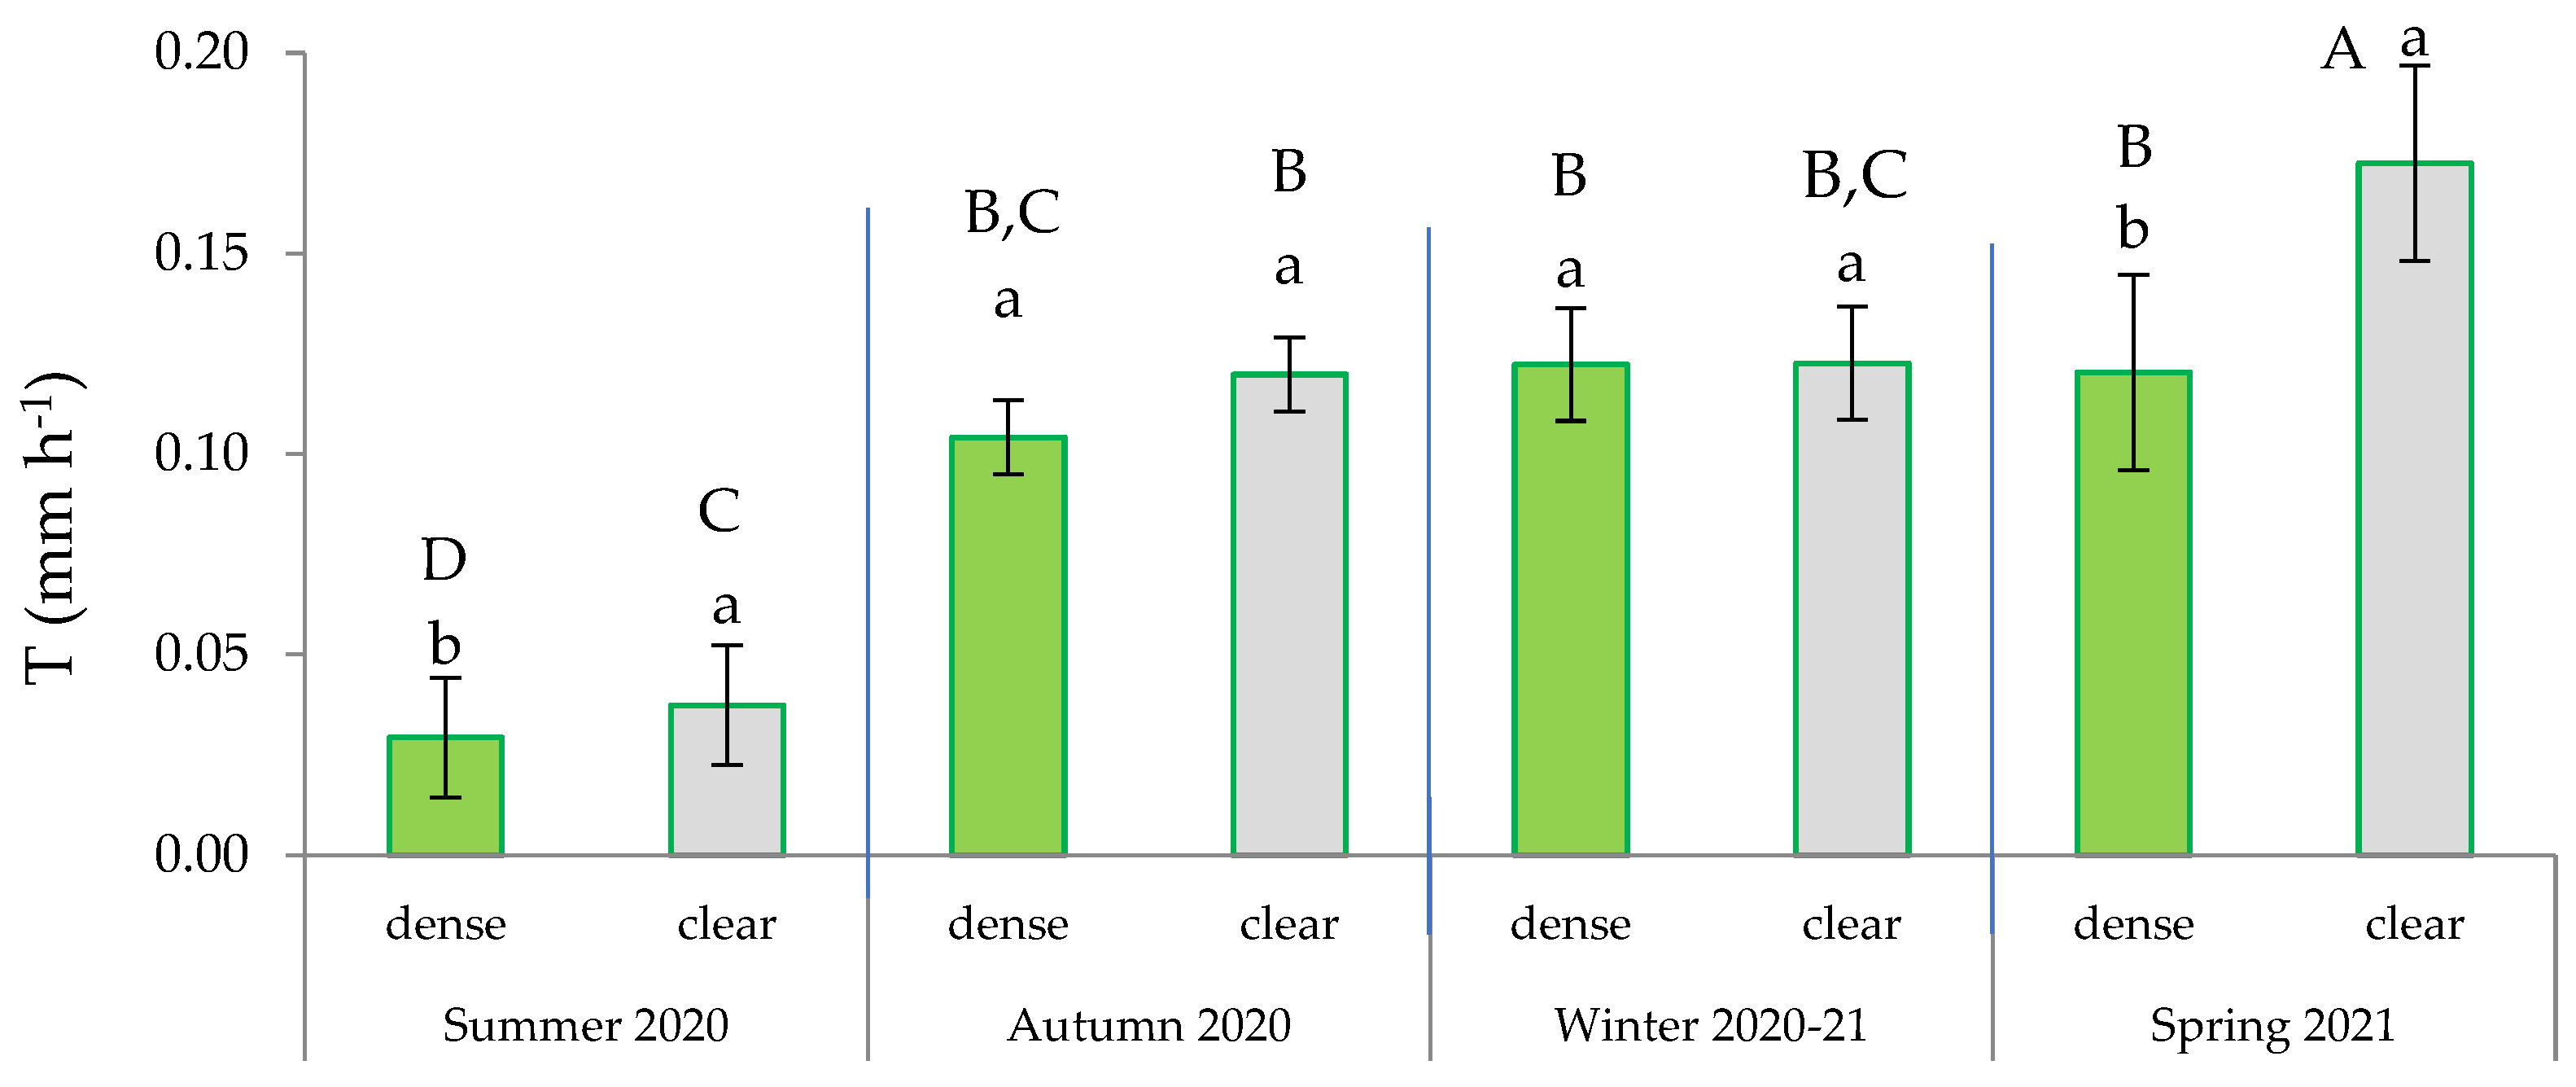
Transpiration rate (mm h−1) in green leaves across the four seasons and in function of the site. In each season, distinct lowercase letters indicate statistically significant differences (p ≤ 0.05; LSD test), while different uppercase letters signify statistically significant differences (p ≤ 0.05; LSD test) between seasons. Error bars represent standard errors.
Figure 6.
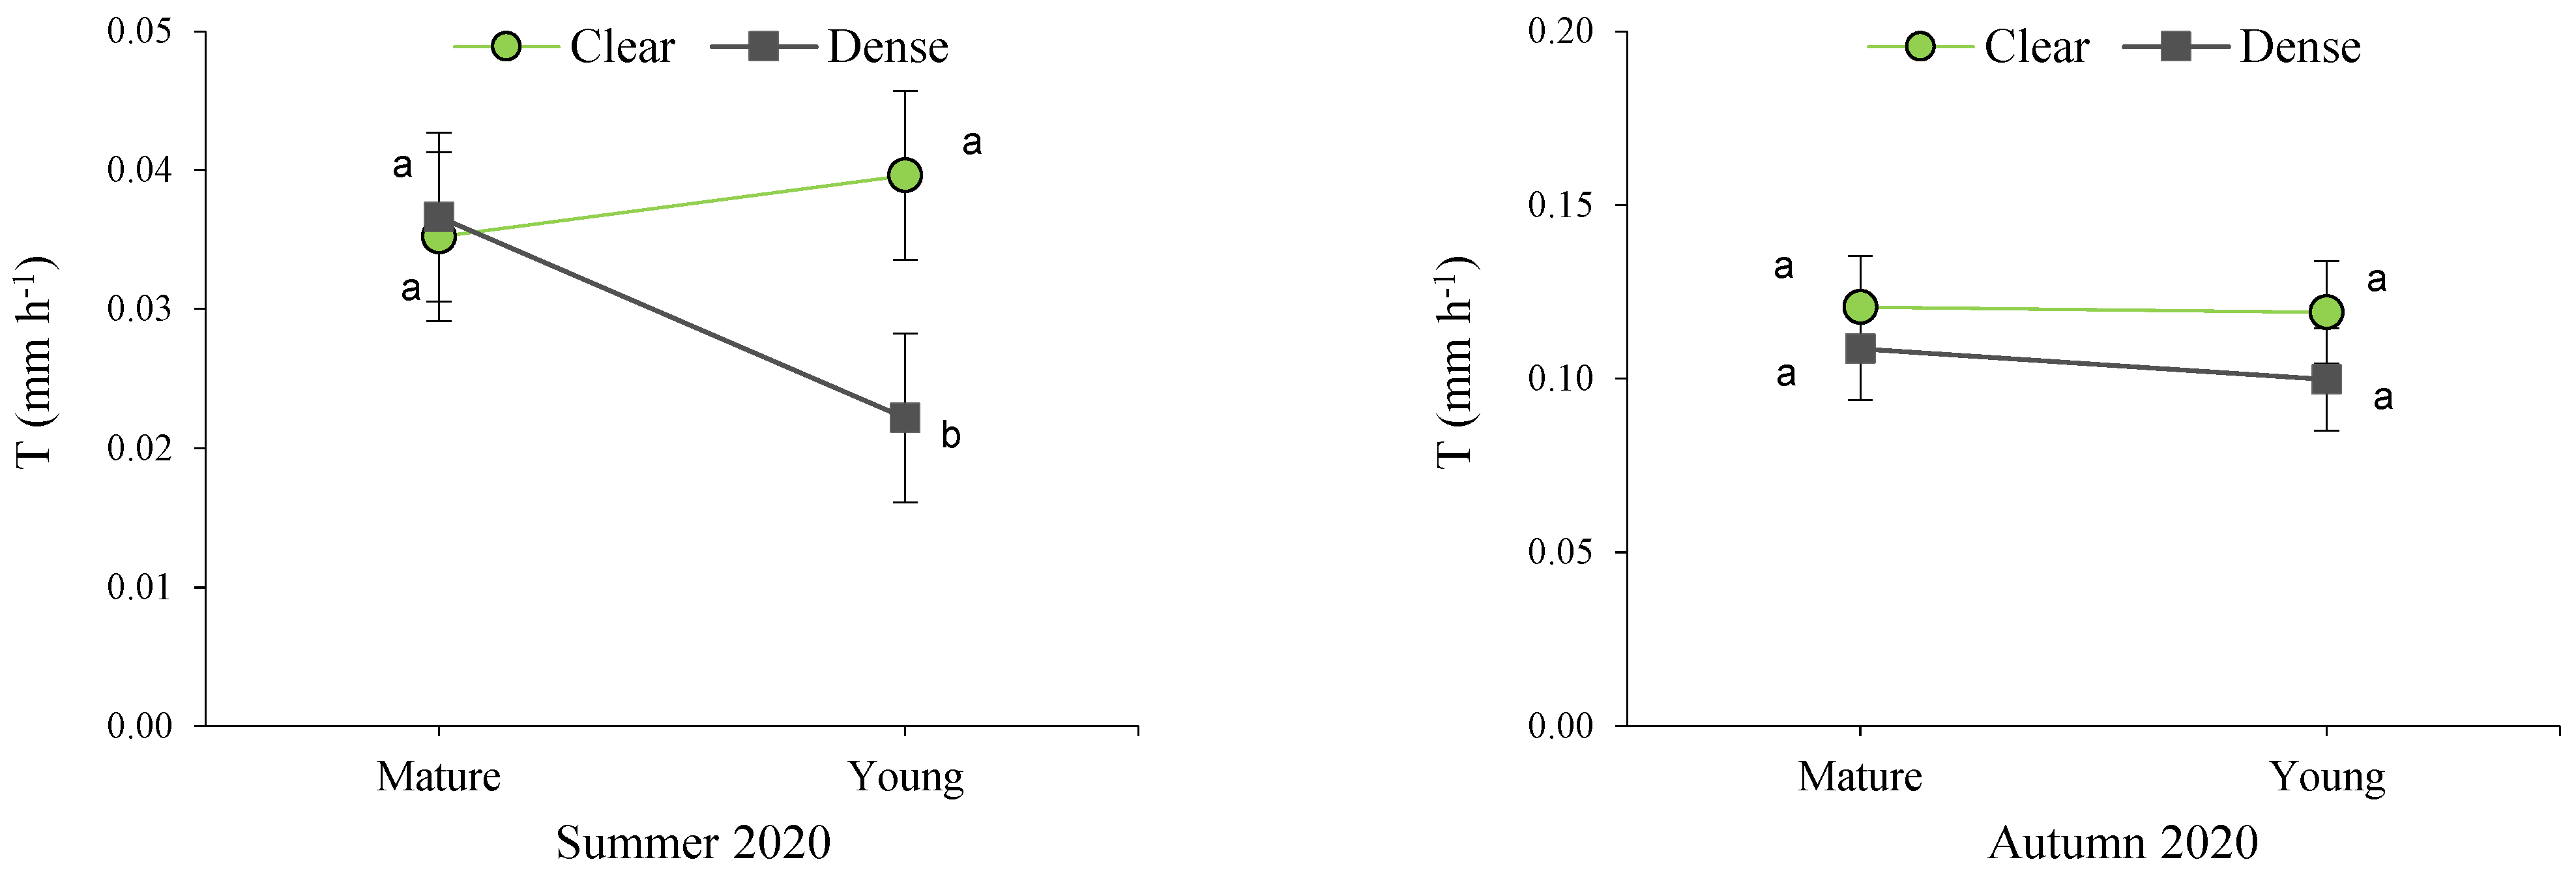
Interactions between site and maturity across the four seasons for the transpiration rate in green leaves. Means sharing the same letter within each season are not significantly different at a 95% probability level (LSD test; p < 0.05).
Figure 6.
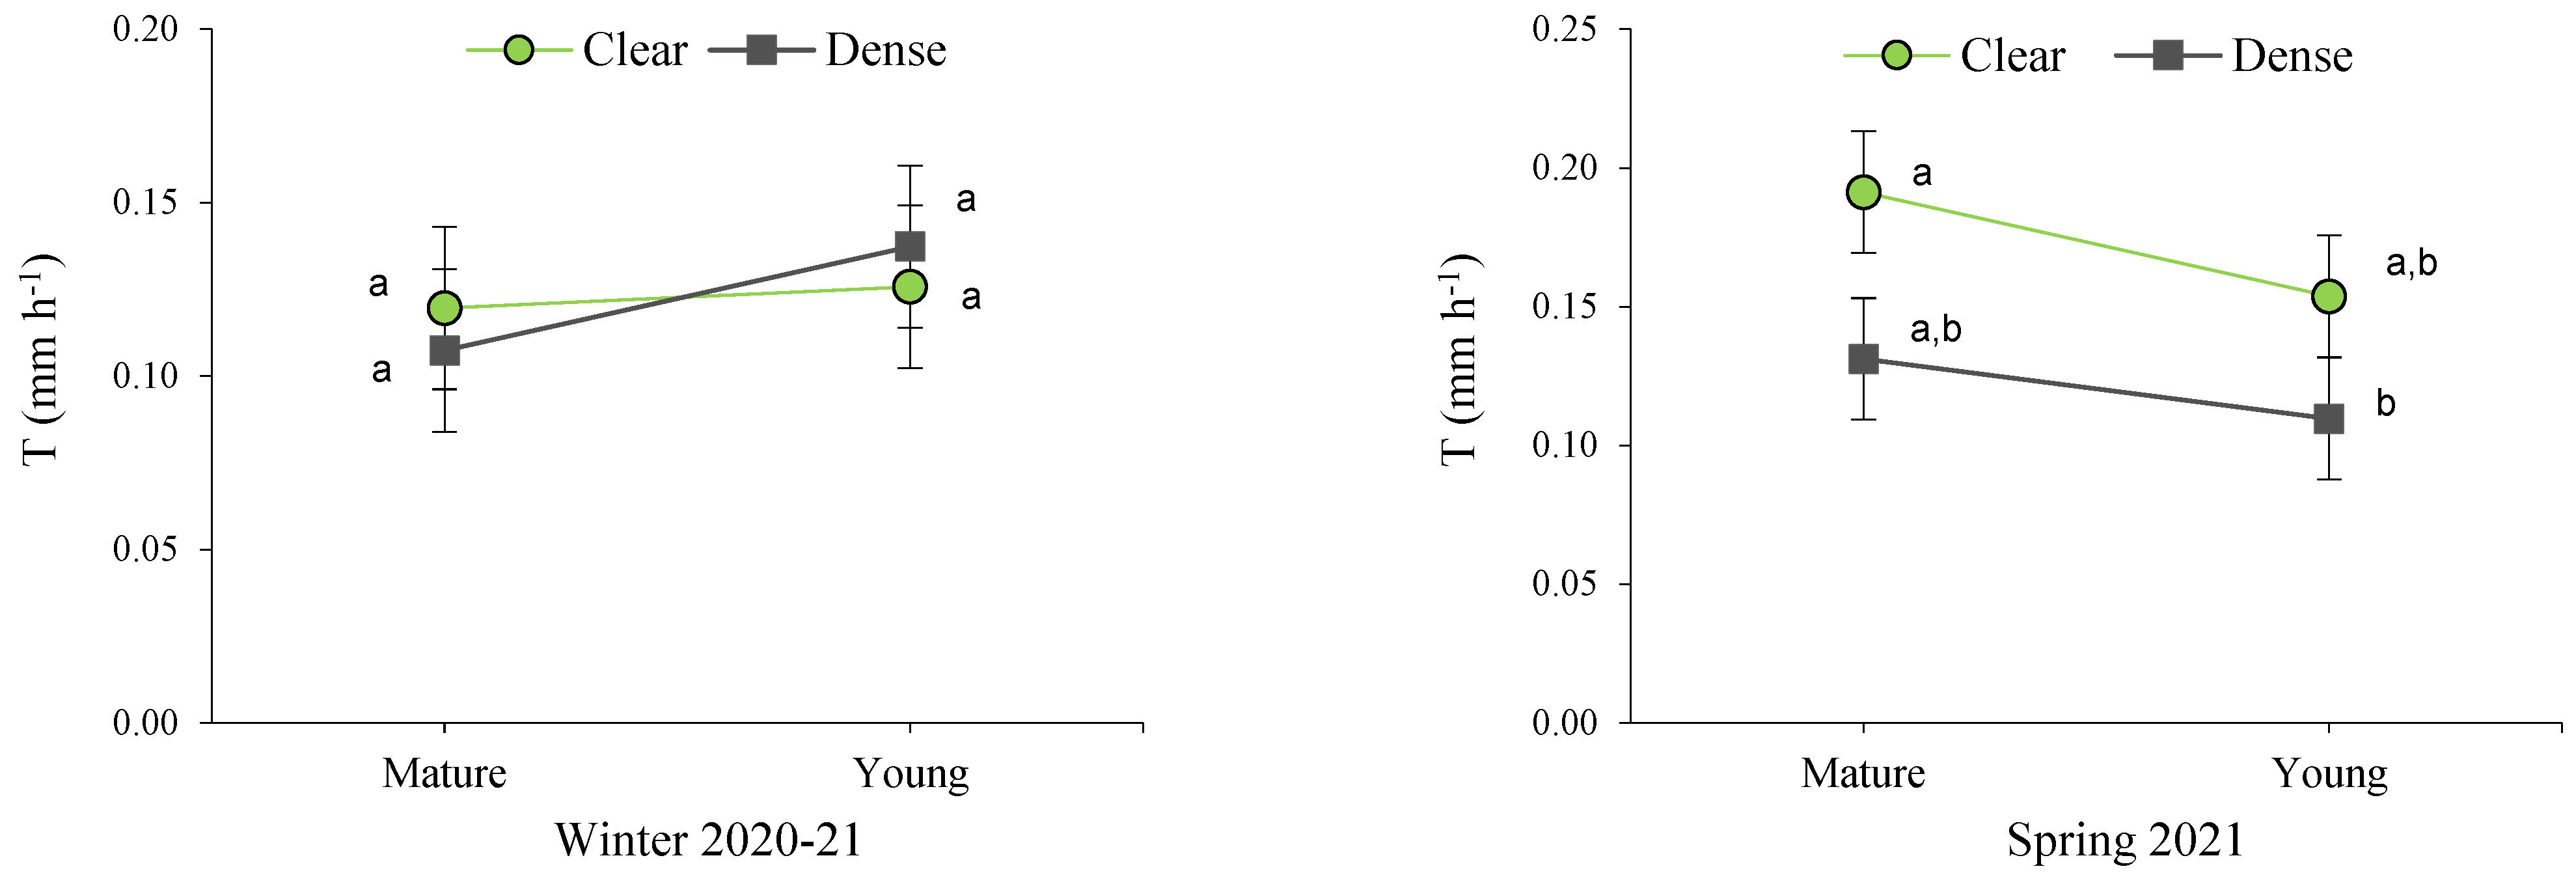
Interactions between site and maturity across the four seasons for the transpiration rate in green leaves. Means sharing the same letter within each season are not significantly different at a 95% probability level (LSD test; p < 0.05).
Figure 7.
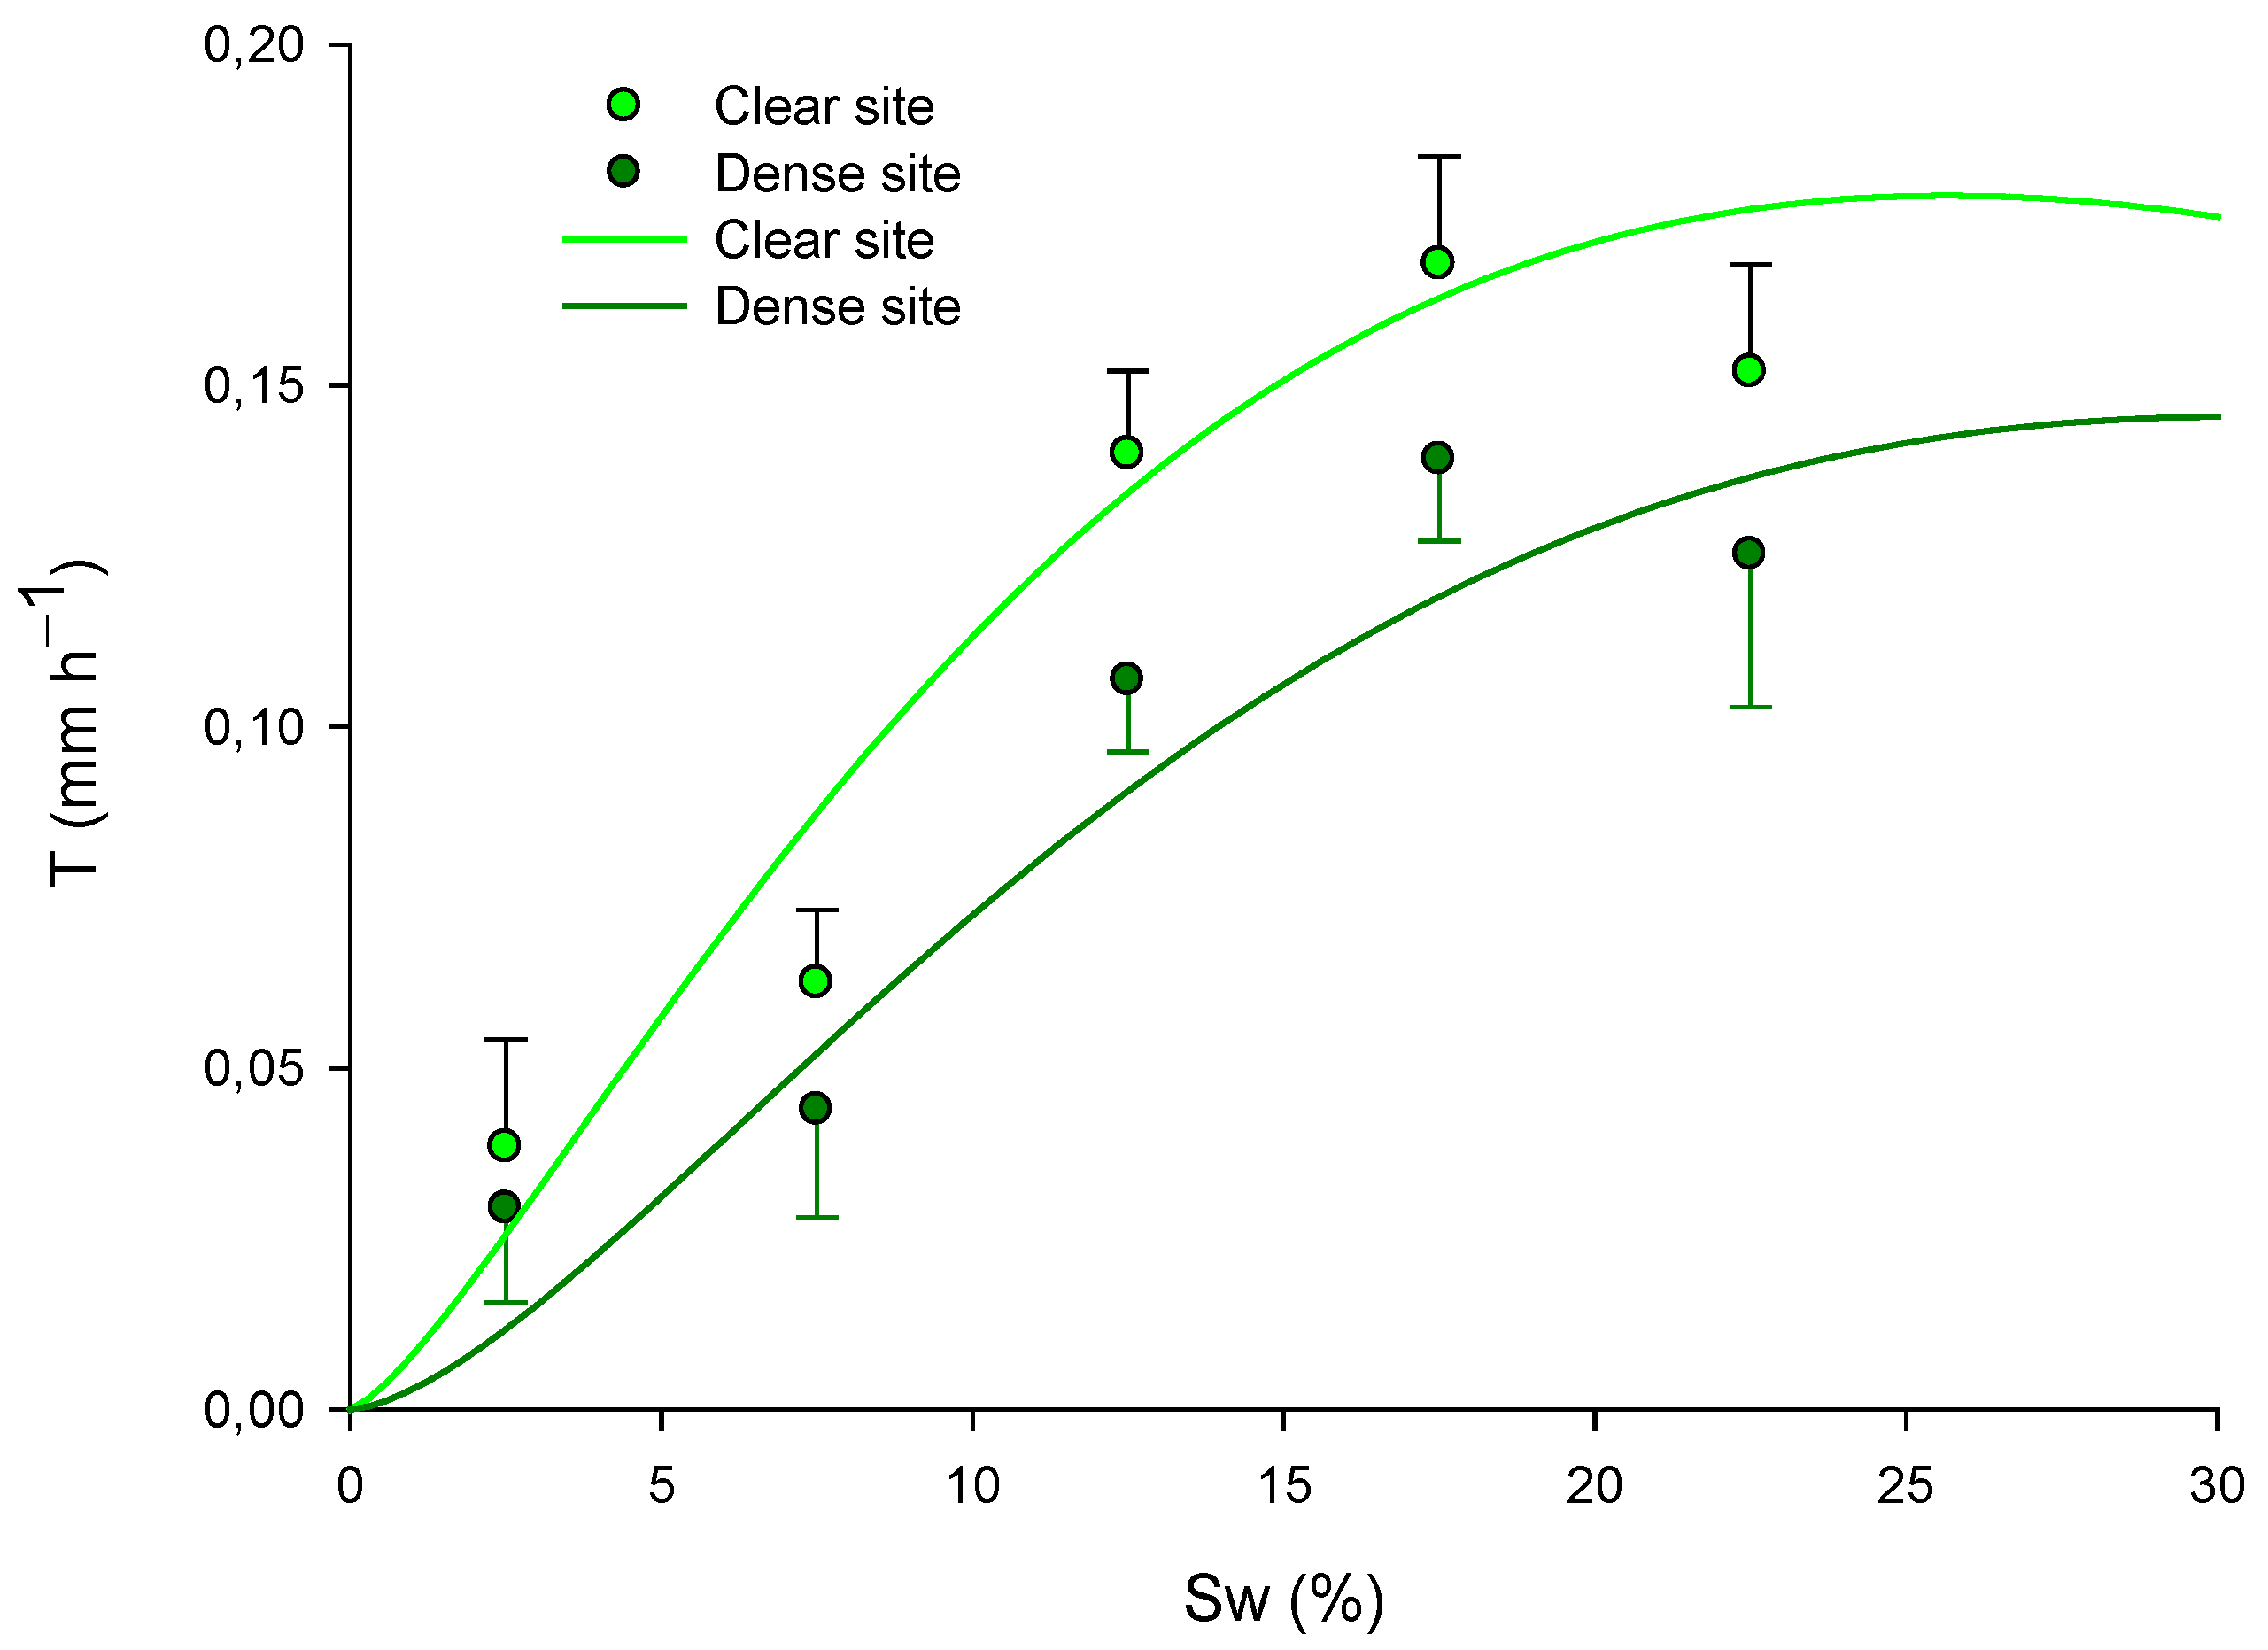
Fitted models for green leaves explaining the Transpiration rate (T; mm h−1) in relation to soil water (Sw; %) and site. The models are presented for the long-term period, with data across all seasons: for the dense site , and for clear site: . Means values of Transpiration rate ± standard error (mm h−1) are also presented in the graph at soil water content intervals of 2.5%, 7.5%, 12.5%, 17.5%, and 22.5%.
Figure 8.
Location of the study area in the southern of Spain (Sierra de los Donceles Mountains), and the sampled esparto grass where transpiration measurements were conducted in both clear and dense stands. The coordinates are in UTM(m), using the ETRS89 reference system.
Figure 8.
Location of the study area in the southern of Spain (Sierra de los Donceles Mountains), and the sampled esparto grass where transpiration measurements were conducted in both clear and dense stands. The coordinates are in UTM(m), using the ETRS89 reference system.
Table 1.
Summary statistics for the linear mixed model (LMM) describing the influence of leaf type on the total transpiration rate (T, mm h−1) in the two sites across all seasons, including the effect of the maturity of the bush. Results are presented with the dependent variable as transpiration measured in both types of leaves (greens and senescent; entire dataset, n=672). * Effects considered significant if p < 0.05 (95% probability).
| |
Growing season |
|
| Main Effects |
Spring |
Summer |
Autumn |
Winter |
Yearly |
| Leaf |
<0.001* |
0.533 |
<0.000* |
0.001* |
<0.001* |
| Leaf x Season |
- |
- |
- |
- |
<0.001* |
| Leaf x Site |
0.858 |
0.687 |
0.571 |
0.873 |
0.317 |
| Leaf x Maturity |
0.322 |
0.223 |
0.447 |
0.784 |
0.295 |
| Leaf x Season x Site |
- |
- |
- |
- |
0.679 |
| Leaf x Season x Maturity |
- |
- |
- |
- |
0.724 |
Table 2.
Summary statistics for the linear mixed model (LMM) describing the influence of fixed factors site and maturity on the total transpiration rate in green leaves (T, mm h−1; n=336) across all seasons.). * Effects are significant if p < 0.05 (95% probability).
Table 2.
Summary statistics for the linear mixed model (LMM) describing the influence of fixed factors site and maturity on the total transpiration rate in green leaves (T, mm h−1; n=336) across all seasons.). * Effects are significant if p < 0.05 (95% probability).
| |
Growing season |
|
| Main Effects |
Spring |
Summer |
Autumn |
Winter |
Total values |
| Season |
- |
- |
- |
- |
<0.001* |
| Site |
0.026* |
0.003* |
0.625 |
0.702 |
0.088 |
| Maturity |
0.512 |
0.098 |
0.775 |
0.240 |
0.305 |
| Season x Site |
- |
- |
- |
- |
0.126 |
| Season x Maturity |
- |
- |
- |
- |
0.164 |
| Site x Maturity |
0.086 |
0.021* |
0.399 |
0.617 |
0.121 |
| Season x Site x Maturity |
- |
- |
- |
- |
0.607 |
Table 3.
Significant parameters (± standard error), model significance (p), and goodness of fit (adjusted R2) in the exponential-power model (Model 1), fitted for seasonal and annual period. The model explains the transpiration rate (T; mm h−1 ) as a function of soil water content (Sw; %), and site (S):; n.s. = non-significant (p > 0.05; 95 % probability). SEE: standard error of estimation; R2(%): coefficient of determination.
| Seasons |
Leaves |
|
|
|
|
|
|
p |
SEE |
(%) |
| Summer 2020 |
Greens |
−8.62±0.88 |
5.03± 1.05 |
n.s. |
n.s |
4.24± 0.81 |
−4.18± 0.91 |
0.00 |
1.04 |
34.9 |
| |
Senescent |
−3.91 ±0.08 |
n.s. |
n.s. |
n.s. |
n.s. |
n.s. |
n.s. |
|
|
| Autumn 2020 |
Greens |
−5.64±0.27 |
0.19±0.09 |
n.s. |
n.s. |
1.26± 0.11 |
n.s. |
0.00 |
0.57 |
48.5 |
| |
Senescent |
−3.97 ±0.10 |
n.s. |
n.s. |
n.s. |
n.s. |
n.s. |
n.s. |
|
|
| Winter 2020-21 |
Green |
−1.67±0.23 |
n.s. |
−0.048±0.014 |
n.s. |
n.s. |
n.s. |
0.00 |
0.39 |
23.8 |
| |
Senescent |
−3.96 ±0.14 |
n.s. |
n.s. |
n.s. |
n.s. |
n.s. |
n.s. |
|
|
| Spring 2021 |
Green |
−2.14±0.89 |
n.s. |
n.s. |
0.028±0.010 |
n.s. |
n.s. |
0.00 |
0.31 |
23.6 |
| |
Senescent |
−3.52 ±0.09 |
n.s. |
n.s. |
n.s. |
n.s. |
n.s. |
n.s. |
|
|
| Yearly(all data) |
Greens |
−5.82±0.29 |
1.04± 0.35 |
−0.053± 0.023 |
n.s. |
1.60± 0.21 |
−0.25± 0.15 |
0.00 |
0.90 |
46.0 |
| Senescent |
−3.92 ±0.06 |
n.s. |
n.s. |
n.s. |
n.s. |
n.s. |
n.s. |
|
|
Table 4.
Fitted models account for each seasonal period, explaining the transpiration rate (T; mm h−1) in relation to soil water content (Sw; %), leaf type (green, senescent), and site (S): ; n.s. = non-significant (p > 0.05; 95 % probability). Average values of soil temperature (Ts; ºC), soil water content (Sw; %), photosynthetic active radiation (PAR; µmol m−2 s−1), and vapor pressure deficit (VPD; kPa) within each adjustment period are denoted by different letters, indicating significant differences (Fisher’s LSD test, 95% probability, α = 0.05).
| Seasons |
Leaf type-site |
T (mm h−1) |
Sw (%) |
Ts (ºC) |
PAR (µmol m−2 s−1) |
VPD(kPa) |
| Summer 2020 |
Green- dense |
|
3.4±0.4 |
32.9±0.5 |
959±39 |
5.2±2.9 |
| |
Green- clear |
|
| |
Senescent |
|
| Autumn 2020 |
Green- dense |
|
13.0±0.3 |
17.8±0.3 |
576±24 |
2.7±1.5 |
| |
Green- clear |
|
| |
Senescent |
|
| Winter 2020-21 |
Green- dense |
|
16.3±0.4 |
11.0±0.5 |
458±37 |
1.6±0.6 |
| |
Green- clear |
|
| |
Senescent |
|
| Spring 2021 |
Green- dense |
|
11.9±0.7 |
12.8± 0.8 |
198±64 |
1.4±0.3 |
| |
Green- clear |
|
| |
Senescent |
|
| Yearly |
Green- dense |
|
11.8±6.5 |
18.9±9.5 |
596±490 |
2.8±2.1 |
| (all data) |
Green- clear |
|
| |
Senescent |
|
Table 5.
Spearman correlations coefficients between transpiration (T; mm h−1) of green leaves, soil temperature (Ts; ºC), soil water content (Sw; %), photosynthetic active radiation (PAR; µmol m−2 s−1), and vapor pressure deficit (VPD; kPa). Coefficients are provided for low (Sw<5%), intermediate (5%≥Sw≤15%) and high (Sw>15%) soil humidity conditions. *: Correlations significantly different from zero, with a confidence level of 95% (p<0.05). **: Significant correlations (p<0.05) with correlation coefficient greater than 0.40 (in absolute value).
| Environmental conditions |
|
Soil water gradients |
| |
Sw<5% |
|
5%≤Sw≤15% |
|
Sw>15% |
| Sw (%) |
|
0,55** |
|
0,49** |
|
-0,14 |
| Ts (ºC) |
|
-0,47** |
|
-0,30* |
|
0,33* |
| VPD (kPa) |
|
0,58** |
|
-0,12 |
|
0,48** |
| PAR (µmol m-2 s-1) |
|
0,45** |
|
0,31* |
|
0,57** |
