1. Introduction
In December 2019, a new pneumonia linked to a novel coronavirus called 2019-nCoV emerged in Wuhan, China. Understanding the epidemiology and clinical characteristics of this pneumonia is of utmost importance [
1,
2]. Initially suspected to be a new coronavirus, the pathogen was later renamed severe acute respiratory syndrome CoV-2 (SARS-CoV-2) [
3].
The Significance of Shock Index (SI)
The shock index (SI) is a simple and reliable formula used to evaluate the physiological response in cardiovascular performance prior to systemic hypotension. It is calculated by dividing the heart rate by the systolic blood pressure. This ratio was first introduced by Allgower and Buri in 1967 as an inexpensive method to assess the degree of hypovolemia in hemorrhagic and infectious shock [
4]. The non-invasive nature of this measurement makes it valuable in providing consistent hemodynamic data. SI serves as a crucial metric for determining the level of tissue perfusion [
5]. Moreover, it enables the assessment of the severity of hypovolemic shock [
6].
Understanding the Shock Index Thresholds
The accepted range for the shock index is between 0.5 and 0.7 [
7]. However, different trials have used varying cutoff values. Among patients with critical conditions, a shock index value of 0.9 is the most commonly observed [
8]. Previous studies have shown that individuals with a shock index exceeding 0.9 face a higher risk of mortality [
8,
9,
10]. These studies have identified a heart rate over 120 beats per minute, a systolic blood pressure below 90 mmHg, and a diastolic blood pressure below 60 mmHg as key indicators of increased mortality. Furthermore, they have highlighted the importance of diastolic blood pressure (DBP) in predicting the severity of these patients, emphasizing its significance comparable to that of systolic blood pressure (SBP) [
11].
The Emergence of Modified Shock Index (MSI)
To further enhance the assessment of hemodynamic stability, the modified shock index (MSI) was developed. The MSI is defined as the ratio of heart rate to mean arterial pressure (MAP). This index takes into account the effect of diastolic blood pressure by replacing SBP with MAP in the calculation [
11]. The modified shock index has proven to be a superior predictor of mortality compared to traditional SI [
11]. It outperforms heart rate, systolic blood pressure, diastolic blood pressure, and SI as individual predictors [
12].
Applications of Modified Shock Index
Utilizing Modified Shock Index in Triage
Within the emergency department, vital signs such as heart rate and systolic blood pressure have traditionally been used to assess a patient’s hemodynamic state upon arrival. However, in certain cases, these values may appear normal even in severely ill individuals. This can lead to delays in treatment, a higher need for intensive care, and an increase in morbidity and mortality [
13,
14]. Age and persistent hypertension can mask hemodynamic compromise, making it difficult to detect symptoms such as tachycardia and hypotension [
15]. Additionally, even after significant blood loss, individuals may maintain normal heart rate and systolic blood pressure [
16]. By incorporating the shock index, healthcare providers can identify individuals at risk of decompensation and poor outcomes [
17]. Moreover, studies have shown that SI, MSI, and age SI are stronger predictors of inpatient mortality compared to SBP [
17]. While these variables are effective in predicting mortality, they do not necessarily indicate the need for critical care unit admission [
17].
Assessing Traumatic Injury
Significant research on the shock index has been conducted in the field of traumatic injury. Hemorrhagic shock (HS) is a common cause of mortality during initial trauma treatment. Detecting shock early can be challenging as normal vital signs may be present during the compensatory phase [
18]. However, the shock index has been proven to be a more useful predictor of HS and bleeding that necessitates the activation of the massive transfusion protocol (MTP) compared to standard indicators such as tachycardia or hypotension [
19]. Studies have consistently shown that SI rises significantly shortly after blood loss, even when heart rate and systolic blood pressure remain within acceptable ranges [
16]. A high SI is indicative of the need for MTP activation in individuals with relatively stable systolic blood pressure (>90 mmHg) [
19]. Furthermore, the modified shock index has been evaluated as a prognostic tool for hospital mortality in trauma patients, with values below 0.7 or above 1.3 associated with a greater risk of death [
12]. A low MSI suggests head injuries or severe hyperperfusion, while a high MSI indicates hypoperfusion.
Utilizing Shock Index in Other Medical Fields
The shock index has been explored in various medical domains, including obstetrics, sepsis, cardiovascular disease, pediatrics, and geriatrics.
Obstetrics
In obstetrics, the shock index has been used as a diagnostic tool and predictor of rupture in ectopic pregnancy. Studies have observed significant differences in SI between ruptured and unruptured pregnancies [
21]. However, the clinical relevance of this difference remains questionable [
21]. Triage heart rate and shock index exhibit substantial increases in individuals with ruptured ectopic pregnancy [
22]. By identifying the appropriate threshold for SI, healthcare providers can effectively predict ruptured ectopic pregnancy and reduce associated risks [
22].
Sepsis
Traditionally, the systemic inflammatory response (SIRS) criteria have been utilized to screen for sepsis in emergency departments. However, shock index has not been compared or added to the criteria, despite its potential to identify patients who require immediate treatment [
23]. Studies have shown a significant association between SI and the development of hyperlactatemia, indicating its value in predicting sepsis-related complications [
23].
Cardiovascular Disease
Shock index has demonstrated its predictive power in the context of cardiogenic shock associated with ST-elevation myocardial infarction (STEMI). Several investigations have recognized a high shock index as a risk factor for acute myocardial infarction (AMI) patients. SI, with its consideration of both blood pressure and heart rate, has been found to be a more sensitive and potent predictor of cardiogenic shock during primary percutaneous coronary intervention.
Pediatrics
Children have unique physiology and bodily reserves that differ from adults. It is important to consider these differences when assessing their vital signs. Moreover, the normal vital signs for children vary according to their age, which can greatly influence the interpretation of their systemic inflammatory (SI) values. Numerous studies have emphasized the significance of using age-adjusted SI measurements to accurately detect and predict outcomes in sick children [
26].
In a retrospective analysis involving 543 children, researchers defined pediatric age-adjusted SI (SIPA) as the maximum normal heart rate (HR) and lowest normal systolic blood pressure (SBP) based on age [
26,
27,
28,
29,
30,
31]. When compared to the standard SI values, SIPA proved to be more effective in accurately identifying seriously injured children who were at an increased risk of in-hospital mortality.
Geriatrics
As the population ages, the prevalence of chronic medical conditions such as hypertension and diabetes is on the rise. When assessing vital signs in older individuals, it is crucial to consider these underlying health issues that can impact the readings. While a normal SI is typically defined as 0.5–0.7, most studies fail to account for these confounding variables that influence vital signs. Additionally, the physiological response to stress in older individuals is slower, particularly in terms of heart rate (HR) [
15,
32]. Factors like hypertension can affect the baseline systolic blood pressure (SBP), and medications such as beta-blockers and calcium channel blockers can help reduce tachycardia caused by hypovolemia [
15]. Moreover, individuals with heart failure may experience impairments in their physiological response to shock.
To explore the relationship between systemic inflammatory (SI) values and mortality prediction, a retrospective cohort analysis of 111,019 individuals considered factors such as beta or calcium channel blocker therapy, hypertension, diabetes, and age over 65 [
15]. The objective was to determine if these factors influenced the correlation between SI and mortality prediction.
These guidelines and findings provide valuable insights into understanding the physiological differences and influences on vital signs in both pediatric and geriatric populations. By considering these factors, healthcare professionals can make more accurate assessments and predictions regarding patient outcomes.
Aim and Objective
The main goal of this study is to assess the effectiveness of Shock index versus modified shock index as predictors of mortality in patients with COVID-19. Additionally, the secondary objective is to examine the association between mortality rates and available medical history data at the time of admission.
2. Materials and Methods
Site of Study
The study took place at the Department of Emergency Medicine in a Tertiary Care Centre.
Type of Study
This was a retrospective observational study.
Period of Study
The study was conducted from February 2021 to April 2021.
Sample Size
The sample consisted of patients admitted to the tertiary care centre between June 1st, 2020, and January 31st, 2021.
Inclusion Criteria
Exclusion Criteria
Method
This retrospective study analyzed COVID-19 patients who were admitted to the ICU between June 1st, 2020, and January 31st, 2021. The data was collected from the Medical Records Department (MRD) at the tertiary care centre. Patient details were recorded using a standardized form and analyzed using SPSS software.
Plan for Analysis
The data was manually collected using a preformatted case record form. Spreadsheet software like Microsoft Excel was used to report the data, perform data analysis, and generate charts using SPSS.
Conflicts of Interest
The authors of this study declare that they have no conflicts of interest to report.
3. Result:
The study was conducted with 93 patients after using the inclusion and exclusion criteria. The research population’s demographic and comorbidity data are summarised in Table 1.1–1.4.
Comorbidity Vs Mortality
Diabetes Mellitus Vs Mortality
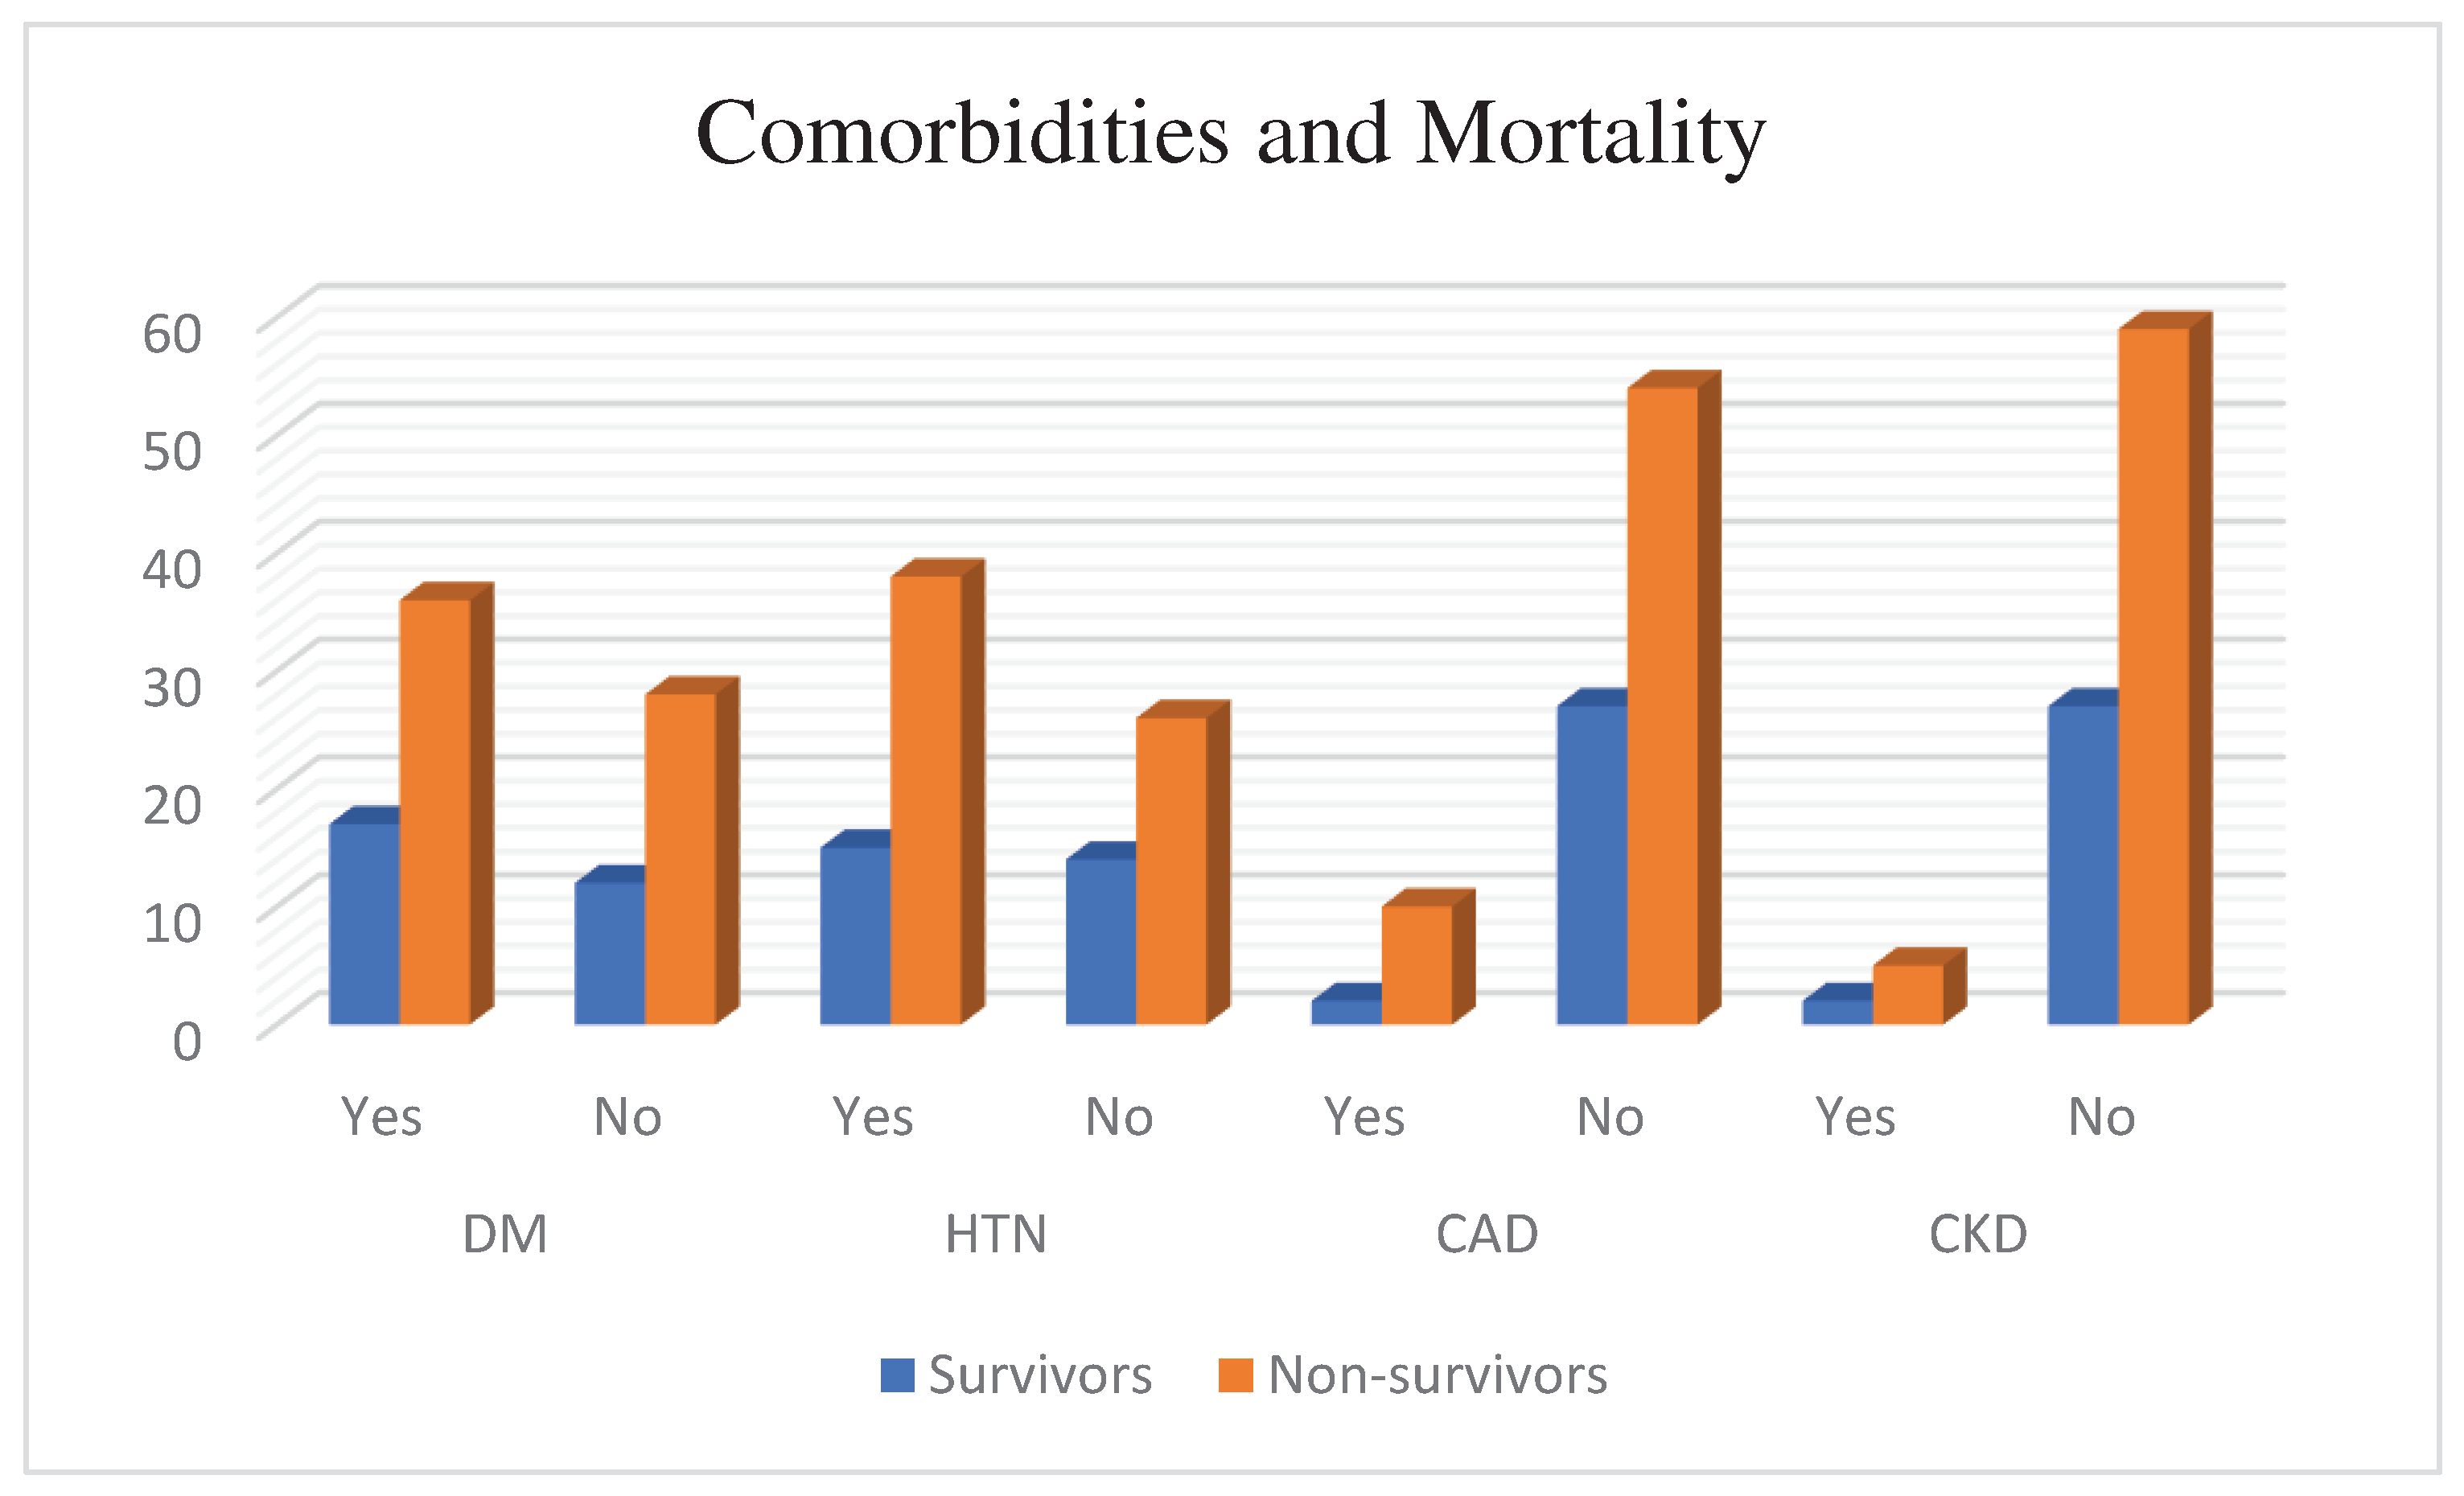
Table 1.1. Diabetes Mellitus and Mortality status of the patients (n=93). About 67.9% of patients were non-survivors out of 53 Diabetes mellitus patients.
| |
Diabetes Mellitus and Mortality |
| |
Survivors |
Non-survivors |
Total |
| Diabetes Mellitus |
Frequency |
Percent |
Frequency |
Percent |
| Yes |
17 |
32.1 |
36 |
67.9 |
53 |
| No |
12 |
30.0 |
28 |
70.0 |
40 |
| Total |
29 |
31.2 |
64 |
68.8 |
93 |
Hypertension Vs Mortality
Table 1.2. Hypertension and Mortality status of the patients (n=93). About 71.7% of Hypertensive patients were non survivors out of 38 Hypertensive patients.
| |
Hypertension and Mortality |
| |
Survivors |
Non- survivors |
Total |
| Hypertension |
Frequency |
Percent |
Frequency |
Percent |
| Yes |
15 |
28.3 |
38 |
71.7 |
53 |
| No |
14 |
35.0 |
26 |
65.0 |
40 |
| Total |
29 |
31.2 |
64 |
68.8 |
93 |
Coronary Arterial Disease Vs Mortality
Table 1.3. CAD and Mortality status of the patients (n=93). Among 12 Coronary Arterial Disease patients, 83.3% of them were non- survivors.
| |
CAD and Mortality |
| |
Survivors |
Non- survivors |
Total |
| CAD |
Frequency |
Percent |
Frequency |
Percent |
| Yes |
2 |
16.7 |
10 |
83.3 |
12 |
| No |
27 |
33.3 |
54 |
66.7 |
81 |
| Total |
29 |
31.2 |
64 |
68.8 |
93 |
Chronic Kidney Disease Vs Mortality
Table 1.4. CKD and Mortality status of the patients (n=93). Among 7 Chronic Kidney Disease patients 71.4% of patients were non-survivors.
| |
CKD and Mortality |
| |
Survivors |
Non- survivors |
Total |
| CKD |
Frequency |
Percent |
Frequency |
Percent |
| Yes |
2 |
28.6 |
5 |
71.4 |
7 |
| No |
27 |
31.4 |
59 |
68.6 |
86 |
| Total |
29 |
31.2 |
64 |
68.8 |
93 |
Figure 1.
Comorbidity and Mortality.
Figure 1.
Comorbidity and Mortality.
Age Distribution
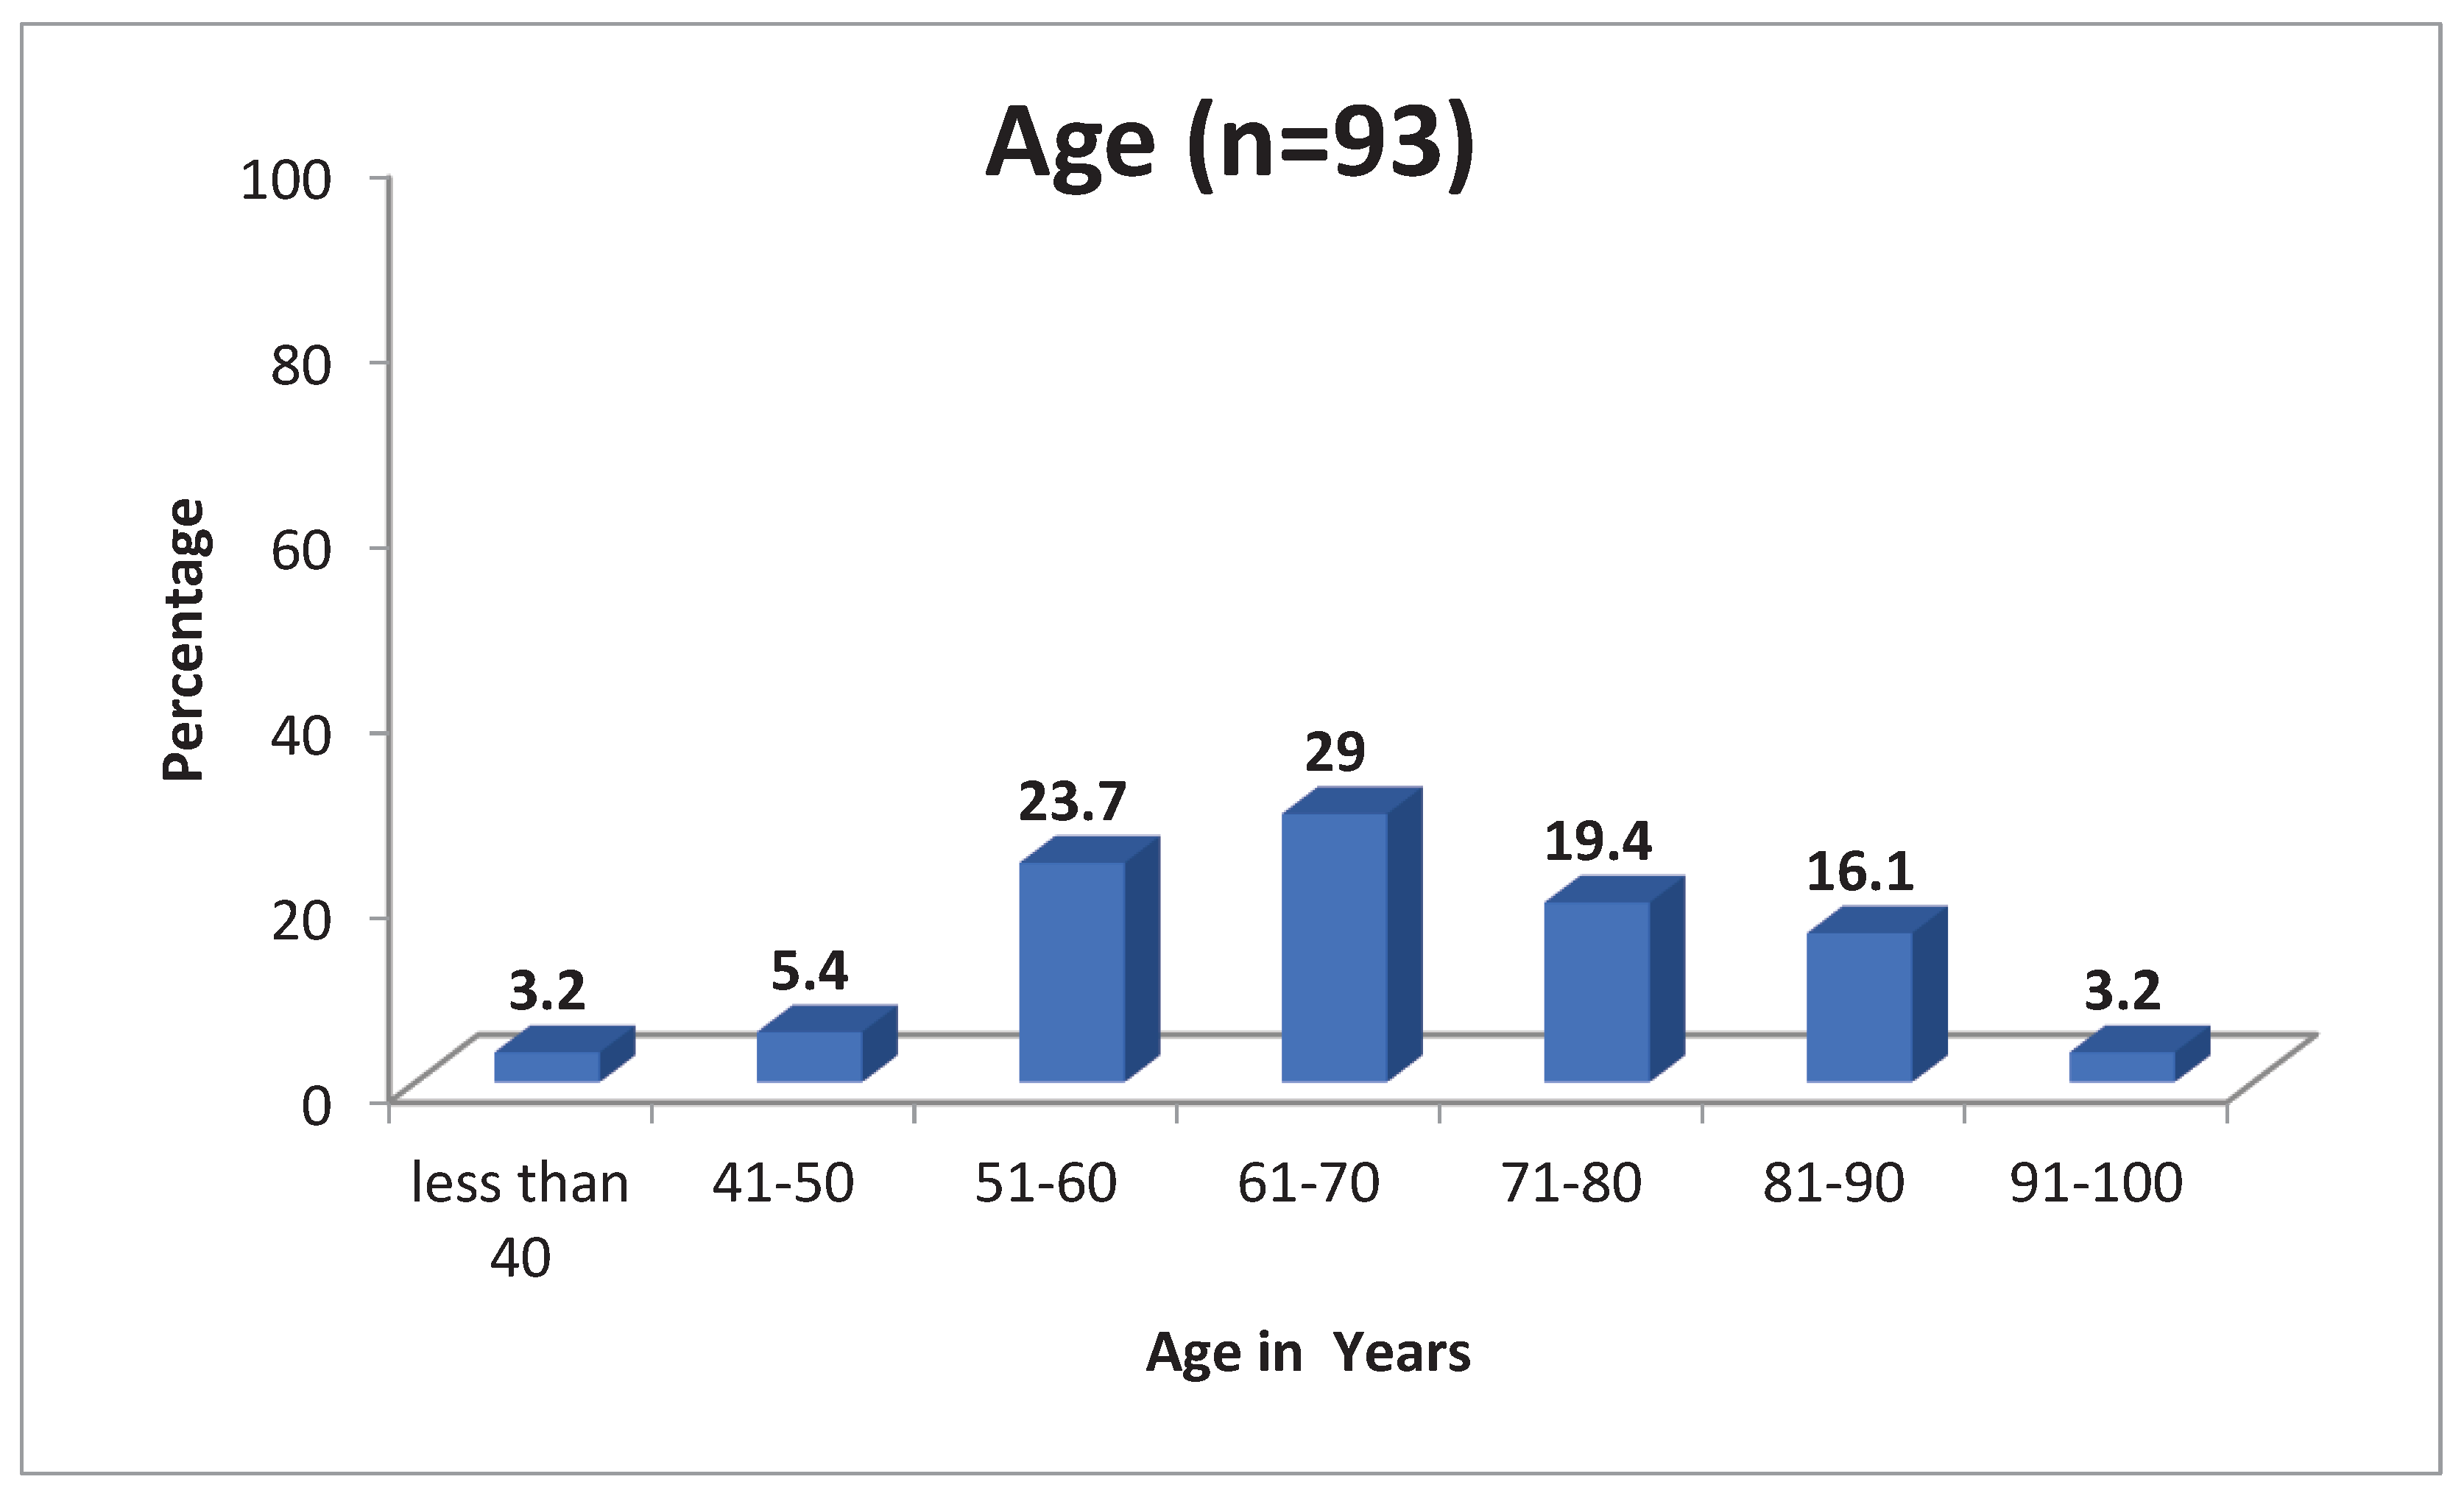
The Mean age of the patients is 67 Years with standard deviation 13.557. Among the patients the minimum age was 28 and maximum age was 97 (
Table 2)
Figure 2.
Age distribution.
Figure 2.
Age distribution.
Gender Distribution
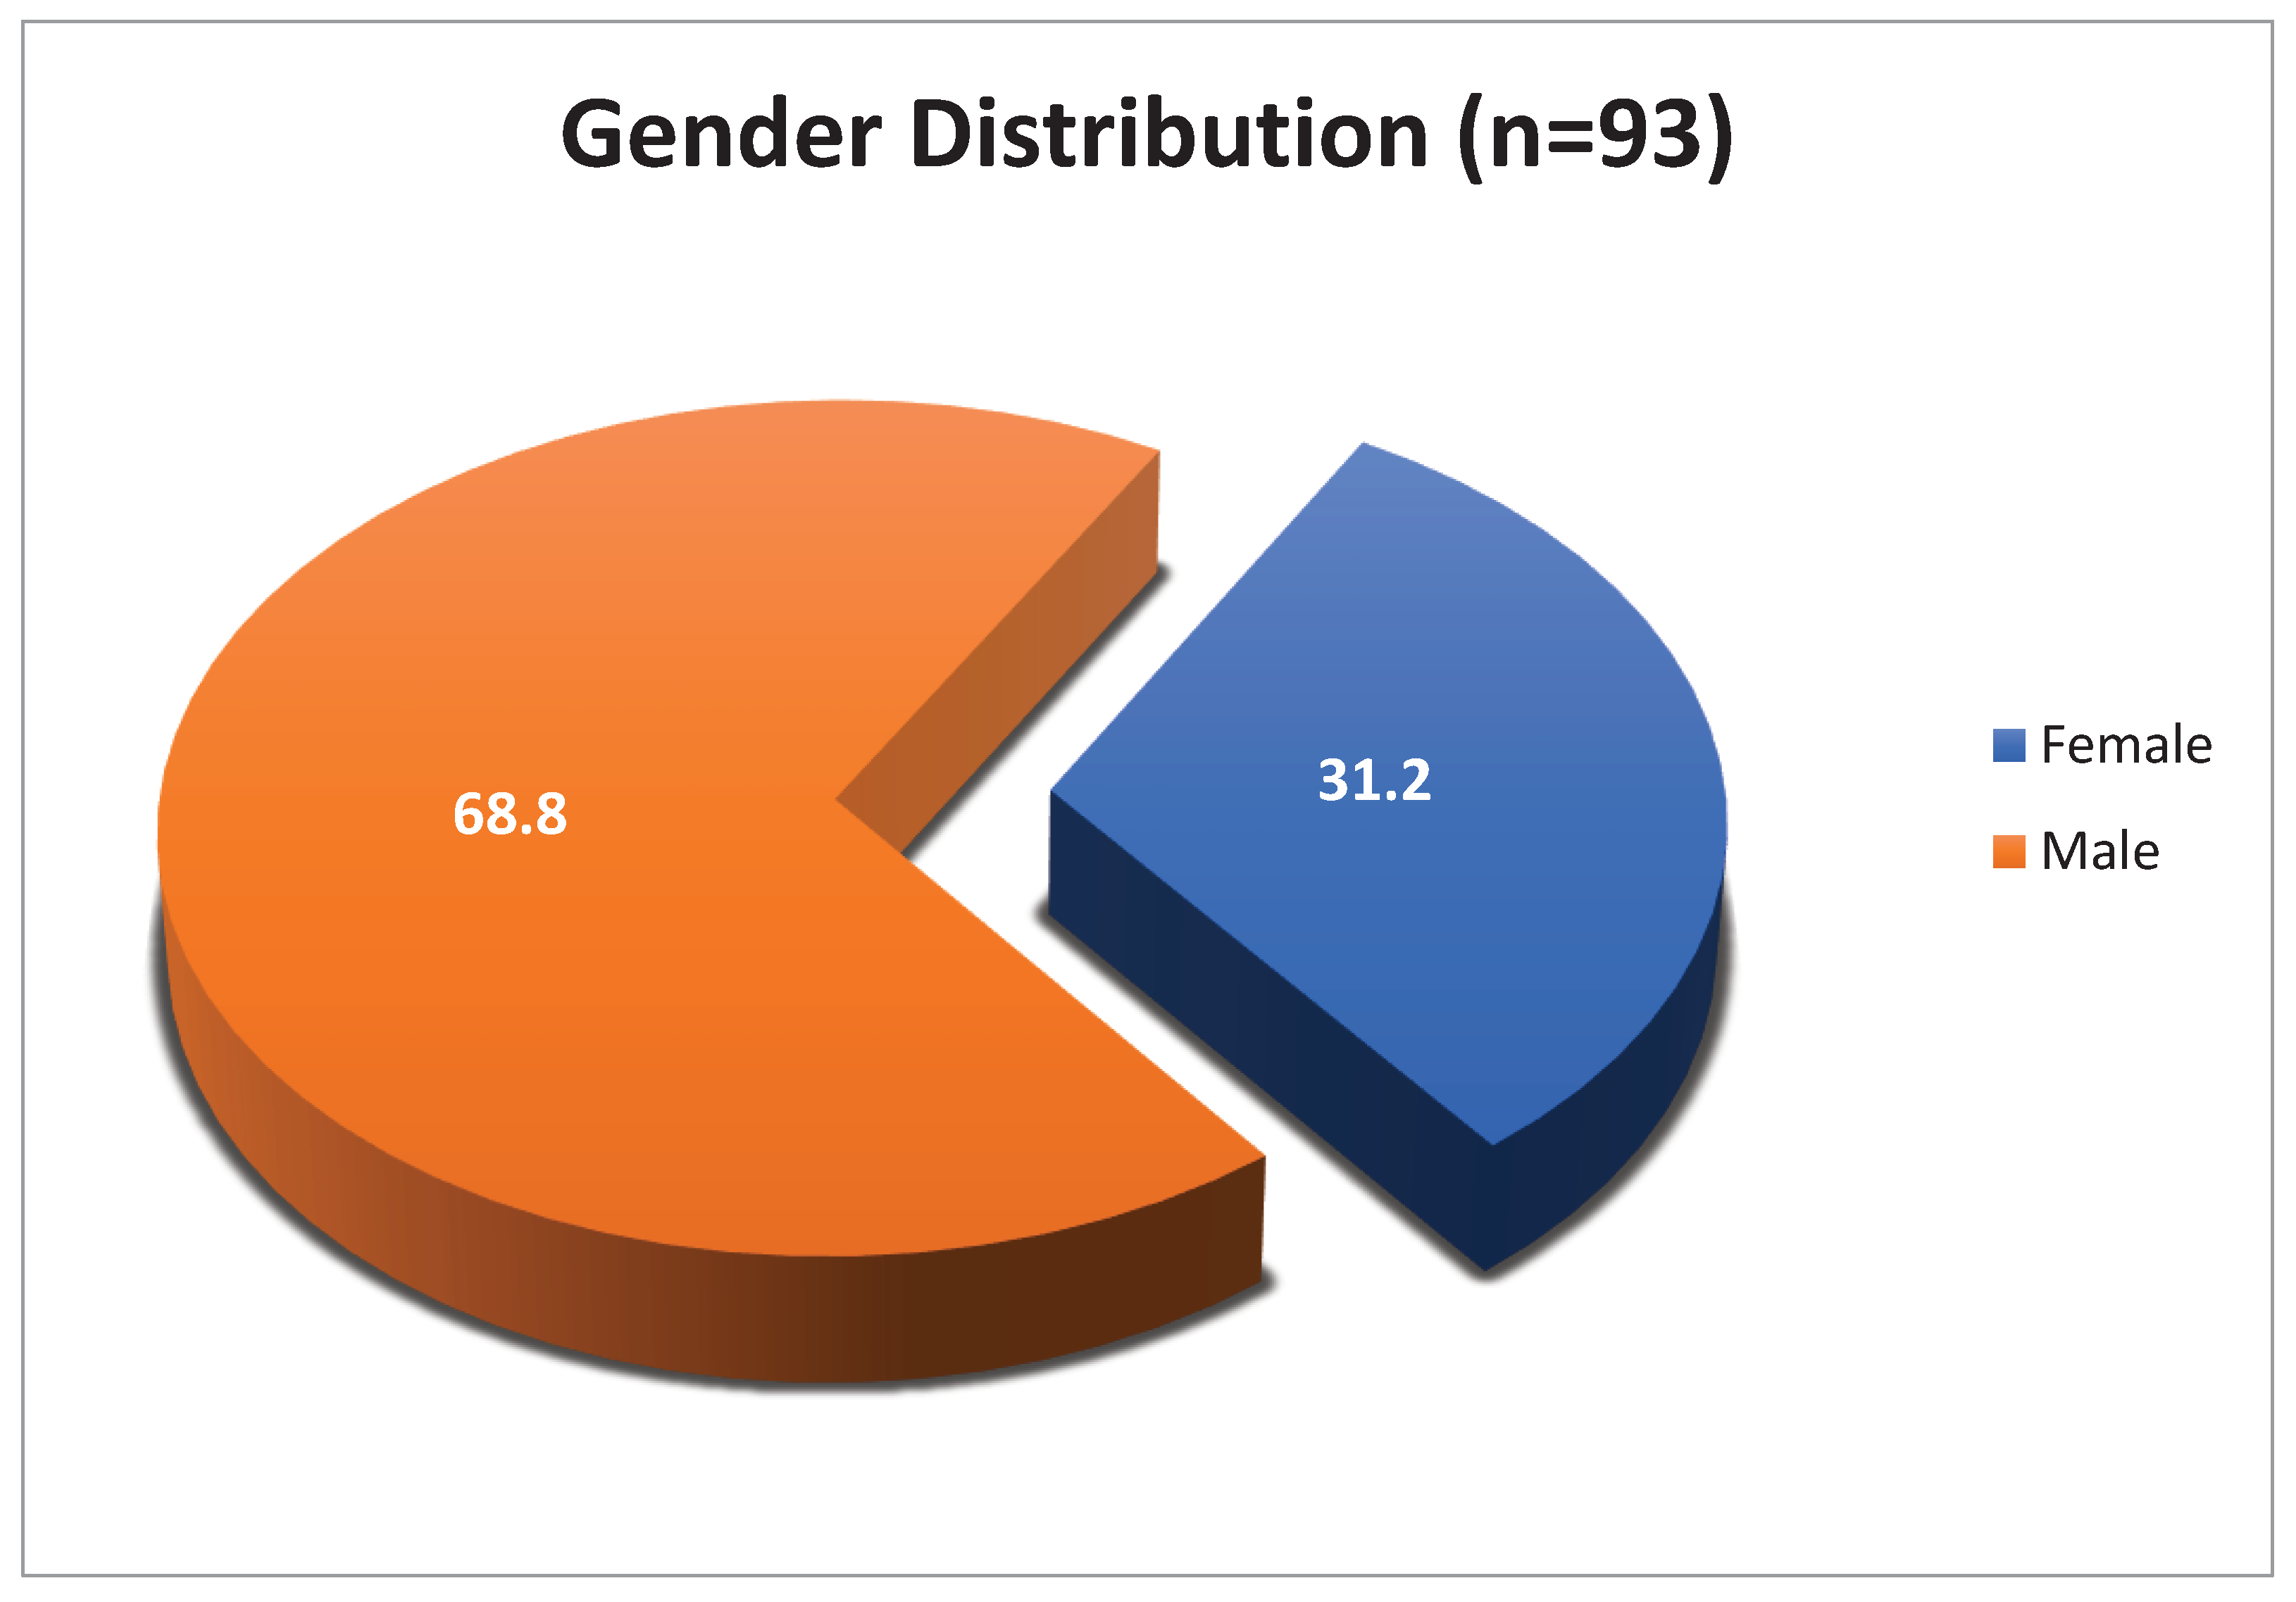
It is observed that 64 (68.9%) of the patients included in the study were male and 29 (31.1%) were female (
Table 3).
Figure 3.
Gender distribution.
Figure 3.
Gender distribution.
Gender wise Mortality
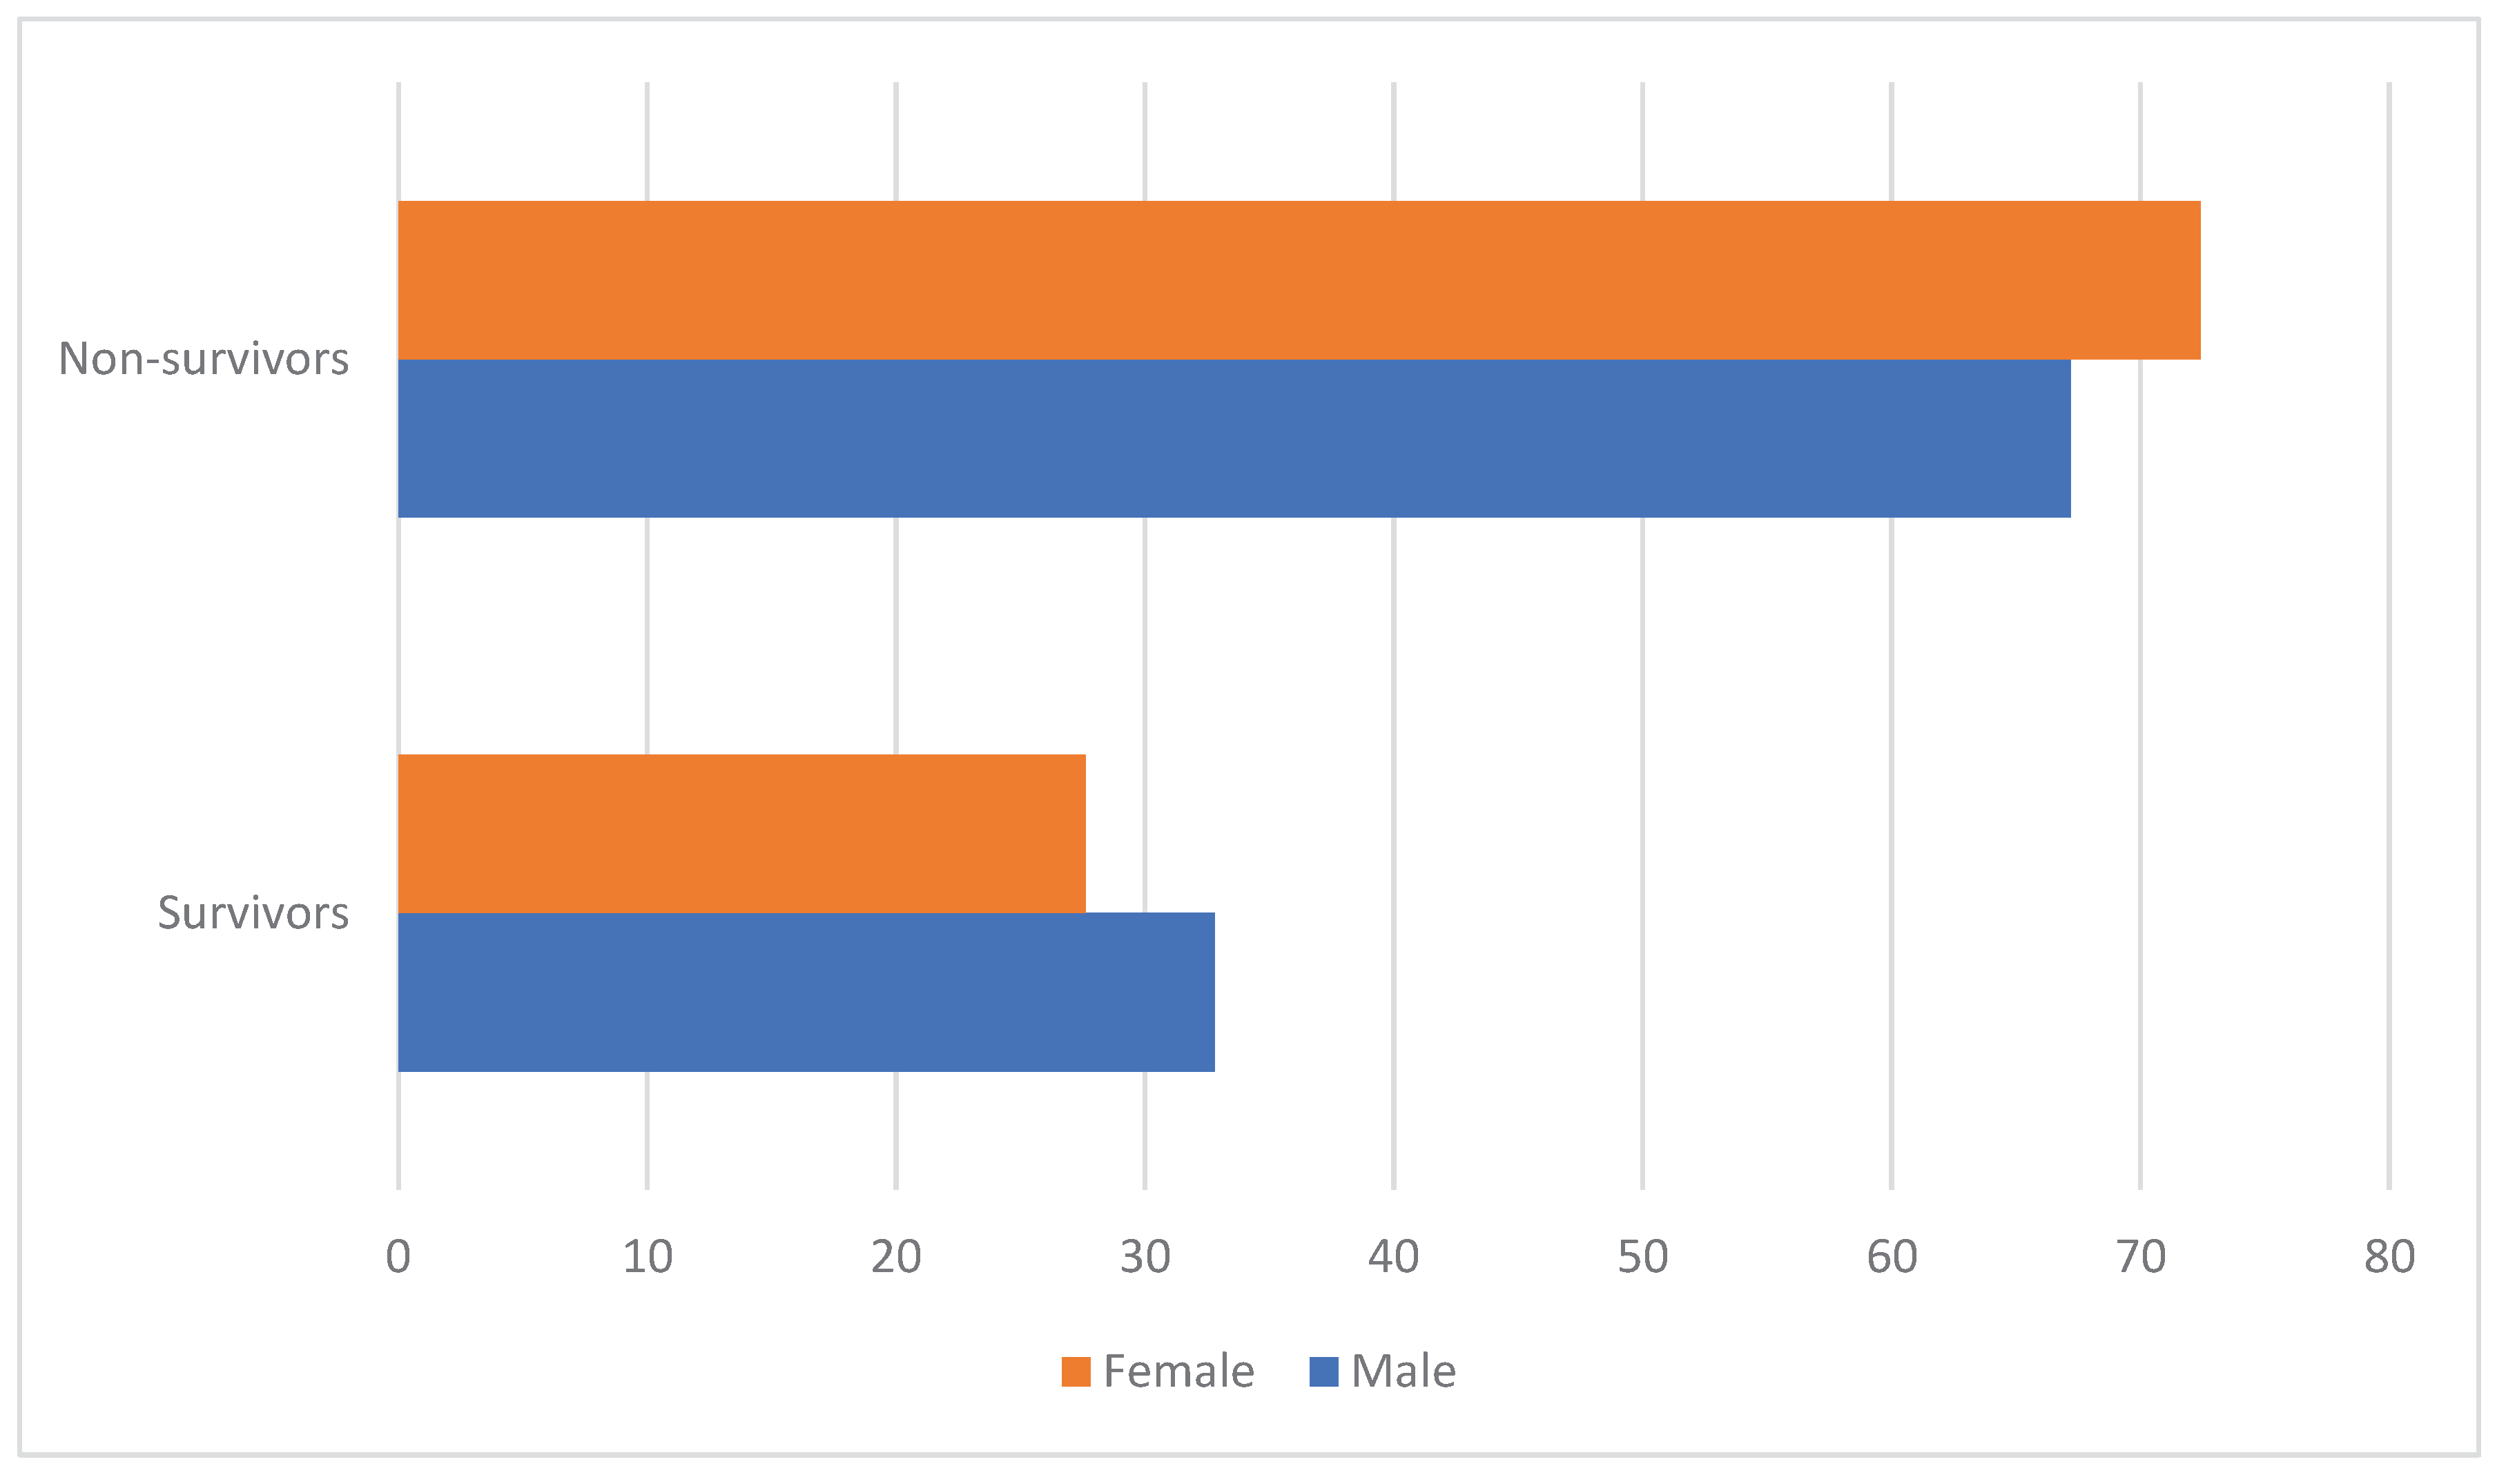
Out of 64 male patients 43 (67.2%) patients were died and out of 29 females 21 (72.4) patients were non-survivors (
Table 4)
Figure 4.
Gender wise mortality.
Figure 4.
Gender wise mortality.
Among non-survivors, majority were Female constituting 72.4% were as Male constituting 67.2%.
Shock Index Vs Mortality: Out of 93 patients 60 (64.5%) patients Shock Index were > 0.7 and 44 (73.3%) patients were non-survivors (Table 5)
Table 5.1. Shock Index Vs Mortality.
| |
|
SI |
Total |
| Mortality Status |
More than 0.7 |
Less than or equal to 0.7 |
| Non-survivors |
Frequency |
44 |
20 |
64 |
| % Within SI |
73.3% |
60.6% |
68.8% |
| Survivors |
Frequency |
16 |
13 |
29 |
| % Within SI |
26.7% |
39.4% |
31.2% |
| Total |
Frequency |
60 |
33 |
93 |
| % Within SI |
100.0% |
100.0% |
100.0% |
Table 5.2. Chi-Square test for Shock Index.
| Chi-Square Tests |
| |
Value |
df |
Asymptotic Significance (2-sided) |
| Pearson Chi-Square |
1.607 |
1 |
0.205 |
| Likelihood Ratio |
1.582 |
1 |
0.208 |
| N of Valid Cases |
93 |
|
|
Modified Shock Index Vs Mortality: Out of 93 patients 18 (19.4%) patients MSI was < 0.7 & > 1.3 and 16 (88.9%) patients were non-survivors.
Table 6.1. Modified Shock Index Vs Mortality.
| |
|
MSI |
Total |
| Mortality Status |
< 0.7 & > 1.3 |
0.7-1.3 |
| Non-survivors |
Frequency |
16 |
48 |
64 |
| % Within MSI |
88.9% |
64.0% |
68.8% |
| Survivors |
Frequency |
2 |
27 |
29 |
| % Within MSI |
11.1% |
36.0% |
31.2% |
| Total |
Frequency |
18 |
75 |
93 |
| % Within MSI |
100.0% |
100.0% |
100.0% |
Table 6.2. Chi-Square test Modified Shock Index.
| Chi-Square Tests |
| |
Value |
df |
Asymptotic Significance(2-sided) |
| Pearson Chi-Square |
4.19 |
1 |
0.041 |
| Likelihood Ratio |
4.853 |
1 |
0.028 |
| N of Valid Cases |
93 |
|
|
Table 6.3. Risk estimation of Modified Shock Index.
| Risk Estimate |
| |
Value |
95% Confidence Interval |
| Lower |
Upper |
| Odds Ratio for Mortality Status (non-survivors/survivors) |
4.500 |
0.961 |
21.069 |
| N of Valid Cases |
93 |
|
|


