1. Introduction
Alzheimer’s disease (AD) is a progressive brain disorder and type of severe dementia that affects about 10 % of older people worldwide [
1]. The accumulation of extracellular amyloid plaques, composed mainly of amyloid (A)β, and intracellular formation of hyperphosphorylated TAUprotein (pTAU) is considered the unique hallmark of AD pathogenesis. The disturbed balance between Aβ production and Aβ clearance with the generation of neurotoxic Aβ
1-40 and Aβ
1-42 fragments, leading to a surge in oxidative stress in the brain, is accepted as one of the hypotheses for the AD etiology. The concomitant behavioral impairments include impaired circadian rhythm, sleep disturbance, decreased cognitive function, and memory loss. Nowadays, the priority in the research on AD is focused on discovering the signaling pathways closely associated with predisposition to the development of AD pathogenesis. This issue is a critical step in finding novel targets for manipulation and, therefore, controlling the progression of this neurological disease. Although funding resources in the research of practical therapeutic approaches are numerous, there is still no approved drug possessing the three “golden” features needed to be introduced in the market, i.e., i) to be able to suppress the neurodegeneration and the progress of the disease; ii) to lack of side effect during chronic treatment and iii) to be at relatively low price.
Experimental and clinical findings suggest that circadian dysregulation of the sleep-wake cycle is part of the early symptoms of the diseases and predisposes to memory deficit and AD progress [
2]. Treating disturbed sleep–wake cycle in the very beginning or before the expression of AD symptoms is suggested to lessen or even prevent pathogenesis development [
3]. Thus, the orexin receptor antagonist Suvorexant, which the Food and Drug Administration recently approved in the USA, is a good sample for studying the efficacy and outcome of treatment strategy on impaired sleep-wake circadian pattern in early period or before to AD symptomatic [
4]. The beneficial role of melatonin in the treatment of AD pathogenesis was also extensively studied [
5]. The melatonin is released from the pineal gland during the dark phase when the inhibitory control from the suprachiasmatic nucleus is attenuated by light exposure. The hormone’s primary function is the regulatory control of the circadian rhythms in the body, including synchronization of the sleep-wake cycle and promotion of sleep. It is hypothesized that melatonin deficiency might be a critical trigger predisposing to AD pathogenesis [
6]. Patients with AD are reported to have low levels of this hormone in cerebrospinal fluid [
6,
7,
8]. The removal of the pineal gland in rodents is accepted as a relevant model to study the harmful consequences of melatonin deficiency that resemble the signaling dysfunction associated with neurodegenerative diseases, including AD [
9]. Recently, we reported that simultaneous removal of the pineal gland and intracerebroventricular (icv) infusion of Aβ
1-42 exacerbates behavioral responses and concomitant oxidative stress in the hippocampus and the frontal cortex [
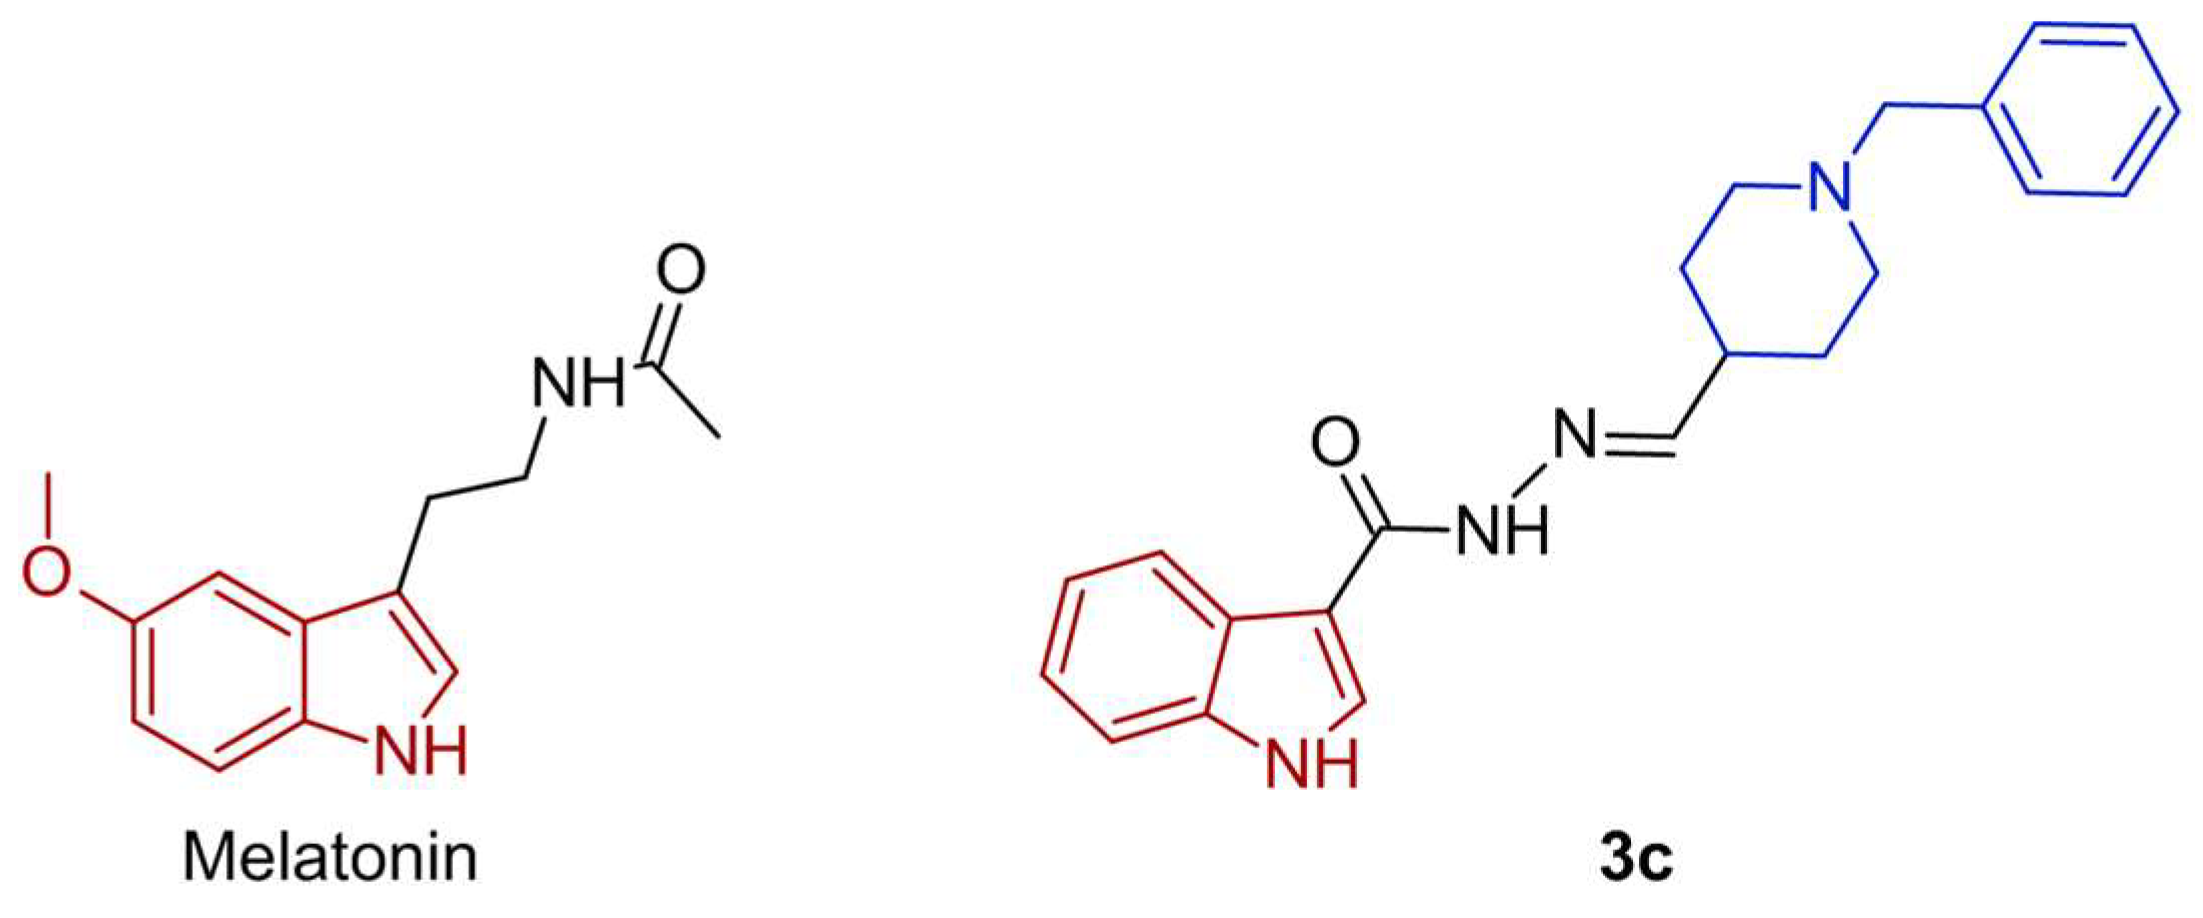
10]. Our research team synthesized and tested a series of new melatonin analogs and sulfonyl hydrazone compounds with a melatonin scaffold [
11]. The docking analysis demonstrated a plausible mechanism of action of one of the most potent compounds, the
3c, associated with melatonin /MT/ receptors, and inhibition of acetylcholinesterase (AchE), and butyrylcholinesterase (BchE). In the present study, the most effective and potent compound,
3c, possessing low
in vitro neurotoxicity, was selected and tested in a rat model of melatonin deficiency induced by pinealectomy (pin) and a subsequent
icvAβ
1-42 infusion. Melatonin was used as a referent drug. The underlying protective mechanism of the new compound was ascertained, including the possible signaling pathway closely related to the melatonin system and involved in the suppression of Aβ
1-42 accumulation in the hippocampus. We hypothesized that this novel melatonin analog,
3c, behaves as a potent MT receptor agonist promoting the non-amyloidogenic pathway via facilitating the MT receptor–related ERK/CREB signaling process.
3. Discussion
Recently, our team designed, synthesized, and characterized a series of melatonin-based hybrid compounds possessing hydrazine scaffold to determine whether they have the potential for further evaluation in AD therapy [
11]. Based on
in silico and
in vitro data, one of the two lead compounds,
3c, was chosen for further
in vivo study in a rat model of pinealectomy and subsequent
icvAβ
1-42 infusion. Melatonin was used as a positive control. The potential protective activity of the hybrid
3c compound against neurotoxicity related to the Aβ protein and plausible underlying mechanism was explored. The hypothesis that melatonin and the compound
3c could stimulate non-amyloidogenic signaling in the hippocampus via activity on MT
1A/MT
2B receptors in the pin+
icvAβ
1-42 model was based on recently reported potency of the novel hybrid compound to bind to the two MT receptor subtypes by molecular docking analysis [
11].
The major points directed to the close link between the melatoninergic system and AD pathogenesis are as follows: 1) impaired circadian rhythms (melatonin has a key role in the resynchronization of circadian rhythms); 2) impaired pro-oxidant/antioxidant balance (melatonin is a potent antioxidant and free radicals scavenger); 3) neuroinflammation (the hormone possess anti-inflammatory activity). As concerns the role of the melatonin system on the three main hallmarks of AD, i.e., formation of Aβ plaques, p-TAU, and cholinergic system dysfunction, a growing body of evidence suggests putative neuroprotective action of the hormone [
12,
13]. There is ongoing research to explore its therapeutic potential and the development of melatonin-related compounds for treating AD pathogenesis. However, the underlying mechanism associated with the beneficial effect of the melatonin system is still an area of ongoing research.
We reported earlier that simultaneous induction of melatonin deficiency by pinealectomy and AD-related pathogenesis by
icv infusion of Aβ
1-42 in rats provokes typical AD behavioral symptomatic alterations such as increased anxiety and cognitive disturbance [
10]. Demir et al. (2017) and Zhu et al. (2004) reported on the exacerbated impact of melatonin deficiencies on AD-like alterations and memory decline [
14,
15].
The idea that cerebrospinal fluid (CSF) melatonin levels decrease in the preclinical stages of AD when patients show no cognitive impairment [
8] suggests that melatonin deficiency might be a critical factor predisposing AD development. In the present study, we modified the reported earlier by our team model [
10] to simulate the preclinical stage of AD with a drop of melatonin blood level induced by pinealectomy to assess the efficacy of advanced prophylactic treatment with the hormone and the novel melatonin hybrid compound
3c on AD pathogenesis induced by a subsequent
icvAβ
1-42-infusion. The long-term supplementation with a high dose of melatonin (50 mg/kg for 40 days) reversed behavioral impairments and concomitant elevation of oxidative stress in the frontal cortex and the hippocampus [
10]. Melatonin may play a role in the modulation of spatial learning and memory, and its potential effects on these cognitive functions in AD models have been investigated in various studies [
16,
17,
18,
19]. The beneficial impact of the melatonin system on spatial memory might be associated with its potency to regulate impaired circadian rhythms, neuroprotection, antioxidant properties, and anti-inflammation. It is well known that the hippocampus is a brain region critical for spatial learning and memory. Melatonin receptors are present in the hippocampus [
20], and thereby, the hormone might affect synaptic plasticity and processes closely related to memory formation in this region.
Moreover, the modulatory role of melatonin on acetylcholine [
13], which neurotransmitter has a crucial role in cognition [
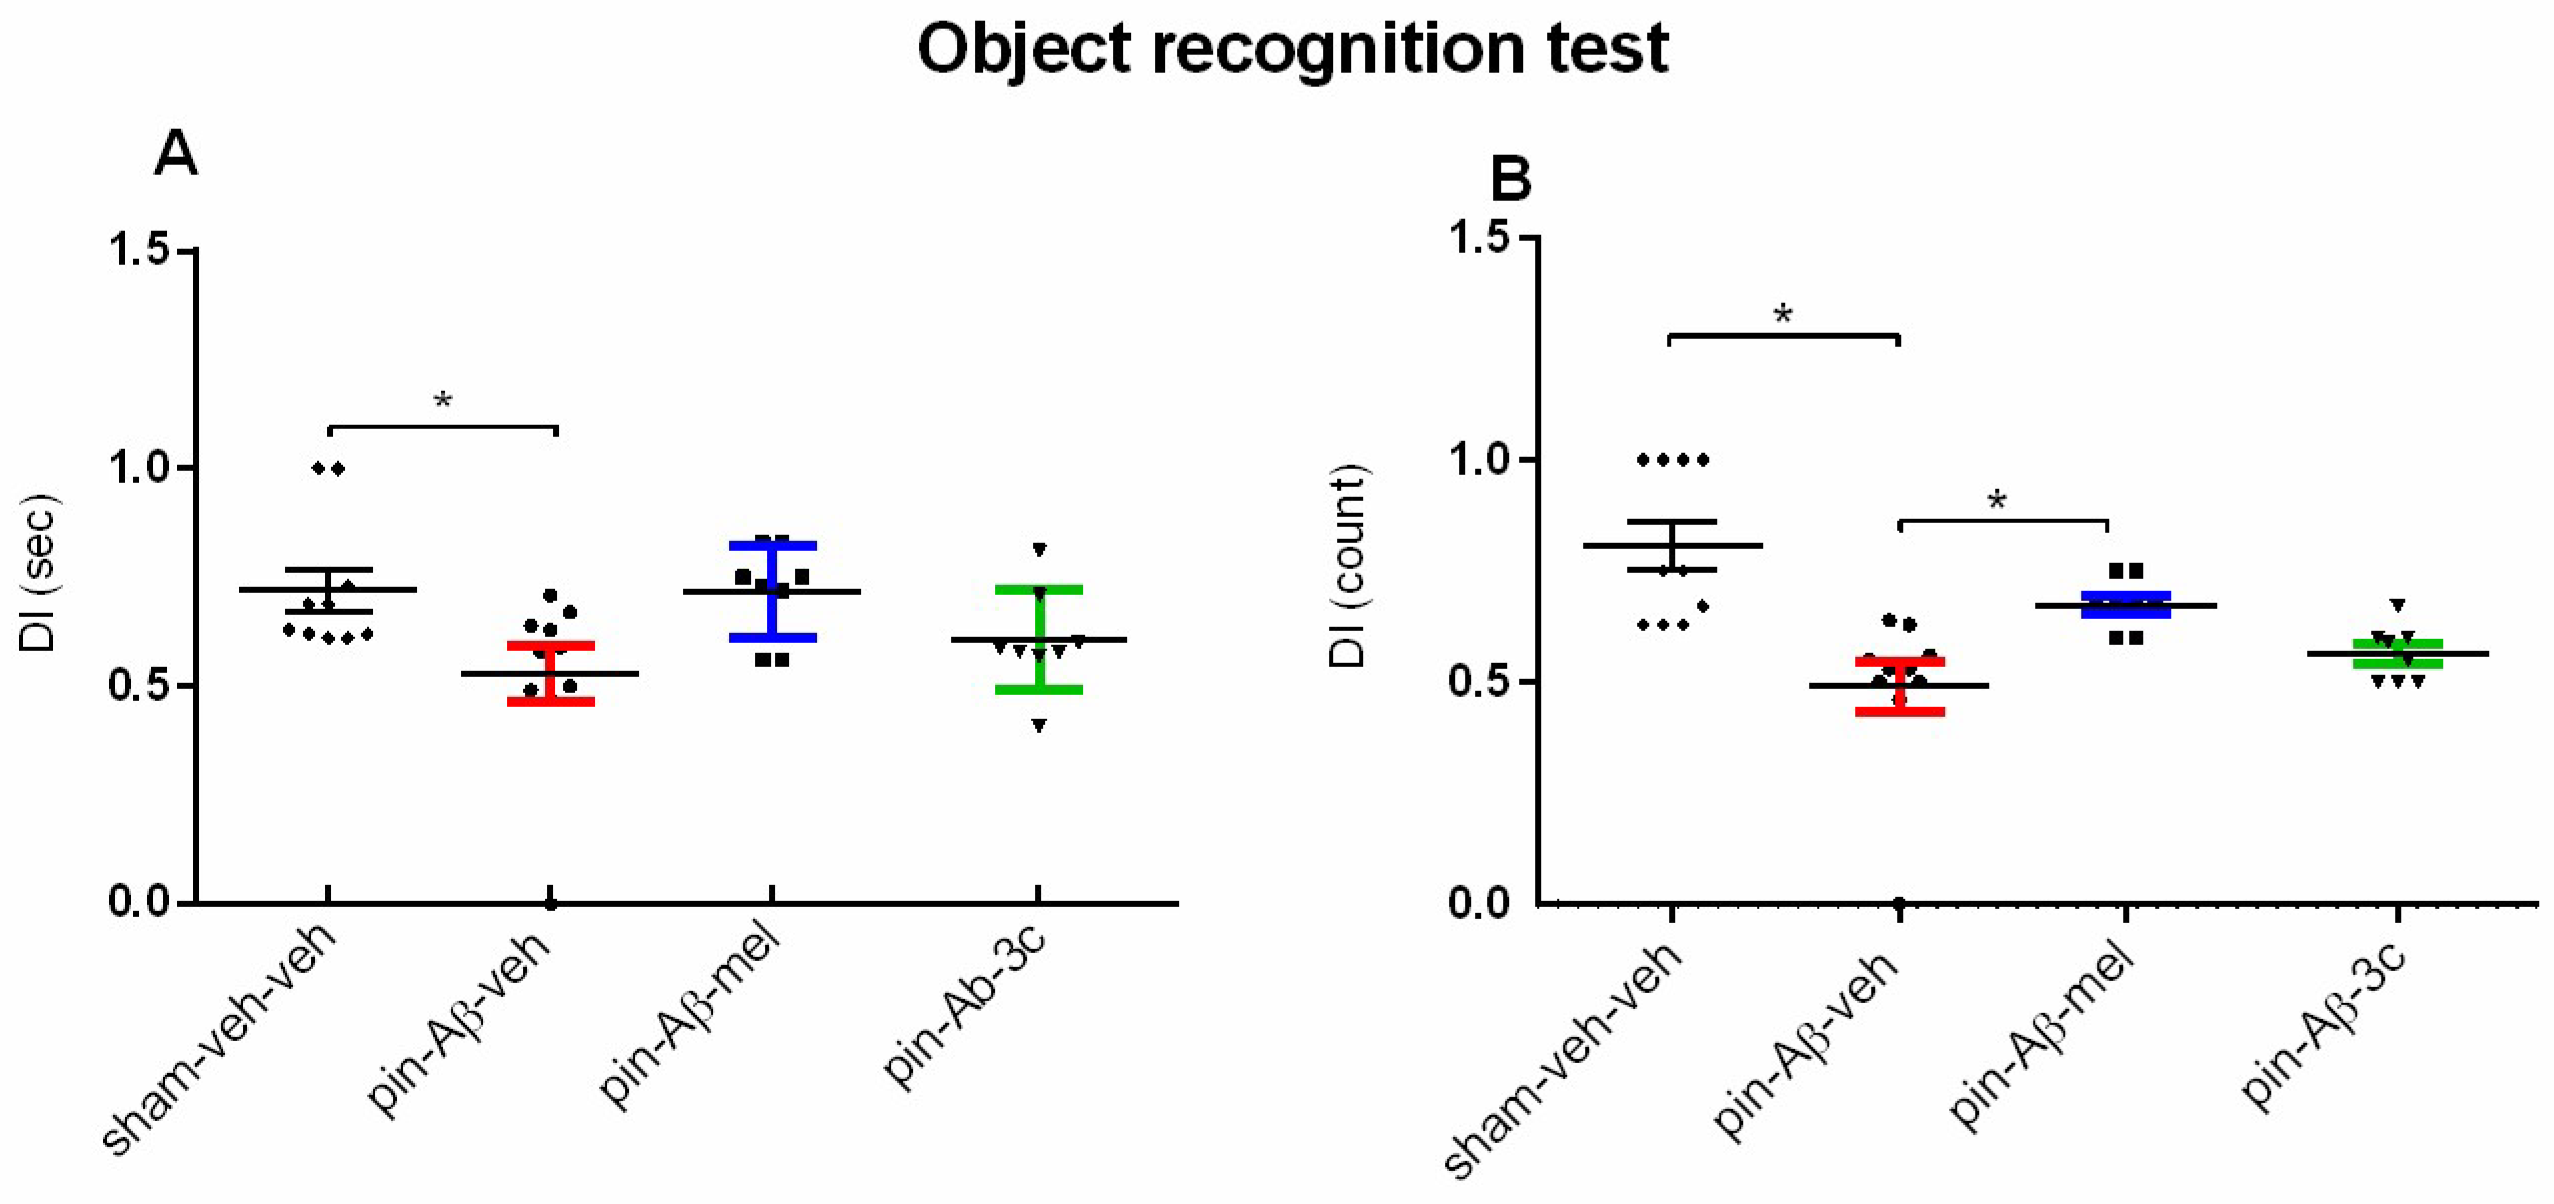
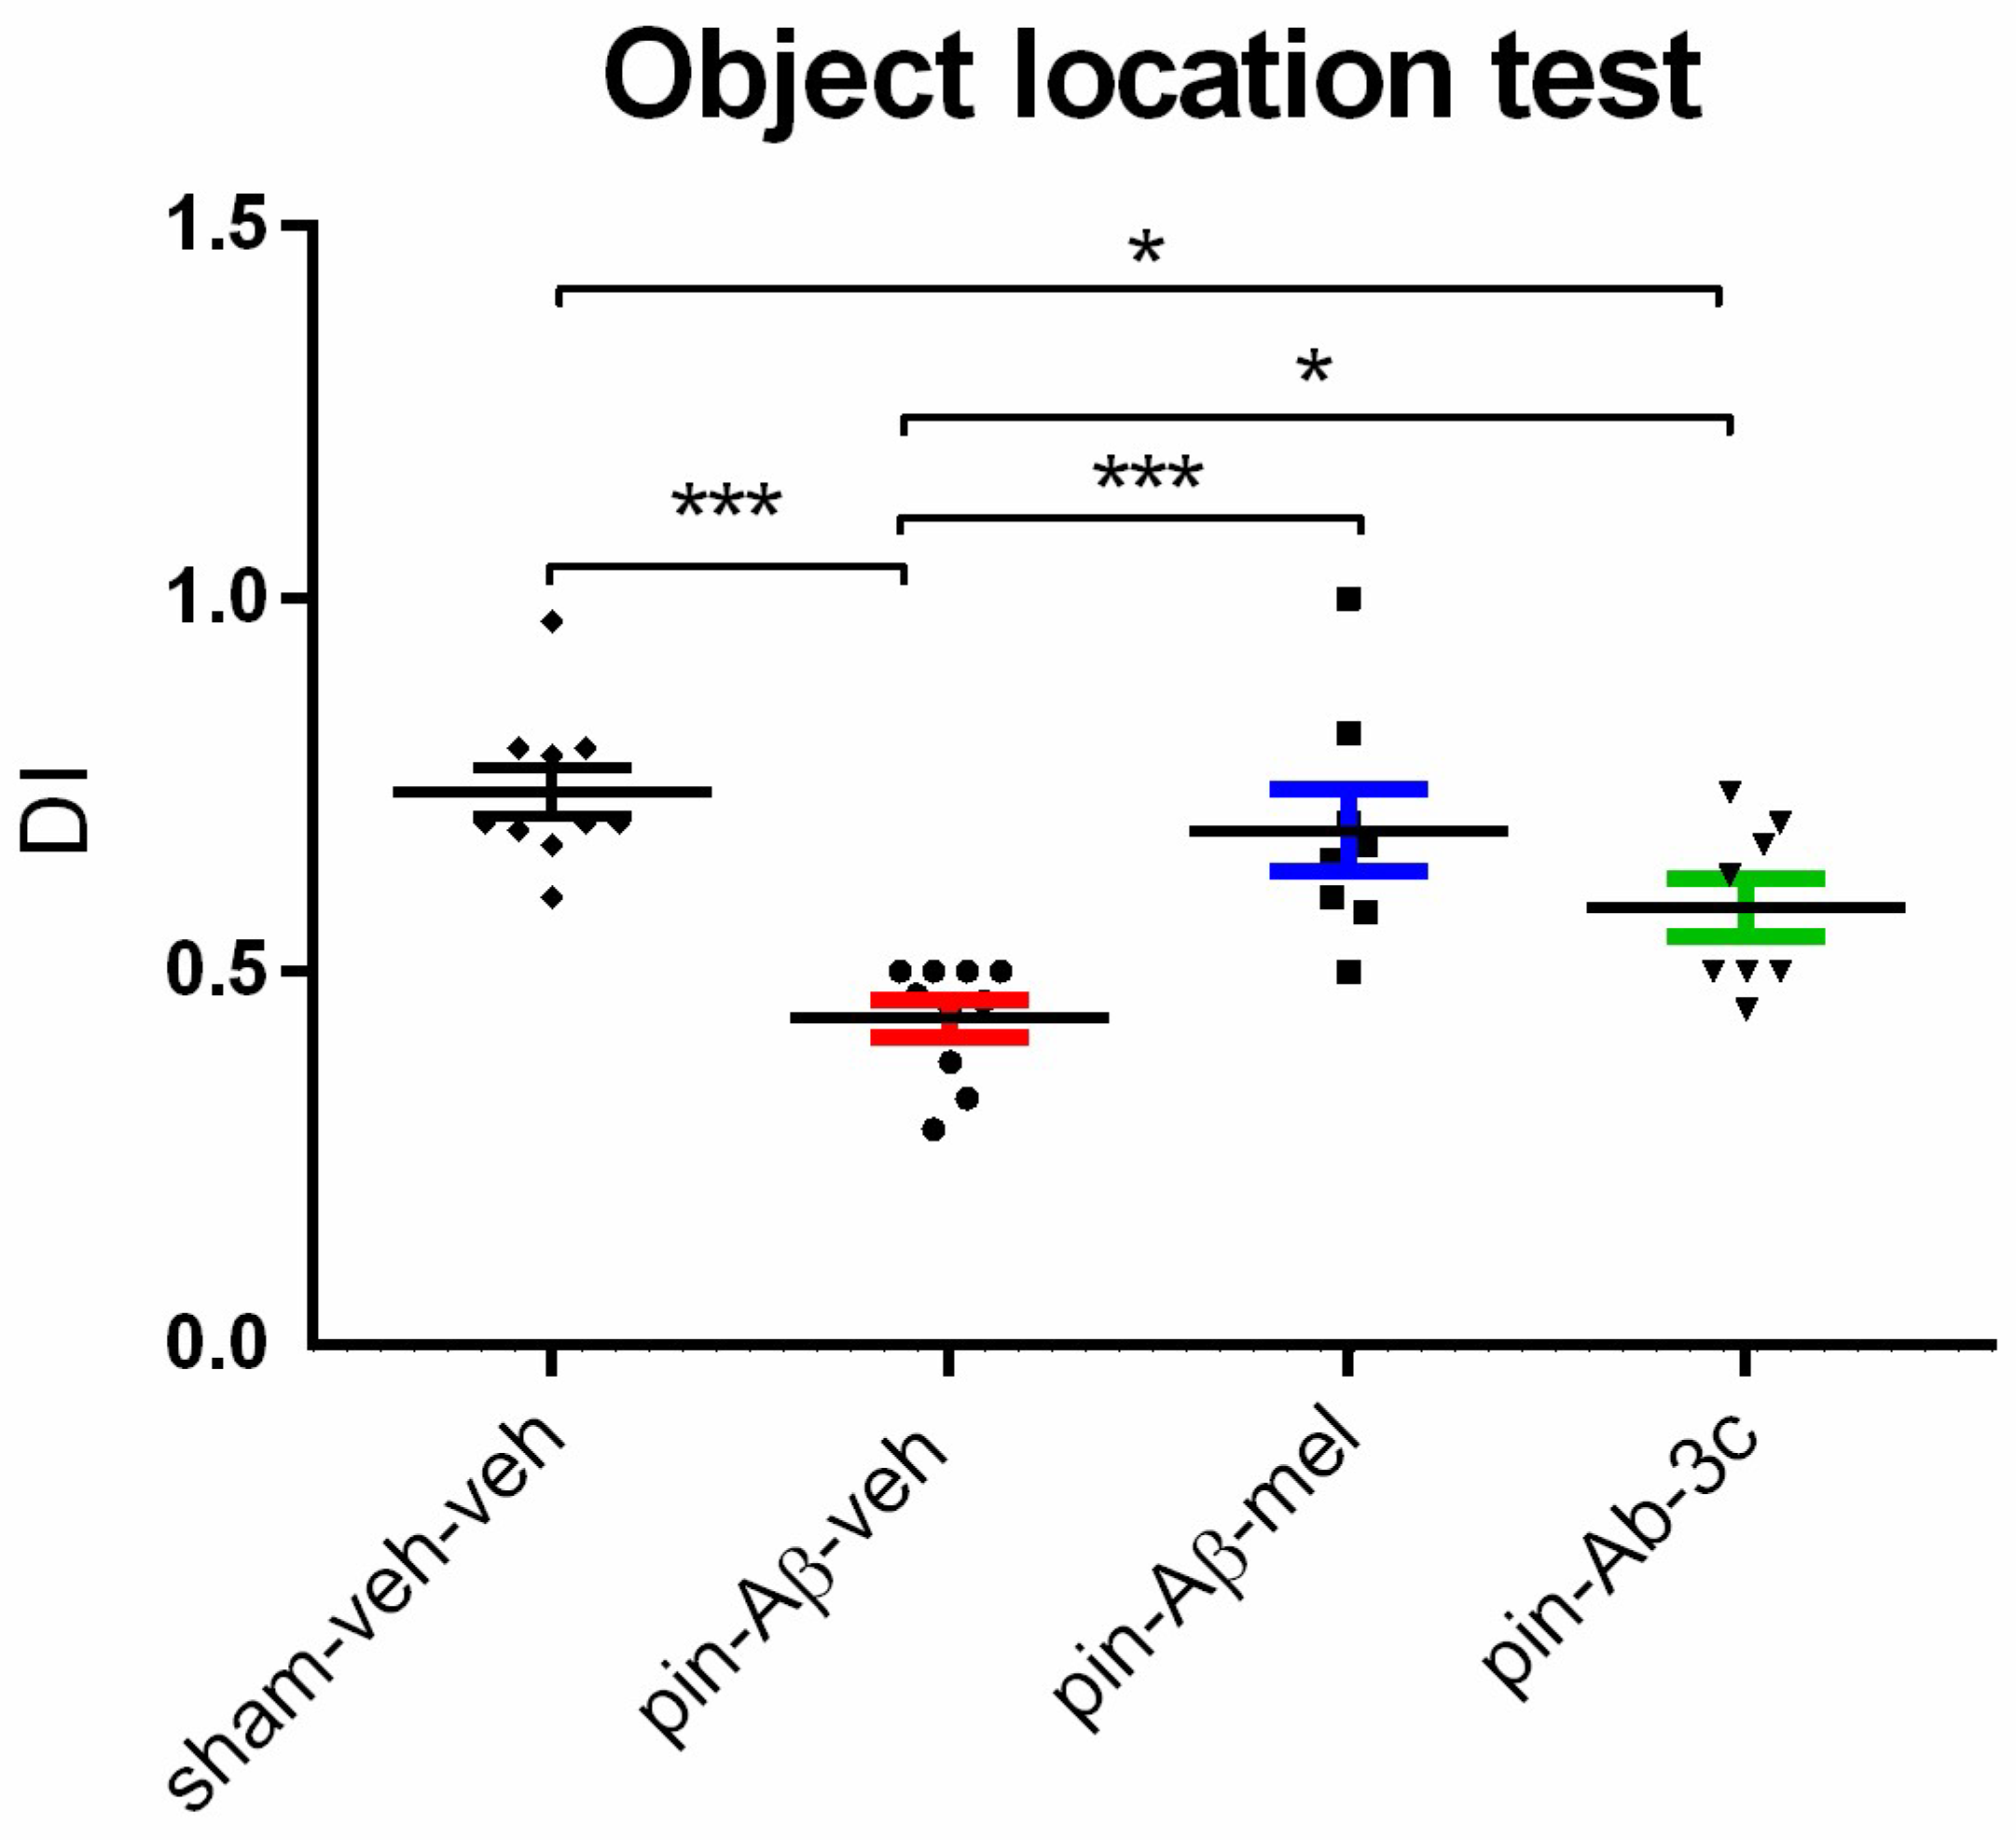
21], is also an essential factor suggesting the beneficial effects of melatonin on spatial memory. Our results revealed that while the novel hybrid compound
3c is ineffective against impaired nonspatial cognitive performance, such as the ORT in a rat model of pin+
icvAβ
1-42, this melatonin analog possesses a comparable to the positive control melatonin potency to correct the impaired short-term and spatial hippocampus-dependent memory. The beneficial role of melatonin supplementation on spatial memory decline was demonstrated in various models of AD, including the hereditary form of AD, such as mouse transgenic and knockout mice [
16,
22,
23], as well as sporadic form of AD, such as senescence-accelerated OXYS rats [
18], streptozotosin- [
24,
25] and
icvAβ
1-42-induced models [
26].
There is enough literature evidence to support the idea that the soluble Aβ oligomers and the total amount of Aβ, in particular, are responsible for progressive memory decline in AD [
27,
28], suggesting that these factors may be more critical than the formation of plaques in understanding the disease pathology. Both experimental reports from transgenic APP mice [
29,
30] and human brain tissue [
27,
28] demonstrated that cognitive changes appear before forming plaques, thereby supporting the presumption that soluble forms of Aβ may bring about cognitive impairment. Moreover, soluble Aβ oligomers, containing Aβ
1–40 or Aβ
1–42, detected in AD patients are assumed to contribute to the neurotoxicity associated with AD than Aβ deposits. Thereby, interventions focused on reducing or preventing the neurotoxicity associated with the soluble Aβ oligomers may be crucial for successive treatment of AD pathogenesis. To verify the model of melatonin deficiency induced by pinealectomy and subsequent
icvAβ
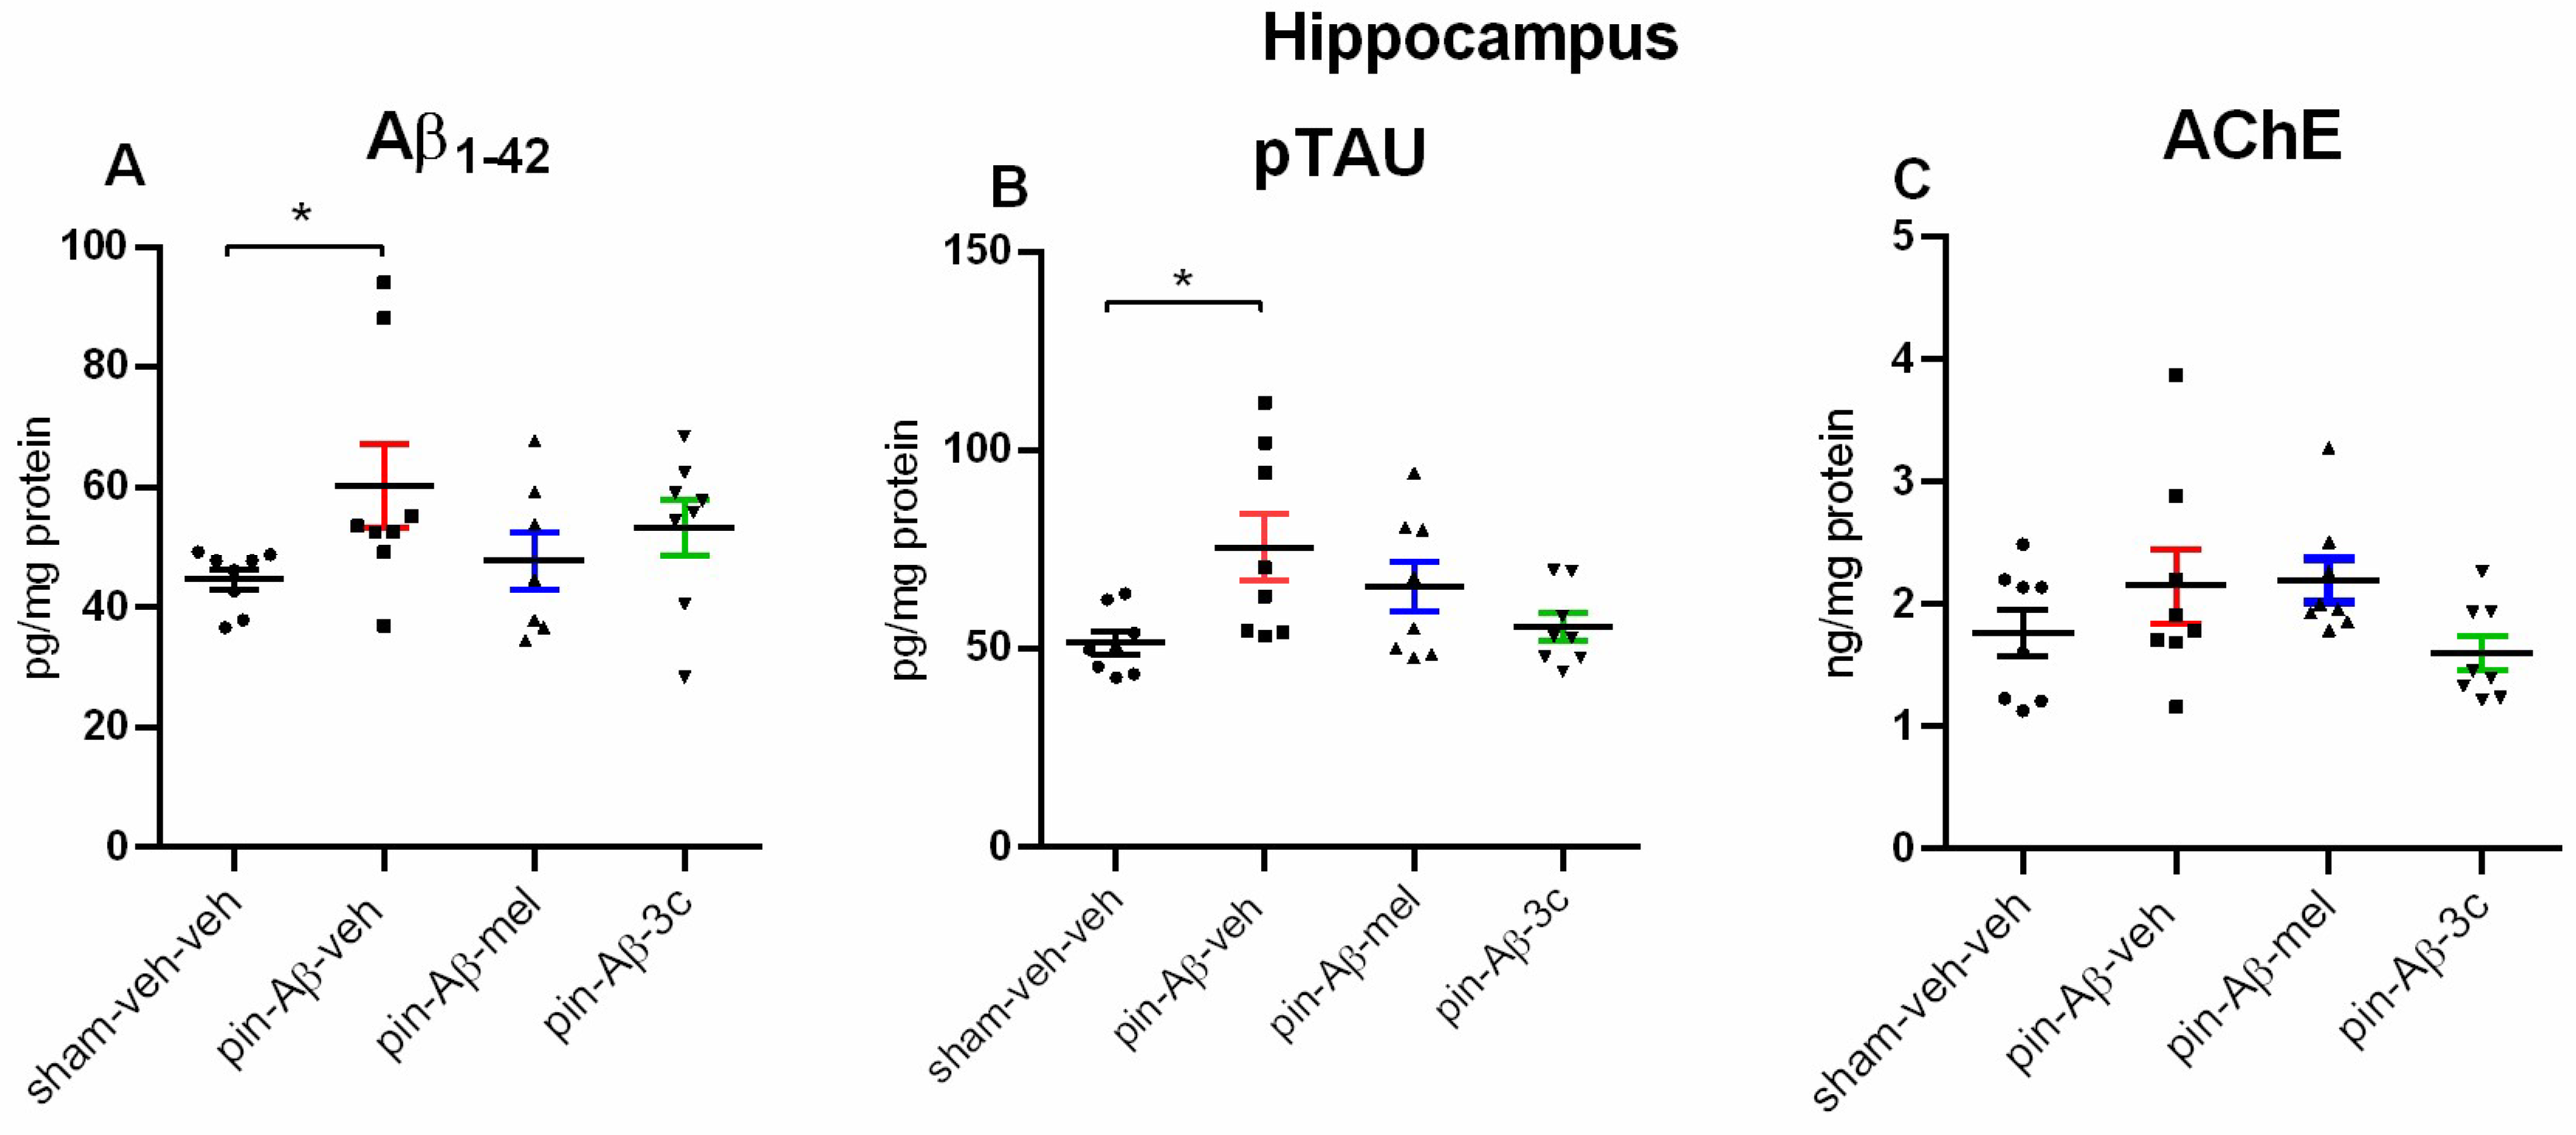
1–42 infusion, we first studied the expression of Aβ
1–42, pTAU, and the level of AchE in the hippocampus. The detected increase of Aβ
1–42 is in line with our previous report, where the pineal gland was removed simultaneously with the toxic oligomer infusion [
10].
Furthermore, in the present study, the pTAU was also confirmed to be significantly elevated in the hippocampus. The lack of difference between the control and model group for this standard marker associated with the pathogenesis of AD as concerns the AChE, may be related to the fact that we measured the levels but not the enzyme activity, which is a limitation of the study and might be taken into consideration in further studies. We can also speculate that in our model, the detected enzyme levels in the hippocampus were conducted before the formation of β-amyloid plaques, where the increased activity of AChE was reported [
31]. In addition, higher AChE activity in the vicinity of amyloid plaques was demonstrated to reinforce Aβ aggregation, making it more toxic than Aβ fibrils [
32]. The pretreatment with both the positive control melatonin and the
3c compound reduced to control level the model-induced increase in the Aβ and pTAU expression in the hippocampus of pin+Aβ
1-42 rats. Interestingly, both the Aβ
1-40 and Aβ
1-42 have a worsening impact on melatonin production and receptor signaling in cultured cells [
33]. Therefore, melatonin deficiency might be associated not only with a removal of the pineal gland but also exacerbated hormonal production in other tissues in the pin+
icvAβ
1–42 rat model.
Further, the underlying molecular mechanism of melatonin and
3c compound was explored and discussed. Accumulated evidence supports the hypothesis that melatonin can trigger the non-amyloidogenic processing of APP while suppressing the amyloidogenic processing, thus preventing the formation of neurotoxic Aβ oligomers and further accumulation of Aβ into plaques [
22]. The endogenous hormone stimulates the activity of alpha-secretases (ADAM10 and ADAM17) at the transcriptional level [
12,
34]. In contrast, melatonin suppresses amyloidogenic processing by downregulating beta-secretase (BACE1) (transcription, translation, and enzyme activity). Furthermore, diminished BACE1 activity keeps the cholinergic system intact and suppresses neuronal damage and memory decline in parallel with suppression of Aβ
40/42 production [
35,
36].
The neuroprotective effects of melatonin might be exerted through both receptor-dependent and receptor-independent mechanisms [
22]. The reduction in SIRT1 levels is negatively correlated with the duration of AD symptoms [
37,
38,
39]. Melatonin promotes the expression of SIRT1 in primary neurons shortly after exposure for up to 24 hours via receptor-independent mode [
40], suggesting that upregulation of SIRT1 may promote the expression of ADAM10 involved in non-amyloidogenic processing, thereby leading to reduced production of Aβ.
Melatonin can also exert its effects through MT
1 and MT
2 receptors, expressed jointly and individually in brain structures [
20,
41]. While the MT
1 receptor is widely distributed in various tissues, the MT
2 receptor is more restrictively distributed and is mainly found in the brain, including the hippocampus [
20]. Melatonin, through its plasma receptors, induces ERK1/2 phosphorylation via distinct signaling pathways, activating transcription factors such as CREB [
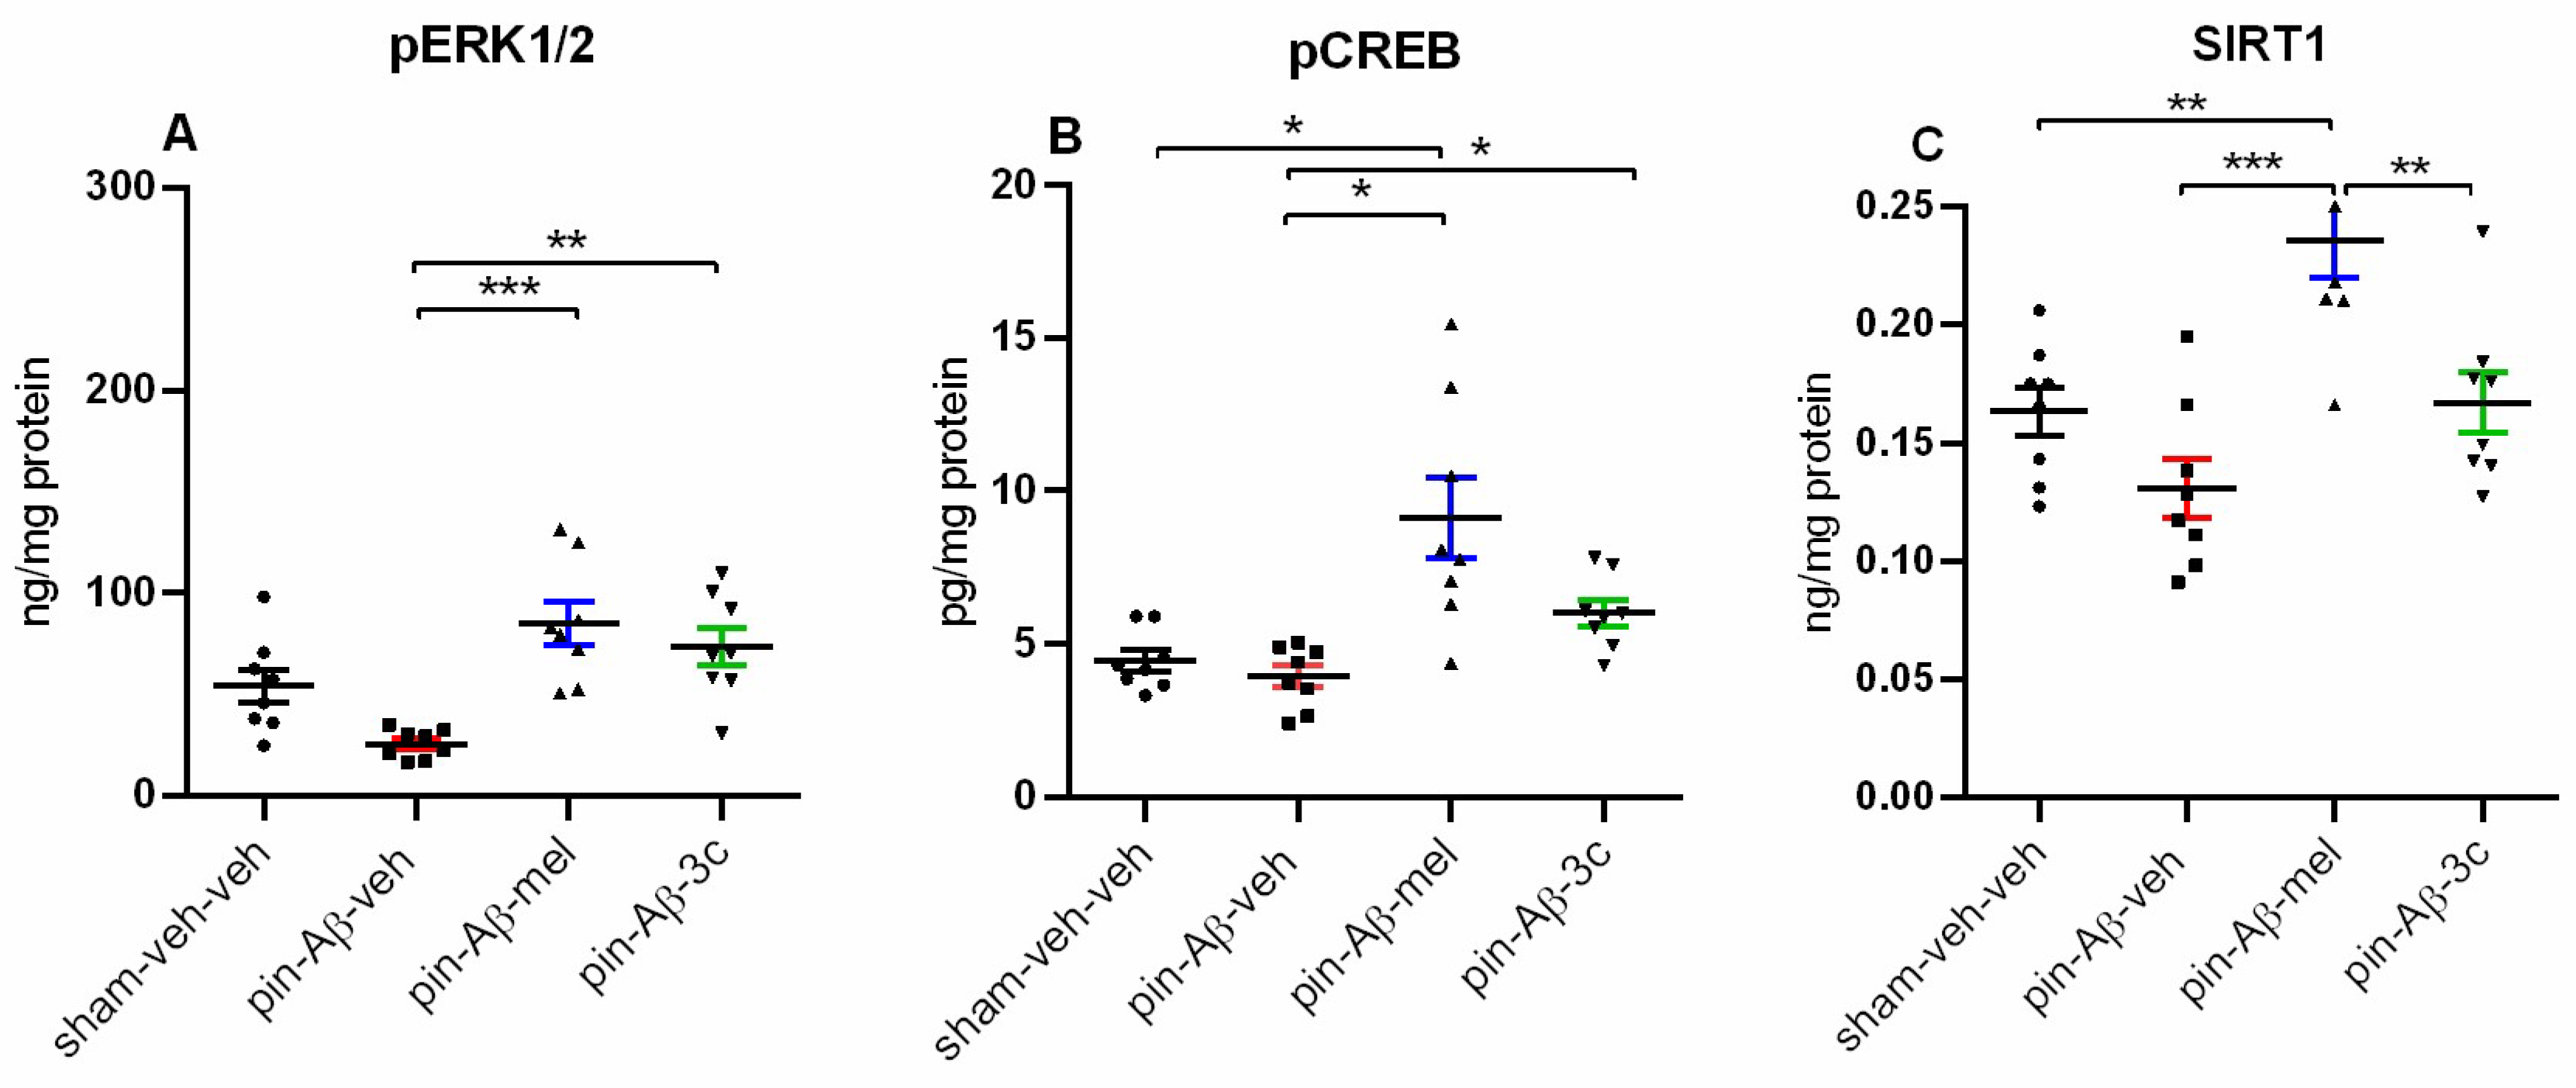
13]. Our results showed that while melatonin up-regulated the expression of SIRT1, the melatonin-related
3c compound was ineffective, suggesting that the hybrid compound could mimic the hormone effects mainly through MT receptor activation. Further, our results revealed that while melatonin and the
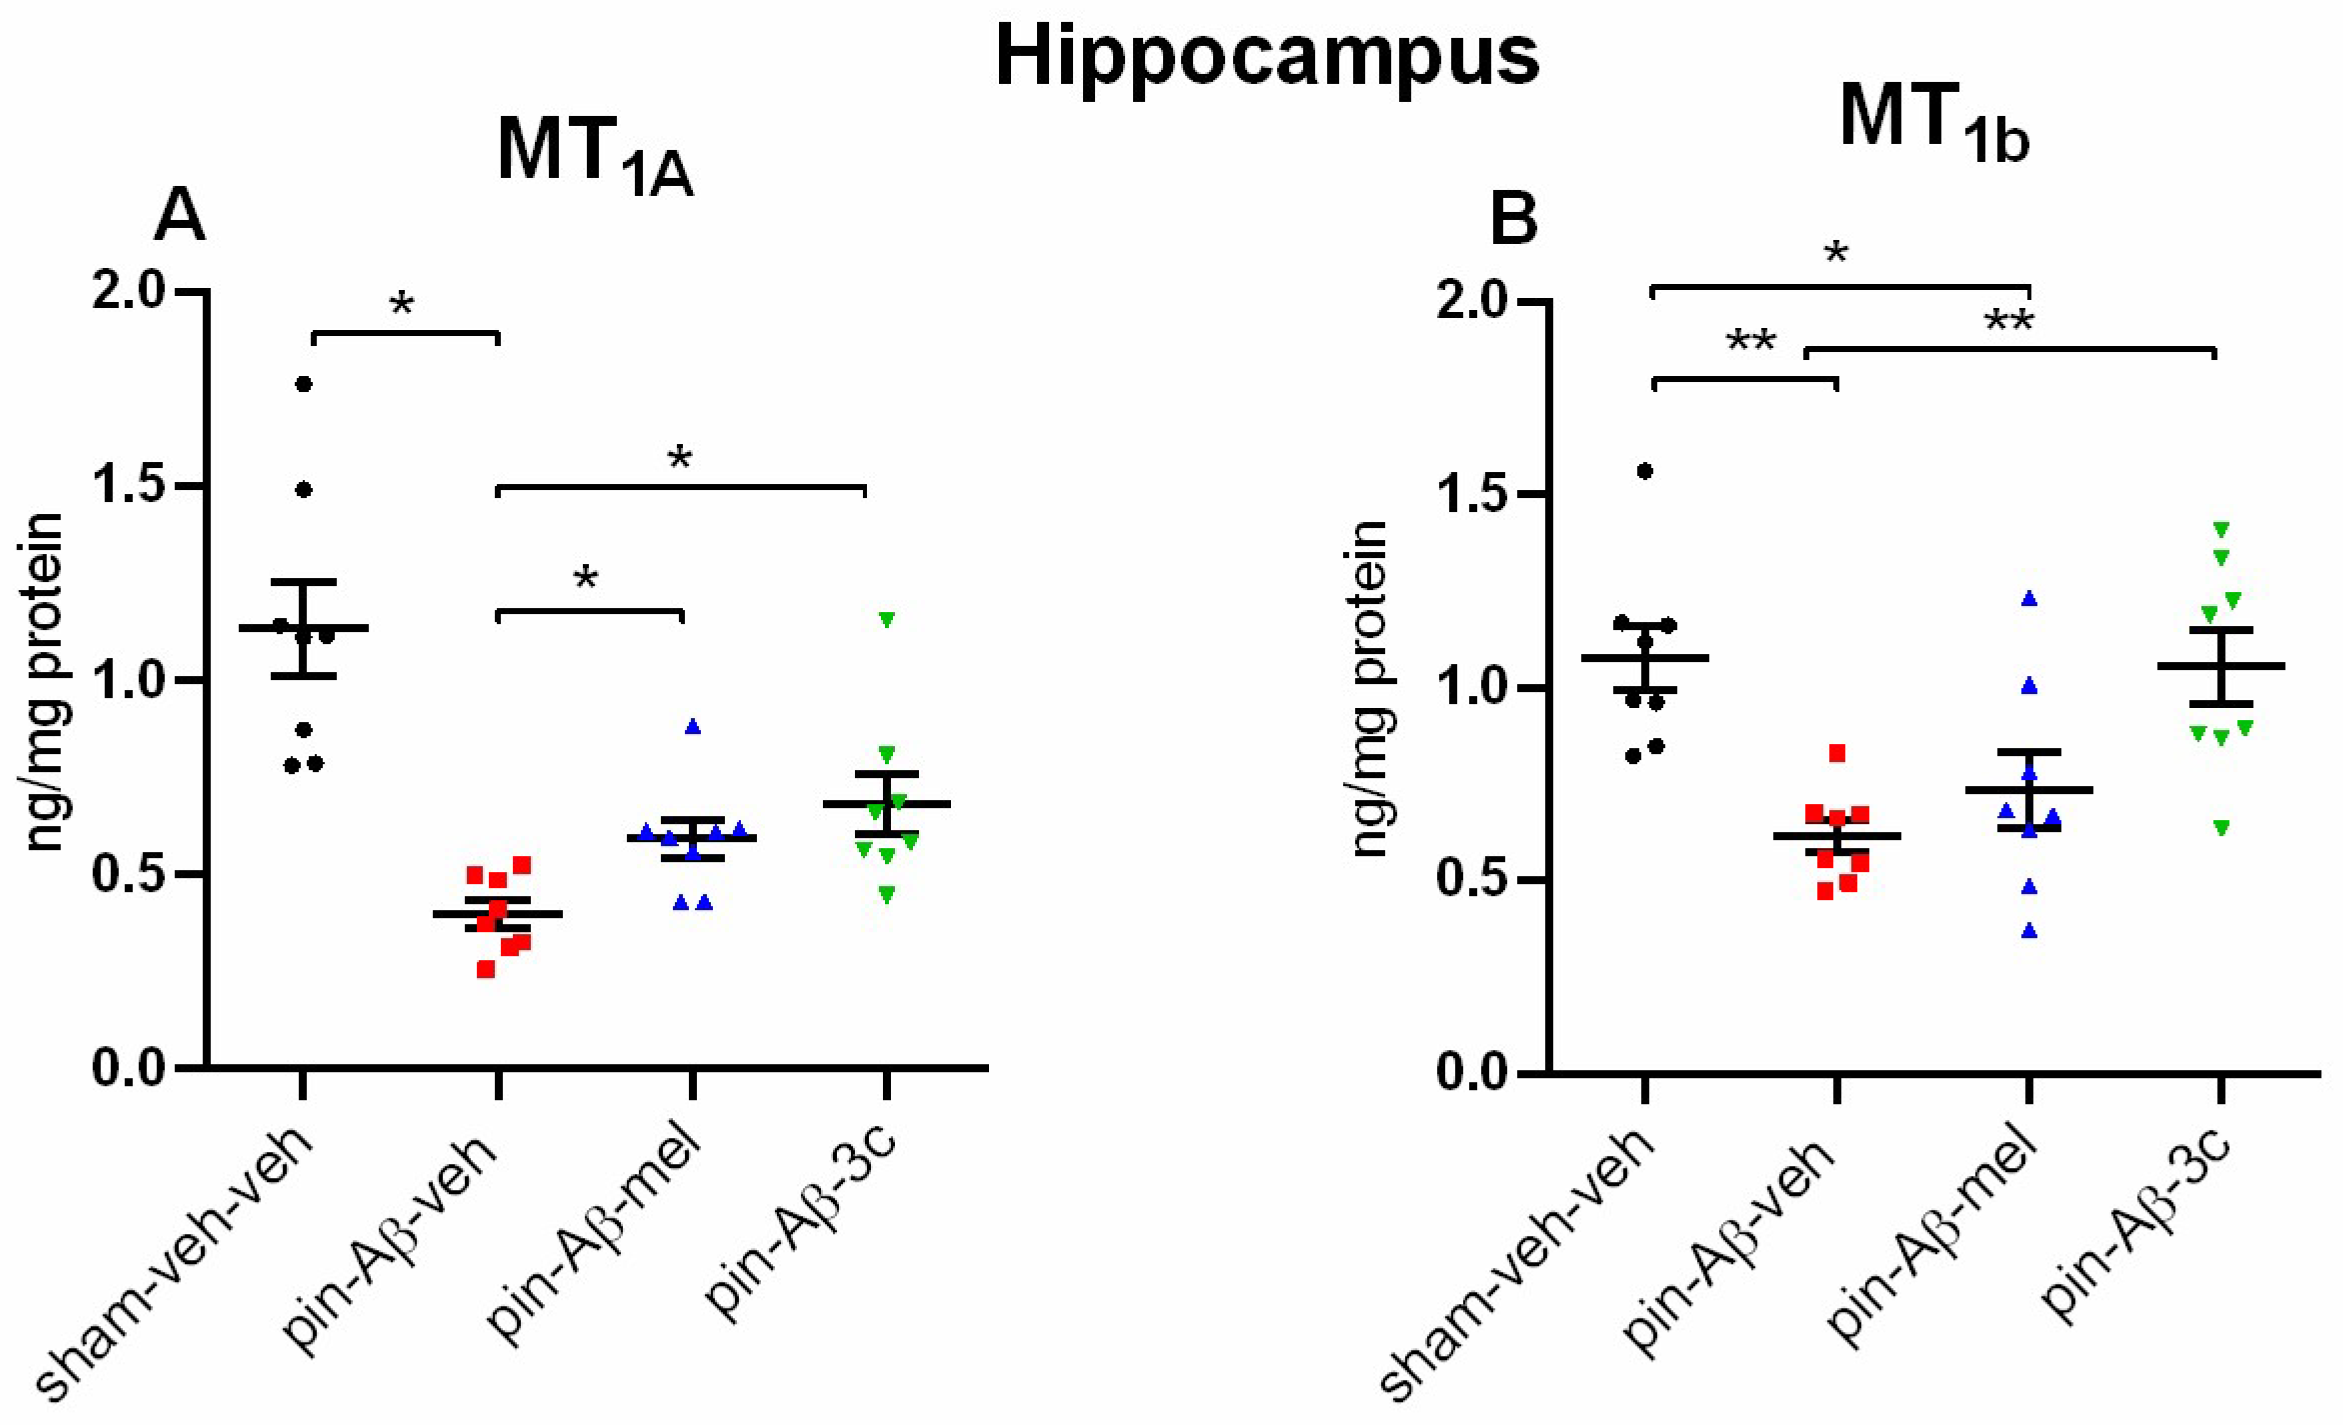
3c compound reversed the model-related down-regulation of MT
1A receptors in the hippocampus, only the novel melatonin-like hybrid corrected the Aβ-induced reduced MT
1B receptors. The positive impact of the two pretreatments (melatonin and
3c) on the pCREB expression suggests that the ERK1/2 / CREB signaling is the underlying mechanism involved in the protective effects of the two drugs against formation of Aβ via activation of MT
1A receptors (melatonin and
3c) and MT
2B (
3c). However, the role of SIRT1 in the effects of melatonin that might be realized via non-receptor mode cannot be excluded.
Figure 2.
Effect of control (sham-veh-veh) group (n = 8), Aβ
1-42-veh group (n = 7), Aβ
1-42-mel group (n = 7), and Aβ
1-42-
3c group (n = ) on 24-h motor activity measured in the actimeter. Data are presented as mean ± SEM. Repeated two-way ANOVA demonstrated a main Time effect [F
23,479 = 34,427, p < 0.001] as well as Group x Time interaction [F
69,479 = 1,422, p = 0.026] for the horizontal activity. A main Time effect [F
23,479 = 15,916, p < 0.001] was detected for the vertical activity.
Post hoc test showed in all groups higher horizontal (
Figure 1A) and vertical (
Figure 1B) activity in the zeitgeber (ZT) 12-23 (the dark period) compared to the ZT 0-11 (the light period). Further, a significant difference in activity was detected at ZT8-ZT19 (pin+Aβ
1-42-veh vs. sham-veh-veh group (p < 0.05) (
Figure 1B). On the right of the figures are inserted Cosinor data.
Figure 3.
Effect of sham-veh-veh group (n = 8), Aβ1-42-veh group (n = 7), Aβ1-42-mel group (n = 7), and Aβ1-42-3c group (n = 7) on daily rhythm of 24-h registered horizontal activity (counts) (A), vertical activity (B), distance (C) and mean velocity (D) measured in the actimeter. Open and black rectangles present the light and the dark phases above the figures. Data are presented as mean ± SEM, n = 7-8. Two-way ANOVA demonstrated a main Phase effect for horizontal activity [F3,56 = 133,318, p < 0.001], a main Phase [F1,55 = 64.475, p < 0.001], Treatment [F3,56 = 6. 519, p = 0.001] as well as Phase x Treatment interaction [F3,56 = 6.273, p = 0.001] for vertical activity, a main Phase [F1,55 = 21.866, p < 0.001] and Phase x Treatment interaction [F3,56 = 18.262, p < 0.001] for distance, and a main Phase effect [F1,56 = 100.719, p < 0.001] for mean velocity. ###p < 0.001, #p < 0.05, dark vs. light phase (A-D); *p = 0.03, pin+Aβ1-42-veh group vs. sham-veh-veh (A); ***p < 0.001, pin+Aβ1-42-veh-mel group vs. pin+Aβ1-42-veh group (B).
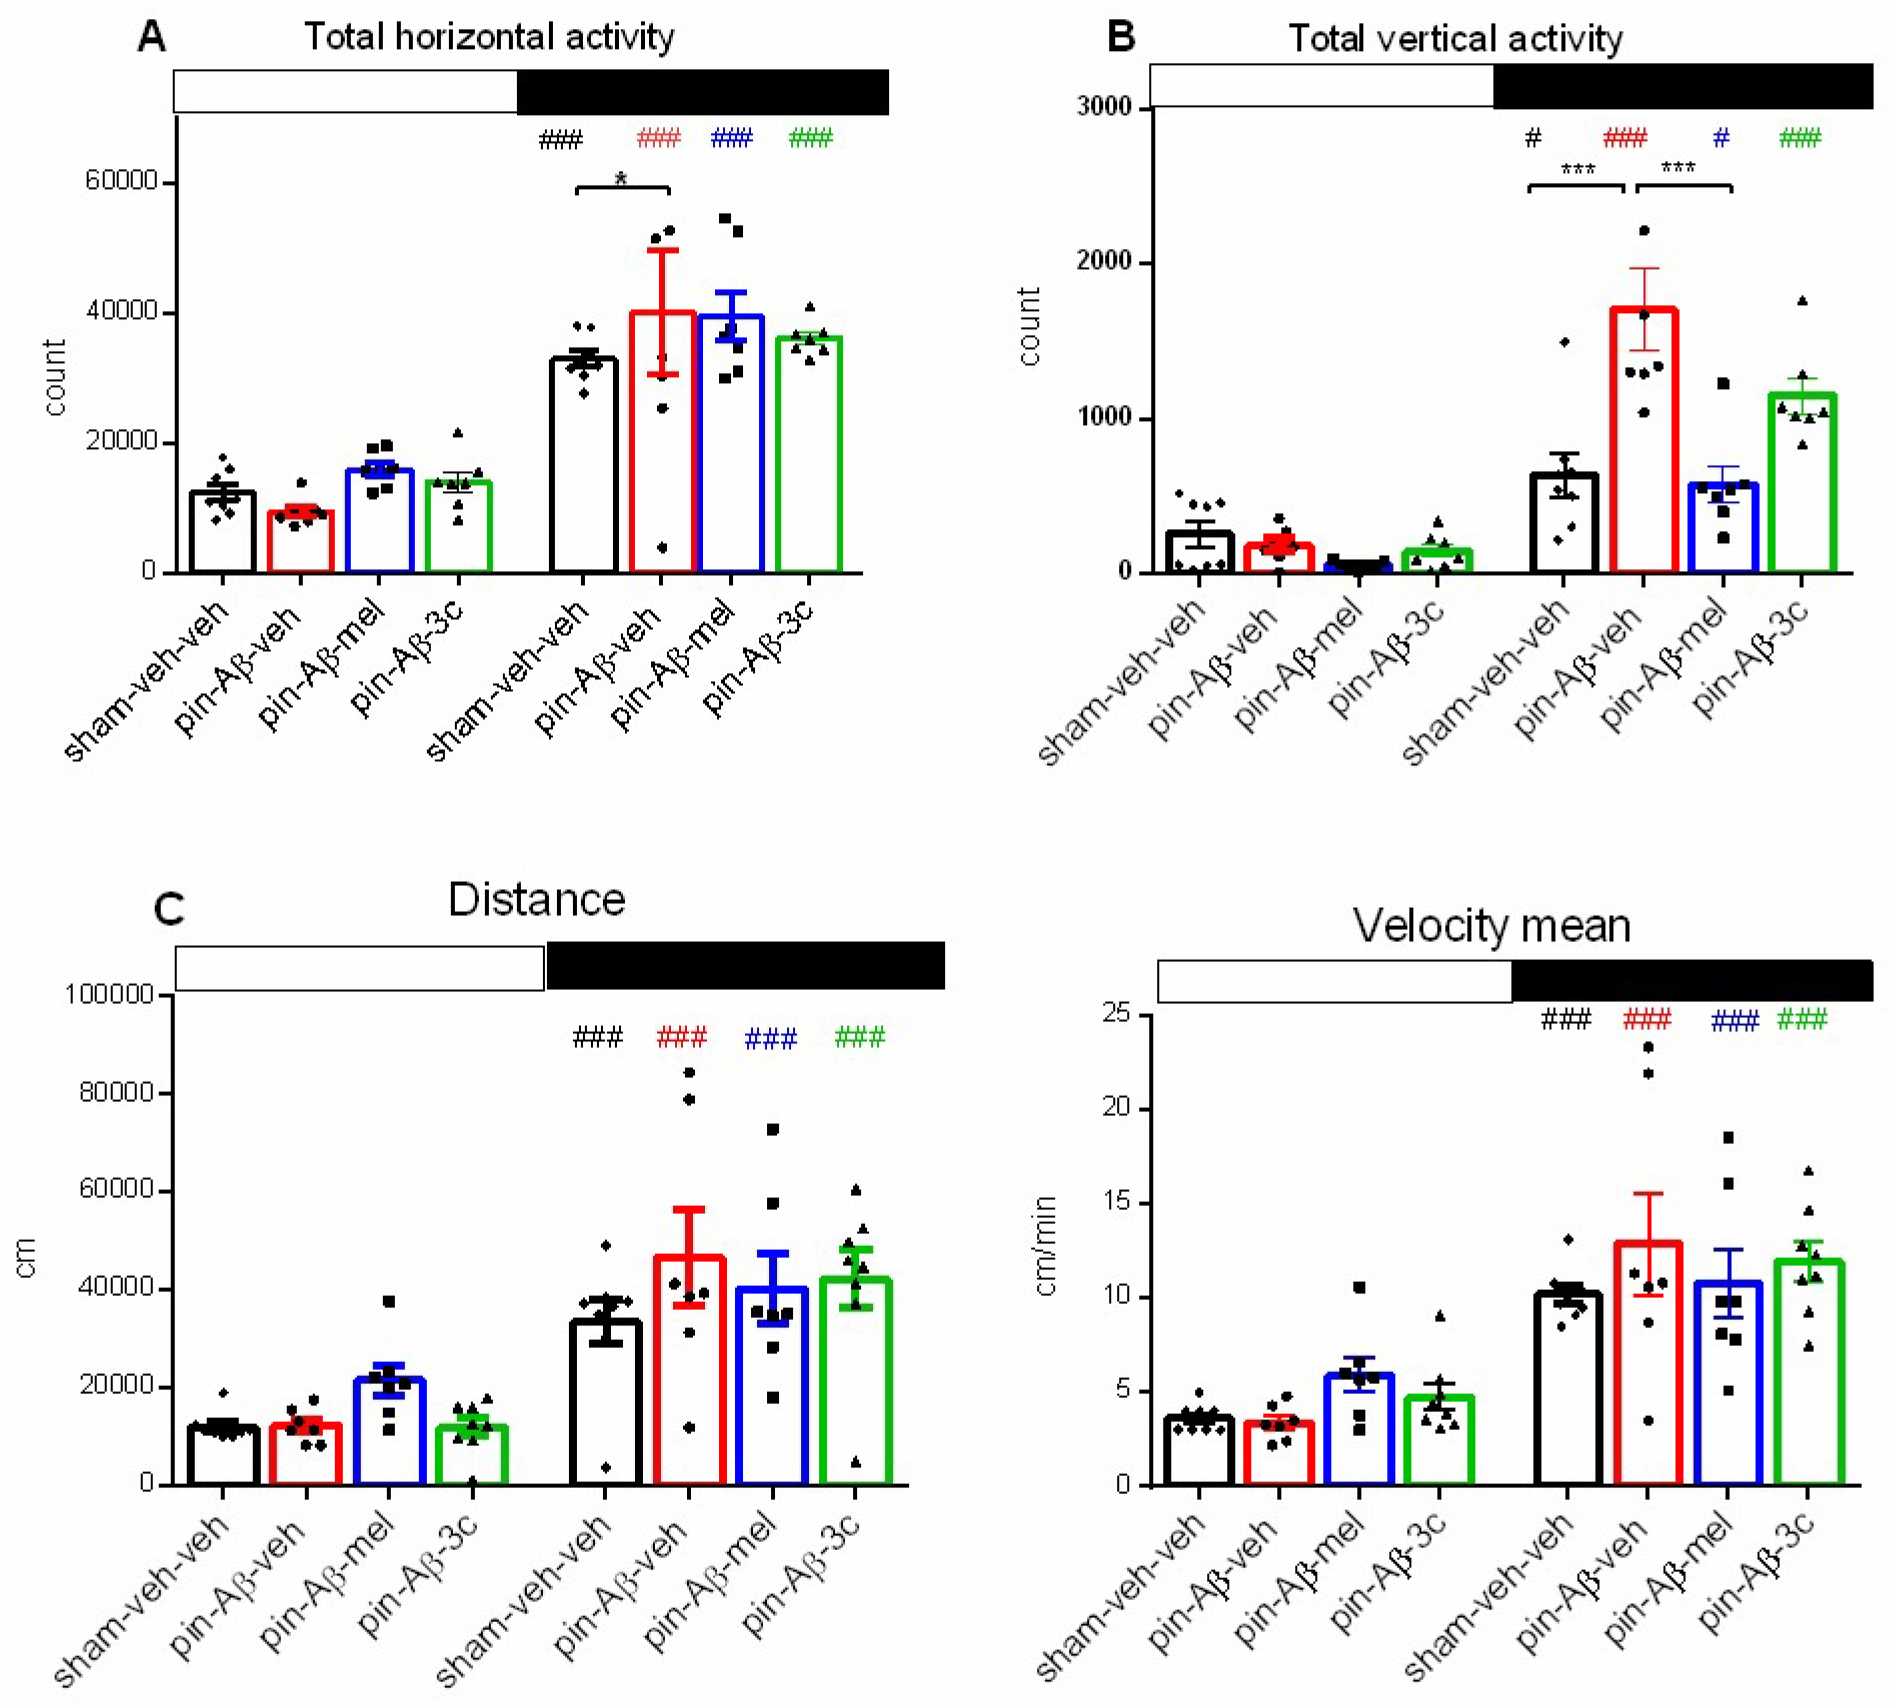
Figure 4.
Effect of control (sham-veh-veh) group, pin-Aβ1-42-veh group, pin-Aβ1-42-mel group, and pin-Aβ1-42-3c group on short-term recognition memory tested in the object recognition test. Data are presented as the mean ± SEM. The Kruskal-Wallis analysis revealed a main Group effect [H = 9.366, p = 0.025] for DI (sec) and [H = 21.933, p < 0.001] for DI (count); *p = 0.028, pin-Aβ1-42-veh group vs. sham-veh-veh group (A); *p = 0.05, pin-Aβ1-42-veh group vs. sham-veh-veh group; *p = 0.05, pin-Aβ1-42-mel group vs. pin-Aβ1-42-veh group (B) (n = 8-10).
Figure 5.
Effect of control (sham-veh-veh) group, pin-Aβ1-42-veh group, pin-Aβ1-42-mel group, and pin-Aβ1-42-3c group on short-term spatial memory tested in the object location test. Data are presented as the mean ± SEM. The one-way ANOVA revealed a main Group effect [F3,35 = 11,367, p < 0.001]; ***p < 0.001, pin-Aβ1-42-veh group vs. sham-veh-veh group; ***p < 0.001, pin-Aβ1-42-veh group vs. pin-Aβ1-42-mel; *p = 0.024, pin-Aβ1-42-3c vs. sham-veh-veh group; *p = 0.047, pin-Aβ1-42-3c vs. pin-Aβ1-42-veh group (n = 8 - 10).
Figure 6.
Effect of control (sham-veh-veh), pin-Aβ1-42-veh, pin-Aβ1-42-mel, and pin-Aβ1-42-3c on Spontaneous alternation behavior (SAB) (in percent) in the Ist trial (A), DI (sec) (B) and DI (count) (C), respectively, in the IInd trial in the Y-maze task. Data are presented as the mean ± SEM. The one-way ANOVA demonstrated a main Group effect [F3,35 = 10,054, p < 0.001] for SAB; a main Group effect [F3,35 = 25,859, p < 0.001] for DI(time) and [H = 16,521, p < 0.001] for DI (counts) (Kruskal-Wallis test); ***p < 0.001, pin-Aβ1-42-veh group vs. sham-veh-veh group; *p = 0.02, pin-Aβ1-42-veh group vs. pin-Aβ1-42-mel group; ***p < 0.001 pin-Aβ1-42-veh group vs. pin-Aβ1-42-3c group (A); ***p < 0.001, pin-Aβ1-42-veh group vs. sham-veh-veh group; ***p < 0.01, pin-Aβ1-42-veh group vs. pin-Aβ1-42-mel group; ***p < 0.001 pin-Aβ1-42-3c group vs. sham-veh-veh group;*p = 0.036, pin-Aβ1-42-3c group vs. pin-Aβ1-42-veh group (B); ***p < 0.001, pin-Aβ1-42-veh group vs. sham-veh-veh group; **p = 0.002, pin-Aβ1-42-veh group vs. pin-Aβ1-42-mel and pin-Aβ1-42-3c group, respectively (C) (n = 8 - 10).
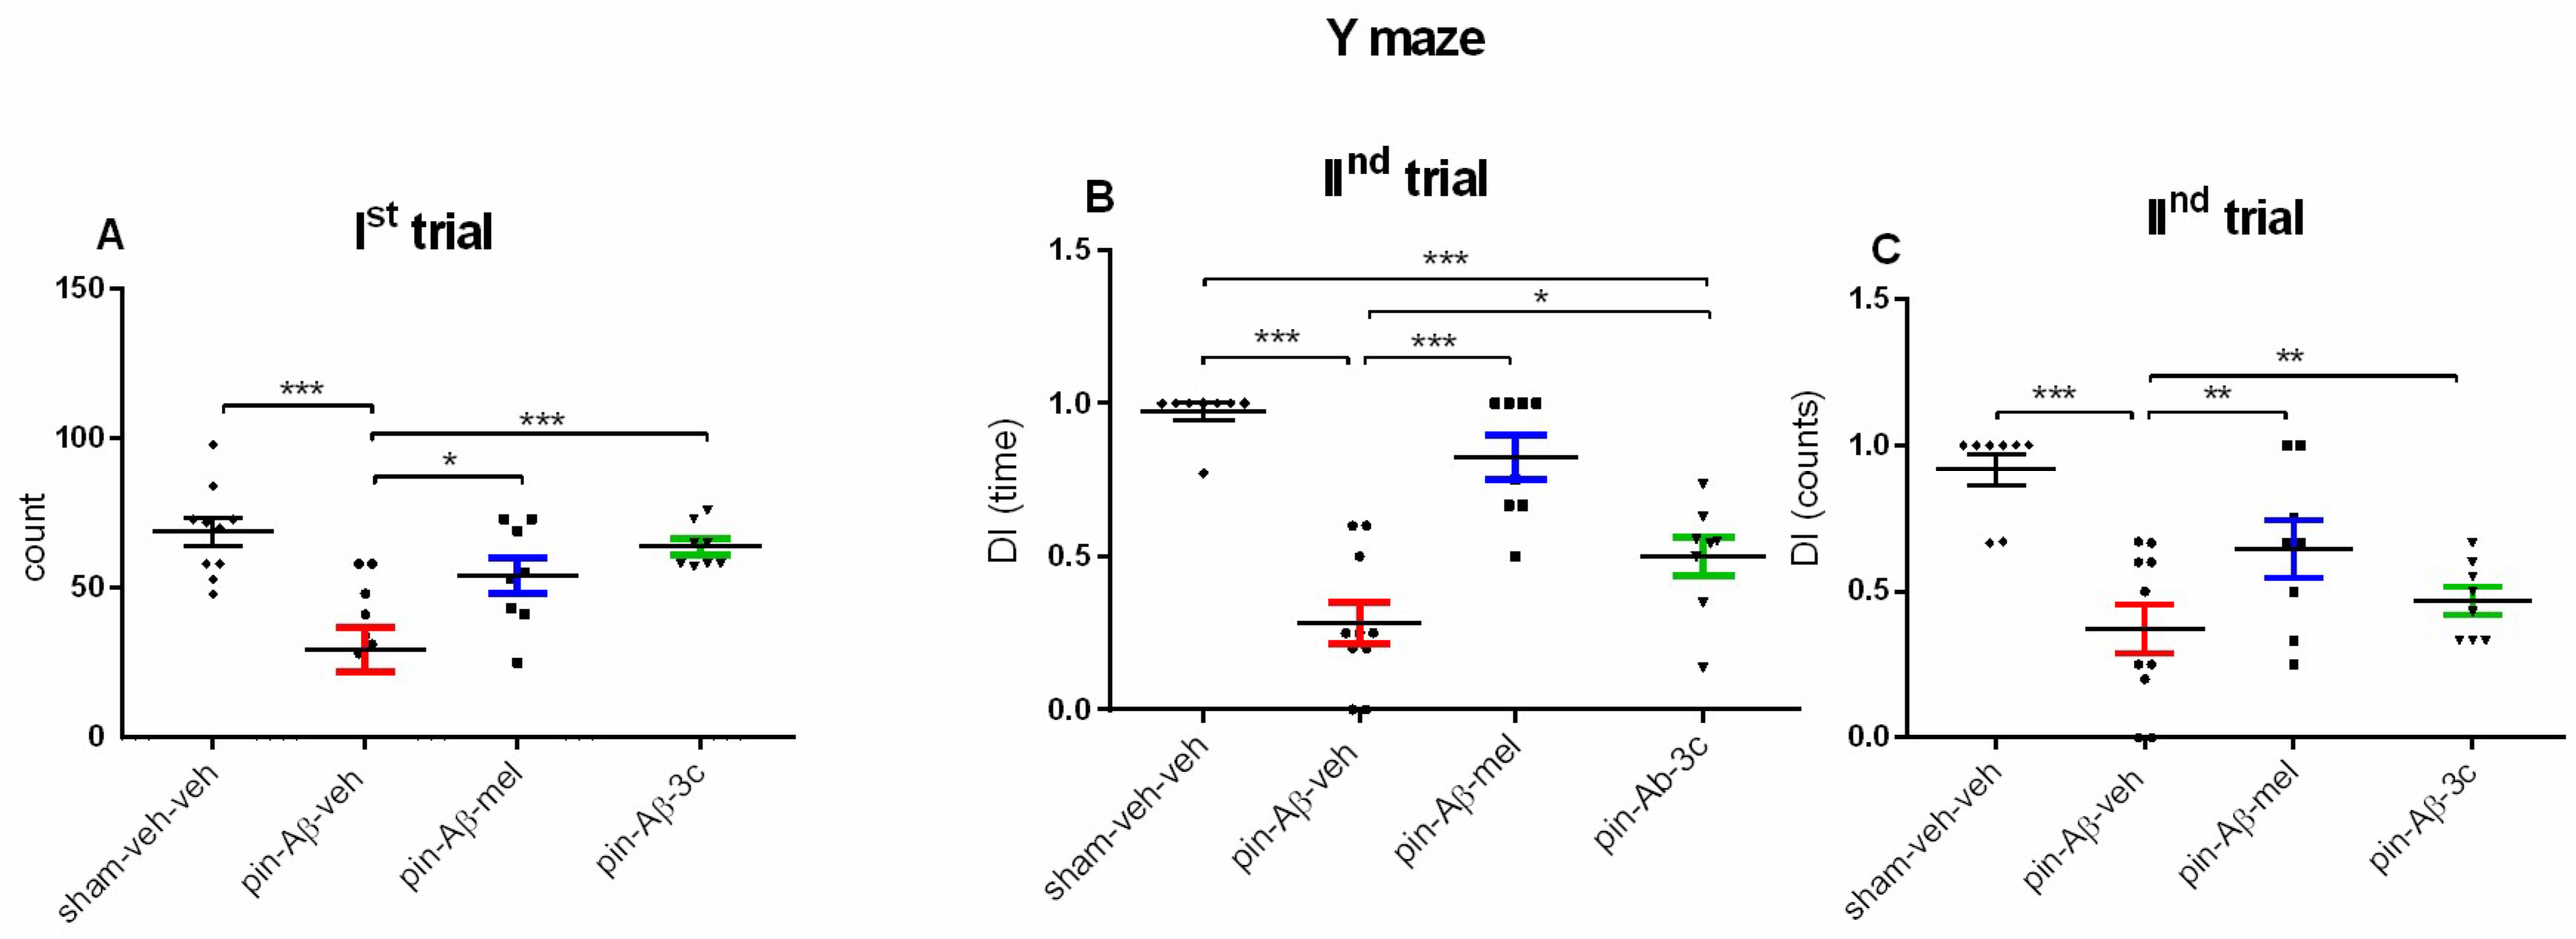
Figure 7.
Effect of control (sham-veh-veh), pin-Aβ1-42-veh, pin-Aβ1-42-mel, and pin-Aβ1-42-3c on Aβ1-42 protein expression (A), p-TAU protein expression (B) and AchE level (C) in the hippocampus measured by the ELISA. Data are presented as the mean ± SEM. The one-way ANOVA demonstrated a main Group effect [F3,31 = 3,125, p = 0.042] for Aβ1-42 protein, and [H = 8,936, p = 0.03] (Kruskal-Wallis test) for pTAU protein; *p = 0.035, pin-Aβ1-42-veh group vs. sham-veh-veh group (A); *p = 0.049, pin-Aβ1-42-veh group vs. sham-veh-veh group (B) (n = 8).
Figure 8.
Effect of control (sham-veh-veh), pin-Aβ1-42-veh, pin-Aβ1-42-mel, and pin-Aβ1-42-3c on MT1A (A) and MT2B (B) receptor subtypes in the hippocampus, measured by the ELISA. Data are presented as the mean ± SEM. The one-way ANOVA demonstrated a main Group effect [H = 21,361, p < 0.001] (Kruskal-Wallis test) for MT1A and [F3,31 = 7,771, p < 0.001] (Shapiro-Wilk test) for MT2B receptor subtype; *p < 0.05, pin-Aβ1-42-veh group vs. sham-veh-veh group, pin-Aβ1-42-mel and pin-Aβ1-42-3c, respectively (A); **p = 0.003, pin-Aβ1-42-veh group vs. sham-veh-veh group; *p = 0.027, pin-Aβ1-42-mel group vs. sham-veh-veh group; **p = 0.004, pin-Aβ1-42-3c group vs. pin-Aβ1-42-veh group (B) (n = 8).
Figure 9.
Effect of control (sham-veh-veh), pin-Aβ1-42-veh, pin-Aβ1-42-mel, and pin-Aβ1-42-3c on pERK 1/2 (A), pCREB (B), and SIRT1 (C) expression in the hippocampus, measured by the ELISA. Data are presented as the mean ± SEM. The one-way ANOVA demonstrated a main Group effect [F3,31 = 10,069, p < 0.001] (Shapiro-Wilk) for pERK1/2; [H = 17,782, p < 0.001] (Kruskal-Wallis test) for pCREB, [F3,31 = 11,774, p < 0.001] (Shapiro-Wilk) for SIRT1;. ***p < 0.001, pin-Aβ1-42-mel group vs pin-Aβ1-42-veh group; **p = 0.002, pin-Aβ1-42-3c group vs pin-Aβ1-42-veh group (A); *p < 0.05, pin-Aβ1-42-mel group vs sham-veh-veh and pin-Aβ1-42-veh group; *p < 0.05, pin-Aβ1-42-3c group vs pin-Aβ1-42-veh group (B); ***p < 0.001, pin-Aβ1-42-mel group vs. pin-Aβ1-42-veh group; **p = 0.007, pin-Aβ1-42-mel group vs. sham-veh-veh group; **p = 0.002, pin-Aβ1-42-mel group vs. pin-Aβ1-42-3c group. .
Figure 10.
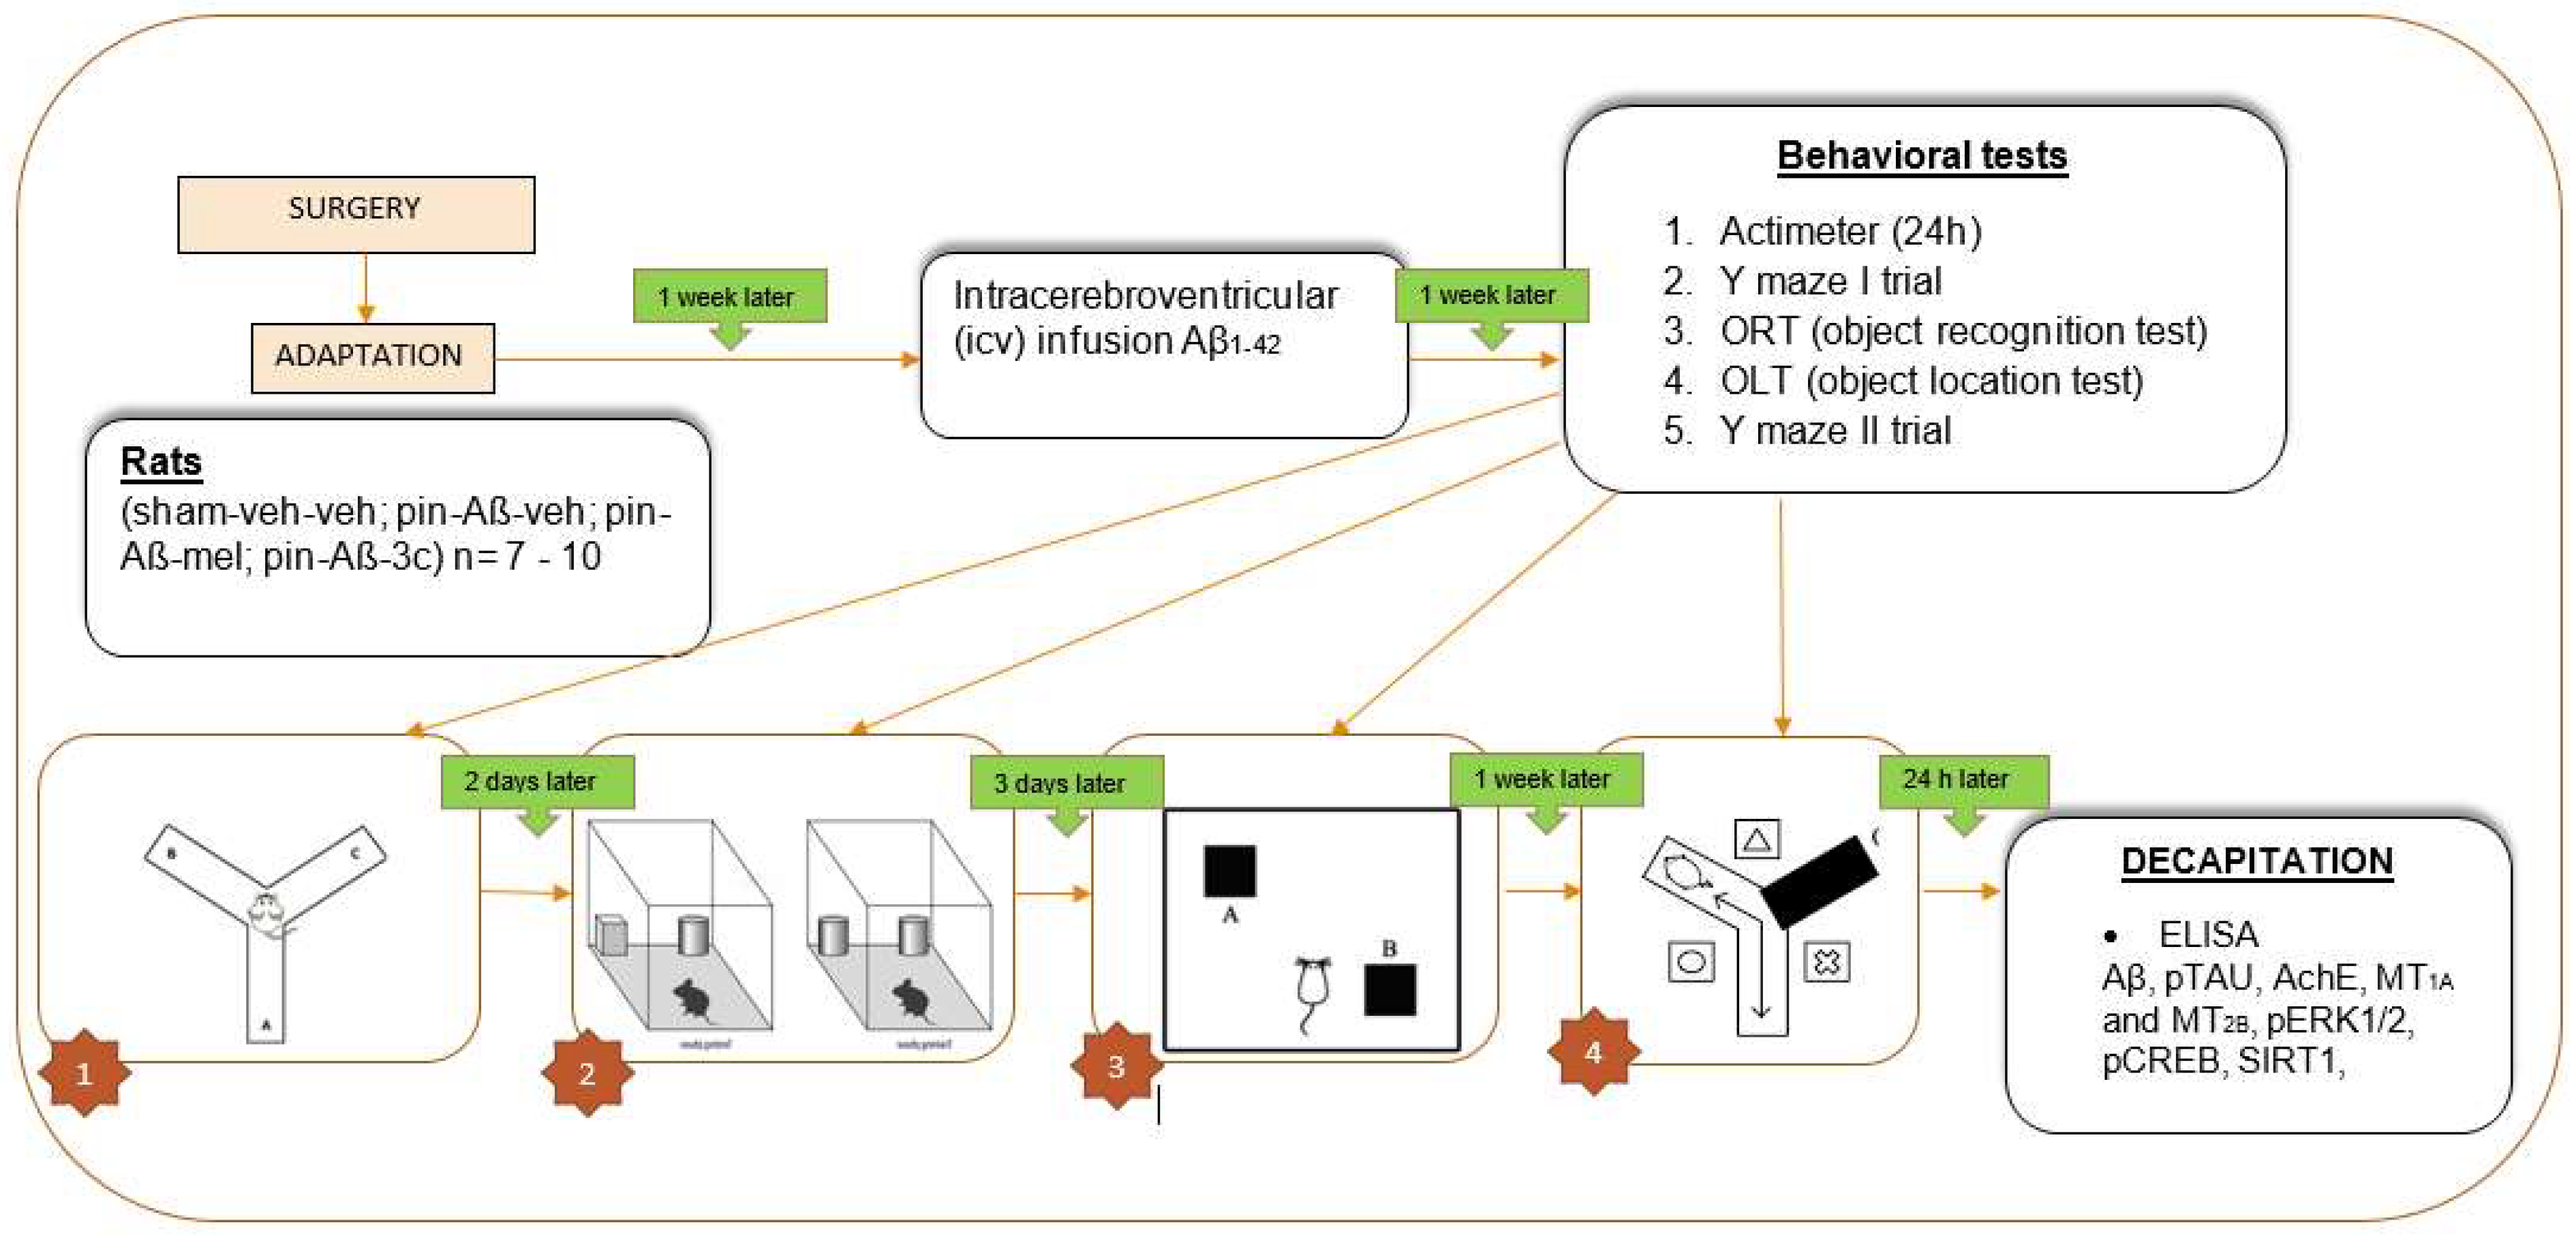
Timeline of experimental steps.
Figure 10.
Timeline of experimental steps.
