Submitted:
19 January 2024
Posted:
23 January 2024
You are already at the latest version
Abstract
Keywords:
1. Introduction
2. Results
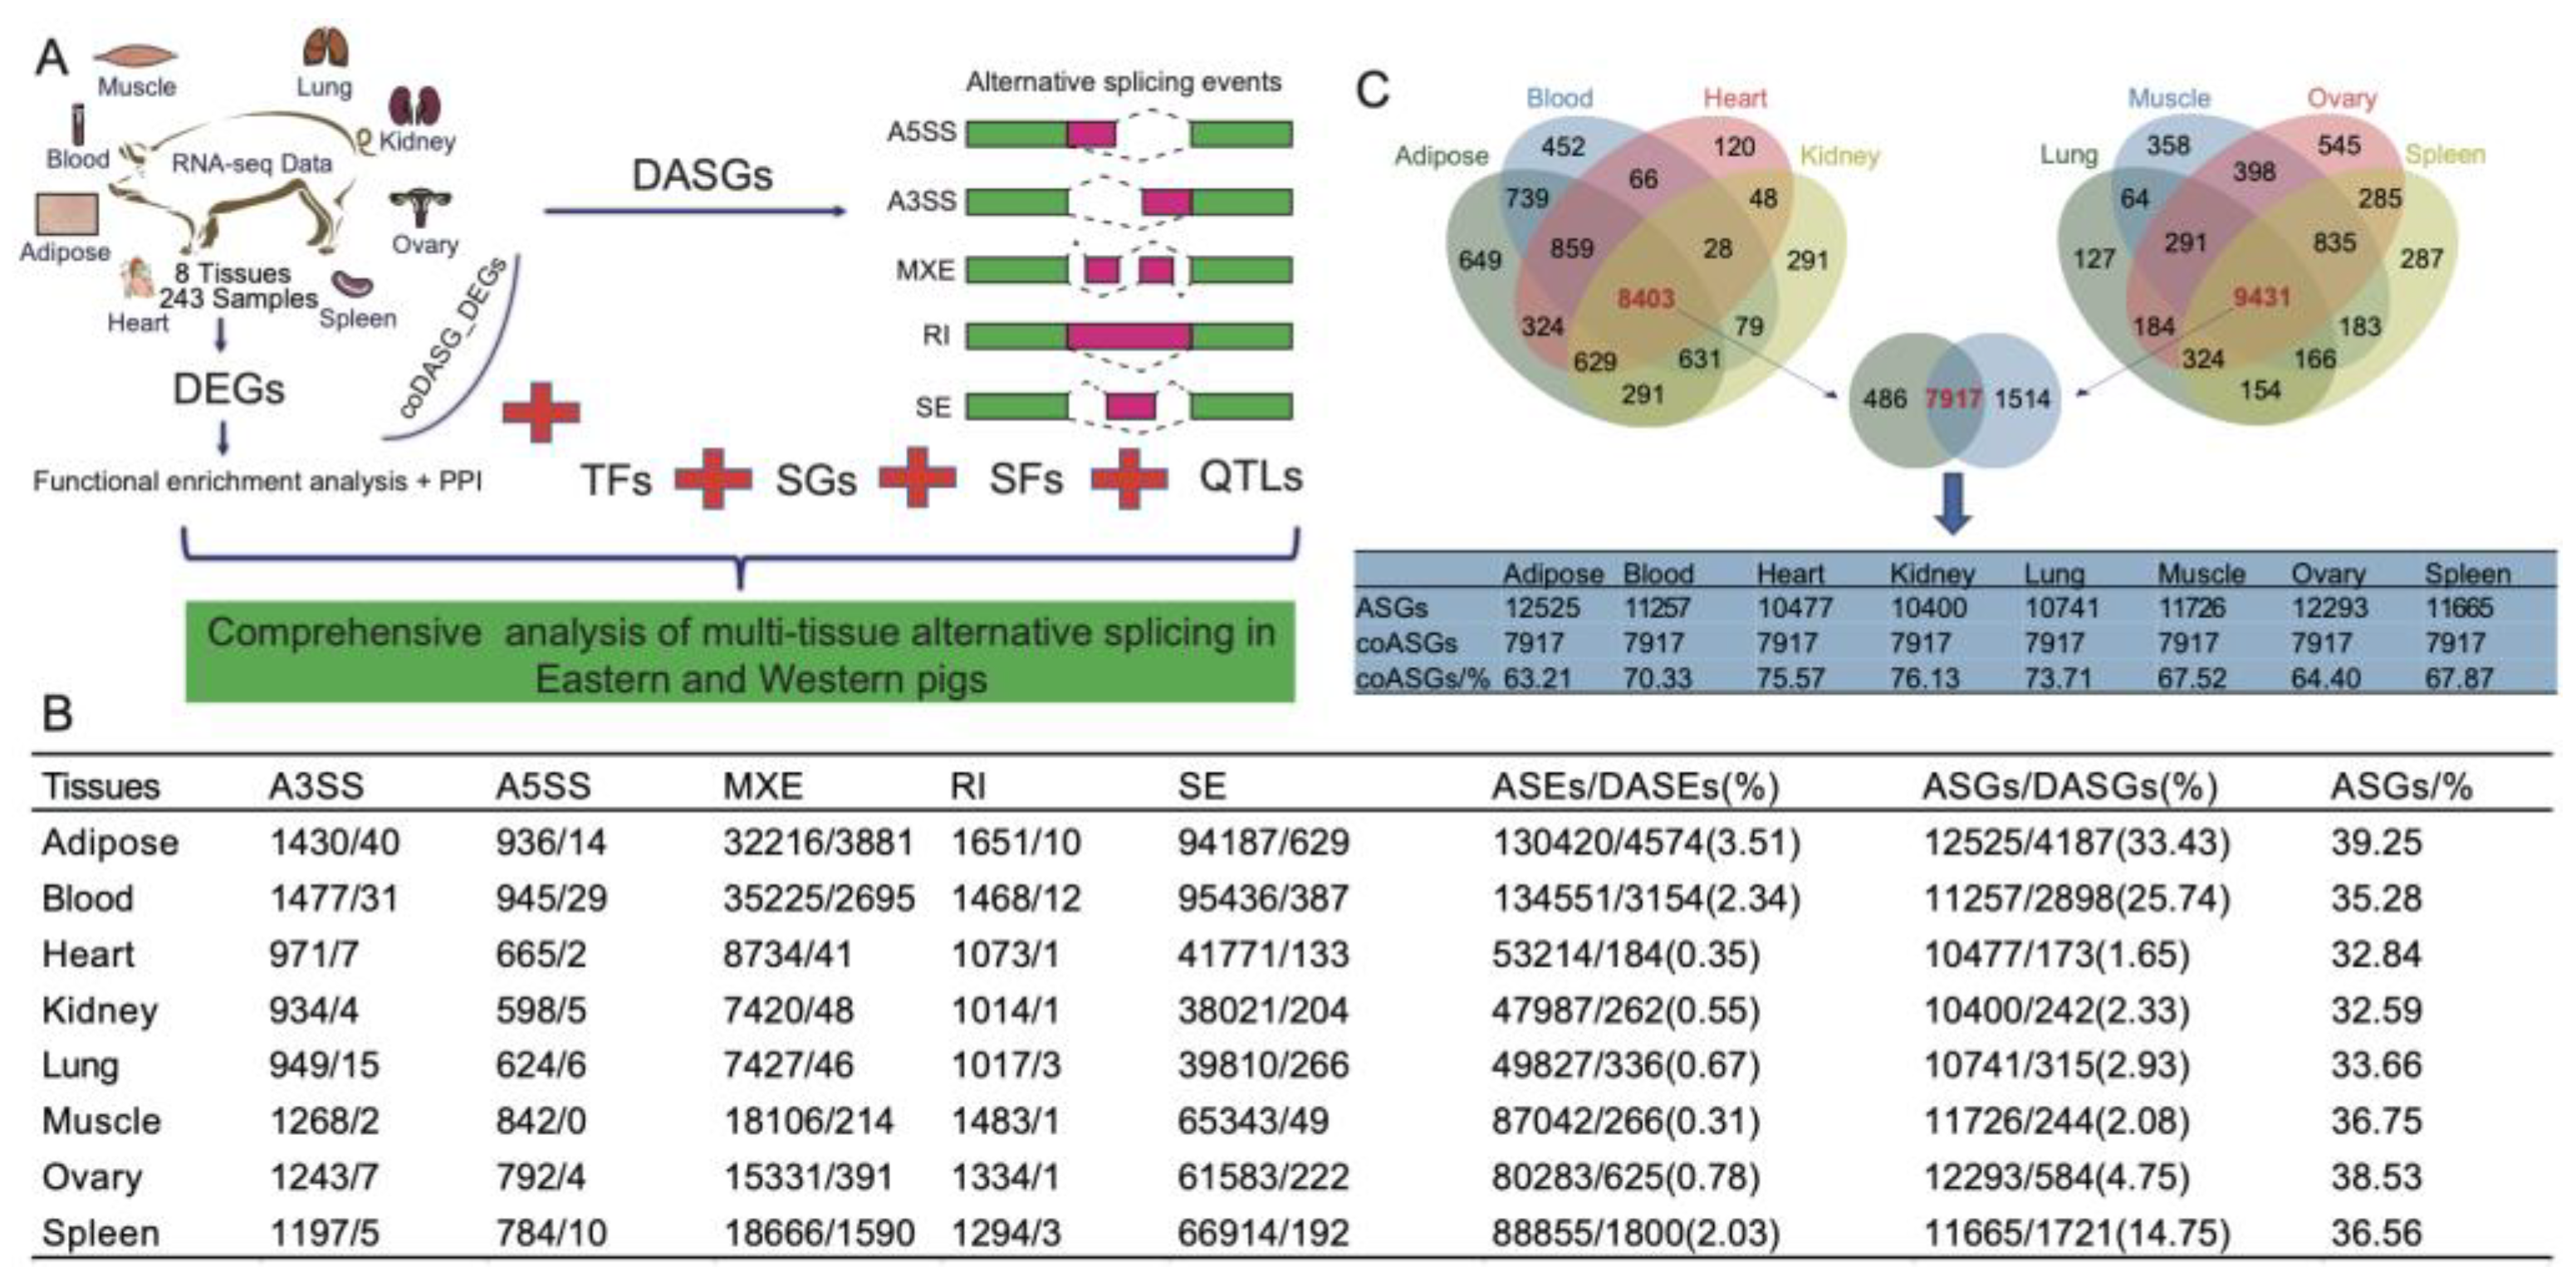
2.1. Genome-wide identification of ASEs in different tissues
2.2. Tissue-specific DASGs and DEGs
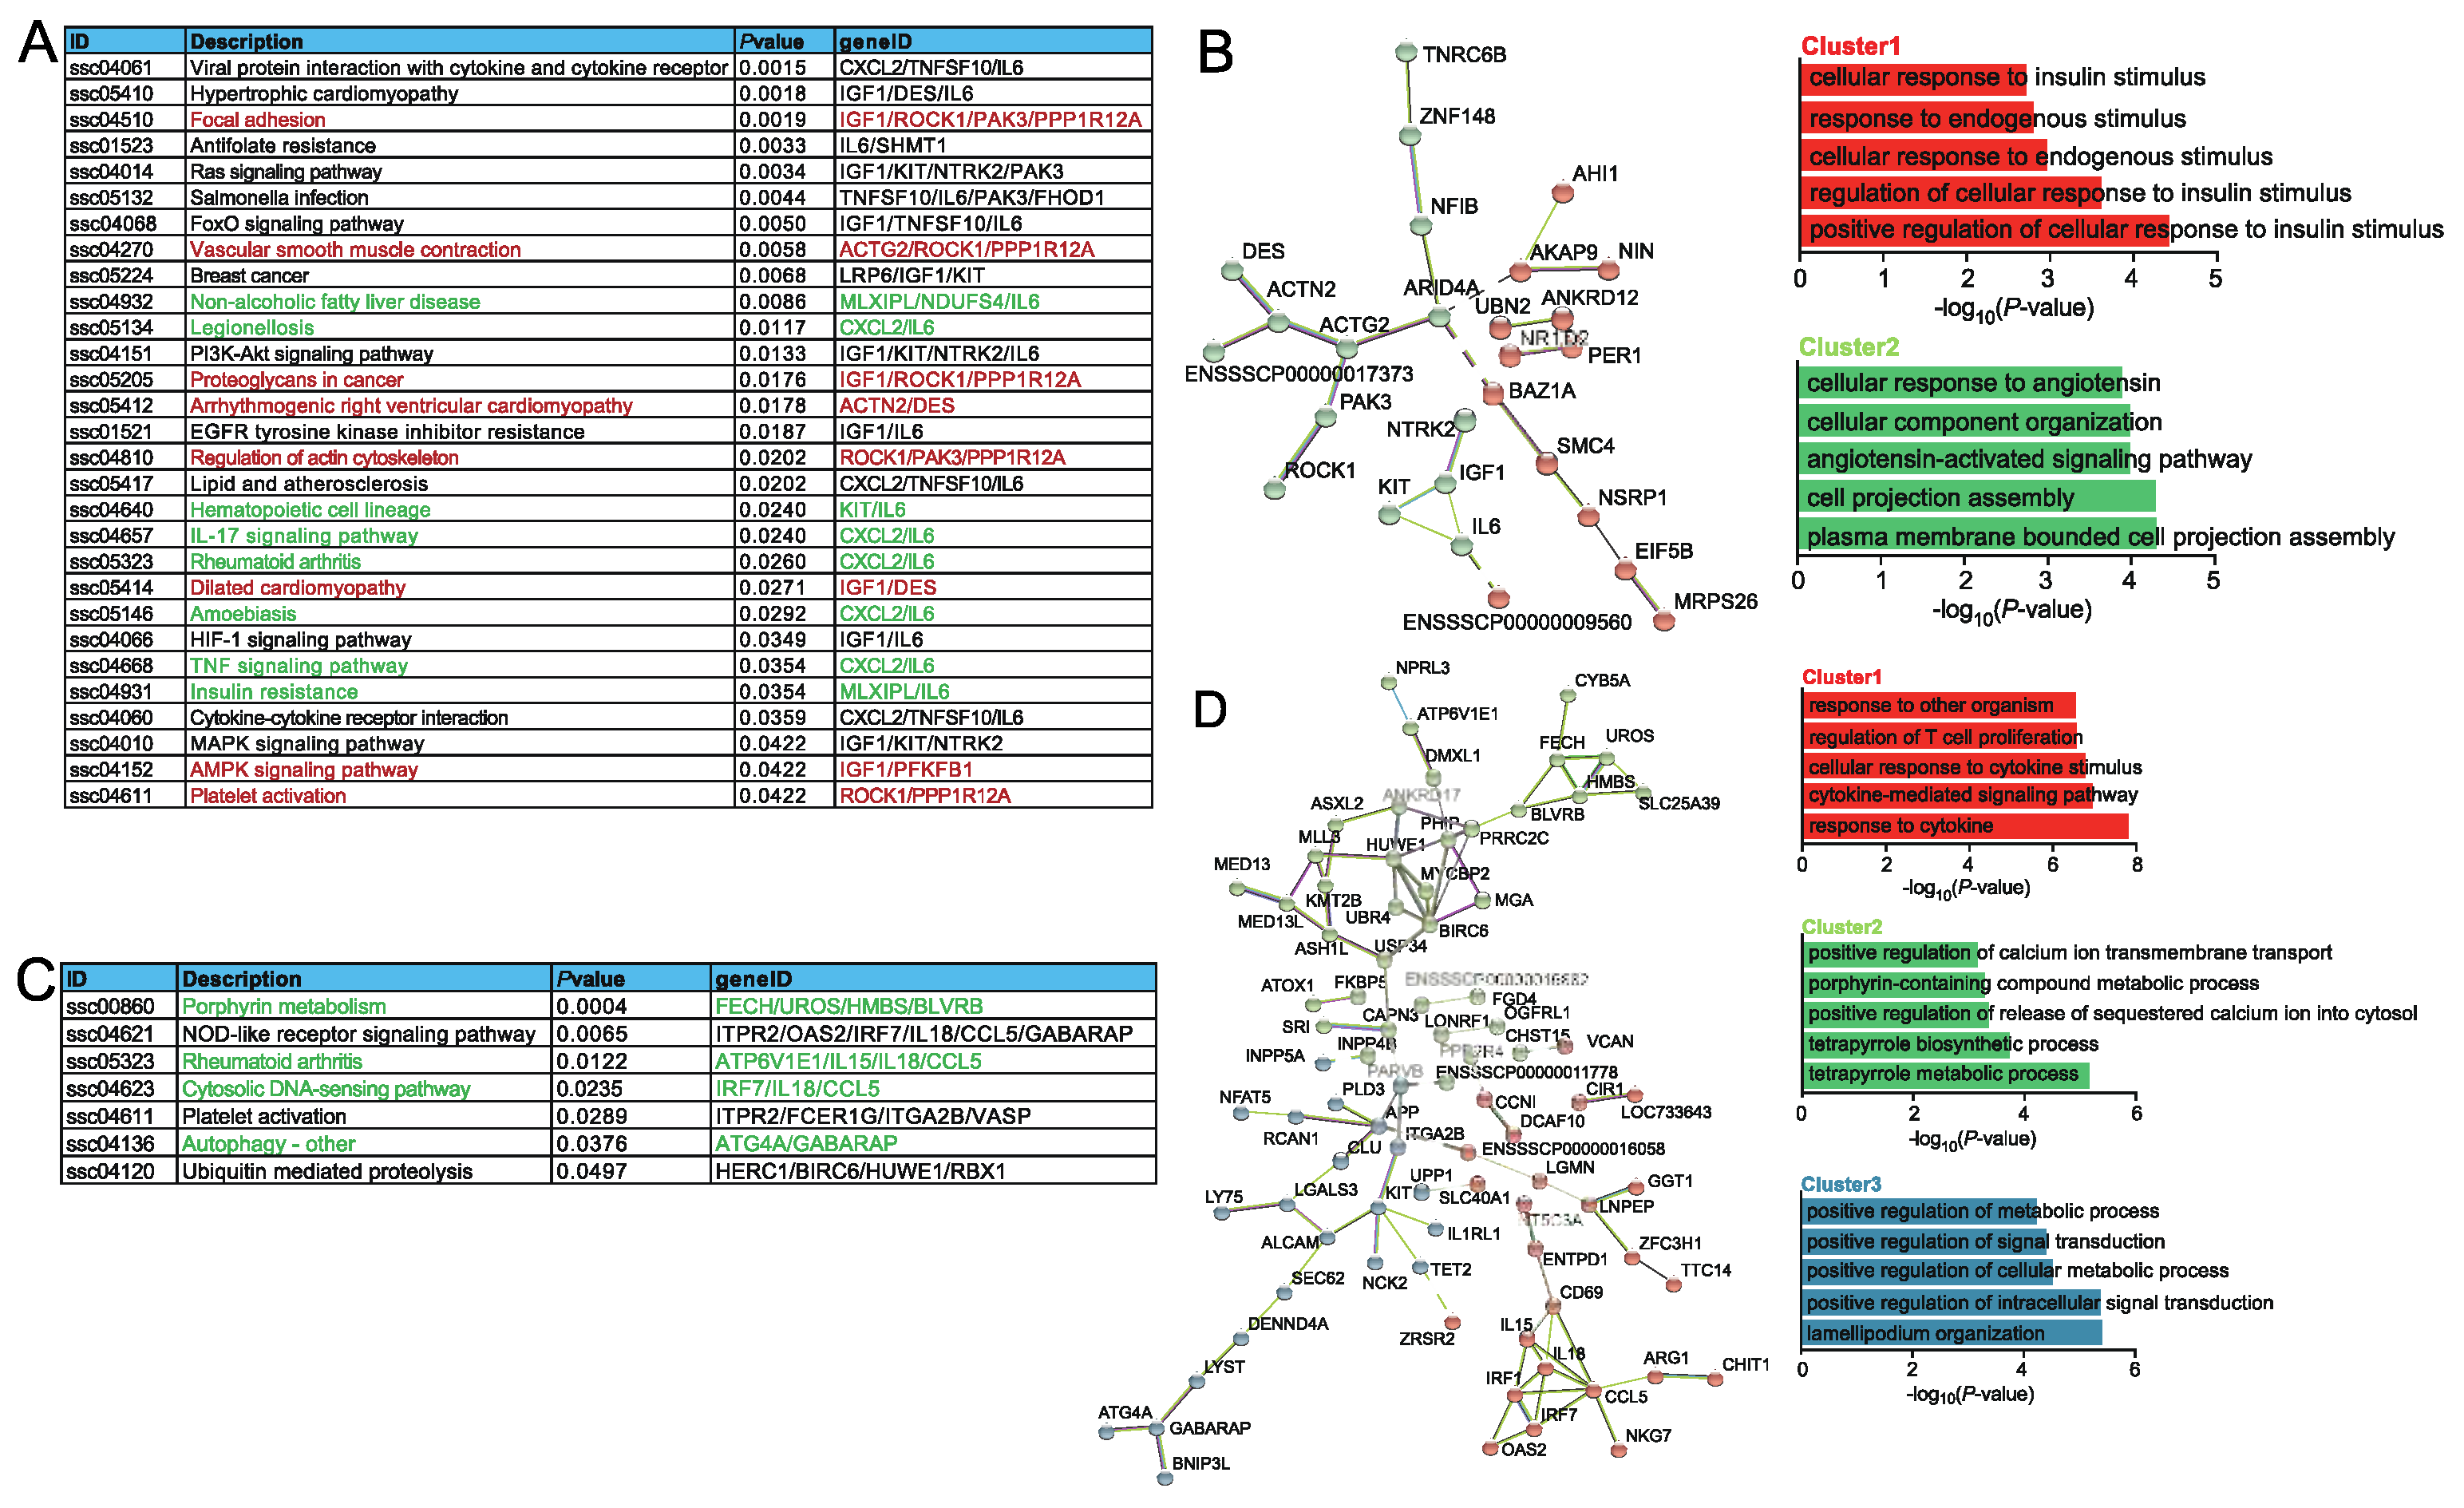
2.3. Functional analysis of DEGs association with ASEs
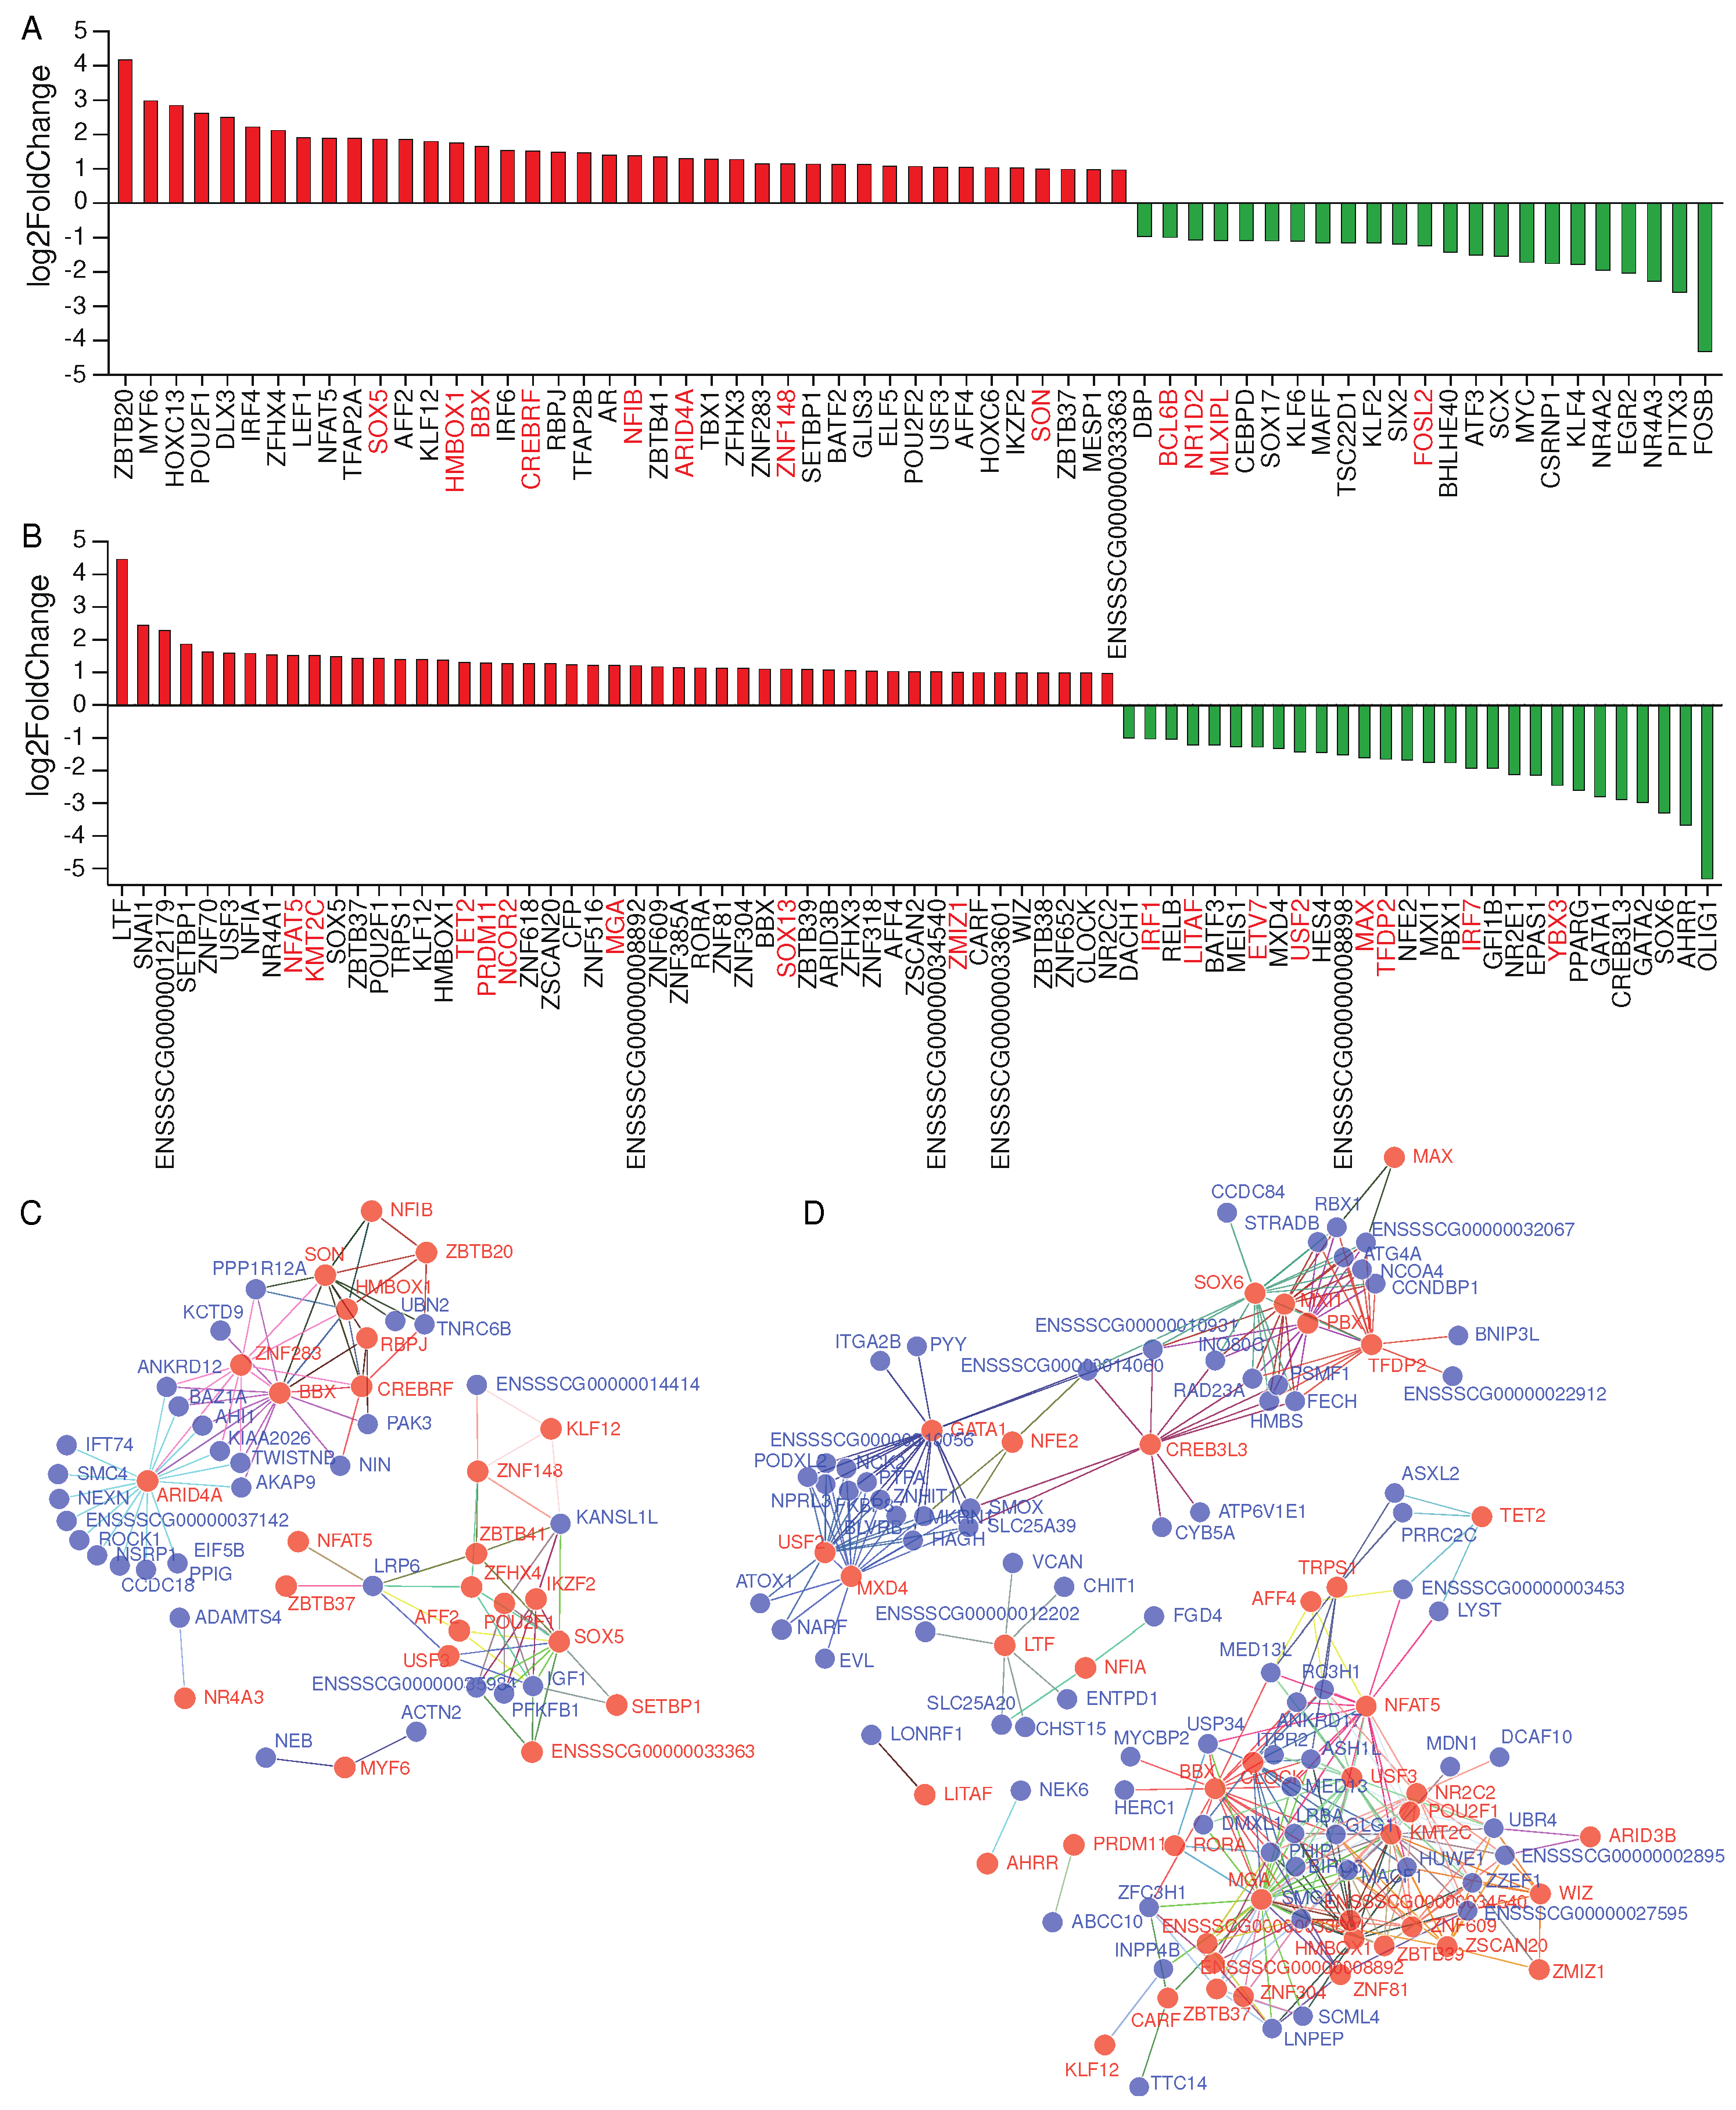
2.4. Effects of transcription factors on alternative splicing
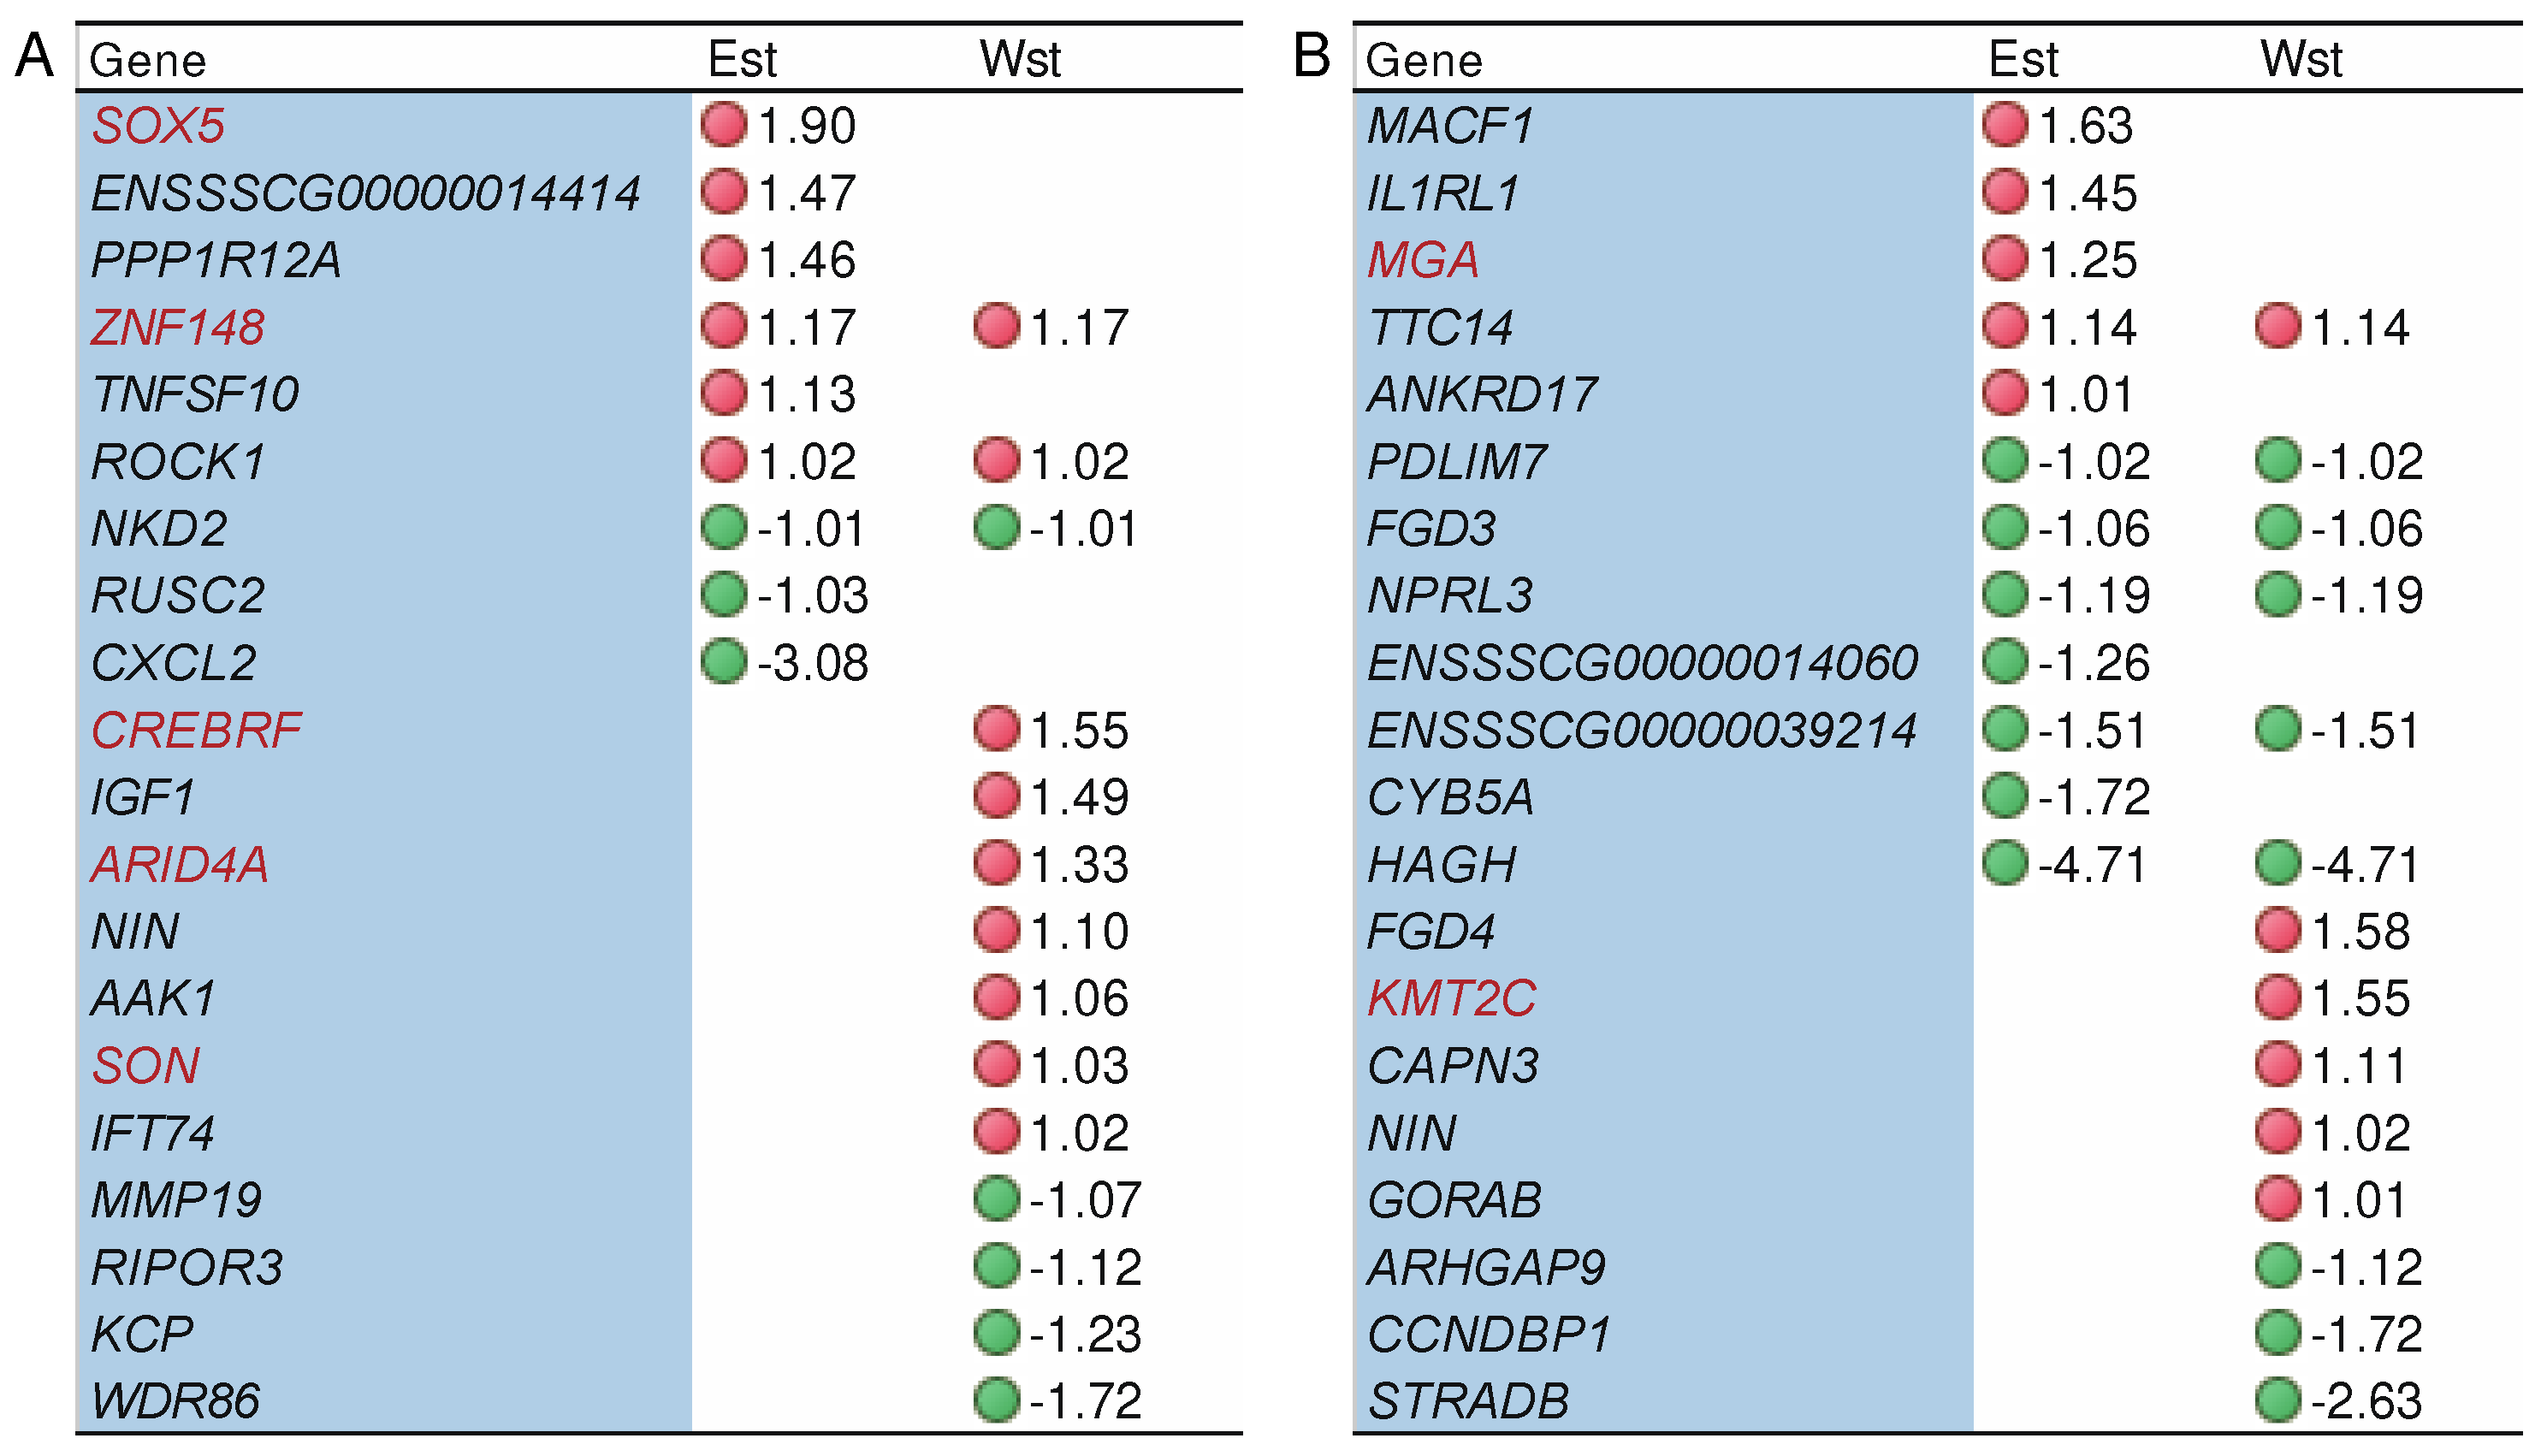
2.5. The impact of genes under potential selection on alternative splicing
2.6. Effects of splicing factors on alternative splicing
2.7. Splicing factor NSRP1 and correlated genes impact adipose-deposition traits
2.8. Splicing factor NSRP1 regulates adipogenesis
2.9. NSRP1 promotes adipogenesis by regulating AS and expression of CCDC18
3. Discussion
4. Materials and Methods
4.1. Data collection
4.2. Transcriptome data quality control and alignment
4.3. Identification and differential analysis of alternative splicing events
4.4. Identification of differentially expressed genes
4.5. Gene functional enrichment analysis
4.6. Protein-protein interaction network analysis
4.7. Integrated analysis of transcription factors, selection signals, splicing factors, and QTLs
4.8. Adipocyte culture and induced differentiation
4.9. RNA extraction and RT-qPCR
4.10. Western blot analysis
4.11. Cell Counting Kit-8 proliferation assay
4.12. 5-Ethynyl-2′-deoxyuridine (EdU) staining
4.13. Oil Red O Staining
4.14. Semiquantitative RT-PCR analysis of alternative splicing events
4.15. Statistical analysis
5. Conclusions
Supplementary Materials
Author Contributions
Funding
Institutional Review Board Statement
Informed Consent Statement
Data Availability Statement
Acknowledgments
Conflicts of Interest
References
- White, S. , From globalized pig breeds to capitalist pigs: a study in animal cultures and evolutionary history. Environmental History 2011. [Google Scholar] [CrossRef]
- Zhang, L.; Tian, H.; Shi, H.; Pan, S.; Qin, X.; Pan, N.; Dangal, S. R. , Methane emissions from livestock in East Asia during 1961− 2019. Ecosystem Health and Sustainability 2021, 7, 1918024. [Google Scholar] [CrossRef]
- Choi, S. K.; Lee, J.-E.; Kim, Y.-J.; Min, M.-S.; Voloshina, I.; Myslenkov, A.; Oh, J. G.; Kim, T.-H.; Markov, N.; Seryodkin, I. , Genetic structure of wild boar (Sus scrofa) populations from East Asia based on microsatellite loci analyses. BMC genetics 2014, 15, 1–10. [Google Scholar] [CrossRef] [PubMed]
- Larson, G.; Dobney, K.; Albarella, U.; Fang, M.; Matisoo-Smith, E.; Robins, J.; Lowden, S.; Finlayson, H.; Brand, T.; Willerslev, E. , Worldwide phylogeography of wild boar reveals multiple centers of pig domestication. Science 2005, 307, 1618–1621. [Google Scholar] [CrossRef] [PubMed]
- Evin, A.; Cucchi, T.; Cardini, A.; Vidarsdottir, U. S.; Larson, G.; Dobney, K. , The long and winding road: identifying pig domestication through molar size and shape. Journal of Archaeological Science 2013, 40, 735–743. [Google Scholar] [CrossRef]
- Liu, Y.; Fu, Y.; Yang, Y.; Yi, G.; Lian, J.; Xie, B.; Yao, Y.; Chen, M.; Niu, Y.; Liu, L.; Wang, L.; Zhang, Y.; Fan, X.; Tang, Y.; Yuan, P.; Zhu, M.; Li, Q.; Zhang, S.; Chen, Y.; Wang, B.; He, J.; Lu, D.; Liachko, I.; Sullivan, S. T.; Pang, B.; Chen, Y.; He, X.; Li, K.; Tang, Z. , Integration of multi-omics data reveals cis-regulatory variants that are associated with phenotypic differentiation of eastern from western pigs. Genet Sel Evol 2022, 54, 62. [Google Scholar] [CrossRef]
- Deng, L.; Li, W.; Liu, W.; Liu, Y.; Xie, B.; Groenen, M. A. M.; Madsen, O.; Yang, X.; Tang, Z. , Integrative metabolomic and transcriptomic analysis reveals difference in glucose and lipid metabolism in the longissimus muscle of Luchuan and Duroc pigs. Front Genet 2023, 14, 1128033. [Google Scholar] [CrossRef]
- Yang, Y.; Liang, G.; Niu, G.; Zhang, Y.; Zhou, R.; Wang, Y.; Mu, Y.; Tang, Z.; Li, K. , Comparative analysis of DNA methylome and transcriptome of skeletal muscle in lean-, obese-, and mini-type pigs. Sci Rep 2017, 7, 39883. [Google Scholar] [CrossRef]
- Wright, C. J.; Smith, C. W.; Jiggins, C. D. , Alternative splicing as a source of phenotypic diversity. Nature Reviews Genetics 2022, 23, 697–710. [Google Scholar] [CrossRef]
- Chen, H.; Gao, F.; He, M.; Ding, X. F.; Wong, A. M.; Sze, S. C.; Yu, A. C.; Sun, T.; Chan, A. W. H.; Wang, X. , Long-read RNA sequencing identifies alternative splice variants in hepatocellular carcinoma and tumor-specific isoforms. Hepatology 2019, 70, 1011–1025. [Google Scholar] [CrossRef]
- Baralle, F. E.; Giudice, J. , Alternative splicing as a regulator of development and tissue identity. Nature reviews Molecular cell biology 2017, 18, 437–451. [Google Scholar] [CrossRef]
- Mazin, P. V.; Khaitovich, P.; Cardoso-Moreira, M.; Kaessmann, H. , Alternative splicing during mammalian organ development. Nature genetics 2021, 53, 925–934. [Google Scholar] [CrossRef] [PubMed]
- Modrek, B.; Lee, C. , A genomic view of alternative splicing. Nature genetics 2002, 30, 13–19. [Google Scholar] [CrossRef] [PubMed]
- Scotti, M. M.; Swanson, M. S. , RNA mis-splicing in disease. Nature Reviews Genetics 2016, 17, 19–32. [Google Scholar] [CrossRef] [PubMed]
- Han, H.; Braunschweig, U.; Gonatopoulos-Pournatzis, T.; Weatheritt, R. J.; Hirsch, C. L.; Ha, K. C. H.; Radovani, E.; Nabeel-Shah, S.; Sterne-Weiler, T.; Wang, J.; O'Hanlon, D.; Pan, Q.; Ray, D.; Zheng, H.; Vizeacoumar, F.; Datti, A.; Magomedova, L.; Cummins, C. L.; Hughes, T. R.; Greenblatt, J. F.; Wrana, J. L.; Moffat, J.; Blencowe, B. J. , Multilayered Control of Alternative Splicing Regulatory Networks by Transcription Factors. Mol Cell 2017, 65, 539–553 e7. [Google Scholar] [CrossRef] [PubMed]
- Bielli, P.; Busa, R.; Di Stasi, S. M.; Munoz, M. J.; Botti, F.; Kornblihtt, A. R.; Sette, C. , The transcription factor FBI-1 inhibits SAM68-mediated BCL-X alternative splicing and apoptosis. EMBO Rep 2014, 15, 419–27. [Google Scholar] [CrossRef] [PubMed]
- Long, J. C.; Caceres, J. F. , The SR protein family of splicing factors: master regulators of gene expression. Biochem J 2009, 417, 15–27. [Google Scholar] [CrossRef] [PubMed]
- Chen, K.; Baxter, T.; Muir, W. M.; Groenen, M. A.; Schook, L. B. , Genetic resources, genome mapping and evolutionary genomics of the pig (Sus scrofa). Int J Biol Sci 2007, 3, 153–65. [Google Scholar] [CrossRef] [PubMed]
- Li, P. J. , Exponential growth, animal welfare, environmental and food safety impact: The case of China’s livestock production. Journal of Agricultural and Environmental Ethics 2009, 22, 217–240. [Google Scholar] [CrossRef]
- Nygard, A.-B.; Cirera, S.; Gilchrist, M. J.; Gorodkin, J.; Jørgensen, C. B.; Fredholm, M. , A study of alternative splicing in the pig. BMC Research Notes 2010, 3, 1–12. [Google Scholar] [CrossRef]
- Hao, W.; Yang, Z.; Sun, Y.; Li, J.; Zhang, D.; Liu, D.; Yang, X. , Characterization of alternative splicing events in porcine skeletal muscles with different intramuscular Fat contents. Biomolecules 2022, 12, 154. [Google Scholar] [CrossRef] [PubMed]
- Shu, Z.; Wang, L.; Wang, J.; Zhang, L.; Hou, X.; Yan, H.; Wang, L. , Integrative Analysis of Nanopore and Illumina Sequencing Reveals Alternative Splicing Complexity in Pig Longissimus Dorsi Muscle. Frontiers in Genetics 2022, 13, 877646. [Google Scholar] [CrossRef] [PubMed]
- Liu, Y.; Fu, Y.; Yang, Y.; Yi, G.; Lian, J.; Xie, B.; Yao, Y.; Chen, M.; Niu, Y.; Liu, L. , Integration of multi-omics data reveals cis-regulatory variants that are associated with phenotypic differentiation of eastern from western pigs. Genetics Selection Evolution 2022, 54, 62. [Google Scholar] [CrossRef]
- Long, J. C.; Caceres, J. F. , The SR protein family of splicing factors: master regulators of gene expression. Biochemical Journal 2009, 417, 15–27. [Google Scholar] [CrossRef] [PubMed]
- Bhadra, M.; Howell, P.; Dutta, S.; Heintz, C.; Mair, W. B. , Alternative splicing in aging and longevity. Human genetics 2020, 139, 357–369. [Google Scholar] [CrossRef]
- Jacobs, A.; Elmer, K. R. , Alternative splicing and gene expression play contrasting roles in the parallel phenotypic evolution of a salmonid fish. Molecular Ecology 2021, 30, 4955–4969. [Google Scholar] [CrossRef]
- Bush, S. J.; Chen, L.; Tovar-Corona, J. M.; Urrutia, A. O. , Alternative splicing and the evolution of phenotypic novelty. Philosophical Transactions of the Royal Society B: Biological Sciences 2017, 372, 20150474. [Google Scholar] [CrossRef]
- Yang, Y.; Yuan, H.; Yang, Q.; Cai, Y.; Ren, Y.; Li, Y.; Gao, C.; Zhao, S. , Post-transcriptional regulation through alternative splicing in the lungs of Tibetan pigs under hypoxia. Gene 2022, 819, 146268. [Google Scholar] [CrossRef]
- Tan, B.; Zeng, J.; Meng, F.; Wang, S.; Xiao, L.; Zhao, X.; Hong, L.; Zheng, E.; Wu, Z.; Li, Z. , Comprehensive analysis of pre-mRNA alternative splicing regulated by m6A methylation in pig oxidative and glycolytic skeletal muscles. BMC genomics 2022, 23, 1–14. [Google Scholar] [CrossRef]
- Jiang, W.; Chen, L. , Tissue specificity of gene expression evolves across mammal species. Journal of Computational Biology 2022, 29, 880–891. [Google Scholar] [CrossRef]
- Mosthaf, L.; Grako, K.; Dull, T.; Coussens, L.; Ullrich, A.; McClain, D. , Functionally distinct insulin receptors generated by tissue-specific alternative splicing. The EMBO journal 1990, 9, 2409–2413. [Google Scholar] [CrossRef] [PubMed]
- Qu, A.; Bai, Y.; Zhang, X.; Zeng, J.; Pu, F.; Wu, L.; Xu, P.; Zhou, T. , Tissue-Specific Analysis of Alternative Splicing Events and Differential Isoform Expression in Large Yellow Croaker (Larimichthys crocea) After Cryptocaryon irritans Infection. Marine Biotechnology 2022, 24, 640–654. [Google Scholar] [CrossRef] [PubMed]
- Yu, T.; Tian, X.; Li, D.; He, Y.; Yang, P.; Cheng, Y.; Zhao, X.; Sun, J.; Yang, G. , Transcriptome, proteome and metabolome analysis provide insights on fat deposition and meat quality in pig. Food Research International 2023, 166, 112550. [Google Scholar] [CrossRef] [PubMed]
- Shen, J.; Hao, Z.; Luo, Y.; Zhen, H.; Liu, Y.; Wang, J.; Hu, J.; Liu, X.; Li, S.; Zhao, Z. , Deep small RNA sequencing reveals important miRNAs related to muscle development and intramuscular fat deposition in longissimus dorsi muscle from different goat breeds. Frontiers in Veterinary Science 2022, 9, 911166. [Google Scholar] [CrossRef] [PubMed]
- Wang, H.; Wang, X.; Li, M.; Wang, S.; Chen, Q.; Lu, S. , Identification of key sex-specific pathways and genes in the subcutaneous adipose tissue from pigs using WGCNA method. BMC Genomic Data 2022, 23, 35. [Google Scholar] [CrossRef] [PubMed]
- Jiao, Y.; Liang, X.; Hou, J.; Aisa, Y.; Wu, H.; Zhang, Z.; Nuermaimaiti, N.; Zhao, Y.; Jiang, S.; Guan, Y. , Adenovirus type 36 regulates adipose stem cell differentiation and glucolipid metabolism through the PI3K/Akt/FoxO1/PPARγ signaling pathway. Lipids in Health and Disease 2019, 18, 1–12. [Google Scholar] [CrossRef] [PubMed]
- Chen, H.; Peng, T.; Shang, H.; Shang, X.; Zhao, X.; Qu, M.; Song, X. , RNA-Seq analysis reveals the potential molecular mechanisms of puerarin on intramuscular fat deposition in heat-stressed beef cattle. Frontiers in Nutrition 2022, 9, 817557. [Google Scholar] [CrossRef]
- Poklukar, K.; Čandek-Potokar, M.; Batorek Lukač, N.; Tomažin, U.; Škrlep, M. , Lipid deposition and metabolism in local and modern pig breeds: A review. Animals 2020, 10, 424. [Google Scholar] [CrossRef]
- Ahmed, B.; Sultana, R.; Greene, M. W. , Adipose tissue and insulin resistance in obese. Biomedicine & Pharmacotherapy 2021, 137, 111315. [Google Scholar]
- Nedunchezhiyan, U.; Varughese, I.; Sun, A. R.; Wu, X.; Crawford, R.; Prasadam, I. , Obesity, inflammation, and immune system in osteoarthritis. Front Immunol 2022, 13, 907750. [Google Scholar] [CrossRef]
- Zhao, G.-N.; Tian, Z.-W.; Tian, T.; Zhu, Z.-P.; Zhao, W.-J.; Tian, H.; Cheng, X.; Hu, F.-J.; Hu, M.-L.; Tian, S. , TMBIM1 is an inhibitor of adipogenesis and its depletion promotes adipocyte hyperplasia and improves obesity-related metabolic disease. Cell metabolism 2021, 33, 1640–1654. e8. [Google Scholar] [CrossRef] [PubMed]
- Stadhouders, R.; Filion, G. J.; Graf, T. , Transcription factors and 3D genome conformation in cell-fate decisions. Nature 2019, 569, 345–354. [Google Scholar] [CrossRef] [PubMed]
- Andrews, G.; Fan, K.; Pratt, H. E.; Phalke, N.; §, Z. C.; Karlsson, E. K.; Lindblad-Toh, K.; Gazal, S.; Moore, J. E.; Weng, Z. , Mammalian evolution of human cis-regulatory elements and transcription factor binding sites. Science 2023, 380, eabn7930. [Google Scholar] [CrossRef] [PubMed]
- Bielli, P.; Busà, R.; Di Stasi, S. M.; Munoz, M. J.; Botti, F.; Kornblihtt, A. R.; Sette, C. , The transcription factor FBI-1 inhibits SAM 68-mediated BCL-X alternative splicing and apoptosis. EMBO reports 2014, 15, 419–427. [Google Scholar] [CrossRef] [PubMed]
- Han, H.; Braunschweig, U.; Gonatopoulos-Pournatzis, T.; Weatheritt, R. J.; Hirsch, C. L.; Ha, K. C.; Radovani, E.; Nabeel-Shah, S.; Sterne-Weiler, T.; Wang, J. , Multilayered control of alternative splicing regulatory networks by transcription factors. Molecular cell 2017, 65, 539–553. e7. [Google Scholar] [CrossRef] [PubMed]
- Farooqi, A. A.; Fayyaz, S.; Poltronieri, P.; Calin, G.; Mallardo, M. In Epigenetic deregulation in cancer: Enzyme players and non-coding RNAs, Seminars in cancer biology, 2022; Elsevier: 2022; pp 197-207.
- Milazzo, G.; Mercatelli, D.; Di Muzio, G.; Triboli, L.; De Rosa, P.; Perini, G.; Giorgi, F. M. , Histone deacetylases (HDACs): evolution, specificity, role in transcriptional complexes, and pharmacological actionability. Genes 2020, 11, 556. [Google Scholar] [CrossRef] [PubMed]
- Delcuve, G. P.; Khan, D. H.; Davie, J. R. , Targeting class I histone deacetylases in cancer therapy. Expert opinion on therapeutic targets 2013, 17, 29–41. [Google Scholar] [CrossRef] [PubMed]
- rivas, P. D.; Papavassiliou, A. G., Transcriptional corepressors in cancer: emerging targets for therapeutic intervention. In Wiley Online Library: 2013; Vol. 119, pp 1120-1128.
- Wu, M.-Y.; Eldin, K. W.; Beaudet, A. L. , Identification of chromatin remodeling genes Arid4a and Arid4b as leukemia suppressor genes. Journal of the National Cancer Institute 2008, 100, 1247–1259. [Google Scholar] [CrossRef]
- Liang, Y. K.; Han, Z. D.; Lu, J. M.; Liu, Z. Z.; Zhuo, Y. J.; Zhu, X. J.; Chen, J. X.; Ye, J. H.; Liang, Y. X.; He, H. C. , Downregulation of ARID4A and ARID4B promote tumor progression and directly regulated by microRNA-30d in patient with prostate cancer. Journal of Cellular Biochemistry 2018, 119, 7245–7255. [Google Scholar] [CrossRef]
- Huang, L.; Teng, D.; Wang, H.; Sheng, G.; Liu, T. , Association of copy number variation in the AHI1 gene with risk of obesity in the Chinese population. European journal of endocrinology 2012, 166, 727–734. [Google Scholar] [CrossRef]
- Cho, Y.; Gutierrez, L.; Bordonaro, M.; Russo, D.; Anzelmi, F.; Hooven, J. T.; Cerra, C.; Lazarova, D. L. , Effects of propolis and gamma-cyclodextrin on intestinal neoplasia in normal weight and obese mice. Cancer Medicine 2016, 5, 2448–2458. [Google Scholar] [CrossRef] [PubMed]
- Deaton, A. M.; Dubey, A.; Ward, L. D.; Dornbos, P.; Flannick, J.; Consortium, A.-T. D.-G.; Yee, E.; Ticau, S.; Noetzli, L.; Parker, M. M. , Rare loss of function variants in the hepatokine gene INHBE protect from abdominal obesity. Nature Communications 2022, 13, 4319. [Google Scholar] [CrossRef] [PubMed]
- Tan, X.; Liu, R.; Xing, S.; Zhang, Y.; Li, Q.; Zheng, M.; Zhao, G.; Wen, J. , Genome-wide detection of key genes and epigenetic markers for chicken fatty liver. International Journal of Molecular Sciences 2020, 21, 1800. [Google Scholar] [CrossRef] [PubMed]
- Zappaterra, M.; Gioiosa, S.; Chillemi, G.; Zambonelli, P.; Davoli, R. , Muscle transcriptome analysis identifies genes involved in ciliogenesis and the molecular cascade associated with intramuscular fat content in Large White heavy pigs. PLoS One 2020, 15, e0233372. [Google Scholar] [CrossRef] [PubMed]
- Pan, C.; Yang, C.; Wang, S.; Ma, Y. , Identifying key genes and functionally enriched pathways of diverse adipose tissue types in cattle. Frontiers in Genetics 2022, 13, 790690. [Google Scholar] [CrossRef] [PubMed]
- Peng, Y.; Shi, X.-e.; Huang, K.-l.; Yao, X.-p.; Chen, F.-f.; Li, X.; Yang, G.-s. , Knock-down Sox5 suppresses porcine adipogenesis through BMP R-Smads signal pathway. Biochemical and Biophysical Research Communications 2020, 527, 574–580. [Google Scholar] [CrossRef] [PubMed]
- Li, Z.; Liu, X.; Li, Y.; Wang, W.; Wang, N.; Xiao, F.; Gao, H.; Guo, H.; Li, H.; Wang, S. , Chicken C/EBPζ gene: Expression profiles, association analysis, and identification of functional variants for abdominal fat. Domestic Animal Endocrinology 2021, 76, 106631. [Google Scholar] [CrossRef]
- Jiang, H.; Gao, Q.; Che, X.; Zhu, L.; Zhang, Z.; Chen, Y.; Dai, Y. , Inhibition of penile tunica albuginea myofibroblasts activity by adipose-derived stem cells. Experimental and Therapeutic Medicine 2017, 14, 5149–5156. [Google Scholar] [CrossRef]
- Dou, Y.; Qi, K.; Liu, Y.; Li, C.; Song, C.; Wei, Y.; Zhang, Z.; Li, X.; Wang, K.; Li, X. , Identification and Functional Prediction of Long Non-Coding RNA in Longissimus Dorsi Muscle of Queshan Black and Large White Pigs. Genes 2023, 14, 197. [Google Scholar] [CrossRef]
- Mota, L. F.; Lopes, F. B.; Fernandes Júnior, G. A.; Rosa, G. J.; Magalhães, A. F.; Carvalheiro, R.; Albuquerque, L. G. , Genome-wide scan highlights the role of candidate genes on phenotypic plasticity for age at first calving in Nellore heifers. Scientific reports 2020, 10, 6481. [Google Scholar] [CrossRef]
- Liu, X.; Wei, S.; Deng, S.; Li, D.; Liu, K.; Shan, B.; Shao, Y.; Wei, W.; Chen, J.; Zhang, L. , Genome-wide identification and comparison of mRNA s, lnc RNA s and circ RNA s in porcine intramuscular, subcutaneous, retroperitoneal and mesenteric adipose tissues. Animal genetics 2019, 50, 228–241. [Google Scholar] [CrossRef]
- Hu, L.; Xiao, Y.; Xiong, Z.; Zhao, F.; Yin, C.; Zhang, Y.; Su, P.; Li, D.; Chen, Z.; Ma, X. In MACF1, versatility in tissue-specific function and in human disease, Seminars in cell & developmental biology, 2017; Elsevier: 2017; pp 3-8.
- Akhabir, L.; Sandford, A. , Genetics of interleukin 1 receptor-like 1 in immune and inflammatory diseases. Current genomics 2010, 11, 591–606. [Google Scholar] [CrossRef] [PubMed]
- Shaw, C. H.; Palti, Y.; Gao, G.; Wiens, G. D. , Evolution of interleukin-1 receptor-like 1 and its role in rainbow trout (Oncorhynchus mykiss) resistance to Flavobacterium psychrophilum. The Journal of Immunology 2017, 198 (1_Supplement), 201.22–201.22. [Google Scholar] [CrossRef]
- Chen, Y.; Zeng, B.; Shi, P.; Xiao, H.; Chen, S. , Comparative analysis of the Liver and Spleen transcriptomes between Holstein and Yunnan humped cattle. Animals 2019, 9, 527. [Google Scholar] [CrossRef] [PubMed]
- Sun, L.; Li, M.; Deng, L.; Niu, Y.; Tang, Y.; Wang, Y.; Guo, L. , MGA Mutation as a novel biomarker for immune checkpoint therapies in non-squamous non-small cell lung cancer. Frontiers in pharmacology 2021, 12, 625593. [Google Scholar] [CrossRef]
- Wang, J.; Shivakumar, S.; Barker, K.; Tang, Y.; Wallstrom, G.; Park, J. G.; Tsay, J.-C. J.; Pass, H. I.; Rom, W. N.; LaBaer, J. , Comparative study of autoantibody responses between lung adenocarcinoma and benign pulmonary nodules. Journal of Thoracic Oncology 2016, 11, 334–345. [Google Scholar] [CrossRef] [PubMed]
- Zhou, G.; Jiang, N.; Zhang, W.; Guo, S.; Xin, G. , Biomarker identification in membranous nephropathy using a long non-coding RNA-mediated competitive endogenous RNA network. Interdisciplinary Sciences: Computational Life Sciences 2021, 13, 615–623. [Google Scholar] [CrossRef]
- Kim, C.-H.; Park, S.-M.; Lee, S.-j.; Kim, Y.-D.; Jang, S.-H.; Woo, S.-M.; Kwon, T.-K.; Park, Z.-Y.; Chung, I.-J.; Kim, H.-R. , NSrp70 is a lymphocyte-essential splicing factor that controls thymocyte development. Nucleic Acids Research 2021, 49, 5760–5778. [Google Scholar] [CrossRef]
- Shi, Y. , Mechanistic insights into precursor messenger RNA splicing by the spliceosome. Nature reviews Molecular cell biology 2017, 18, 655–670. [Google Scholar] [CrossRef]
- Jiang, H.; Gao, Q.; Che, X.; Zhu, L.; Zhang, Z.; Chen, Y.; Dai, Y. , Inhibition of penile tunica albuginea myofibroblasts activity by adipose-derived stem cells. Exp Ther Med 2017, 14, 5149–5156. [Google Scholar] [CrossRef]
- Deaton, A. M.; Dubey, A.; Ward, L. D.; Dornbos, P.; Flannick, J.; Consortium, A.-T. D. G.; Yee, E.; Ticau, S.; Noetzli, L.; Parker, M. M.; Hoffing, R. A.; Willis, C.; Plekan, M. E.; Holleman, A. M.; Hinkle, G.; Fitzgerald, K.; Vaishnaw, A. K.; Nioi, P. , Rare loss of function variants in the hepatokine gene INHBE protect from abdominal obesity. Nat Commun 2022, 13, 4319. [Google Scholar] [CrossRef] [PubMed]
- Pan, C.; Yang, C.; Wang, S.; Ma, Y. , Identifying Key Genes and Functionally Enriched Pathways of Diverse Adipose Tissue Types in Cattle. Front Genet 2022, 13, 790690. [Google Scholar] [CrossRef] [PubMed]
- Tan, X.; Liu, R.; Xing, S.; Zhang, Y.; Li, Q.; Zheng, M.; Zhao, G.; Wen, J. , Genome-Wide Detection of Key Genes and Epigenetic Markers for Chicken Fatty Liver. Int J Mol Sci 2020, 21. [Google Scholar] [CrossRef]
- Chen, S.; Zhou, Y.; Chen, Y.; Gu, J. , fastp: an ultra-fast all-in-one FASTQ preprocessor. Bioinformatics 2018, 34, i884–i890. [Google Scholar] [CrossRef] [PubMed]
- Andrews, S., FastQC: a quality control tool for high throughput sequence data. In Babraham Bioinformatics, Babraham Institute, Cambridge, United Kingdom: 2010.
- Dobin, A.; Davis, C. A.; Schlesinger, F.; Drenkow, J.; Zaleski, C.; Jha, S.; Batut, P.; Chaisson, M.; Gingeras, T. R. , STAR: ultrafast universal RNA-seq aligner. Bioinformatics 2013, 29, 15–21. [Google Scholar] [CrossRef] [PubMed]
- Shen, S.; Park, J. W.; Lu, Z.-x.; Lin, L.; Henry, M. D.; Wu, Y. N.; Zhou, Q.; Xing, Y. , rMATS: robust and flexible detection of differential alternative splicing from replicate RNA-Seq data. Proceedings of the National Academy of Sciences 2014, 111, E5593–E5601. [Google Scholar] [CrossRef] [PubMed]
- Liao, Y.; Smyth, G. K.; Shi, W. , featureCounts: an efficient general purpose program for assigning sequence reads to genomic features. Bioinformatics 2014, 30, 923–930. [Google Scholar] [CrossRef]
- Love, M. I.; Huber, W.; Anders, S. , Moderated estimation of fold change and dispersion for RNA-seq data with DESeq2. Genome biology 2014, 15, 1–21. [Google Scholar] [CrossRef]
- Yu, G.; Wang, L.-G.; Han, Y.; He, Q.-Y. , clusterProfiler: an R package for comparing biological themes among gene clusters. Omics: a journal of integrative biology 2012, 16, 284–287. [Google Scholar] [CrossRef]
| Adipose | Blood | Heart | Kidney | Lung | Muscle | Ovary | Spleen | |
|---|---|---|---|---|---|---|---|---|
| DASGs | 4187 | 2898 | 173 | 242 | 315 | 244 | 584 | 1721 |
| SDASGs | 1740 | 909 | 41 | 63 | 80 | 56 | 101 | 280 |
| SDASGs/DASGs | 41.56% | 31.37% | 23.70% | 26.03% | 25.40% | 22.95% | 17.29% | 16.27% |
| DEGs | 840 | 960 | 178 | 218 | 358 | 310 | 1348 | 620 |
| SDEGs | 504 | 604 | 69 | 109 | 210 | 161 | 880 | 311 |
| SDEGs/DEGs | 60% | 62.92% | 38.76% | 50% | 58.66% | 51.94% | 65.28% | 50.16% |
| coDASG_DEGs | 83 | 164 | 0 | 4 | 4 | 2 | 15 | 65 |
Disclaimer/Publisher’s Note: The statements, opinions and data contained in all publications are solely those of the individual author(s) and contributor(s) and not of MDPI and/or the editor(s). MDPI and/or the editor(s) disclaim responsibility for any injury to people or property resulting from any ideas, methods, instructions or products referred to in the content. |
© 2024 by the authors. Licensee MDPI, Basel, Switzerland. This article is an open access article distributed under the terms and conditions of the Creative Commons Attribution (CC BY) license (http://creativecommons.org/licenses/by/4.0/).


