1. Introduction
In efforts to reduce environmental pollution, there is a significant emphasis on green energy, leading to the flourishing development of lithium-ion battery energy storage systems and electric vehicles. To meet the demands of fast charging for electric vehicles and the automatic frequency regulation capabilities required for energy storage systems to provide rapid response reserve services, the high-speed charge and discharge performance has become an essential requirement for the future development of lithium-ion batteries. To enhance the fast charging and discharging performance of lithium-ion batteries, the most common approach is to employ methods that reduce the internal resistance of the battery. Due to its high conductivity, carbon nanotubes [
1] and graphene [
2] are often used as conductive additives for electrodes. The utilization of conductive additives serves to expedite electronic conduction at the interface between active materials, as well as between the active materials and current collectors. Additionally, these additives play a crucial role in diminishing the overall contact resistance within the electrode, thereby mitigating polarization, particularly during high-current-density charging and discharging. Furthermore, they contribute to the adsorption of the electrolyte, thereby facilitating ion diffusion through the electrode. However, carbon nanotubes (CNTs) exhibit a small diameter in the nanometer scale and a high aspect ratio (>1000), resulting in an extremely large surface area. Similarly, graphene also possesses a remarkably large surface area. Besides the issue of high production costs, the dispersion of these two materials is equally a significant challenge. Findings from the studies by P.-C. Ma et al.[
3] and S.P. et al.[
4] indicated that carbon nanotubes and graphene were often employed in composite formulations with polymers to address their inherent dispersion challenges.
Polyaniline is a conductive polymer formed from the monomer aniline, exhibiting pseudocapacitance characteristics [
5]. Polyaniline is characterized by its low cost, low density, high stability in oxidation and water, electrical conductivity, and reversible oxidation and reduction. It is also applied as the active material for both the cathode and anode in lithium batteries. Depending on the degree of oxidation, a single polyaniline polymer chain may exhibit both benzene-benzene reduced state and benzene-quinone oxidized state [
6]. In each case, adjacent benzene monomers are connected by amino and imine groups, respectively. The energy gap of polyaniline (~1.54 eV) is similar to the semiconductor energy gap (~1.3 eV). Through a doping process, the energy gap can be reduced to enhance conductivity. In an acidic environment, nitrogen on the imine group in polyaniline is easily protonated. Due to the conjugated double-bond structure in the main chain of polyaniline, it exhibits conductivity.
F. Zeng et al. [
7] found that the microstructures of polyanilines formed via interfacial polymerization with a single oxidant (ammonium persulfate) were markedly different from those formed with composite oxidants like APS/FeCl
3 (ammonium and ferric chloride) or APS/K
2Cr
2O
7 (ammonium and potassium dichromate). When introducing FeCl
3 as the second component instead of APS as a single oxidant, a similar nanofibrous morphology in PANI was observed, with a slight increase in average diameter from 70 nm to 80 nm. However, PANI prepared with K
2Cr
2O
7 as the second component in composite oxidants did not exhibit the typical nanofibrous structure seen in general interfacial polymerization systems. Specifically, the product displayed a unique petal-like structure with sphere diameters of 500 nm. Beyond the essential parameters for aniline oxidation, in accordance with Tran et al. [
8], various other reaction and processing parameters play a crucial role in influencing the microstructure of polyaniline. These additional factors encompass the type of template employed, the introduction of chemical additives during aniline oxidation, and the specific methodology utilized in the polymerization process. According to Felipe de Salas et al. [
9], the microstructure of polyaniline was significantly influenced by external templates guiding nanostructural growth either within or around self-assembled micelles. Dodecylbenzenesulfonate (SDBS) led to nanofibers, docusate sodium salt (AOT) resulted in granular spheres, sodium dodecyl sulfate (SDS) produced splinters, and sodium lauryl ether sulfate (SLES) led to amorphous agglomerates. Sathish et al.[
10] achieved oxidative polymerization of aniline by MnO
2 on the surface of graphene, leading to the formation of a microstructure comprising porous polyaniline (PANI) nanofibers on the graphene surface.
Previous studies have rarely explored the uniform dispersion of nanoporous polyaniline on the graphene surface to form graphene-polyaniline composites. In this study, hydrochloric acid (HCl) was used as a dopant, and ammonium persulfate was employed as the oxidant during the polymerization process of polyaniline. Additionally, it served as a surface modifier for graphene, resulting in the formation of polyaniline-modified graphene composites. In the past, this composite material was frequently applied in supercapacitors [
11,
12], with relatively fewer applications in the field of lithium-ion batteries. The composite is characterized by low production costs and excellent dispersibility during slurry preparation, addressing the aforementioned issues simultaneously. In this report, PMPC was added to the electrodes of lithium-ion batteries as a conductive additive. The effects of varying amount of PMGC on reducing internal resistance, DCIR and impedance were measured. Furthermore, assessed its impact on the charging and discharging efficiency, as well as the cycling performance of the battery.
2. Material and methods
2.1. Preparation of polyaniline-modified graphene composites
Polyaniline-modified graphene composites were synthesized using aniline (99.5% Thermo Scientific, U.S.) and graphene (Enerage, P-ML20, Taiwan) as primary materials. A hydrochloric acid solution (37%, Honeywell, Fluka, U.S.) was diluted with deionized water and utilized as the doping agent. Ammonium persulfate (98%, Showa, Japan) was dissolved in deionized water and employed as the oxidant. The synthesis process followed these steps: initially, graphene was added to aniline under a nitrogen atmosphere, and the mixture underwent oscillation using a bath-type ultrasonic oscillator at a low temperature (≤15°C) for 6 hours. Deionized water was added to the glass-jacketed reaction vessel, followed by cooling. Subsequently, the pre-mixed graphene-aniline slurry was introduced into the reaction vessel, and diluted hydrochloric acid was added. The ammonium persulfate aqueous solution was slowly dripped into the vessel at approximately 5°C. The resulting precipitate was collected, dried under vacuum, and the doped material was obtained. This material underwent de-doping through the introduction of ammonium hydroxide, resulting in the formation of polyaniline-modified graphene composites.
2.2. Characterization
The material's microstructure was examined via field emission scanning electron microscopy (ZEISS ULTRA PLUS, Hitachi S-3000N). The tap density was determined using Micromeritics ASAP 2020. Thermogravimetric analysis (TGA) was conducted with NEXTA STA200 by Hitachi to observe the thermal weight loss behavior of the composite. Raman spectroscopy (UniDRON) and Fourier-transform infrared spectroscopy (FTIR, PerkinElmer Spectrum 100 FT-IR Spectrometers) were employed as primary techniques for studying molecular structures, confirming the presence of polyaniline coating on the surface of graphene.
2.3. Battery fabrication
Regarding the batteries fabricated in this study, the primary materials utilized are detailed as follows. The cathode electrode material comprised NMC622 (T61R, Shanshan Energy Technology Co., Ltd.), while the anode electrode material was a blend of intercalated graphite microspheres (MCMB) MG11-A (China Steel Chemical Corporation) and graphite MAGE3 (Showa Denko Materials Co., Ltd.). The key components of the electrolyte included Ethylene Carbonate (EC) / Ethyl Methyl Carbonate (EMC) / Diethyl Carbonate (DEC). The separator (WE20, WSCPOE) was constructed from polyethylene (PE) and featured a three-layer structure with ceramic layers on both sides, resulting in a total separator thickness of 16 μm.
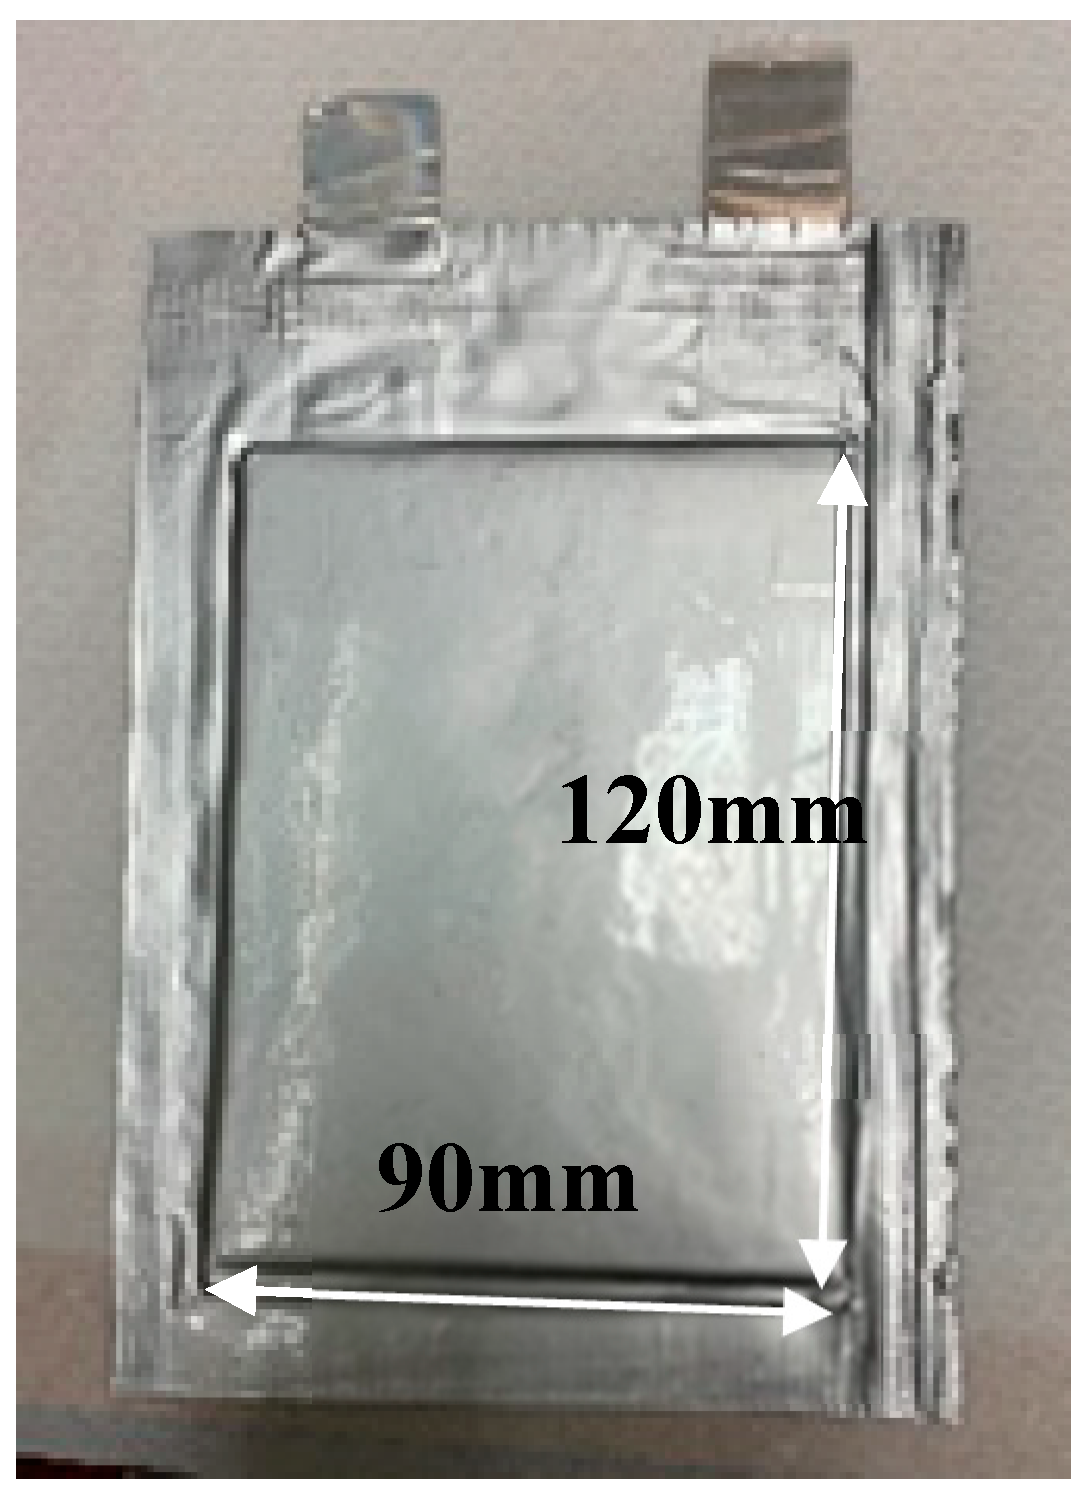
A pouch-type lithium battery with a 3600mAh capacity was produced, as depicted in
Figure 1, featuring electrode dimensions approximately measuring 120mm in length and 90mm in width. The standard battery manufacturing process comprised battery design, electrode fabrication, battery assembly, and formation. Following the completion of battery assembly, and before commencing the formation process, the internal resistance of the battery was measured using the Battery Internal Resistance Tester (Hioki BT3563).
As indicated in
Table 1, an evaluation of the influence of varying quantities of PMGC was conducted by incorporating 0%, 0.5%, and 1% of PMGC into the cathode and anode electrodes, respectively. These additions replaced a minor portion of the active material within the electrodes. The cathode electrode and anode electrode were designated with three distinct codes each: Ca1, Ca2, Ca3, and An1, An2, An3, respectively.
The cathode and anode electrodes, with varying contents as outlined in
Table 1, were paired and assembled into complete batteries. The nomenclature of batteries in Test 1 is detailed in
Table 2. Test 1 encompassed 9 groups (G1-G9) of batteries, each consisting of 5 batteries. G1 functioned as the control group with no PMGC addition, employing Ca1 and An1 for the cathode and anode electrodes, respectively. The five batteries within the control group were designated C0A0-1 to C0A0-5. The nomenclature for battery IDs in the other groups (G2-G9) followed a similar sequence.
Drawing insights from the experimental findings of Test 1, the optimal quantity of PMGC was identified. Subsequently, Test 2 was formulated, as outlined in
Table 3. The primary distinction between Test 1 and Test 2 resided in the density of the anode electrodes, with the former at 1.4 g/cc and the latter at 1.57 g/cc. The anode electrode code for the latter was designated as NAn1, and it did not incorporate PMGC. This decision was informed by the outcomes of Test 1, where the addition of PMGC into the anode electrode did not yield favorable results.
The cathode and anode electrodes, featuring diverse compositions detailed in
Table 3, were paired and assembled into complete batteries. The nomenclature of batteries in Test 2 is provided in
Table 4. Test 2 comprised 3 groups (G10, G11, and G12) of batteries, each consisting of 4 batteries. G10 functioned as the control group without PMGC addition.
3. Results and Discussion
3.1. Characteristics of polyaniline-modified graphene composites
The powder of the synthesized polyaniline-modified graphene composites, exhibiting a measured tap density of 1.43 g/cm³, offers advantages for slurry preparation and energy density in comparison to typical carbon black, graphene, and CNT, all of which possess tap densities less than 1 g/cm³.
Figure 2(a) and 2(b) depict pure graphene and PMGC, respectively, with the porous polyaniline visibly covering the graphene. In
Figure 2(c), the polyaniline, approximately 10 nanometers in width, forms a network of nano-sized pores, coating the surface of graphene. The addition of these PMGC to the battery electrode led to speculation that these nanoscale pores would enhance the absorption and infiltration of the lithium battery electrolyte.
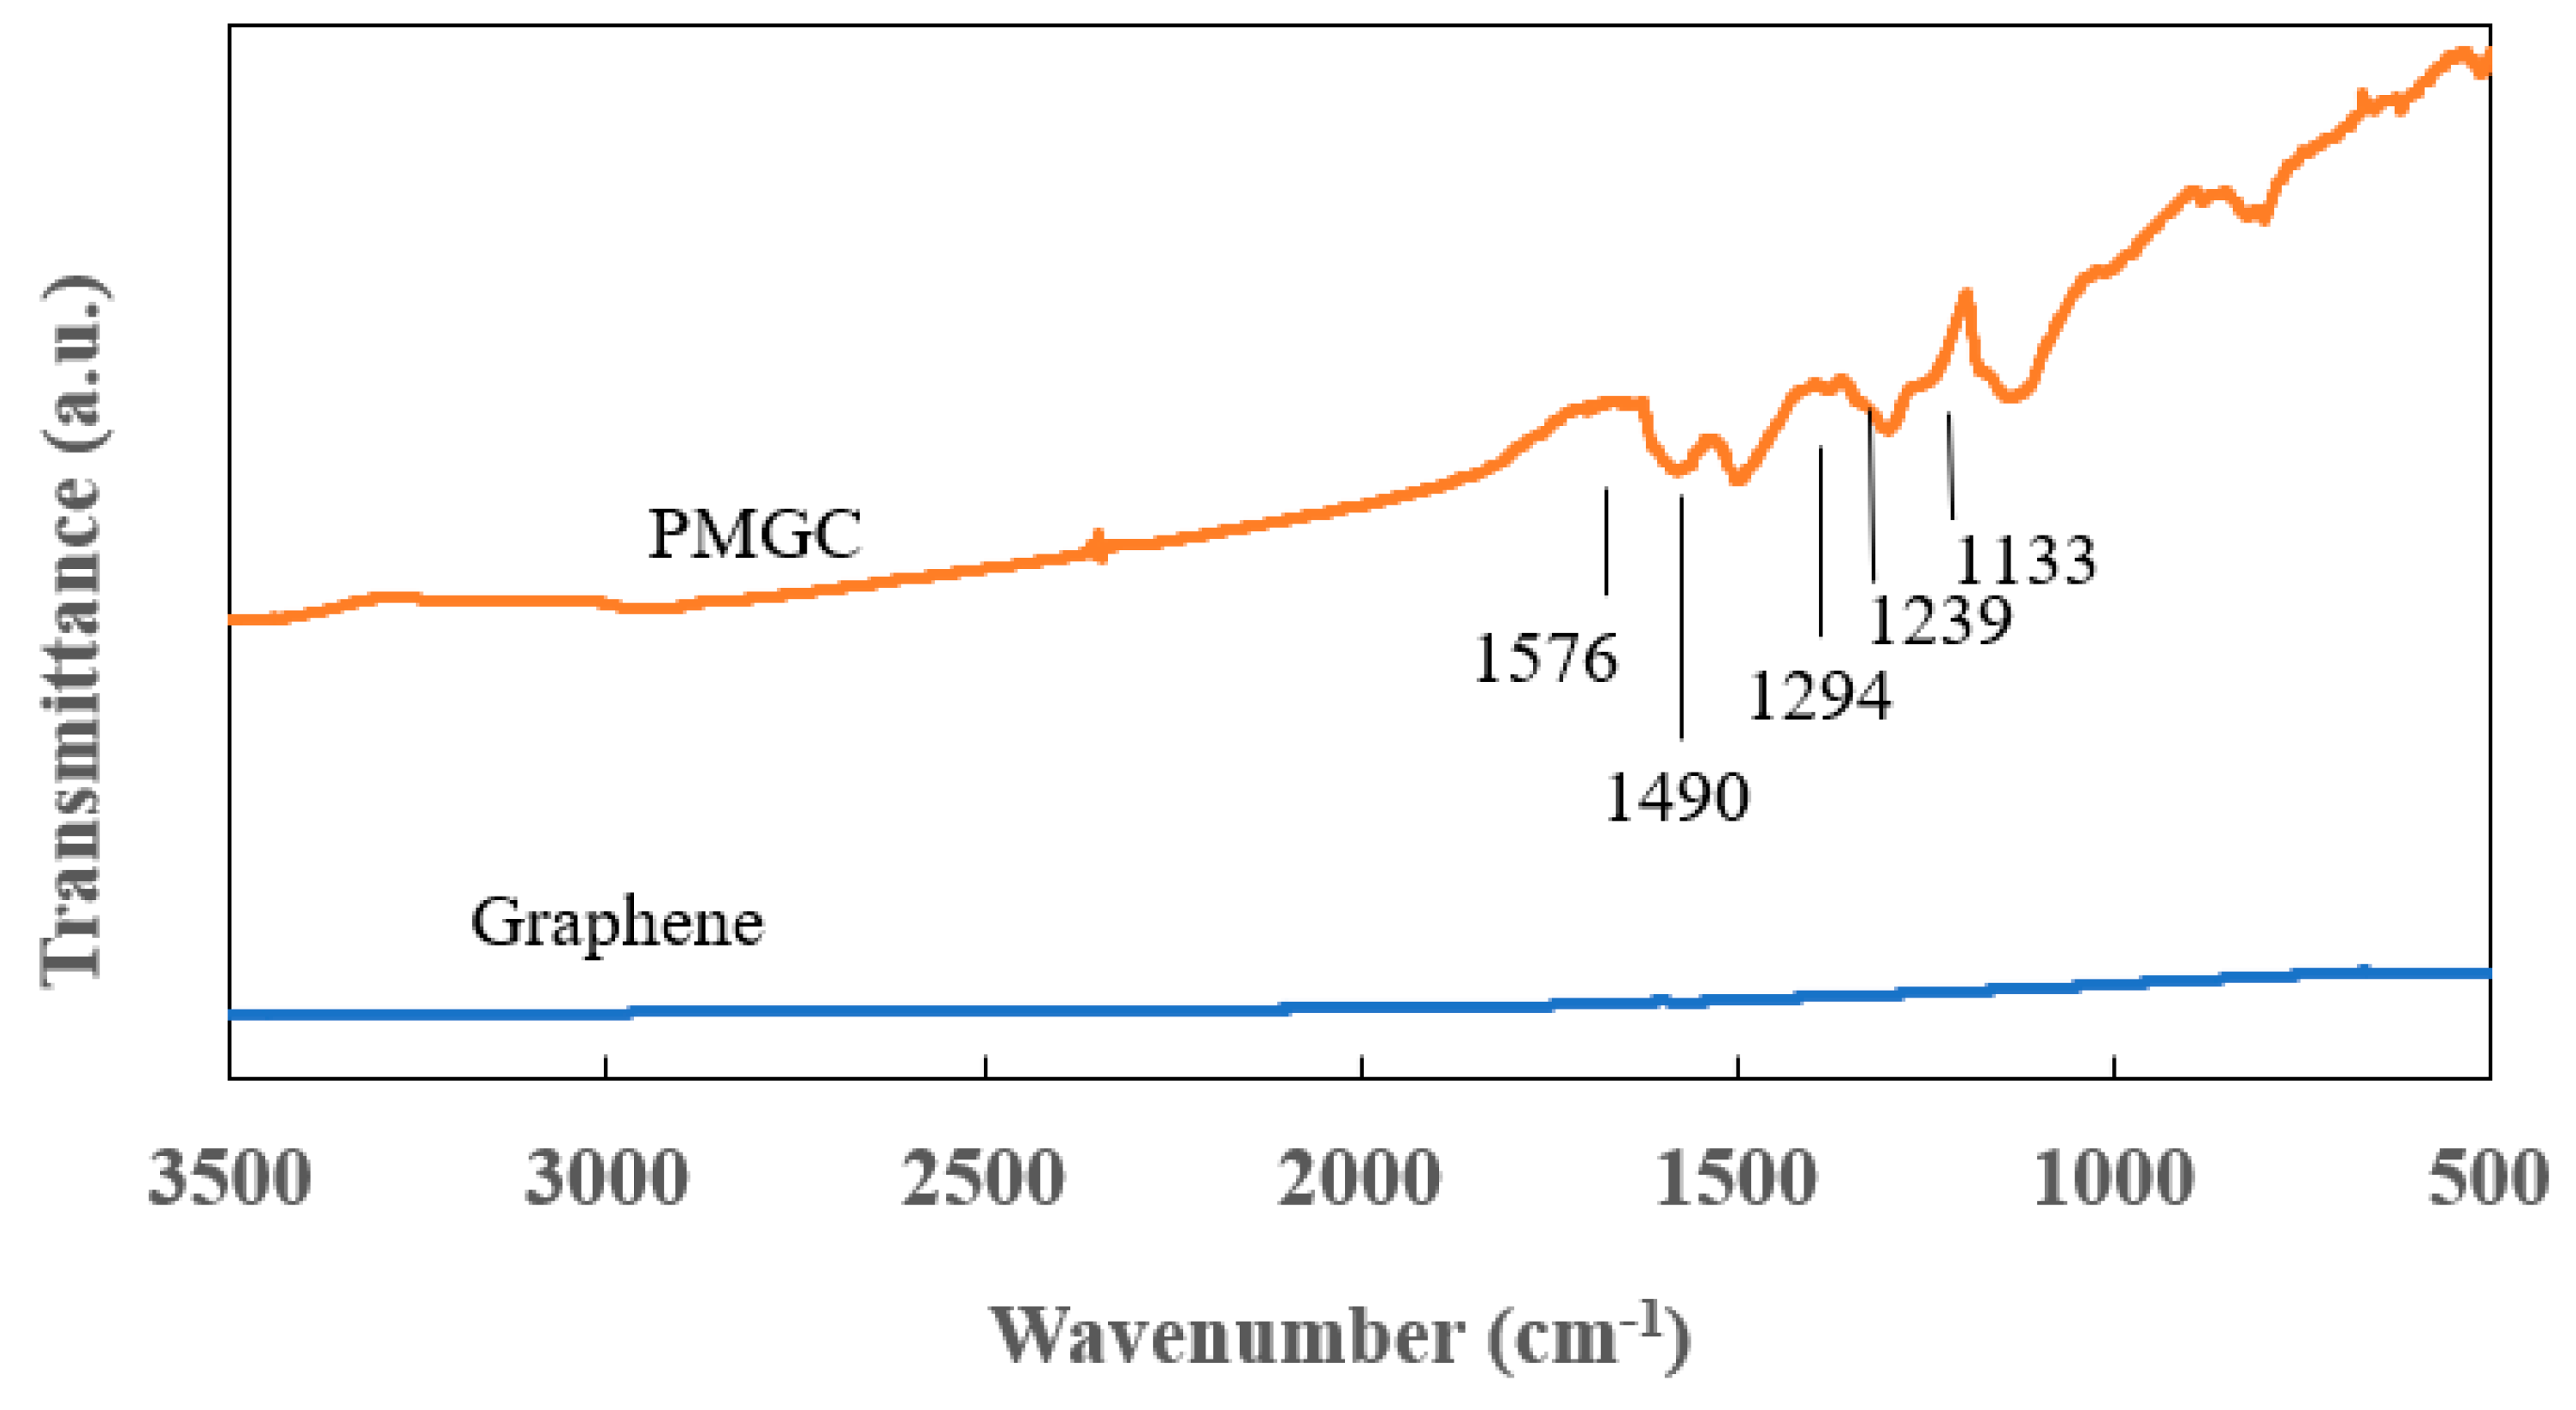
Figure 3 presents the FT-IR spectra of graphene and polyaniline-modified graphene composites. In comparison to PMGC, the spectrum of graphene reveals no distinct features. However, for PMGC, peaks at 1576 and 1490 cm-1 are attributed to the stretching vibration of the quinonoid and benzenoid rings, respectively [
13]. Additionally, bands at 1294 cm-1 can be assigned to the π-electron delocalization induced in the polymer through protonation or C-N-C stretching vibration [
13]. Peaks at 1239 cm-1 and 1133 cm-1 are ascribed to C–N and C–H bending of benzenoid and quinoid rings [
14,
15].
Figure 3 showcases characteristic absorption bands of polyaniline, confirming the successful synthesis of polyaniline, which was coated on the surface of graphene.
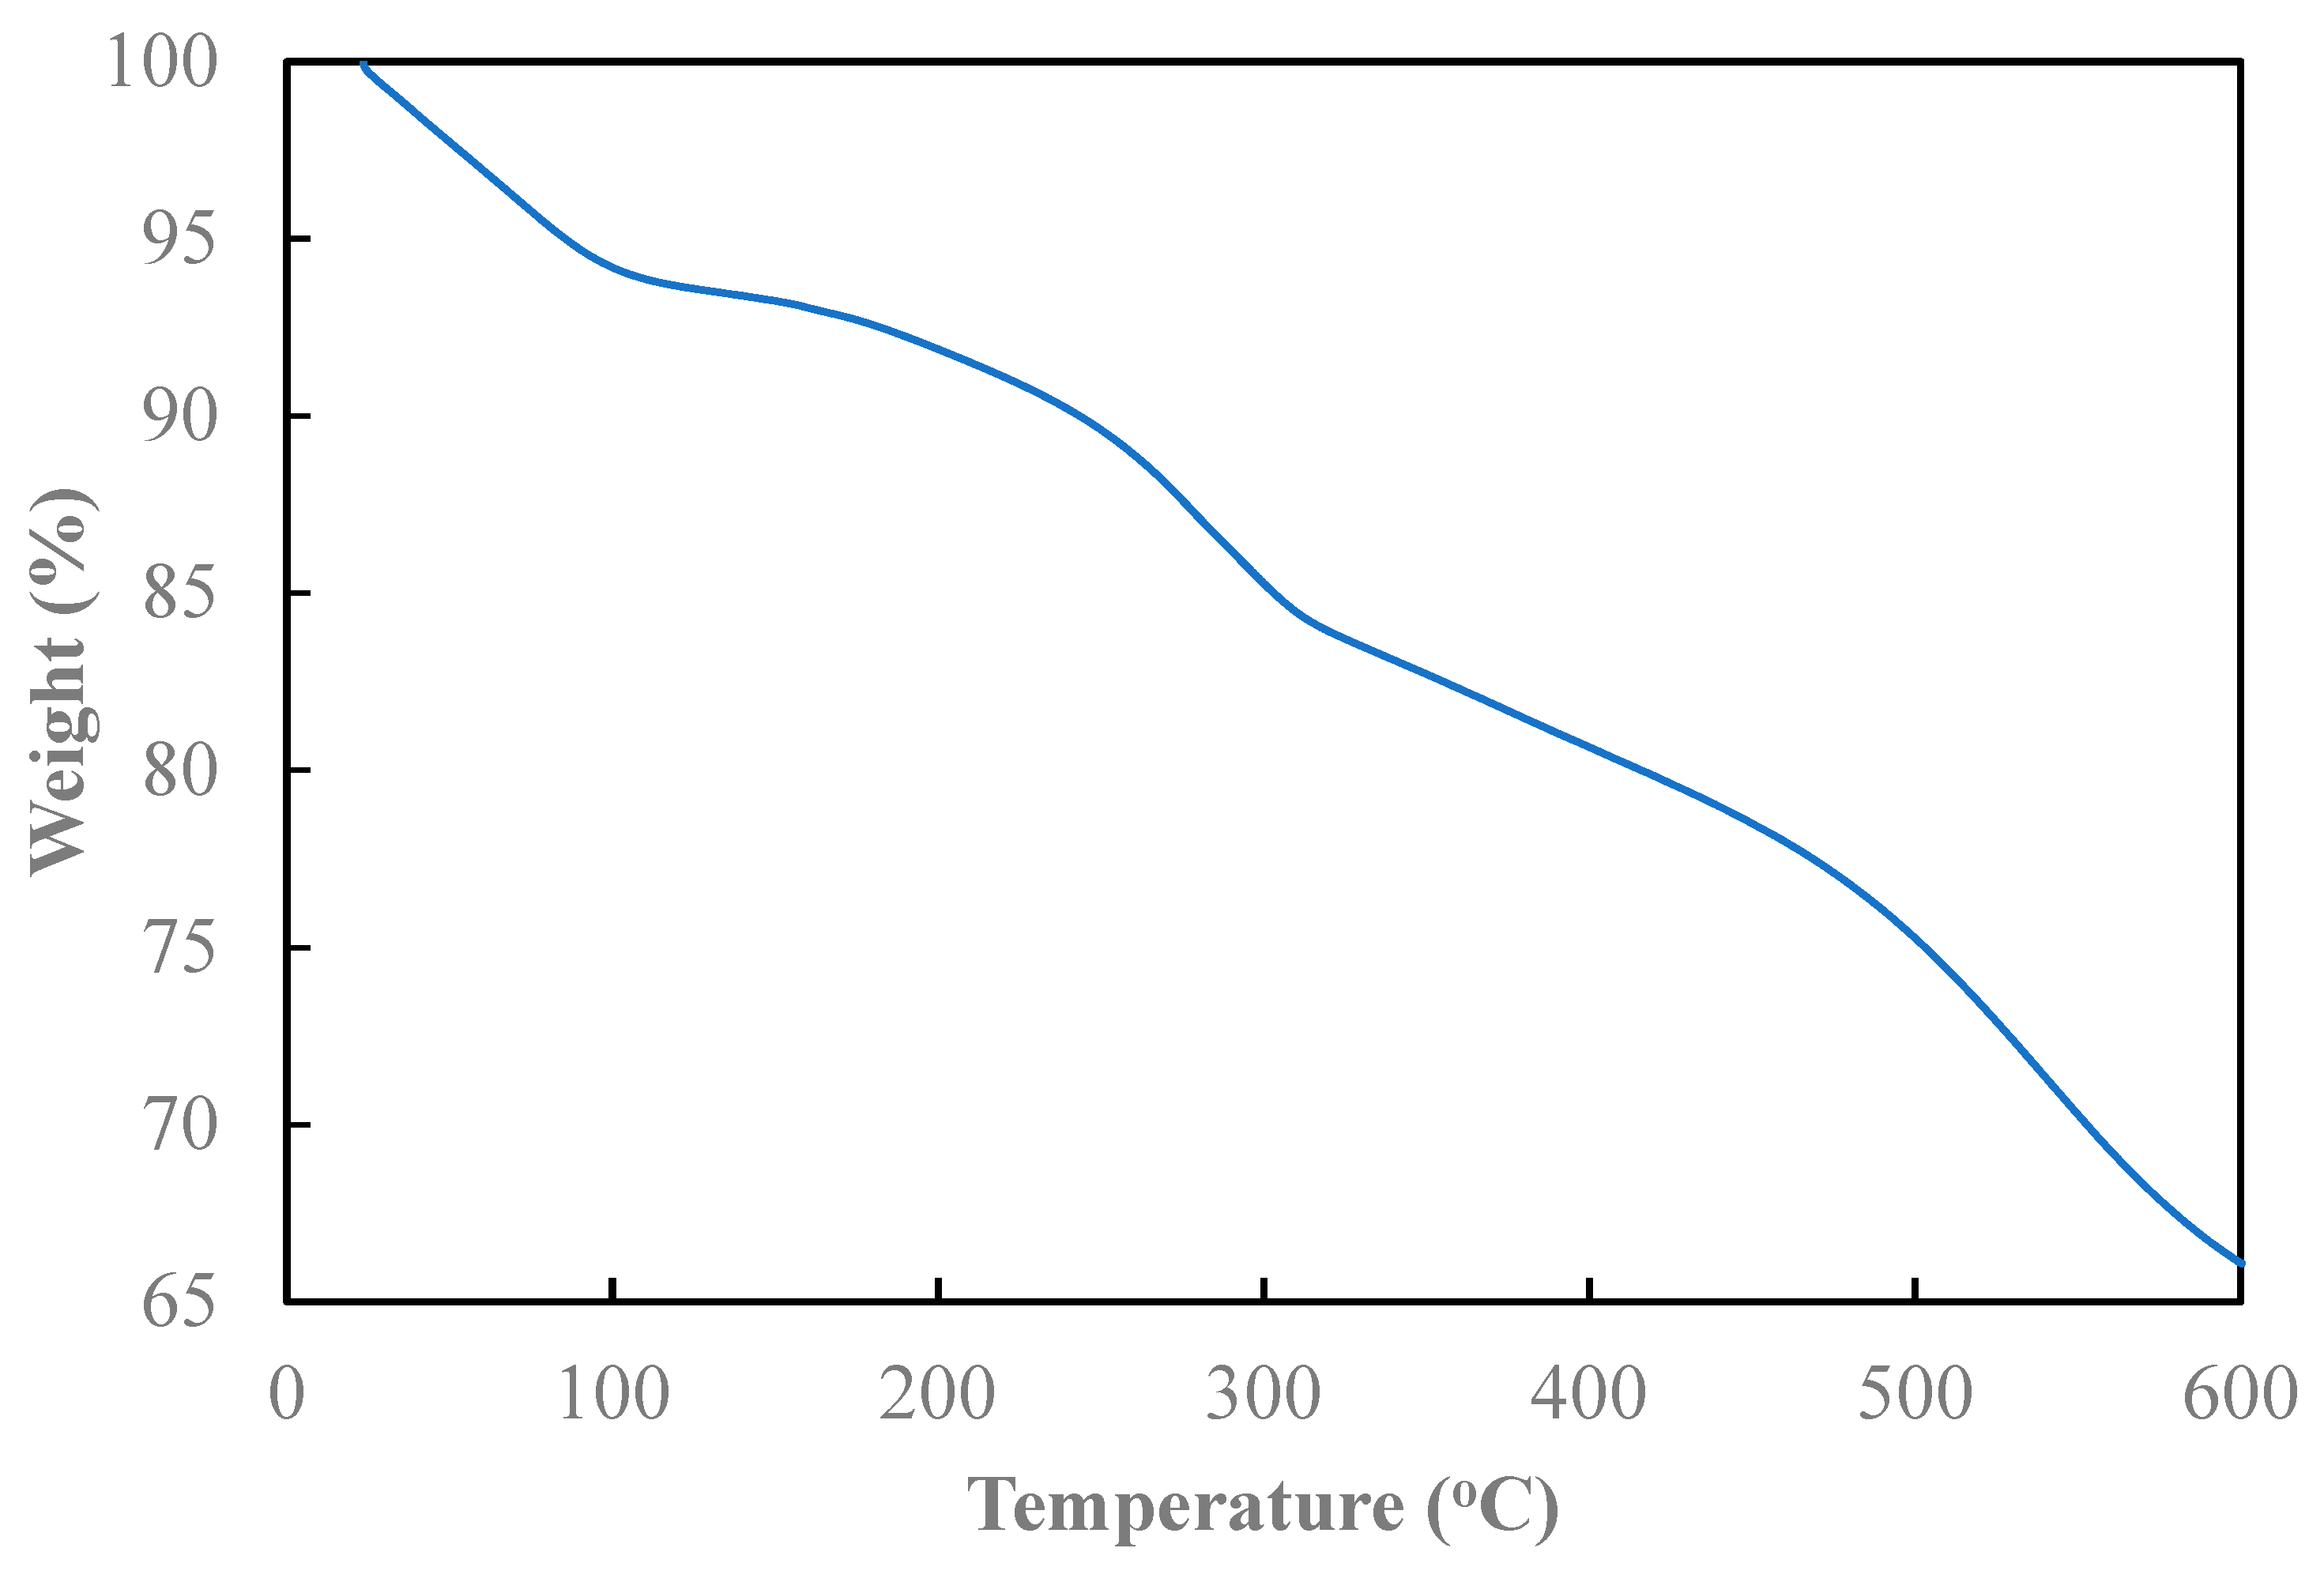
The weight loss of the composite with temperature variation can be obtained from
Figure 4. The primary weight loss is characterized by three distinct steps. The initial stage of weight loss, approximately 6%, occurs from room temperature to around 100°C and is attributed to the vaporization of moisture and the elimination of unreacted monomers in liquid form. The subsequent stage, spanning 100°C to 300°C, is likely associated with the decomposition of doped acid and aniline oligomers formed during the reaction. The final stage, occurring at temperature large than 300°C, could be ascribed to the complete decomposition of the polymer backbone. Similar phenomena were also observed in Yang et al.’s study [
16].
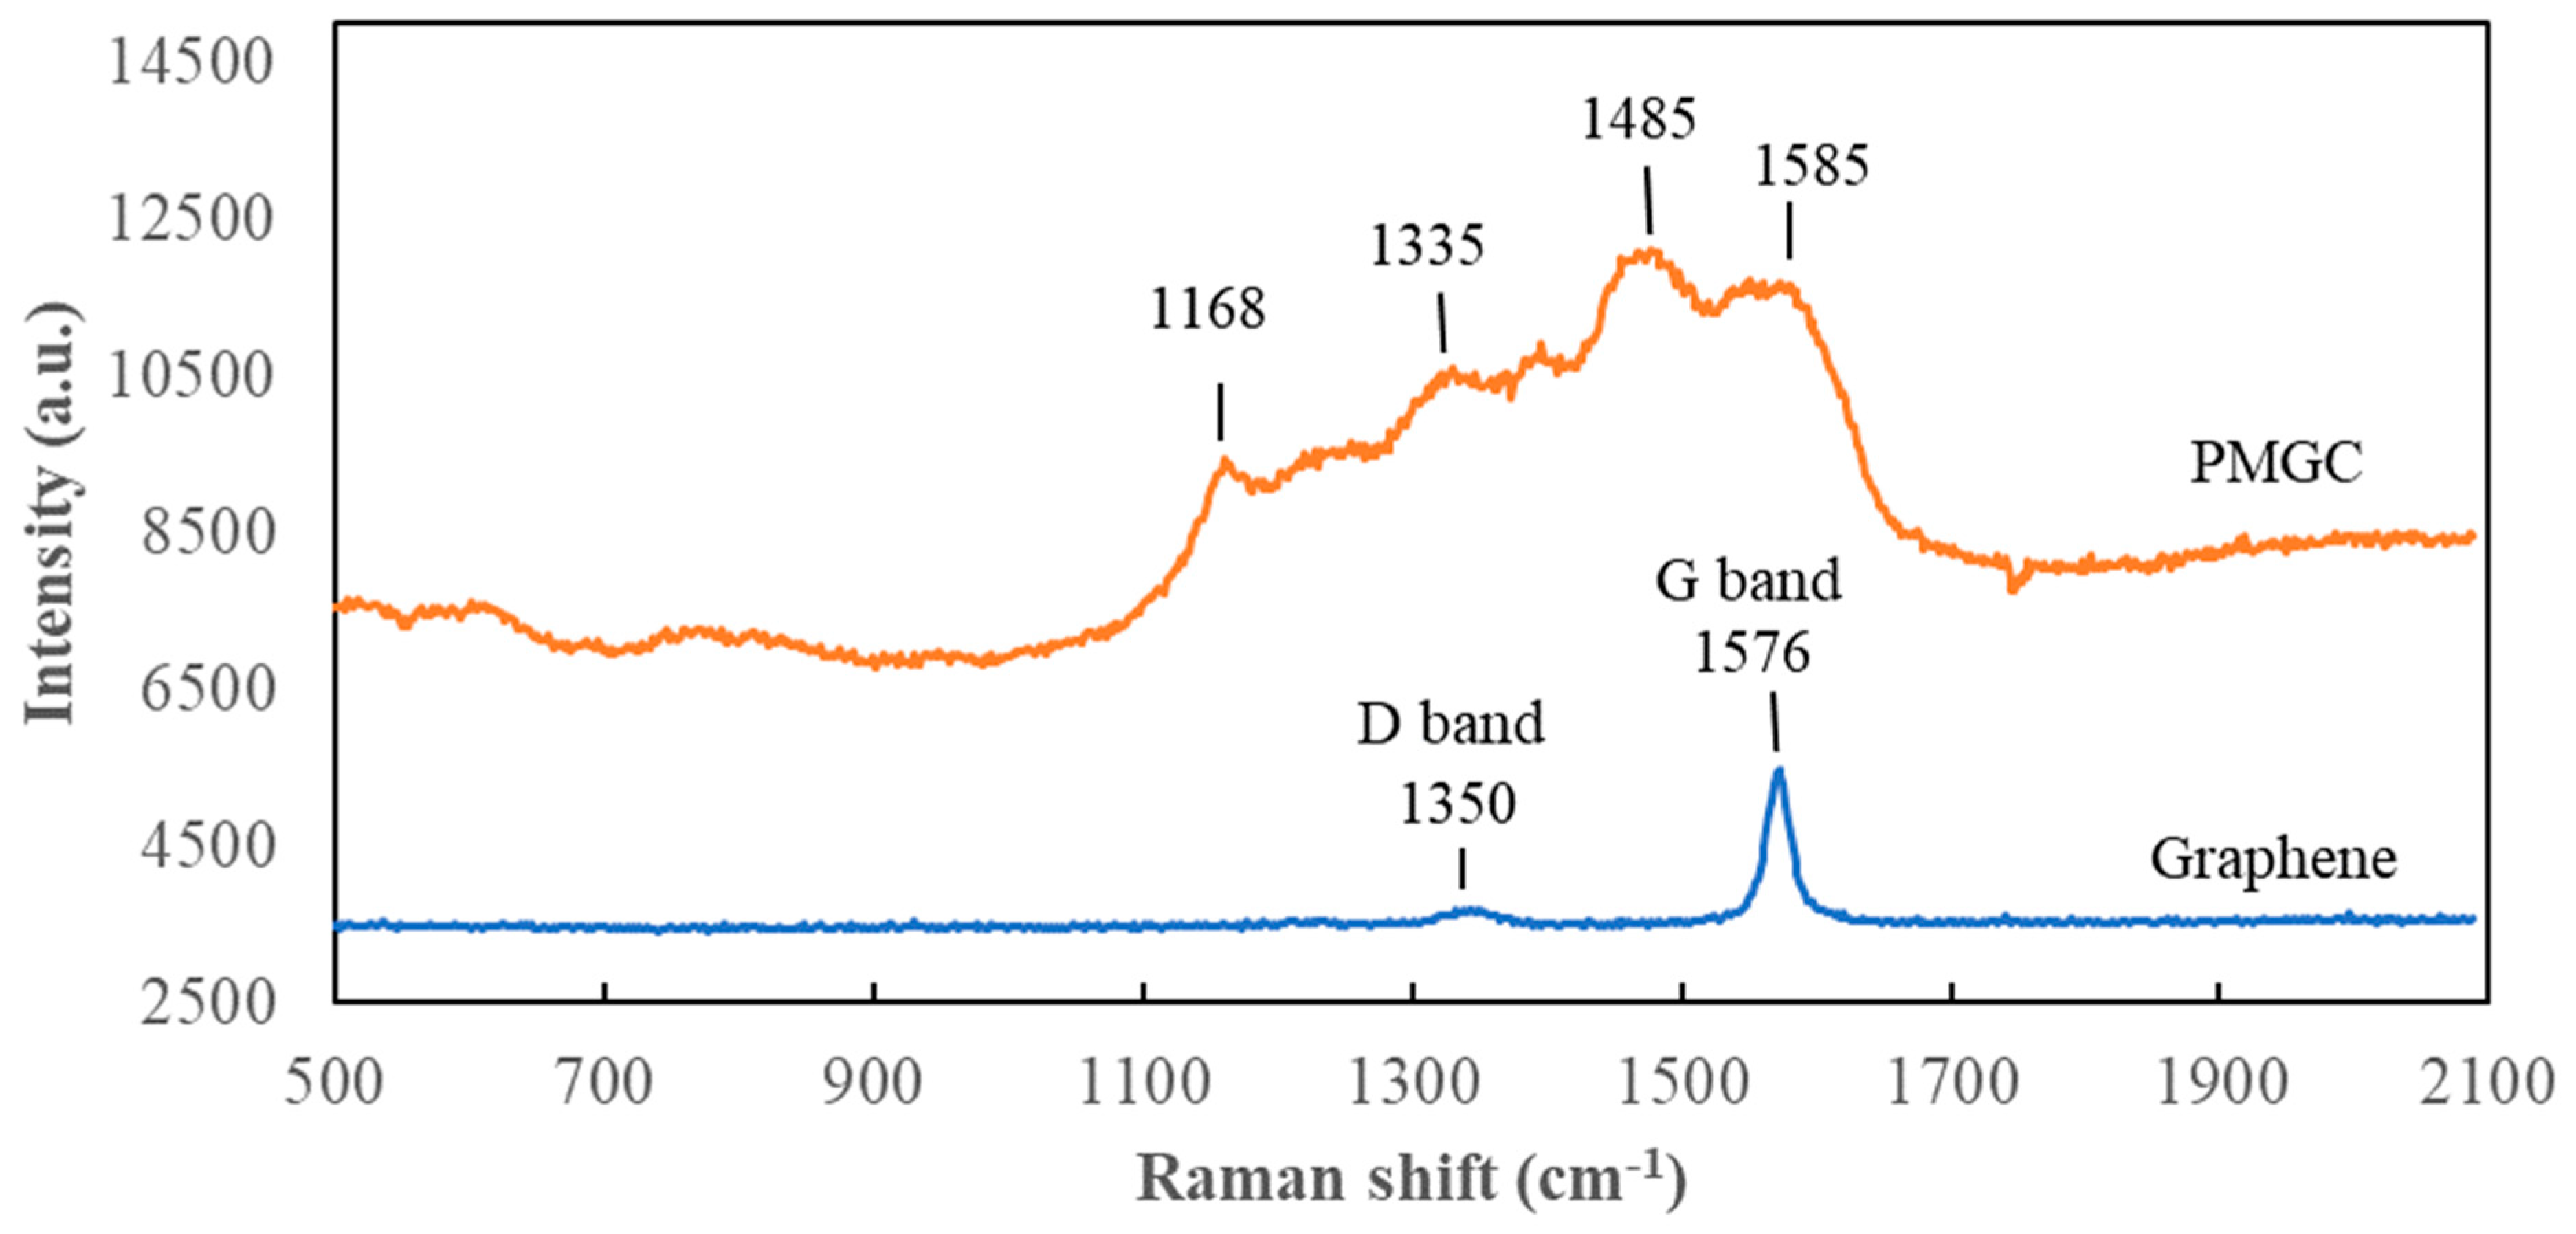
Figure 5 depicts the Raman spectra of graphene and polyaniline-modified graphene composites. Graphene exhibits a prominent Raman-active peak at 1576 cm-1, corresponding to the G band related to the first-order scattering of the E2g mode observed for sp2-carbon domains [
17]. The Raman-active peak at 1350 cm-1, assigned to the D band corresponding to structural defects, is not prominently observed. In the PMGC curve, C–H bending deformation in the benzenoid ring at 1168 cm-1, C–N+ stretching at 1335 cm-1, C=N stretching vibration at 1485 cm-1, and C=C stretching of quinoid at 1585 cm-1 are evident [
15,
18], indicating the presence of the polyaniline structure on the surface of graphene. This outcome aligns with the results obtained from FTIR analysis.
3.2. Internal resistance
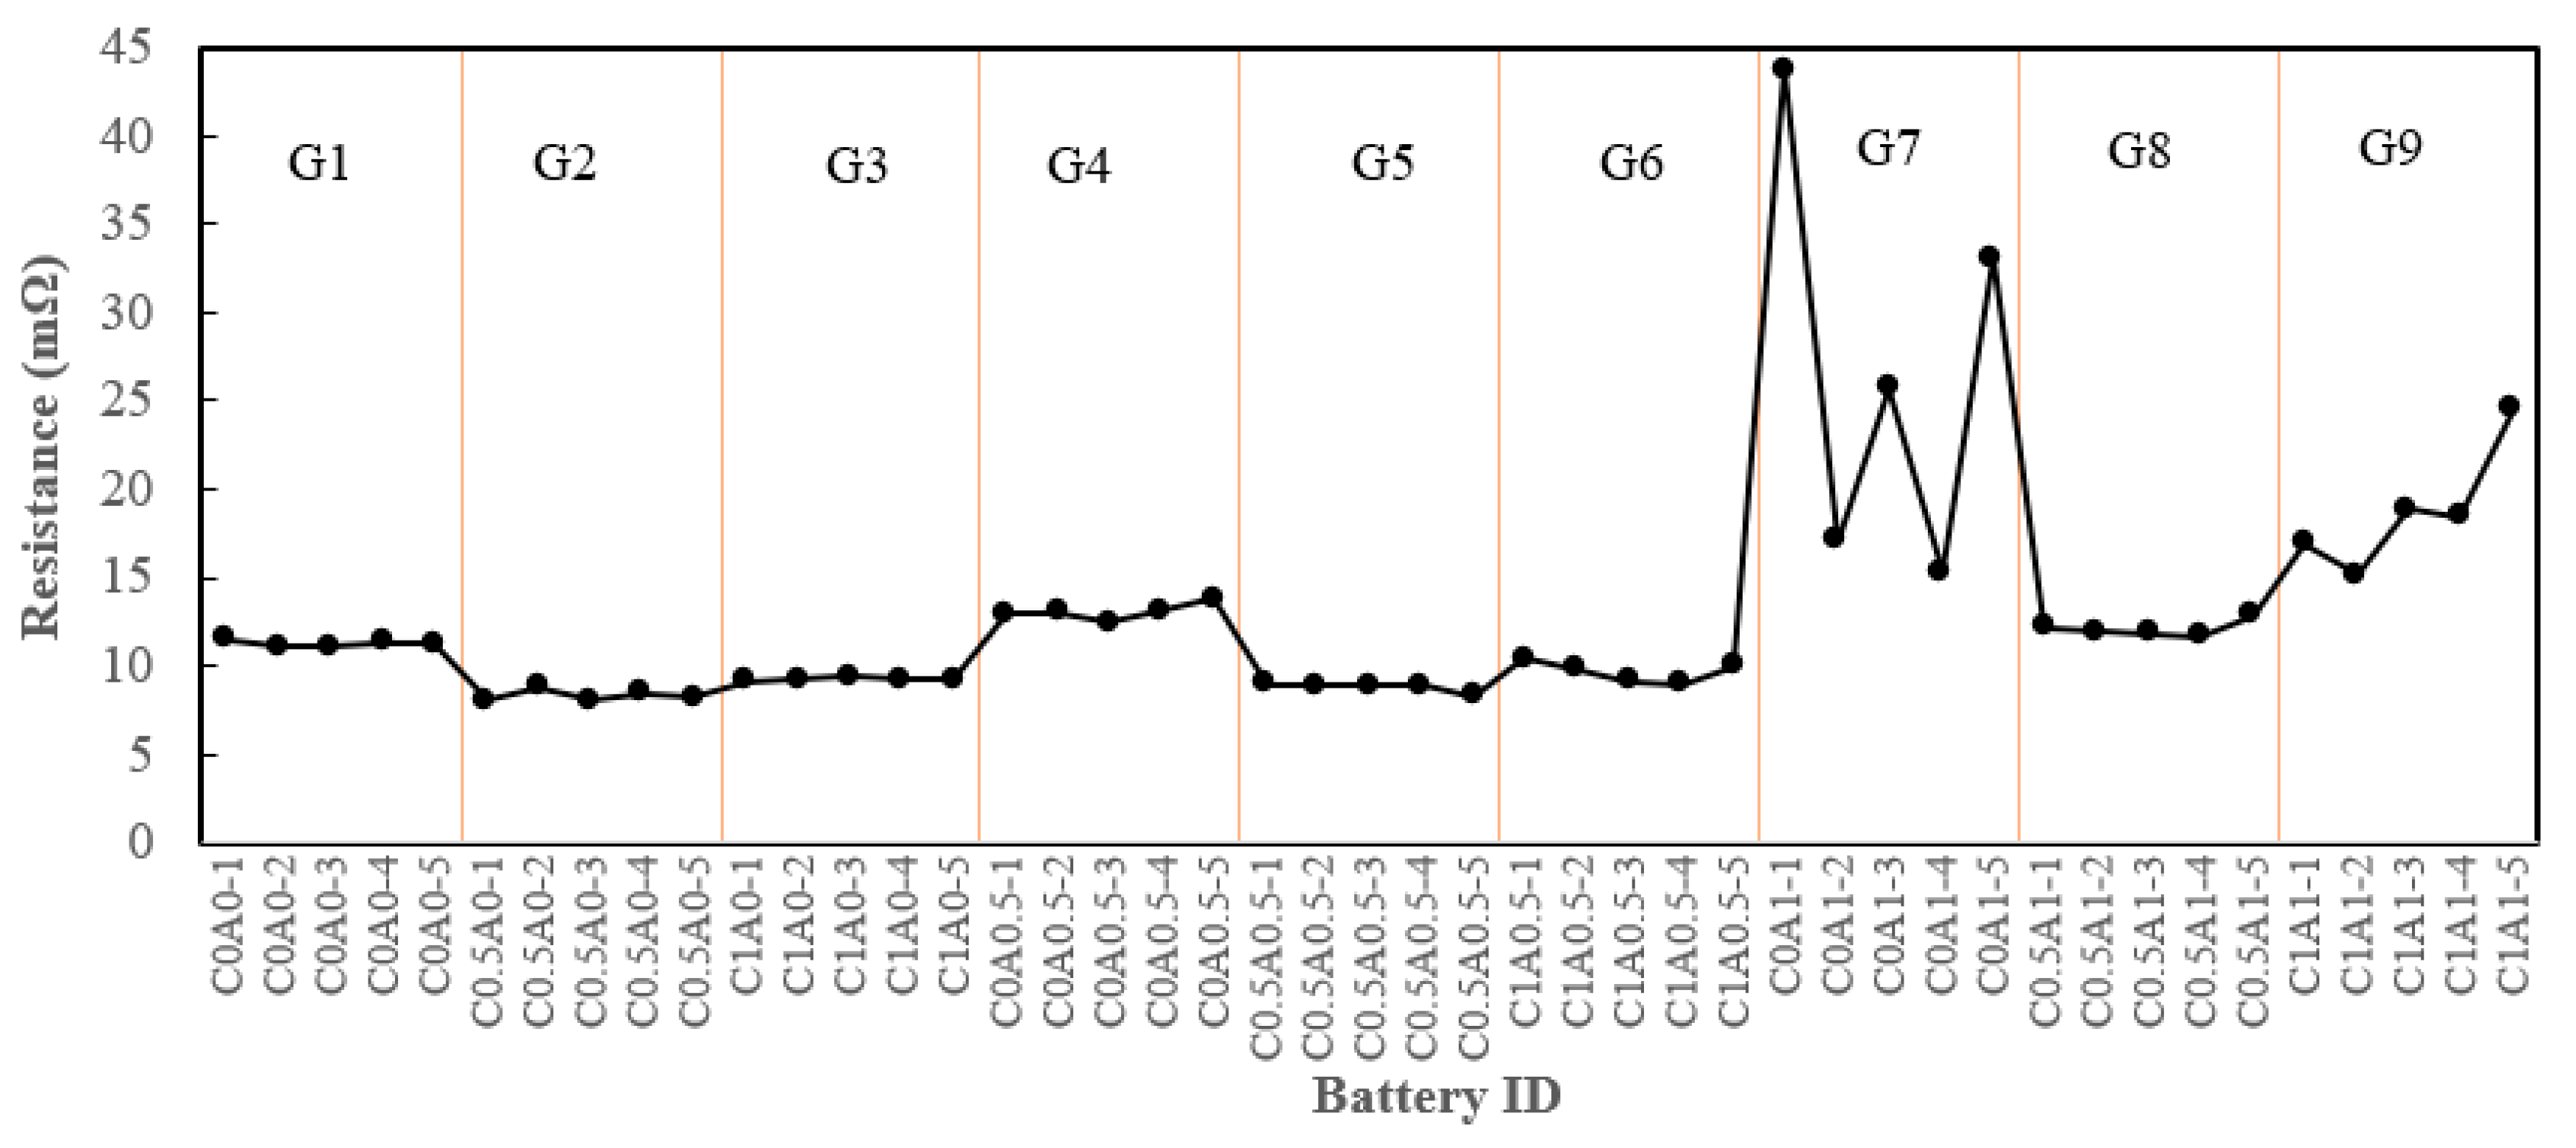
All assembled batteries underwent internal resistance testing prior to the formation process. Batteries with the addition of 0.5% PMGC in the cathode electrode, labeled as C0.5A0-1 to C0.5A0-5 (G2), exhibited a reduction in internal resistance compared to the control group C0A0 (G1), as depicted in
Figure 6. The average resistance decreased from approximately 11.2 mΩ for G1 to an average of 8.3 mΩ for G2. However, the introduction of 1% PMGC in C1A0 (G3) resulted in an average resistance of 9.2 mΩ, showing no further decrease compared to 0.5% PMGC. This observation was speculated to be associated with the directional nature of graphene [
19]. Given graphene's 2D structure, the longer ion transmission path in the plane may lead to inefficient ion conductivity when a higher quantity of PMGC is added.
Nevertheless, the inclusion of PMGC in the anode electrode led to an increase in internal resistance, as evident in C0A0.5 (G4) and C0A1 (G7). This can be attributed to the fact that graphite, serving as the active material in the anode electrode, inherently possesses good conductivity. The addition of PMGC in the anode electrodes resulted in comparatively less advantageous conductivity of polyaniline in the composite.
3.3. Aging
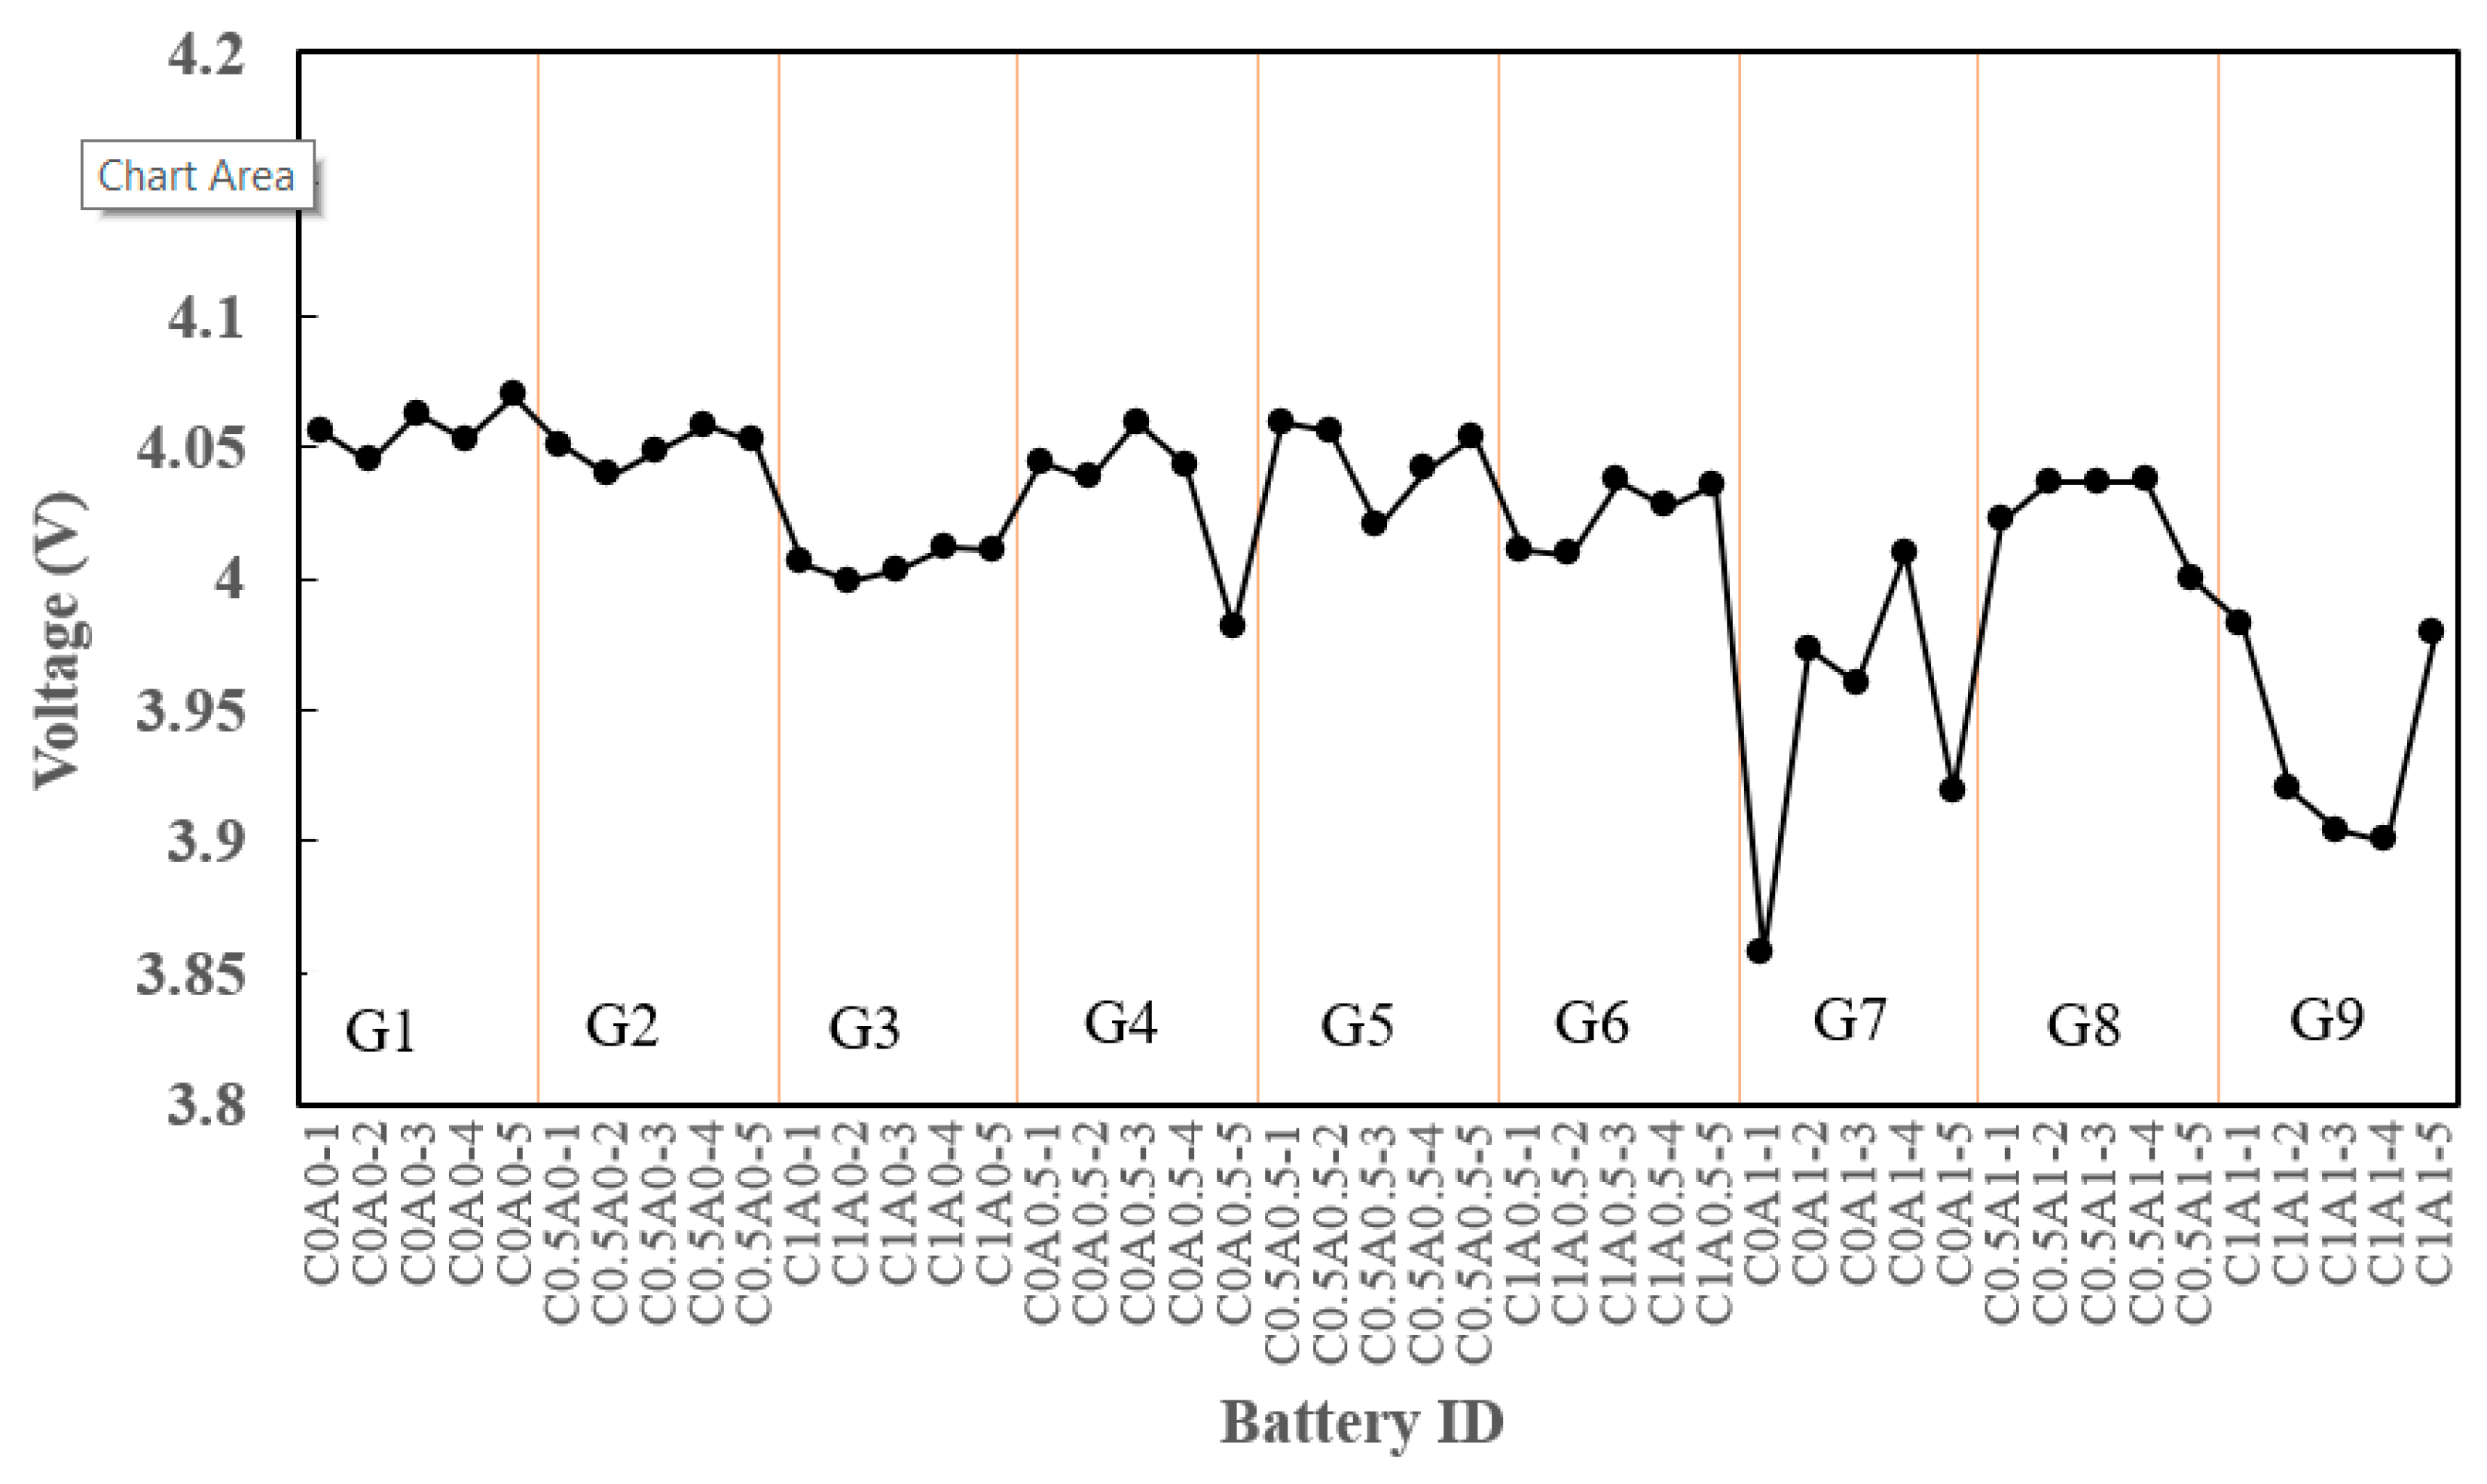
To evaluate the self-discharge behavior, an aging test was conducted on the batteries. Following charging to 4.2V, the batteries were left at room temperature for 24 hours, and their voltages were tested.
Figure 7 illustrates the voltage drop after 24 hours for C0.5A0 (G2), which contained 0.5% PMGC. In comparison to the control group C0A0 (G1), no significant difference is observed. However, batteries with 1% PMGC in either the cathode or anode electrode, such as C1A0 (G3), C1A0.5 (G6), C0A1 (G7), C0.5A1 (G8), and C1A1 (G9), exhibited noticeable voltage drops after 24 hours of aging. This suggests that a higher proportion of PMGC may contribute to significant self-discharge. The excessive addition of conductive additives could have led to negative effects, as they were less likely to disperse uniformly, potentially resulting in self-discharge.
3.4. Fast charge performance
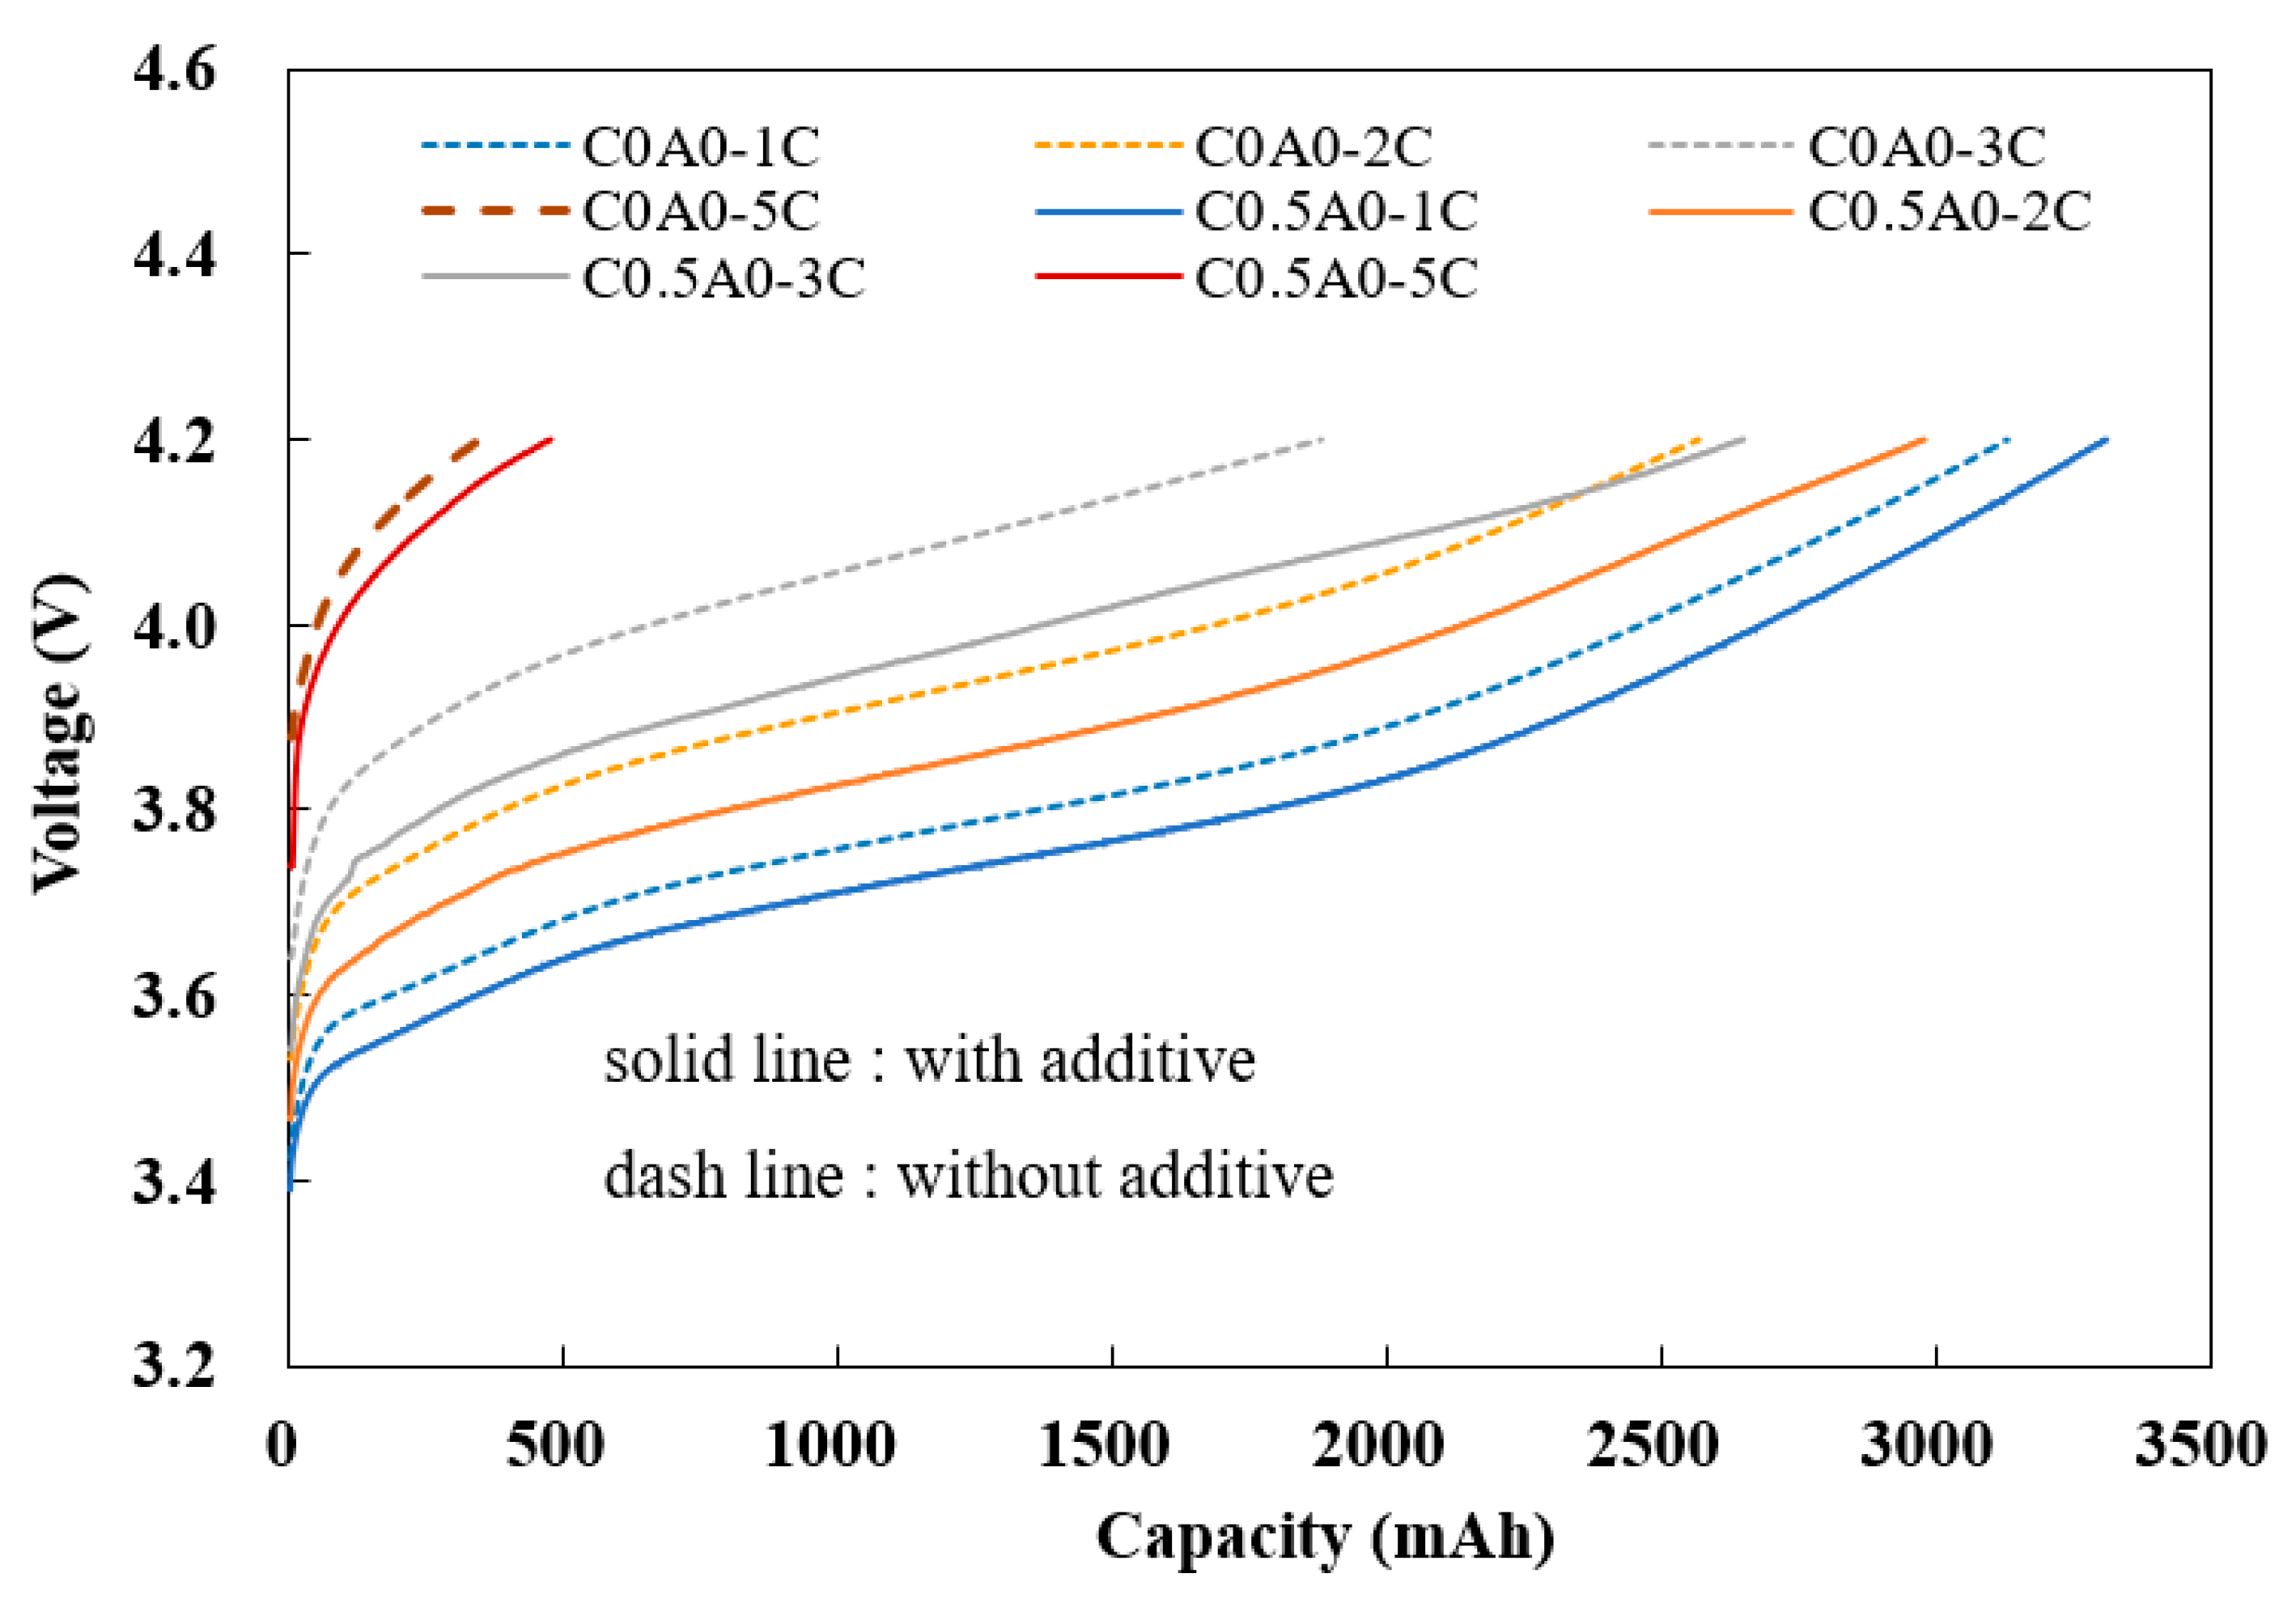
At room temperature, constant current (CC) charging was performed with different currents (1C, 2C, 3C, 5C) until reaching 4.2V, followed by constant voltage (CV) charging until the current reached 0.2C. The charge capacity during constant current charging (CC) was observed. In
Figure 8, the solid line represents the battery C0.5A0 (G2) with 0.5% PMGC in the cathode electrode, and the dashed line represents the control group batteries C0A0 (G1) without PMGC in the cathode electrode.
When utilizing the 1C constant current (CC) capacity as a baseline, the charging capacities at constant currents of 2C, 3C, and 5C, divided by the charging capacity at a constant of 1C, the comparison revealed noteworthy findings. The battery incorporating 0.5% PMGC exhibited a substantial enhancement in its 3C CC charging capacity, achieving an impressive 80% of baseline. This outperformed the control group battery, which lacked PMGC and registered a comparatively lower charging capacity of 60% of baseline. The utilization of PMGC evidently contributes to a more efficient and rapid charging process, showcasing its potential to significantly improve the overall performance of the battery system, as illustrated in
Table 5.
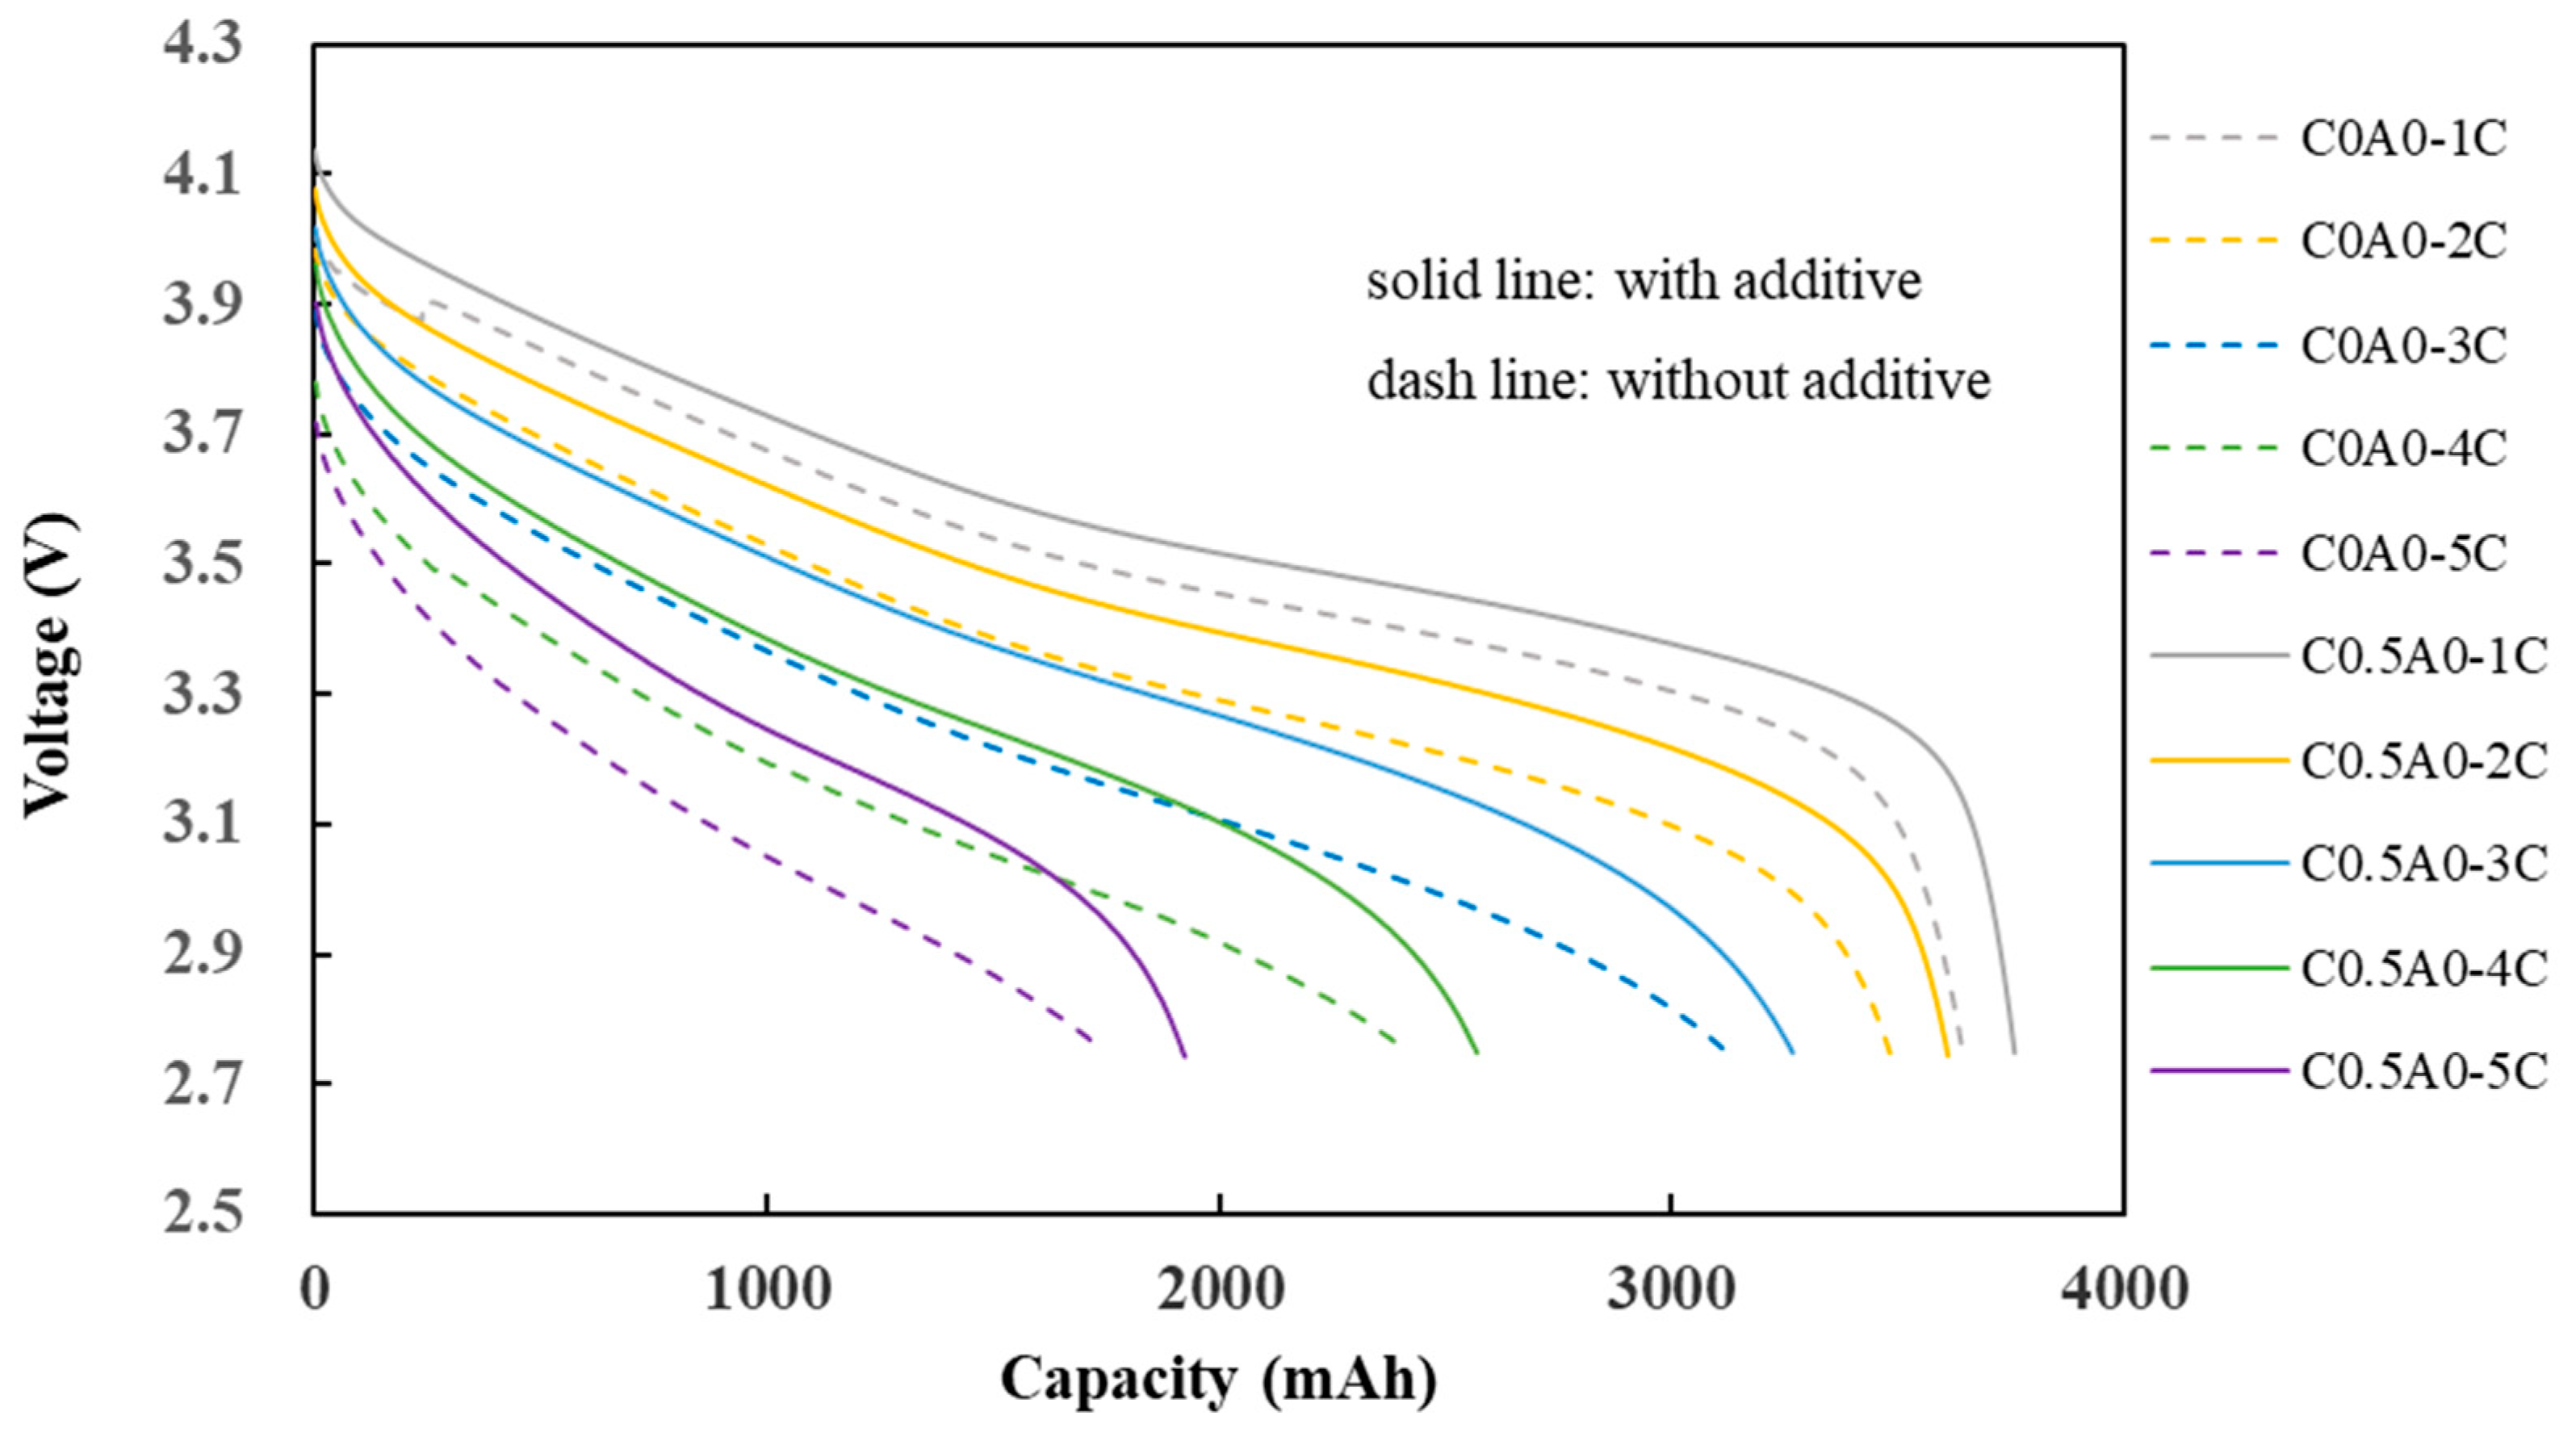
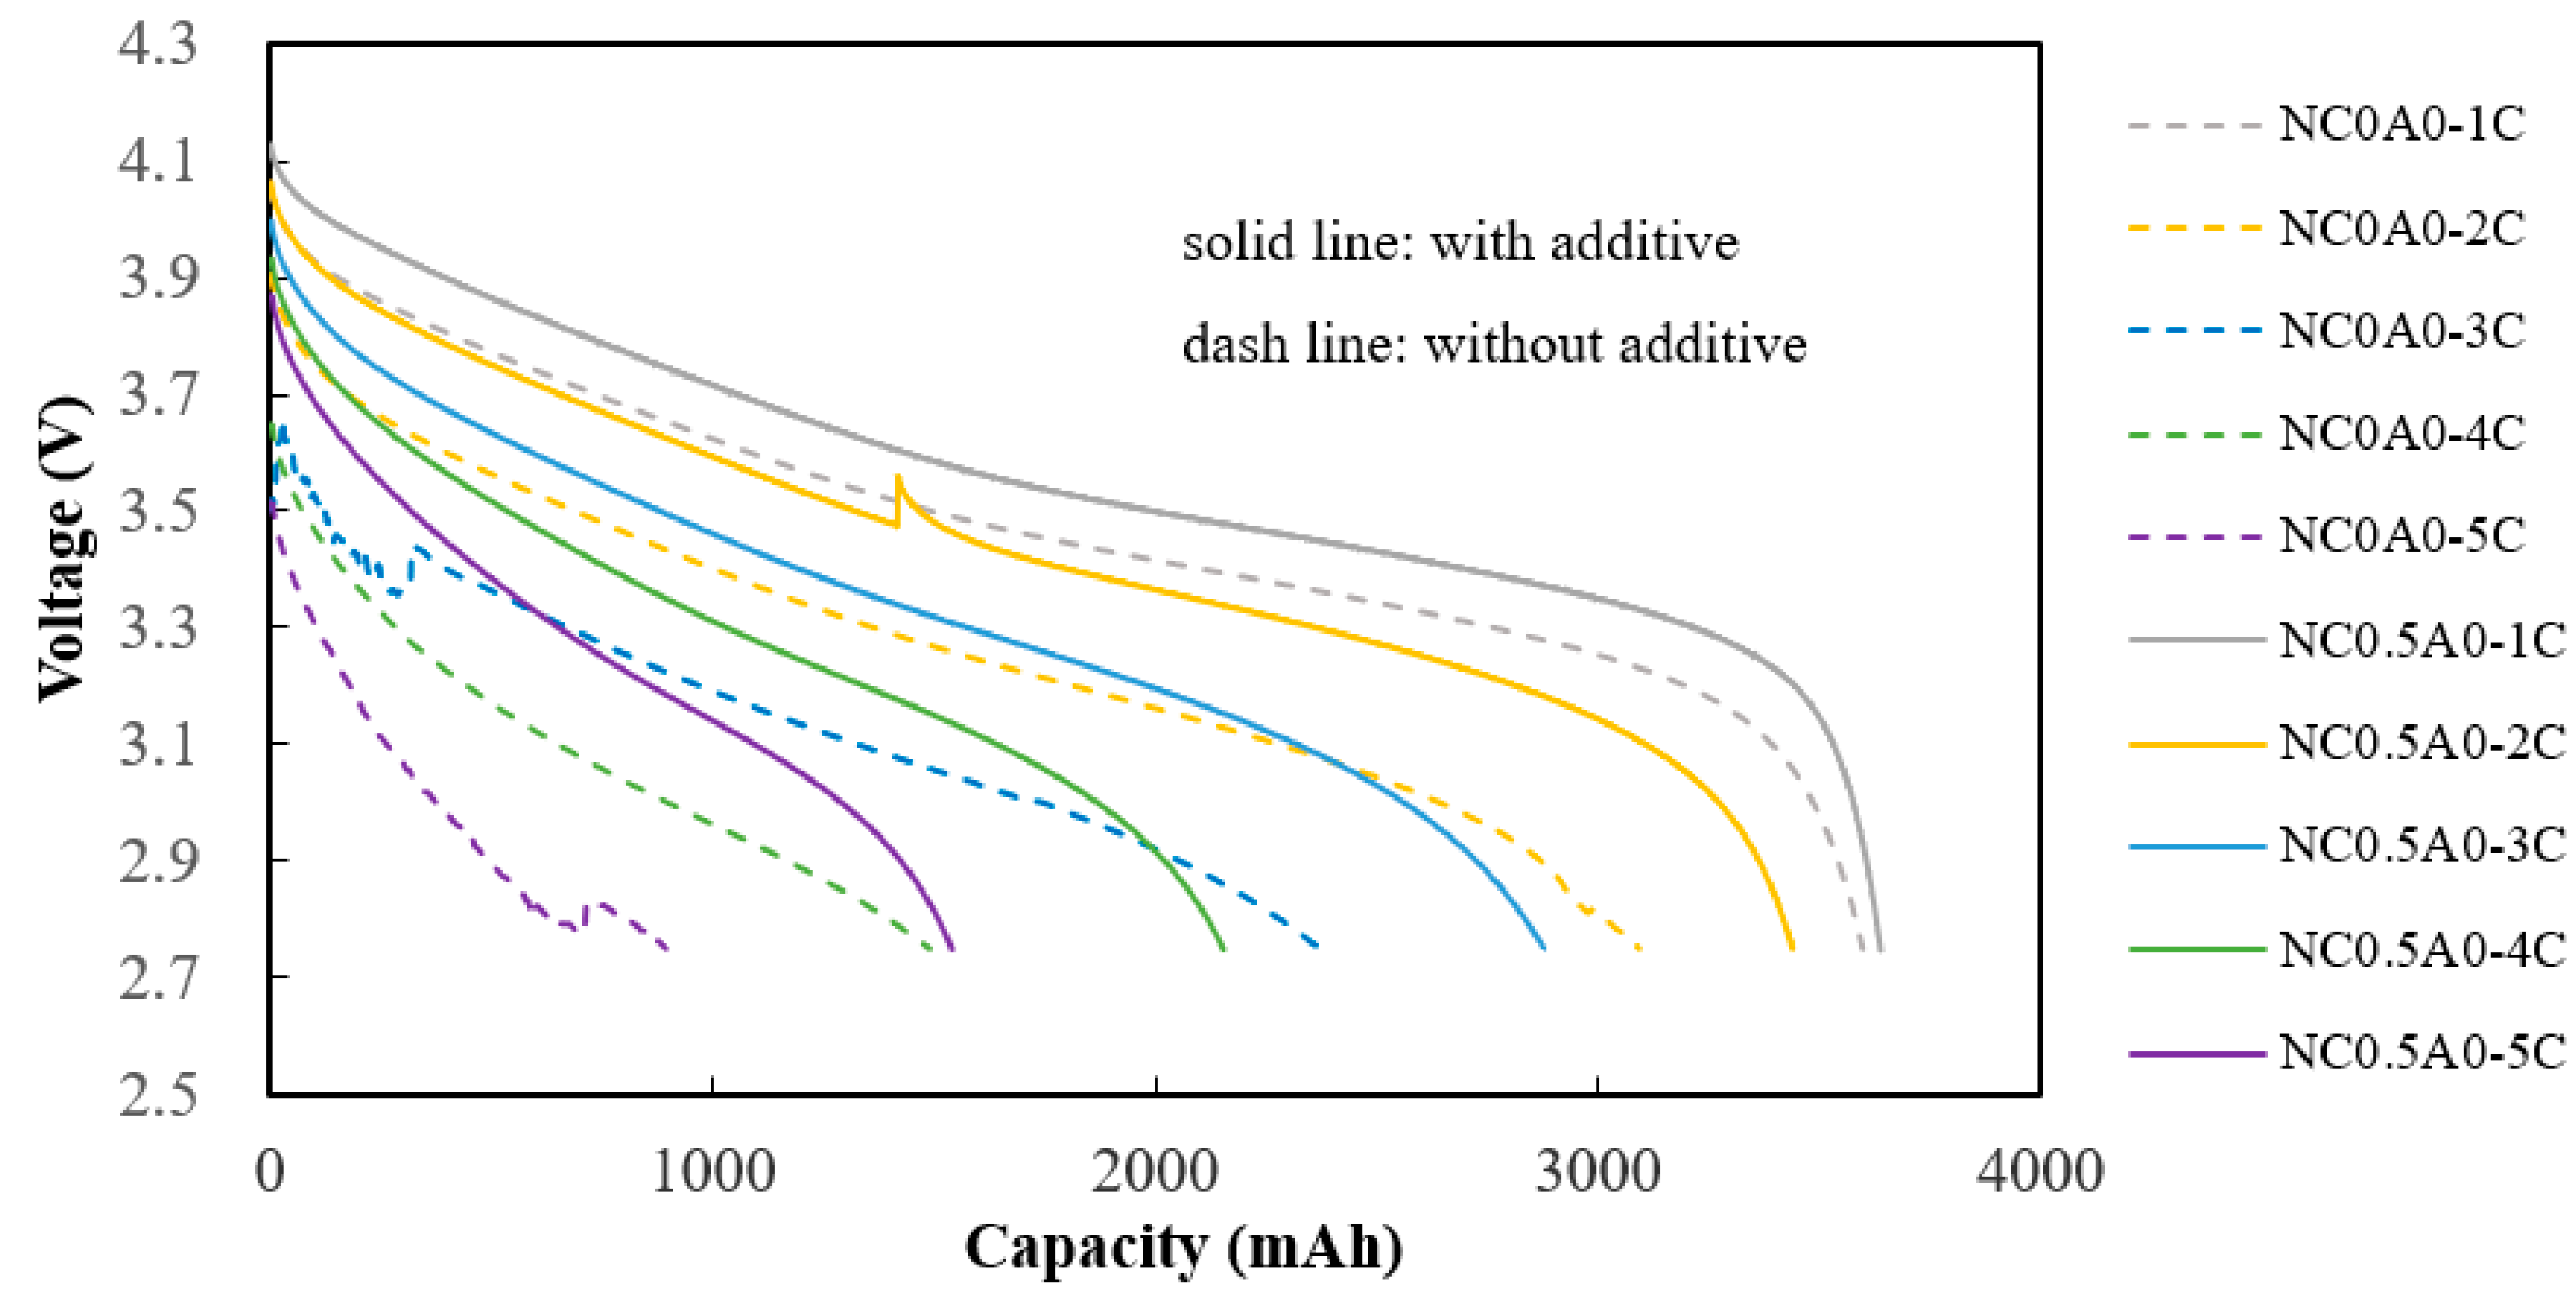
At room temperature, discharge capacity testing was performed with charging conditions involving 1C constant current (CC) charging until reaching 4.2V, followed by constant voltage (CV) charging until the current reached 0.2C. Subsequently, the discharge capacity was measured under discharge conditions at different currents (1C, 2C, 3C, 4C, 5C) until 2.75V.
The experimental results presented in
Figure 9 indicate that the discharge capacity of C0.5A0 (G2) is slightly better than that of C0A0 (G1). Using the capacity at 1C as a reference point, the retention percentages for capacities of 2C, 3C, 4C, and 5C were calculated by dividing each capacity by the 1C capacity. The actual values, as shown in
Table 6, indicate that the difference in performance between the two is not very significant at high C rates.
3.5. DCIR and EIS
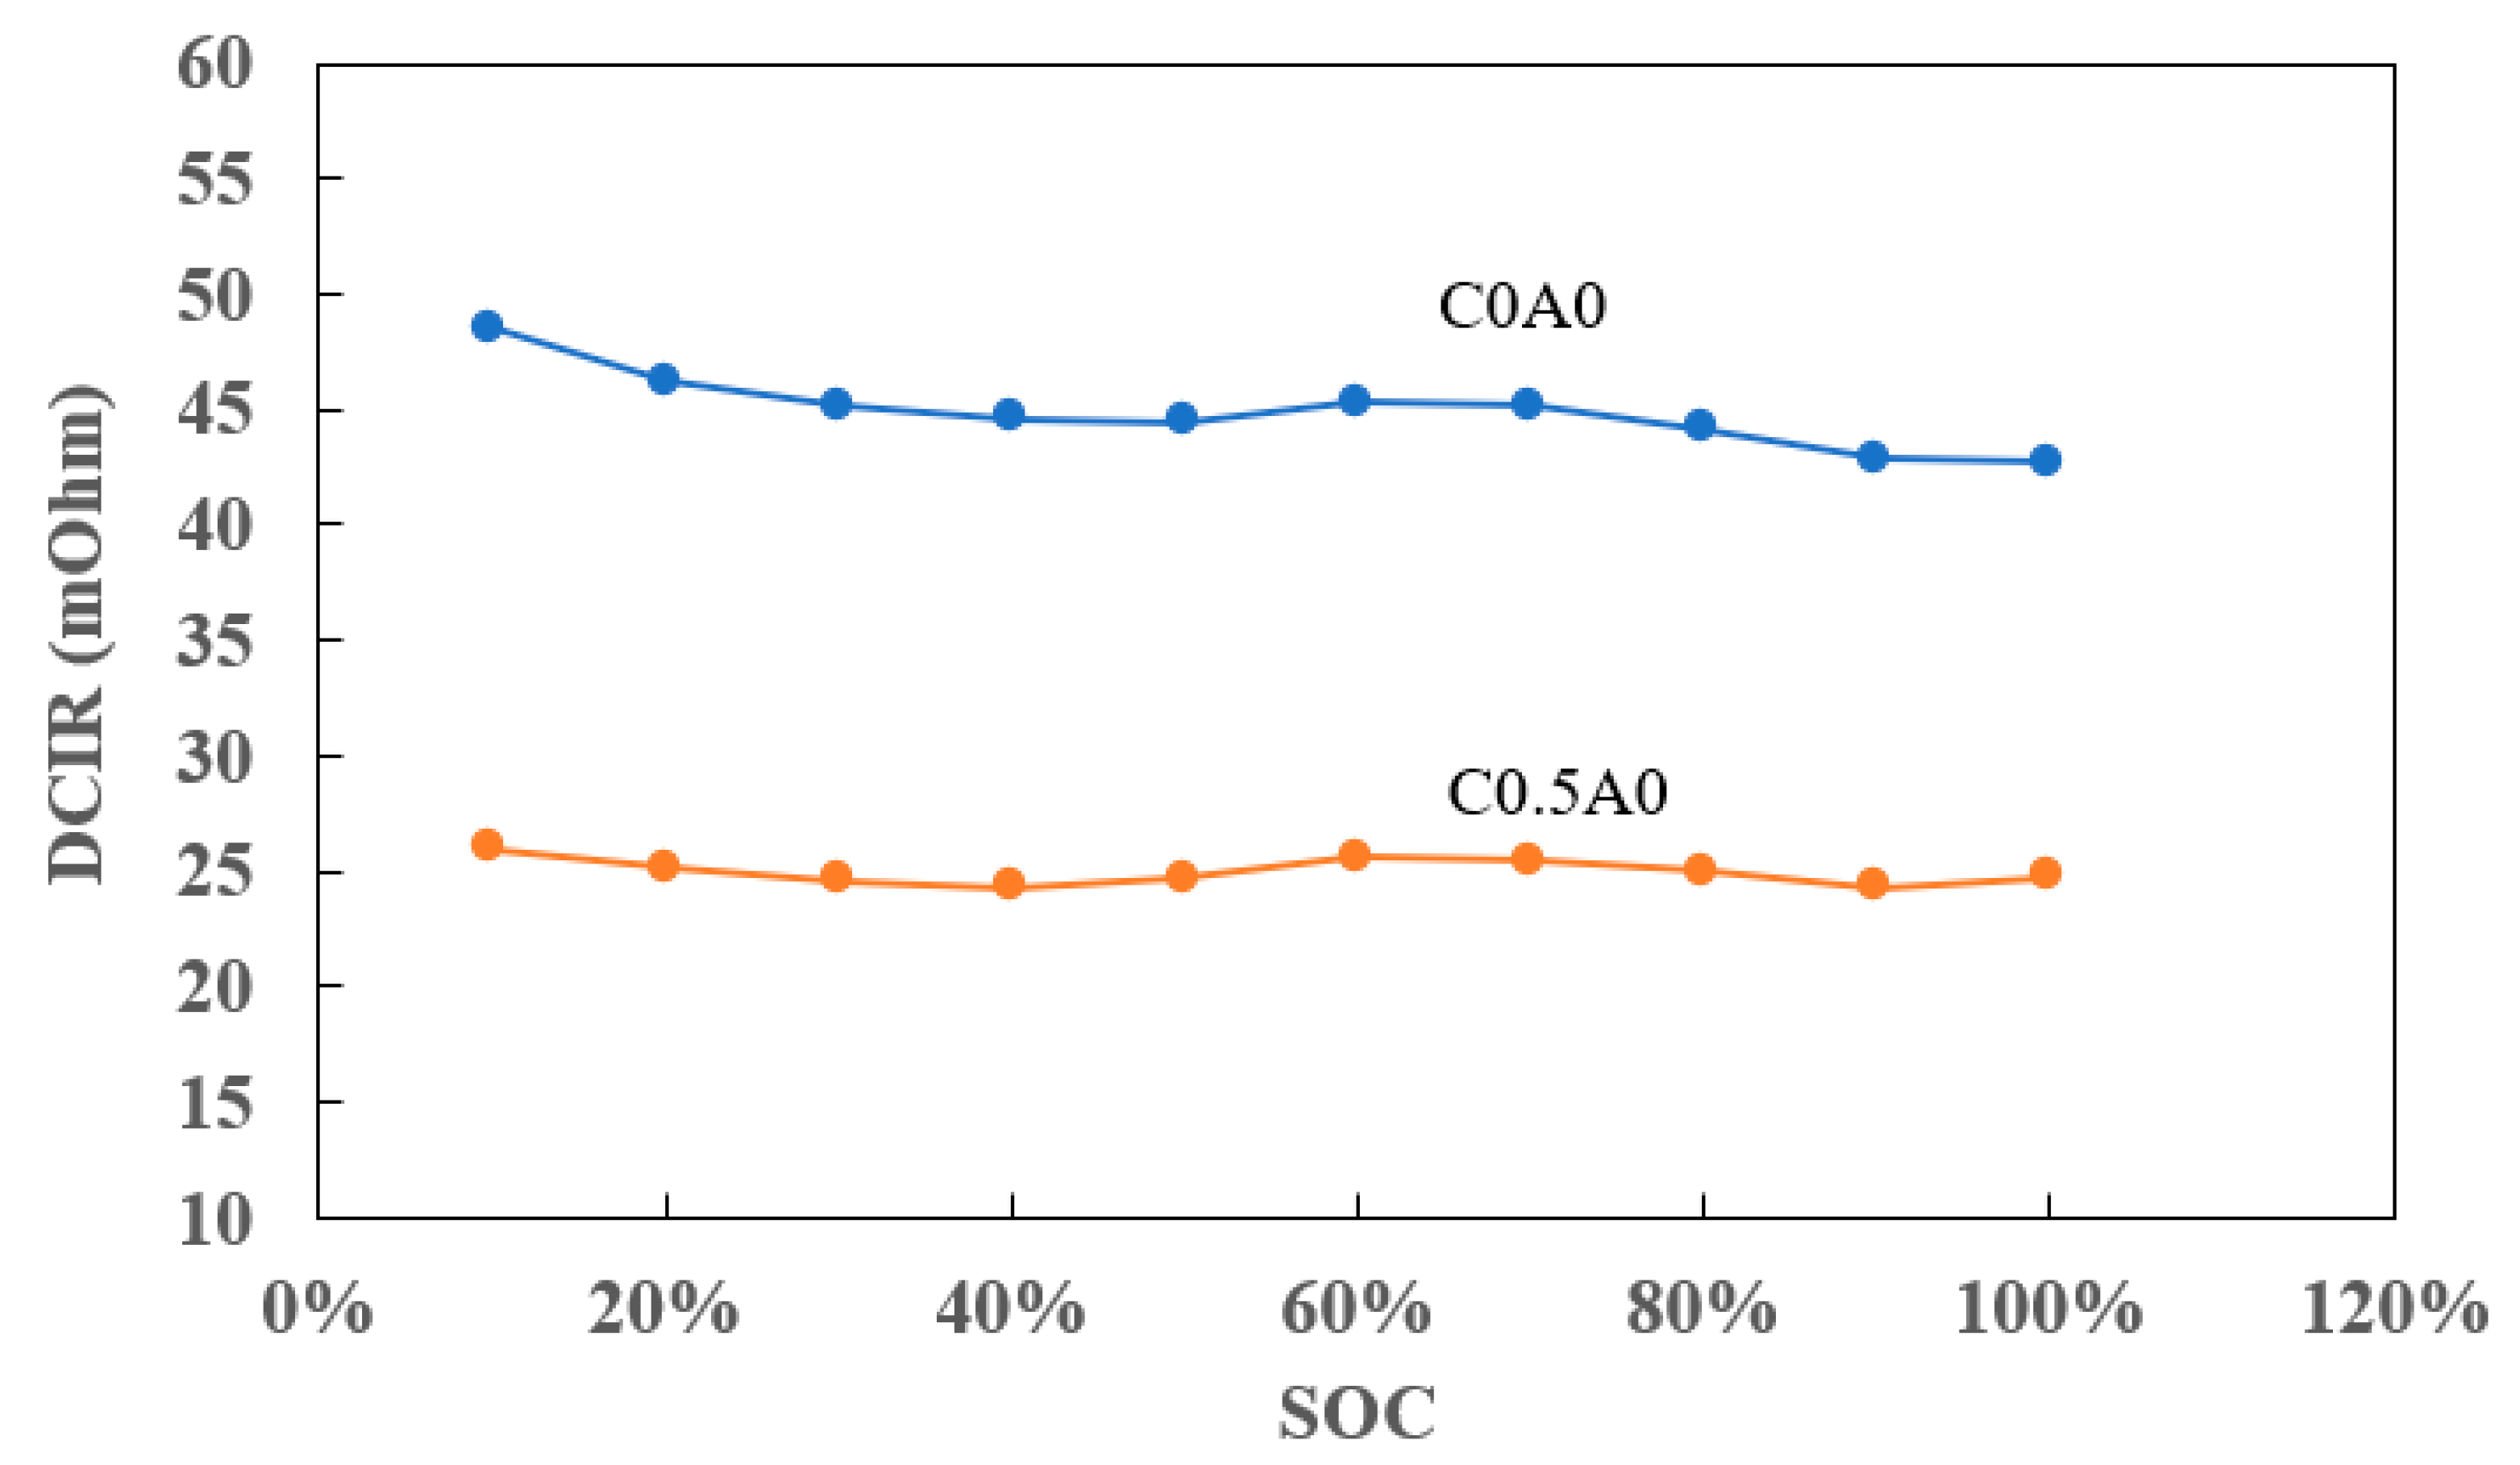
To evaluate the stability of the battery, the battery at 30% state of charge (SOC) was stored at room temperature for 6 months, after which its DCIR (Direct Current Internal Resistance) and EIS (Electrochemical Impedance Spectroscopy) were measured.
The DCIR testing procedure was as follows: In Step 1, the battery was charged to 4.2V. In Step 2, a discharge at 0.03A for 30 minutes was conducted, and the voltage value at the last second of the discharge was recorded as V
1. Subsequently, a discharge at 6A for 5 seconds was performed, and the voltage value at the last second of the discharge was recorded as V
2. The DCIR at 100% SOC was then calculated using Formula 1, where I
1 was 0.03A, and I
2 was 6A. Following that, a discharge at 0.6A for 30 minutes was carried out, followed by a 30-second rest. In Step 3, the process of Step 2 was repeated nine times, and the DCIR was calculated at 90%, 80%, down to 10% SOC. The DCIR result, as depicted in
Figure 10, highlighted a lower DCIR in the battery denoted as C0.5A0, where 0.5% PMGC was added to the cathode electrode, compared to the control battery C0A0 without the additive.
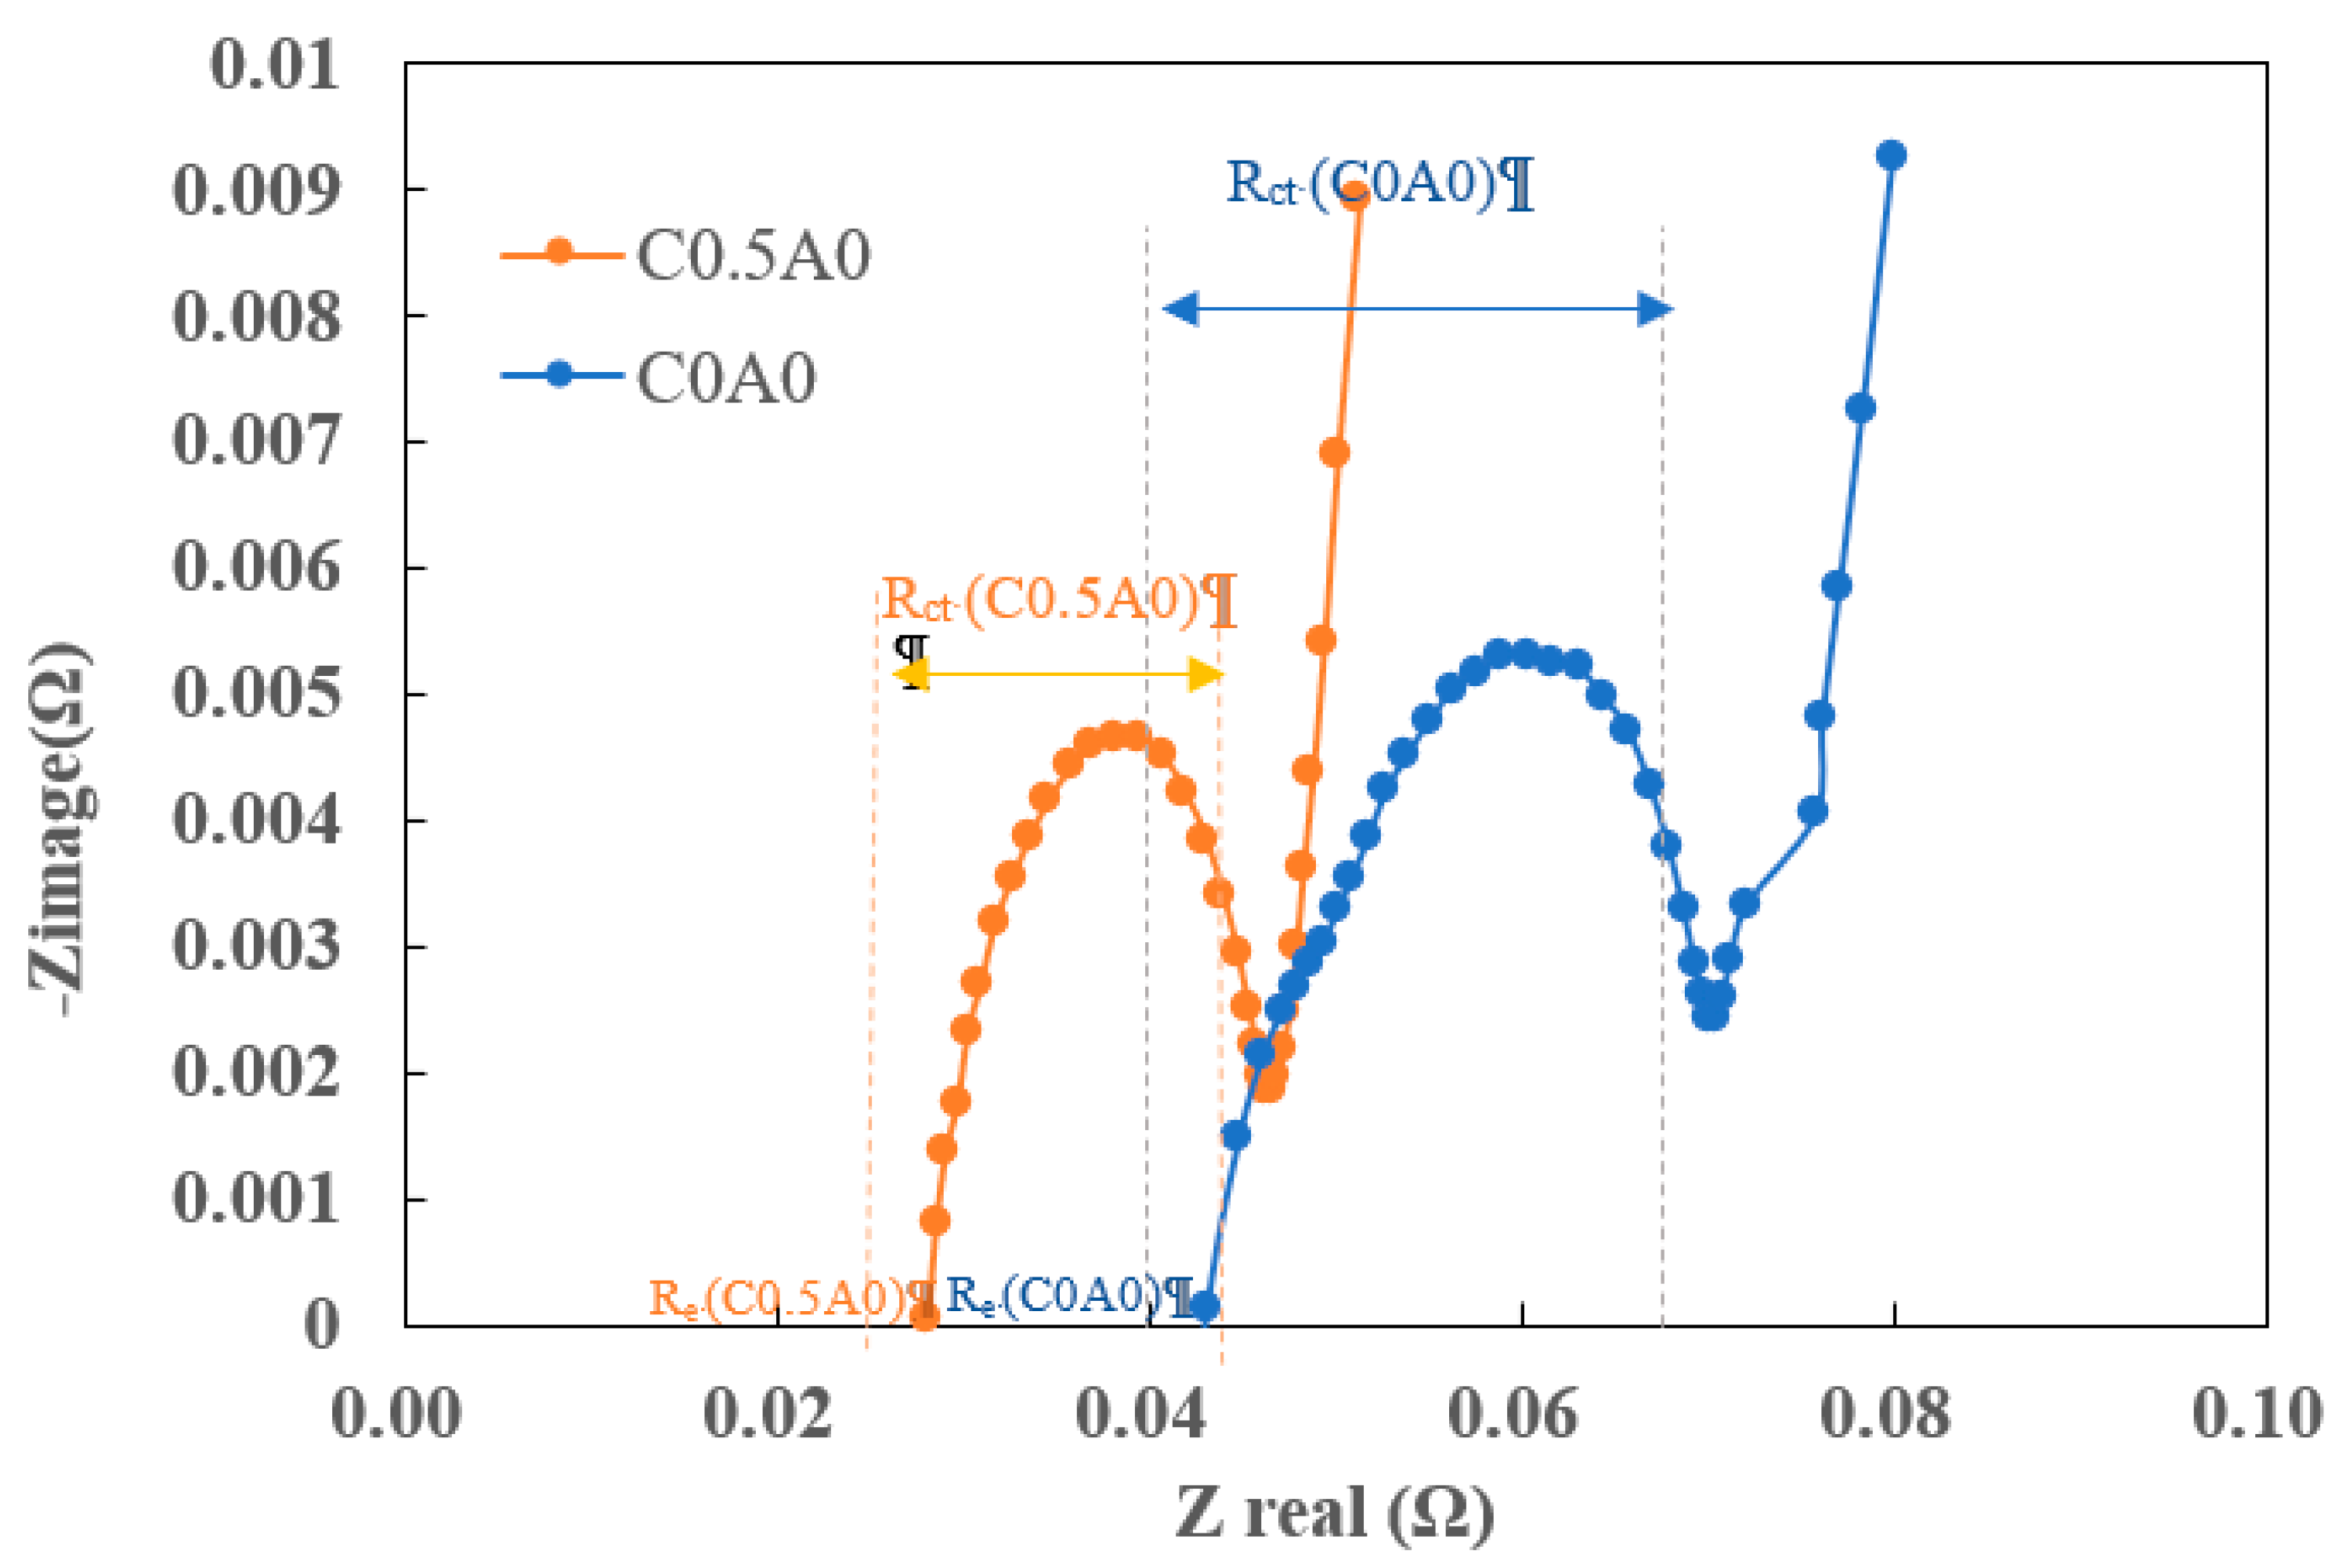
The EIS was conducted using the BioLogic SP-300 equipment, with a frequency range spanning from 10mHz to 0.5MHz.
Figure 11 shows representative impedance spectra measured around 3.6V from C0A0 and C0.5A0 batteries. Electrochemical impedance spectra can be represented as Nyquist plots. The Nyquist plot is a graphical representation of the real part of impedance (Zreal) and the imaginary part of impedance (Zimage) plotted at different angular frequencies. Re (equivalent series resistance) accounts for the pure ohmic resistance of electrodes, electrolyte, connecting wires, and current collector foils. Rct represents charge transfer resistance, and its value can be estimated from the semicircle. The value of Re was determined by the intersection point of the Nyquist plot with the X-axis (Re(Z)), with the detection frequency in the high-frequency region [
20,
21]. The test results indicated that, compared to C0A0 with Re (0.043Ω) and Rct (0.028Ω), C0.5A0 showed lower values for both Re (0.028Ω) and Rct (0.018Ω).
3.6. Fast discharge and cycle performance
To simulate a higher energy density for the rechargeable battery, experiments for Test 2 were designed. The anode electrode density of batteries in Test 1 was 1.4 g/cc, while it was 1.57g/cc in Test 2. The former has a higher porosity in the electrode, allowing the electrolyte to wet the pores and enhance ion conductivity. Consequently, batteries with the same additive content in Test 1 exhibited lower impedance compared to those in Test 2. Comparing with internal resistance in Test 1, the average resistance for C0A0 (G1) was 11.2 mΩ, while in Test 2, NC0A0 (G10) was 29.7 mΩ. For C0.5A0 (G2), the average resistance was 8.3 mΩ, whereas NC0.5A0 (G11) was 12.3 mΩ. Similarly, C1A0 (G3) had an average resistance of 8.8 mΩ, while NC1A0 (G12) was 16.3 mΩ. This difference could be attributed to the higher porosity and ion conductivity in the anode electrode of Test 1 batteries.
Compared to the control group NC0A0 (G10), batteries incorporating 0.5% PMGC (NC0.5A0, G11) and 1.0% PMGC (NC1A0, G12) demonstrated markedly reduced internal resistance. Notably, G11 shows an even lower resistance, consistent with the results observed in Test 1.
Comparing NC0.5A0 (G11) to NC0A0 (G10), it exhibits superior discharge capacities at 2C, 3C, 4C, and 5C. Additionally, it demonstrates better discharge percentages at higher C-rates, as depicted in
Figure 12 and detailed in
Table 7.
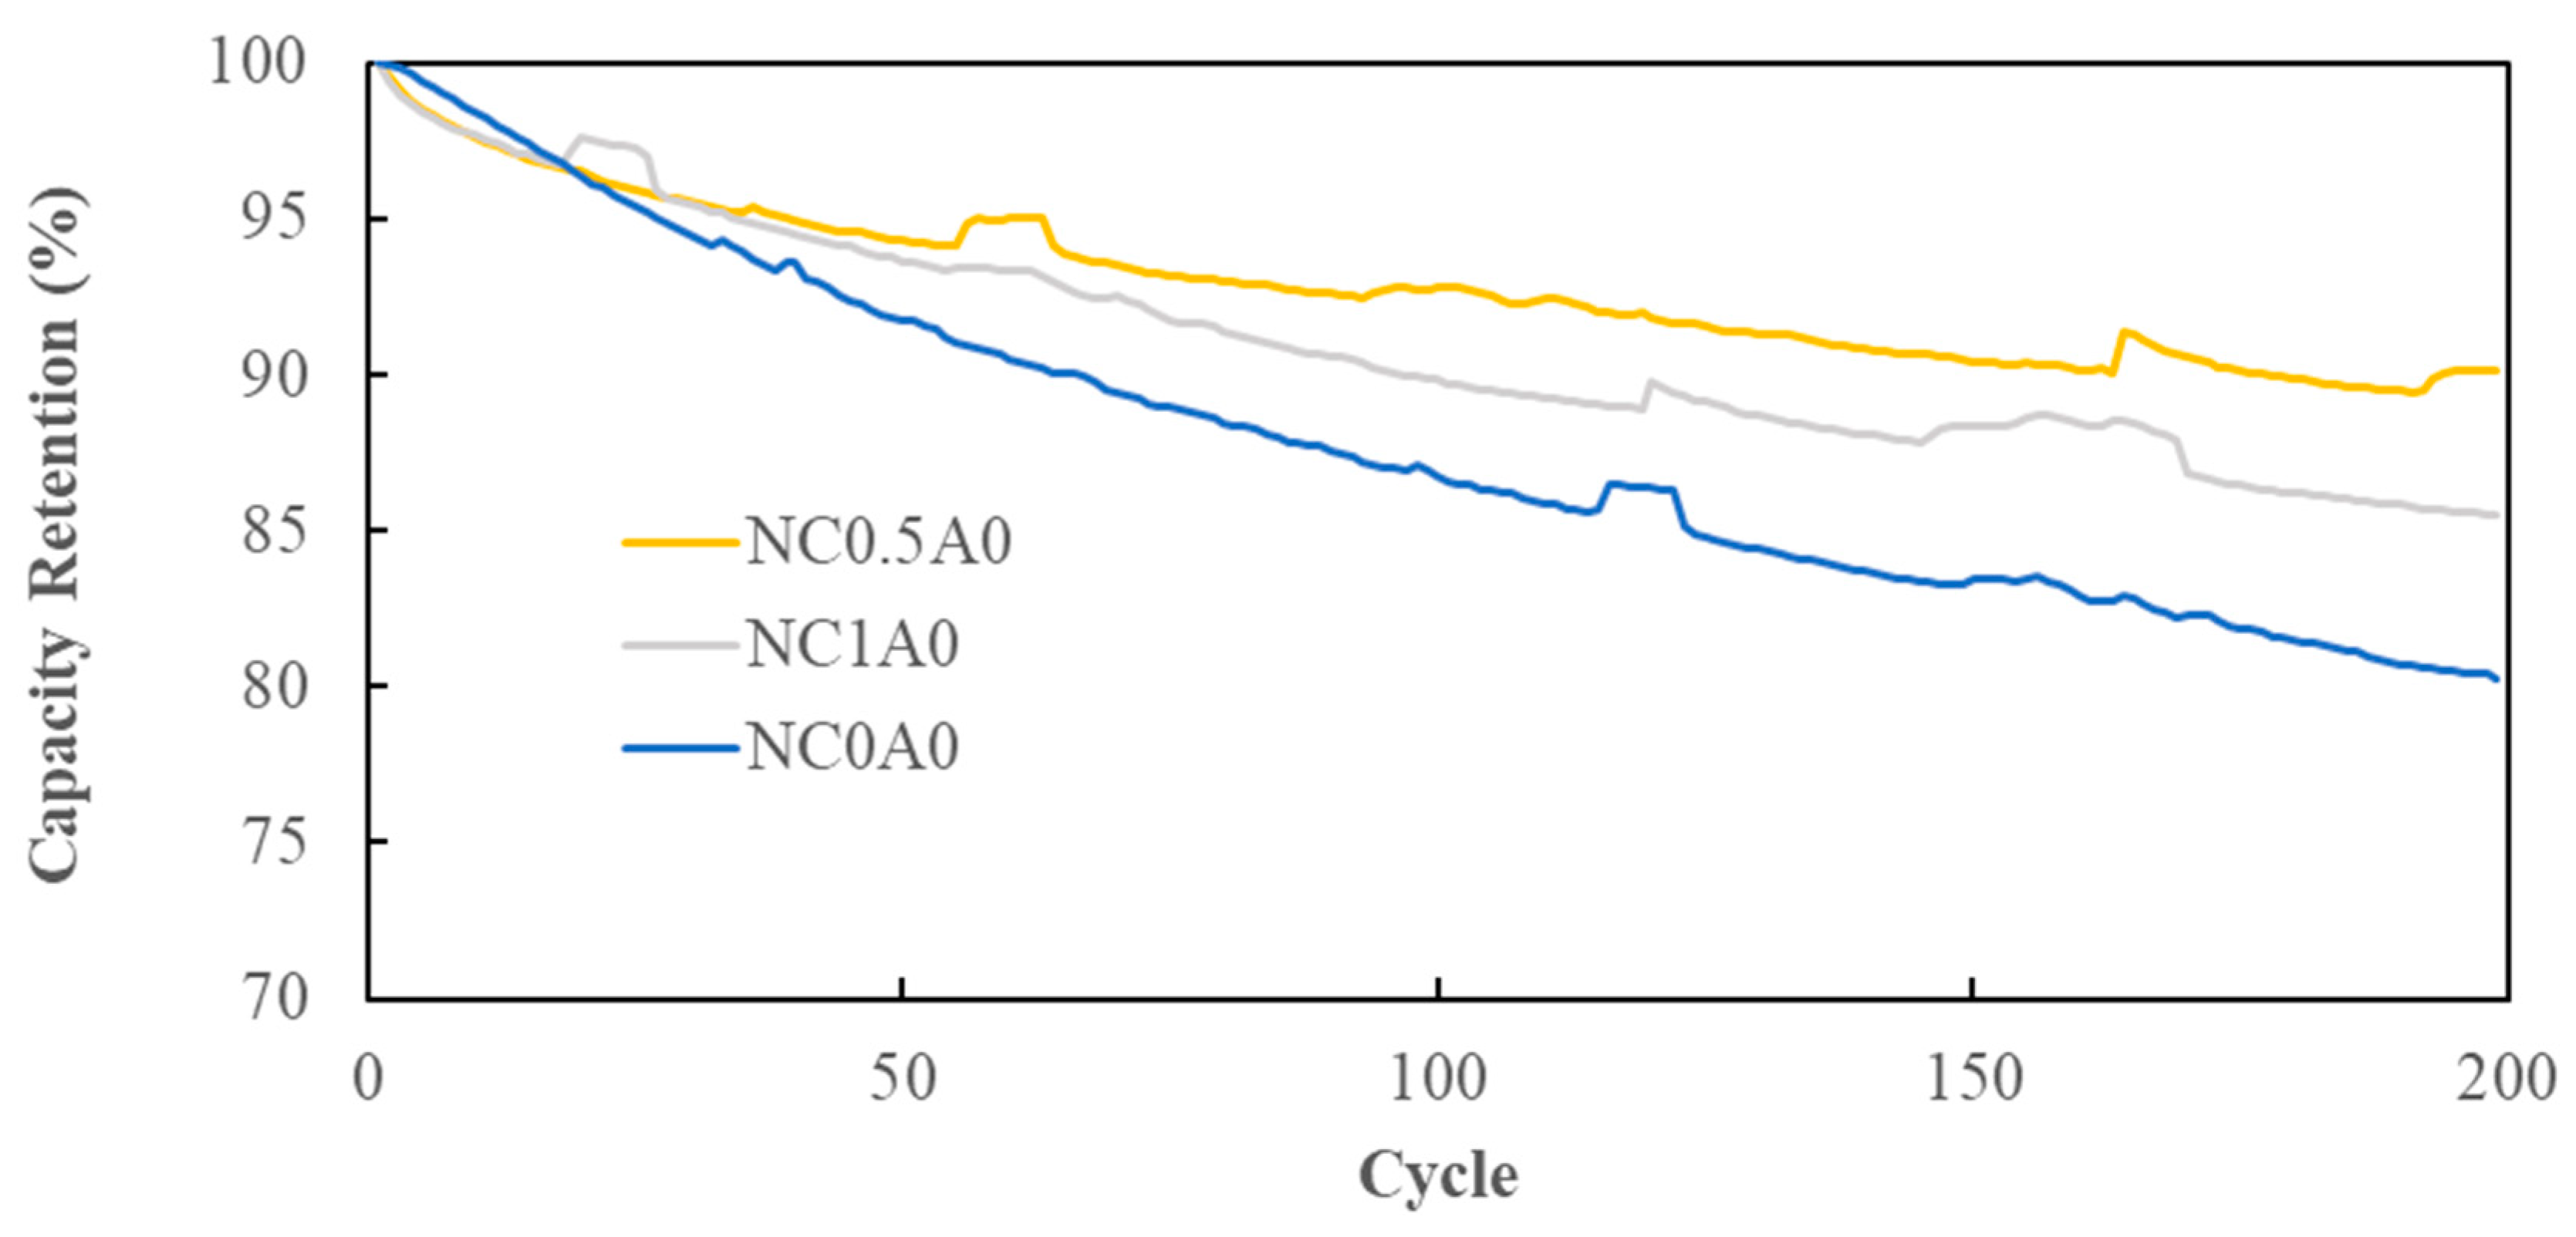
Cycling tests were conducted at room temperature with a 1C charging and 1C discharging rate, operating within a voltage range of 2.75V to 4.2V. In contrast to NC0A0 (G10) and NC1A0 (G12), the battery featuring 0.5% PMGC, NC0.5A0 (G11), showcased the most favorable cycling performance. In
Figure 13, it illustrated that after 200 cycles, NC0.5A0 (G11) retained 90%, indicating excellent stability and cycle life for the battery with PMGC inside the cathode electrode.
4. Conclusions
This study investigates the enhancement of lithium-ion battery performance through the utilization of polyaniline-modified graphene composites, with a specific focus on porous morphology. Incorporating polyaniline, a conductive polymer, as a surface modifier for graphene demonstrated effectiveness in reducing internal resistance and overall battery improvement. The distinctive porous nanostructure of polyaniline on graphene was explored to address challenges associated with additives like carbon nanotubes and graphene, including cost and aggregation issues.
A comprehensive analysis revealed that adding 0.5% PMGC to the cathode electrode significantly reduced internal resistance, contributing to enhanced battery performance. However, the introduction of 1% PMGC did not provide additional benefits, emphasizing the significance of optimal concentration. The study also investigated how PMGC influences various electrode densities, unveiling its complex impact on internal resistance.
The morphology of PMGC, characterized by porous polyaniline intertwining with graphene, was observed, suggesting potential benefits for lithium battery electrolyte absorption and infiltration. Various characterization techniques, including FT-IR, TGA, and Raman spectroscopy, confirmed the successful synthesis of PMGC and its structural features.
Evaluation of fast charge and discharge performance, aging tests, and cycle performance aimed to assess the practical implications of PMGC. The study demonstrated that 0.5% PMGC in the cathode electrode enhanced rapid charging capabilities, resulting in a higher charge capacity compared to the control group. Additionally, PMGC-incorporated batteries exhibited lower internal resistance, improved stability, and favorable cycle life, particularly evident in the 0.5% PMGC concentration.
These findings highlight the potential of polyaniline-modified graphene composites with a porous nanostructure as a promising solution for advancing lithium-ion battery technologies. The study's insights contribute to ongoing efforts to develop sustainable and high-performance energy storage systems for applications such as electric vehicles and energy storage systems.
Acknowledgments
This work was supported by the Energy Administration, Ministry of Economic Affairs , R.O.C.
References
- Brian J. Landi, Matthew J. Ganter, Cory D. Cress, Roberta A. DiLeo, and Ryne P. Raffaelle, Carbon nanotubes for lithium ion batteries, Energy Environ. Sci. 2009, 2, 638–654. [CrossRef]
- Ying Shi, Lei Wen, Songfeng Pei, Minjie Wu, Feng Li, Choice for graphene as conductive additive for cathode of lithium-ion batteries, Journal of Energy Chemistry. 2019; 30, 19–26. [CrossRef]
- Peng-Cheng Ma, Naveed A. Siddiqui, Gad Marom, Jang-Kyo Kim, Dispersion and functionalization of carbon nanotubes for polymer-based nanocomposites: A review, Composites: Part A. 2010, 41, 1345–1367. [CrossRef]
- Suguna Perumal, Raji Atchudan, In Woo Cheong, Recent Studies on Dispersion of Graphene–Polymer Composites, Polymers , 2021; 13, 2375. [CrossRef]
- Shaker A. Ebrahim, Mohamed E. Harb, Moataz M. Soliman, Mazhar B. Tayel, Preparation and characterization of a pseudocapacitor electrode by spraying a conducting polymer onto a flexible substrate, Journal of Taibah University for Science. 2016, 10, 281–285. [CrossRef]
- Yifan Chen, A review of polyaniline based materials as anodes for lithiumion batteries, Mater. Sci. Eng. 2019, 677, 022115. [CrossRef]
- Fanxin Zeng, Zongyi Qin, Banglei Liang, Tao Li, Na Liu, Meifang Zhu, Polyaniline nanostructures tuning with oxidants in interfacial polymerization system, Progress in Natural Science Materials International. 2015; 25, 512–519. [CrossRef]
- Tran HD, D'Arcy JM, Wang Y, Beltramo PJ, Strong V a., Kaner RB, The oxidation of aniline to produce “polyaniline”: a process yielding many different nanoscale structures, J. Mater. Chem. 2011, 21, 3534–3550. [CrossRef]
- Felipe de Salas, Isabel Pardo, Horacio J. Salavagione, Pablo Aza, Eleni Amougi, Jesper Vind, Angel T. MartõÂnez, Susana Camarero, Advanced Synthesis of Conductive Polyaniline Using Laccase as Biocatalyst, PLOS ONE. 2016, 11, e0164958. [CrossRef]
- Marappan Sathish, Satoshi Mitani, Takaaki Tomai, Itaru Honma, MnO2 assisted oxidative polymerization of aniline on graphene sheets: Superior nanocomposite electrodes for electrochemical supercapacitors, J. Mater. Chem. 2011, 21, 16216. [CrossRef]
- Zhaoqi Huang, LeLi, Yufeng Wang, Chao Zhang, Tianxi Liu, Polyaniline/graphene nanocomposites towards high-performance supercapacitors: A review, Composites Communications v 8. 2018; 8, 83–91. [CrossRef]
- Xiaodong Hong, Jiawei Fu, Yue Liu, Shanggong Li, Xiaoliang Wang, Wei Dong, Shaobin Yang, Recent Progress on Graphene/Polyaniline Composites for High-performance Supercapacitors, Materials 2019, 12, 1451. 12. [CrossRef]
- Weiwei Shao, Ruxangul Jamal, Feng Xu, Aminam Ubul and Tursun Abdiryim, The Effect of a Small Amount of Water on the Structure and Electrochemical Properties of Solid-State Synthesized Polyaniline, Materials 2012, 5, 1811–1825. 5. [CrossRef]
- M. Shabani-Nooshabadi and F. Karimian-Taheri, Electrosynthesis of a polyaniline/zeolite nanocomposite coating on copper in a three-step process and the effect of current density on its corrosion protection performance, RSC Adv. 2015, 5, 96601–96610. [CrossRef]
- Yuefang Zhang, Jia Liu,a Yahong Zhang, Jin Liu and Yuping Duan, Facile synthesis of hierarchical nanocomposites of aligned polyaniline nanorods on reduced graphene oxide nanosheets for microwave absorbing materials, RSC Adv. 2017, 7, 54031–54038. [CrossRef]
- Shuanqiang Yang, Shu Zhu,and Ruoyu Hong, Structural and Morphological Characteristics of Polyaniline Synthesized in Pilot Scale, J. Aerosp. Technol. Manag., São José dos Campos. 2017, 9, 39–47. [CrossRef]
- M. Kim, C. Lee and J. Jang, Fabrication of Highly Flexible, Scalable, and High-Performance Supercapacitors Using Polyaniline/Reduced Graphene Oxide Film with Enhanced Electrical Conductivity and Crystallinity, Adv. Funct. Mater. 2014, 24, 2489–2499. [CrossRef]
- M. Cochet, G. Louarn, S. Quillard, et al., Theoretical and experimental vibrational study of emeraldine in salt form. Part II, J. Raman Spectrosc. 2000, 31, 1041–1049. [CrossRef]
- Tao Liu, Shimei Sun, Zhao Zang, Xichao Li, Xiaolin Sun, Fengting Cao and Jianfei Wu, Effects of graphene with different sizes as conductive additives on the electrochemical performance of a LiFePO4 cathode RSC Adv. 2017, 7, 20882–20887. [CrossRef]
- Alireza Rastegarpanah, Jamie Hathaway, Mohamed Ahmeid, Simon Lambert, AllanWalton and Rustam Stolkin “A rapid neural network–based state of health estimation scheme for screening of end of life electric vehicle” J Systems and Control Engineering. 2021; 235, 330–346. [CrossRef]
- Doron Aurbach, Review of selected electrode–solution interactions which determine the performance of Li and Li ion batteries, Journal of Power Sources. 2000; 89, 206–218. [CrossRef]
|
Disclaimer/Publisher’s Note: The statements, opinions and data contained in all publications are solely those of the individual author(s) and contributor(s) and not of MDPI and/or the editor(s). MDPI and/or the editor(s) disclaim responsibility for any injury to people or property resulting from any ideas, methods, instructions or products referred to in the content. |
© 2024 by the authors. Licensee MDPI, Basel, Switzerland. This article is an open access article distributed under the terms and conditions of the Creative Commons Attribution (CC BY) license (http://creativecommons.org/licenses/by/4.0/).
