1. Introduction
The previously developed two-dimensional model [
1] describes the state of the shock front and the changes to the hypersonic flow behind it as a result of interaction with a thermal discontinuity created in a discharge, a flame, or an interstellar environment. [
2,
3]. This work is a short addition to the model extending it into the third dimension. Both open and closed interfaces of an arbitrary shape are covered by the existing model in the plane of symmetry oriented along the shock propagation direction that corresponds to the cylindrical symmetry case. In describing the evolution of the hypersonic flow with time, the model essentially relates the perturbation to the front with the incident shock, plasma medium, and the interface geometrical parameters. Under definite conditions, the dynamics of the perturbation to the front represents an instability that develops in the form of wave-like stretchings into the lower density medium followed with the loss of stability in the flow behind it, that eventually evolves into an intense vortex structure. The instability mode in this case is aperiodical and unconditional, and the shock state evolves with either a transition to another stable state or continuous development as a secondary flow [
4]. The instability features a set of interesting features, such as: a similarity law in the spatial and temporal evolution of the perturbations with respect to the interface curvature; the instability locus independence of the gas density distribution thus identifying the interface conditions as the sole triggering factor; the specific role of the density gradient in the instability evolution discriminating between qualitatively different outcomes; the possibility of decay via non-viscous dumping mechanisms; and the connection between the shock and the interface stability.
Both a sharp and an extended type of the interface can be accommodated within the model, resulting in considerable difference in the refraction effect [
5]. If accounting for real-gas effects, the model predicts significant deviations in the shock reflection and refraction strengths at the interface with plasma [
6], and shows that the presence of thermodynamic non-equilibrium in the hypersonic flow can result in variation of the shock wave structure during the interface crossing and interaction with plasma medium [
7]. Studying the dynamics for the two components of the front distortion in the longitudinal and transversal directions revealed another interesting feature of the interaction showing the possibility of vorticity generation in the hypersonic flow behind the refracted front. It is triggered at the interface due to parameter re-distribution in the flow behind the front and continues inside the plasma spot in an intense non-linear dynamics mode [
1]. The induced rotation of the shock velocity components tended to occur under definite conditions and typically attributed to the front portion undergoing the most steep changes. In this connection, considering the model in 3
D would allow one to see whether the presence of the third dimension in the interaction can instantly produce a component of the shock velocity at the interface due to refraction itself, resulting in an additional spinning of the front elements around the longitudinal symmetry axis.
In the following examples, two problems featuring the spherical and cylindrical geometries will be solved numerically in 3D and the results for the front profiles will be matched to those obtained with the 2D model.
2. Refraction parameters and the shock distortion components in 3D
The aim of this paragraph is determining the shock refraction parameters and the front distortion in 3
D with time as a function of the interface coordinates. It will be assumed that the plasma medium inside the sphere is heated to the temperature
T2, and the gas surrounding the sphere is kept at
T1 and the same pressure
p1 =
p2 =
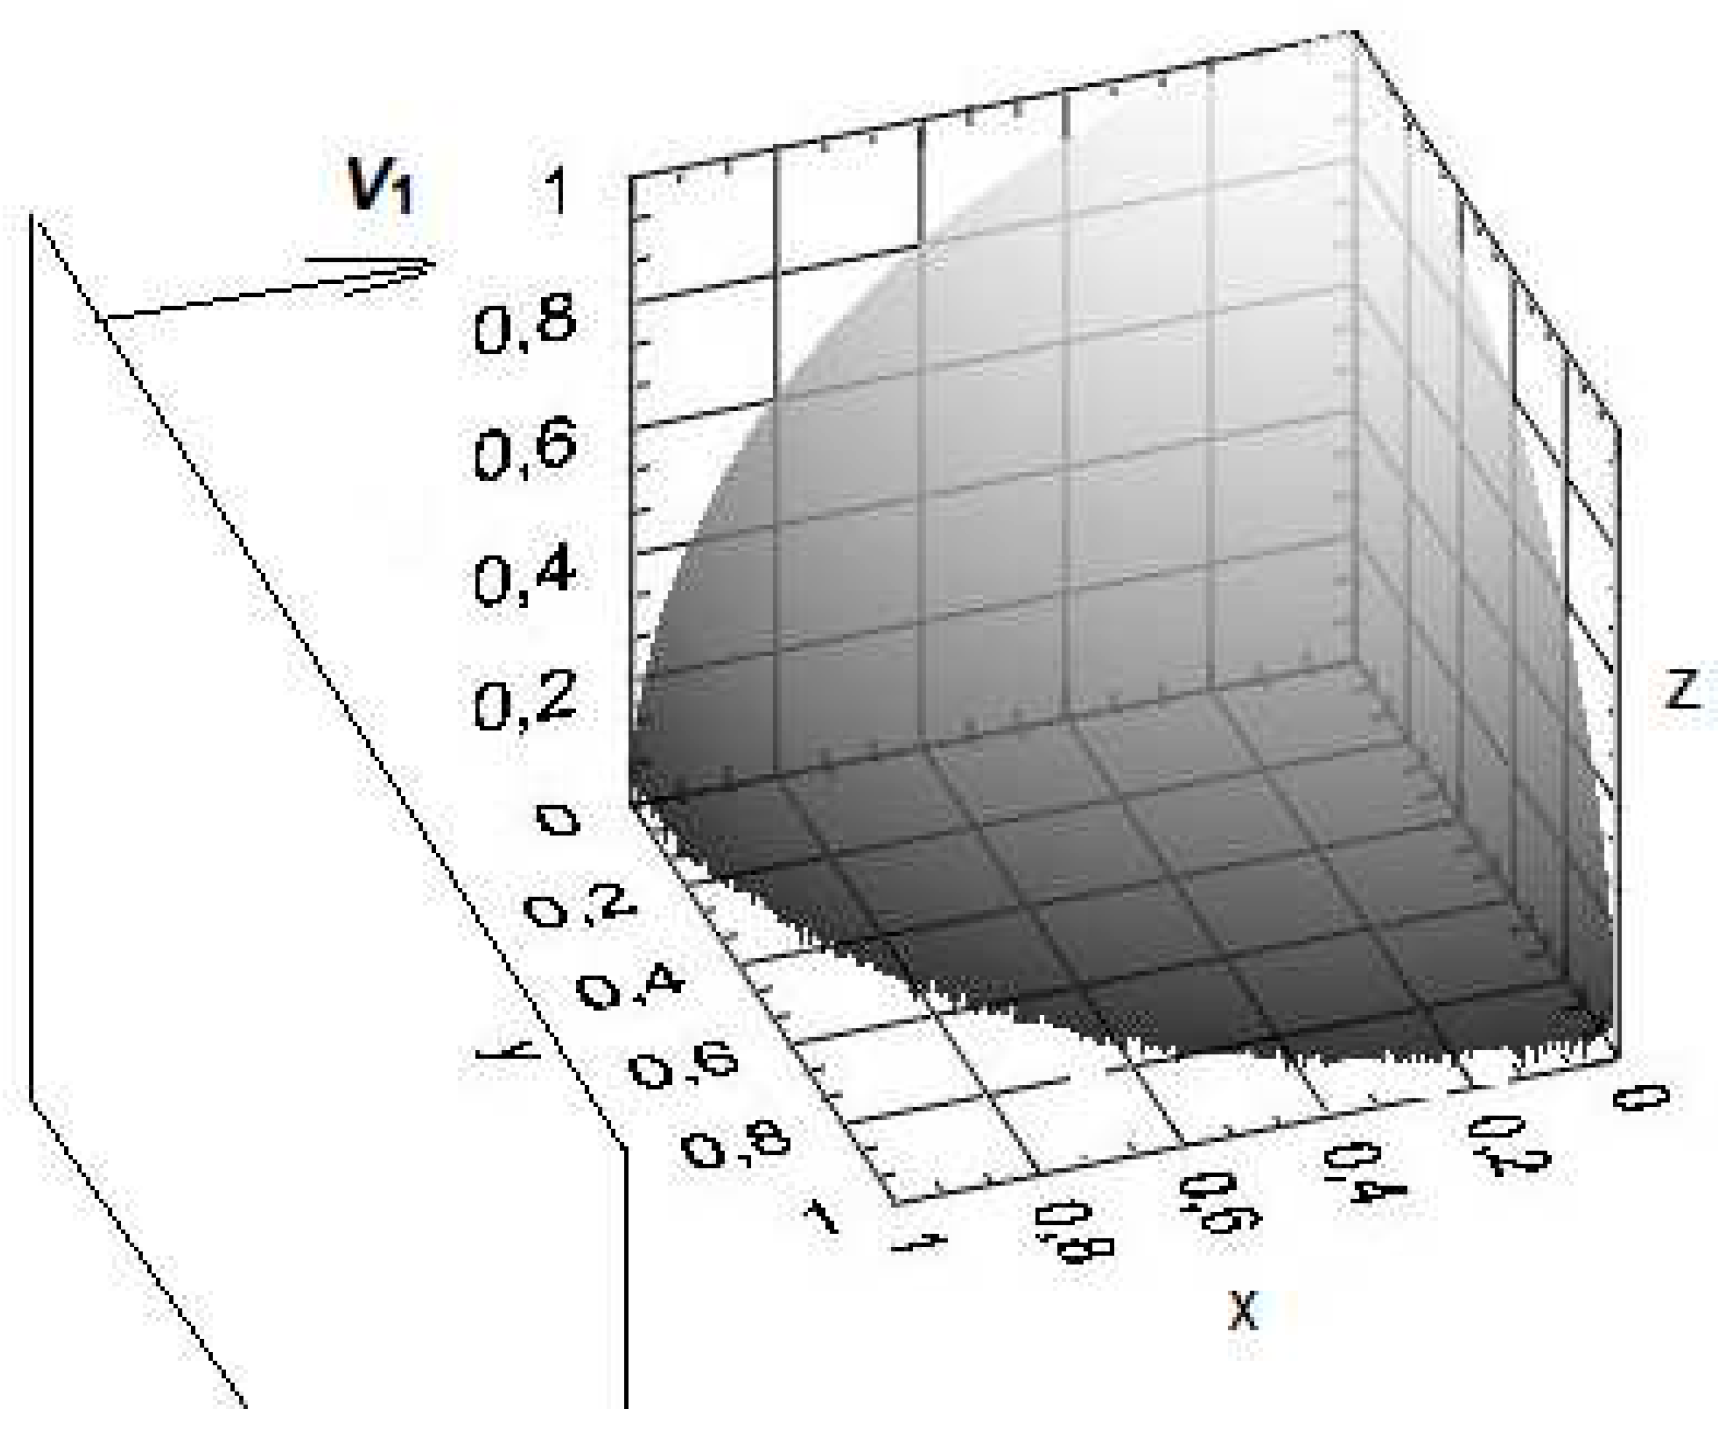
patm. A planar shock wave will be incident on a spherical interface in the
x-direction with the velocity
V1, as shown in
Figure 1, i.e.
In the spherical coordinate system this translates into a three-component vector
where (
x,y,z) and (
r,θ,φ) are the corresponding coordinates of the point of interaction (
i) on the sphere,
θ is the angle between the
r- and
z-directions, the angle
φ is in the
x-y plane, the symbol “hat” over a coordinate denotes the unit vector in the corresponding direction,
and the angles
φ and
θ are determined as
The component of the velocity normal to the surface, which its the radial
component,
and the tangential component
Then the incidence angle α defined as the angle between vector
V1 and the normal to the sphere at the point (
i), is determined by the relation
The velocity
V2 of the shock wave refracted into the hot sphere is obtained through its normal and tangential components,
V2n and
V2τ. The normal component of the velocity
V2n is determined by the ratio of normal components of the Mach number
M2n(
M1n) that is obtained from a pair of shock refraction equations, depending on the temperature ratio condition across the interface [
6],
where
and
,
from which
Using the continuity principle for tangential components across the interface,
the shock velocity vector inside the sphere for the front element crossed the point (
I) takes the form
Then the refraction angle γ, as the one between vectors
V1 and
V2, is determined by the following equation
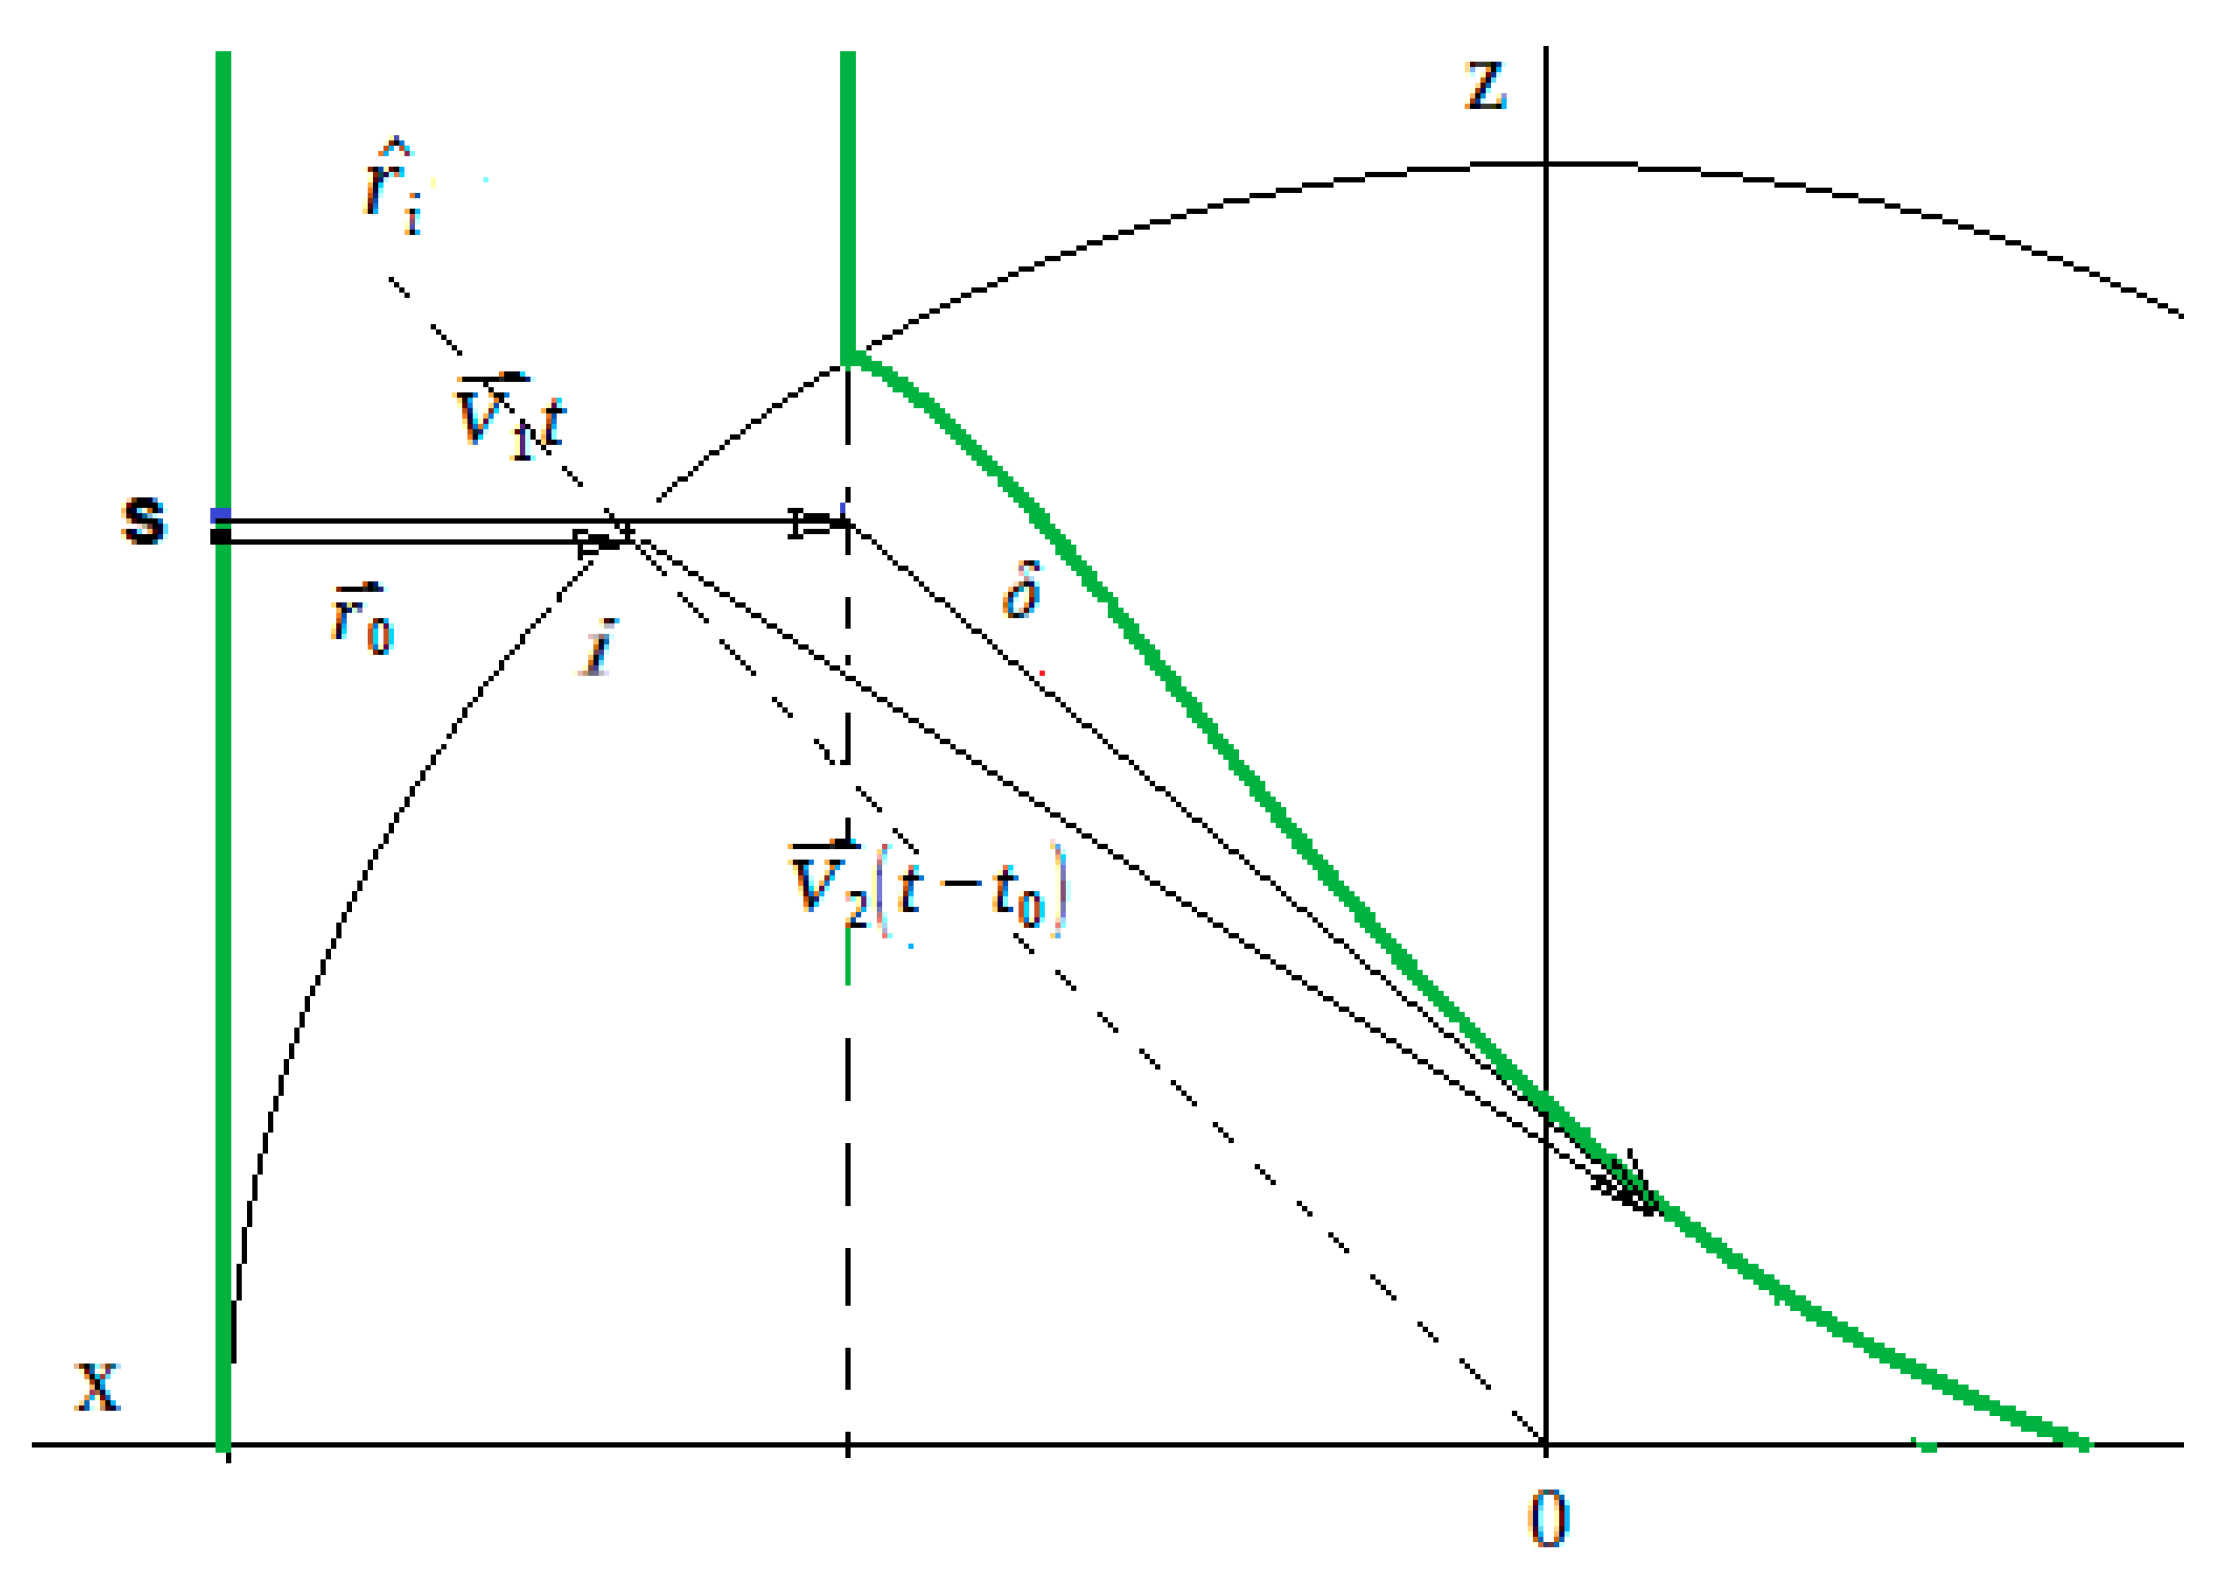
In the next step, the shock front distortion can be found by following a path of a small element “
s” of the incident shock front through the plasma inside the sphere, as shown in
Figure 2.
In the reference frame moving with the velocity
V1, the distortion vector
where
t is the interaction time starting at the moment the initially planar shock arrives at the location
x = R,
R is the sphere radius,
rs is the radial coordinate of the small element “
s” that is eventually crossing the sphere at the interaction point “
i”,
is the local displacement for the time
t0 of the shock’s approaching the interface, and the third term in the righthand side of eq. (12) is introduced to obtain the front coordinates relative to the portion of the front undisturbed by the plasma spot.
For the shock front approaching the interface along the
x-direction,
and, using (3) and (10), the eq. (12) transforms into
where the angles
φ and
θ are referred to the point of interaction
i.
Since
, the
- and
-components of the distortion in eq. (14) are equal to zero,
and the expression (14) takes the final form
from which it immediately follows that all the changes in the front occur in the radial direction only. It should be noted that the “radial” direction has a current status as it is dependent on the position of the interaction point “
i”, and thus it changes as the interaction point progresses along the interface surface, starting from being in the (
x,y)-plane at {
t = 0,
x = R} until it ends up in the (
z,y)-plane (at
x = 0). Consequently, referring to
Figure 2, the vector
δr will always be parallel to the current radial direction
ri drawn through the interaction point
i.
Going back to the cartesian coordinate system, to determine the projections of eq. (16) onto the (
x, y, z)-basis, the factor
ε in (7) should be first expressed in the spherical coordinate system. In accordance to the the results in [
6], the normal component of the Mach number
is a function of
M1n that is very close to linear,
where the factors ζ and η are numerical coefficients that are dependent on the Mach number
M1, the ratio
. and the specific heat ratio constants for the two media.
Then, with
and eqs.(4, 7), we obtain
from which, and in accordance to eq. (16),
and the three cartesian components of the distortion are
The eq.(20) can be more generalized by presenting it in a dimensionless form if scaling
δr with the characteristic length
R and time – with
τ = R/V1. Then, for the dimensionless time
and the coordinates
,
, it yields the following dimensionless equation for
δr
and its cartesian components correspondingly
where the “bar” over a variable means its dimensionless equivalent.
3. Numerical results for a spherical and cylindrical geometries
For illustration purposes and for matching with the 2
D model results (in the two planes of symmetry), a numerical simulation was done for a particular case of non-dissociating nitrogen gas heated to temperature
T2 = 2000
K and the outside temperature of
T1 = 300
K, the incident shock Mach number
M1 = 3.5, and
p =
patm. In the slow-fast scenario present at the entrance of the heated spot, the ratio of normal components of the Mach number in (7) is obtained using the refraction equation that assumes that the reflected wave is a rarefaction wave. For the shock and gas conditions considered here, the function
M2n =
f (
M1n) has been already determined in [
6] and the factors ζ and η in (17) can be borrowed from there. With those parameters in place, the radial component of the front distortion
δr, and its projections into the Cartesian basis
δx,
δy,
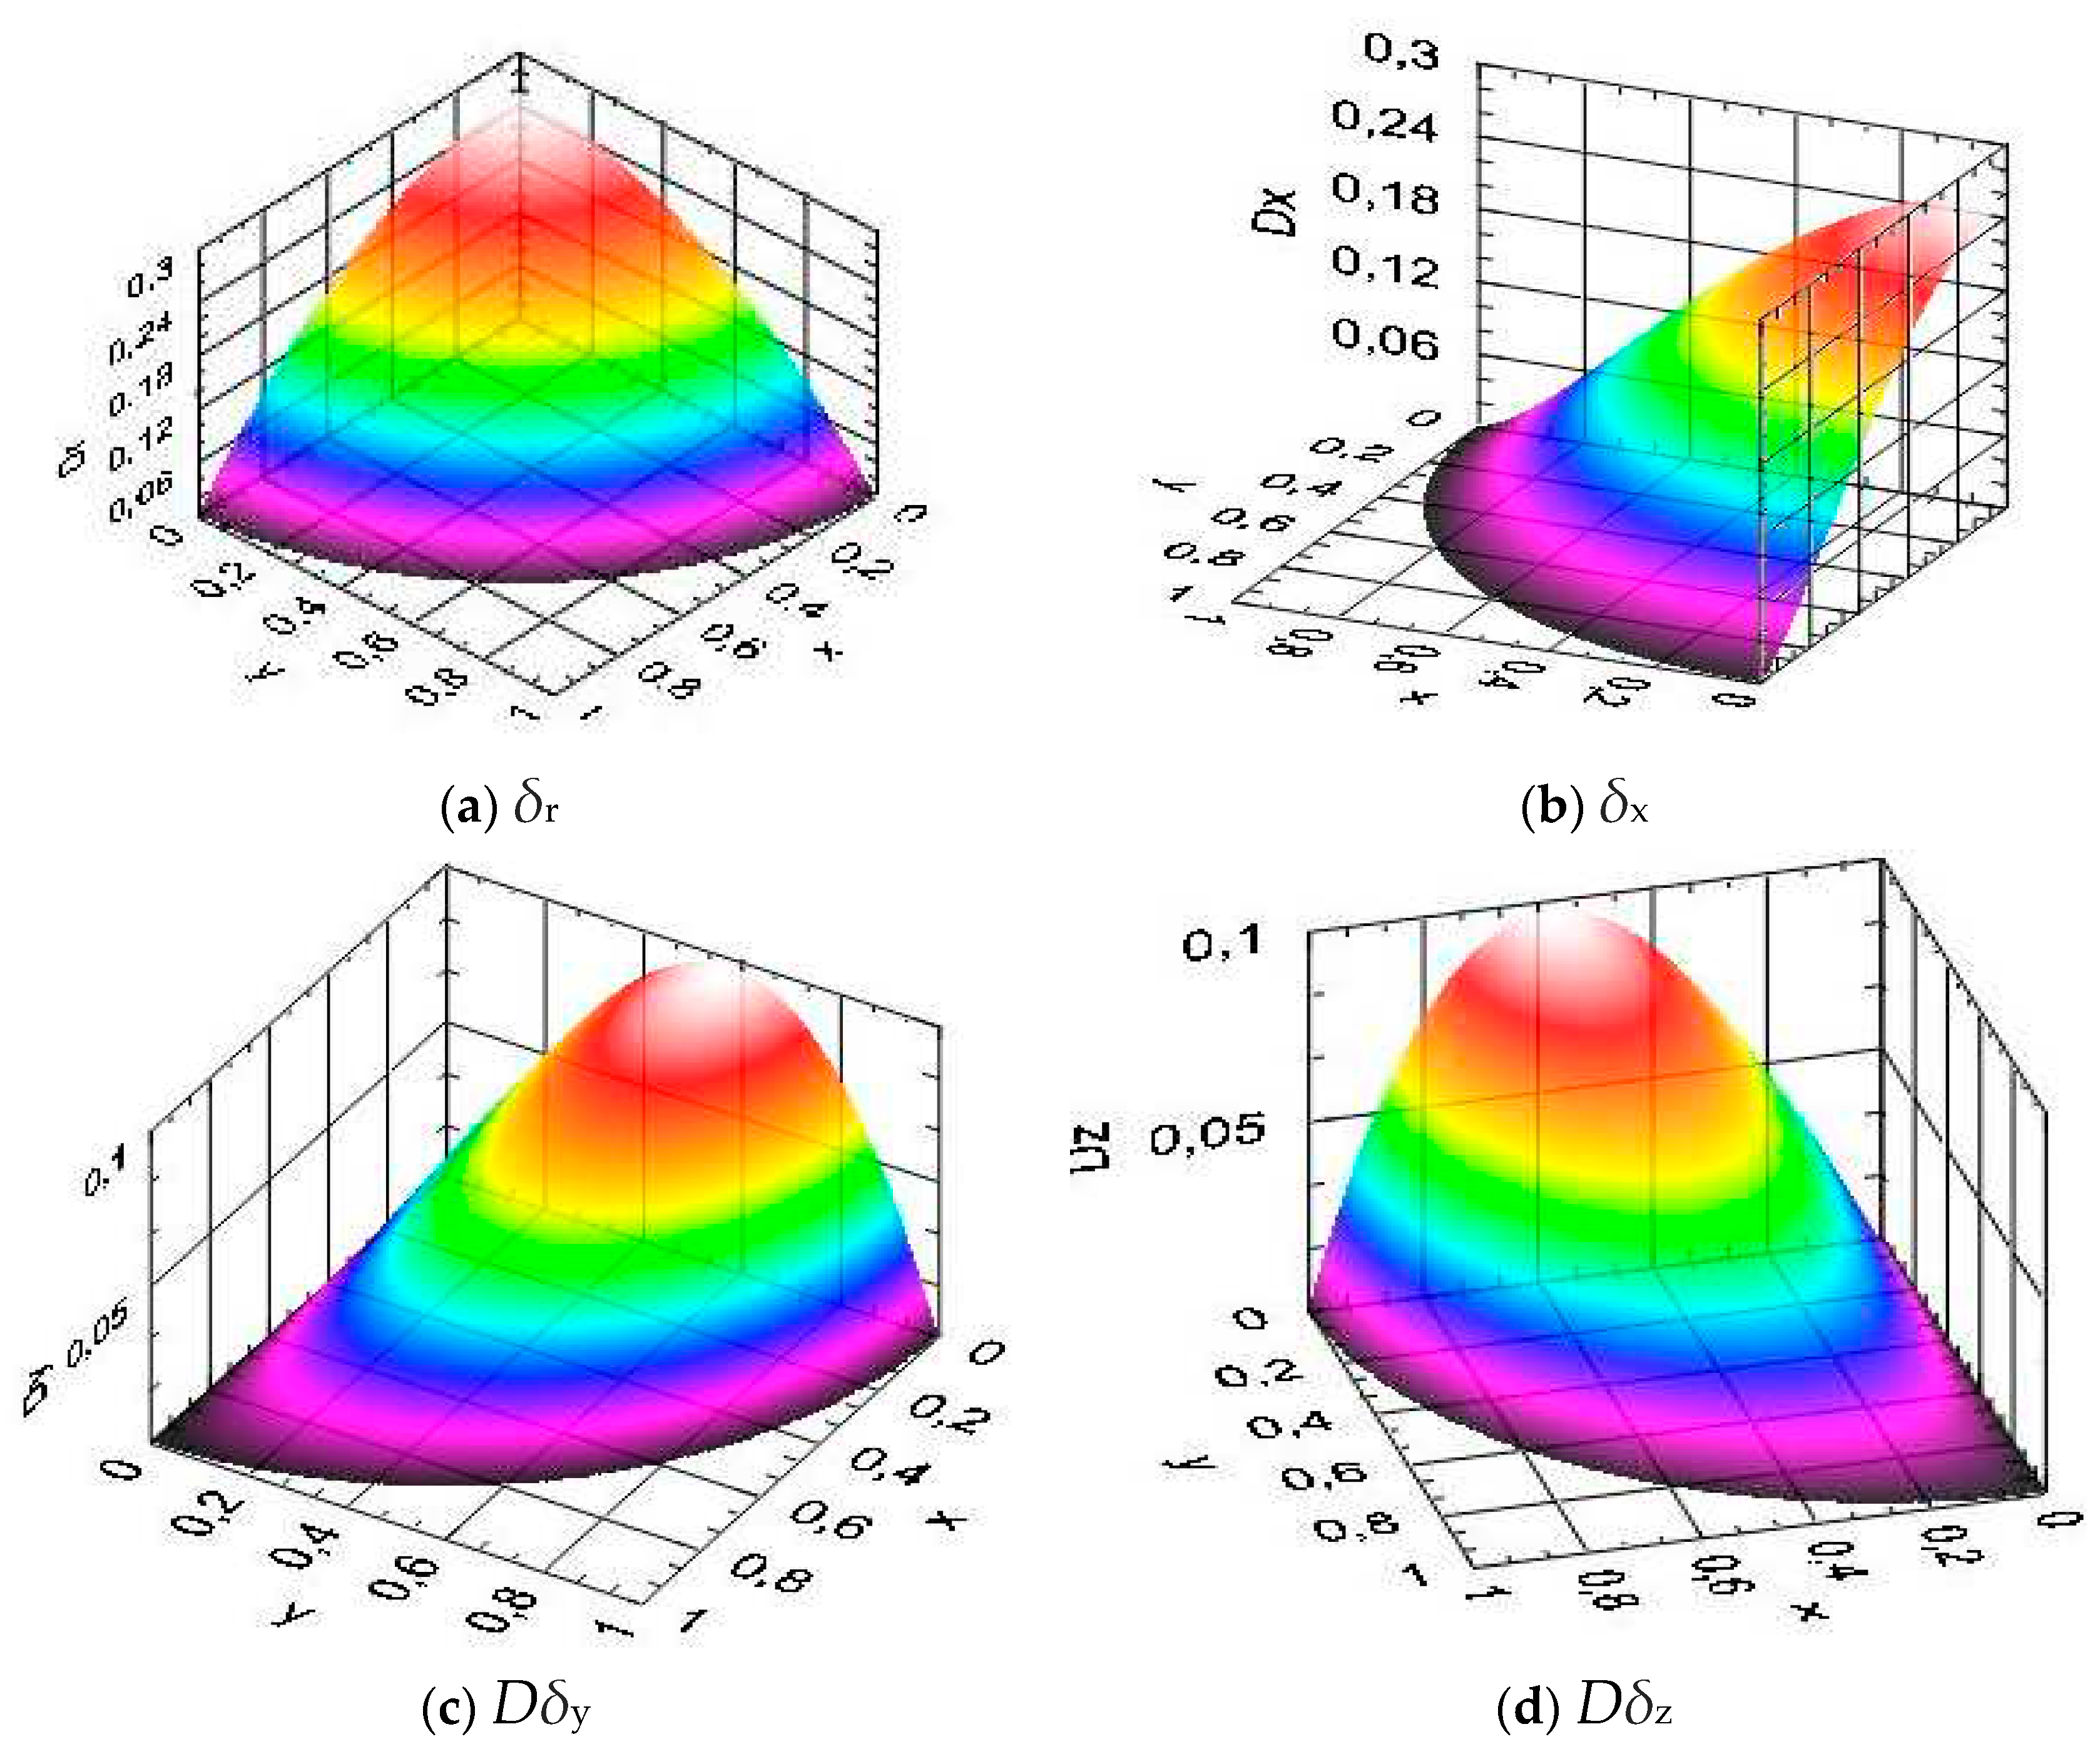
δx are calculated using eqs. (20,21). The simulation results in the (
z,y)-plane, that is transversal to the shock incidence direction, are presented in
Figure 3 and correspond to the dimensionless time
nt = 1.0.
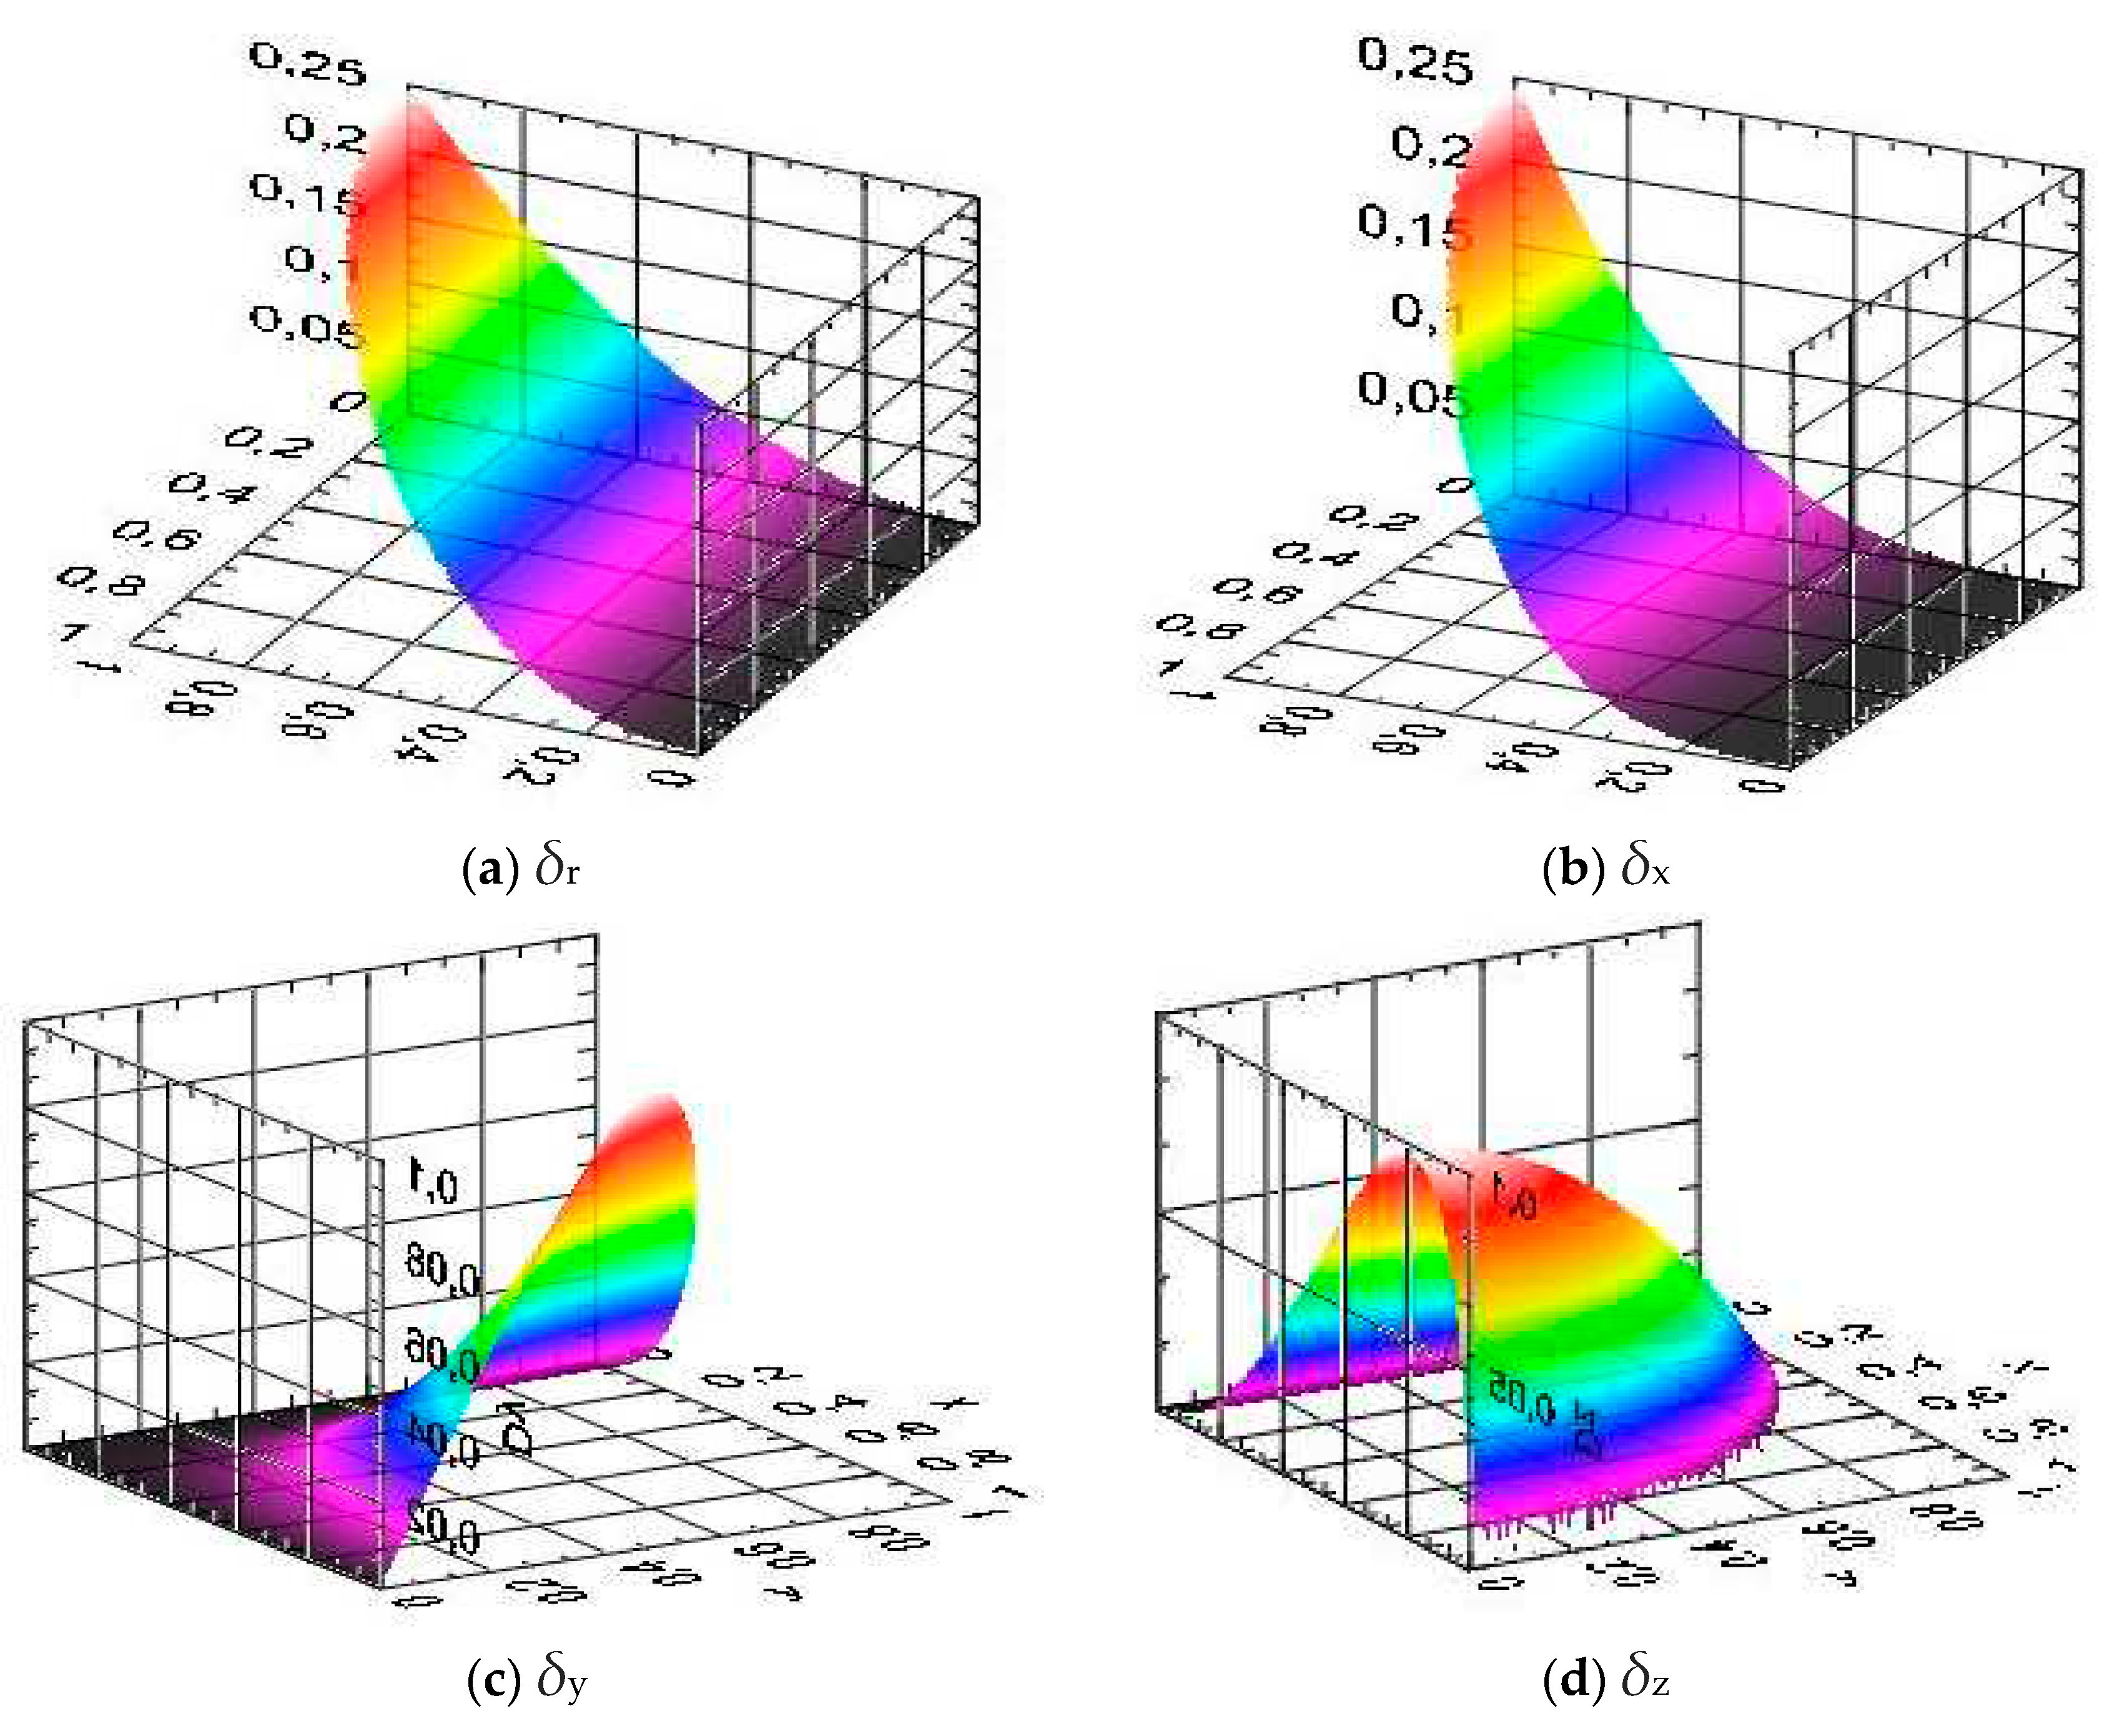
In the longitudinally oriented (
x,y)-plane, the results are presented in
Figure 4.
As the plots in
Figure 3 demonstrate, the distributions for
δr and
δx, in the radial and longitudinal directions are fully symmetrical, as well as those in
Figure 4, exhibiting the same tendency and maximum locations. Projecting the profiles into the two planes of symmetry in
Figure 3 and
Figure 4, it can be seen that they are similar to those obtained with the 2
D model in [
8] (
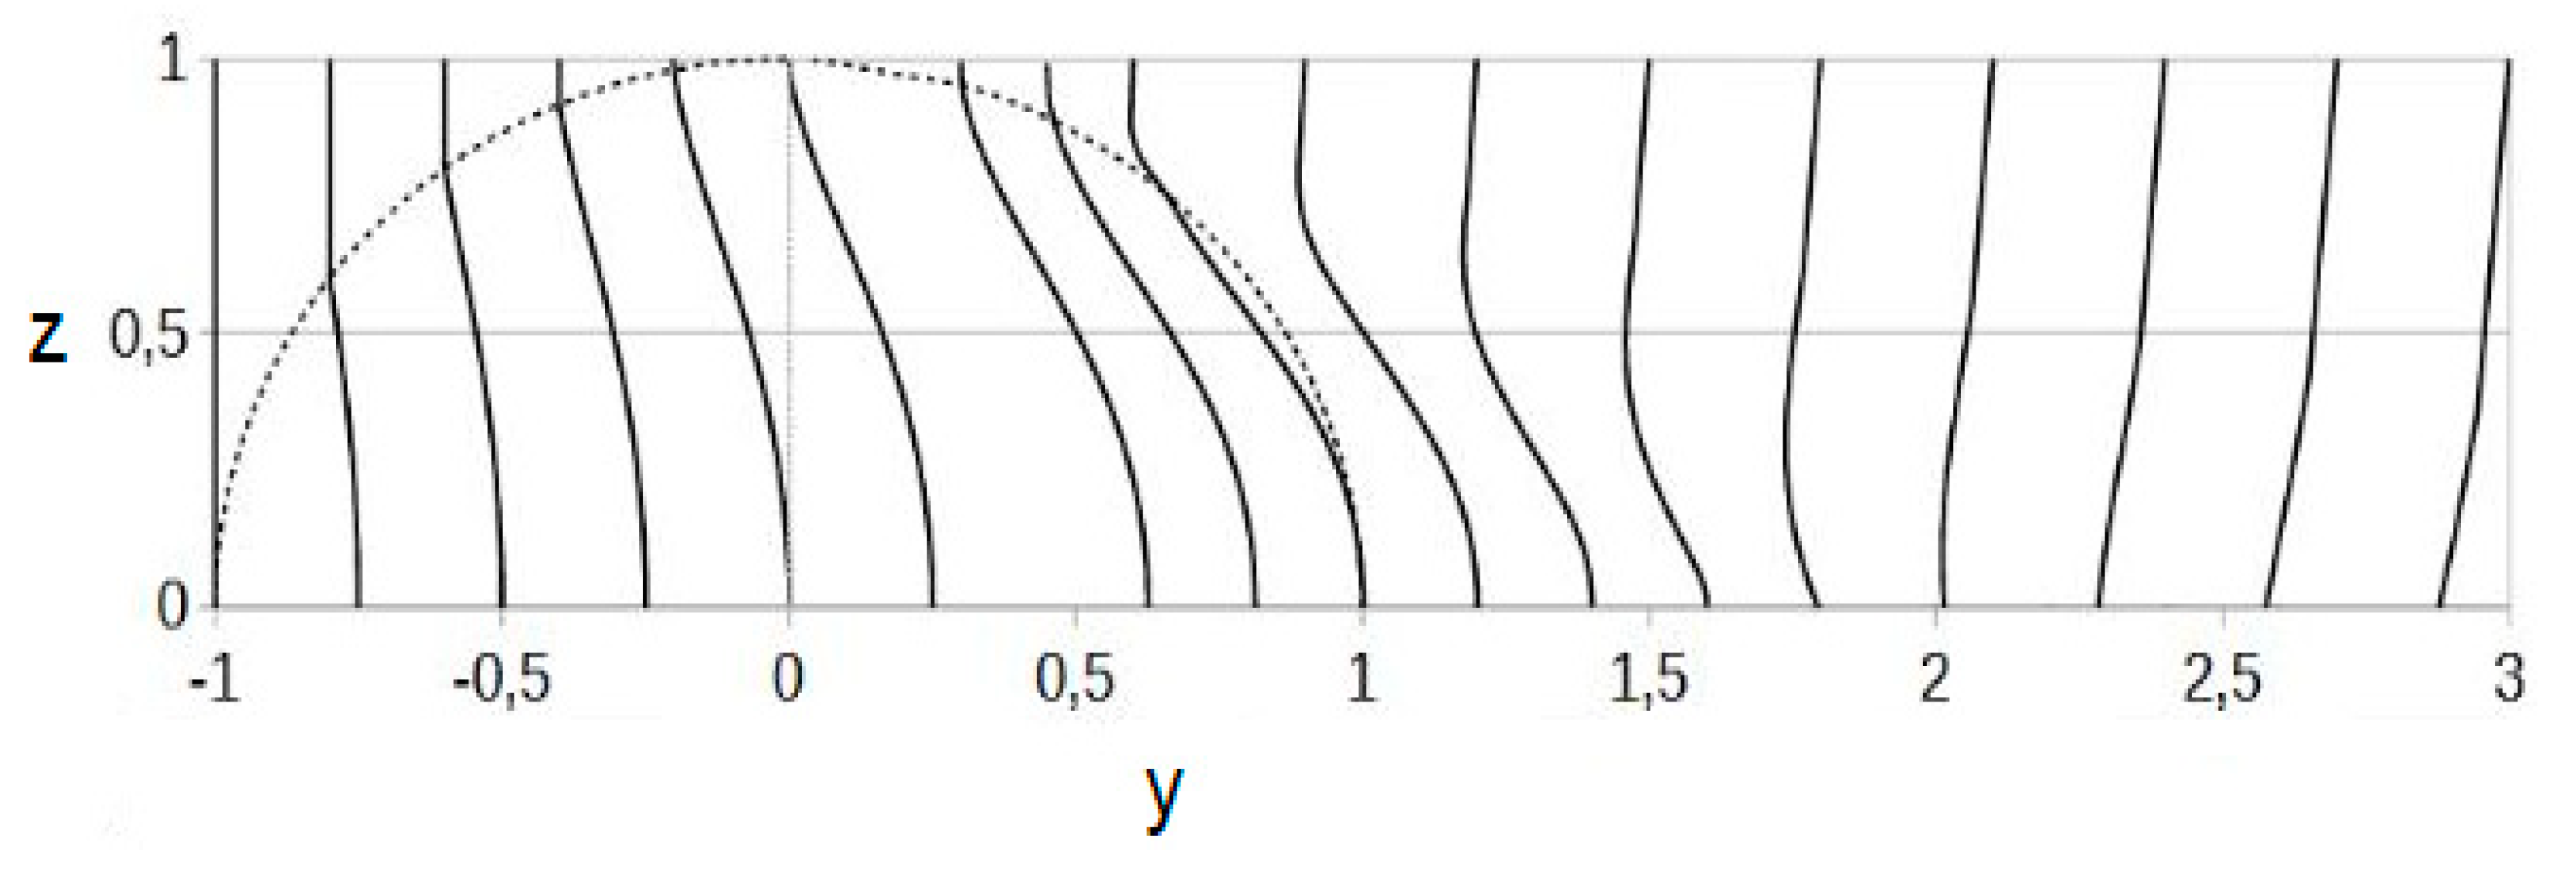
Figure 5). In the plot of
Figure 5, the curve used for comparison at the moment of time
nt = 1.0 is the one crossing the sphere pole.
Comparing the data in the
Figure 3,
Figure 4 and
Figure 5 quantitatively, it is seen that maximum distortion
δx = 0.25 taking place at the longitudinal symmetry axis coincides with that value and location in Figure s 3 and 4. Thus, in both planes of symmetry, the 3
D model transitions exactly into its 2
D equivalent (
φ = 0).
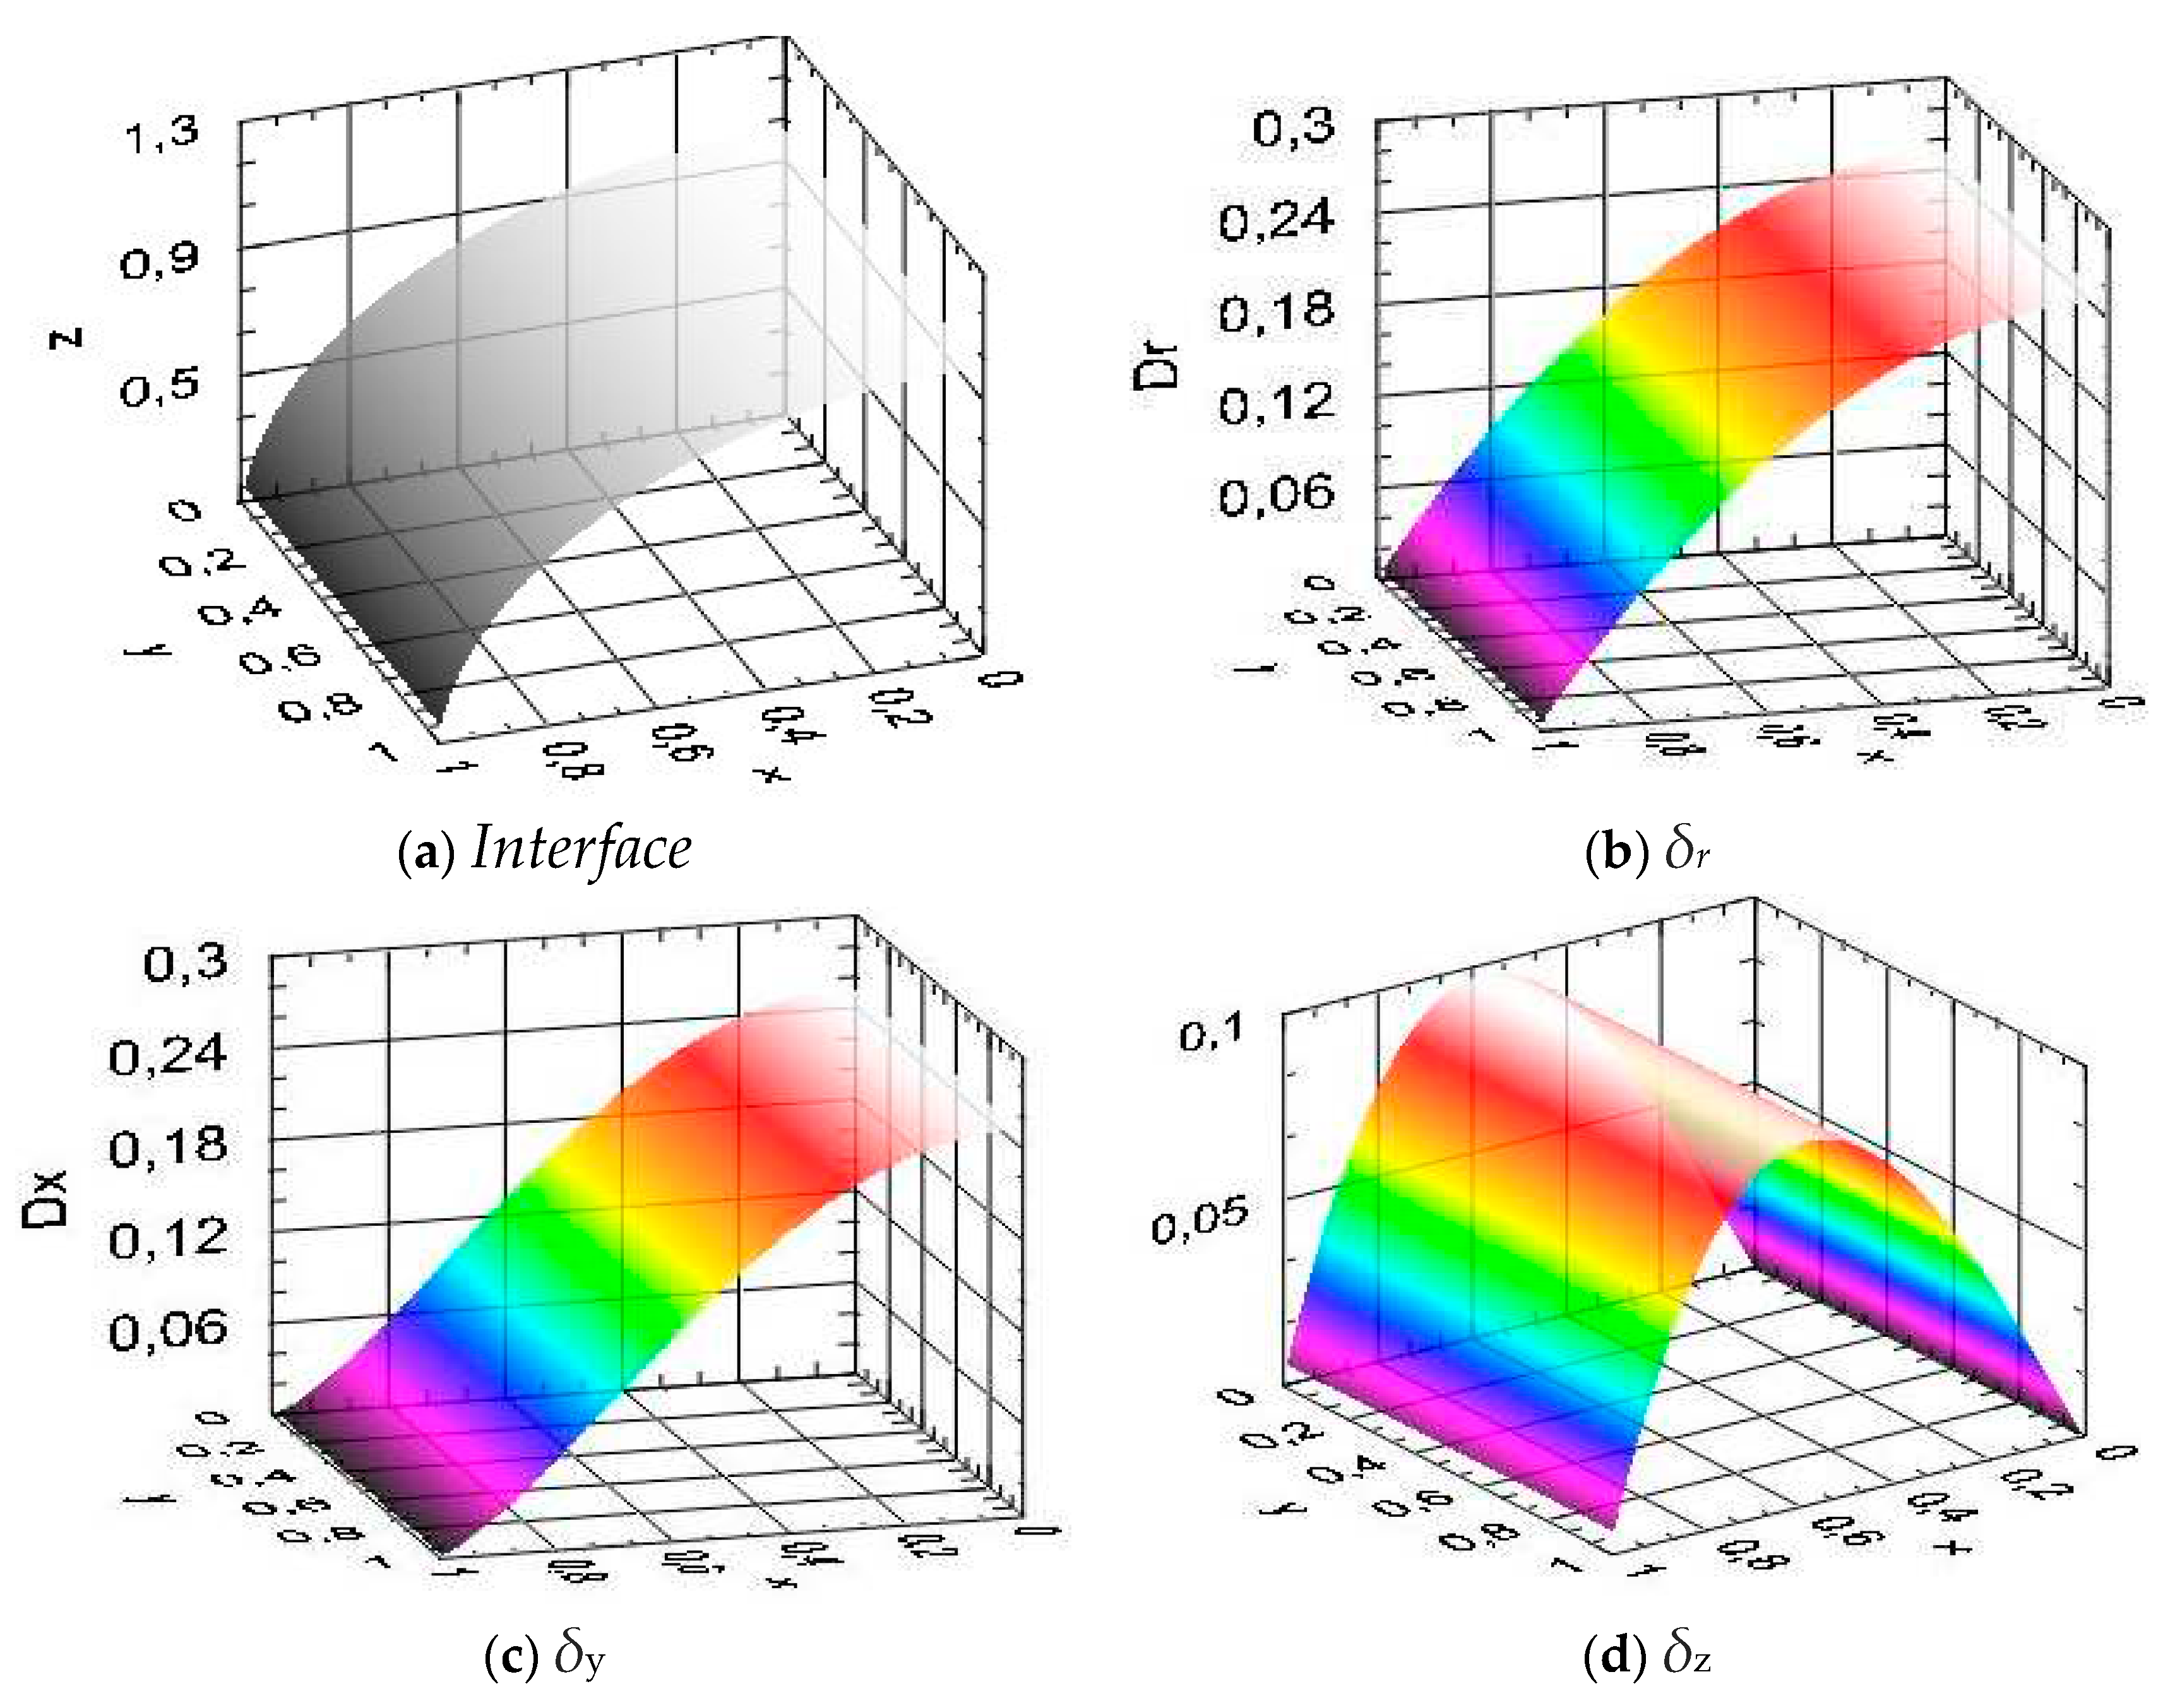
A problem featuring the cylindrical symmetry can be considered here using the polar coordinate system (i.e. what the 2
D model is applied to), in which the derived above relations are reduced to the planar case by taking
φ = 0 and leaving θ as a variable, resulting in yi = 0, ys = 0, and δy = 0. In this case the problem corresponds to a planar shock interacting with an interface of a cylindrical shape that is shown with the gray-colored surface in Figure 6a. The results for the distortion profiles at the time nt = 1.0
and the same shock and gas parameters as above, are presented in the Figure 6, b-c.
The profiles are matching those in the previous figures when projected into the planes of symmetry, as well as those in
Figure 5, if taken as a slice in the (
z,x)-plane. The results for the two models match analytically as well, if different definition of the angles are accounted for using the transition
θ → π/2 - α.
4. Conclusion
The examples based on the 3D spherical coordinate representation illustrated that the front distortion in the transversal plane exhibit fully symmetrical distribution, thus obviously validating the use of the 2D model in spherically symmetrical problems as well. The projection of the 3D results on the two planes of symmetry coincide with those obtained with 2D model, thus making the 3D model relations exactly transitioning into its 2D equivalent (at φ = 0).
Considering the interaction problem in 3
D showed that it is advantageous using the spherical coordinate system over cartesian as all the changes to the front become reduced to one component of the distortion vector only. This is the direct consequence of the continuity principle for the tangential components of the velocity, from which it follows that there will be no change in the distortion vector components in the azimuthal and orbital directions. It immediately follows then that the zero tangential components of the distortion vector at the interface exclude the possibility of an additional spinning of the front elements due to refraction itself. In relating this result to the phenomena of vorticity generation triggered at the interface and described in [
1], it should be noted the following difference. While there is no instant, jump-like rotation of the shock velocity vector at the moment of refraction at the interface, the positive dynamics in the radial component of the front distortion initiates and further supports the production of vorticity. As it was shown in [
1], the vorticity is triggered and amplified at the locations of the most steep changes of the front. Thus presentation of the distortion components in the spherical coordinate system offers a transparent way to show and essentially rule out the possibility of an instant vorticity generation at the interface. It points to the mechanism of a different nature and location referring the vorticity production to later times of the shock propagation rather than at the interface.
As another bonus of the spherical coordinate representation, the form of the solution obtained here becomes more transparent for interpreting. It also significantly shortens the calculation by eliminating a set of parameters needed in the procedure, such as the incident and refraction angles, and associated to this Mach number and velocity components, etc. As in the 2D model, the 3D relations are presentable in a dimensionless form and thus can be applied to a wider range of applications.
